biofuels—at what cost? a review of costs and benefits of
TRANSCRIPT

www.iisd.org/gsi © 2013 The International Institute for Sustainable Development
Biofuels—At What Cost?A review of costs and benefits of EU biofuel policies
Technical Annex
Chris Charles Ivetta Gerasimchuk Richard Bridle Tom Moerenhout Elisa Asmelash Tara Laan April 2013

© 2013 The International Institute for Sustainable DevelopmentRESEARCH REPORT APRIL 2013Biofuels—At What Cost? A review of costs and benefits of EU biofuel policiesTechnical Annex iiii
© 2013 The International Institute for Sustainable DevelopmentPublished by the International Institute for Sustainable Development.
About IISDThe International Institute for Sustainable Development (IISD) contributes to sustainable development by advancing policy recommendations on international trade and investment, economic policy, climate change and energy, and management of natural and social capital, as well as the enabling role of communication technologies in these areas. We report on international negotiations and disseminate knowledge gained through collaborative projects, resulting in more rigorous research, capacity building in developing countries, better networks spanning the North and the South, and better global connections among researchers, practitioners, citizens and policy-makers.
IISD’s vision is better living for all—sustainably; its mission is to champion innovation, enabling societies to live sustainably. IISD is registered as a charitable organization in Canada and has 501(c)(3) status in the United States. IISD receives core operating support from the Government of Canada, provided through the Canadian International Development Agency (CIDA), the International Development Research Centre (IDRC), and from the Province of Manitoba. The Institute receives project funding from numerous governments inside and outside Canada, United Nations agencies, foundations and the private sector.
Head Office161 Portage Avenue East, 6th Floor, Winnipeg, Manitoba, Canada R3B 0Y4 Tel: +1 (204) 958-7700 | Fax: +1 (204) 958-7710 | Website: www.iisd.org
About GSIGSI is an initiative of the International Institute for Sustainable Development (IISD). GSI is headquartered in Geneva, Switzerland and works with partners located around the world. Its principal funders have included the governments of Denmark, the Netherlands, New Zealand, Norway, Sweden and the United Kingdom. The William and Flora Hewlett Foundation have also contributed to funding GSI research and communications activities.
International Institute for Sustainable DevelopmentGlobal Subsidies InitiativeInternational Environment House 2, 9 chemin de Balexert, 1219 Châtelaine, Geneva, SwitzerlandTel: +41 22 917-8373 | Fax: +41 22 917-8054
Biofuels—At What Cost? A review of costs and benefits of EU biofuel policies
Technical Annex
April 2013
© 2013 The International Institute for Sustainable DevelopmentRESEARCH REPORT APRIL 2013Biofuels—At What Cost? A review of costs and benefits of EU biofuel policiesTechnical Annex iii
Table of Contents1. Introduction ............................................................................................................................................................................ 1
2. Conversion Factors ............................................................................................................................................................. 2
3. Estimates of Biofuel Production Costs ........................................................................................................................ 3
4. Estimates of Capital Expenditure Costs .....................................................................................................................4
5. Biofuel Production Plants in France, Germany, Italy, Spain and the United Kingdom .................................. 5
6. Biofuel Excise Tax Rates in EU Member States ........................................................................................................ 8
7. Direct Emissions and Emissions from Land Use Change ..................................................................................... 9
7.1 Direct Emissions from EU Biofuels .......................................................................................................................... 9
7.2 Indirect Land Use Change Emissions from EU Biofuels ..................................................................................11
8. The Social Cost of Carbon ............................................................................................................................................. 16
References .................................................................................................................................................................................... 18
List of FiguresFigure 1: Direct emission factors from biofuels (per feedstock). ................................................................................. 9
Figure 2: Direct emissions from biofuels in the European Union, 2020. ..................................................................11
Figure 3: Annual ILUC emissions under the Monte Carlo analysis. .........................................................................13
Figure 4: ILUC emissions under a 312 MTOE scenario. ............................................................................................... 14
Figure 5: ILUC Emissions under a 5 per cent cap scenario. ..........................................................................................15
List of TablesTable 1: Conversion factors ....................................................................................................................................................... 2
Table 2: International estimates for production costs for biofuels .............................................................................. 3
Table 3: International estimates for capital expenditure costs for biofuel refineries ............................................4
Table 4: Breakdown of biofuel production plants in five key countries ..................................................................... 5
Table 5: Social Cost of Carbon values (EUR/tCO2, 2011 euros) .................................................................................17
Table 6: Social benefits of EU biofuel emission reduction in 2020 (million EUR), 5 per cent cap, central ILUC ..................................................................................................................................................................17
© 2013 The International Institute for Sustainable DevelopmentRESEARCH REPORT APRIL 2013Biofuels—At What Cost? A review of costs and benefits of EU biofuel policiesTechnical Annex iv
List of AcronymsCO2 eq Carbon dioxide equivalent
DfT Department for Transport
EU European Union
GDP Gross Domestic Product
IEA International Energy Agency
IFPRI International Food Policy Research Institute
ILUC Indirect Land Use Change
MTOE Million Tonne(s) of Oil Equivalent
RED Renewable Energy Directive
SCC Social Cost of Carbon

© 2013 The International Institute for Sustainable DevelopmentRESEARCH REPORT APRIL 2013Biofuels—At What Cost? A review of costs and benefits of EU biofuel policiesTechnical Annex 1
1. IntroductionThis Technical Annex is in support of a study published by the Global Subsidies Initiative (GSI) of the International Institute for Sustainable Development (IISD) called Biofuels at What Cost? A Review of Costs and Benefits of EU Biofuel Policies.
The aim of the project is to help promote a better understanding of the cost-effectiveness of supporting the European Union’s (EU) biofuels industry. The objectives of the main study are:
• to provide a comprehensive overview of economic and non-economic costs and benefits of the EU biofuel policy and quantify these costs and benefits where possible, using estimates available from public accounts and the state-of-the-art literature
• to estimate the cost-effectiveness of the EU biofuel policies as a means of achieving the European Union’s stated policy objectives
• to compare the effectiveness of supporting the biofuels sector versus other policy options
• to provide conclusions and recommendations in a form suitable for policy-makers
The main report can be downloaded from http://www.iisd.org/gsi/sites/default/files/bf_awc_eu.pdf.
Tables, figures, and explanatory text in the Technical Annex correspond to sections and chapters of the main report (with the sections from the main report specified in the text). The Technical Annex provides supporting research material and data for analysis contained in the main report and also elaborates upon a number of more technical issues.
© 2013 The International Institute for Sustainable DevelopmentRESEARCH REPORT APRIL 2013Biofuels—At What Cost? A review of costs and benefits of EU biofuel policiesTechnical Annex 2
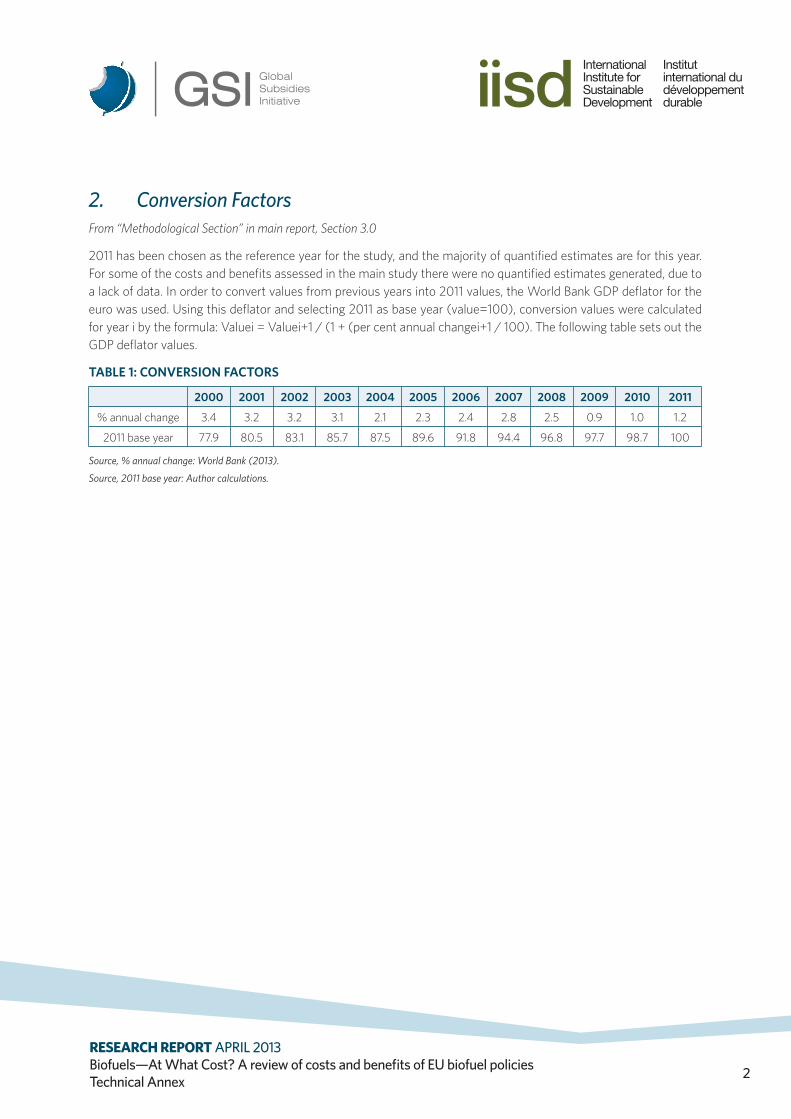
2. Conversion Factors From “Methodological Section” in main report, Section 3.0
2011 has been chosen as the reference year for the study, and the majority of quantified estimates are for this year. For some of the costs and benefits assessed in the main study there were no quantified estimates generated, due to a lack of data. In order to convert values from previous years into 2011 values, the World Bank GDP deflator for the euro was used. Using this deflator and selecting 2011 as base year (value=100), conversion values were calculated for year i by the formula: Valuei = Valuei+1 / (1 + (per cent annual changei+1 / 100). The following table sets out the GDP deflator values.
TABLE 1: CONVERSION FACTORS
2000 2001 2002 2003 2004 2005 2006 2007 2008 2009 2010 2011
% annual change 3.4 3.2 3.2 3.1 2.1 2.3 2.4 2.8 2.5 0.9 1.0 1.2
2011 base year 77.9 80.5 83.1 85.7 87.5 89.6 91.8 94.4 96.8 97.7 98.7 100
Source, % annual change: World Bank (2013).
Source, 2011 base year: Author calculations.
© 2013 The International Institute for Sustainable DevelopmentRESEARCH REPORT APRIL 2013Biofuels—At What Cost? A review of costs and benefits of EU biofuel policiesTechnical Annex 3
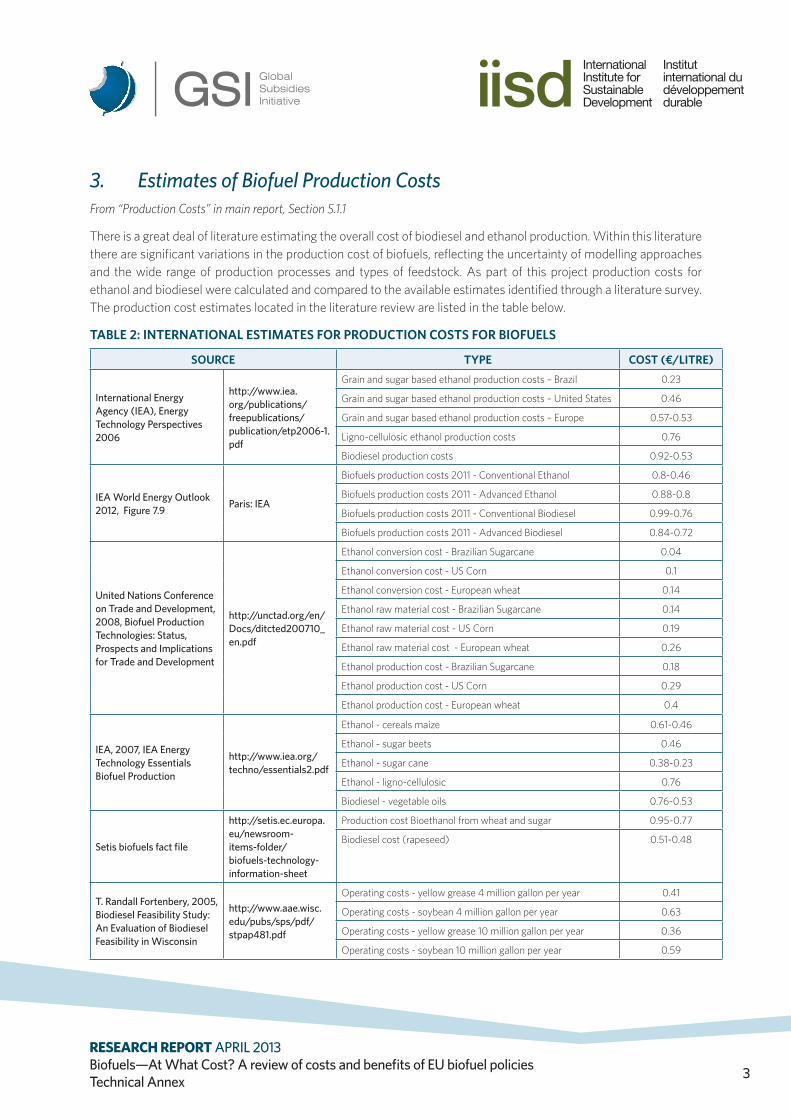
3. Estimates of Biofuel Production Costs From “Production Costs” in main report, Section 5.1.1
There is a great deal of literature estimating the overall cost of biodiesel and ethanol production. Within this literature there are significant variations in the production cost of biofuels, reflecting the uncertainty of modelling approaches and the wide range of production processes and types of feedstock. As part of this project production costs for ethanol and biodiesel were calculated and compared to the available estimates identified through a literature survey. The production cost estimates located in the literature review are listed in the table below.
TABLE 2: INTERNATIONAL ESTIMATES FOR PRODUCTION COSTS FOR BIOFUELS
SOURCE TYPE COST (€/LITRE)
International Energy Agency (IEA), Energy Technology Perspectives 2006
http://www.iea.org/publications/freepublications/publication/etp2006-1.pdf
Grain and sugar based ethanol production costs – Brazil 0.23
Grain and sugar based ethanol production costs – United States 0.46
Grain and sugar based ethanol production costs – Europe 0.57-0.53
Ligno-cellulosic ethanol production costs 0.76
Biodiesel production costs 0.92-0.53
IEA World Energy Outlook 2012, Figure 7.9 Paris: IEA
Biofuels production costs 2011 - Conventional Ethanol 0.8-0.46
Biofuels production costs 2011 - Advanced Ethanol 0.88-0.8
Biofuels production costs 2011 - Conventional Biodiesel 0.99-0.76
Biofuels production costs 2011 - Advanced Biodiesel 0.84-0.72
United Nations Conference on Trade and Development, 2008, Biofuel Production Technologies: Status, Prospects and Implications for Trade and Development
http://unctad.org/en/Docs/ditcted200710_en.pdf
Ethanol conversion cost - Brazilian Sugarcane 0.04
Ethanol conversion cost - US Corn 0.1
Ethanol conversion cost - European wheat 0.14
Ethanol raw material cost - Brazilian Sugarcane 0.14
Ethanol raw material cost - US Corn 0.19
Ethanol raw material cost - European wheat 0.26
Ethanol production cost - Brazilian Sugarcane 0.18
Ethanol production cost - US Corn 0.29
Ethanol production cost - European wheat 0.4
IEA, 2007, IEA Energy Technology Essentials Biofuel Production
http://www.iea.org/techno/essentials2.pdf
Ethanol - cereals maize 0.61-0.46
Ethanol - sugar beets 0.46
Ethanol - sugar cane 0.38-0.23
Ethanol - ligno-cellulosic 0.76
Biodiesel - vegetable oils 0.76-0.53
Setis biofuels fact file
http://setis.ec.europa.eu/newsroom-items-folder/biofuels-technology-information-sheet
Production cost Bioethanol from wheat and sugar 0.95-0.77
Biodiesel cost (rapeseed) 0.51-0.48
T. Randall Fortenbery, 2005, Biodiesel Feasibility Study: An Evaluation of Biodiesel Feasibility in Wisconsin
http://www.aae.wisc.edu/pubs/sps/pdf/stpap481.pdf
Operating costs - yellow grease 4 million gallon per year 0.41
Operating costs - soybean 4 million gallon per year 0.63
Operating costs - yellow grease 10 million gallon per year 0.36
Operating costs - soybean 10 million gallon per year 0.59
© 2013 The International Institute for Sustainable DevelopmentRESEARCH REPORT APRIL 2013Biofuels—At What Cost? A review of costs and benefits of EU biofuel policiesTechnical Annex 4
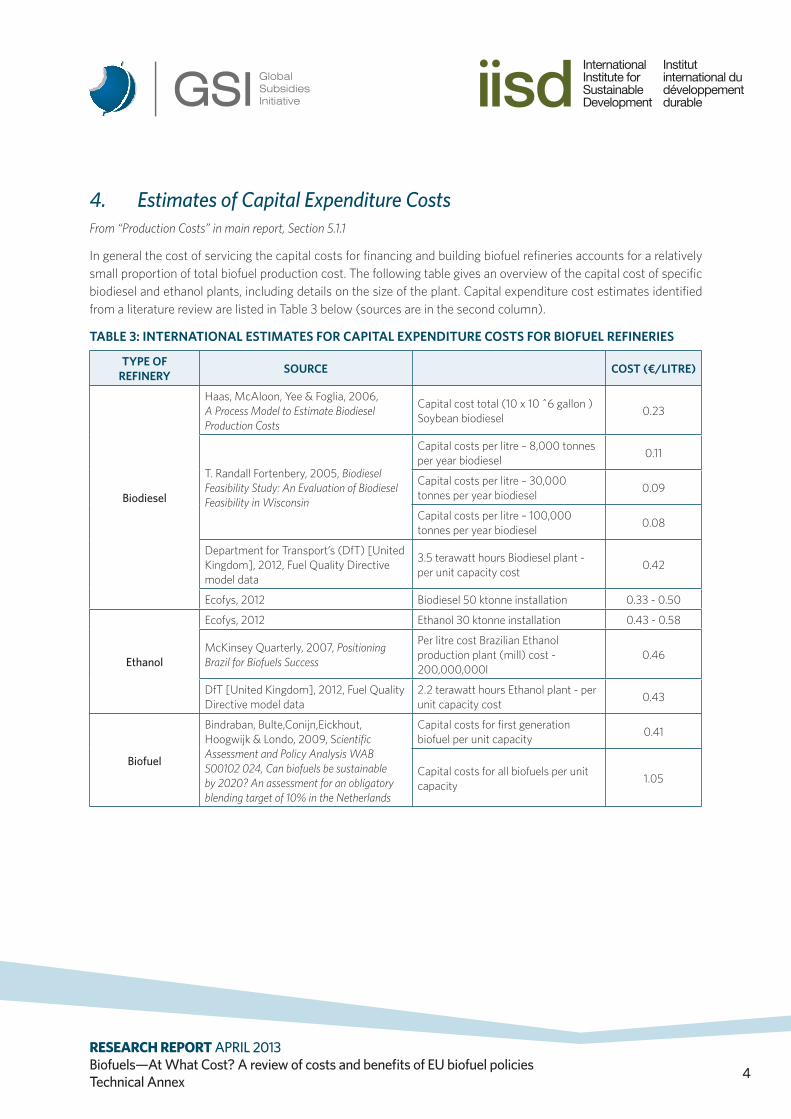
4. Estimates of Capital Expenditure Costs From “Production Costs” in main report, Section 5.1.1
In general the cost of servicing the capital costs for financing and building biofuel refineries accounts for a relatively small proportion of total biofuel production cost. The following table gives an overview of the capital cost of specific biodiesel and ethanol plants, including details on the size of the plant. Capital expenditure cost estimates identified from a literature review are listed in Table 3 below (sources are in the second column).
TABLE 3: INTERNATIONAL ESTIMATES FOR CAPITAL EXPENDITURE COSTS FOR BIOFUEL REFINERIES
TYPE OF REFINERY SOURCE COST (€/LITRE)
Biodiesel
Haas, McAloon, Yee & Foglia, 2006, A Process Model to Estimate Biodiesel Production Costs
Capital cost total (10 x 10 ^6 gallon ) Soybean biodiesel 0.23
T. Randall Fortenbery, 2005, Biodiesel Feasibility Study: An Evaluation of Biodiesel Feasibility in Wisconsin
Capital costs per litre – 8,000 tonnes per year biodiesel 0.11
Capital costs per litre – 30,000 tonnes per year biodiesel 0.09
Capital costs per litre – 100,000 tonnes per year biodiesel 0.08
Department for Transport’s (DfT) [United Kingdom], 2012, Fuel Quality Directive model data
3.5 terawatt hours Biodiesel plant - per unit capacity cost 0.42
Ecofys, 2012 Biodiesel 50 ktonne installation 0.33 - 0.50
Ethanol
Ecofys, 2012 Ethanol 30 ktonne installation 0.43 - 0.58
McKinsey Quarterly, 2007, Positioning Brazil for Biofuels Success
Per litre cost Brazilian Ethanol production plant (mill) cost - 200,000,000l
0.46
DfT [United Kingdom], 2012, Fuel Quality Directive model data
2.2 terawatt hours Ethanol plant - per unit capacity cost 0.43
Biofuel
Bindraban, Bulte,Conijn,Eickhout, Hoogwijk & Londo, 2009, Scientific Assessment and Policy Analysis WAB 500102 024, Can biofuels be sustainable by 2020? An assessment for an obligatory blending target of 10% in the Netherlands
Capital costs for first generation biofuel per unit capacity 0.41
Capital costs for all biofuels per unit capacity 1.05

© 2013 The International Institute for Sustainable DevelopmentRESEARCH REPORT APRIL 2013Biofuels—At What Cost? A review of costs and benefits of EU biofuel policiesTechnical Annex 5
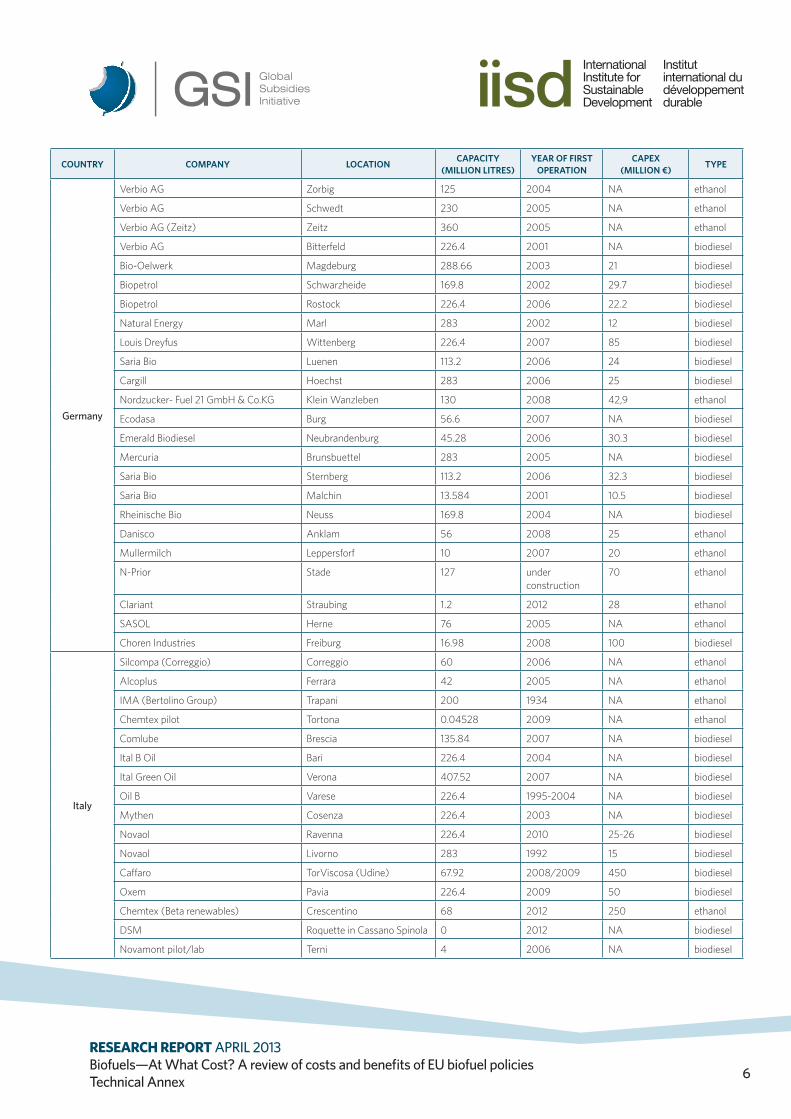
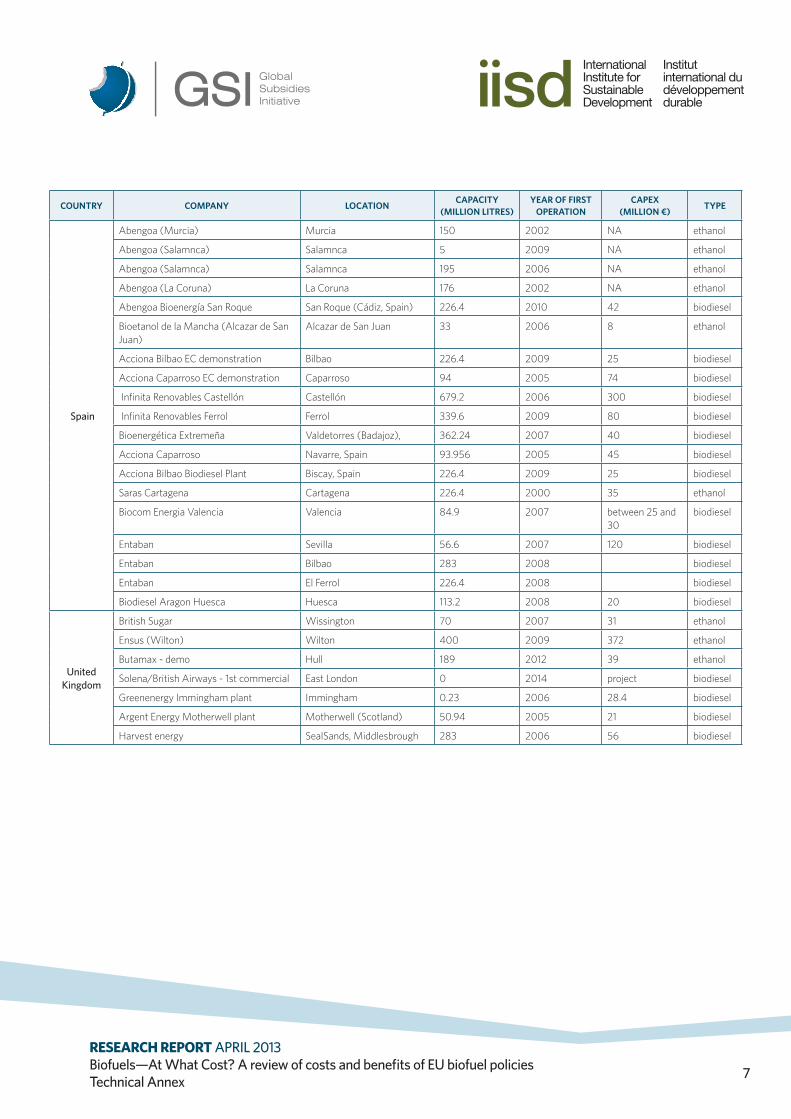
5. Biofuel Production Plants in France, Germany, Italy, Spain and the United KingdomFrom “Production Costs” in main report, Section 5.1.1
A full breakdown of biofuel production plants in the five key countries of analysis, France, Germany, Italy, Spain and the United Kingdom, was developed through a combination of desk-based research and communications with biofuel companies. The geographical locations, installed capacity, year of first operation, and capital expenditure, CAPEX, for the biofuel refining facilities identified are contained in the table below. Further discussion of the geographical location of the biofuel plants and job creations is provided in the main report’s Section 6.1.3, “Employment and European Union Biofuel Policies.” In a number of countries, most notably the United Kingdom, plants are predominantly located at port locations providing direct access to imported feedstocks and export markets.
TABLE 4: BREAKDOWN OF BIOFUEL PRODUCTION PLANTS IN FIVE KEY COUNTRIES
COUNTRY COMPANY LOCATION CAPACITY (MILLION LITRES)
YEAR OF FIRST OPERATION
CAPEX (MILLION €) TYPE
France
Tereos Artenay 40 1928 NA ethanol
Tereos Provins 15 operational NA ethanol
Tereos Lillers 80 2006 NA ethanol
Tereos Morains 40 operational NA ethanol
Tereos Lillebonne 250 2007 215 ethanol
Tereos Origny 300 2009 NA ethanol
Cristanol Arcis sur Aube 150 1986 385 ethanol
Cristanol I Bazancourt 150 2007 between 217-250 ethanol
Cristanol II Bezancourt 200 2008 ethanol
Cristanol Deulep (St.Gilles) 40 2005 NA ethanol
Soufflet (SMBE)- Saint Louis Sucre Eppeville 90 1920 NA ethanol
CropEnergies AG Ryssen 100 2008 NA ethanol
AB Bioenergy France Lacq 250 2007 200 ethanol
Roquette (Beinheim) Beinheim 150 2008 35 ethanol
Diester Industrie Grand-Couronne II 283 2008 NA biodiesel
Diester Industrie Compiegne 113.2 2005 NA biodiesel
Diester Industrie Sete 226.4 2006 NA biodiesel
Diester Industrie Montoir/St-Nazaire 283 2007 NA biodiesel
Diester Industrie Le Meriot 283 2007 NA biodiesel
Diester Industrie Bordeaux/Bassens 283 2008 NA biodiesel
DSM Lesterm 38 2010 NA biodiesel
Bionergy (Sica) La Rochelle 11.32 2008 NA biodiesel
Bionergy (Sica) La Rochelle 56.6 2009 NA biodiesel
Futurol Pomacle 180 2011 74 biodiesel
Cognis Boussens 45.28 2002 NA biodiesel
Ecomotion (Saria) Le Havre 84.9 2010 40 biodiesel
INEOS Enterprises France SAS Baleycourt (Verdun) 260.36 2008 70 biodiesel
© 2013 The International Institute for Sustainable DevelopmentRESEARCH REPORT APRIL 2013Biofuels—At What Cost? A review of costs and benefits of EU biofuel policiesTechnical Annex 6
COUNTRY COMPANY LOCATION CAPACITY (MILLION LITRES)
YEAR OF FIRST OPERATION
CAPEX (MILLION €) TYPE
Germany
Verbio AG Zorbig 125 2004 NA ethanol
Verbio AG Schwedt 230 2005 NA ethanol
Verbio AG (Zeitz) Zeitz 360 2005 NA ethanol
Verbio AG Bitterfeld 226.4 2001 NA biodiesel
Bio-Oelwerk Magdeburg 288.66 2003 21 biodiesel
Biopetrol Schwarzheide 169.8 2002 29.7 biodiesel
Biopetrol Rostock 226.4 2006 22.2 biodiesel
Natural Energy Marl 283 2002 12 biodiesel
Louis Dreyfus Wittenberg 226.4 2007 85 biodiesel
Saria Bio Luenen 113.2 2006 24 biodiesel
Cargill Hoechst 283 2006 25 biodiesel
Nordzucker- Fuel 21 GmbH & Co.KG Klein Wanzleben 130 2008 42,9 ethanol
Ecodasa Burg 56.6 2007 NA biodiesel
Emerald Biodiesel Neubrandenburg 45.28 2006 30.3 biodiesel
Mercuria Brunsbuettel 283 2005 NA biodiesel
Saria Bio Sternberg 113.2 2006 32.3 biodiesel
Saria Bio Malchin 13.584 2001 10.5 biodiesel
Rheinische Bio Neuss 169.8 2004 NA biodiesel
Danisco Anklam 56 2008 25 ethanol
Mullermilch Leppersforf 10 2007 20 ethanol
N-Prior Stade 127 under construction
70 ethanol
Clariant Straubing 1.2 2012 28 ethanol
SASOL Herne 76 2005 NA ethanol
Choren Industries Freiburg 16.98 2008 100 biodiesel
Italy
Silcompa (Correggio) Correggio 60 2006 NA ethanol
Alcoplus Ferrara 42 2005 NA ethanol
IMA (Bertolino Group) Trapani 200 1934 NA ethanol
Chemtex pilot Tortona 0.04528 2009 NA ethanol
Comlube Brescia 135.84 2007 NA biodiesel
Ital B Oil Bari 226.4 2004 NA biodiesel
Ital Green Oil Verona 407.52 2007 NA biodiesel
Oil B Varese 226.4 1995-2004 NA biodiesel
Mythen Cosenza 226.4 2003 NA biodiesel
Novaol Ravenna 226.4 2010 25-26 biodiesel
Novaol Livorno 283 1992 15 biodiesel
Caffaro TorViscosa (Udine) 67.92 2008/2009 450 biodiesel
Oxem Pavia 226.4 2009 50 biodiesel
Chemtex (Beta renewables) Crescentino 68 2012 250 ethanol
DSM Roquette in Cassano Spinola 0 2012 NA biodiesel
Novamont pilot/lab Terni 4 2006 NA biodiesel
© 2013 The International Institute for Sustainable DevelopmentRESEARCH REPORT APRIL 2013Biofuels—At What Cost? A review of costs and benefits of EU biofuel policiesTechnical Annex 7
COUNTRY COMPANY LOCATION CAPACITY (MILLION LITRES)
YEAR OF FIRST OPERATION
CAPEX (MILLION €) TYPE
Spain
Abengoa (Murcia) Murcia 150 2002 NA ethanol
Abengoa (Salamnca) Salamnca 5 2009 NA ethanol
Abengoa (Salamnca) Salamnca 195 2006 NA ethanol
Abengoa (La Coruna) La Coruna 176 2002 NA ethanol
Abengoa Bioenergía San Roque San Roque (Cádiz, Spain) 226.4 2010 42 biodiesel
Bioetanol de la Mancha (Alcazar de San Juan)
Alcazar de San Juan 33 2006 8 ethanol
Acciona Bilbao EC demonstration Bilbao 226.4 2009 25 biodiesel
Acciona Caparroso EC demonstration Caparroso 94 2005 74 biodiesel
Infinita Renovables Castellón Castellón 679.2 2006 300 biodiesel
Infinita Renovables Ferrol Ferrol 339.6 2009 80 biodiesel
Bioenergética Extremeña Valdetorres (Badajoz), 362.24 2007 40 biodiesel
Acciona Caparroso Navarre, Spain 93.956 2005 45 biodiesel
Acciona Bilbao Biodiesel Plant Biscay, Spain 226.4 2009 25 biodiesel
Saras Cartagena Cartagena 226.4 2000 35 ethanol
Biocom Energia Valencia Valencia 84.9 2007 between 25 and 30
biodiesel
Entaban Sevilla 56.6 2007 120 biodiesel
Entaban Bilbao 283 2008 biodiesel
Entaban El Ferrol 226.4 2008 biodiesel
Biodiesel Aragon Huesca Huesca 113.2 2008 20 biodiesel
United Kingdom
British Sugar Wissington 70 2007 31 ethanol
Ensus (Wilton) Wilton 400 2009 372 ethanol
Butamax - demo Hull 189 2012 39 ethanol
Solena/British Airways - 1st commercial East London 0 2014 project biodiesel
Greenenergy Immingham plant Immingham 0.23 2006 28.4 biodiesel
Argent Energy Motherwell plant Motherwell (Scotland) 50.94 2005 21 biodiesel
Harvest energy SealSands, Middlesbrough 283 2006 56 biodiesel
© 2013 The International Institute for Sustainable DevelopmentRESEARCH REPORT APRIL 2013Biofuels—At What Cost? A review of costs and benefits of EU biofuel policiesTechnical Annex 8
6. Biofuel Excise Tax Rates in EU Member States From “Government Revenue Foregone Due to Tax Breaks for Biofuels” in main report, Section 5.1.4
In the European Union some countries, such as the United Kingdom, have phased out excise tax exemptions for biofuels, bringing the level of the tax up to the level charged on petrol and diesel. Nevertheless, major producing and consuming countries still have different excise tax rates in place for ethanol, biodiesel or both. Some countries have quota systems to limit the difference in tax rates up to a certain consumption level for ethanol and/or biodiesel.

© 2013 The International Institute for Sustainable DevelopmentRESEARCH REPORT APRIL 2013Biofuels—At What Cost? A review of costs and benefits of EU biofuel policiesTechnical Annex 9
7. Direct Emissions and Emissions from Land Use Change From “EU Biofuel Policies and Greenhouse Gas Emissions” in main report, Section 6.2.2
Total emissions from the use of biofuels include direct emissions and land use change associated emissions. Based on a set of different assumptions outlined below, a number of scenarios were developed in order to generate more robust total emissions and emission savings calculations. The different scenarios are explained further in the main report. In summary, three different assumptions were used:
1. Different percentage caps (3 per cent, 5 per cent, 7 per cent, 10 per cent) on the level of conventional food-based biofuels being allowed to contribute to the 10 per cent renewable energy in transport target.
2. Different total EU road energy transport demand projections in 2020 (280 MTOE, 312 MTOE, 350 MTOE).
3. Different indirect land use change (ILUC) factors based on the Monte Carlo analysis performed by Laborde (2012), from very low to very high (5th percentile, 25th percentile, central, 75th percentile, 95th percentile).
7.1 Direct Emissions from EU BiofuelsFor estimates on direct emissions from biofuels, the assessment relied on the EC Impact Assessment accompanying the proposal (see below and the “Well to Wheel” (WTW) study of the JRC, EUCAR and CONCAWE - together called JEC (European Commission, 2012a). Their study only modelled biofuels from land already in arable use and did not assess land use changes. For the estimation of emissions from direct and indirect LUC, this study will rely on the International Food Policy Research Institute (IFPRI) model developed by Laborde, described below.
The JEC study analysis itself recognizes that its greenhouse gas balances for biofuels deal with uncertainty as a result of nitrous oxide emissions (N2O) in agriculture. This greenhouse gas has a climate change inducing effect 300 times that of carbon dioxide and a small change in N2O values would thus significantly change the overall estimate of greenhouse gas intensity. In addition, the JEC study points to recent literature that indicated an underestimation of N2O emissions in the methodology used in their study (Edwards, Larivé & Beziat, 2011). The study is recognized as some of the best available scientific estimations of direct emissions from biofuels. The study also formed the basis of greenhouse gas intensity values in EU legislation (European Commission, 2012a).
FIGURE 1: DIRECT EMISSION FACTORS FROM BIOFUELS (PER FEEDSTOCK).Source: European Commission (2012a).
0 10 20 30 40 50 60 70 80 90 100
Biodiesel non-land usingImproved vegatable oil 2Improved vegetable oil 1
Palm oil with methane captureSunflowerRapeseed
SoybeanPalm oil
Sugar caneWheat straw as process fuel in CHP plant
Sugar beetCorn (maize)
Wheat natural gas as process fuel in CHP plantWheat process fuel not specified
Fossil fuels
Biod
iesel
Eth
anol
gCO2/MJ

© 2013 The International Institute for Sustainable DevelopmentRESEARCH REPORT APRIL 2013Biofuels—At What Cost? A review of costs and benefits of EU biofuel policiesTechnical Annex 10
By using the 280 MTOE scenario for the amount of energy in road transport, the European Commission’s estimate of 21 million tonnes of emissions form a scenario where biofuels will provide 14 MTOE (it is possible to calculate the direct emissions of different scenarios when assuming linearity). For the 7 per cent ethanol growth only scenario and the 10 per cent scenario based on the projected feedstock distribution given in the EC Impact Assessment, which is the source for Figure 1, the JEC figures were used directly in those calculations. In terms of direct emissions, two noteworthy conclusions are discussed below.
Scenario Findings
First, the more efficient use of feedstock brings down total direct emissions. As can be seen in the chart above, in particular wheat and palm oil have uses that can make a significant difference. Calculations are substantially affected be assumptions relating to the life cycle of the energy generated, and existence and use of potential by-products.
• For the 7 per cent “ethanol growth only” scenario, this leads to a difference of 4 to 5 million tonnes of carbon dioxide equivalent (CO2 eq), depending on the use of wheat. In the graph above the most efficient use of wheat straw as process fuel in a Combined Heat and Power plant is used. This would mean if the most efficient method is not used, direct emissions in an ethanol growth only scenario would be roughly equal to a linear 7 per cent scenario. An important finding is in case of a 7 per cent scenario with ethanol growth only, the level of emissions would thus be based on the use of feedstocks, making feedstock selection critical to achieve climate targets.
• When calculating the 10 per cent scenario based on the EC projections of feedstock distribution in 2020 (published previous to the proposal), palm oil without methane capture and palm oil with methane capture have a difference in direct emissions of almost 5 million tonnes of CO2 eq. In the graph below (Figure 2), palm oil use without methane capture is assumed.
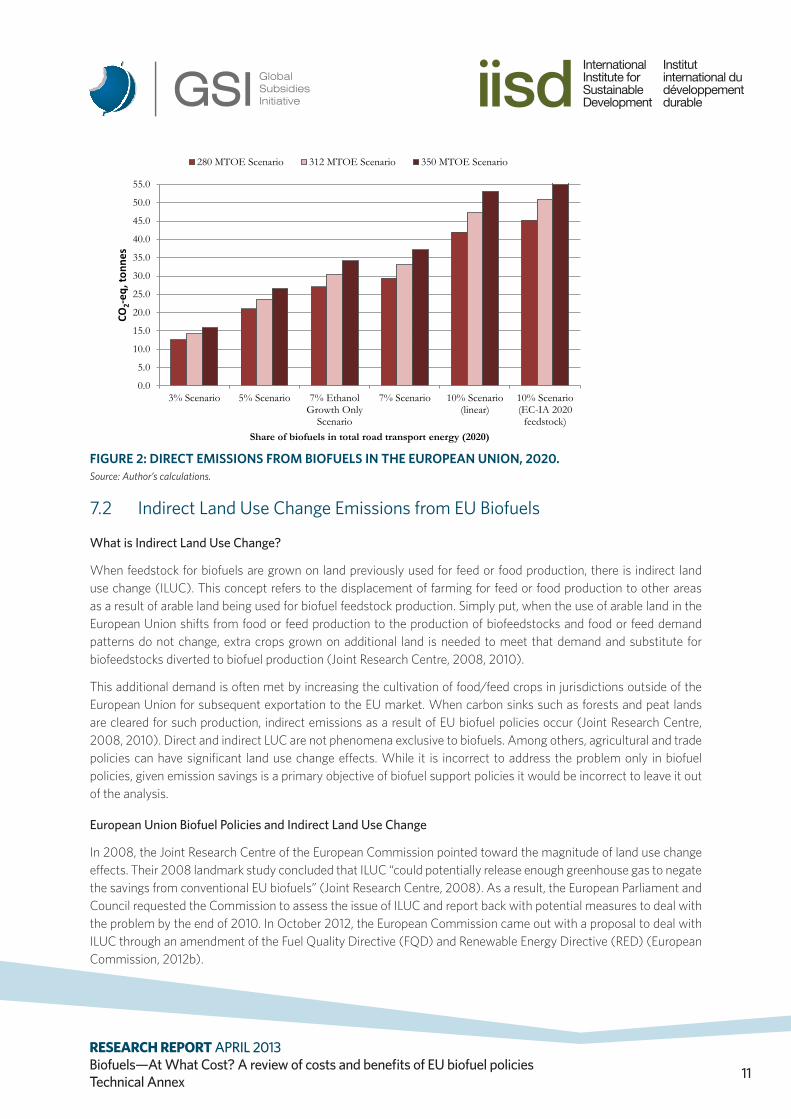
• Second, and arguably more important, the different scenarios for total road transport energy demand have a large impact on direct emissions from biofuels.
• Under the baseline 5 per cent scenario, there is a difference of 5.5 million tonnes of CO2 eq between the 280 MTOE scenario and the 350 MTOE scenario. The fact the European Commission explicitly states is that a 5 per cent cap is roughly equal to 14 MTOE of biofuels. Stating it projects a total of 312 MTOE road energy demand in 2020 appears inconsistent, as 5 per cent of conventional biofuels will generate 15.6 MTOE instead of 14 MTOE. In that case, under a 5 per cent cap, emissions would be almost 3 million tonnes higher than anticipated. Additional information provided by the European Commission on the assumption used to develop its emissions figure of 14 MTOE and 21 million tonnes of CO2 eq would allow for greater understanding on the data used in the calculations.
• If a cap on first generation biofuels was lifted to 7 per cent or 10 per cent, the difference between greenhouse gas emissions under a 280 MTOE scenario and a 350 MTOE scenario would, respectively, become more than 7 million tonnes and more than 9 million tonnes.
One of the main findings is thus that the European Union needs to provide much greater clarity on the expected energy required for road transport in order to estimate emissions from EU biofuels consumption.
© 2013 The International Institute for Sustainable DevelopmentRESEARCH REPORT APRIL 2013Biofuels—At What Cost? A review of costs and benefits of EU biofuel policiesTechnical Annex 11
FIGURE 2: DIRECT EMISSIONS FROM BIOFUELS IN THE EUROPEAN UNION, 2020.Source: Author’s calculations.
7.2 Indirect Land Use Change Emissions from EU Biofuels
What is Indirect Land Use Change?
When feedstock for biofuels are grown on land previously used for feed or food production, there is indirect land use change (ILUC). This concept refers to the displacement of farming for feed or food production to other areas as a result of arable land being used for biofuel feedstock production. Simply put, when the use of arable land in the European Union shifts from food or feed production to the production of biofeedstocks and food or feed demand patterns do not change, extra crops grown on additional land is needed to meet that demand and substitute for biofeedstocks diverted to biofuel production (Joint Research Centre, 2008, 2010).
This additional demand is often met by increasing the cultivation of food/feed crops in jurisdictions outside of the European Union for subsequent exportation to the EU market. When carbon sinks such as forests and peat lands are cleared for such production, indirect emissions as a result of EU biofuel policies occur (Joint Research Centre, 2008, 2010). Direct and indirect LUC are not phenomena exclusive to biofuels. Among others, agricultural and trade policies can have significant land use change effects. While it is incorrect to address the problem only in biofuel policies, given emission savings is a primary objective of biofuel support policies it would be incorrect to leave it out of the analysis.
European Union Biofuel Policies and Indirect Land Use Change
In 2008, the Joint Research Centre of the European Commission pointed toward the magnitude of land use change effects. Their 2008 landmark study concluded that ILUC “could potentially release enough greenhouse gas to negate the savings from conventional EU biofuels” (Joint Research Centre, 2008). As a result, the European Parliament and Council requested the Commission to assess the issue of ILUC and report back with potential measures to deal with the problem by the end of 2010. In October 2012, the European Commission came out with a proposal to deal with ILUC through an amendment of the Fuel Quality Directive (FQD) and Renewable Energy Directive (RED) (European Commission, 2012b).
0.0
5.0
10.0
15.0
20.0
25.0
30.0
35.0
40.0
45.0
50.0
55.0
3% Scenario 5% Scenario 7% EthanolGrowth Only
Scenario
7% Scenario 10% Scenario(linear)
10% Scenario(EC-IA 2020
feedstock)
CO2-e
q, to
nnes
Share of biofuels in total road transport energy (2020)
280 MTOE Scenario 312 MTOE Scenario 350 MTOE Scenario
© 2013 The International Institute for Sustainable DevelopmentRESEARCH REPORT APRIL 2013Biofuels—At What Cost? A review of costs and benefits of EU biofuel policiesTechnical Annex 12
The EC proposal aims at limiting “the contribution that conventional biofuels (with a risk of ILUC emissions) make toward attainment of the targets in the Renewable Energy Directive” (European Commission, 2012b). The proposal does not include mandatory ILUC factors, but limits the contribution that conventional biofuels from food crops can make to the RED to 5 per cent of the energy accounting to the 10 per cent renewable energy transport target. The Commission reported that this 5 per cent of energy is roughly equal to energy produced by current biofuel production levels and is assumed to be equivalent to around 14 MTOE (European Commission, 2012a). As mentioned in the previous section on direct emissions, the estimated amount of energy anticipated to come from biofuels may very well be an underestimate as total road transport energy demand in the EU in 2020 could be higher than currently projected.
The Challenge of Calculating Indirect Land Use Change Factors
Measuring or observing ILUC is not possible as feedstock producers cannot measure land use change patterns in different parts in the world (di Lucia, Ahlgren & Ericsson, 2012). One can only calculate estimates by using global models that are based on future projections of agricultural productivity, biofuel policies and international trade. Such projections are based on assumptions that are subject to a wide degree of uncertainty (Joint Research Centre, 2008) (Laborde, 2011). The most advanced modelling exercise to date was performed by the International Food Policy Research Institute (IFPRI). Their initial 2010 study was updated in 2011 and used by the European Commission in its Impact Assessment accompanying the October 2012 proposal to deal with ILUC.
To reduce uncertainty, IFPRI performed 1,000 rounds of Monte Carlo simulations by which a sensitivity analysis of seven parameters that have the most important effect on the supply side of the model were scrutinized. This exercise resulted in a wide range of land use change estimates (Laborde, 2011). One can for example observe the wide range for rapeseed. In line with IFPRI and the European Commission, the analysis contained in the main report also included a sensitivity analysis based on the mean, 5th, 25th, 75th and 95th percentile of IFPRI’s Monte Carlo Analysis. The IFPRI model estimates land use change, both direct and indirect. However, since it assumes an implementation of EU directives, the results equate estimated ILUC. Since this part of the analysis focuses on estimating total emissions from biofuels and equally assumes compliance with EU sustainability requirements, the results of the IFPRI model and related factors can be used without adjustment.
Uncertainty relating to the projected results is the main reason why models are often criticized. As any model, the IFPRI model is imperfect. As the author recognizes himself, there is room for improvement with regards to assumptions related to land use expansion and substitution. Uncertainties related to additional land needed are both independent from (more structural) and dependent on policies (Laborde, 2011). One such example is how the modelled emissions are partially dependent on the assumption that increased palm oil production will take place on peat land forest areas in countries like Indonesia and Malaysia. According to Delzeit (2012), this is formally illegal according to Indonesian law and the assumption is dependent on political factors such as the non-enforcement of existing regulations. A review of this Indonesian moratorium on new forest concessions indeed found that there have been clearings in primary forest in spite of the moratorium. In addition, the moratorium only applies to new concessions and it excludes secondary forests, which are also large carbon sinks (Union of Concerned Scientists, Greenpeace and World Resources Institute, 2012). At the same, time, up-to-date research by the International Council for Clean Transportation has unveiled that emissions from peat land degradation are underestimated in the IFPRI model, and that in reality peat degradation in South East Asia for palm oil plantations are much more severe (Page, Morrson, Malins, Hooijer, Rieley & Jauhiainen, 2011). Similarly, one could argue that IFPRI numbers are underestimated as they assume higher yields in the baseline than most other ILUC models (Marelli, 2013). Generally it can be concluded that uncertainty related to ILUC factors goes both ways, rather than one-directional, as certain parts of the biofuel industry sometimes claim.

© 2013 The International Institute for Sustainable DevelopmentRESEARCH REPORT APRIL 2013Biofuels—At What Cost? A review of costs and benefits of EU biofuel policiesTechnical Annex 13
Therefore, many commentators recommend biofuel policies should be guided according to the precautionary principle, in particular related to ILUC (Gerasimchuk, Bridle, Charles & Moerenhout, 2012). For di Lucia, Ahlgren and Ericsson (2012) the precautionary principle implies the selection of high ILUC factors to guide policy making that aims to improve the certainty no negative ILUC occurs. The choice of factors from middle values would imply a preventive approach, which aims at reducing the risk of negative ILUC but has less certainty of its success than higher values. The choice of low ILUC factors would then, according to di Lucia et al be a risk-indifferent approach.
In line with the European Commission, the assessment of ILUC in this cost-effectiveness analysis is based on the IFPRI model, which can be regarded as the best available science in estimating ILUC factors. The uncertainty related to the results of our analysis is integrated through the estimation of ILUC emissions based on the variation of ILUC factors generated by the IFPRI model’s Monte Carlo analysis. Using different ILUC factors, an assessment of potential emissions can be generated using (a) high ILUC factors (a clear precautionary choice), (b) middle ILUC factors (a preventive) approach or, (c) low ILUC factors (a more risk-indifferent approach).
FIGURE 3: ANNUAL ILUC EMISSIONS UNDER THE MONTE CARLO ANALYSIS. Source: European Commission (2012a), which bases its values on Laborde (2011).
0
10
20
30
40
50
60
70
80
90
Palm oil Rapeseed Soybean Sunflower Maize Sugar beet Sugar cane Wheat
gCO
2eq/
MJ
Type of feedstock
5th percentile 25the percentile Central 75th percentile 95th percentile
© 2013 The International Institute for Sustainable DevelopmentRESEARCH REPORT APRIL 2013Biofuels—At What Cost? A review of costs and benefits of EU biofuel policiesTechnical Annex 14
Emissions as a Result of Direct and Indirect Land Use Change
Emissions as a result of land use change are significant compared to direct emissions from biofuels and overall emissions from fossil fuel use. Using the IFPRI ILUC factors, this study finds three notable conclusions with regards to ILUC emissions.
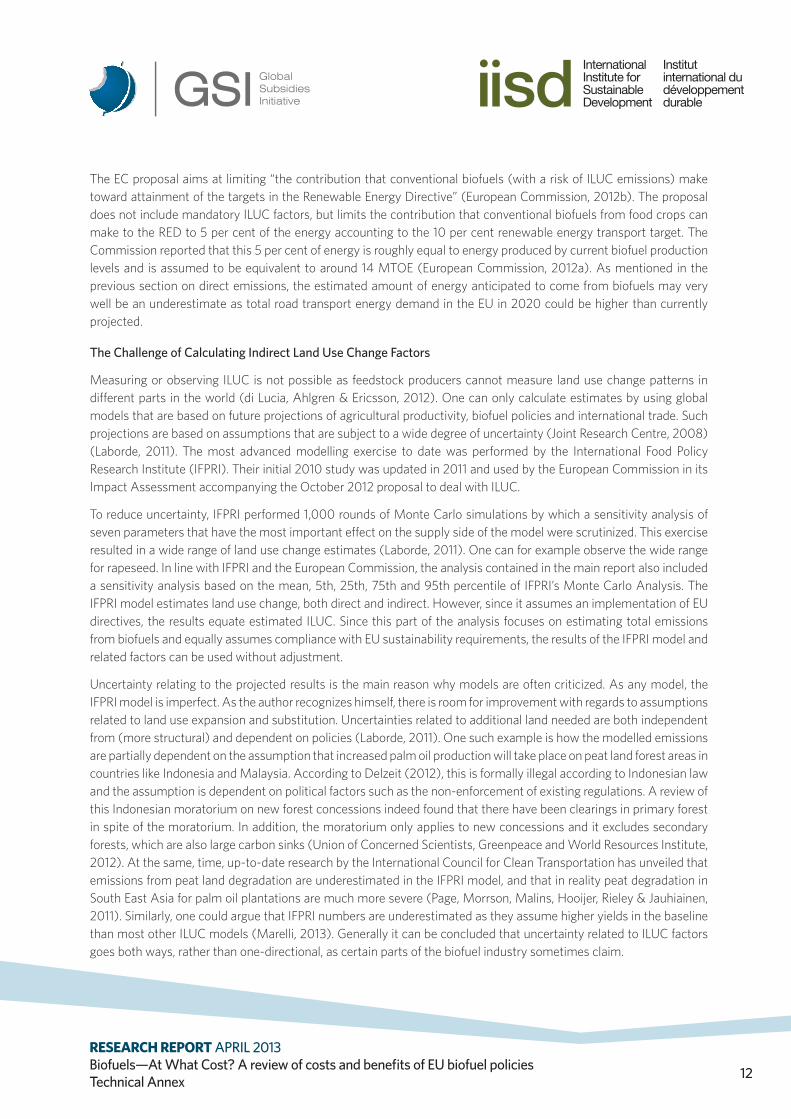
First and foremost, it is clear that the uncertainty linked to the ILUC factors is crucial to the total estimated emissions from biofuels. As mentioned, ILUC is immeasurable and can only be modelled theoretically. Under a 312 MTOE total road energy demand scenario, we see that ILUC emissions estimates in a 5 per cent cap scenario vary from 17 million tonnes CO2 eq (5th percentile) to 30 million tonnes CO2 eq (central scenario) to a maximum of 43 million tonnes CO2 eq (95th percentile). The range of emissions depending on which percentile of the Monte Carlo analysis is chosen widens from about 26 MTOE to 45 MTOE under a 10 per cent cap (and 312 MTOE scenario).
Second, as expected different percentage caps on first generation biofuels bring about different emissions. We find that under the current IFPRI factors, a 7 per cent ethanol growth only scenario does not generate much more ILUC emissions than a 5 per cent baseline scenario. Depending on the road transport energy demand, the difference is between 1 and 3 million tonnes CO2 eq, on a scale of between 27 and 33 million tonnes. This is simply because feedstock for ethanol has much lower values than feedstock for biodiesel (see Figure 3, “Annual ILUC emissions under the Monte Carlo analysis”). To give an order of magnitude, Germany estimated that emission savings as a result of renewable energy in the transport sector reached 5 million tonnes in 2010 (Government of Federal Republic of Germany, 2011). As this number was calculated without accounting for ILUC, savings are actually significantly lower in reality.
FIGURE 4: ILUC EMISSIONS UNDER A 312 MTOE SCENARIO. Source: Author’s calculations.
0
10
20
30
40
50
60
70
80
90
100
3% Scenario 5% Scenario 7% EthanolGrowth Only
Scenario
7% Scenario 10% Scenario(linear)
10% Scenario(EC-IA 2020
feedstock)
Mt C
O2e
q
Share of biofuels in total road transport energy (2020)
5th percentile 25th percentile Central 75th percentile 95th percentile
© 2013 The International Institute for Sustainable DevelopmentRESEARCH REPORT APRIL 2013Biofuels—At What Cost? A review of costs and benefits of EU biofuel policiesTechnical Annex 15
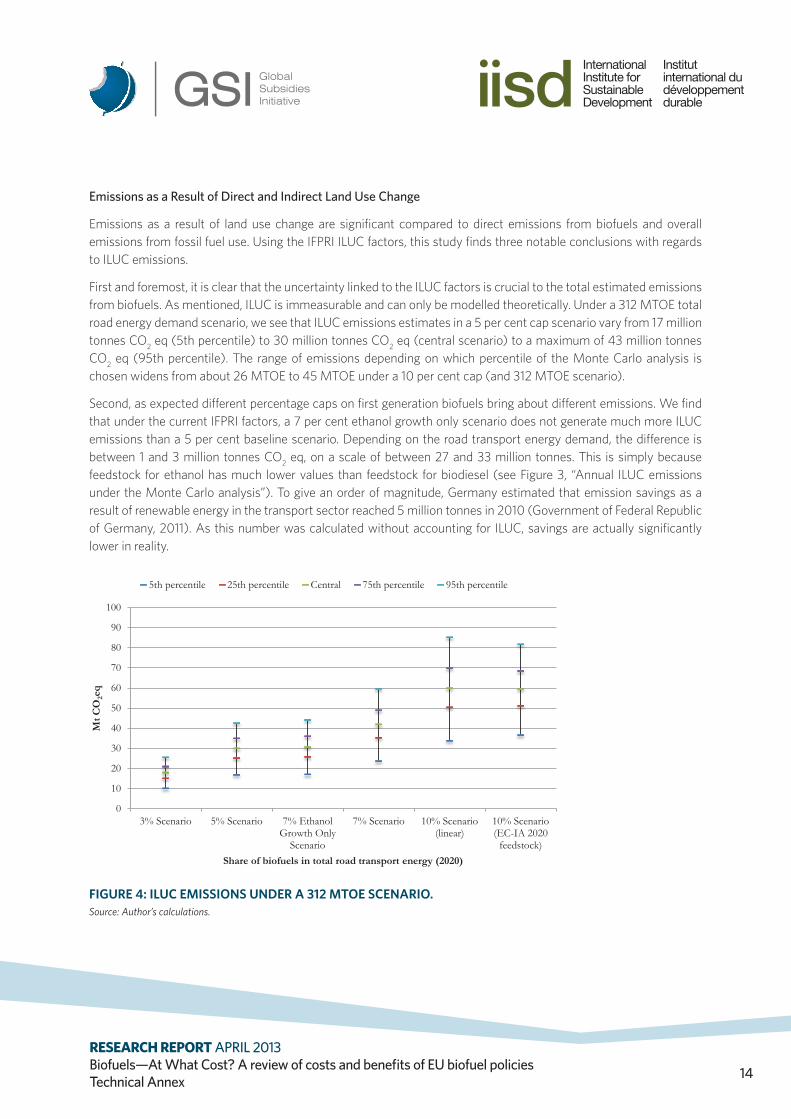
Third, the projected road transport energy demand is an important factor in estimating ILUC emissions from the biofuels caps proposed by the EC. As with direct emissions, it is possible to observe a significant difference between a 280 MTOE scenario, a 312 MTOE scenario and a 350 MTOE scenario. For example in a 5 per cent cap scenario, we see a difference of 4 million tonnes CO2 eq in the 5th percentile of ILUC factors, growing to a difference of 7 million tonnes in a central ILUC factors scenario and 10 million tonnes in the 95th percentile. These are large numbers, relative to the total estimates of ILUC emissions. Therefore, again, this study can only conclude that policy makers need to carefully assess the projected road transport energy demand, unlike the European Commission in its Impact Assessment accompanying the 5 per cent cap proposal.
FIGURE 5: ILUC EMISSIONS UNDER A 5 PER CENT CAP SCENARIO.Source: Author’s calculations.
0
10
20
30
40
50
60
280 MTOE 312 MTOE 350 MTOE
Mt C
O2e
q
Total road transport energy demand (2020)
5th percentile 25th percentile Central 75th percentile 95th percentile
© 2013 The International Institute for Sustainable DevelopmentRESEARCH REPORT APRIL 2013Biofuels—At What Cost? A review of costs and benefits of EU biofuel policiesTechnical Annex 16
8. The Social Cost of Carbon From “EU Biofuel Policies and Greenhouse Gas Emissions” in main report, Section 6.2.2
It is an important tool for policy makers to calculate the social costs and benefits of policies that are related to energy or climate change (Nordhaus, 2011). It can thus be used as a benchmark of economic efficiency of carbon-related policies. Simply put, it can be used to calculate and integrate the social benefits of reducing CO2-emissions into cost-benefit analyses of policies that have a small impact (like EU biofuel policy) on total global emissions (Interagency Working Group on Social Cost of Carbon, 2010). Nearly all policies have a small impact on global emissions, which is why the social cost of carbon (SCC) is calculated at the margin. A higher SCC implies that governments expect to incur higher costs from climate change related damage, which simply means they will be more inclined to take stringent measures with the aim of reducing carbon emissions or, alternatively, preventing new emissions.
There are many uncertainties related to the calculation of the SCC. First, by its very own nature, SCC estimates the economic impact of climate change effects. These effects deal with a certain degree of uncertainty themselves. Second, the SCC is dependent on a chosen discount rate. This discount rate represents the value of the benefit of future reduced climate change impacts in today’s currency (or those of one given year) (Greenspan, Bell & Callan, 2011). A lower discount rate implies that future costs are more significant (or “valued”) today than they would have been if a higher discount rate were applied. As for impact on policy making, calculations using a lower discount rate would thus spur governments to take action sooner. Higher discount rates often assume a wealthier economy, capable of making climate investments and having technological capacity to adapt to certain climate change effects (Greenspan, Bell & Callan, 2011).
These uncertainties are reflected in the range of SCCs found in the literature and within governments. Tol (2009) assessed 232 published estimates of the SCC and found a mean SCC of $105/tC (or $28.6/tCO2) with a standard deviation of $243/tC (or $66.2$/tCO2). The modal estimate is $13/tC (or $3.5/tCO2), which shows that the mean is driven by large estimates in certain percentiles (for example, $360/tC or $98.1/tCO2, in the 95th percentile). This high standard deviation is indicative of the uncertainty involved and is, among others, caused by the use of different discount rates.
Choosing one value or another has important policy implications. When a high value is used, policy makers are encouraged to be stricter on carbon emissions. For this study, we use sensitivity from a study by an interagency team of US government specialists. This team calculated an SCC range for the year 2010 of between $4.7/tCO2
(using a 5 per cent discount rate) and $35/tCO2 (using a 2.5 per cent discount rate), in 2007 dollars and assuming average values related to uncertainties. When assuming high impacts from climate change (95th percentile in the Interagency Team’s analysis) and a discount rate of 3 per cent, the SCC increases to about $64/tCO2 (Interagency Working Group on Social Cost of Carbon, 2010). Since these SCC estimates have received criticism for being too low (Ackerman & Stanton, 2010), the following estimates keep the 95th percentile in and urge the reader to keep in mind uncertainty.

© 2013 The International Institute for Sustainable DevelopmentRESEARCH REPORT APRIL 2013Biofuels—At What Cost? A review of costs and benefits of EU biofuel policiesTechnical Annex 17
TABLE 5: SOCIAL COST OF CARBON VALUES (EUR/TCO2, 2011 EUROS)
DISCOUNT RATESDISCOUNT RATES
5 PER CENT AVG 3 PER CENT AVG 2.5 PER CENT AVG 3 PER CENT 95TH
2010 3.6 16.5 27.1 50.1
2015 4.4 18.4 29.7 56.2
2020 5.3 20.3 32.2 62.3
2025 6.3 22.9 35.5 69.8
Source: Interagency Working Group on Social Cost of Carbon (2010).
Note: Converted using ECB Reference Exchange Rates and World Bank (2013) annual GDP deflators for the Euro-area.
To calculate the social benefits of avoiding emissions in the year 2020, the 2020 SCC values are multiplied by the amount of emissions saved as a result of biofuels in that year. We assume a 5 per cent cap as proposed by the European Commission. As mentioned in the previous sections, the total emission savings depends on a number of assumptions (related to uncertainties) such as road transport energy demand and ILUC factors. Assuming a central ILUC factor, the total emission savings from biofuels in 2020 would reach between 5.3 and 6 million tonnes, depending on road energy demand. When applying a 3 per cent discount rate (average climate impacts), we find that the benefits of avoiding these amounts of emissions in 2020 reaches between EUR108 and EUR122 million. This monetary benefit from avoiding emissions decreases when applying a higher discount rate (5 per cent) to around EUR30 million and increases when a 2.5 per cent discount rate is used to around EUR170 million and EUR190 million. It is clear that the social benefits of EU emission reductions increase drastically when we assume a grave impact of climate change on the economy. In this case, benefits can rise until around EUR373 million in a high transport energy demand scenario.
TABLE 6: SOCIAL BENEFITS OF EU BIOFUEL EMISSION REDUCTION IN 2020 (MILLION EUR), 5 PER CENT CAP, CENTRAL ILUC
ROAD TRANSPORT ENERGY DEMAND
DISCOUNT RATES
5 PER CENT AVG 3 PER CENT AVG 2.5 PER CENT AVG 3 PER CENT 95TH
280 MTOE 27.9 108.0 171.2 331.4
312 MTOE 28.0 108.4 171.8 332.5
350 MTOE 31.4 121.6 192.8 373.0
Source: Author calculations.
© 2013 The International Institute for Sustainable DevelopmentRESEARCH REPORT APRIL 2013Biofuels—At What Cost? A review of costs and benefits of EU biofuel policiesTechnical Annex 18
ReferencesAckerman, F., & Stanton, E. A. (2010). The Social Cost of Carbon: A report for the Economics for Equity and the Environment Network. Retrieved from http://progressive-economists.net/papers/SocialCostOfCarbon_SEI_20100401.pdf
Bindraban, P., Bulte, E., Conijn, S., Eickhout, B., Hoogwijk, M., & Londo, M. (2009). Scientific Assessment and Policy Analysis WAB 500102 024, Can biofuels be sustainable by 2020? An assessment for an obligatory blending target of 10% in the Netherlands. The Hague: Netherlands Environmental Assessment Agency. Retrieved from http://www.rivm.nl/bibliotheek/rapporten/500102024.pdf
Delzeit, R. (2012). Review of the IFPRI study, “Assessing the land use change consequences of European biofuel policies and its uncertainties.” Kiel Institute for the World Economy, 23.
DfT. (2012). Fuel Quality Directive “FQD” model data. London: Department for Transport.
di Lucia, L., Ahlgren, S., & Ericsson, K. (2012). The dilemma of indirect land-use changes in EU biofuel policy – An empirical study of policy-making in the context of scientific uncertainty. Environmental Science & Policy 16, 9-19.
Ecofys. (2012). Assessing grandfathering options under an EU ILUC policy. Retrieved from http://www.ecofys.com/files/files/ecofys_2012_grandfathering%20iluc_02.pdf
Edwards, R., J-F. Larivé, & J-C. Beziat. (2011).Well-to-wheels analysis of future automotive fuels and powertrains in the European context. JRC, CONCAWE and Renault/EUCAR, 74.
European Commission. (2012a). Impact Assessment. Accompanying the document Proposal for a directive of the European Parliament and of the Council amending Directive 98/70/EC relating to the quality of petrol and diesel fuels and amending Directive 2009/28/EC on the promotion of the use of energy from renewable sources. Brussels: European Commission, 129.
European Commission. (2012b). Proposal for a directive of the European Parliament and of the Council amending Directive 98/70/EC relating to the quality of petrol and diesel fuels and amending Directive 2009/28/EC on the promotion of the use of energy from renewable sources. Brussels: European Commission, 23.
Fortenbery, T. R. (2005). Biodiesel feasibility study: An evaluation of biodiesel feasibility in Wisconsin. Retrieved from http://www.aae.wisc.edu/pubs/sps/pdf/stpap481.pdf
Gerasimchuk , I., Bridle, R., Charles, C., & Moerenhout, T. (2012). Cultivating governance: Cautionary tales for biofuel policy reformers. Geneva: Global Subsidies Initiative.
Government of Federal Republic of Germany. (2011). Progress report under Article 22 of Directive 2009/28/EC on Promotion of the Use of Energy from Renewable Sources. European Commission, 73.
Greenspan Bell, R., & Callan, D. (2011). More than meets the eye: The social cost of carbon in U.S. climate policy, in Plain English. Policy Brief, World Resources Institute & Environmental Law Institute, 16.
Haas, M. J., McAloon, A. J., Yee, W. C., & Foglia, T. (2006). A process model to estimate biodiesel production costs. Bioresource Technology, 671-678.
Interagency Working Group on Social Cost of Carbon. (2010). Social Cost of Carbon for regulatory impact analysis - Under Executive Order 12866. Technical Support Document. Washington, DC: United States Government.

© 2013 The International Institute for Sustainable DevelopmentRESEARCH REPORT APRIL 2013Biofuels—At What Cost? A review of costs and benefits of EU biofuel policiesTechnical Annex 19
Joint Research Centre. (2008). Biofuels in the European context: Facts and uncertainties.”European Commission, 30.
Joint Research Centre. (2010). Indirect Land Use Change from increased biofuels demand. European Commission, 152.
Laborde, D. (2011). Assessing the land use change consequences of European biofuel policies. Washington, DC: International Food Policy Research Institute.
Marelli, L. (2013, February 20). Methodologies to assess ILUC. Workshop in Sustainable Biofuels: addressing Indirect Land Use Change. Brussels, Belgium.
McKinsey Quarterly. (2007). Positioning Brazil for biofuels success. Retrieved from http://www.mckinseyquarterly.com/Positioning_Brazil_for_biofuels_success_1950
Nordhaus, W. (2011). Estimates of the social cost of carbon: Background and results from the TICE-2011 model. New Haven, CT: Yale University, Cowles Foundation for Research in Economics.
Page, S. E., Morrison, R., Malins, C., Hooijer, A., Rieley, J. O., & Jauhiainen, J. (2011). Review of peat surface greenhouse gas emissions from oil palm plantations in Southeast Asia. ICCT White Paper.
Tol, R. S. J. (2009). The economic effects of climate change. Journal of Economic Perspectives 23, 2: 29-51.
Union of Concerned Scientists, Greenpeace and World Resources Institute. (2012). Indonesia’s moratorium on new forest concessions: A review. Retrieved January 24 from http://www.ucsusa.org/assets/documents/global_warming/indonesia-moratorium-forest-carbon-stocks-summary.pdf
World Bank. (2013). Inflation, GDP deflator (annual %). Retrieved from http://data.worldbank.org/indicator/NY.GDP.DEFL.KD.ZG/countries/EU?display=graph
www.iisd.org/gsi GSI is an initiative of the International Institute for Sustainable Development
Further details and contact informationFor further information contact Kerryn Lang at: [email protected] or +41-22-917-8920.
International Institute for Sustainable DevelopmentGlobal Subsidies InitiativeInternational Environment House 2, 9 chemin de Balexert, 1219 Châtelaine, Geneva, SwitzerlandTel: +41 22 917-8373 | Fax: +41 22 917-8054