bioenergia de nuevo lÉon, s.a. de c.v
TRANSCRIPT
1
MONTERREY’S LANDFILL GAS TO ENERGY PROJECT
BIOENERGIA DE NUEVO LÉON, S.A. DE C.V.
THE WORLD BANK
Jorge Humberto Padilla Olvera & Jaime Luis Saldaña MéndezWashington, D.C., March 19th, 2007
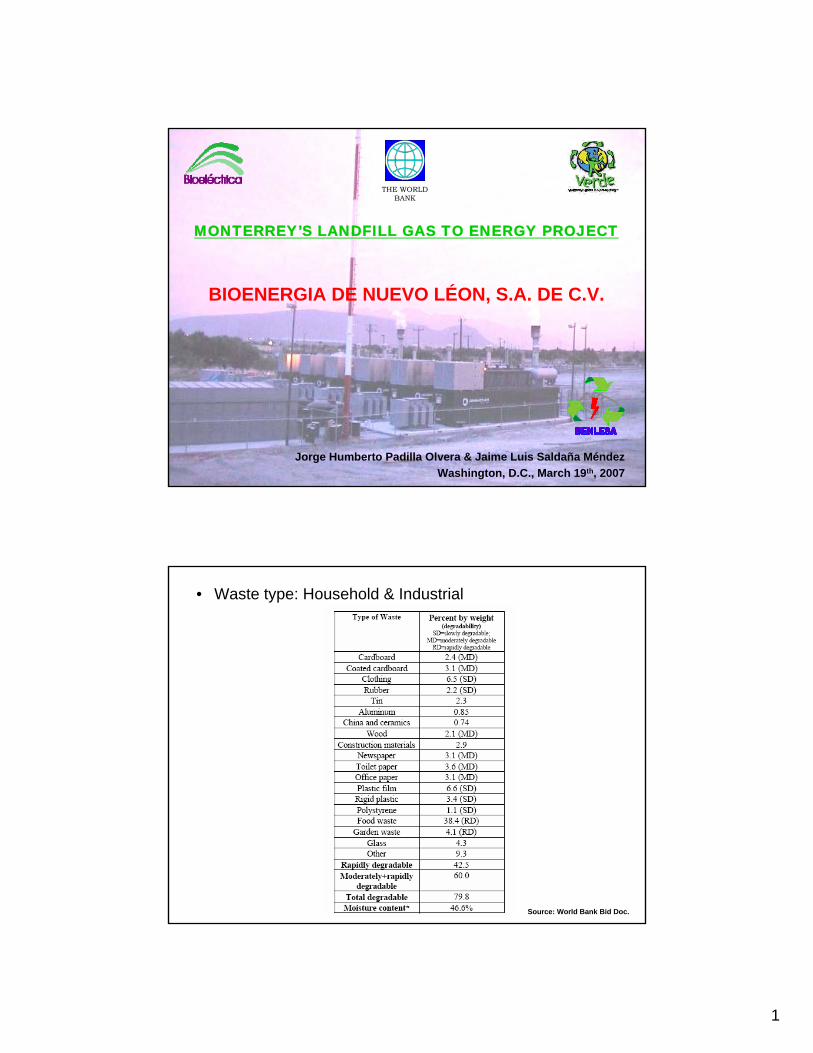
• Waste type: Household & Industrial
Source: World Bank Bid Doc.
2
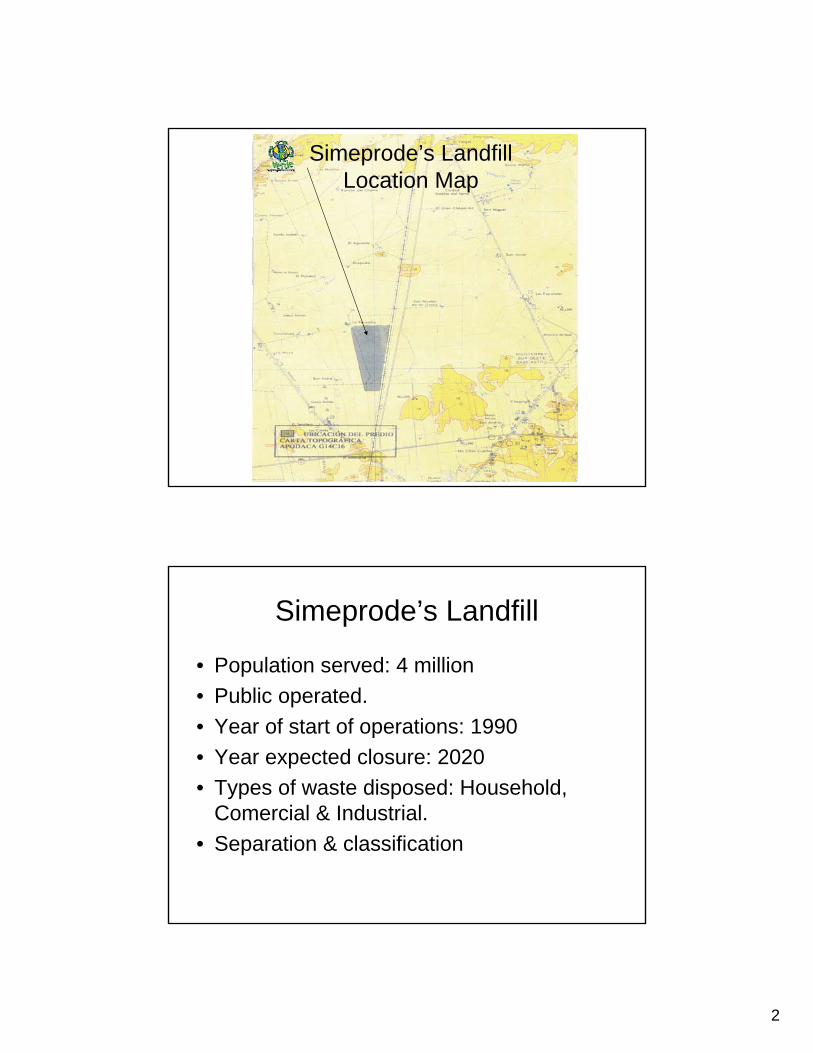
Simeprode’s LandfillLocation Map
Simeprode’s Landfill
• Population served: 4 million• Public operated.• Year of start of operations: 1990• Year expected closure: 2020 • Types of waste disposed: Household,
Comercial & Industrial.• Separation & classification
3
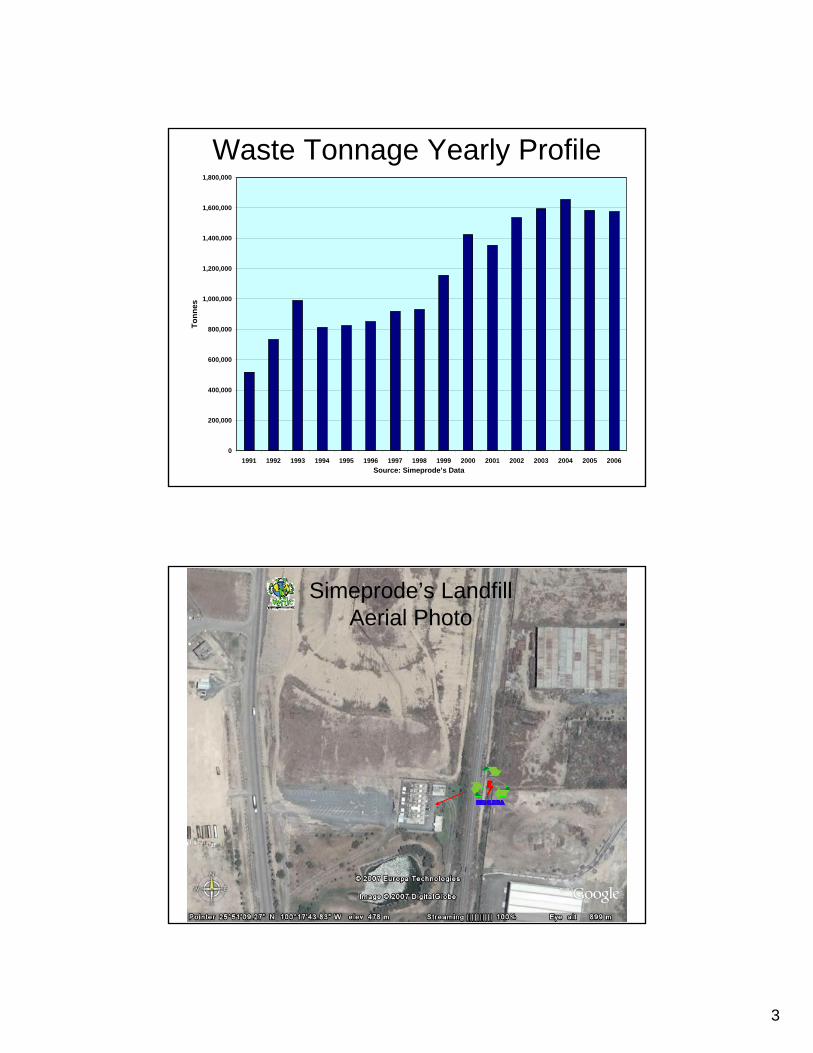
Source: Simeprode’s Data
0
200,000
400,000
600,000
800,000
1,000,000
1,200,000
1,400,000
1,600,000
1,800,000
1991 1992 1993 1994 1995 1996 1997 1998 1999 2000 2001 2002 2003 2004 2005 2006
Tonn
es
Waste Tonnage Yearly Profile
Simeprode’s LandfillAerial Photo

4
Benlesa (Phase 1)Benlesa (Phase 2)Expansion Project
Benlesa (Facility)
Simeprode’s LandfillAerial Photo
Landfill Engineering• Engineering details (construction)
– Gas collection system background: None– Leachate collection system background: Vertical
pumping extraction. • Operation
– Average depth: 20 mts.– Area covered: 56 ha.– Total tonnage with gas collection: 8.7 million tons.– Compaction details: Mechanical compactor: 0.8 kg/m3
– Frequency of waste cover: Daily– Type of cover: Clay
5
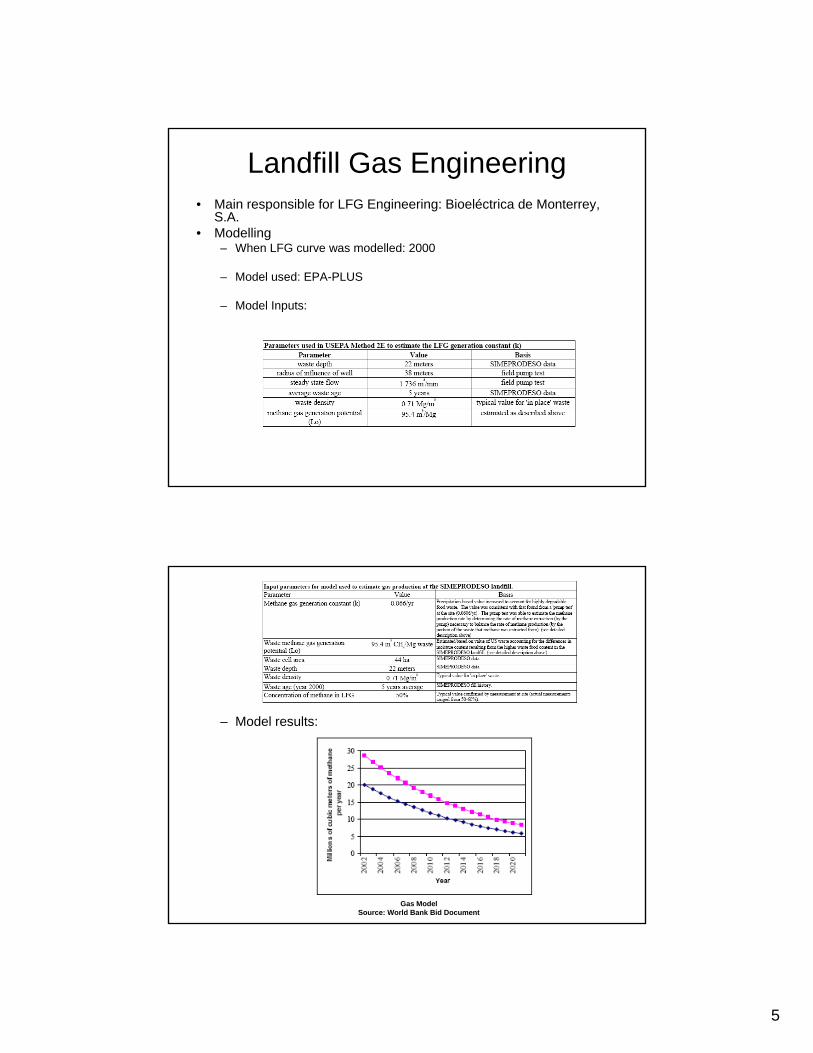
Landfill Gas Engineering• Main responsible for LFG Engineering: Bioeléctrica de Monterrey,
S.A.• Modelling
– When LFG curve was modelled: 2000
– Model used: EPA-PLUS
– Model Inputs:
– Model results:
Gas ModelSource: World Bank Bid Document

6
• Pump testing– Carried out or not: Carries out– If carried out, systematics:
• When: 2000 & 2002• How many wells: 1 & 160• Location of wells: Middle of the landfill / All the surface.• For how long: 7 days in 2000 & 90 days between 2002-2003.
– Pump testing results (average LFG composition, flow)
WELL NO CH4 % CO2 % O2 % N2 % 1 54.90 40.53 0.81 3.53 2 ---- ---- ---- ---- 3 ---- ---- ---- ---- 4 ---- ---- ---- ----
….. TOTAL 54.90 40.53 0.81 3.53
Gas Measurements for the landfill (1st. trial report)
Source: World Bank Bid Document
2nd. Gas Proving Trial
The purpose of gas proving trial was to determine if there was sufficient quantity and quality of landfill gas available from the existing, closed, 44 Ha area of the SIMEPRODESO sanitary landfill located at Salinas Victoria, Nuevo León, Mexico, sanitary landfill to satisfactorily operate the 7MW landfill gas plant.
The required gas level was calculated as follows:
a. Each Jenbacher 320 Engine requires 311m3 methane per hour (including the stated 5% ISO allowance) at an electrical output of 1,060kW at Standard Temperature and Pressure (0oC, 1013.25mBar).
b. The desired methane concentration in the landfill gas is between 35% and 50%.
c. The desired Oxygen concentration is less than 2%.
d. A safety margin of 20% excess methane volumes, above that level required by the engines, to take account of seasonal variation in gas yield from the landfill. This level of safety margin is based on experience.
As a result the required gas flow rate is;
2,612m3/hr methane for 7 Engines at full output
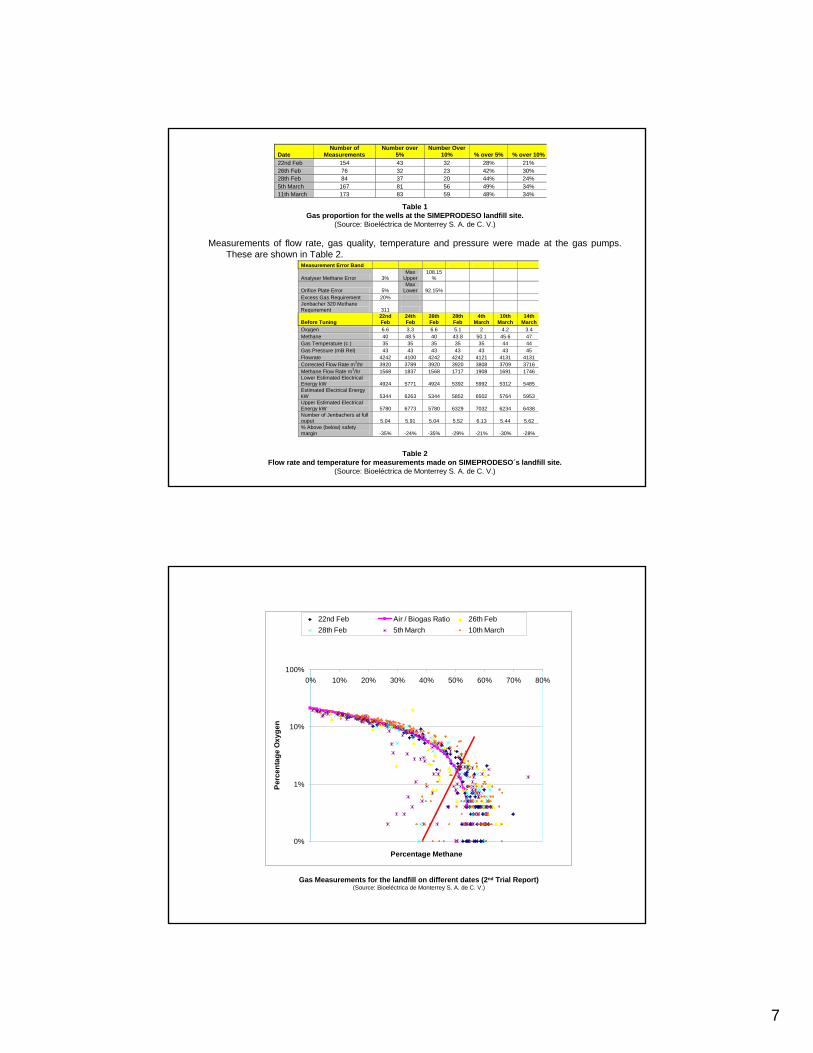
Table 1 shows the proportion of samples that contained oxygen above 5%, and above 10%, on each of the occasions that measurements were taken.
7
Table 1Gas proportion for the wells at the SIMEPRODESO landfill site.
(Source: Bioeléctrica de Monterrey S. A. de C. V.)
Measurements of flow rate, gas quality, temperature and pressure were made at the gas pumps. These are shown in Table 2.
Table 2Flow rate and temperature for measurements made on SIMEPRODESO´s landfill site.
(Source: Bioeléctrica de Monterrey S. A. de C. V.)
Date Number of
Measurements Number over
5% Number Over
10% % over 5% % over 10%22nd Feb 154 43 32 28% 21% 26th Feb 76 32 23 42% 30% 28th Feb 84 37 20 44% 24% 5th March 167 81 56 49% 34% 11th March 173 83 59 48% 34%
Measurement Error Band
Analyser Methane Error 3% Max
Upper 108.15
%
Orifice Plate Error 5% Max
Lower 92.15% Excess Gas Requirement 20% Jenbacher 320 Methane Requirement 311
Before Tuning 22nd Feb
24th Feb
26th Feb
28th Feb
4th March
10th March
14th March
Oxygen 6.6 3.3 6.6 5.1 2 4.2 3.4 Methane 40 48.5 40 43.8 50.1 45.6 47 Gas Temperature (c ) 35 35 35 35 35 44 44 Gas Pressure (mB Rel) 43 43 43 43 43 43 45 Flowrate 4242 4100 4242 4242 4121 4131 4131 Corrected Flow Rate m3/hr 3920 3789 3920 3920 3808 3709 3716 Methane Flow Rate m3/hr 1568 1837 1568 1717 1908 1691 1746 Lower Estimated Electrical Energy kW 4924 5771 4924 5392 5992 5312 5485 Estimated Electrical Energy kW 5344 6263 5344 5852 6502 5764 5953 Upper Estimated Electrical Energy kW 5780 6773 5780 6329 7032 6234 6438 Number of Jenbachers at full ouput 5.04 5.91 5.04 5.52 6.13 5.44 5.62 % Above (below) safety margin -35% -24% -35% -29% -21% -30% -28%
0%
1%
10%
100%0% 10% 20% 30% 40% 50% 60% 70% 80%
Percentage Methane
Per
cent
age
Oxy
gen
22nd Feb Air / Biogas Ratio 26th Feb28th Feb 5th March 10th March
Gas Measurements for the landfill on different dates (2nd Trial Report)(Source: Bioeléctrica de Monterrey S. A. de C. V.)
8
Table 1. indicates that 34% of the gas wells exhibit oxygen levels above 10%. On the assumption that all of these wells are upgraded, and that 60% of those seal upgrades are successful from the methane generation point of view, then the gas flow rate and consequently electrical output will be improved by 20.5%.
The current lower estimated electrical energy (taking into account the required safety margins and measurement accuracy) is 5,485kW. An improvement of 20.5% on this level implies an estimate lower electrical output of 6,690kW, or the equivalent of 6.31 Jenbacher 320 Engines at full output.
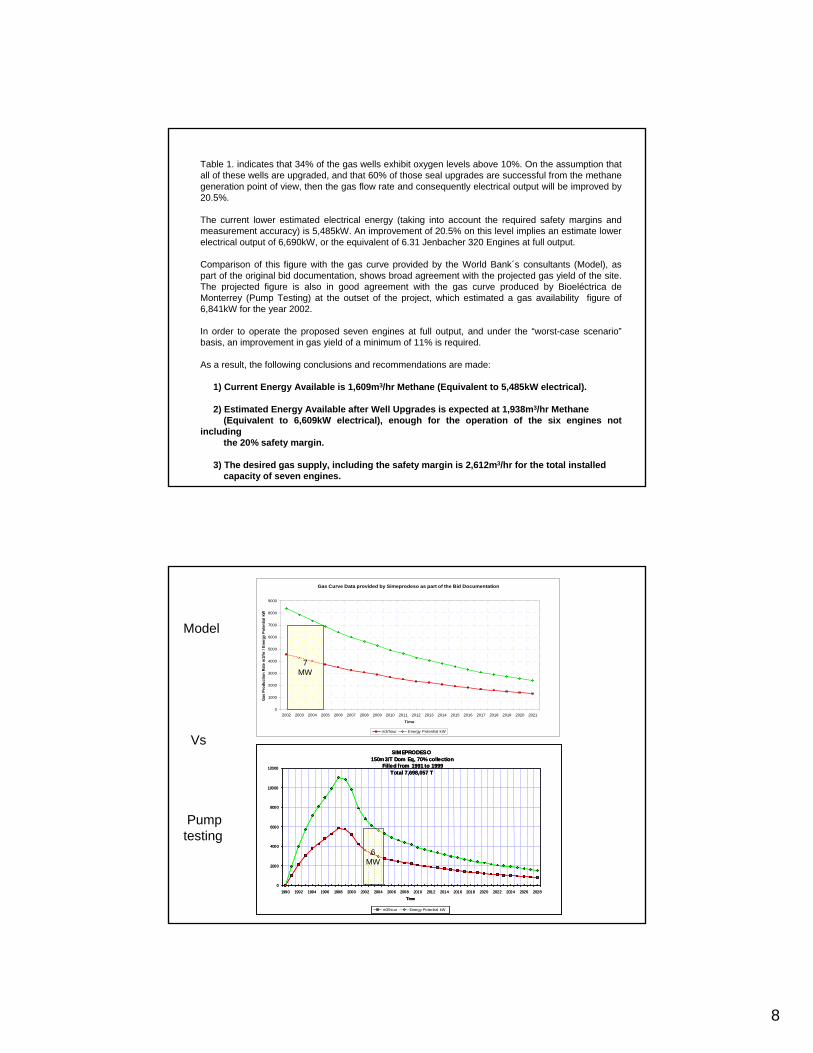
Comparison of this figure with the gas curve provided by the World Bank´s consultants (Model), as part of the original bid documentation, shows broad agreement with the projected gas yield of the site. The projected figure is also in good agreement with the gas curve produced by Bioeléctrica de Monterrey (Pump Testing) at the outset of the project, which estimated a gas availability figure of 6,841kW for the year 2002.
In order to operate the proposed seven engines at full output, and under the “worst-case scenario”basis, an improvement in gas yield of a minimum of 11% is required.
As a result, the following conclusions and recommendations are made:
1) Current Energy Available is 1,609m3/hr Methane (Equivalent to 5,485kW electrical).
2) Estimated Energy Available after Well Upgrades is expected at 1,938m3/hr Methane(Equivalent to 6,609kW electrical), enough for the operation of the six engines not
including the 20% safety margin.
3) The desired gas supply, including the safety margin is 2,612m3/hr for the total installedcapacity of seven engines.
Model
Vs
Pumptesting
Gas Curve Data provided by Simeprodeso as part of the Bid Documentation
0
1000
2000
3000
4000
5000
6000
7000
8000
9000
2002 2003 2004 2005 2006 2007 2008 2009 2010 2011 2012 2013 2014 2015 2016 2017 2018 2019 2020 2021
Time
Gas
Pro
duct
ion
Rate
m3/
hr /
Ener
gy P
oten
tial k
W
m3/hour Energy Potential kW
SIMEPRODESO150m3/T Dom Eq, 70% collection
Filled from 1991 to 1999Total 7,698,057 T
0
2000
4000
6000
8000
10000
12000
1990 1992 1994 1996 1998 2000 2002 2004 2006 2008 2010 2012 2014 2016 2018 2020 2022 2024 2026 2028
Time
m3/hour Energy Potential kW
SIMEPRODESO150m3/T Dom Eq, 70% collection
Filled from 1991 to 1999Total 7,698,057 T
0
2000
4000
6000
8000
10000
12000
1990 1992 1994 1996 1998 2000 2002 2004 2006 2008 2010 2012 2014 2016 2018 2020 2022 2024 2026 2028
Time
m3/hour Energy Potential kW
7MW
6MW
9
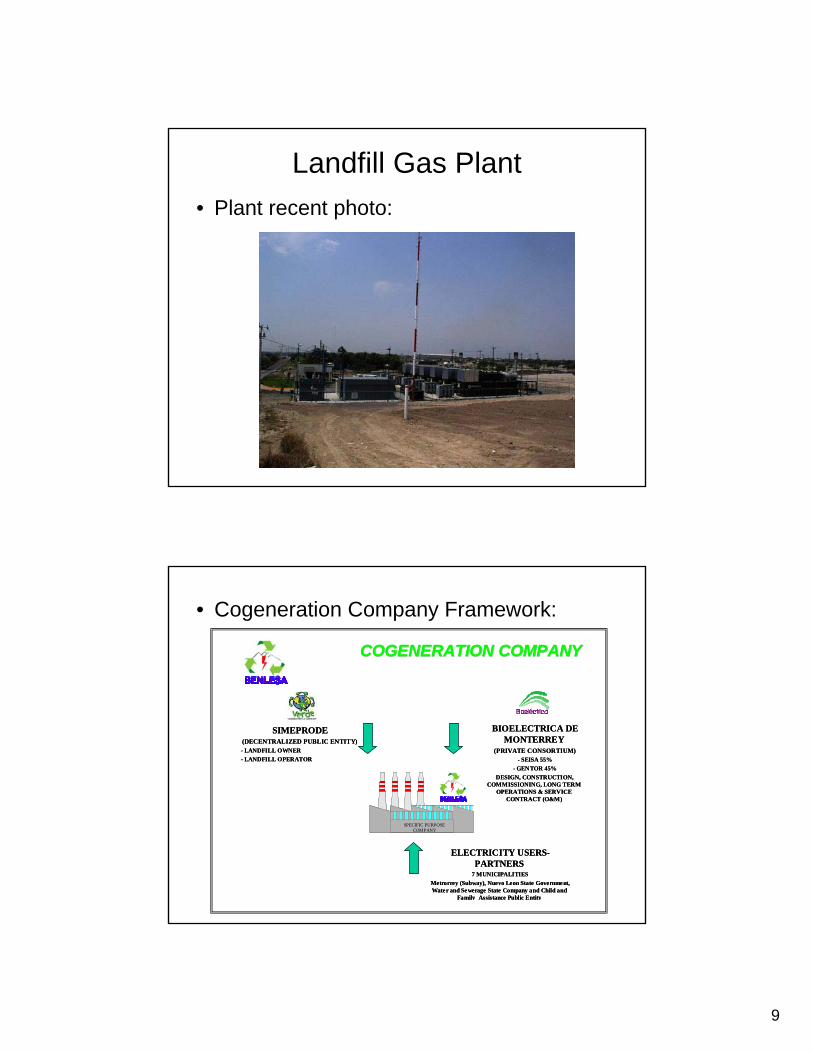
Landfill Gas Plant• Plant recent photo:
• Cogeneration Company Framework:
COGENERATION COMPANY COGENERATION COMPANY
SIMEPRODE (DECENTRALIZED PUBLIC ENTITY) - LANDFILL OWNER - LANDFILL OPERATOR
BIOELECTRICA DE MONTERREY
(PRIVATE CONSORTIUM) - SEISA 55%
- GENTOR 45% DESIGN, CONSTRUCTION,
COMMISSIONING, LONG TERM OPERATIONS & SERVICE
CONTRACT (O&M)
ELECTRICITY USERS-PARTNERS
7 MUNICIPALITIES Metrorrey (Subway), Nuevo Leon State Government, Water and Se werage State Company and Child and
Family Assistance Public Entity
SPECIFIC PURPOSECOMPANY
SPECIFIC PURPOSECOMPANY
10
• Engineering– Who designed the plant: Bioeléctrica de Monterrey,
S.A.• Construction
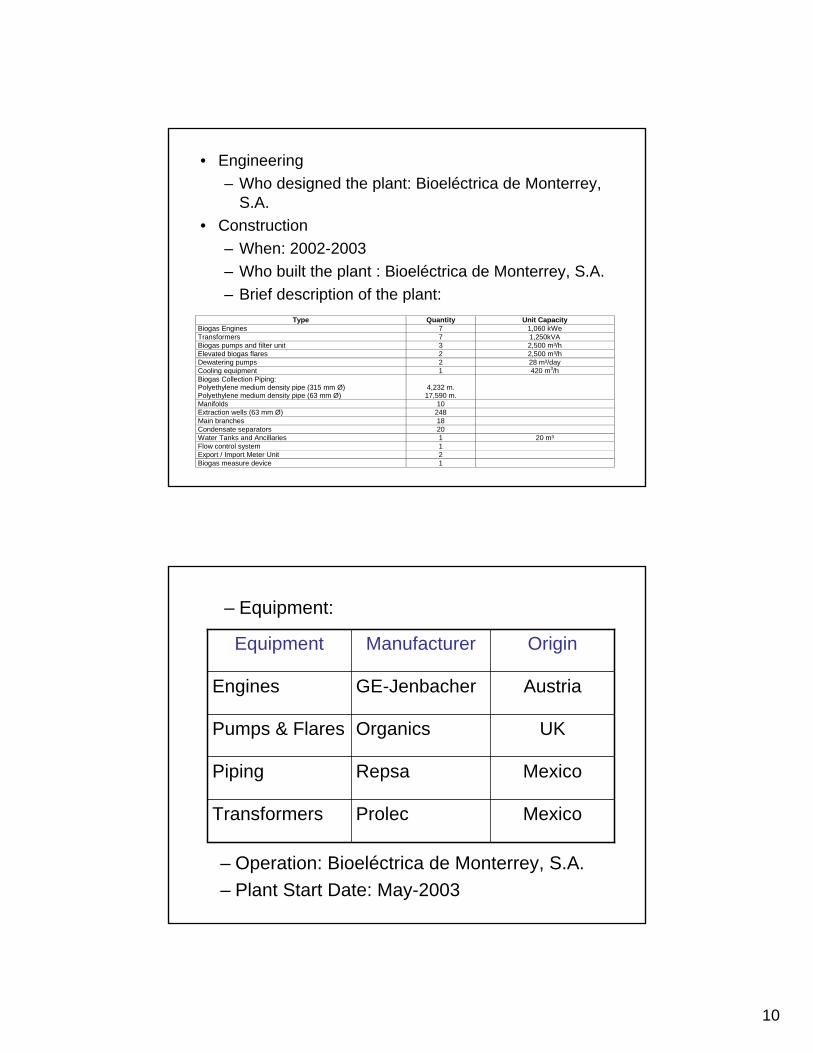
– When: 2002-2003– Who built the plant : Bioeléctrica de Monterrey, S.A.– Brief description of the plant:
Type Quantity Unit Capacity Biogas Engines 7 1,060 kWe Transformers 7 1,250kVA Biogas pumps and filter unit 3 2,500 m³/h Elevated biogas flares 2 2,500 m³/h Dewatering pumps 2 28 m³/day Cooling equipment 1 420 m3/h Biogas Collection Piping: Polyethylene medium density pipe (315 mm Ø) Polyethylene medium density pipe (63 mm Ø)
4,232 m. 17,590 m.
Manifolds 10 Extraction wells (63 mm Ø) 248 Main branches 18 Condensate separators 20 Water Tanks and Ancillaries 1 20 m³ Flow control system 1 Export / Import Meter Unit 2 Biogas measure device 1
– Equipment:
MexicoProlecTransformers
MexicoRepsaPiping
UKOrganicsPumps & Flares
AustriaGE-JenbacherEngines
OriginManufacturerEquipment
– Operation: Bioeléctrica de Monterrey, S.A.– Plant Start Date: May-2003
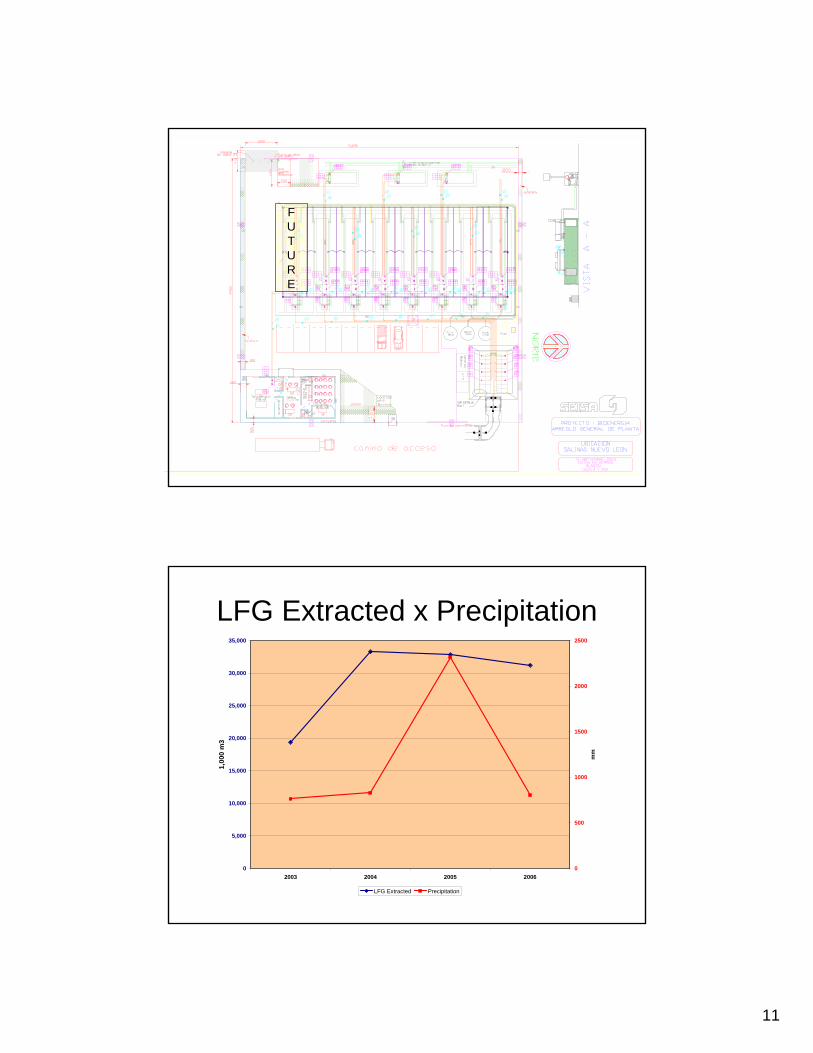
11
FUTURE
LFG Extracted x Precipitation
0
5,000
10,000
15,000
20,000
25,000
30,000
35,000
2003 2004 2005 2006
1,00
0 m
3
0
500
1000
1500
2000
2500
mm
LFG Extracted Precipitation
12
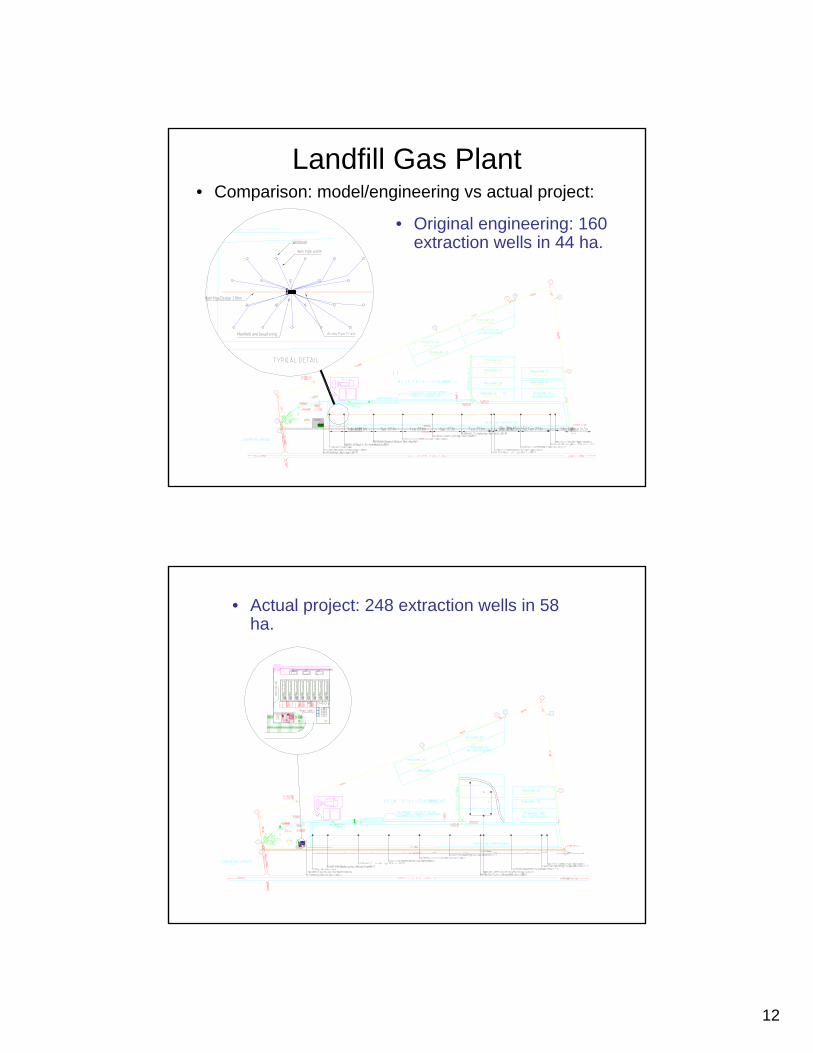
Landfill Gas Plant• Comparison: model/engineering vs actual project:
• Original engineering: 160 extraction wells in 44 ha.
• Actual project: 248 extraction wells in 58 ha.
13
0
10,000
20,000
30,000
40,000
2003 2004 2005 2006
1,00
0 m
3
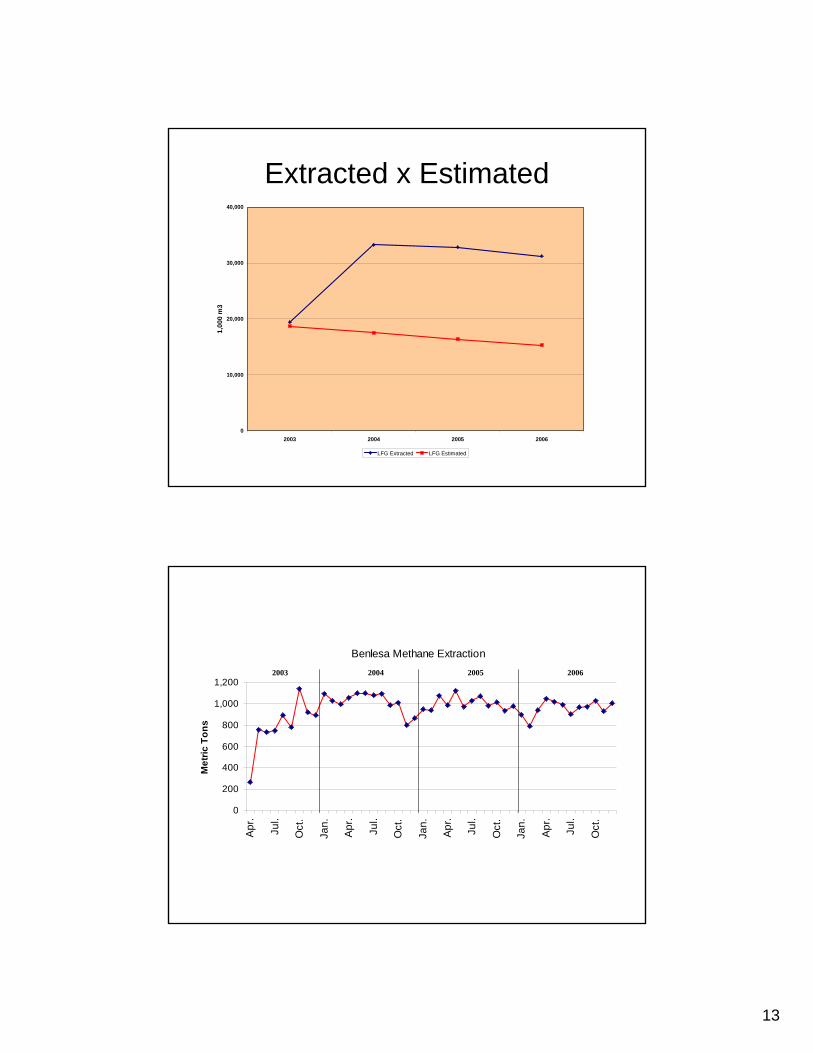
LFG Extracted LFG Estimated
Extracted x Estimated
Benlesa Methane Extraction
0
200
400
600
800
1,000
1,200
Apr
.
Jul.
Oct
.
Jan.
Apr
.
Jul.
Oct
.
Jan.
Apr
.
Jul.
Oct
.
Jan.
Apr
.
Jul.
Oct
.
Met
ric T
ons
2003 2004 2005 2006
14
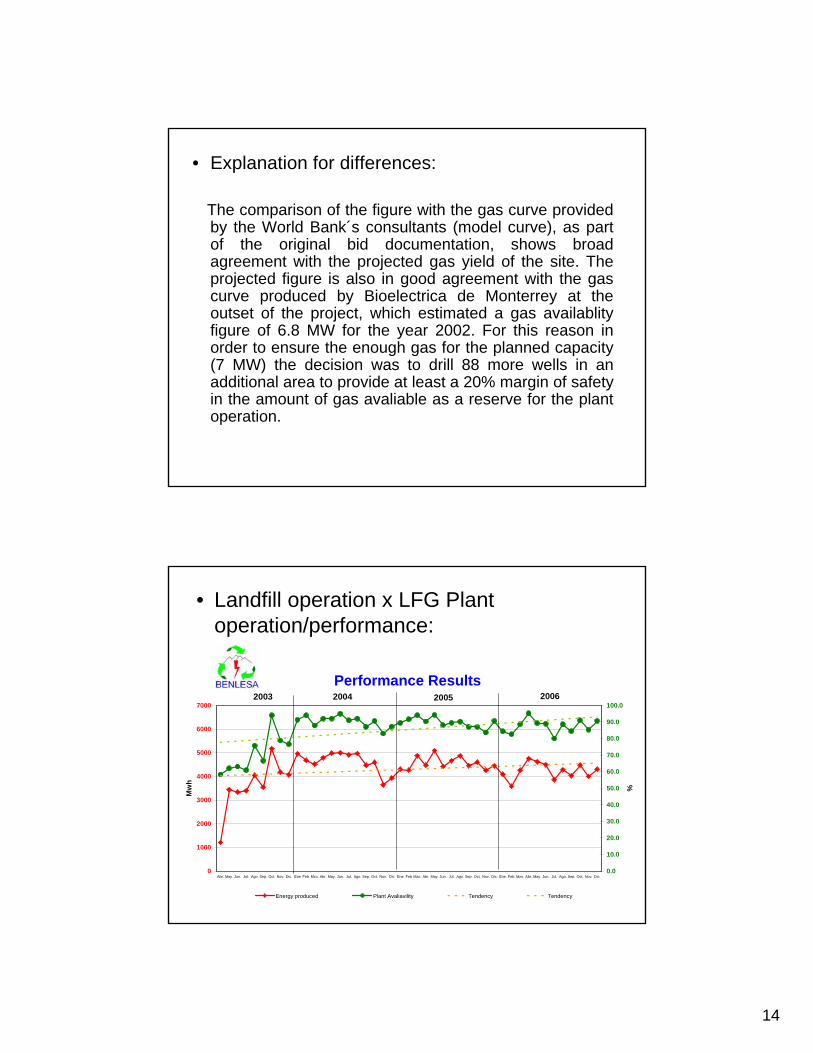
• Explanation for differences:
The comparison of the figure with the gas curve providedby the World Bank´s consultants (model curve), as partof the original bid documentation, shows broadagreement with the projected gas yield of the site. Theprojected figure is also in good agreement with the gas curve produced by Bioelectrica de Monterrey at theoutset of the project, which estimated a gas availablityfigure of 6.8 MW for the year 2002. For this reason in order to ensure the enough gas for the planned capacity(7 MW) the decision was to drill 88 more wells in anadditional area to provide at least a 20% margin of safetyin the amount of gas avaliable as a reserve for the plantoperation.
• Landfill operation x LFG Plantoperation/performance:
Performance Results
0
1000
2000
3000
4000
5000
6000
7000
Abr. May. Jun. Jul. Ago. Sep. Oct. Nov. Dic. Ene Feb. Mzo. Abr. May. Jun. Jul. Ago. Sep. Oct. Nov. Dic Ene Feb Mzo. Abr. May. Jun. Jul. Ago. Sep. Oct. Nov. Dic. Ene. Feb. Mzo. Abr. May. Jun. Jul. Ago. Sep. Oct. Nov. Dic.
Mw
h
0.0
10.0
20.0
30.0
40.0
50.0
60.0
70.0
80.0
90.0
100.0
%
Energy produced Plant Avaliavility Tendency Tendency
2003 2004 2005 2006
15
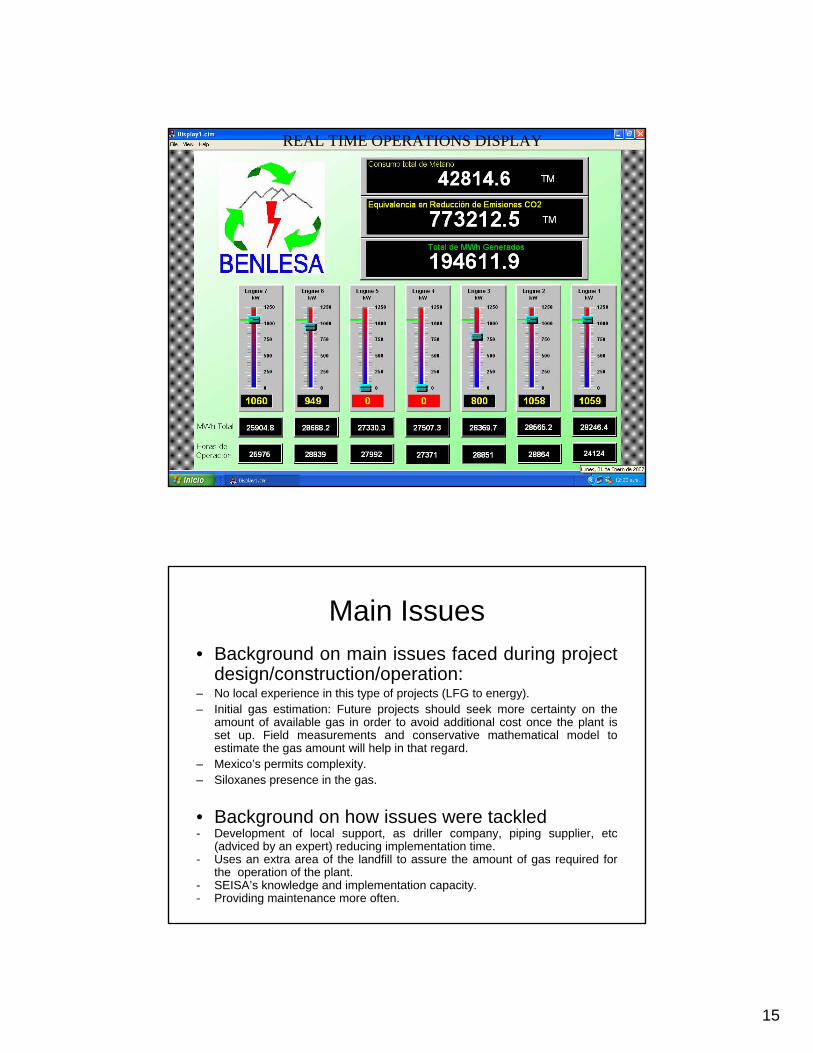
REAL TIME OPERATIONS DISPLAY
Main Issues• Background on main issues faced during project
design/construction/operation:– No local experience in this type of projects (LFG to energy).– Initial gas estimation: Future projects should seek more certainty on the
amount of available gas in order to avoid additional cost once the plant isset up. Field measurements and conservative mathematical model toestimate the gas amount will help in that regard.
– Mexico’s permits complexity.– Siloxanes presence in the gas.
• Background on how issues were tackled- Development of local support, as driller company, piping supplier, etc
(adviced by an expert) reducing implementation time.- Uses an extra area of the landfill to assure the amount of gas required for
the operation of the plant.- SEISA’s knowledge and implementation capacity. - Providing maintenance more often.
16
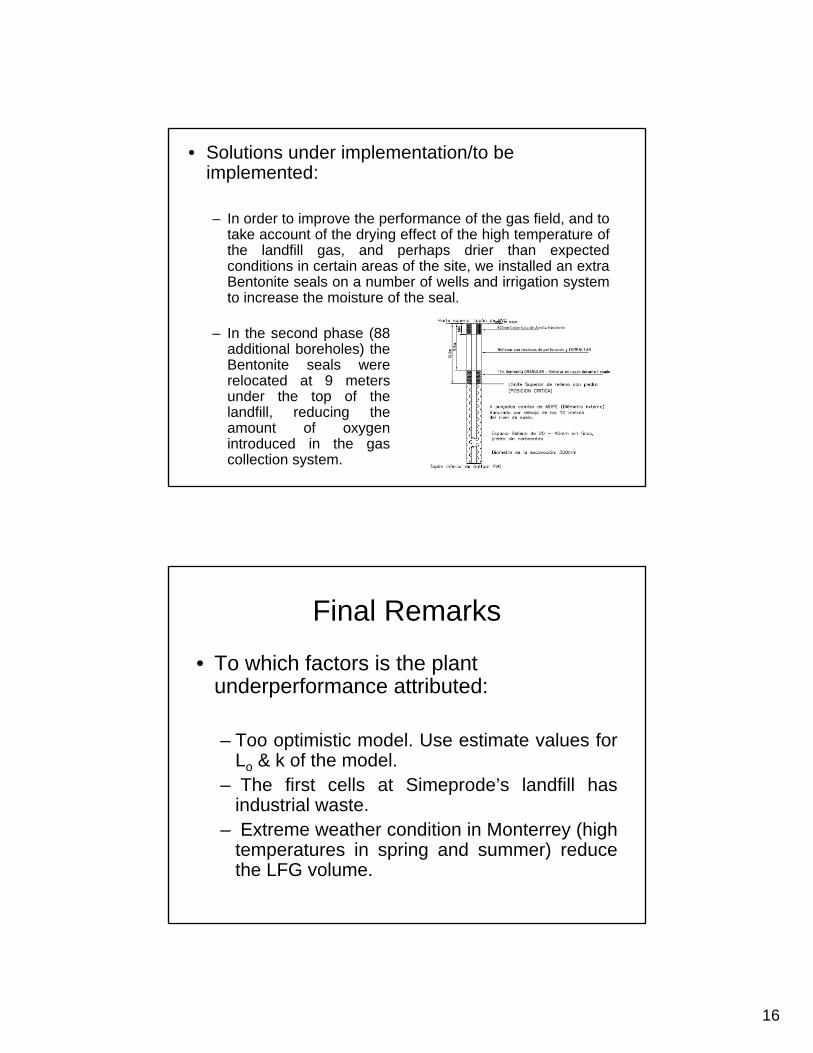
• Solutions under implementation/to be implemented:
– In order to improve the performance of the gas field, and totake account of the drying effect of the high temperature ofthe landfill gas, and perhaps drier than expectedconditions in certain areas of the site, we installed an extra Bentonite seals on a number of wells and irrigation systemto increase the moisture of the seal.
– In the second phase (88 additional boreholes) theBentonite seals wererelocated at 9 metersunder the top of thelandfill, reducing theamount of oxygenintroduced in the gas collection system.
Final Remarks
• To which factors is the plantunderperformance attributed:
– Too optimistic model. Use estimate values forLo & k of the model.
– The first cells at Simeprode’s landfill has industrial waste.
– Extreme weather condition in Monterrey (hightemperatures in spring and summer) reduce the LFG volume.
17
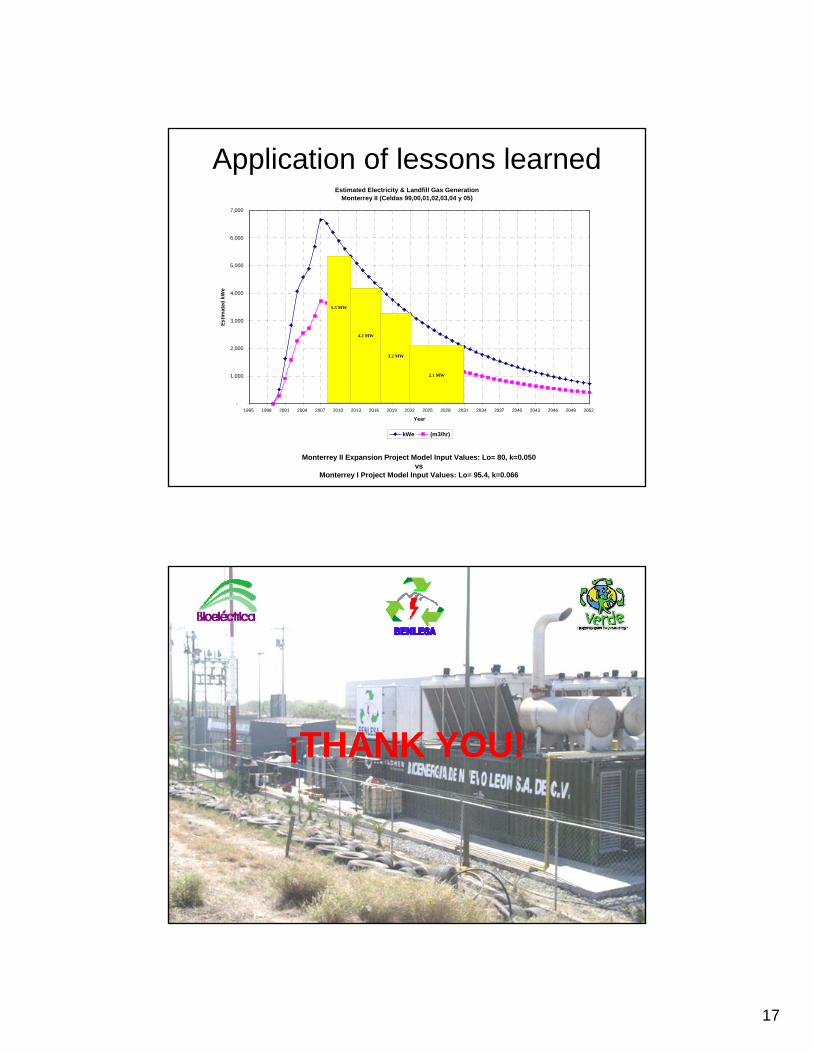
Application of lessons learnedEstimated Electricity & Landfill Gas Generation
Monterrey II (Celdas 99,00,01,02,03,04 y 05)
-
1,000
2,000
3,000
4,000
5,000
6,000
7,000
1995 1998 2001 2004 2007 2010 2013 2016 2019 2022 2025 2028 2031 2034 2037 2040 2043 2046 2049 2052
Year
Estim
ated
kW
e
kWe (m3/hr)
5.3 MW
4.2 MW
3.2 MW
2.1 MW
Monterrey II Expansion Project Model Input Values: Lo= 80, k=0.050vs
Monterrey I Project Model Input Values: Lo= 95.4, k=0.066
¡THANK YOU!