biodiesel production via functionalized graphite...
TRANSCRIPT
BIODIESEL PRODUCTION VIA FUNCTIONALIZED GRAPHITE
CATALYST
HO YEE SHEN
A project report submitted in partial fulfilment of the
requirements for the award of Bachelor of Engineering
(Hons.) Chemical Engineering
Lee Kong Chian Faculty of Engineering and Science
Universiti Tunku Abdul Rahman
May 2016

ii
DECLARATION
I hereby declare that this project report is based on my original work except for
citations and quotations which have been duly acknowledged. I also declare that it
has not been previously and concurrently submitted for any other degree or award at
UTAR or other institutions.
Signature :
Name : HO YEE SHEN
ID No. : 12UEB03762
Date : MAY 2016
iii
APPROVAL FOR SUBMISSION
I certify that this project report entitled “BIODIESEL PRODUCTION VIA
FUNCTIONALIZED GRAPHITE CATALYST” was prepared by HO YEE
SHEN has met the required standard for submission in partial fulfilment of the
requirements for the award of Bachelor of Engineering (Hons.) Chemical
Engineering at Universiti Tunku Abdul Rahman.
Approved by,
Signature :
Supervisor : DR LEE ZHI HUA
Date : MAY 2016
iv
The copyright of this report belongs to the author under the terms of the
copyright Act 1987 as qualified by Intellectual Property Policy of Universiti Tunku
Abdul Rahman. Due acknowledgement shall always be made of the use of any
material contained in, or derived from, this report.
© 2015, Ho Yee Shen. All right reserved.

v
Specially dedicated to
my beloved lecturers, supervisor, family and friends

vi
ACKNOWLEDGEMENTS
I would like to take this opportunity to express my deep sense of gratitude towards
the many characters that have been contributory and supportive in the successful
completion of this final year project as a fractional fulfilment of the requirement for
the Bachelor of Engineering (Hons.) Chemical Engineering in Universiti Tunku
Abdul Rahman.
First of all, I would like to utter my utmost gratitude to my supervisor, Dr.
Lee Zhi Hua for her invaluable advice and guidance throughout the development of
the project. Her advices, guidance, recommendations, insights and cheerful
approaches had enlightened and motivated me towards the successful completion of
this project.
Furthermore, I would like to express my appreciations and thankfulness to
my other partners who are Hong Wei Sam, Tan Yin Rui, Teoh Yee Ling, Wong Sin
Long and Ngu Sing Yii for sharing our opinions, ideas and thoughts on various
topics.
Lastly, I would also like to thank my loving parent and friends who had
helped and given me constant encouragement and support, which are crucial in
providing me the reason to keep striving for the best.
vii
BIODIESEL PRODUCTION VIA FUNCTIONALIZED GRAPHITE
CATALYST
ABSTRACT
In this study, the esterification process of PFAD and methanol to form biodiesel was
successfully investigated using graphite as catalyst. Catalyst characterization
methods such as XRD, SEM and FTIR were completed on the graphite catalysts
based on different preparation conditions. The three types of catalyst investigated
were original, purified and sulfonated graphite catalysts. Besides that, GC was
carried to determine the yield of biodiesel for different process parameters such as
methanol-to-PFAD ratio, reaction temperature and catalyst loading. From the XRD
analysis, sulfonated graphite catalyst has smaller crystallite sizes and greater integrity
intensity. For SEM spectroscopy, sulfonated graphite catalyst has more defects and
cracks, which contribute to greater number of active sites. For FTIR spectroscopy,
the presence of sulfonate groups, O=S=O stretching vibrations and S-O groups was
only shown in the sulfonated graphite catalyst but not the others. It indicated the
practicality of introducing SO3H groups on the surfaces of graphite catalyst through
sulfonation. For GC analysis, some process parameters such as were selected to
investigate their effect on the biodiesel yield and to predict their optimal values. The
optimal methanol-to-PFAD ratio, reaction temperature and catalyst loading were
30.0, 170 and 3 wt%, respectively. These results were tally with the one suggested
by using software DesignExpert8 where it was more preferable to have high
temperature and high catalyst loading since it offered a more accurate analysis.
viii
TABLE OF CONTENTS
DECLARATION ii
APPROVAL FOR SUBMISSION iii
ACKNOWLEDGEMENTS vi
ABSTRACT vii
TABLE OF CONTENTS viii
LIST OF TABLES xi
LIST OF FIGURES xii
LIST OF SYMBOLS / ABBREVIATIONS xiv
LIST OF APPENDICES xvi
CHAPTER
1 INTRODUCTION 1
1.1 Renewable Energy Sources 1
1.2 Background of Biodiesel 2
1.2.1 Properties of Biodiesel 3
1.2.2 Advantages of Biodiesel 4
1.2.3 Disadvantages of Biodiesel 5
1.3 Problem Statement 5
1.3.1 Limitations of Conventional Heterogeneous
Catalysts 6
1.4 Aims and Objectives 8
1.5 Scope of Study 8
ix
1.6 Outline of Thesis 9
2 LITERATURE REVIEW 10
2.1 PFAD as Feedstock 10
2.2 Transesterification and Esterification 11
2.2.1 Transesterification 12
2.2.2 Esterification 13
2.3 Catalysis in Esterification 14
2.3.1 Homogeneous Acidic Catalyst 14
2.3.2 Heterogeneous Acidic Catalyst 14
2.4 Catalyst Support 15
2.4.1 Carbon Materials as Catalyst Support 16
2.4.2 Desirable Properties of a Catalyst Support 17
2.5 Functionalized Graphite as the Proposed Catalyst for
Esterification 18
2.5.1 Properties, Characteristics and Applications of
Graphite 18
2.5.2 Utilization of Graphite as Catalyst Support in Other
Studies 19
2.5.3 Advantages of Graphite in Other Conventional
Catalysts 21
2.6 Process Parameters that Affect Biodiesel Synthesis 22
2.6.1 Methanol-to-Oil Ratio 25
2.6.2 Reaction Temperature 25
2.6.3 Reaction Time 26
3 METHODOLOGY 27
3.1 Materials 27
3.1.1 Raw Materials 27
3.1.2 Chemicals 27
3.2 Preparation of Catalyst 28
3.2.1 Purification of Pristine Graphite 28

x
3.2.2 Sulfonation of by Polymerisation of Sulfuric Acid
and Acetic Anhydride 29
3.3 Esterification 29
3.4 FAME Analysis 30
3.5 Characterization Methods 30
3.5.1 X-Ray Diffraction (XRD) Analysis 30
3.5.2 Scanning Electron Microscopy (SEM) Spectroscopy
31
3.5.3 Fourier Transform-Infrared (FT-IR) Spectroscopy 31
4 RESULTS AND DISCUSSION 32
4.1 Characterization of Catalyst 32
4.1.1 XRD Analysis 32
4.1.2 SEM Spectroscopy 35
4.1.3 FT-IR Spectroscopy 38
4.2 Optimization of Biodiesel (Numerical Calculation) 39
4.2.1 Methanol-to-PFAD Ratio 39
4.2.2 Reaction Temperature 40
4.2.3 Catalyst Loading 42
4.3 Optimization of Biodiesel (Software Calculation) 43
4.3.1 Analysis of Test Models 44
4.3.2 ANOVA Analysis 46
4.3.3 DFFITS Analysis 47
4.3.4 Contour Plot and 3D Surface Model 47
5 CONCLUSION AND RECOMMENDATIONS 50
5.1 Conclusion and Recommendations 50
5.2 Recommendations 51
REFERENCES 52
APPENDICES 61

xi
LIST OF TABLES
TABLE TITLE PAGE
Table 1.1: Comparison on the main properties of diesel and
biodiesel (Atabani et al., 2012). 3
Table 2.1: Comparison of reaction conditions of a number of
biodiesel production catalysts (Shuit et al.,
2013). 23
Table 3.1: Lists of chemical reagents used. 27
Table 4.1: Basic data extracted from XRD 33
Table 4.2: Computed crystallite sizes for graphite catalysts 34
Table 4.3: Effect of the methanol-to-PFAD ratio on the
FAME yield 39
Table 4.4: Effect of the reaction temperature on the FAME
yield. 41
Table 4.5: Effect of the catalyst loading on the FAME yield. 42
Table 4.6: Biodiesel yield for different parameters. 43
xii
LIST OF FIGURES
FIGURE TITLE PAGE
Figure 1.1: Comparison of energy consumption in 2007 with
2035 (Atabani et al., 2012). 1
Figure 1.2: Transesterification reaction (Lam et al., 2010). 3
Figure 1.3: Total world biodiesel productions between 2000
and 2008 (Atabani et al., 2012). 4
Figure 2.1: General cost breakdown for biodiesel production
(Atabani et al., 2012). 10
Figure 2.2: Catalytic particles supported on porous and non-
porous supports (Islam et al., 2014). 17
Figure 2.3: Basic structural unit of disordered graphite
(Dimovski, 2006). 19
Figure 2.4: SEM images of the carbon supports and catalysts
(Özdemir, 2015). 20
Figure 4.1: XRD patterns for graphite of different
preparation conditions. 32
Figure 4.2: SEM images with magnification of 2.0k for (a)
original graphite, (b) purified graphite and (c)
sulfonated graphite catalyst. 35
Figure 4.3: SEM images with magnification of 10.0k for (a)
original graphite, (b) purified graphite and (c)
sulfonated graphite catalyst. 36
Figure 4.4: SEM images with magnification of 20.0k for (a)
original graphite, (b) purified graphite and (c)
sulfonated graphite catalyst. 37
Figure 4.5: FTIR spectra of original, purified and sulfonated
graphite. 38
xiii
Figure 4.6: The effect of methanol-to-PFAD ratio on the
biodiesel yield. 40
Figure 4.7: The effect of reaction temperature on the biodiesel
yield. 41
Figure 4.8: The effect of catalyst loading on the biodiesel yield.
42
Figure 4.9: Results of sequential model sum of squares test. 45
Figure 4.10: Results of lack of fit test. 45
Figure 4.11: ANOVA table. 46
Figure 4.12: Graph of DFFITS vs. Run 47
Figure 4.13: Contour plot. 48
Figure 4.14: 3D surface model. 49

xiv
LIST OF SYMBOLS / ABBREVIATIONS
n number of order
d lattice plane distance
Tm peak maximum temperature, K
wavelength, m
diffraction angle,
crystallite size, m
ASTM American Standards for Testing Materials
ATR attenuated total reflectance
BET Brunauer-Emmett-Teller
CaO calcium oxide
CH3OH methanol
CH3SO3H methanesulfonic acid
(CH3CO)2O acetic anhydride
CNT carbon nanotube
CO carbon monoxide
DW distilled water
EDX Energy Dispersive X-Ray
EN European Union
Et3N-CNT amino-functionalized carbon nanotube
FAME fatty acid methyl ester
FFA free fatty acid
FID flame ionization detector
FT-IR Fourier Transform-Infrared
FWHM full width at half maximum
GC gas chromatography

xv
HCl hydrochloric acid
HI hydrogen iodide
HNO3 nitric acid
H2SO4 sulfuric acid
ICP-MS inductively coupled plasma mass spectrometry
IEA International Energy Agency
JCPDS Joint Committee Powder Diffraction Standard
KOH potassium hydroxide
MWCNT multi-walled carbon nanotube
NaOH sodium hydroxide
PFAD palm fatty acid distillate
Pt platinum
PXRD powder X-ray diffraction
SEM Scanning Electron Microscope
SEM-EDX Scanning Electron Microscopy with Energy Dispersive X-Ray
TCD thermal conductivity detector
TGA Thermal Gravimetric Analysis
TEM Transmission Electron Microscope
TPD Temperature Programmed Desorption
XRD X-ray diffraction
ZnO zinc oxide

xvi
LIST OF APPENDICES
APPENDIX TITLE PAGE
APPENDIX A: Detailed Data and Graphs Generated by XRD 61
APPENDIX B: FTIR Spectra of Original, Purified and
Sulfonated Graphite Catalysts 62
APPENDIX C: Results of Gas Chromatography 63
APPENDIX D: MSDS of All Chemicals Used 64
1
CHAPTER 1
1 INTRODUCTION
1.1 Renewable Energy Sources
Energy and environment are two major concerns around the world. Extensive use of
natural gas, crude oil and coal has resulted in climate change and increasing prices
for energy (Rexhäuser and Löschel, 2015). According to Lam et al. (2010), there is a
serious need to look for more renewables to keep up with future demand and sustain
energy security worldwide. Having said that, the world is still heavily dependent on
fossil fuels with the expected share in global energy at about 75 % in 2035 (IEA,
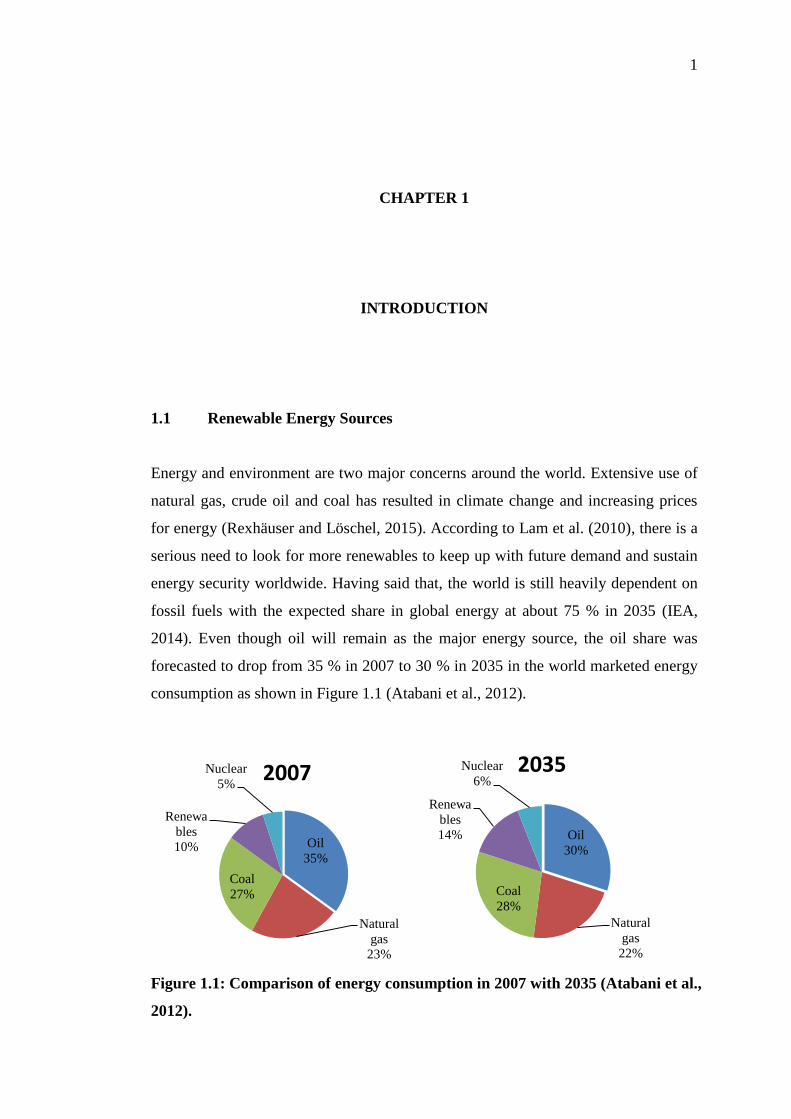
2014). Even though oil will remain as the major energy source, the oil share was
forecasted to drop from 35 % in 2007 to 30 % in 2035 in the world marketed energy
consumption as shown in Figure 1.1 (Atabani et al., 2012).
Figure 1.1: Comparison of energy consumption in 2007 with 2035 (Atabani et al.,
2012).
Oil
35%
Natural
gas
23%
Coal
27%
Renewa
bles
10%
Nuclear
5% 2007
Oil
30%
Natural
gas
22%
Coal
28%
Renewa
bles
14%
Nuclear
6% 2035

2
Renewable energy, in the past ten years, has been recognized to have the
potential to replace the conventional fossil fuels. Besides, renewable energy sources
have been utilized successfully to reduce the dependency of fossil fuels. According
to a study constructed from International Energy Agency (EIA), the energy source
with the highest potential among other renewable energies is the energy produced
from renewables and wastes (Lam et al., 2010).
Among the renewable energies, considerable focuses and attentions have
been given on biodiesel due to its high availability of inexhaustible feedstock. In
1893, peanut oil was used by Rudolf Diesel for his engine as transportation fuel for
the first time (Zabeti et al., 2009b). Biodiesel was then brought into South Africa to
power vehicles. Vegetable oils were already used as fuels during 1930s and 1940s. In
1982, an active discussion on these as fuels was held in an international conference
in Fargo, North Dakota (Ma and Hanna, 1999).
1.2 Background of Biodiesel
Biodiesel is a substitute diesel fuel derived from biological substances such as animal
fats and vegetable oils. Triglycerides, consisting of different fatty acid chains, are the
major constituents of these oils and fats. Different fatty acid chains will have
different physicochemical properties and their compositions will be of paramount
importance because they will affect the properties of the biodiesel produced (Lam et
al., 2010).
The direct use of oils and fats as fuels is restricted because of their high
kinematic viscosity and low volatility. In addition, they would cause serious
complications such as carbon deposition and ring sticking in the engine. Thus, they
must be subjected to transesterification to convert triglycerides into fatty acid methyl
ester (FAME) (Lam et al., 2010). According to ASTM D6751, a standard biodiesel
should have a minimum ester content of 96.4 % (Jakeria et al., 2014).
3
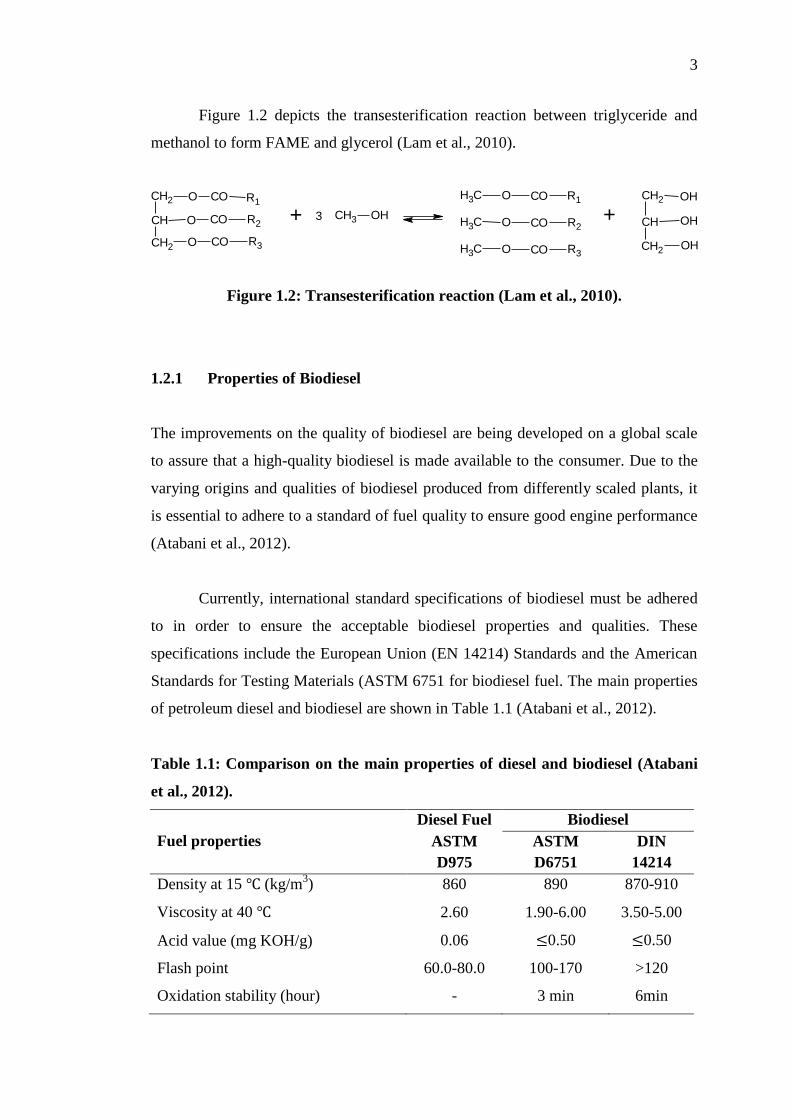
Figure 1.2 depicts the transesterification reaction between triglyceride and
methanol to form FAME and glycerol (Lam et al., 2010).
CH O CO
CH2 O CO
CH2 O CO
R1
R2
R3
+ 3 CH3 OH +CH3 O CO R1
CH3 O CO R2
CH3 O CO R3
CH2 OH
CH OH
CH2 OH
Figure 1.2: Transesterification reaction (Lam et al., 2010).
1.2.1 Properties of Biodiesel
The improvements on the quality of biodiesel are being developed on a global scale
to assure that a high-quality biodiesel is made available to the consumer. Due to the
varying origins and qualities of biodiesel produced from differently scaled plants, it
is essential to adhere to a standard of fuel quality to ensure good engine performance
(Atabani et al., 2012).
Currently, international standard specifications of biodiesel must be adhered
to in order to ensure the acceptable biodiesel properties and qualities. These
specifications include the European Union (EN 14214) Standards and the American
Standards for Testing Materials (ASTM 6751 for biodiesel fuel. The main properties
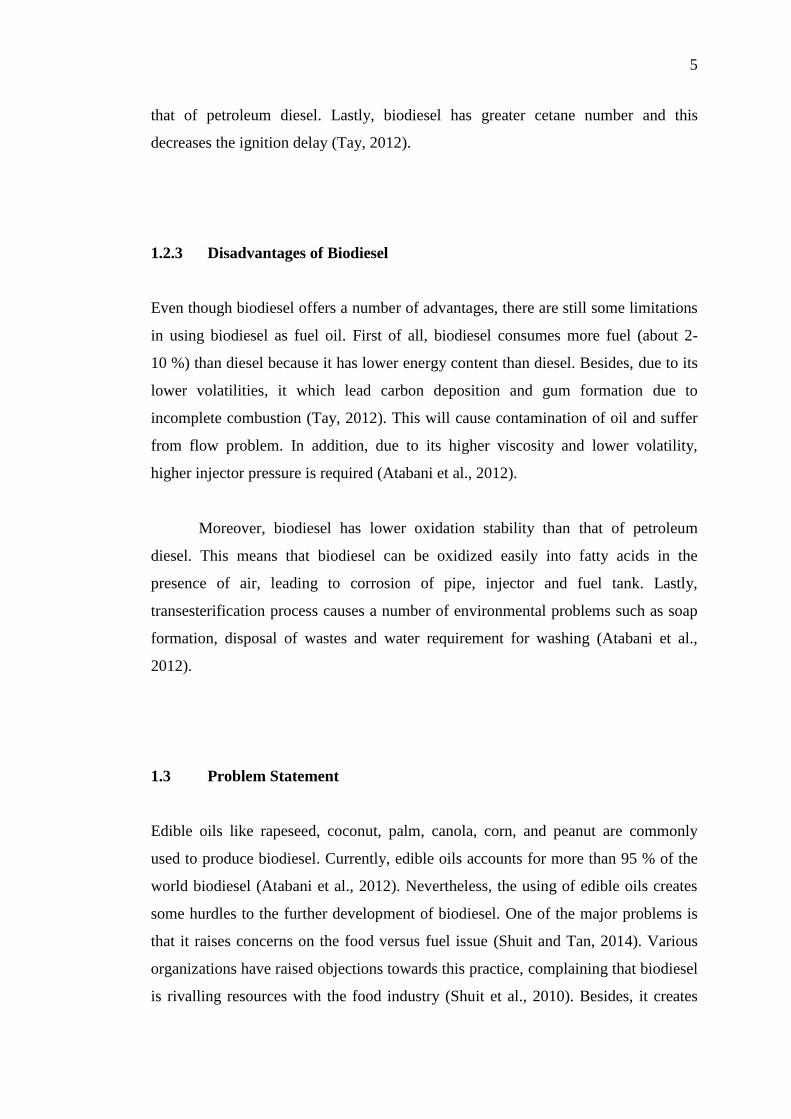
of petroleum diesel and biodiesel are shown in Table 1.1 (Atabani et al., 2012).
Table 1.1: Comparison on the main properties of diesel and biodiesel (Atabani
et al., 2012).
Fuel properties
Diesel Fuel Biodiesel
ASTM
D975
ASTM
D6751
DIN
14214
Density at 15 (kg/m3) 860 890 870-910
Viscosity at 40 2.60 1.90-6.00 3.50-5.00
Acid value (mg KOH/g) 0.06 0.50 0.50
Flash point 60.0-80.0 100-170 >120
Oxidation stability (hour) - 3 min 6min
4
1.2.2 Advantages of Biodiesel
One of the advantages of biodiesel is that it can reduce the carbon dioxide emissions
by 78 % compared to conventional diesel fuel while having high combustion
characteristics (Liaw, 2013). Since biodiesel is renewable, non-flammable, non-toxic,
readily available, biodegradable, portable, eco-friendly, sustainable, sulfur-free and
free from the hazardous aromatic compounds, it becomes an ideal choice of fuel for
heavily polluted cities. Moreover, biodiesel reduces the amount of particulate matter
in ambient air and thus, reducing air toxicity (Atabani et al., 2012). In addition,
biodiesel production is less time-consuming and can be raised easily since it does not
involve upstream processes such as drilling, transportation and refining as that of
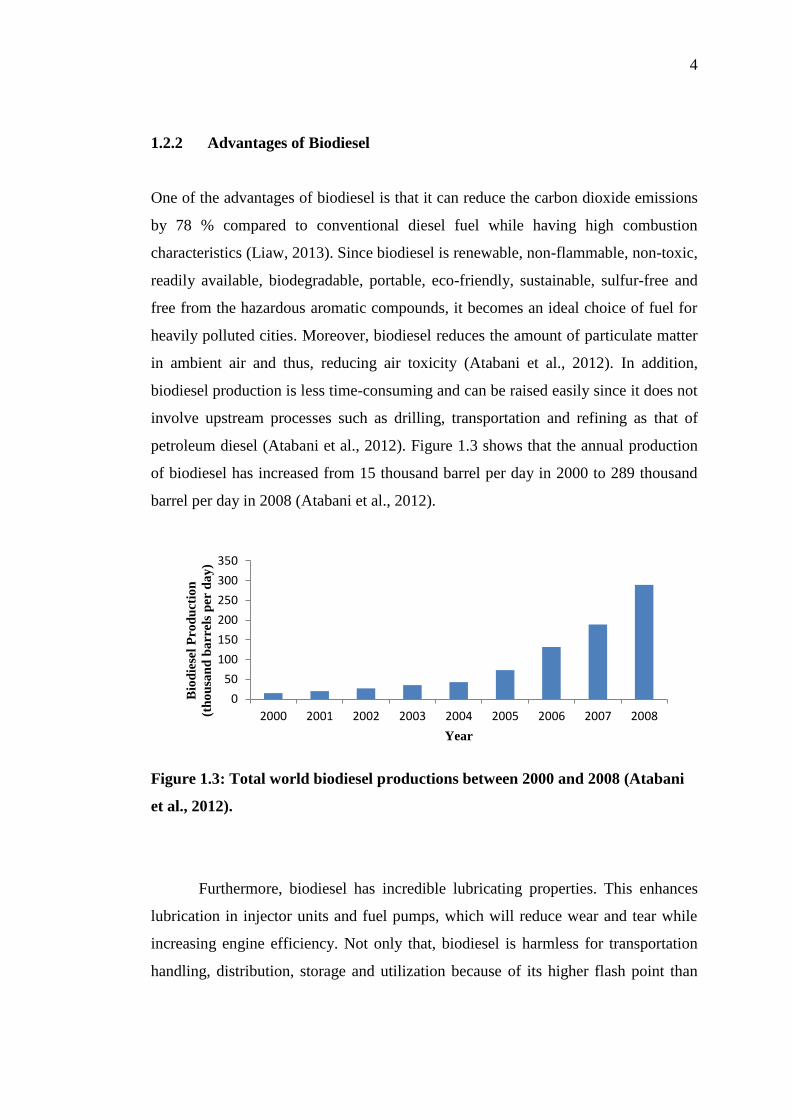
petroleum diesel (Atabani et al., 2012). Figure 1.3 shows that the annual production
of biodiesel has increased from 15 thousand barrel per day in 2000 to 289 thousand
barrel per day in 2008 (Atabani et al., 2012).
Figure 1.3: Total world biodiesel productions between 2000 and 2008 (Atabani
et al., 2012).
Furthermore, biodiesel has incredible lubricating properties. This enhances
lubrication in injector units and fuel pumps, which will reduce wear and tear while
increasing engine efficiency. Not only that, biodiesel is harmless for transportation
handling, distribution, storage and utilization because of its higher flash point than
0
50
100
150
200
250
300
350
2000 2001 2002 2003 2004 2005 2006 2007 2008
Bio
die
sel
Pro
du
cti
on
(th
ou
san
d b
arrels
per d
ay
)
Year
5
that of petroleum diesel. Lastly, biodiesel has greater cetane number and this
decreases the ignition delay (Tay, 2012).
1.2.3 Disadvantages of Biodiesel
Even though biodiesel offers a number of advantages, there are still some limitations
in using biodiesel as fuel oil. First of all, biodiesel consumes more fuel (about 2-
10 %) than diesel because it has lower energy content than diesel. Besides, due to its
lower volatilities, it which lead carbon deposition and gum formation due to
incomplete combustion (Tay, 2012). This will cause contamination of oil and suffer
from flow problem. In addition, due to its higher viscosity and lower volatility,
higher injector pressure is required (Atabani et al., 2012).
Moreover, biodiesel has lower oxidation stability than that of petroleum
diesel. This means that biodiesel can be oxidized easily into fatty acids in the
presence of air, leading to corrosion of pipe, injector and fuel tank. Lastly,
transesterification process causes a number of environmental problems such as soap
formation, disposal of wastes and water requirement for washing (Atabani et al.,
2012).
1.3 Problem Statement
Edible oils like rapeseed, coconut, palm, canola, corn, and peanut are commonly
used to produce biodiesel. Currently, edible oils accounts for more than 95 % of the
world biodiesel (Atabani et al., 2012). Nevertheless, the using of edible oils creates
some hurdles to the further development of biodiesel. One of the major problems is
that it raises concerns on the food versus fuel issue (Shuit and Tan, 2014). Various
organizations have raised objections towards this practice, complaining that biodiesel
is rivalling resources with the food industry (Shuit et al., 2010). Besides, it creates
6
many environmental implications such as deforestation, soil destruction and use of
many lands for agricultural purposes. In addition, the price of refined vegetable oils
is unstable and fluctuating. In the past years, the values of vegetable oil plants have
skyrocketed and this will affect the biodiesel industry in terms of economic viability.
Not only that, the using of edible oils to produce biodiesel is not practical in the long-
run due to the rising gap between supply and demand of those oils in many countries
(Atabani et al., 2012).
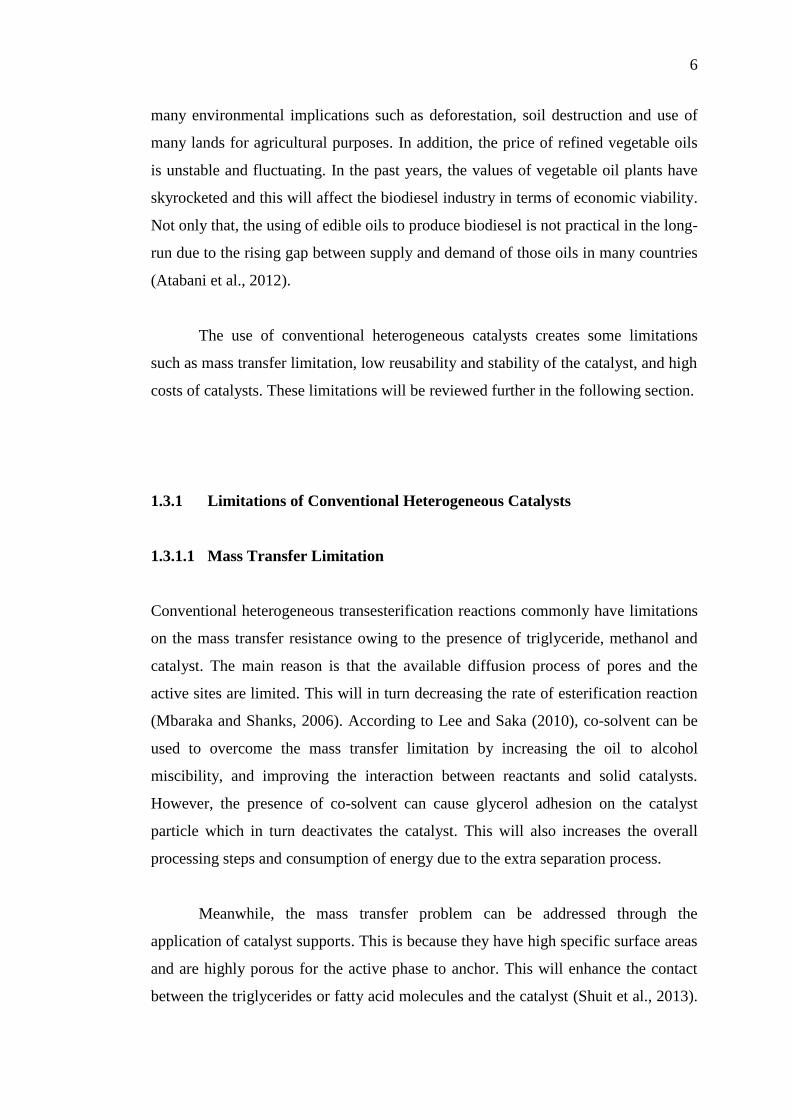
The use of conventional heterogeneous catalysts creates some limitations
such as mass transfer limitation, low reusability and stability of the catalyst, and high
costs of catalysts. These limitations will be reviewed further in the following section.
1.3.1 Limitations of Conventional Heterogeneous Catalysts
1.3.1.1 Mass Transfer Limitation
Conventional heterogeneous transesterification reactions commonly have limitations
on the mass transfer resistance owing to the presence of triglyceride, methanol and
catalyst. The main reason is that the available diffusion process of pores and the
active sites are limited. This will in turn decreasing the rate of esterification reaction
(Mbaraka and Shanks, 2006). According to Lee and Saka (2010), co-solvent can be
used to overcome the mass transfer limitation by increasing the oil to alcohol
miscibility, and improving the interaction between reactants and solid catalysts.
However, the presence of co-solvent can cause glycerol adhesion on the catalyst
particle which in turn deactivates the catalyst. This will also increases the overall
processing steps and consumption of energy due to the extra separation process.
Meanwhile, the mass transfer problem can be addressed through the
application of catalyst supports. This is because they have high specific surface areas
and are highly porous for the active phase to anchor. This will enhance the contact
between the triglycerides or fatty acid molecules and the catalyst (Shuit et al., 2013).

7
According to Zabeti et al. (2009a), it is reported that all supports with high thermal
and chemical stability can be utilized as catalyst supports. Examples of the most
common support materials used for either transesterification or esterification are
alumina, silica, activated carbon, zeolite, carbon nanotubes (CNT) and even graphite.
1.3.1.2 Low Reusability and Stability of the Catalyst
Low reusability and stability are two main concerns that have to be taken into
account when using heterogeneous catalyst for biodiesel production (Lee and Saka,
2010). According to Alonso et al. (2007), the main factors of catalysts deactivation
are deposition of organic substances on the catalyst surface and leaching of the active
species. Even though calcium oxide (CaO) is frequently used in producing biodiesel,
significant amount of CaO leached was detected during transesterification reaction
(Kouzu et al., 2009). It was stated by Kouzu et al. (2009) 10.5 wt% of CaO has
leached away during the first set of the transesterification, decreasing the yield of
biodiesel.
Apart from that, one more reason is the adsorption or deposition of organic
substances, particularly carbon onto the surface of catalyst (Shuit et al., 2013).
According to Ngamcharussrivichai et al. (2008), it was described that over 12 wt% of
organic substances was deposited on the CaO-ZnO catalyst used in transesterification
reaction of the palm kernel oil.
1.3.1.3 High Cost and Non-renewable Nature of Catalysts
Another major disadvantage of using conventional metal type heterogeneous
catalysts in biodiesel production is their high costs and non-renewable nature (Mo et
al., 2008). Compared to the homogeneous catalyst, most of the metal catalysts are
more expensive (Lee and Saka, 2010). Zong et al. (2007) reported that expensive
8
metal catalysts have given satisfying catalytic activity and stability during the
simultaneous esterification and transesterification of oils with high free fatty acid
(FFA) content. However, they have not been widely applied in the industry mainly
due to their rareness and costs.
1.4 Aims and Objectives
The objectives of the project are listed as follows:
I. To prepare graphite catalyst through sulfonation for the esterification reaction
of PFAD with methanol.
II. To study and optimize the effect of process parameters, namely reaction
temperature, methanol-to-PFAD ratio and catalyst loading in the
esterification of PFAD, using functionalized graphite catalyst.
III. To characterize the functionalized graphite catalyst.
1.5 Scope of Study
The scope of this research study was limited to the esterification reactions based on
different biodiesel synthesis technologies, various catalysts used for biodiesel
synthesis, background and preparation of the proposed catalyst, assessment on
different process parameters, and some characterization methods. Where necessary,
non-esterification related works, such as those relating to transesterification, are
reviewed as well so that the researcher and reader are more understand and familiar
with this study.
9
1.6 Outline of Thesis
Chapter 1 (Introduction) will mainly cover the brief background and review of the
biodiesel, problem statement, and objectives.
Chapter 2 (Literature Review) will mainly cover the PFAD as feedstock,
transesterification and esterification, catalysis in esterification, catalyst support, and
process parameters that affect the biodiesel synthesis.
Chapter 3 (Materials and Methods) will mainly cover the types of materials used,
catalyst preparation, esterification conditions, FAME analysis and different
characterization methods.
Chapter 4 (Results and Discussion) will mainly cover the determination and
discussion of the optimum conditions for biodiesel synthesis based on the process
parameters tested.
Chapter 5 (Conclusion and Recommendations) will mainly cover the general
conclusion established from this study and recommendations will be suggested.

10
CHAPTER 2
2 LITERATURE REVIEW
2.1 PFAD as Feedstock
There is a wide range of feedstocks available for the biodiesel production, ranging
from edible oils, non-edible oils, waste oils and animal fats. Figure 2.1 shows that the
feedstock alone represents 75 % of the overall production cost of biodiesel (Atabani
et al., 2012).
Figure 2.1: General cost breakdown for biodiesel production (Atabani et al.,
2012).
Oil feedstock
75%
Chemical
feedstock 12%
Depreciation 7%
Direct labour 3%
Energy
2%
General overhead
1%

11
Biodiesel is usually produced using refined edible oils such as soybean,
sunflower oil and so on. However, this practice causes the price of refined vegetable
oils to be fluctuating and eventually biodiesel production will not be economically
feasible (Shuit and Tan, 2014).
Therefore, non-edible oils such jojoba, rubber seed and PFAD are now
gaining attention because they seem to be a promising substitute for biodiesel
production. Among the non-edible oils, PFAD appear to be the most promising and
is the most suitable for Malaysia scenario (Shuit and Tan, 2015). This is because
PFAD is a low-value, non-food by-product generated in the fatty acid stripping and
deodorization stages during the refining of palm oil (Olutoye et al., 2014). Besides,
PFAD refinery costs is much cheaper (only 0.37 USD per litre) than that of other
refined vegetable oils (Yujaroen et al., 2009). In addition, the high miscibility of FFA
of PFAD in methanol reduces the mass transfer limitation instigated by immiscibility
between methanol and oil (Shuit and Tan, 2014). According to Chongkhong et al.
(2007), PFAD has high FFA content of about 93 wt%.
2.2 Transesterification and Esterification
Globally, sufficient amount of efforts are required to develop and improve the
production of biodiesel. Common limitations linked with the usage of crude
vegetable oils are their high viscosities, low relative volatilities and their
polyunsaturated characters. Hence, there are four common technologies used to
overcome these issues which are pyrolysis, dilution, micro-emulsion and
transesterification/ esterification (Atabani et al., 2012). Among the four methods,
transesterification/ esterification is the most popular and widely used method (Tay,
2012). Transesterification and esterification reactions are closely related to each
other since they are can be carried out separately or simultaneously in one-step or
two-step reaction, respectively (Atadashi et al., 2012).

12
2.2.1 Transesterification
Transesterification involves a series of consecutive and reversible reactions (Atabani
et al., 2012). First step is where the triglycerides is converted to diglycerides,
followed by the second step where diglycerides is converted to monoglycerides, and
finally the conversion of monoglycerides to glycerol (Shuit et al., 2013). One FAME
molecule will be produced from each individual steps (Abbaszaadeh et al., 2012).
The transesterification reaction of triglyceride is illustrated in the following
equations (Atabani et al., 2012).
(2.1)
(2.2)
(2.3)
Hence, the overall reaction is
(2.4)
The glycerol produced will sink to the bottom and the biodiesel which floats
on top will then be siphoned out. The common alcohols used are methanol and
ethanol due to their fairly low cost. Nevertheless, other alcohols such as propanol,
butanol, branched alcohol, isopropanol and so on can also be used but they are of
higher cost (Atabani et al., 2012).
For each transesterification reaction, three moles of alcohol will react with
one mole of vegetable oil to form three moles of FAME and a glycerol (Liaw, 2013).
Since alcohol is less soluble in either oil or fat, the use of a homogeneous catalyst is
commendable to commence the reaction. This is because the homogeneous catalyst
improves the miscibility of alcohol in the reaction mixture and thus, increasing the
rate of reaction (Atabani et al., 2012). The most common catalyst for
transesterification is homogeneous basic catalysts such as KOH and NaOH.

13
2.2.2 Esterification
Esterification is a chemical reaction between FFA and alcohol (usually methanol) to
form alkyl ester and water (Zhang et al., 2003). Esterification of FFA takes place
much more rapidly than transesterification of triglycerides. The reason for this is that
esterification is a one-step reaction while transesterification is a three-step
consecutive reaction (Warabi et al., 2004). The intermediate steps of removing the
fatty acid chains from the glycerine backbone are not present. Therefore, water is the
by-product and not glycerol (Altic, 2010).
(2.5)
The esterification reaction between fatty acid and methanol to form FAME
and water is depicted in the chemical equation above (Liaw, 2013). Acid catalyst is
generally used to catalyze the esterification reaction. This is because fatty acids will
react chemically with the basic catalysts such as NaOH and KOH to form soap by
saponification. According to Tyson (2005), the FFA mass concentrations above 4 %
will produce more soap in a conventional base-catalyzed reaction which will cause
incomplete reactions to take place. Besides, Islam et al. (2014) stated that the alkali
catalyzed reaction gives a lower biodiesel yield for low grade feedstocks with high
FFA content because the soap formation resulted serious emulsification and
separation problems. These studies clearly imply that the conventional method of
biodiesel synthesis using basic catalyst is ineffective for oils with high FFA content.
Thus, esterification would be a sounder option than transesterification for
non-edible oils with high content of FFA. Since PFAD contains high amount of FFA
(93 wt%), esterification is selected to be the reaction to produce biodiesel.
14
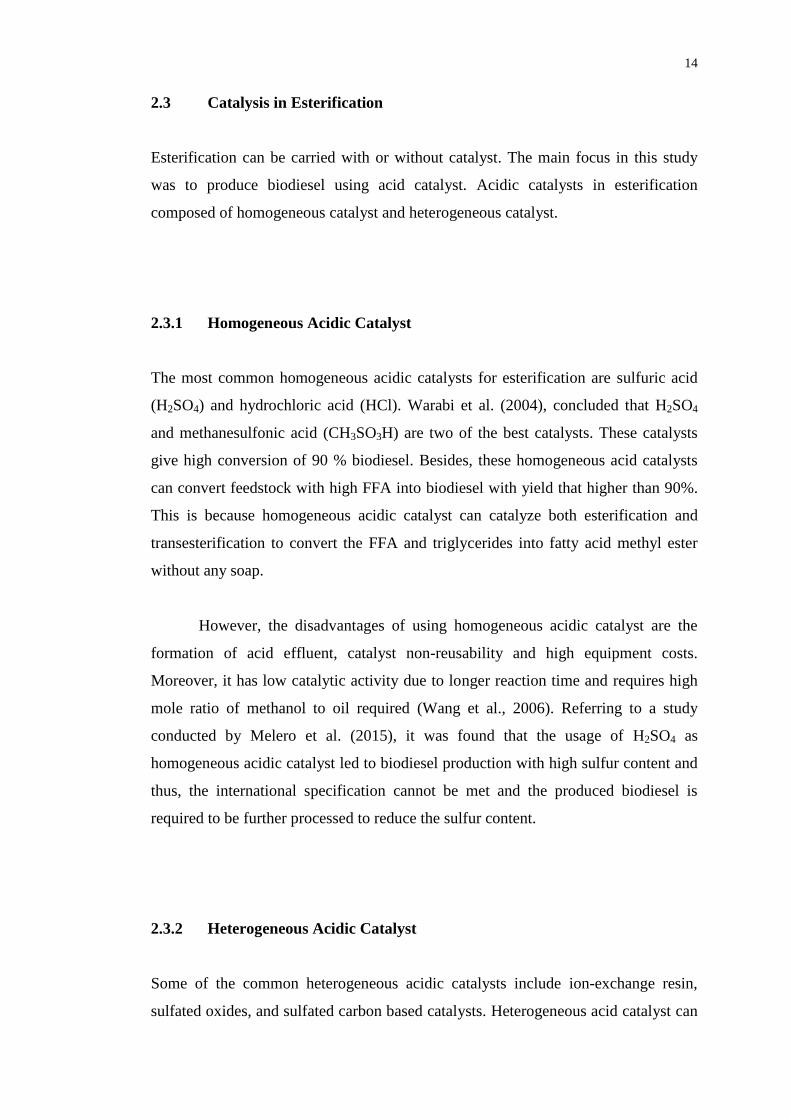
2.3 Catalysis in Esterification
Esterification can be carried with or without catalyst. The main focus in this study
was to produce biodiesel using acid catalyst. Acidic catalysts in esterification
composed of homogeneous catalyst and heterogeneous catalyst.
2.3.1 Homogeneous Acidic Catalyst
The most common homogeneous acidic catalysts for esterification are sulfuric acid
(H2SO4) and hydrochloric acid (HCl). Warabi et al. (2004), concluded that H2SO4
and methanesulfonic acid (CH3SO3H) are two of the best catalysts. These catalysts
give high conversion of 90 % biodiesel. Besides, these homogeneous acid catalysts
can convert feedstock with high FFA into biodiesel with yield that higher than 90%.
This is because homogeneous acidic catalyst can catalyze both esterification and
transesterification to convert the FFA and triglycerides into fatty acid methyl ester
without any soap.
However, the disadvantages of using homogeneous acidic catalyst are the
formation of acid effluent, catalyst non-reusability and high equipment costs.
Moreover, it has low catalytic activity due to longer reaction time and requires high
mole ratio of methanol to oil required (Wang et al., 2006). Referring to a study
conducted by Melero et al. (2015), it was found that the usage of H2SO4 as
homogeneous acidic catalyst led to biodiesel production with high sulfur content and
thus, the international specification cannot be met and the produced biodiesel is
required to be further processed to reduce the sulfur content.
2.3.2 Heterogeneous Acidic Catalyst
Some of the common heterogeneous acidic catalysts include ion-exchange resin,
sulfated oxides, and sulfated carbon based catalysts. Heterogeneous acid catalyst can

15
eliminate the problem of equipment corrosion and the treatment of water effluent
produced after the process by using homogeneous acidic catalyst (Shu et al., 2010).
Besides, heterogeneous acidic catalysts can be removed easily from the reaction
medium through filtration and the catalyst can be recycled and reused in the new
process. In short, it gives better separation with less catalyst lost (Melero et al., 2010).
Not only that, the usage of heterogeneous acid catalyst offers higher stability, which
means better tolerance for FFA without catalyst deactivation (López et al., 2005)
Although heterogeneous acid catalyst seems to offer quite a number of
advantages, it has its drawbacks as well. According to López et al. (2005),
heterogeneously catalyzed reaction has low catalytic activity. Some other groups of
author also stated that heterogeneous catalyzed reaction requires extreme reaction
conditions to increase the biodiesel yield and to cut down the reaction time
(Rattanaphra et al., 2012).
2.4 Catalyst Support
The mass transfer limitation can be considerably lowered through the use of a
catalyst support. The reason is that it provides higher external surface area (Pham
Huu et al., 1987). A catalyst support with presence of pores where active components
can be attached on provides higher surface area. For most of the solid catalyst, active
component and support are the two major components involved. A particular support
is chosen based on the reaction conditions and the nature of application. The support
properties are mainly affected by the preparation procedures and the quality of the
materials used (Islam et al., 2014).
Commonly, it is necessary for heterogeneous catalysts to be microporous or
mesoporous for easy separation from the fluid reactants and products. Due to their
nano-sized characteristics, agglomeration of heterogeneous catalysts is a common
phenomenon. Catalyst support provides high specific surface area for the strong
attachment of nano-sized heterogeneous catalysts and to reduce the agglomeration of
heterogeneous catalyst (Julkapli and Bagheri, 2015).
16
In addition, high dispersion of active site phase on the surface can be
achieved by using catalyst support. It is clear that the higher the surface area formed
by pores which can be accessed, the higher the dispersion of active catalyst
(DeCastro et al., 2000).
2.4.1 Carbon Materials as Catalyst Support
Nanomaterials made up of carbon have always been utilized as support medium
owing to its remarkable tensile strength, thermal stability, high surface area, and
recyclability. This is essential in keeping up with the sustainable chemistry protocol
(Wu et al., 2011). According to Wang et al. (2007), surface functionalization was
suggested to be one of the possible routes to improve the support properties of
carbon materials.
The key leading to noteworthy selectivity and cost reduction of catalyst is the
blend of nanocarbon materials and heterogeneous catalysis (Ioroi et al., 2006). The
activity and selectivity of a catalyst supported on carbon-based catalyst support
largely depends on the atomic structure of its active site (Shen et al., 2014).
Meanwhile, the active sites depend on the porosity of the catalyst support, varying in
size from nanometres to centimetres (Gong et al., 2014). Therefore, by distributing
the active sites microscopically, the availability of the active site in carbon-based
catalyst support can be enhanced (Chekin et al., 2013).
The physical and chemical properties of the support surface can be designed
to create a large specific surface area for large scattering of the active phase
(Mosaddegh and Hassankhani, 2014). Lastly, the presence of carbon support
materials can encourage some interactions between active phase and support which
further increase the catalyst stability and reusability (Jing et al., 2014).
17
2.4.2 Desirable Properties of a Catalyst Support
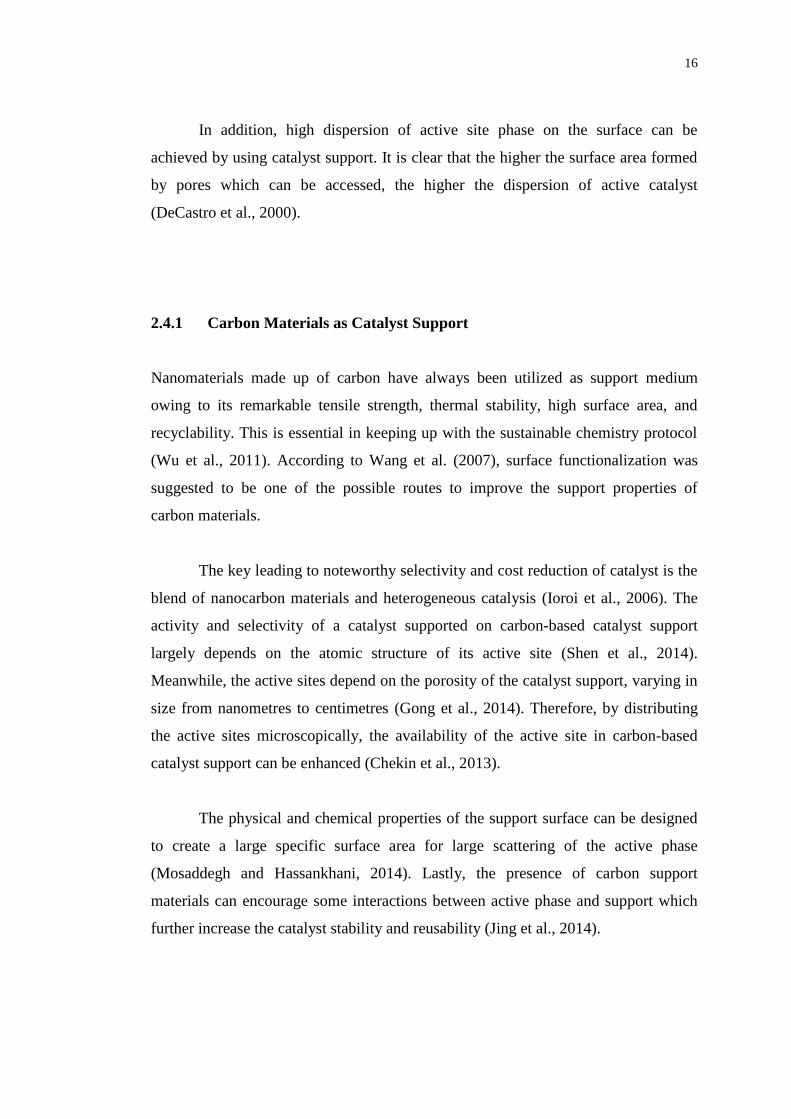
Figure 2.2 shows the deposition of catalyst on both porous and non-porous support. It
is obvious that the porous catalyst support offers a greater specific surface area which
leads to greater dispersion of the catalysts.
Figure 2.2: Catalytic particles supported on porous and non-porous supports
(Islam et al., 2014).
Much attention has been given in recent years on the modification of support
microstructure due to the unique properties (Borges and Díaz, 2012). Based on the
survey done on different studies, few vital properties of the catalyst support are listed
as follows:
Inertness. Catalyst support should not involve in the catalytic reaction which
may lead to undesirable side reactions (Perego and Villa, 1997).

18
Stability. Support materials involved in reaction and regeneration should
possess high chemical and thermal stability (Chuah et al., 2000).
Shape. The shape of support materials are preferred to be spherical to
minimize resistance caused by the collision with reactants and products
(Islam et al., 2013)
Porosity. The active components are usually dispersed on the surface of a
porous or non-porous support as shown in Figure 2-2 (Islam et al., 2014).
Size. The activity of the catalyst depends on the particle size. The smaller the
particle, the greater the specific surface area and thus, the higher the rate of
reaction (Kuila et al., 2014).
High surface area and desirable mechanical strength (Kuila et al., 2014).
Low cost (Islam et al., 2014).
2.5 Functionalized Graphite as the Proposed Catalyst for Esterification
The application of graphite as catalyst support in biodiesel production still remains
unexplored. Therefore, more studies are required to provide significant insights for
graphite-supported heterogeneous acidic catalysts.
2.5.1 Properties, Characteristics and Applications of Graphite
Graphite is a crystalline and highly ordered material composed of aromatic sheets
with a constant interlayer spacing of 0.335 nm. Graphite is generally non-porous and
has a low active surface area (10 m2/g). However, atoms and smaller molecules can
slip between layers, providing a confinement effect (d’Halluin et al., 2015).
Apart from that, graphite is chemically inert to acid and alkali under most
conditions. Besides, it also has high thermal stability up to 3200 under vacuum or
inert atmospheres. However, it oxidizes at about 400 . Unlike diamond, graphite is

19
an electrical conductor and it is usually used in electrodes. Moreover, graphite is also
applied as a structural material due to its remarkable strength to weight ratio and it is
of low cost (Dimovski, 2006). Figure 2.3 shows the basic structural unit of
disordered graphite (Dimovski, 2006).
Figure 2.3: Basic structural unit of disordered graphite (Dimovski, 2006).
In graphite, every carbon atom is bonded covalently to three other carbon
atoms with short (1.418 ) and strong (524 kJ/mole) sigma bonds in hexagonal
pattern. All the sigma bonds belong to a single plane, known as a basal plane. This
sp2
bonded carbon atoms is called a graphene layer when isolated. Graphene sheets
are formed from pure sp2 carbon while the three-dimensional (3D) bonding network
of sp3 carbon can only be found in diamond (Dimovski, 2006). When a planar
graphene sheet is folded as in fullerenes and carbon nanotubes, there is a partial loss
of sp2 hybridization and increase in the sp
3 character due to the change in bond
angles (Dimovski, 2006).
2.5.2 Utilization of Graphite as Catalyst Support in Other Studies
Figure 2.4 depicts the morphology of the graphite support (G) and cobalt boride
catalysts supported on the graphite support (Co-B/G). From the figure, it can be
observed that graphite is made up of planar sheets with different thickness. For the

20
graphite supported cobalt boride catalysts, the fibrous cobalt boride of different sizes
are deposited on the graphite support (Özdemir, 2015).
Figure 2.4: SEM images of the carbon supports and catalysts (Özdemir, 2015).
Özdemir (2015), evaluated the catalytic activity of cobalt boride catalysts
supported on graphitic and amorphous carbon derivatives, namely graphite and
glassy carbon. The goal of the study was to reveal the influence of catalyst
preparation route on NaBH4 hydrolysis rate for cobalt catalyst supported on graphite
and glassy carbon. The size of the graphite used was reported to be less than 20 m.
By using powder X-ray diffraction (PXRD), the peaks for graphite were centered at
26.54 and 54.63 scattering from the 002 and 004 planes of graphite. The results of
the study showed that Co-B/graphite enhanced the volume of hydrogen evolution.
Ramos-Sánchez and Balbuena (2014), studied on the adsorption of carbon
monoxide (CO) on platinum (Pt) clusters supported on graphite. The adsorption
energies were evaluated on different sites of Pt clusters supported on graphite. In the
study, the graphite was reported to have the capacity to accept electrons from the
deposited clusters and will exchange donate electrons when the Pt clusters absorbs
CO.
Wang et al. (2013), studied on the comparisons of Pt catalysts supported on
AC, carbon molecular sieve, CNTs and graphite for hydrogen iodide (HI)
decomposition at varying temperature. The catalytic performances on the HI
decomposition were assessed at a temperature range of 400 to 500 under

21
atmospheric pressure. The graphite supported catalyst showed good activity at higher
temperatures
d’Halluin et al. (2015), evaluated the preparation, characterization and
catalysis applications of graphite-supported ultra-small copper nanoparticles. The
ultra-small copper nanoparticles were reported to be well spread onto the graphite
support and yield very narrow distribution in size, which is in the range from 1.6 to
2.6 nm. This heterogeneous catalyst was successfully evaluated and the catalyst was
easily recovered by filtration, leaving the crude mixture virtually free of copper
residues, as evidenced by ICP-MS analyses.
2.5.3 Advantages of Graphite in Other Conventional Catalysts
The limitations of the conventional heterogeneous catalysts such as low stability,
mass transfer problem, high cost of catalyst and limited reusability can be improved
by using graphite as catalyst support. Functionalized graphite is deemed to have the
capability to be the ensuring catalyst for use in the production of biodiesel. As
mentioned previously, the intrinsic properties of graphite are highly crystallized,
highly ordered, chemically inert, high thermal stability, high strength to weight ratio,
and low cost. The advantages and desirable properties of in biodiesel synthesis will
be reviewed in the next session.
2.5.3.1 Excellent Catalyst Stability
Conventional catalysts are commonly prepared by precipitation methods. Carbon
materials, such as CNT can be tailored to be catalytically energetic through
functionalization with specific functional groups onto its surface (Balasubramanian
and Burghard, 2005). Besides, leaching of active sites was reported to have occurred
under liquid-phase reactions because they are not covalently bonded to the solid
catalyst support (Li et al., 2011). CNTs seem to be the perfect choice of support for
22
biodiesel production. The reason is that the active sites or functional groups are
covalently bonded to CNTs (Balasubramanian and Burghard, 2005). So, the leaching
of the active phase into the reaction mixture is less likely to occur because the strong
covalent bonds will not simply broken under reaction temperature (Salavati-Niasari
et al., 2008).
Since graphite and CNT are both comprised of a network of carbon atoms, it
is most likely that the graphite would act the same way and possess the same
properties as that of CNTs. Meanwhile, the covalent bonding offers good stability,
accessibility and selectivity. Hence, graphite would be an appropriate alternative to
overcome the low stability problem.
2.5.3.2 Low Catalyst Cost
As mentioned, one of the major hindrances in using metal catalysts for producing
biodiesel is their high catalyst cost. Even though the production cost for graphite is
still high at this moment because it is still in research stages, graphite has a huge
potential to be in mass scale production with lower production cost. Therefore,
replacing valuable metal catalysts with functionalized graphite as supporting
materials in esterification is more economically feasible since the cost for graphite is
low. Besides, unlike other precious metal, graphite is more renewable because it can
be regenerated by using methane (Özdemir, 2015).
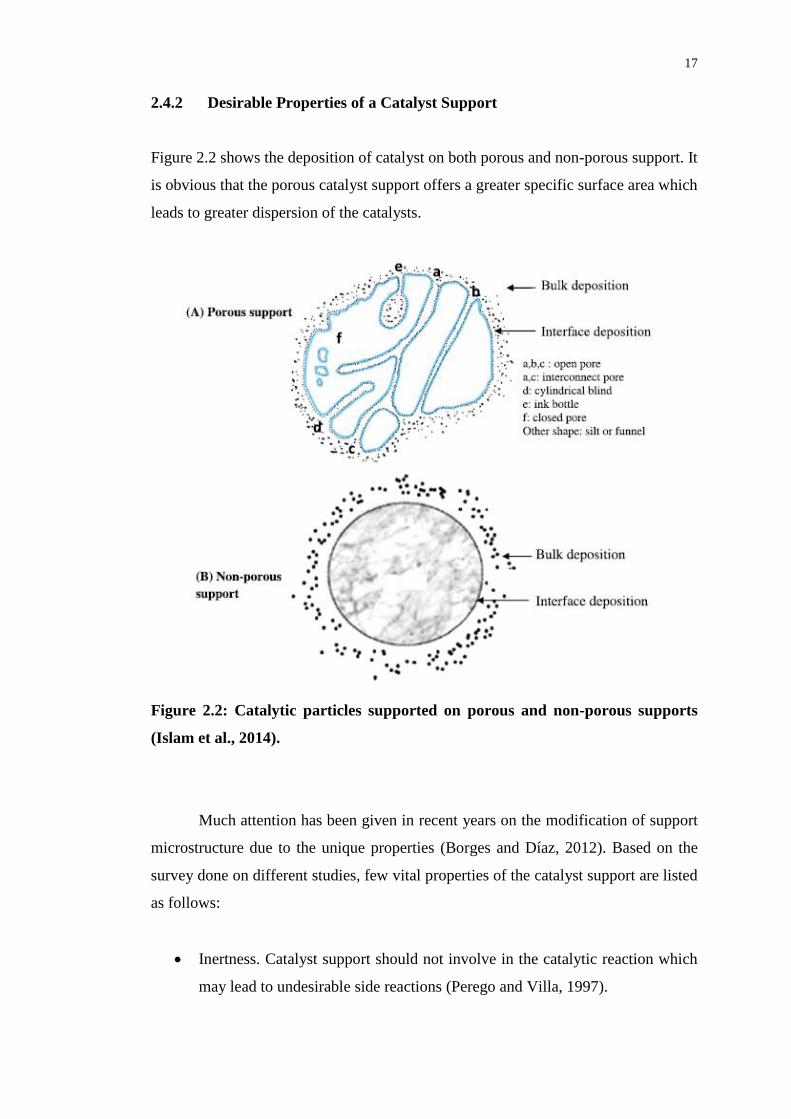
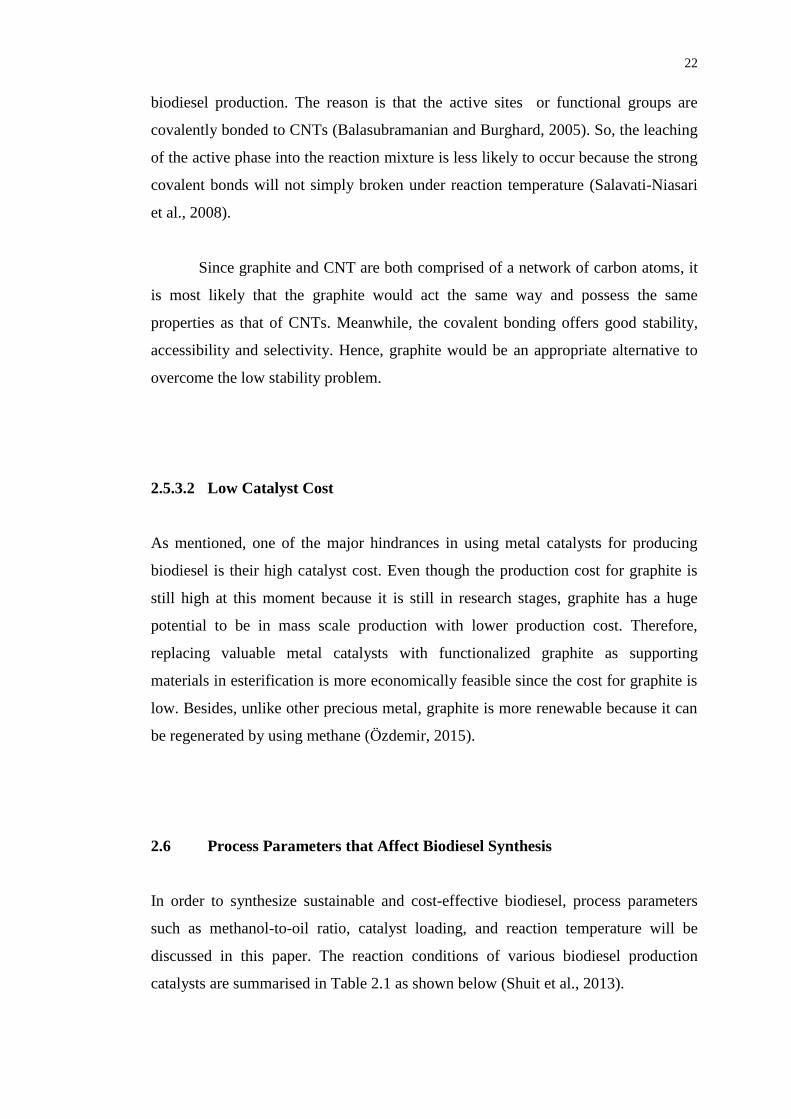
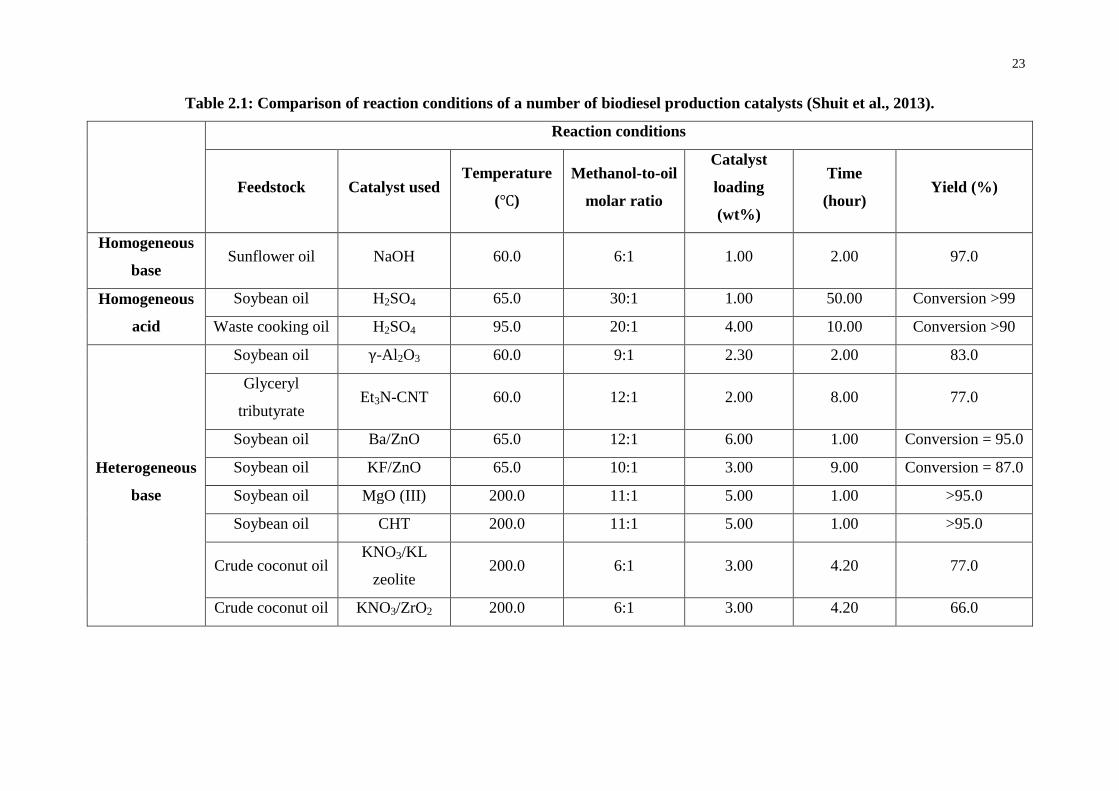
2.6 Process Parameters that Affect Biodiesel Synthesis
In order to synthesize sustainable and cost-effective biodiesel, process parameters
such as methanol-to-oil ratio, catalyst loading, and reaction temperature will be
discussed in this paper. The reaction conditions of various biodiesel production
catalysts are summarised in Table 2.1 as shown below (Shuit et al., 2013).
23
Table 2.1: Comparison of reaction conditions of a number of biodiesel production catalysts (Shuit et al., 2013).
Reaction conditions
Feedstock Catalyst used Temperature
( )
Methanol-to-oil
molar ratio
Catalyst
loading
(wt%)
Time
(hour) Yield (%)
Homogeneous
base Sunflower oil NaOH 60.0 6:1 1.00 2.00 97.0
Homogeneous
acid
Soybean oil H2SO4 65.0 30:1 1.00 50.00 Conversion >99
Waste cooking oil H2SO4 95.0 20:1 4.00 10.00 Conversion >90
Heterogeneous
base
Soybean oil -Al2O3 60.0 9:1 2.30 2.00 83.0
Glyceryl
tributyrate Et3N-CNT 60.0 12:1 2.00 8.00 77.0
Soybean oil Ba/ZnO 65.0 12:1 6.00 1.00 Conversion = 95.0
Soybean oil KF/ZnO 65.0 10:1 3.00 9.00 Conversion = 87.0
Soybean oil MgO (III) 200.0 11:1 5.00 1.00 >95.0
Soybean oil CHT 200.0 11:1 5.00 1.00 >95.0
Crude coconut oil KNO3/KL
zeolite 200.0 6:1 3.00 4.20 77.0
Crude coconut oil KNO3/ZrO2 200.0 6:1 3.00 4.20 66.0

24
Crude coconut oil ZnO 200.0 6:1 3.00 4.20 78.0
Heterogeneous
acid
Oleic acid HMFI (25)
zeolites 60.0 15:1 5.60 1.00 85.0
Oleic acid s-MWCNTs 135.0 6.4:1 0.20 1.50 Conversion = 96.0
Soybean oil VOP 150.0 27:1 6.50 1.00 80.0
Acidic sunflower
oil Fe-Zn-1 170.0 15:1 3.00 8.00 Conversion = 98.0
Crude coconut oil SO4/SnO2 200.0 6:1 3.00 4.20 81.0
Sesame oil 15 WZ-750 200.0 20:1 3.00 5.00 97.0
Soybean oil WZ 250.0 40:1a 6.70
a 4.00 Conversion >96.0
Cottonseed oil SO42-
/ZrO2 230.0 12:1 2.00 8.00 >90.0
Purified palm oil SO42-
/ZrO2 250.0 24:1 0.50 10 min Conversion = 90.0
Palm fatty acid SO42-
/ZrO2 250.0 6:1 0.50 1 min Conversion = 75.0
Soybean oil SZA 300.0 40:1a 6.70
a 4.00 80.0
a Self-estimation.

25
2.6.1 Methanol-to-Oil Ratio
Methanol-to-oil ratio is one of the essential process parameters in synthesizing
biodiesel. From the stoichiometric equation, transesterification reaction requires
three moles of methanol and one mole of triglyceride. In the meantime, only one
mole of methanol and one mole of fatty acid are required for esterification (Marchetti
et al., 2007). Since both are reversible reactions, excess methanol is required in order
to drive the reaction forward, enhancing the FAME formation (Shuit et al., 2012).
Villa et al. (2010a), investigated the transesterification catalyzed by Et3N-
CNT as catalyst using different molar ratio of methanol to glyceryl tributyrate (6:1,
12:1, 24:1, and 60:1). It was found that the higher the amount of methanol, the more
active the system is. For molar ratios of 24:1, and 60:1, complete conversion was
achieved in 4 hours and 2 hours, respectively. For molar ratios of 12:1, a conversion
of 77 % was achieved after 8 hours. In comparison, for molar ratios of 6:1,
deactivation of catalyst was observed.
During transesterification and esterification, protonation occurs at the
carboxyl group of the chemisorbed molecule, which will then be attacked by
methanol to form FAME. When there is a surplus of methanol, the attack of
methanol is enhanced, leading to higher yield of FAME. Nevertheless, when the
methanol to oil ratio to too high, the active sites of the catalyst will be flooded by the
surplus of methanol instead of oil (Shu et al., 2009). In addition, when the methanol-
to-oil ratio increases, the separation difficulty and complexity increases (de Boer and
Bahri, 2011).
2.6.2 Reaction Temperature
Villa et al. (2010a), studied the influence of reaction temperature on the catalytic
activity using amino-functionalized MWCNTs as catalyst for the transesterification
of glyceryl tributyrate with methanol. It was found that when the reaction
temperature is high, the conversion and rate of conversion increases. However, more

26
energy was required to maintain the reaction at high temperatures. Hence, a lower
temperature is more preferable. Unfortunately, too low a temperature would result in
lower conversion and longer reaction time. The other basic catalysts listed in Table
2.1 shows the similar results (Shuit et al., 2013).
2.6.3 Reaction Time
For the study carried out by Villa et al. (2010a), the reaction time for the
transesterification was significantly influenced by the temperature of the reaction and
methanol-to-oil ratio used. When reaction temperature and methanol-to-oil ratio
increase, there was an increase in catalytic activity and the reaction time was greatly
reduced. It was believed that there will be a reduction in reaction time as well when
the catalyst loading increasing. The reason for this is because there are more active
sites accessible for the reaction to take place.
Shuit et al. (2013), reported that the longer reaction times, the higher the
conversion or yield of biodiesel, up until the chemical equilibrium is accomplished,
regardless of the types of catalyst and the technologies used. When the methanol to
oil ratio and catalyst loading are fixed, the reaction time required to achieve complete
conversion is two hours when the temperature is augmented to 90 . When the
temperature is reduced to 75 , 6 h is required for 90 % conversion and so on.

27
CHAPTER 3
3 METHODOLOGY
3.1 Materials
3.1.1 Raw Materials
PFAD used in this thesis was provided by a local edible oil manufacturing company.
Graphite was bought from Shenzhen Nanotechnologies Port Co.
3.1.2 Chemicals
All the chemicals utilized in this project were listed in Table 3.1 with thorough
information of purity, name of suppliers and purpose of use.
Table 3.1: Lists of chemical reagents used.
Chemicals Purity (%) Supplier Purpose of use
Acetic anhydride
((CH3CO)2O) 99
Acros Organics,
Malaysia
Sulfonation of graphite and
as drying agent during
preparation of polymer
n-Hexane 99 Fischer Scientific,
Malaysia
Solvent for gas
chromatography (GC)
analysis

28
Methanol
(CH3OH) 99
Fischer Scientific,
Malaysia
Esterification reaction and
preparation of polymer
Methyl
heptadecanoate 99
Sigma-Aldrich,
Malaysia
Internal standard for GC
analysis
Sulfuric acid
(H2SO4) N/A
Fischer Scientific,
Malaysia Sulfonation of graphite
Nitric acid
(HNO3) N/A JT Baker, Malaysia Purification of graphite
Methyl linoleate 99 Fluka Chemie,
Germany
Internal standard for GC
analysis
3.2 Preparation of Catalyst
The purification and sulfonation of graphite in this study were performed parallel to
the method described by Peng et al. (2005) and Shuit and Tan (2015) as graphite has
nearly similar properties as carbon nanotubes. Due to limited references on the using
of sulfonated graphite as the acid solid catalyst, the operating conditions for
MWCNTs will be used as the reference in this study.
3.2.1 Purification of Pristine Graphite
Initially, a mixture of graphite (1 g) and HNO3 (100 ml) was ultrasonicated for 1 h
and followed by refluxing at 80 for 8 h. The treated graphite was then filtered and
washed by distilled water (DW) until the pH of the filtrate matched with the pH of
DW. The graphite was then dried at about 120 for 12 h to obtain graphite-COOH,
before being sulfonated.

29
3.2.2 Sulfonation of by Polymerisation of Sulfuric Acid and Acetic Anhydride
The sulfonation procedures and the amount of chemicals used are based on those
reported by Sun et al. (2009) and Ramulifho et al. (2012). In this process, 0.2 g of
graphite-COOH was added into a mixture containing (CH3CO)2O and 20 ml of
concentrated H2SO4. The mixture was then stirred and heated to 70 for 2 h. Next,
the mixture was cooled down to room temperature while stirring continuously. The
resultant products was then filtered was then and washed by using DW until the pH
of the filtrate matched with the pH of DW. It was then dried at 120 for 12 h. The
sulfonated graphite was denoted as s-graphite.
3.3 Esterification
The esterification of PFAD into FAME (biodiesel) was conducted in a three-round-
neck glass reactor furnished with a thermocouple and a magnetic stirrer. Before 10 g
of PFAD was added, a pre-determined amount of s-graphite was stirred in methanol
for 10 min to avoid the adsorption of PFAD to the active sites that would lead to
catalyst deactivation (Villa et al., 2010b). In this study, the molar ratios of methanol
to PFAD were 5, 17.5 and 30. The reaction temperature were set at 80, 125 and 170
. In addition, the catalyst loadings used were 1.0, 2.0 and 3.0 wt% (based on the
mass of PFAD). The reactants were stirred at 300 rpm to maintain a constant
temperature and uniform suspension. For each set of the parameters (methanol-to-
PFAD ratio, reaction temperature and catalyst loading), the reaction time for the
esterification was fixed to be 3 h. Reaction time was counted when the desired
reaction temperature was achieved and stable. Finally, the reaction mixture was
cooled to room temperature and filtered to separate s-graphite from the reaction
mixture. A rotary evaporator was used to remove the excess methanol.
30
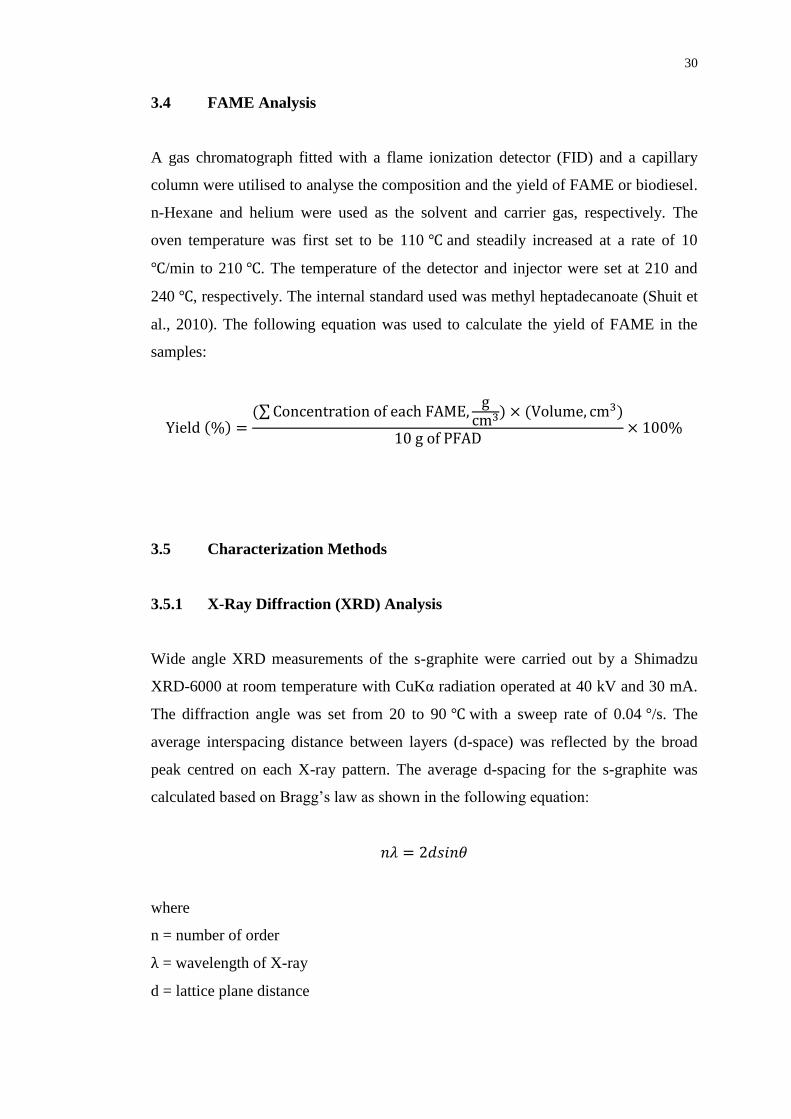
3.4 FAME Analysis
A gas chromatograph fitted with a flame ionization detector (FID) and a capillary
column were utilised to analyse the composition and the yield of FAME or biodiesel.
n-Hexane and helium were used as the solvent and carrier gas, respectively. The
oven temperature was first set to be 110 and steadily increased at a rate of 10
/min to 210 . The temperature of the detector and injector were set at 210 and
240 , respectively. The internal standard used was methyl heptadecanoate (Shuit et
al., 2010). The following equation was used to calculate the yield of FAME in the
samples:
( ) (∑
) ( )
3.5 Characterization Methods
3.5.1 X-Ray Diffraction (XRD) Analysis
Wide angle XRD measurements of the s-graphite were carried out by a Shimadzu
XRD-6000 at room temperature with CuKα radiation operated at 40 kV and 30 mA.
The diffraction angle was set from 20 to 90 with a sweep rate of 0.04 /s. The
average interspacing distance between layers (d-space) was reflected by the broad
peak centred on each X-ray pattern. The average d-spacing for the s-graphite was
calculated based on Bragg’s law as shown in the following equation:
where
n = number of order
= wavelength of X-ray
d = lattice plane distance

31
= diffraction angle
Besides, Debye-Scherrer equation is used to determine the size of the
crystallites. The equation is as shown below.
where
= crystallite size
= wavelength of X-ray
= full length at half maximum (line width)
= diffraction angle
3.5.2 Scanning Electron Microscopy (SEM) Spectroscopy
The surface and structure morphology of the s-graphite after the thermal treatment
were observed by using a Hitachi S-3400N.
3.5.3 Fourier Transform-Infrared (FT-IR) Spectroscopy
The presence of the sulfonic (SO3H) groups was validated by the FT-IR analysis
using a Shimadzu IRPrestige-21 over a frequency range of 4000-500 cm-1
. A blend
of s-graphite sample and potassium bromide was pelleted into a tiny pellet, and the
IR spectrum was collected after 32 scans. On the other hand, the structure of the s-
graphite was confirmed by using the attenuated total reflectance (ATR) mode.
32
CHAPTER 4
4 RESULTS AND DISCUSSION
4.1 Characterization of Catalyst
4.1.1 XRD Analysis
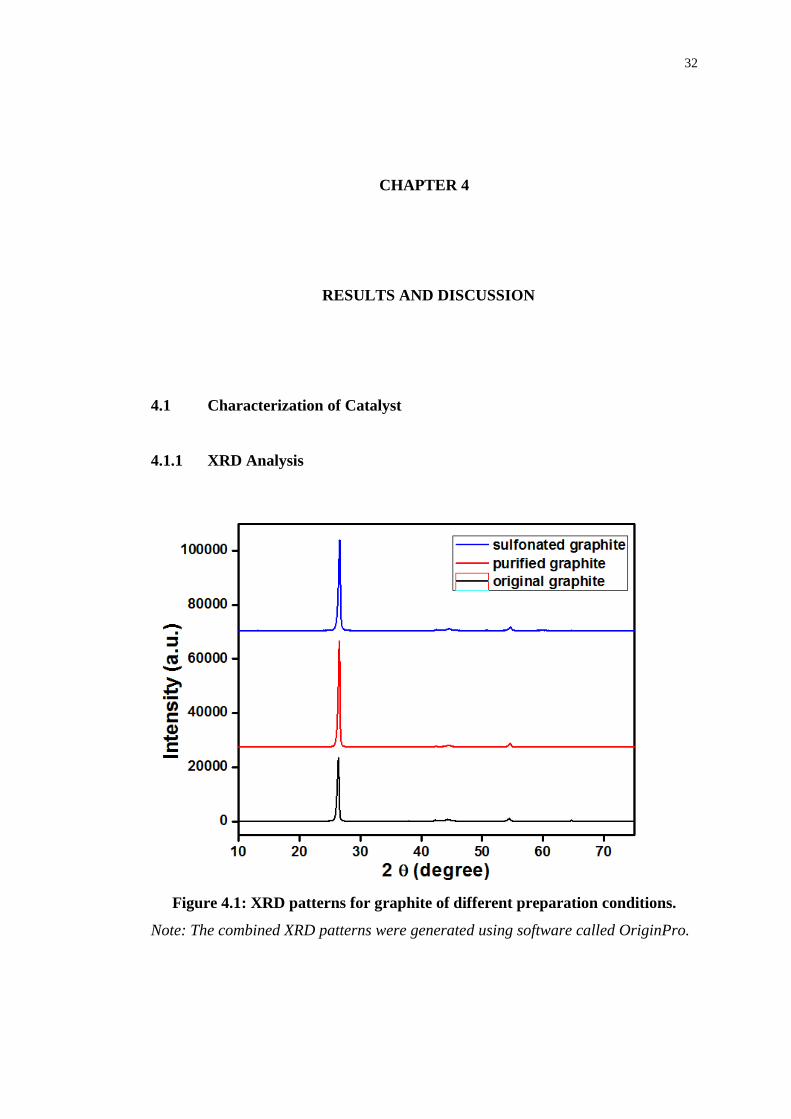
Figure 4.1: XRD patterns for graphite of different preparation conditions.
Note: The combined XRD patterns were generated using software called OriginPro.
33
The XRD patterns in Figure 4.1 show the characteristics reflection of the crystalline
structures of graphite catalyst under three different preparation conditions. The three
types of catalysts used consisted of original graphite, purified graphite by using nitric
acid, and sulfonated graphite by using a mixture of H2SO4 and (CH3CO)2O. All three
of the well-crystallized graphite catalysts give two main characteristic peaks. Liaw
(2013) proved that the peak around 20o were assigned to the graphitic [0 0 2] planes.
The development of the crystalline structure formation of the surface
morphology is influenced by the preparation conditions of catalysts. The original
graphite catalyst was expected to give larger crystallite sizes than both the purified
and sulfonated graphite catalysts. Meanwhile, the sulfonated graphite catalyst was
estimated to give smallest crystallite sizes due to its harsher preparation conditions
compared to the other two catalysts. Smaller crystallite sizes give better catalytic
activities because they are sharper for the sulfonic (-SO3H) groups to graft on them.
Moreover, larger crystallite sizes tend to take up more space than smaller crystallite
sizes and consequently, lowers down the number of actives sites available and
decreasing the biodiesel production.
From XRD data, the crystallite size of catalyst can be determined. The
detailed data and graphs generated by using XRD for all three types of catalysts will
be enclosed in Appendix A. Table 4.1 below shows the basic data extracted from
Appendix A for the purpose of calculation and discussion.
Table 4.1: Basic data extracted from XRD
Catalyst Peak 2 (deg) FWHM (deg) Integrated intensity
(counts)
Original 1 26.3464 0.41830 324763
2 54.3802 0.52900 17499
Purified 1 26.4928 0.36890 514488
2 54.5125 0.49170 26844
Sulfonated 1 26.5540 0.42540 480543
2 54.5716 0.54040 26603

34
From Table 4.1, it clearly shows that the integrated intensity for both purified
and sulfonated graphite catalysts are much higher than the original graphite catalyst.
This confirms the need and importance of catalyst preparation methods because
higher integrated intensity means higher amount of crystalline structures present.
Therefore, this will in turn increase the catalytic activity and biodiesel yield.
Unfortunately, the integrated intensity for sulfonated graphite was lesser than that of
purified graphite. The most probable reason for this phenomenon was due to the
sintering effect during refluxing or prolonged drying in an oven. Nevertheless, its
integrated intensity was much higher than the original graphite and not too low than
the purified graphite.
The size of crystallites was determined by using Debye-Scherrer equation.
Peak 1 of original graphite catalyst was taken as the sample calculation. The
wavelength, of X-rays is fixed at 1.54 Ǻ.
( ) (
)
The Table 4.2 shows the computed crystallite sizes for all peaks of the three catalysts.
It shows a trend where crystallite sizes of the catalysts decrease with harsher
preparation conditions. This shows that sulfonated graphite catalyst was better than
the other two catalysts since it offered greater catalytic activity.
Table 4.2: Computed crystallite sizes for graphite catalysts
Catalyst Crystallite size, (Ǻ)
Peak 1 Peak 2
Original 192.81 166.89
Purified 190.69 164.66
Sulfonated 189.67 163.51
35
4.1.2 SEM Spectroscopy
(a) Original graphite catalyst
(b) Purified graphite catalyst
(c) Sulfonated graphite catalyst
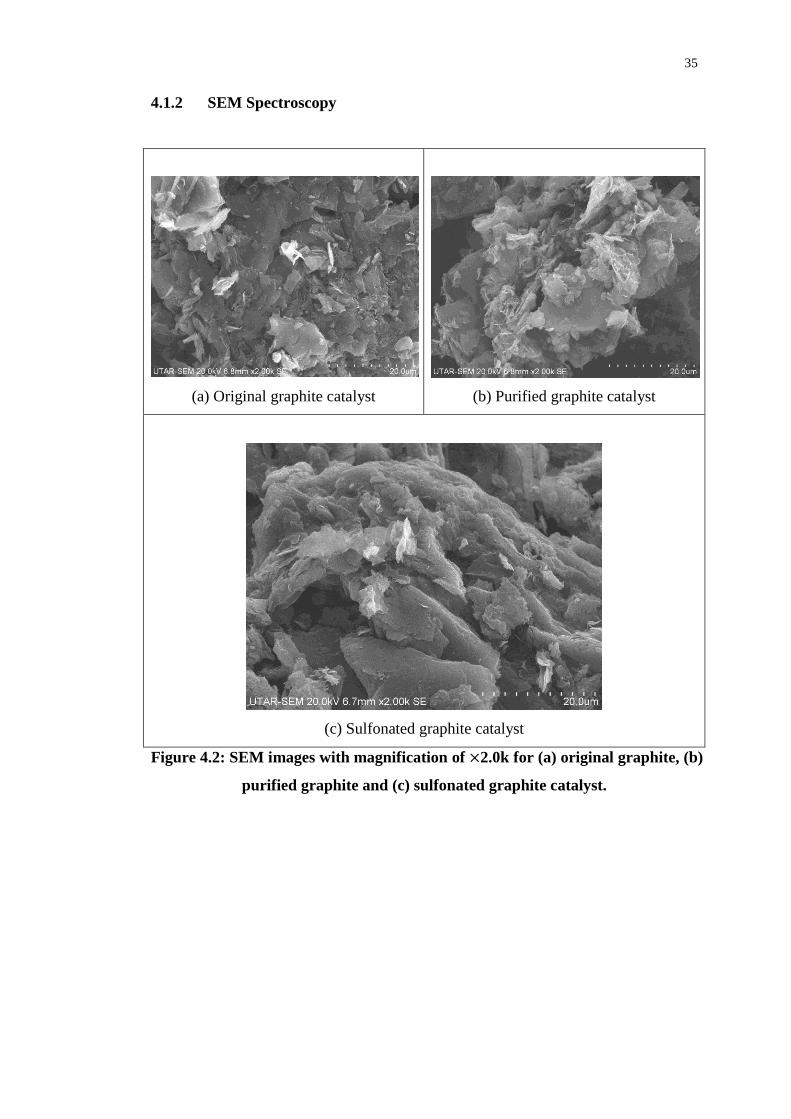
Figure 4.2: SEM images with magnification of 2.0k for (a) original graphite, (b)
purified graphite and (c) sulfonated graphite catalyst.
36
(a) Pristine graphite catalyst
(b) Purified graphite catalyst
(c) Sulfonated graphite catalyst
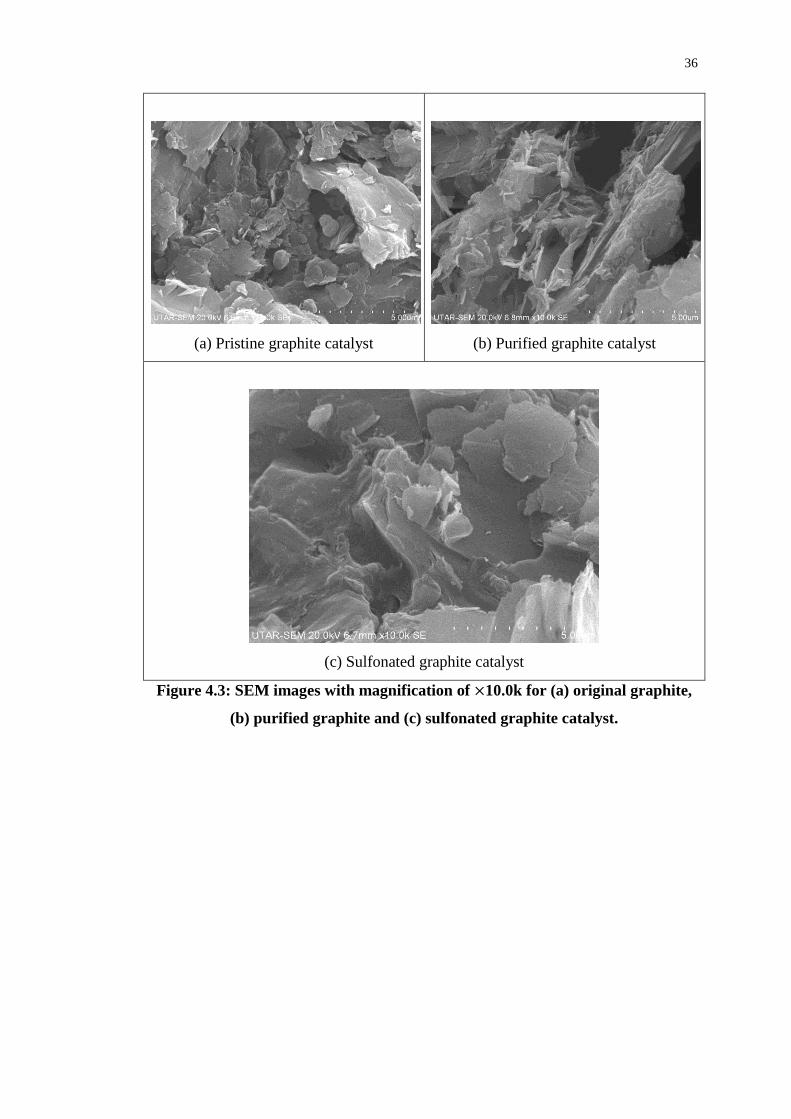
Figure 4.3: SEM images with magnification of 10.0k for (a) original graphite,
(b) purified graphite and (c) sulfonated graphite catalyst.
37
(a) Pristine graphite catalyst
(b) Purified graphite catalyst
(c) Sulfonated graphite catalyst
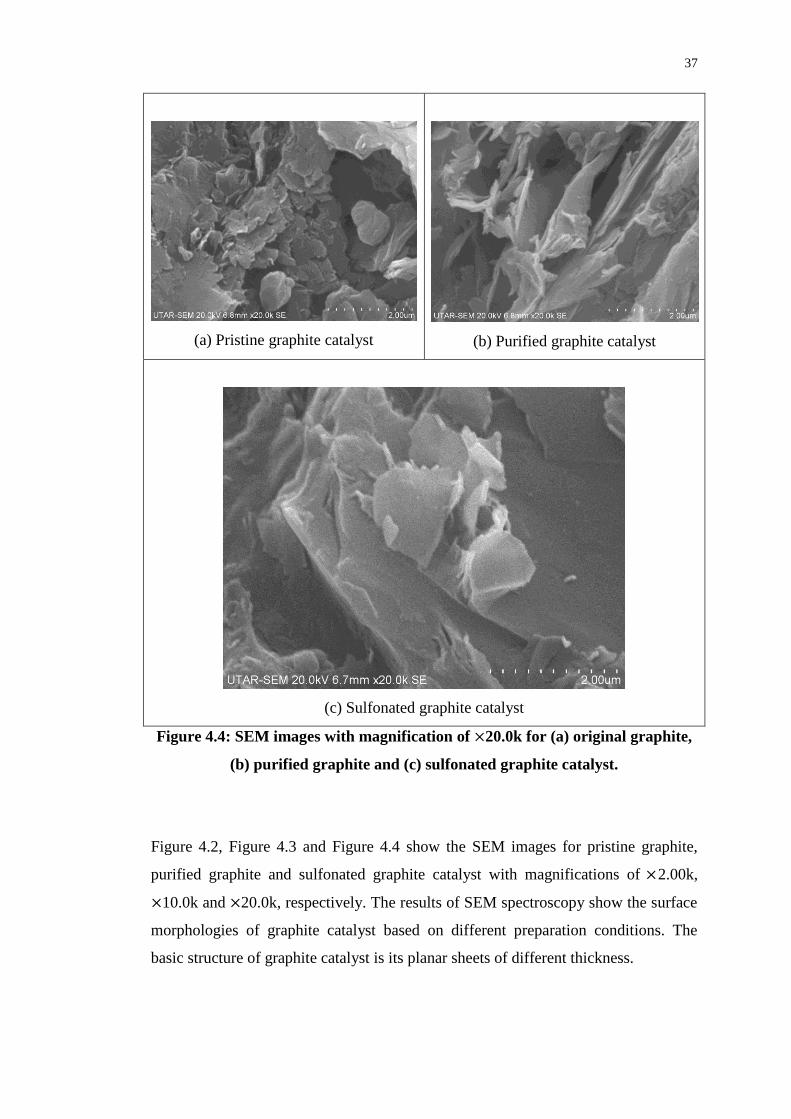
Figure 4.4: SEM images with magnification of 20.0k for (a) original graphite,
(b) purified graphite and (c) sulfonated graphite catalyst.
Figure 4.2, Figure 4.3 and Figure 4.4 show the SEM images for pristine graphite,
purified graphite and sulfonated graphite catalyst with magnifications of 2.00k,
10.0k and 20.0k, respectively. The results of SEM spectroscopy show the surface
morphologies of graphite catalyst based on different preparation conditions. The
basic structure of graphite catalyst is its planar sheets of different thickness.

38
From the SEM images of different magnifications, it can be observed that the
purified graphite catalyst has more cracks and defects than the pristine graphite
catalyst. Meanwhile, the sulfonated graphite catalyst has the highest amount of
cracks and defects than the other two catalysts. This is due to the harsher preparation
conditions of the graphite catalyst since it involved a two-step process consisting of
both purification and sulfonation. The cracks and defects present will become the
active sites of the catalyst for the sulfonic groups to anchor on and form chemical
bonds. Therefore, sulfonated graphite catalyst is a better catalyst than the others
because it has higher number of sulfonic groups to catalyze chemical reactions and
increase the biodiesel yield.
4.1.3 FT-IR Spectroscopy
Figure 4.5: FTIR spectra of original, purified and sulfonated graphite.
Note: The FTIR spectra were generated by using software called OriginPro and the
enlarged figure will be provided in Appendix B.

39
Figure 4.5 shows the IR spectra of original, purified and sulfonated graphite catalyst
in the range of 500-4000 cm-1
. The spectra show significant differences between all
three types of graphite catalyst. The peak at around 3750 cm-1
indicates the presence
of –OH groups (Lam et al., 2010). The formation of –OH groups on the catalyst is
very advantageous because it enhances the catalytic activities of the solid acid
catalysts (Shuit and Tan, 2014). The peak at about 1600 cm-1
and was assigned to the
aromatic-like C=C stretching mode in polyaromatic sketch (Liaw, 2013). The peaks
at 1234.09, 1094.87 and 649.53 cm-1
only appear in the spectra of sulfonated graphite
catalyst. The presence of sulfonate groups was indicated by the peak at 1234.09 cm-1
.
Furthermore, the absorption peak at 1094.87 cm-1
was attributed to the asymmetric
and symmetric O=S=O stretching vibrations, and the peak at 649.53 cm-1
indicated
the presence of S-O groups on the surface of the catalyst (Shuit and Tan, 2014). In a
conclusion, the FT-IR spectra showed the capability of introducing SO3H groups on
the surfaces of graphite catalyst through the chosen sulfonation method.
4.2 Optimization of Biodiesel (Numerical Calculation)
4.2.1 Methanol-to-PFAD Ratio
Table 4.3 shows the influence of different methanol-to-PFAD ratio on the FAME
yield at the fixed reaction temperature of 170 and a fixed catalyst loading of 3
wt%. The range methanol-to-PFAD ratio used in this study was between from 5.0 to
30.0.
Table 4.3: Effect of the methanol-to-PFAD ratio on the FAME yield
Ratio Yield (%)
5.0 23.24712
17.5 53.14844
30.0 95.0616
40
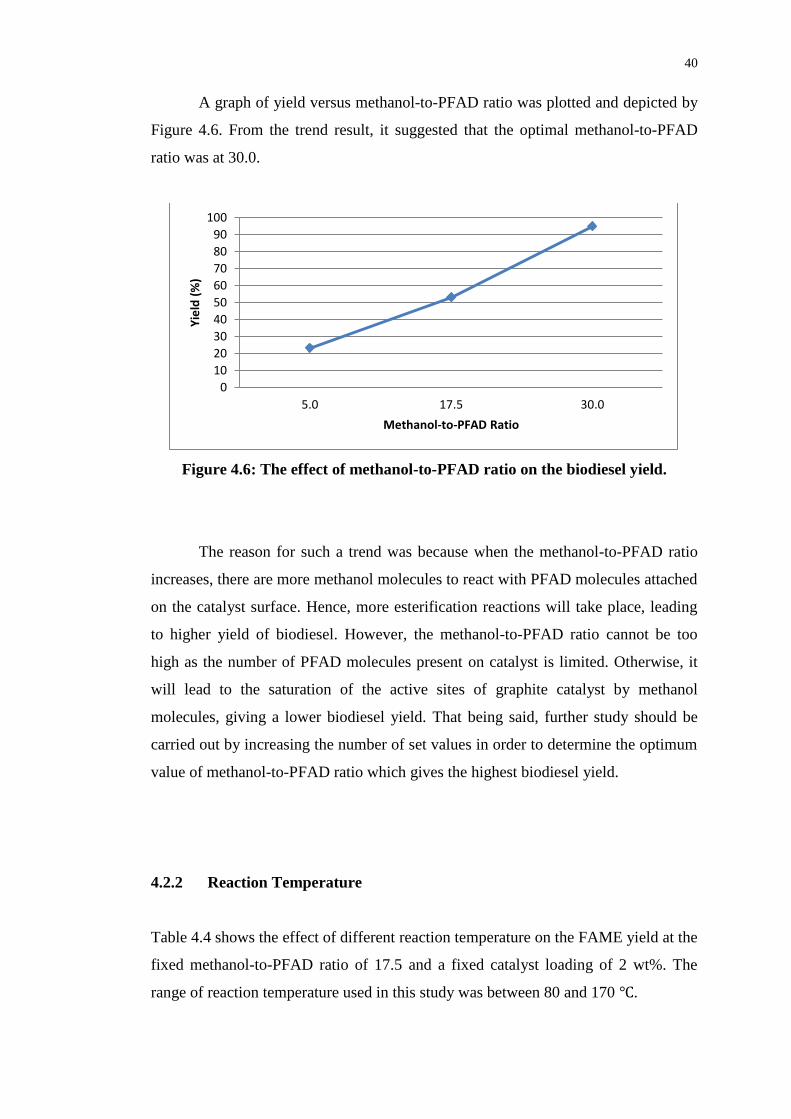
A graph of yield versus methanol-to-PFAD ratio was plotted and depicted by
Figure 4.6. From the trend result, it suggested that the optimal methanol-to-PFAD
ratio was at 30.0.
Figure 4.6: The effect of methanol-to-PFAD ratio on the biodiesel yield.
The reason for such a trend was because when the methanol-to-PFAD ratio
increases, there are more methanol molecules to react with PFAD molecules attached
on the catalyst surface. Hence, more esterification reactions will take place, leading
to higher yield of biodiesel. However, the methanol-to-PFAD ratio cannot be too
high as the number of PFAD molecules present on catalyst is limited. Otherwise, it
will lead to the saturation of the active sites of graphite catalyst by methanol
molecules, giving a lower biodiesel yield. That being said, further study should be
carried out by increasing the number of set values in order to determine the optimum
value of methanol-to-PFAD ratio which gives the highest biodiesel yield.
4.2.2 Reaction Temperature
Table 4.4 shows the effect of different reaction temperature on the FAME yield at the
fixed methanol-to-PFAD ratio of 17.5 and a fixed catalyst loading of 2 wt%. The
range of reaction temperature used in this study was between 80 and 170 .
0
10
20
30
40
50
60
70
80
90
100
5.0 17.5 30.0
Yie
ld (
%)
Methanol-to-PFAD Ratio

41
Table 4.4: Effect of the reaction temperature on the FAME yield.
Reaction Temperature ( ) Yield (%)
80 30.16244
125 31.54816
170 32.08473
A graph of yield versus reaction temperature was plotted and depicted by
Figure 4.7. From the trend result, it suggested that the optimal reaction temperature
was 170 .
Figure 4.7: The effect of reaction temperature on the biodiesel yield.
The reason for such a trend was because when reaction temperature increases,
the reacting molecules gain kinetic energy and react faster. The number and
frequency of effective collisions between methanol and PFAD will increase
significantly, giving rise to higher yield of biodiesel. However, the reaction
temperature cannot be too high because it will need higher heating requirement.
Hence, higher production cost is required and it will increase the risk of fire and
explosion from a safety point of view. That being said, further study should be
carried out by increasing the number of set values in order to determine the optimum
value of reaction temperature which gives the highest biodiesel yield.
29
29.5
30
30.5
31
31.5
32
32.5
80 125 170
Yie
ld (
%)
Reaction Temperature ( )
42
4.2.3 Catalyst Loading
Table 4.5 shows the effect of different catalyst loading on the FAME yield at the
fixed methanol-to-PFAD ratio of 17.5 and a fixed reaction temperature of 125 .
The catalyst loading was increased from 1 to 3 wt%.
Table 4.5: Effect of the catalyst loading on the FAME yield.
Catalyst Loading (wt%) Yield (%)
1.0 33.97525
2.0 35.14844
3.0 37.79040
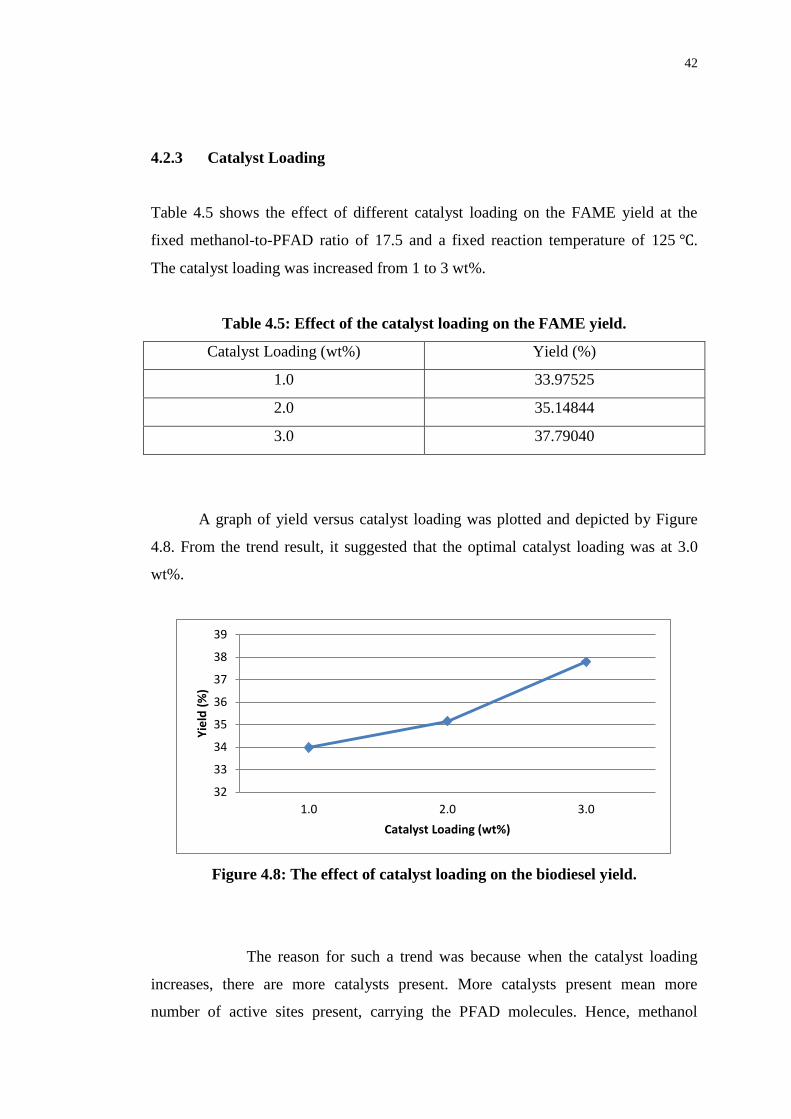
A graph of yield versus catalyst loading was plotted and depicted by Figure
4.8. From the trend result, it suggested that the optimal catalyst loading was at 3.0
wt%.
Figure 4.8: The effect of catalyst loading on the biodiesel yield.
The reason for such a trend was because when the catalyst loading
increases, there are more catalysts present. More catalysts present mean more
number of active sites present, carrying the PFAD molecules. Hence, methanol
32
33
34
35
36
37
38
39
1.0 2.0 3.0
Yie
ld (
%)
Catalyst Loading (wt%)

43
molecules can react easily and actively with the PFAD molecules, leading to higher
activity and biodiesel yield. However, the catalyst loading cannot be too high
because the number of methanol molecules present is limited for them to react with
PFAD molecules attached on the catalyst. When the catalyst loading is too high, the
reaction is said to be saturated by the catalyst, leading to lower yield of biodiesel.
That being said, further study should be carried out by increasing the number of set
values in order to determine the optimum value of reaction temperature which gives
the highest biodiesel yield.
4.3 Optimization of Biodiesel (Software Calculation)
Apart from the conventional manual calculation, a reliable analysis can also be done
by using software called DesignExpert8. This software design was based on the
response surface and central composite designs with three changing parameters
namely: methanol-to-PFAD ratio, reaction temperature and catalyst loading.
Meanwhile, the biodiesel yield was set to be the response. Table 4.6 shows the
results for the all of the experiment runs. At the first glance, it is obvious that run 20
was the outliers of these data. Thus, this may influence the subsequent analysis.
Table 4.6: Biodiesel yield for different parameters.
Run Temperature
(°C)
Catalyst Loading
(wt%)
Methanol-to-PFAD
Ratio Yield (%)
1 80.0 1.00 5.00 52.1407
2 80.0 1.00 30.0 14.46195
3 80.0 2.00 17.5 50.16244
4 80.0 3.00 5.00 9.067411
5 80.0 3.00 30.0 22.23472
6 125.0 1.00 17.5 33.97525
7 125.0 2.00 5.00 45.03471
8 125.0 2.00 17.5 27.60396

44
9 125.0 2.00 17.5 31.54816
10 125.0 2.00 17.5 35.14844
11 125.0 2.00 17.5 28.35939
12 125.0 2.00 17.5 34.8295
13 125.0 2.00 17.5 30.1926
14 125.0 2.00 30.0 36.06577
15 125.0 3.00 17.5 20.7904
16 170.0 1.00 5.00 12.57012
17 170.0 1.00 30.0 19.61645
18 170.0 2.00 17.5 32.08473
19 170.0 3.00 5.00 23.24712
20 170.0 3.00 30.0 95.0616
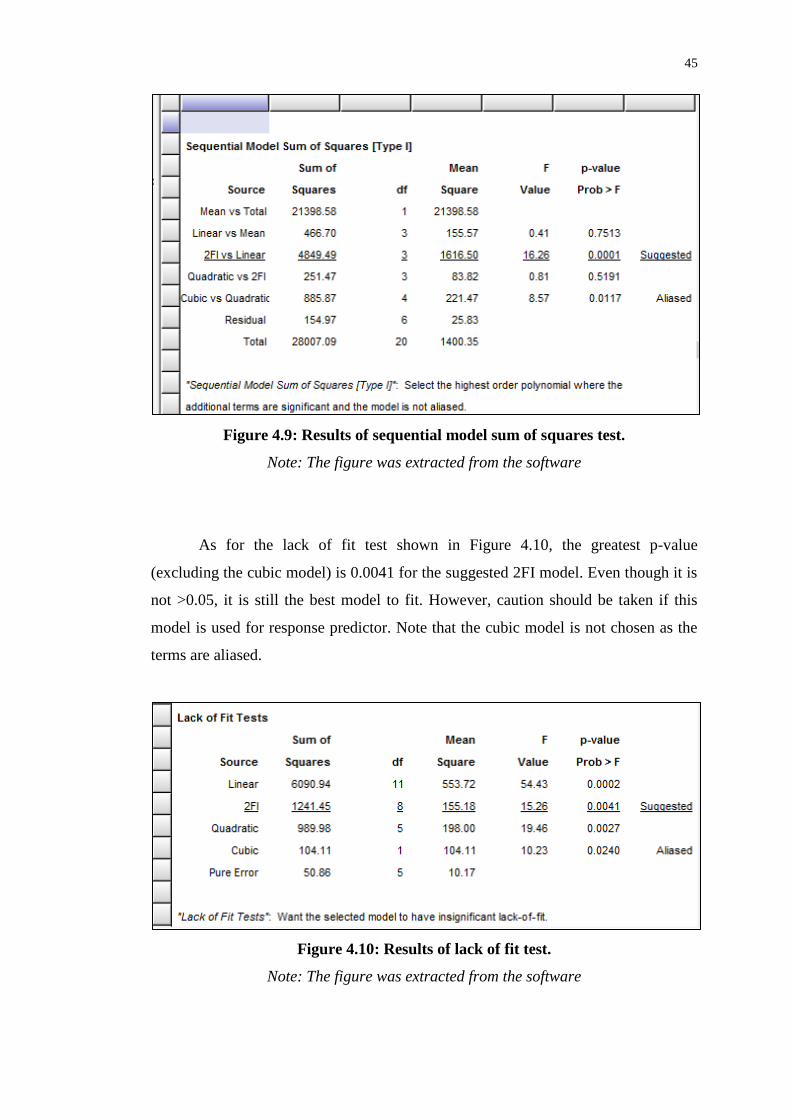
4.3.1 Analysis of Test Models
In order to select the best model for this design, the sequential sum of squares test
and the lack of fit test were utilized for analysis. The sequential sum of squares test
shows how terms of increasing complexity contribute to the total model. To select
the best model based on the sequential sum of squares, the probability should be less
than 0.05 (<0.05) while the probability for the lack of fit test should be more than
0.05 (>0.05). As shown in Figure 4.9, the p-value for the suggested 2FI (two-factor
interaction) vs. Linear is 0.0001 (<0.05), and it gives the best fit. 2FI vs Linear
means that the two-factor interaction is also considered in addition to the mean,
block and linear terms. Note that the Cubic vs. Quadratic model is not chosen as the
terms are aliased.
45
Figure 4.9: Results of sequential model sum of squares test.
Note: The figure was extracted from the software
As for the lack of fit test shown in Figure 4.10, the greatest p-value
(excluding the cubic model) is 0.0041 for the suggested 2FI model. Even though it is
not >0.05, it is still the best model to fit. However, caution should be taken if this
model is used for response predictor. Note that the cubic model is not chosen as the
terms are aliased.
Figure 4.10: Results of lack of fit test.
Note: The figure was extracted from the software

46
4.3.2 ANOVA Analysis
Figure 4.11 shows the ANOVA results of the design. Important and significant
figures to look out for are the p-values of both the model and the lack of fit. The p-
value of the model should be less than 0.05 (<0.05). Values outside more than 0.05
mean that the model terms are insignificant. In this case, the significant terms are AB,
AC and BC, indicating that the terms interact with each other for this design. The
ideal p-value of the lack of fit should be more than 0.05 (>0.05). From the results
shown, the p-value is 0.0014 (<0.05). This suggests that the data may not fit in the
model. This may be caused by some outliers in the data.
Figure 4.11: ANOVA table.
Note: The figure was extracted from the software

47
4.3.3 DFFITS Analysis
The DFFITS analysis can show how influential a point is in the model. From Figure
4.12, two points are out of the range (-2.00 – 2.00). These points correspond to the
outliers of the data (run 4 and run 6). The whole model may be heavily influenced by
these two points which may not give an accurate prediction.
Figure 4.12: Graph of DFFITS vs. Run
Note: The figure was extracted from the software
4.3.4 Contour Plot and 3D Surface Model
Figure 4.13 shows the contour plot while Figure 4.14 shows the 3D surface of the
model with reaction temperature and catalyst loading as the x-axes. The reference
point was methanol-to-PFAD ratio and was set at 17.5. From the contour plot and 3D
surface model, it was suggested that the yield of biodiesel is higher either from a
combination of low temperature and low catalyst loading or high temperature and
high catalyst loading are used. Since the two outliers involve Run 4 (80 , 3 wt%, 5)

48
and Run 6 (125 , 1 wt%, 17.5), the combination of low temperature and low
catalyst loading might not be the accurate depiction for high biodiesel yield.
Therefore, high temperature and high catalyst loading is more preferable since it
offers a more accurate analysis. This is tally with the manual calculation where the
optimal reaction temperature is 170 and the catalyst loading is 3 wt%.
Figure 4.13: Contour plot.
Note: The figure was extracted from the software

49
Figure 4.14: 3D surface model.
Note: The figure was extracted from the software

50
CHAPTER 5
5 CONCLUSION AND RECOMMENDATIONS
5.1 Conclusion and Recommendations
In this thesis, the esterification process of PFAD and methanol to form biodiesel was
successfully investigated using graphite as catalyst. Catalyst characterization
methods such as XRD, SEM and FTIR were completed on the graphite catalysts
based on different preparation conditions. The three types of catalyst investigated
were original, purified and sulfonated graphite catalysts. Besides that, GC was
carried to determine the yield of biodiesel for different process parameters such as
methanol-to-PFAD ratio, reaction temperature and catalyst loading. Three sets of
data were examined for each of the process parameters.
From the XRD Analysis, all three of the well-crystallized graphite catalysts
give two main characteristic peaks. The integrated intensity for both purified and
sulfonated graphite catalysts are much higher than the original graphite catalyst. This
confirms the need and importance of catalyst preparation methods because higher
integrated intensity means higher number of active sites present. The computed
crystallite sizes for all peaks of the three catalysts shows a trend where crystallite
sizes of the catalysts decrease with harsher preparation conditions. This shows that
sulfonated graphite catalyst was better than the other two catalysts since it offered
greater catalytic activity and biodiesel yield.
For SEM spectroscopy, it can be observed that the purified graphite catalyst
has more cracks and defects than the pristine graphite catalyst. Meanwhile, the

51
sulfonated graphite catalyst has the highest amount of cracks and defects than the
other two catalysts. Therefore, sulfonated graphite catalyst is a better catalyst than
the others because it has higher number of sulfonic groups to catalyze chemical
reactions and increase the biodiesel yield.
For FT-IR spectroscopy, the presence of sulfonate groups, O=S=O stretching
vibrations and S-O groups was only shown in the sulfonated graphite catalyst but not
the other two. It showed the capability of introducing SO3H groups on the surfaces of
graphite catalyst through the chosen sulfonation method.
For GC analysis, process parameters such as methanol-to-PFAD ratio,
reaction temperature and catalyst loading were selected to investigate their effect on
the biodiesel yield and to predict their optimal values. The optimal methanol-to-
PFAD ratio, reaction temperature and catalyst loading were 30.0, 170 and 3 wt%,
respectively. These results were tally with the one suggested by using software
DesignExpert8 where it was more preferable to have high temperature and high
catalyst loading since it offered a more accurate analysis.
5.2 Recommendations
Based on the analysis done in this study, functionalized graphite is very assuring and
believed to have the potential to be the ensuring catalyst for use in the production of
biodiesel. The limitations of the conventional heterogeneous catalysts such as low
stability, mass transfer problem, high cost of catalyst and limited reusability can be
improved by using graphite as catalyst support.
Moreover, the number of set values is recommended to be increased for each
of the process parameters. This is to confirm a more accurate and reliable results.
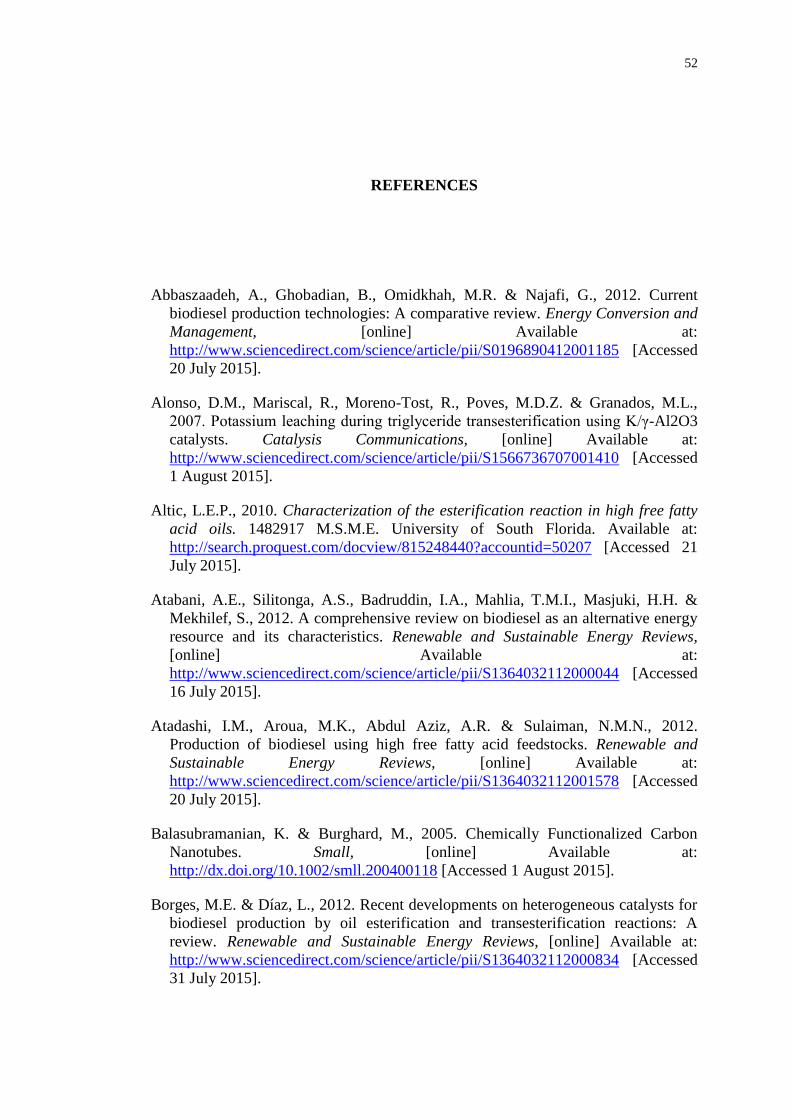
52
REFERENCES
Abbaszaadeh, A., Ghobadian, B., Omidkhah, M.R. & Najafi, G., 2012. Current
biodiesel production technologies: A comparative review. Energy Conversion and
Management, [online] Available at:
http://www.sciencedirect.com/science/article/pii/S0196890412001185 [Accessed
20 July 2015].
Alonso, D.M., Mariscal, R., Moreno-Tost, R., Poves, M.D.Z. & Granados, M.L.,
2007. Potassium leaching during triglyceride transesterification using K/γ-Al2O3
catalysts. Catalysis Communications, [online] Available at:
http://www.sciencedirect.com/science/article/pii/S1566736707001410 [Accessed
1 August 2015].
Altic, L.E.P., 2010. Characterization of the esterification reaction in high free fatty
acid oils. 1482917 M.S.M.E. University of South Florida. Available at:
http://search.proquest.com/docview/815248440?accountid=50207 [Accessed 21
July 2015].
Atabani, A.E., Silitonga, A.S., Badruddin, I.A., Mahlia, T.M.I., Masjuki, H.H. &
Mekhilef, S., 2012. A comprehensive review on biodiesel as an alternative energy
resource and its characteristics. Renewable and Sustainable Energy Reviews,
[online] Available at:
http://www.sciencedirect.com/science/article/pii/S1364032112000044 [Accessed
16 July 2015].
Atadashi, I.M., Aroua, M.K., Abdul Aziz, A.R. & Sulaiman, N.M.N., 2012.
Production of biodiesel using high free fatty acid feedstocks. Renewable and
Sustainable Energy Reviews, [online] Available at:
http://www.sciencedirect.com/science/article/pii/S1364032112001578 [Accessed
20 July 2015].
Balasubramanian, K. & Burghard, M., 2005. Chemically Functionalized Carbon
Nanotubes. Small, [online] Available at:
http://dx.doi.org/10.1002/smll.200400118 [Accessed 1 August 2015].
Borges, M.E. & Díaz, L., 2012. Recent developments on heterogeneous catalysts for
biodiesel production by oil esterification and transesterification reactions: A
review. Renewable and Sustainable Energy Reviews, [online] Available at:
http://www.sciencedirect.com/science/article/pii/S1364032112000834 [Accessed
31 July 2015].
53
Chekin, F., Bagheri, S. & Abd Hamid, S.B., 2013. Synthesis of Pt doped TiO2
nanoparticles: Characterization and application for electrocatalytic oxidation of l-
methionine. Sensors and Actuators B: Chemical, [online] Available at:
http://www.sciencedirect.com/science/article/pii/S0925400512013111 [Accessed
31 July 2015].
Chongkhong, S., Tongurai, C., Chetpattananondh, P. & Bunyakan, C., 2007.
Biodiesel production by esterification of palm fatty acid distillate. Biomass and
Bioenergy, [online] Available at:
http://www.sciencedirect.com/science/article/pii/S0961953407000554 [Accessed
22 July 2015].
Chuah, G.K., Jaenicke, S. & Xu, T.H., 2000. The effect of digestion on the surface
area and porosity of alumina. Microporous and Mesoporous Materials, [online]
Available at:
http://www.sciencedirect.com/science/article/pii/S1387181199002772 [Accessed
30 July 2015].
d’Halluin, M., Mabit, T., Fairley, N., Fernandez, V., Gawande, M.B., Le Grognec, E.
& Felpin, F.-X., 2015. Graphite-supported ultra-small copper nanoparticles –
Preparation, characterization and catalysis applications. Carbon, [online]
Available at:
http://www.sciencedirect.com/science/article/pii/S0008622315005321 [Accessed
1 August 2015].
de Boer, K. & Bahri, P.A., 2011. Supercritical methanol for fatty acid methyl ester
production: A review. Biomass and Bioenergy, [online] Available at:
http://www.sciencedirect.com/science/article/pii/S0961953410004307 [Accessed
2 August 2015].
DeCastro, C., Sauvage, E., Valkenberg, M.H. & Hölderich, W.F., 2000. Immobilised
Ionic Liquids as Lewis Acid Catalysts for the Alkylation of Aromatic Compounds
with Dodecene. Journal of Catalysis, [online] Available at:
http://www.sciencedirect.com/science/article/pii/S0021951700930045 [Accessed
30 July 2015].
Dimovski, S., 2006. Structure, characterization and exploration of synthesis of
conical and polyhedral crystals of graphite. 3202891 Ph.D. Drexel University.
Available at: http://search.proquest.com/docview/305324532?accountid=50207
[Accessed 31 July 2015].
Gong, J., Liu, J., Jiang, Z., Chen, X., Wen, X., Mijowska, E. & Tang, T., 2014.
Converting mixed plastics into mesoporous hollow carbon spheres with
controllable diameter. Applied Catalysis B: Environmental, [online] Available at:
http://www.sciencedirect.com/science/article/pii/S092633731400071X [Accessed
31 July 2015].
IEA, 2014. Market Energy Investment Outlook. France: Agency, I.E.
Ioroi, T., Akita, T., Yamazaki, S.-i., Siroma, Z., Fujiwara, N. & Yasuda, K., 2006.
Comparative study of carbon-supported Pt/Mo-oxide and PtRu for use as CO-

54
tolerant anode catalysts. Electrochimica Acta, [online] Available at:
http://www.sciencedirect.com/science/article/pii/S0013468606006268 [Accessed
30 July 2015].
Islam, A., Taufiq-Yap, Y.H., Chan, E.-S., Moniruzzaman, M., Islam, S. & Nabi,
M.N., 2014. Advances in solid-catalytic and non-catalytic technologies for
biodiesel production. Energy Conversion and Management, [online] Available at:
http://www.sciencedirect.com/science/article/pii/S0196890414003410 [Accessed
28 July 2015].
Islam, A., Taufiq-Yap, Y.H., Ravindra, P., Moniruzzaman, M. & Chan, E.-S., 2013.
Development of a procedure for spherical alginate–boehmite particle preparation.
Advanced Powder Technology, [online] Available at:
http://www.sciencedirect.com/science/article/pii/S0921883113000769 [Accessed
30 July 2015].
Jakeria, M.R., Fazal, M.A. & Haseeb, A.S.M.A., 2014. Influence of different factors
on the stability of biodiesel: A review. Renewable and Sustainable Energy
Reviews, [online] Available at:
http://www.sciencedirect.com/science/article/pii/S1364032113006837 [Accessed
15 July 2015].
Jing, S., Luo, L., Yin, S., Huang, F., Jia, Y., Wei, Y., Sun, Z. & Zhao, Y., 2014.
Tungsten nitride decorated carbon nanotubes hybrid as efficient catalyst supports
for oxygen reduction reaction. Applied Catalysis B: Environmental, [online]
Available at:
http://www.sciencedirect.com/science/article/pii/S0926337313006516 [Accessed
31 July 2015].
Julkapli, N.M. & Bagheri, S., 2015. Graphene supported heterogeneous catalysts: An
overview. International Journal of Hydrogen Energy, [online] Available at:
http://www.sciencedirect.com/science/article/pii/S0360319914030055 [Accessed
30 July 2015].
Kouzu, M., Yamanaka, S.-y., Hidaka, J.-s. & Tsunomori, M., 2009. Heterogeneous
catalysis of calcium oxide used for transesterification of soybean oil with
refluxing methanol. Applied Catalysis A: General, [online] Available at:
http://www.sciencedirect.com/science/article/pii/S0926860X08007540 [Accessed
1 August 2015].
Kuila, U., McCarty, D.K., Derkowski, A., Fischer, T.B., Topór, T. & Prasad, M.,
2014. Nano-scale texture and porosity of organic matter and clay minerals in
organic-rich mudrocks. Fuel, [online] Available at:
http://www.sciencedirect.com/science/article/pii/S0016236114006024 [Accessed
30 July 2015].
Lam, M.K., Lee, K.T. & Mohamed, A.R., 2010. Homogeneous, heterogeneous and
enzymatic catalysis for transesterification of high free fatty acid oil (waste
cooking oil) to biodiesel: a review. Biotechnol Adv, [online] Available at:
http://www.ncbi.nlm.nih.gov/pubmed/20362044 [Accessed 12 July 2015].
55
Lee, J.-S. & Saka, S., 2010. Biodiesel production by heterogeneous catalysts and
supercritical technologies. Bioresource Technology, [online] Available at:
http://www.sciencedirect.com/science/article/pii/S0960852410007571 [Accessed
1 August 2015].
Li, Y., Liu, J.H., Witham, C.A., Huang, W., Marcus, M.A., Fakra, S.C., Alayoglu, P.,
Zhu, Z., Thompson, C.M., Arjun, A., Lee, K., Gross, E., Toste, F.D. & Somorjai,
G.A., 2011. A Pt-cluster-based heterogeneous catalyst for homogeneous catalytic
reactions: X-ray absorption spectroscopy and reaction kinetic studies of their
activity and stability against leaching. J Am Chem Soc, [online] Available at:
http://www.ncbi.nlm.nih.gov/pubmed/21721543 [Accessed 1 August 2015].
Liaw, K.J., 2013. Biodiesel Synthesis via Solid acid Catalyst by Using Palm Fatty
Acid Distillate (PFAD) as Feedstock. Degree. Universiti Tunku Abdul Rahman.
Available at: http://eprints.utar.edu.my/id/eprint/894 [Accessed 16 July 2013].
López, D.E., Goodwin Jr, J.G., Bruce, D.A. & Lotero, E., 2005. Transesterification
of triacetin with methanol on solid acid and base catalysts. Applied Catalysis A:
General, [online] Available at:
http://www.sciencedirect.com/science/article/pii/S0926860X05006186 [Accessed
29 July 2015].
Ma, F. & Hanna, M.A., 1999. Biodiesel production: a review1. Bioresource
Technology, [online] Available at:
http://www.sciencedirect.com/science/article/pii/S0960852499000255 [Accessed
12 July 2015].
Marchetti, J.M., Miguel, V.U. & Errazu, A.F., 2007. Heterogeneous esterification of
oil with high amount of free fatty acids. Fuel, [online] Available at:
http://www.sciencedirect.com/science/article/pii/S0016236106003516 [Accessed
2 August 2015].
Mbaraka, I. & Shanks, B., 2006. Conversion of oils and fats using advanced
mesoporous heterogeneous catalysts. Journal of the American Oil Chemists'
Society, [online] Available at: http://dx.doi.org/10.1007/s11746-006-1179-x
[Accessed 1 August 2015].
Melero, J.A., Bautista, L.F., Morales, G., Iglesias, J. & Sánchez-Vázquez, R., 2010.
Biodiesel production from crude palm oil using sulfonic acid-modified
mesostructured catalysts. Chemical Engineering Journal, [online] Available at:
http://www.sciencedirect.com/science/article/pii/S1385894709008936 [Accessed
29 July 2015].
Melero, J.A., Bautista, L.F., Morales, G., Iglesias, J. & Sánchez-Vázquez, R., 2015.
Acid-catalyzed production of biodiesel over arenesulfonic SBA-15: Insights into
the role of water in the reaction network. Renewable Energy, [online] Available at:
http://www.sciencedirect.com/science/article/pii/S0960148114006545 [Accessed
29 July 2015].
Mo, X., López, D.E., Suwannakarn, K., Liu, Y., Lotero, E., Goodwin Jr, J.G. & Lu,
C., 2008. Activation and deactivation characteristics of sulfonated carbon

56
catalysts. Journal of Catalysis, [online] Available at:
http://www.sciencedirect.com/science/article/pii/S0021951708000171 [Accessed
1 August 2015].
Mosaddegh, E. & Hassankhani, A., 2014. Preparation and characterization of nano-
CaO based on eggshell waste: Novel and green catalytic approach to highly
efficient synthesis of pyrano[4,3-b]pyrans. Chinese Journal of Catalysis, [online]
Available at:
http://www.sciencedirect.com/science/article/pii/S1872206712607554 [Accessed
31 July 2015].
Ngamcharussrivichai, C., Totarat, P. & Bunyakiat, K., 2008. Ca and Zn mixed oxide
as a heterogeneous base catalyst for transesterification of palm kernel oil. Applied
Catalysis A: General, [online] Available at:
http://www.sciencedirect.com/science/article/pii/S0926860X08001129 [Accessed
1 August 2015].
Olutoye, M.A., Wong, C.P., Chin, L.H. & Hameed, B.H., 2014. Synthesis of FAME
from the methanolysis of palm fatty acid distillate using highly active solid oxide
acid catalyst. Fuel Processing Technology, [online] Available at:
http://www.sciencedirect.com/science/article/pii/S0378382014000745 [Accessed
20 July 2015].
Özdemir, E., 2015. Enhanced catalytic activity of Co–B/glassy carbon and Co–
B/graphite catalysts for hydrolysis of sodium borohydride. International Journal
of Hydrogen Energy, [online] Available at:
http://www.sciencedirect.com/science/article/pii/S0360319915015840 [Accessed
31 July 2015].
Peng, F., Zhang, L., Wang, H., Lv, P. & Yu, H., 2005. Sulfonated carbon nanotubes
as a strong protonic acid catalyst. Carbon, [online] Available at:
http://www.sciencedirect.com/science/article/pii/S0008622305002265 [Accessed
9 August 2015].
Perego, C. & Villa, P., 1997. Catalyst preparation methods. Catalysis Today, [online]
Available at:
http://www.sciencedirect.com/science/article/pii/S0920586196000557 [Accessed
30 July 2015].
Pham Huu, C., Palhares de Miranda, A.L., Navarro-Delmasure, C., Pham Huu Chanh,
A. & Moutier, R., 1987. Comparative study of the biosynthesis of PGE2, PGF2α
and TXA2 by different organs of genetically hypertensive (SHR) and obese-
hypertensive (SHR-fa/fa) rats. Prostaglandins, Leukotrienes and Medicine,
[online] Available at:
http://www.sciencedirect.com/science/article/pii/0262174687901491 [Accessed
30 August 2015].
Ramos-Sánchez, G. & Balbuena, P.B., 2014. CO adsorption on Pt clusters supported
on graphite. Journal of Electroanalytical Chemistry, [online] Available at:
http://www.sciencedirect.com/science/article/pii/S1572665713004323 [Accessed
31 July 2015].

57
Ramulifho, T., Ozoemena, K.I., Modibedi, R.M., Jafta, C.J. & Mathe, M.K., 2012.
Fast microwave-assisted solvothermal synthesis of metal nanoparticles (Pd, Ni, Sn)
supported on sulfonated MWCNTs: Pd-based bimetallic catalysts for ethanol
oxidation in alkaline medium. Electrochimica Acta, [online] Available at:
http://www.sciencedirect.com/science/article/pii/S0013468611016239 [Accessed
9 August 2015].
Rattanaphra, D., Harvey, A.P., Thanapimmetha, A. & Srinophakun, P., 2012.
Simultaneous transesterification and esterification for biodiesel production with
and without a sulphated zirconia catalyst. Fuel, [online] Available at:
http://www.sciencedirect.com/science/article/pii/S0016236112000567 [Accessed
29 July 2015].
Rexhäuser, S. & Löschel, A., 2015. Invention in energy technologies: Comparing
energy efficiency and renewable energy inventions at the firm level. Energy
Policy, [online] Available at:
http://www.sciencedirect.com/science/article/pii/S030142151500066X [Accessed
11 July 2015].
Salavati-Niasari, M., Mirsattari, S.N. & Bazarganipour, M., 2008. Synthesis,
characterization and catalytic oxyfunctionalization of cyclohexene with tert-
butylhydroperoxide over a manganese(II) complex covalently anchored to multi-
wall carbon nanotubes (MWNTs). Polyhedron, [online] Available at:
http://www.sciencedirect.com/science/article/pii/S0277538708004555 [Accessed
1 August 2015].
Shen, Y., Zhao, P., Shao, Q., Takahashi, F. & Yoshikawa, K., 2014. In situ catalytic
conversion of tar using rice husk char/ash supported nickel–iron catalysts for
biomass pyrolytic gasification combined with the mixing-simulation in fluidized-
bed gasifier. Applied Energy, [online] Available at:
http://www.sciencedirect.com/science/article/pii/S0306261914011246 [Accessed
31 July 2015].
Shu, Q., Gao, J., Nawaz, Z., Liao, Y., Wang, D. & Wang, J., 2010. Synthesis of
biodiesel from waste vegetable oil with large amounts of free fatty acids using a
carbon-based solid acid catalyst. Applied Energy, [online] Available at:
http://www.sciencedirect.com/science/article/pii/S0306261910000887 [Accessed
29 July 2015].
Shu, Q., Zhang, Q., Xu, G. & Wang, J., 2009. Preparation of biodiesel using s-
MWCNT catalysts and the coupling of reaction and separation. Food and
Bioproducts Processing, [online] Available at:
http://www.sciencedirect.com/science/article/pii/S0960308509000406 [Accessed
2 August 2015].
Shuit, S. & Tan, S., 2015. Biodiesel Production via Esterification of Palm Fatty Acid
Distillate Using Sulphonated Multi-walled Carbon Nanotubes as a Solid Acid
Catalyst: Process Study, Catalyst Reusability and Kinetic Study. BioEnergy
Research, [online] Available at: http://dx.doi.org/10.1007/s12155-014-9545-2
[Accessed 20 July 2015].

58
Shuit, S.H., Lee, K.T., Kamaruddin, A.H. & Yusup, S., 2010. Reactive extraction
and in situ esterification of Jatropha curcas L. seeds for the production of
biodiesel. Fuel, [online] Available at:
http://www.sciencedirect.com/science/article/pii/S001623610900341X [Accessed
9 August 2015].
Shuit, S.H., Ong, Y.T., Lee, K.T., Subhash, B. & Tan, S.H., 2012. Membrane
technology as a promising alternative in biodiesel production: A review.
Biotechnology Advances, [online] Available at:
http://www.sciencedirect.com/science/article/pii/S0734975012000468 [Accessed
2 August 2015].
Shuit, S.H. & Tan, S.H., 2014. Feasibility study of various sulphonation methods for
transforming carbon nanotubes into catalysts for the esterification of palm fatty
acid distillate. Energy Conversion and Management, [online] Available at:
http://www.sciencedirect.com/science/article/pii/S019689041400079X [Accessed
19 July 2015].
Shuit, S.H., Yee, K.F., Lee, K.T., Subhash, B. & Tan, S.H., 2013. Evolution towards
the utilisation of functionalised carbon nanotubes as a new generation catalyst
support in biodiesel production: an overview. RSC Advances, [online] Available at:
http://dx.doi.org/10.1039/C3RA22945A [Accessed 21 July 2015].
Sun, Z.-P., Zhang, X.-G., Liang, Y.-Y. & Li, H.-L., 2009. A facile approach towards
sulfonate functionalization of multi-walled carbon nanotubes as Pd catalyst
support for ethylene glycol electro-oxidation. Journal of Power Sources, [online]
Available at:
http://www.sciencedirect.com/science/article/pii/S0378775309001918 [Accessed
9 August 2015].
Tay, K.S., 2012. A Study of Enzymatic Reaction in Biodiesel Conversion Using Fresh
and Waste Cooking Oil. Degree. Universiti Tunku Abdul Rahman. Available at:
http://eprints.utar.edu.my/id/eprint/635 [Accessed 16 July 2015].
Tyson, K.S., 2005. DOE analysis of fuels and coproducts from lipids. Fuel
Processing Technology, [online] Available at:
http://www.sciencedirect.com/science/article/pii/S0378382004001948 [Accessed
27 July 2015].
Villa, A., Tessonnier, J.-P., Majoulet, O., Su, D.S. & Schlögl, R., 2010a.
Transesterification of Triglycerides Using Nitrogen-Functionalized Carbon
Nanotubes. ChemSusChem, [online] Available at:
http://dx.doi.org/10.1002/cssc.200900181 [Accessed 2 August 2015].
Villa, A., Tessonnier, J.P., Majoulet, O., Su, D.S. & Schlogl, R., 2010b.
Transesterification of triglycerides using nitrogen-functionalized carbon
nanotubes. ChemSusChem, [online] Available at:
http://www.ncbi.nlm.nih.gov/pubmed/19908273 [Accessed 9 August 2015].
Wang, L., Han, Q., Li, D., Wang, Z., Chen, J., Chen, S., Zhang, P., Liu, B., Wen, M.
& Xu, J., 2013. Comparisons of Pt catalysts supported on active carbon, carbon
59
molecular sieve, carbon nanotubes and graphite for HI decomposition at different
temperature. International Journal of Hydrogen Energy, [online] Available at:
http://www.sciencedirect.com/science/article/pii/S0360319912023403 [Accessed
31 July 2015].
Wang, Y., Ou, S., Liu, P., Xue, F. & Tang, S., 2006. Comparison of two different
processes to synthesize biodiesel by waste cooking oil. Journal of Molecular
Catalysis A: Chemical, [online] Available at:
http://www.sciencedirect.com/science/article/pii/S1381116906005772 [Accessed
29 July 2015].
Wang, Z.-B., Yin, G.-P. & Lin, Y.-G., 2007. Synthesis and characterization of
PtRuMo/C nanoparticle electrocatalyst for direct ethanol fuel cell. Journal of
Power Sources, [online] Available at:
http://www.sciencedirect.com/science/article/pii/S0378775307007458 [Accessed
30 July 2015].
Warabi, Y., Kusdiana, D. & Saka, S., 2004. Reactivity of triglycerides and fatty acids
of rapeseed oil in supercritical alcohols. Bioresource Technology, [online]
Available at:
http://www.sciencedirect.com/science/article/pii/S0960852403002025 [Accessed
29 July 2015].
Wu, B., Kuang, Y., Zhang, X. & Chen, J., 2011. Noble metal nanoparticles/carbon
nanotubes nanohybrids: Synthesis and applications. Nano Today, [online]
Available at:
http://www.sciencedirect.com/science/article/pii/S1748013210001696 [Accessed
30 July 2015].
Yujaroen, D., Goto, M., Sasaki, M. & Shotipruk, A., 2009. Esterification of palm
fatty acid distillate (PFAD) in supercritical methanol: Effect of hydrolysis on
reaction reactivity. Fuel, [online] Available at:
http://www.sciencedirect.com/science/article/pii/S0016236109001203 [Accessed
25 July 2015].
Zabeti, M., Daud, W.M.A.W. & Aroua, M.K., 2009a. Optimization of the activity of
CaO/Al2O3 catalyst for biodiesel production using response surface methodology.
Applied Catalysis A: General, [online] Available at:
http://www.sciencedirect.com/science/article/pii/S0926860X09004840 [Accessed
1 August 2015].
Zabeti, M., Wan Daud, W.M.A. & Aroua, M.K., 2009b. Activity of solid catalysts
for biodiesel production: A review. Fuel Processing Technology, [online]
Available at:
http://www.sciencedirect.com/science/article/pii/S0378382009000629 [Accessed
12 July 2015].
Zhang, Y., Dubé, M.A., McLean, D.D. & Kates, M., 2003. Biodiesel production
from waste cooking oil: 1. Process design and technological assessment.
Bioresource Technology, [online] Available at:

60
http://www.sciencedirect.com/science/article/pii/S0960852403000403 [Accessed
23 July 2015].
Zong, M.-H., Duan, Z.-Q., Lou, W.-Y., Smith, T.J. & Wu, H., 2007. Preparation of a
sugar catalyst and its use for highly efficient production of biodiesel. Green
Chemistry, [online] Available at: http://dx.doi.org/10.1039/B615447F [Accessed 1
August 2015].

61
APPENDICES
APPENDIX A: Detailed Data and Graphs Generated by XRD

62
APPENDIX B: FTIR Spectra of Original, Purified and Sulfonated Graphite Catalysts

63
APPENDIX C: Results of Gas Chromatography

64
APPENDIX D: MSDS of All Chemicals Used