biocomplexity of arctic patterned ground: ecosystems
TRANSCRIPT
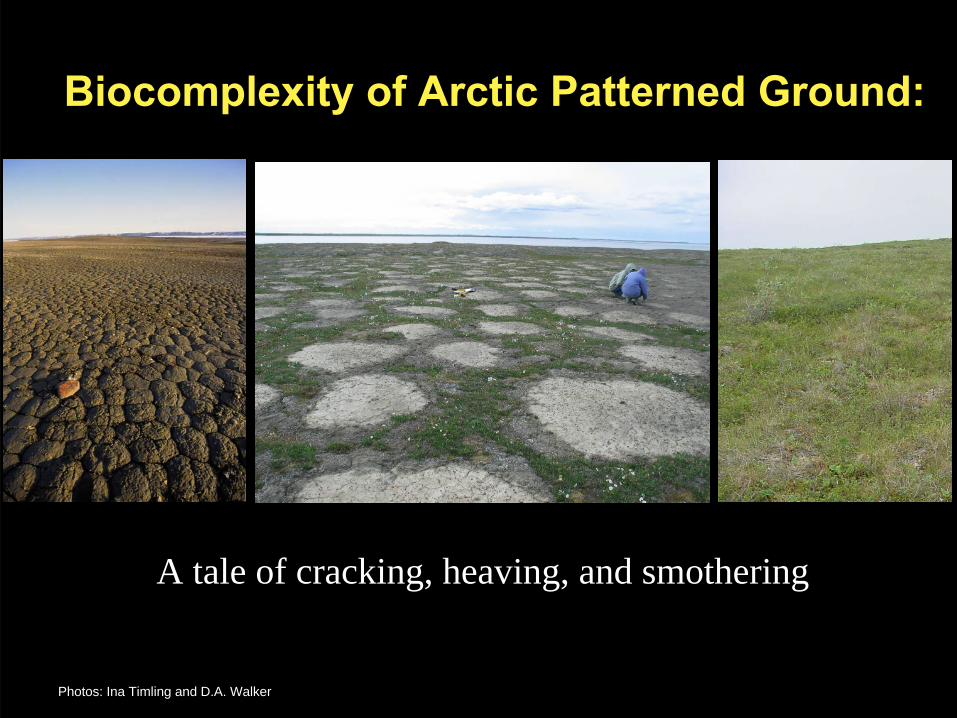
Biocomplexity of Arctic Patterned Ground:ecosystems
Photos: Ina Timling and D.A. Walker
A tale of cracking, heaving, and smothering
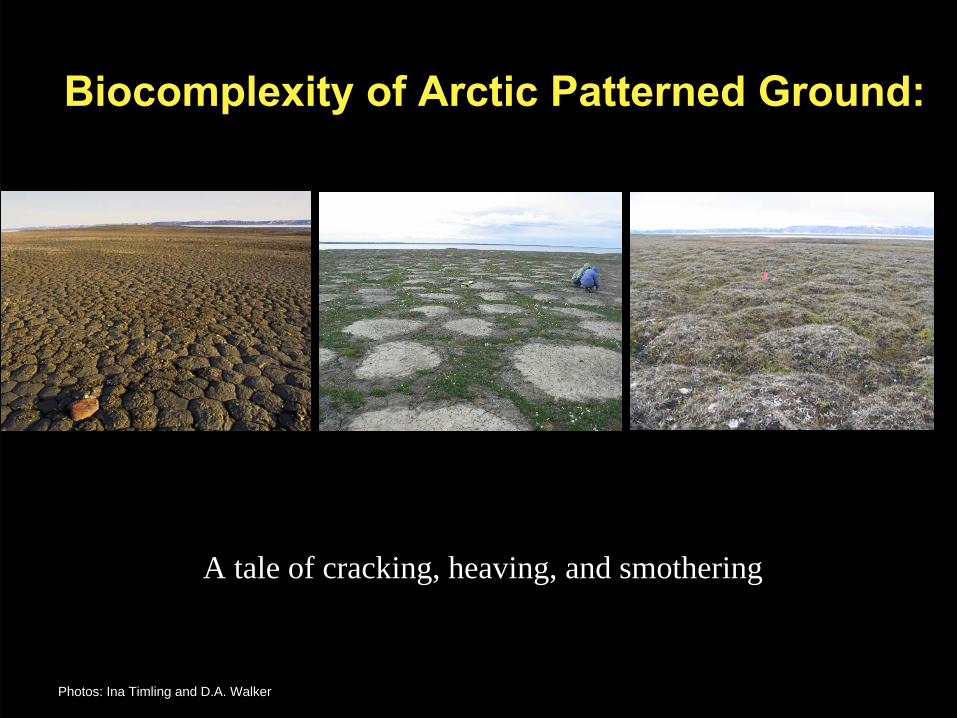
Biocomplexity of Arctic Patterned Ground:ecosystems
Photos: Ina Timling and D.A. Walker
A tale of cracking, heaving, and smothering
Co-authors:
Donald Walker1, Ronnie Daanen1, Howard Epstein2, William Gould3, Grizelle Gonzalez3 Anja Kade1, Alexia Kelley2, William
Krantz4, Patrick Kuss1, Gary Michaelson5, Corinne Munger1, Dmitri Nickolsky1, Rorik Peterson1, Chien-Lu Ping5, Martha Raynolds1,
Vladimir Romanovsky1, Charles Tarnocai6, and Corinne Vonlanthen1
1IAB, University of Alaska Fairbanks, 2 Univ.Virginia, 3USDA Inst. Trop. Forest., San Juan, PR, 4Dept. Chem. Mater. Eng., Univ. Cincinnati, 5UAF Ag. And Forestry Exp.
Sta., Palmer, AK, 6Ag. and Agri-Food Canada, Ottawa, CAN
Funding:NSF Biocomplexity in the Environment, OPP Grant #0120736
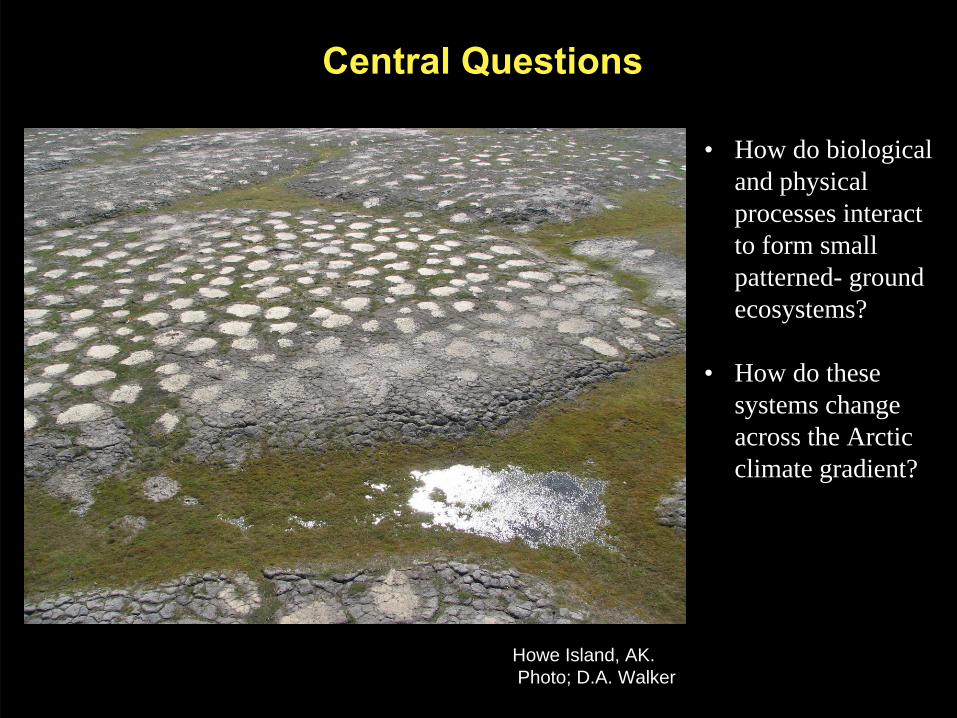
Howe Island, AK.Photo; D.A. Walker
Central Questions
• How do biological and physical processes interact to form small patterned- ground ecosystems?
• How do these systems change across the Arctic climate gradient?
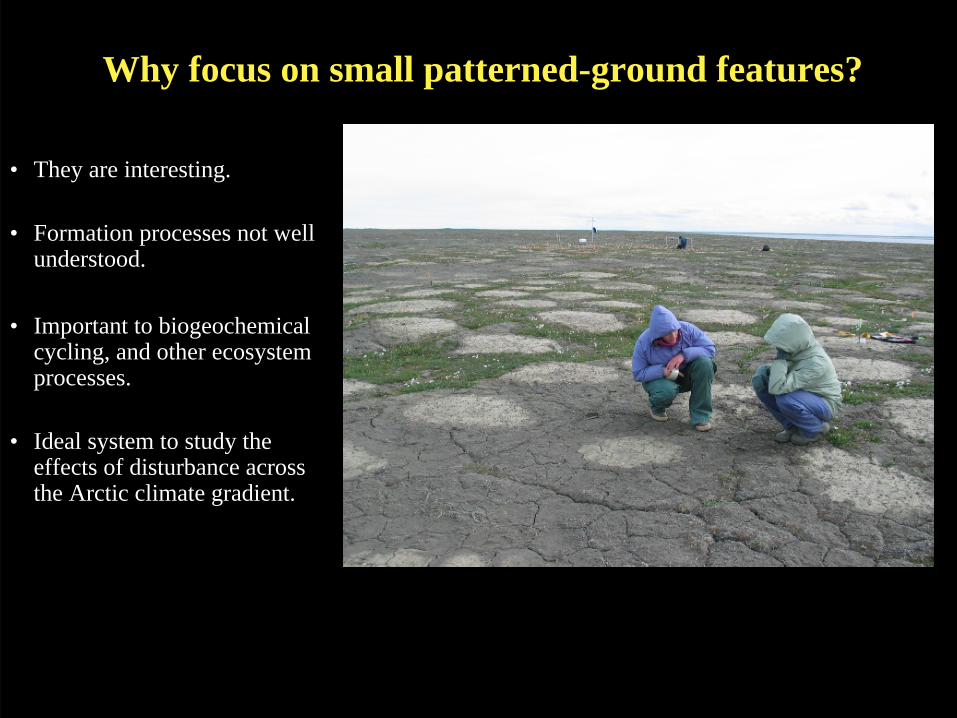
Why focus on small patterned-ground features?
• They are interesting.
• Formation processes not well understood.
• Important to biogeochemical cycling, and other ecosystem processes.
• Ideal system to study the effects of disturbance across the Arctic climate gradient.
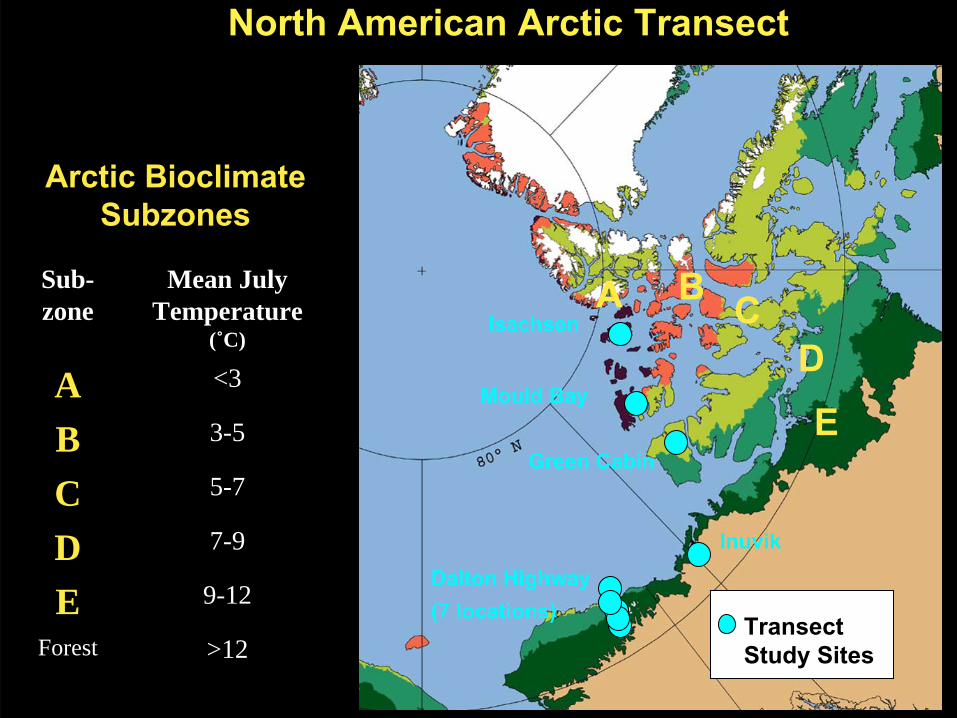
North American Arctic Transect
Dalton Highway (7 locations)
Isachsen
Green Cabin
Mould Bay
Inuvik
A B CDE
Arctic Bioclimate Subzones
Transect Study Sites>12Forest
9-12E
7-9D
5-7C
3-5B
<3A
Mean July Temperature
(˚C)
Sub-zone
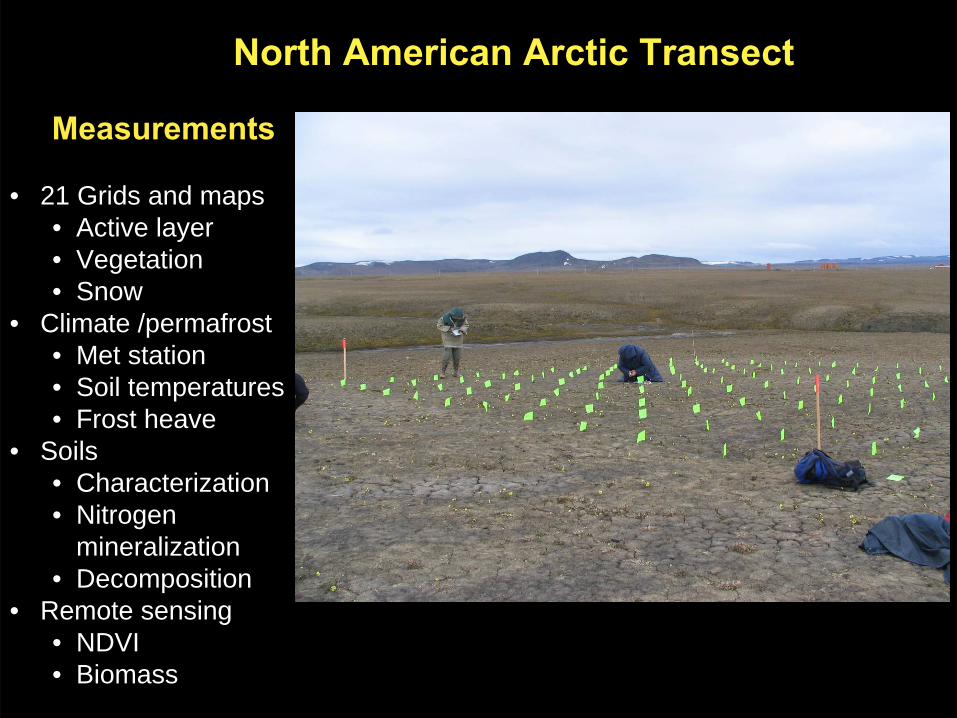
North American Arctic Transect
Dalton Highway (7 locations)
Measurements
• 21 Grids and maps• Active layer• Vegetation • Snow
• Climate /permafrost• Met station• Soil temperatures• Frost heave
• Soils • Characterization• Nitrogen
mineralization• Decomposition
• Remote sensing• NDVI• Biomass
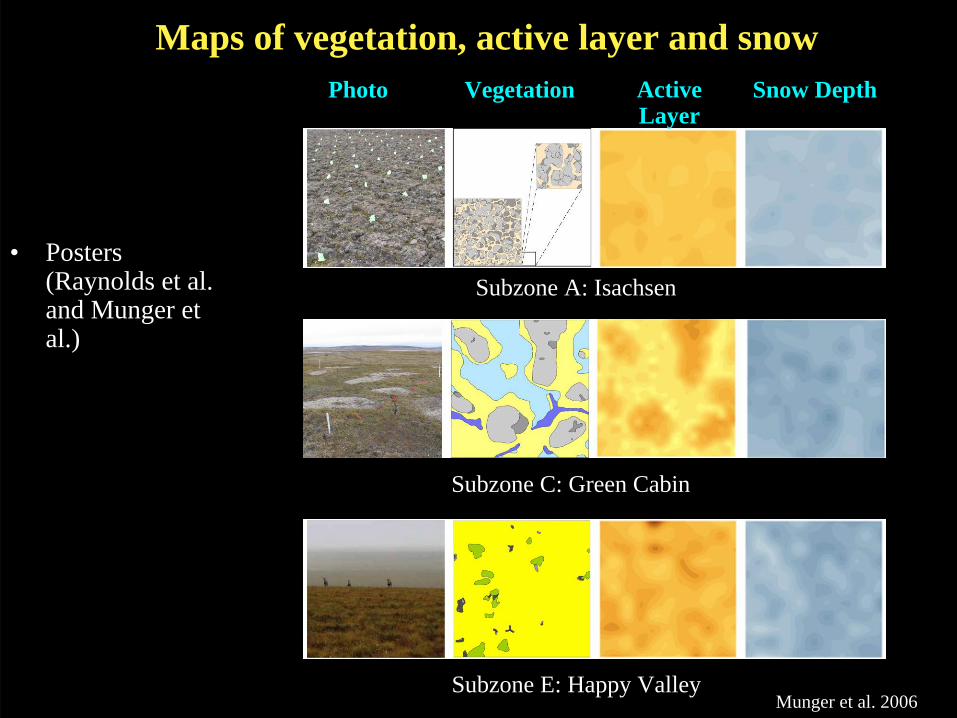
Maps of vegetation, active layer and snow
• Posters (Raynolds et al. and Munger et al.)
Munger et al. 2006
Photo Active Layer
Vegetation Snow Depth
Subzone A: Isachsen
Subzone C: Green Cabin
Subzone E: Happy Valley
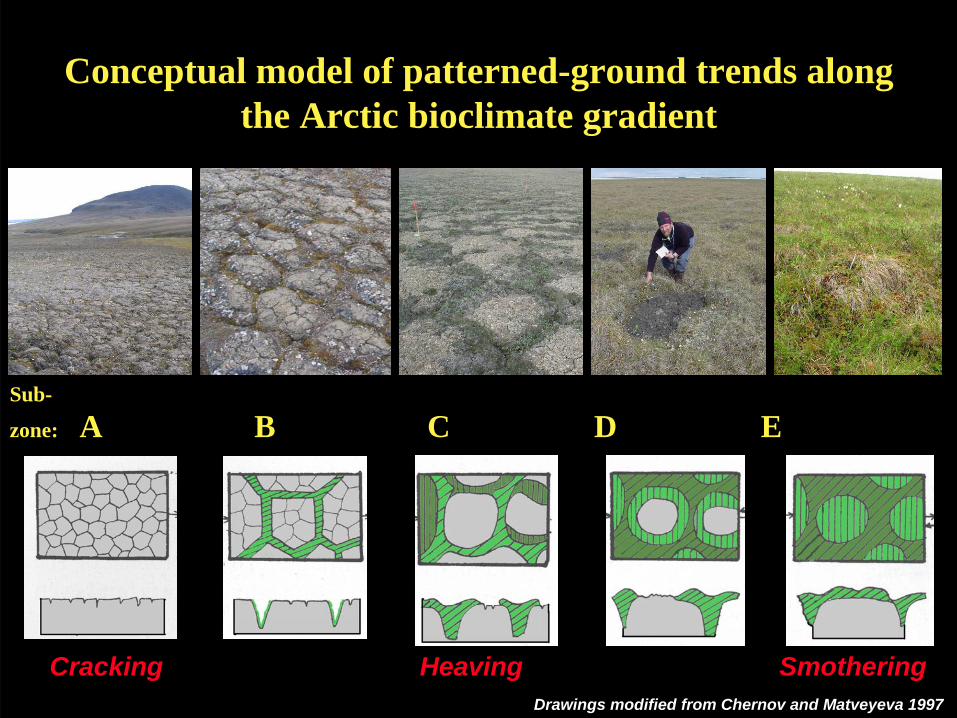
Conceptual model of patterned-ground trends along the Arctic bioclimate gradient
Sub-
zone: A B C D E
Drawings modified from Chernov and Matveyeva 1997
Cracking Heaving Smothering
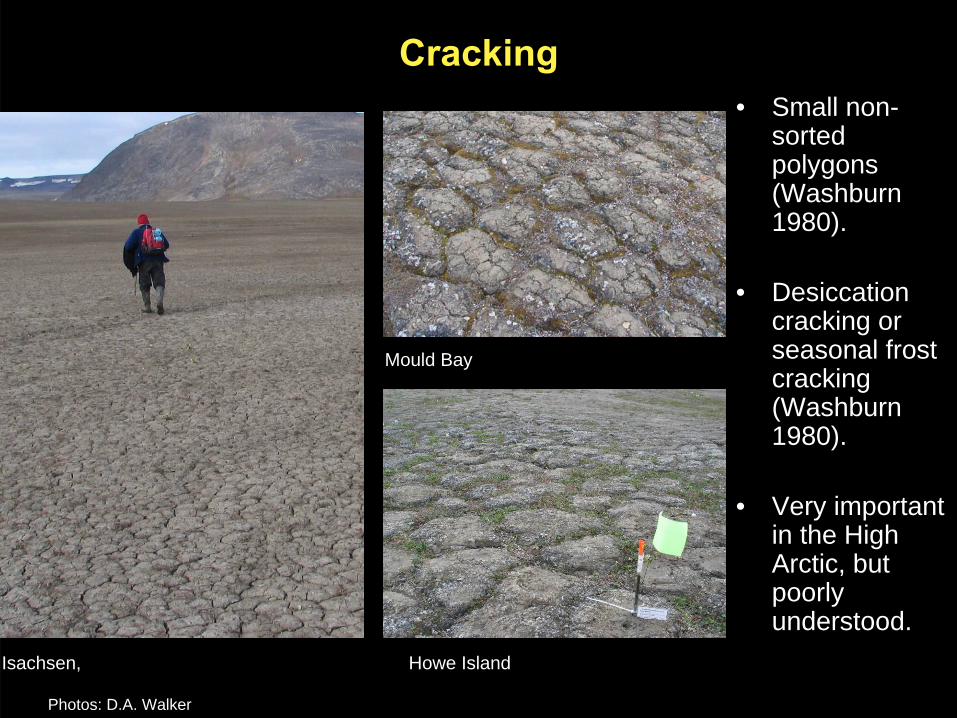
Cracking• Small non-
sorted polygons (Washburn 1980).
• Desiccation cracking or seasonal frost cracking (Washburn 1980).
• Very important in the High Arctic, but poorly understood.
Isachsen, Howe Island
Mould Bay
Photos: D.A. Walker
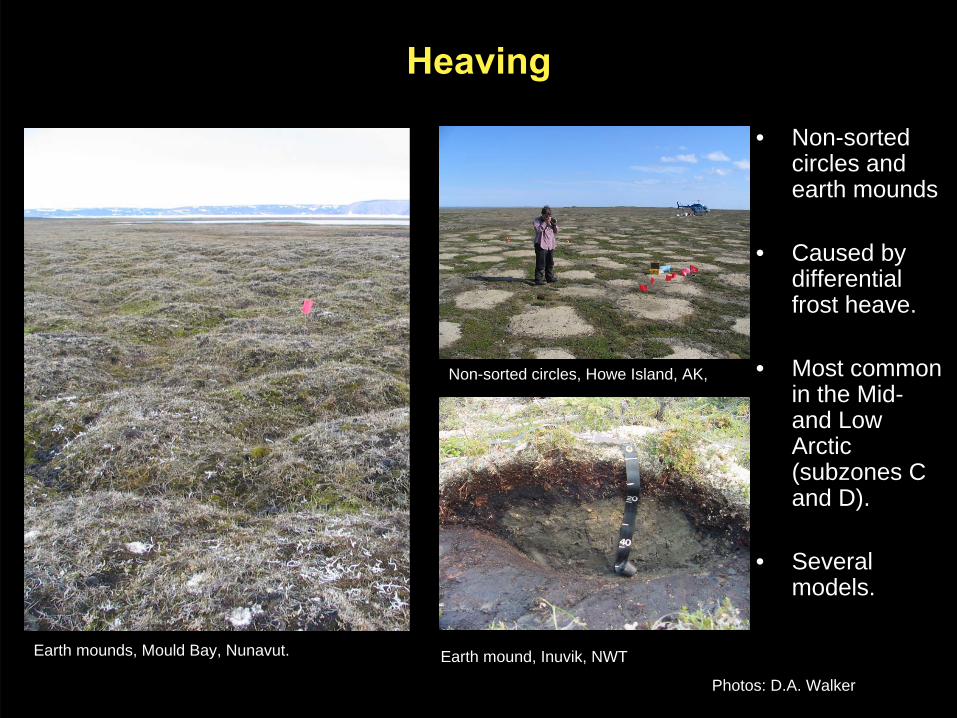
Heaving
• Non-sorted circles and earth mounds
• Caused by differential frost heave.
• Most common in the Mid-and Low Arctic (subzones C and D).
• Several models.
Earth mounds, Mould Bay, Nunavut. Earth mound, Inuvik, NWT
Non-sorted circles, Howe Island, AK, .
Photos: D.A. Walker
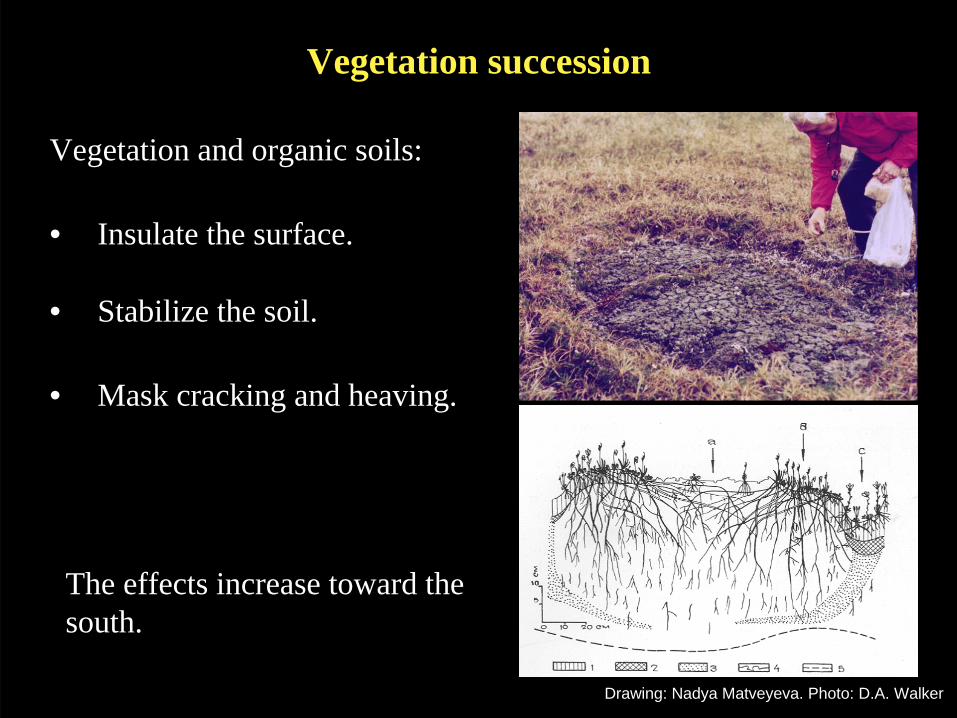
Vegetation succession
Vegetation and organic soils:
• Insulate the surface.
• Stabilize the soil.
• Mask cracking and heaving.
Drawing: Nadya Matveyeva. Photo: D.A. Walker
The effects increase toward the south.
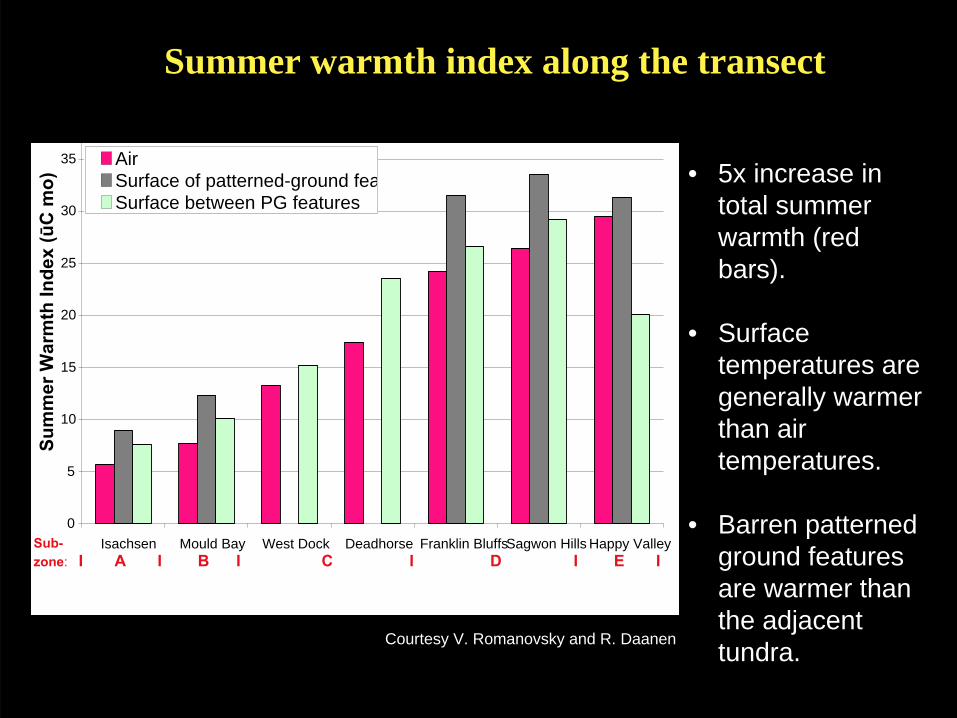
Summer warmth index along the transect
0
5
10
15
20
25
30
35
Isachsen Mould Bay West Dock Deadhorse Franklin BluffsSagwon Hills Happy Valley
Sum
mer
War
mth
Inde
x (ū
C m
o)
Air Surface of patterned-ground feaSurface between PG features
• 5x increase in total summer warmth (red bars).
• Surface temperatures are generally warmer than air temperatures.
• Barren patterned ground features are warmer than the adjacent tundra.
Sub-zone: I A I B I C I D I E I
Courtesy V. Romanovsky and R. Daanen
August Thaw Depth on 10x10-m Biocomp
0
10
20
30
40
50
60
70
80
90
100
Isac
hsen
- 1
Isac
hsen
- 2
Isac
hsen
- 3
Mou
ld B
ay- 1
Mou
ld B
ay- 2
Wes
t Doc
k
Howe
Isla
nd
Green
Cab
in- 1
Green
Cab
in- 2
Green
Cab
in- 3
Deadh
orse
Fran
klin
Blu
ffs- 1
Fran
klin
Blu
ffs- 2
Fran
klin
Blu
ffs- 3
Sagw
on N
onac
idic
- 1
Sagw
on N
onac
idic
- 2
Sagw
on A
cidi
c
Happy
Val
ley-
1
Happy
Val
ley-
2
Happy
Val
ley-
3In
uvik
Th
aw
Dep
th (
cm)
20002001200220052006
Subzone: I A I B I C I D I E IBFI
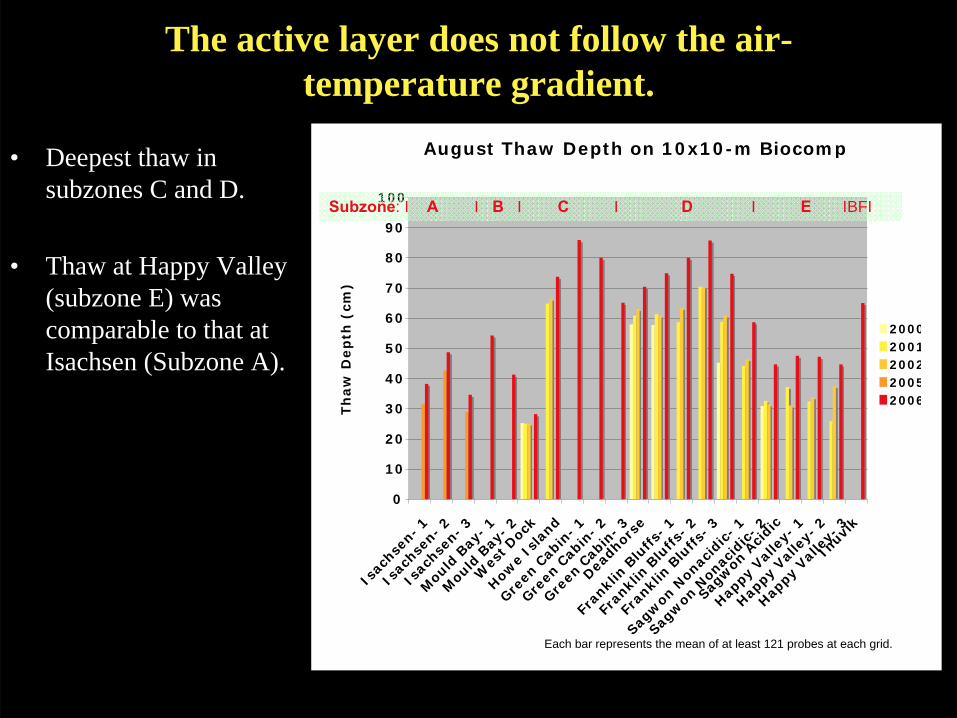
August thaw depth at 10 x 10-m grids
Each bar represents the mean of at least 121 probes at each grid.
The active layer does not follow the air-temperature gradient.
• Deepest thaw in subzones C and D.
• Thaw at Happy Valley (subzone E) was comparable to that at Isachsen (Subzone A).
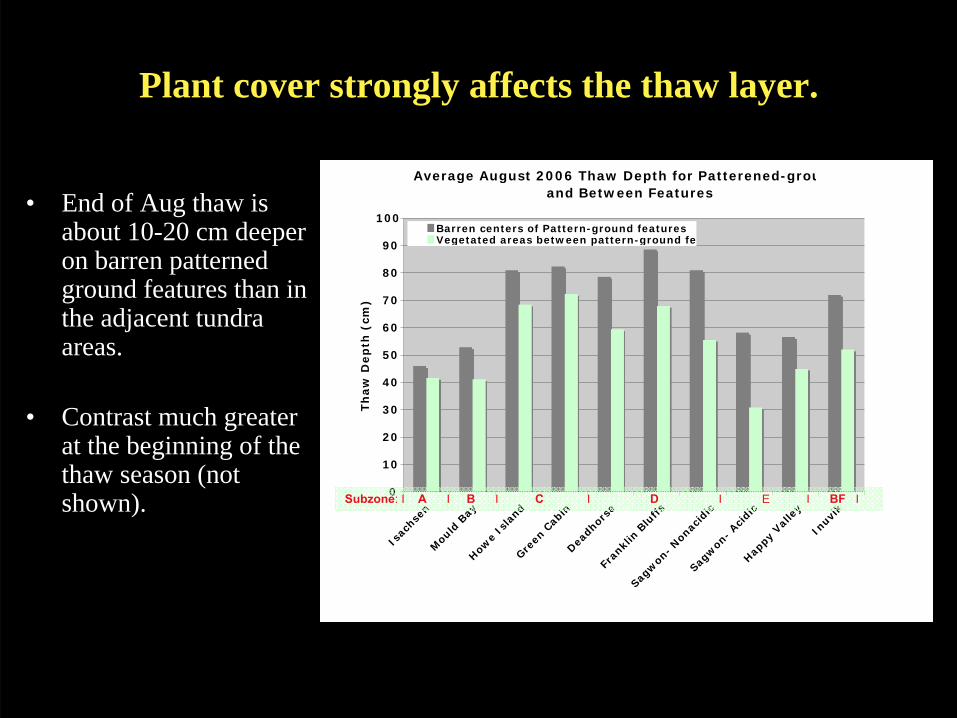
Plant cover strongly affects the thaw layer.
Average August 2006 Thaw Depth for Patterened-grouand Between Features
0
10
20
30
40
50
60
70
80
90
100
Isac
hsen
Mou
ld B
ayHow
e Is
land
Green
Cab
inDea
dhor
seFr
ankl
in B
luffs
Sagw
on- N
onac
idic
Sagw
on- A
cidi
cHap
py V
alle
y
Inuv
ik
Th
aw
Dep
th (
cm)
Barren centers of Pattern-ground featuresVegetated areas between pattern-ground fe
Subzone: I A I B I C I D I E I BF I
• End of Aug thaw is about 10-20 cm deeper on barren patterned ground features than in the adjacent tundra areas.
• Contrast much greater at the beginning of the thaw season (not shown).
0
100
200
300
400
500
600
700
800
Isachsen Mould Bay GreenCabin
Deadhorse FranklinBluffs
SagwonNonacidic
SagwonAcidic
HappyValley
Bio
mass
(g
/m
2)
Deciduous shrubEvergreen shrubForbGraminoidLichenMoss
Data represent the means of 5 20x50-cm plots in each vegetation type.
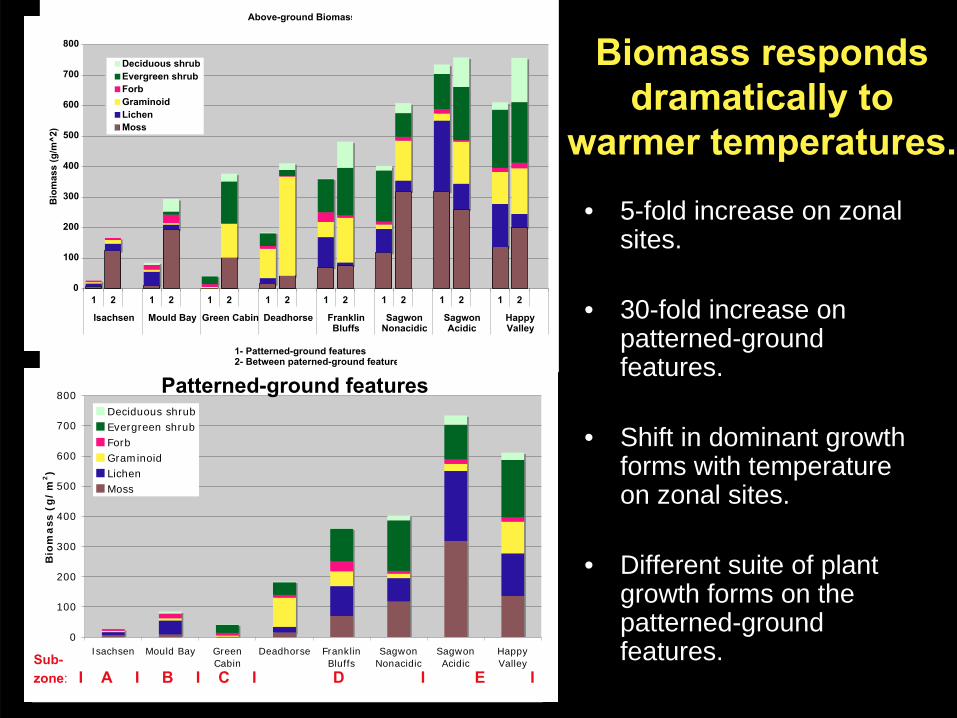
Biomass responds dramatically to
warmer temperatures.
Patterned-ground features
Zonal vegetation
Sub-zone: I A I B I C I D I E I
• 5-fold increase on zonal sites.
• 30-fold increase on patterned-ground features.
• Shift in dominant growth forms with temperature on zonal sites.
• Different suite of plant growth forms on the patterned-ground features.
Above-ground Biomass
0
100
200
300
400
500
600
700
800
1 2 1 2 1 2 1 2 1 2 1 2 1 2 1 2
Isachsen Mould Bay Green Cabin Deadhorse FranklinBluffs
SagwonNonacidic
SagwonAcidic
HappyValley
Bio
mas
s (g
/m^2
)Deciduous shrubEvergreen shrubForbGraminoidLichenMoss
1- Patterned-ground features2- Between paterned-ground feature
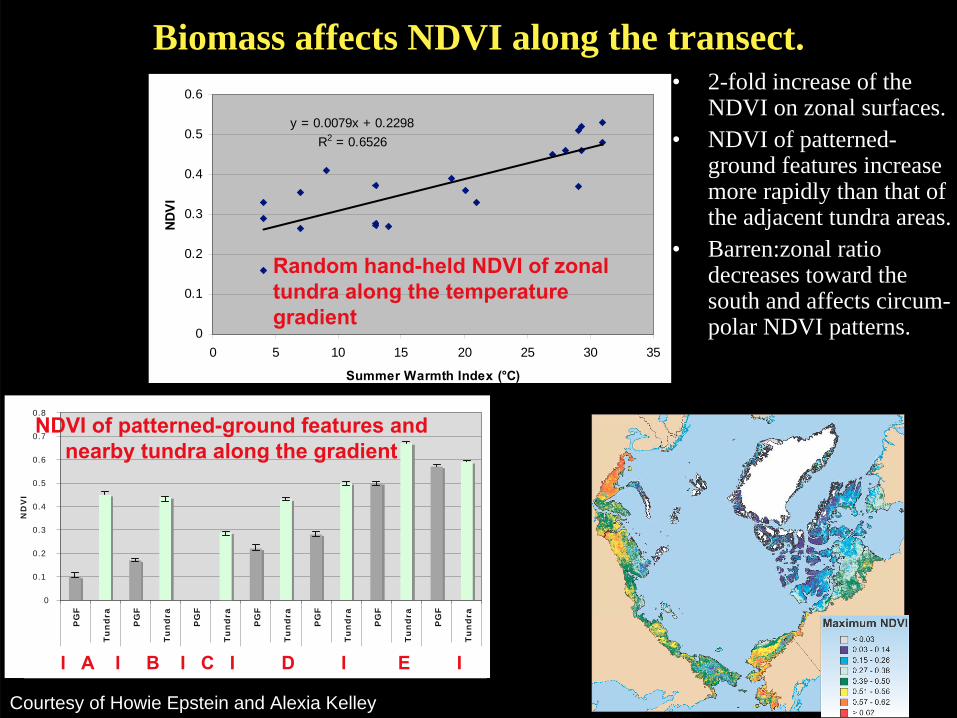
Biomass affects NDVI along the transect.• 2-fold increase of the
NDVI on zonal surfaces.• NDVI of patterned-
ground features increase more rapidly than that of the adjacent tundra areas.
• Barren:zonal ratio decreases toward the south and affects circum-polar NDVI patterns.
y = 0.0079x + 0.2298R2 = 0.6526
0
0.1
0.2
0.3
0.4
0.5
0.6
0 5 10 15 20 25 30 35
Summer Warmth Index (°C)
NDV
I
y = 2320.8x - 459.23R2 = 0.7166
y = 1452.4x - 326.35R2 = 0.5267
y = 817.29x - 198.18R2 = 0.4576
0100200300400500600700800900
1000
0 0.1 0.2 0.3 0.4 0.5 0.6
NDVI
Abo
vegr
ound
Bio
mas
s (g
/m²) Total AG
Vascular
Shrubs
Random hand-held NDVI of zonal tundra along the temperature gradient
0
0.1
0.2
0.3
0.4
0.5
0.6
0.7
0.8
PG
F
Tu
nd
ra
PG
F
Tu
nd
ra
PG
F
Tu
nd
ra
PG
F
Tu
nd
ra
PG
F
Tu
nd
ra
PG
F
Tu
nd
ra
PG
F
Tu
nd
ra
Isachsen MouldBay
GreenCabin
FranklinBlfs
SagwonMNT
SagwonMAT
HappyValley
ND
VI
NDVI of patterned-ground features and nearby tundra along the gradient
Courtesy of Howie Epstein and Alexia Kelley
I A I B I C I D I E I
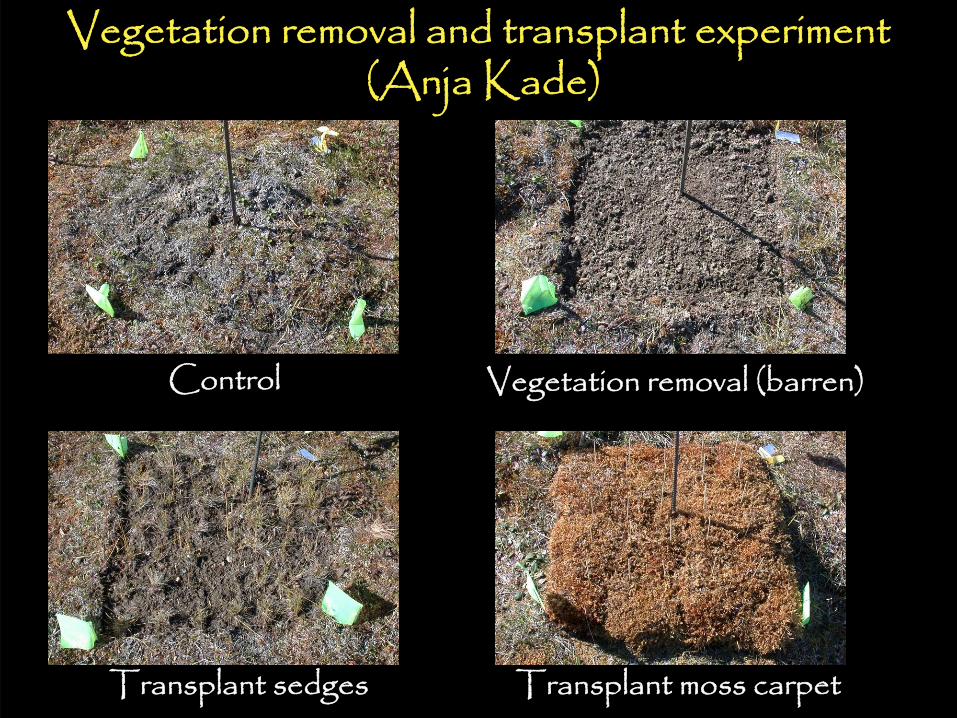
Vegetation removal and transplant experiment (Anja Kade)
Control Vegetation removal (barren)
Transplant moss carpetTransplant sedges
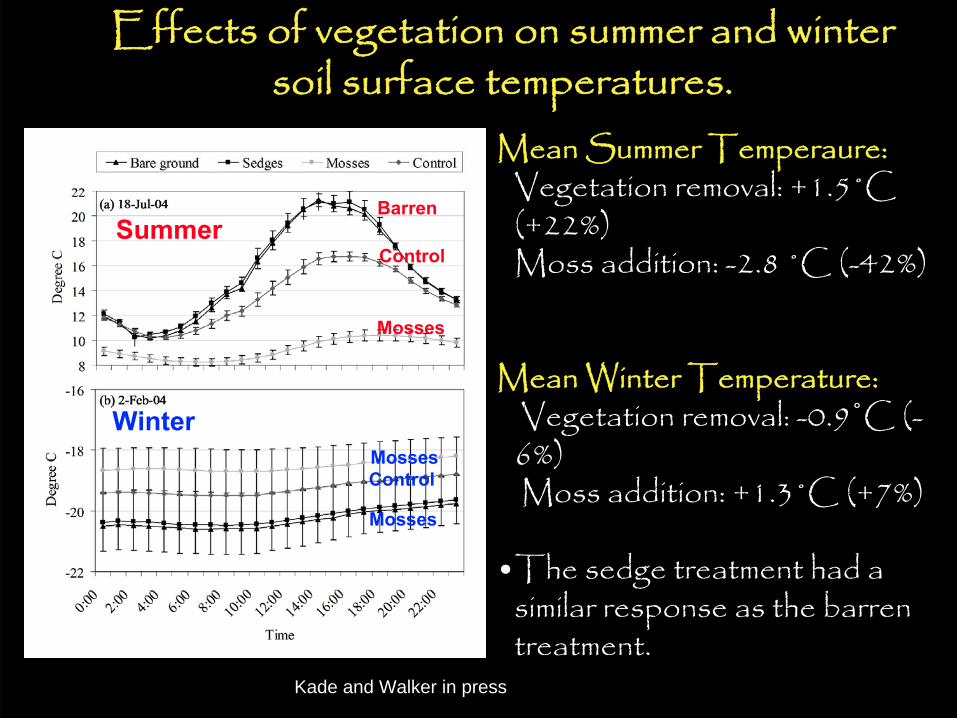
Effects of vegetation on summer and winter soil surface temperatures.
Mean Summer Temperaure:Vegetation removal: +1.5˚C (+22%)Moss addition: -2.8 ˚C (-42%)
Mean Winter Temperature:Vegetation removal: -0.9̊C (-6%)Moss addition: +1.3˚C (+7%)
•The sedge treatment had a similar response as the barren treatment.
Kade and Walker in press
Summer
Winter
Mosses
Barren
Control
MossesControl
Mosses
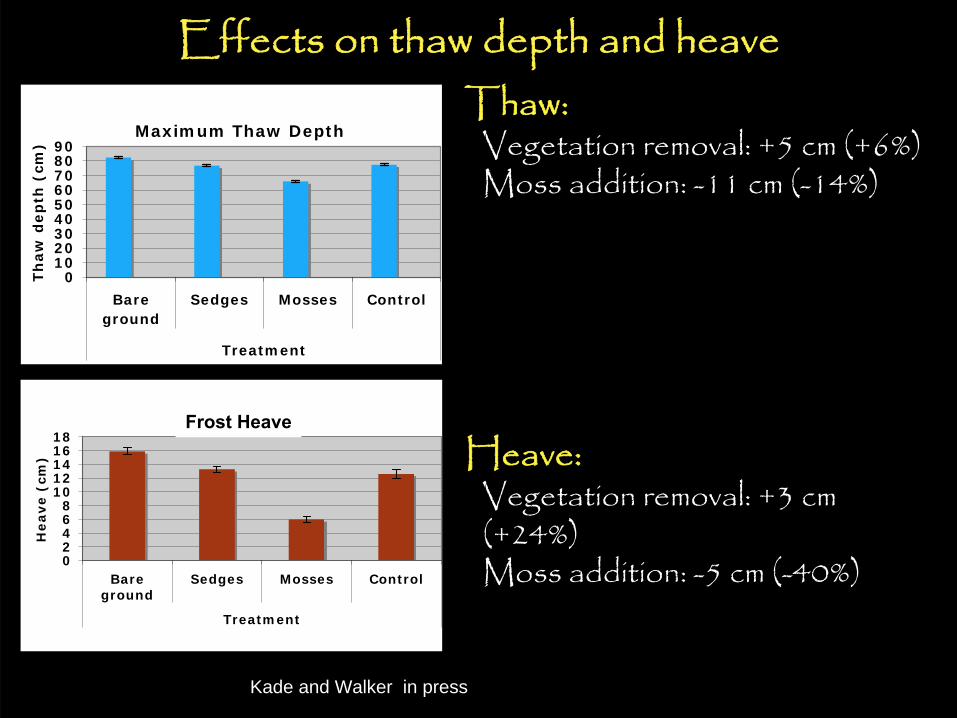
Effects on thaw depth and heaveThaw:
Vegetation removal: +5 cm (+6%)Moss addition: -11 cm (-14%)
Heave:Vegetation removal: +3 cm (+24%)Moss addition: -5 cm (-40%)
Kade and Walker in press
Maximum Thaw Depth
0102030405060708090
Bareground
Sedges Mosses Control
Treatment
Th
aw
dep
th (
cm)
Fros
02468
1012141618
Bareground
Sedges Mosses Control
Treatment
Heave (
cm)
Frost Heave
0 0.2 0.4 0.6 0.8 1 1.20
0.02
0.04
0.06
0.08
0.1
0.12
0.14
0.16
0.18
Hea
ve (m
)
Distance from the center of a circle, m
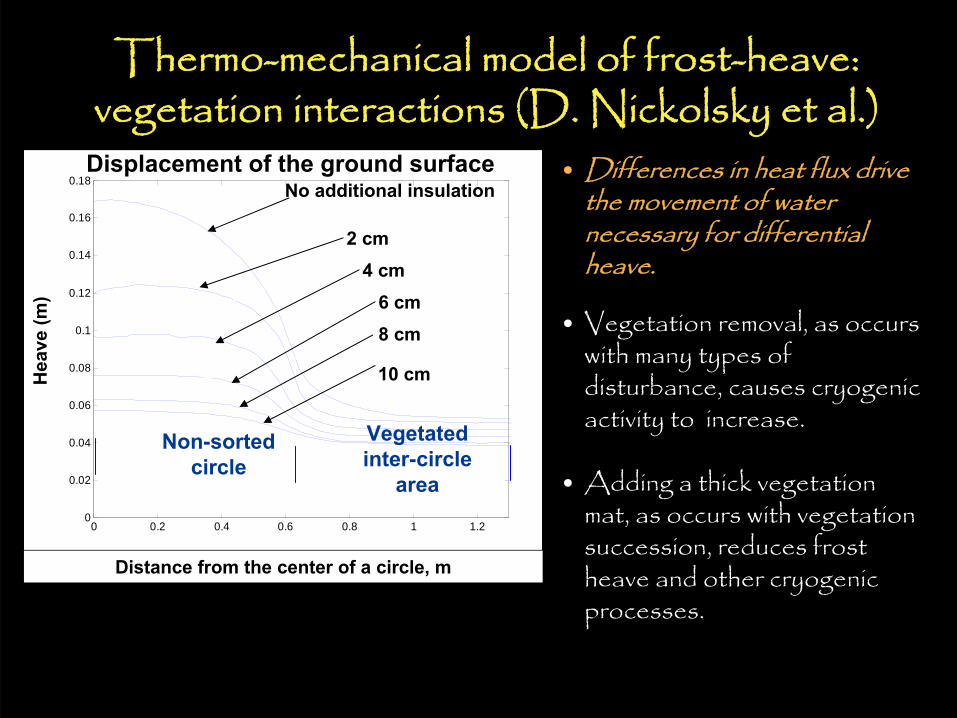
• Differences in heat flux drive the movement of water necessary for differential heave.
• Vegetation removal, as occurs with many types of disturbance, causes cryogenic activity to increase.
• Adding a thick vegetation mat, as occurs with vegetation succession, reduces frost heave and other cryogenic processes.
Displacement of the ground surfaceNo additional insulation
2 cm4 cm
6 cm8 cm
10 cm
Non-sortedcircle
Vegetated inter-circle
area
Thermo-mechanical model of frost-heave: vegetation interactions (D. Nickolsky et al.)
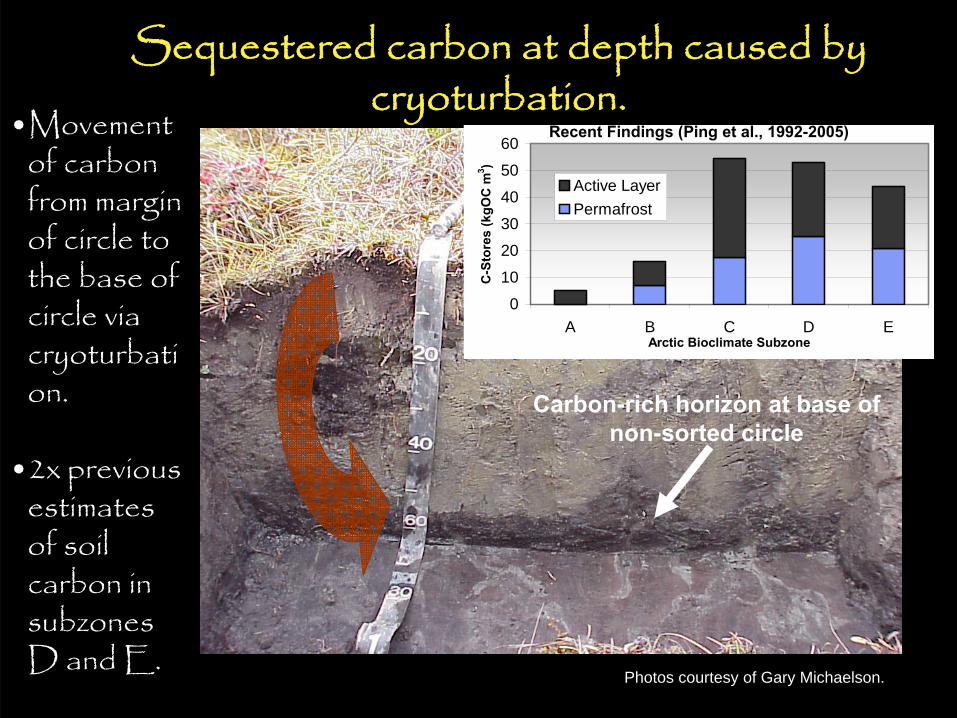
Sequestered carbon at depth caused by cryoturbation.
Carbon-rich horizon at base of non-sorted circle
•Movement of carbon from margin of circle to the base of circle via cryoturbation.
•2x previous estimates of soil carbon in subzones D and E.
Photos courtesy of Gary Michaelson.
Recent Findings (Ping et al., 1992-2005)
0
10
20
30
40
50
60
A B C D EArctic Bioclimate Subzone
C-S
tore
s (k
gOC
m3 )
Active LayerPermafrost
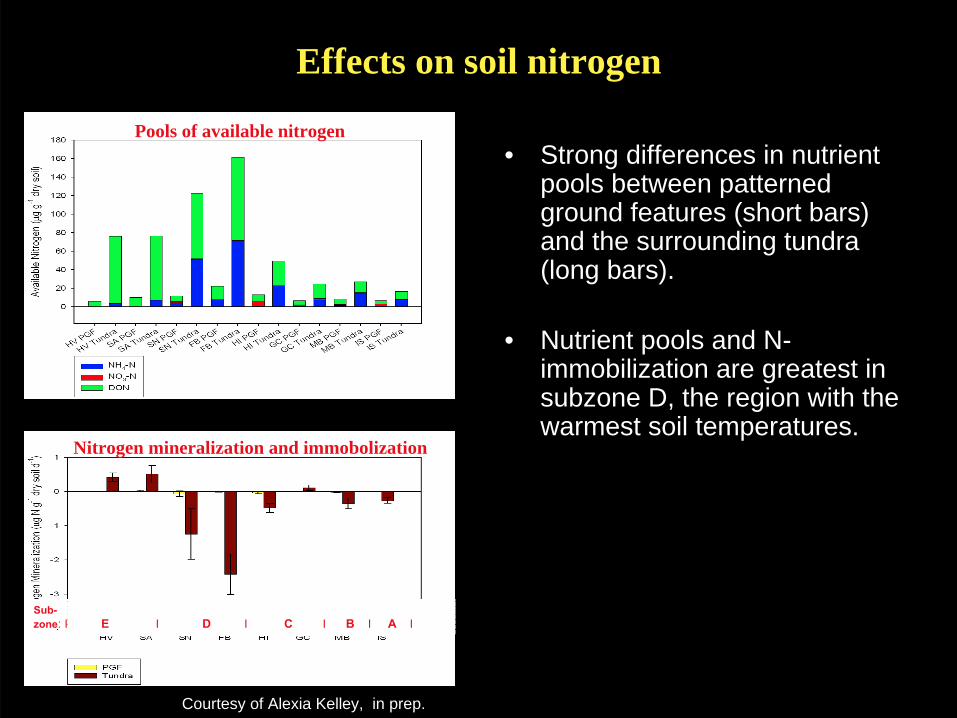
Effects on soil nitrogen
• Strong differences in nutrient pools between patterned ground features (short bars) and the surrounding tundra (long bars).
• Nutrient pools and N-immobilization are greatest in subzone D, the region with the warmest soil temperatures.
Courtesy of Alexia Kelley, in prep.
Pools of available nitrogen
Nitrogen mineralization and immobolization
Sub-zone: I E I D I C I B I A I
A B EC D BF
Stre
ngth
of e
ffect
3
2
1
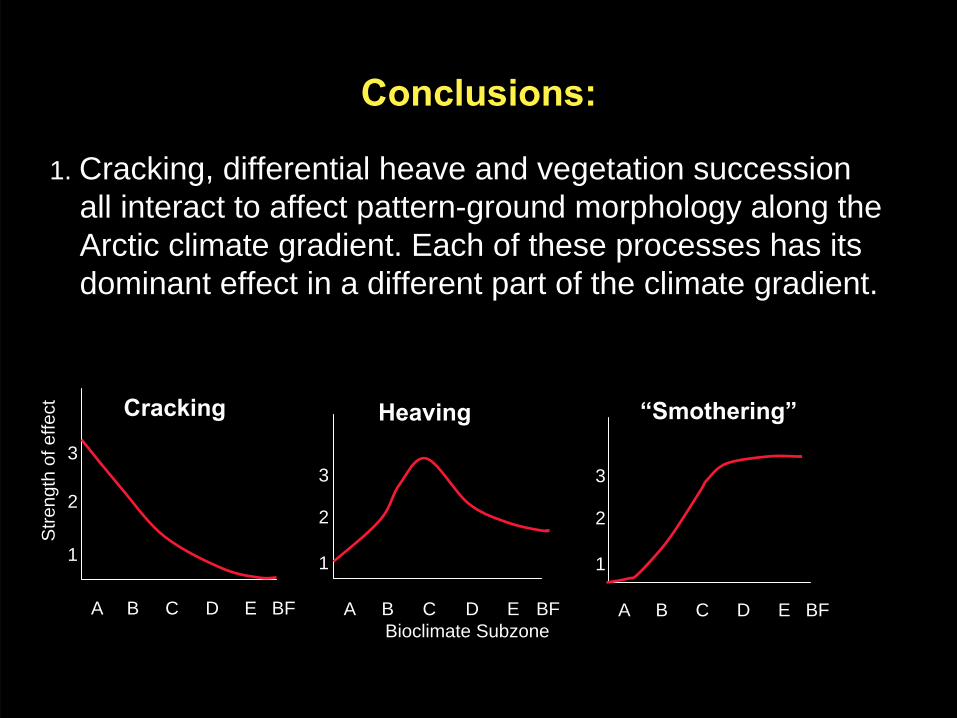
Cracking
Bioclimate SubzoneA B EC D BF
3
2
1
Heaving
A B EC D BF
3
2
1
“Smothering”
Conclusions:
1. Cracking, differential heave and vegetation succession all interact to affect pattern-ground morphology along the Arctic climate gradient. Each of these processes has its dominant effect in a different part of the climate gradient.
Conclusions
2. Our study and models focused on the combined effects of differential heave and vegetation succession. New models will be needed to incorporate cracking.
3. Strong thermal contrasts between the centers and margins of heave features drive the movement of water and the development of frost heave.
4. The presence of patterned ground affects most ecosystem processes at small spatial scales. How these small-scale processes scale up to large regions still needs to be described.
5. Experimental manipulation of small-patterned ground features, such as that of Anja Kade help elucidate the response of these features to disturbance.