biochemistry review i - computational & systems … · biochemistry review ii bbsi @ pitt 2004....
TRANSCRIPT

Biochemistry Review IIBiochemistry Review II
BBSI @ Pitt 2004BBSI @ Pitt 2004
Rajan Munshi
Center for Computational Biology and BioinformaticsUniversity of Pittsburgh School of Medicine
May 26, 2004

OutlineOutline
Cell Cycle
Signal Transduction
DNA Microarrays

Cell Cycle
Four phases of the cell cycle:Mitosis (M phase)Gap 1 (G1 phase)DNA Synthesis (S phase)Gap 2 (G2 phase)A fifth “phase”: G0 (quiescence)
G0

Cell Cycle Phases
M phase: cell division; each cell gets 1 copy of the genomeG1 phase: cell growth; preparation for DNA replicationS phase: DNA synthesis (replication)G2 phase: preparation for M phase

ChromatinPackaging
Why does DNA in interphase “look”different from DNA in mitosis?Higher order of packagingMitotic phase: DNA packaged intochromosomesInterphase: DNA present as chromatin“beads-on-a-string”beads = nucleosomesnucleosomes = DNA wrapped around histones

Mitotic chromosomes =transcriptionally inactive(heterochromatin)
Interphase chromatin =transcriptionally active(euchromatin)

Cell Cycle Control
Web animationCheckpoints controlled by proteinsImportant group of checkpoint proteins are the cyclinsSo termed because their levels “cycle” during different phasesCyclins, by themselves, are inactiveHave to associate with cyclin-dependent kinases (cdk)Cdk levels are invariant throughout the cell cycleG1 cyclin ― cyclin D (cdk4)S-phase cyclins ― cyclins A and E (cdk2)G2 cyclins ― cyclin B (cdc2 (cdk1))

Cyclins and cdks
CyclinsG1 cyclin (cyclin D)S-phase cyclins (cyclins E and A)mitotic cyclins (cyclins B and A)
CdksG1 Cdk (cdk4)S-phase cdk (cdk2)M-phase cdk (cdc2 (Cdk1))

Cell Cycle Checkpoints
G2
Restrictionpoint, R
Cyclin B-cdc2 Cyclin A-cdc2
Cyclin A-cdk2
Cyclin E-cdk2
M
G1
S
Nuclear envelope breakdown; assembly of
mitotic spindle; activation of APC
Dissociation of APC; exit from M
In molecular terms, passing R is the
phosphorylation of the retinablastoma protein, Rb. Unphosphorylated
Rb binds the trasnscription factor,
E2F; the phosphorylated form
cannot bind E2F, thereby allowing E2F to
modulate gene expression
Cyclin D-cdk4

Regulation via Phosphorylation
Phosphorylation and dephorphorylation regulate many key eventsCell cycle controlSignal transductionTranscription

Signal Transduction
Ensures that a signal is converted from one form to another
From the exterior of the cell to the interior
Retain original signal content

Steps in Signal Transduction
Signal is sent. e.g. hormone, non-steriod ligand (epinephrine)Recognition of the signal by the cell via a receptor.Receptors can be present on the cell membrane or in the cytosolInternal signaling molecules transduce and amplify the signalCarried out via a signaling cascade, with multiple regulatory stepsE.g. Glycogen breakdown in response to epinephrine

Cell Receptors
Ion-channel linked: involved in rapid synaptic signaling betweenexcitable cells; mediated by neurotransmittersEnzyme-linked receptors: when activated, either function directly as enzymes or are associated with enzymes.G-protein coupled receptors (GPCR)

GPCRs
Largest family of cell-surface receptorsBiological functions include smell, taste, vision, neurotransmission,blood pressure, embryogenesis, cell growth, developmentRhodopsin is the only GPCR with a known 3D structureContains 7 membrane traversing α helices (7TM)N terminal – outside cell, C terminal – inside cellLigand binding outside cell induces conformational change detected inside cellMediating molecule is a G protein (hence the name GPCR) Heterotrimeric GTP-binding regulatory protein (α, β, γ)Activated G protein transmits signal by binding to other proteins (e.g. adenylate cyclase: converts ATP to cAMP)

GPCR Structure

GPCR Structure (contd.)

Signal reception
Signal mediationand amplification
Regulation by reversiblePhosphorylation and
dephosphorylation
Signal effects

DNA Microarrays: An Overview

Also called
DNA chipsbiochipsgene chips / gene arrays
genome chips / genome arrays

What is a microarray?
An arrangement of DNA sequences on a solid supportEach microarray contains thousands of genesAble to simultaneously monitor gene expression levels in all these genesUsed for:
- gene expression studies- disease diagnosis- pharmacogenetics (drug discovery)- toxicogenomics

Types
Two basic microarray technologiescDNA arrays (Stanford)High-density oligonucleotide arrays (Affymetrix)Each technology has its merits and demerits

Definition

High-density oligonucleotide arrays
Pioneered by Affymetrix (GeneChip®)DNA probe sequences are 25-mer fragmentsBuilt in situ (“on-chip”) by photolithographyUses 1 flourescent dye

High-density oligonucleotide arrays
Each sequence is represented by a probe set1 probe set = 16 probe pairsEach probe pair = 1 Perfect Match (PM) probe cell and 1 MisMatch (MM) probe cellPM = perfectly complementary to targetMM = central base is mismatched to target

Affymetrix Probe Sets5’ 3’
GATGGTGGATCCGTACTTCCATGCCTAGCTAGCTAGTCCGTATGGCTACCAAT
Perfect Match (PM)GTACTTCCATGCCTAGCTAGCTAGTMisMatch (MM)GTACTTCCATGCATAGCTAGCTAGT
Probe set(102353_at)
Probe pair
PM
MM

Affymetrix chip

A Single Probe set

cDNA arrays
Also known as spotted arraysSupport can be glass or membraneDNA sequences are robotically “imprinted”Sequences can range from 30 bp to 2 kbSequences are cDNA clonesUses 2 fluorescent dyes (cy3, cy5)

cDNA arrays overview

cDNA arrays
Animation(Courtesy: Dr. A. Malcolm Campbell, Davidson College, NC)(www.bio.davidson.edu/courses/genomics/chip/chip.html)

Genome-on-a-chip (yeast)

General Steps
Visualization, data mining
What do the results mean?
Fluorescence intensities, fold-change ratios(up- or down-regulated)
Hybridization(Southern Blot)
Fluorescently labeled cDNA(single channel, dual channel)
Putting probes on chip(robotic imprinting, photolithogr-aphy)
DNA or cDNA with known identity
InformaticsReadoutAssayTargetChip Fabrication
Probe

Analysis
Low-level analysisExtraction of signal intensitiesNormalization of samples
High-level analysisUnsupervised learning (clustering)
Aggregation of a collection of data into clusters based on different features in a data set (e.g. heirarchical clustering, SOM)
Supervised learning (class discovery)Incorporates knowledge of class label information to make distinctions of interest by using a training set.

Low-level analysis
Gene ExpressionIntensity (Signal)
In other words, anumerical value isobtained
Now, these valuescan be compared because fluorescenseintensity is directlyproportional to geneexpression

High-level analysis
Now what??

High-level analysis (Hierarchical Clustering)
Algorithm that “pairs” similarly expressed genesUses Pearson’s correlation coefficient (r)Useful to gain a general understanding of genes involved in pathways

Time course of serum stimulation of human fibroblasts
Identify clusters of genes that are co-regulatedIdentification of novelgenesVery widespread methodfor microarray analysis
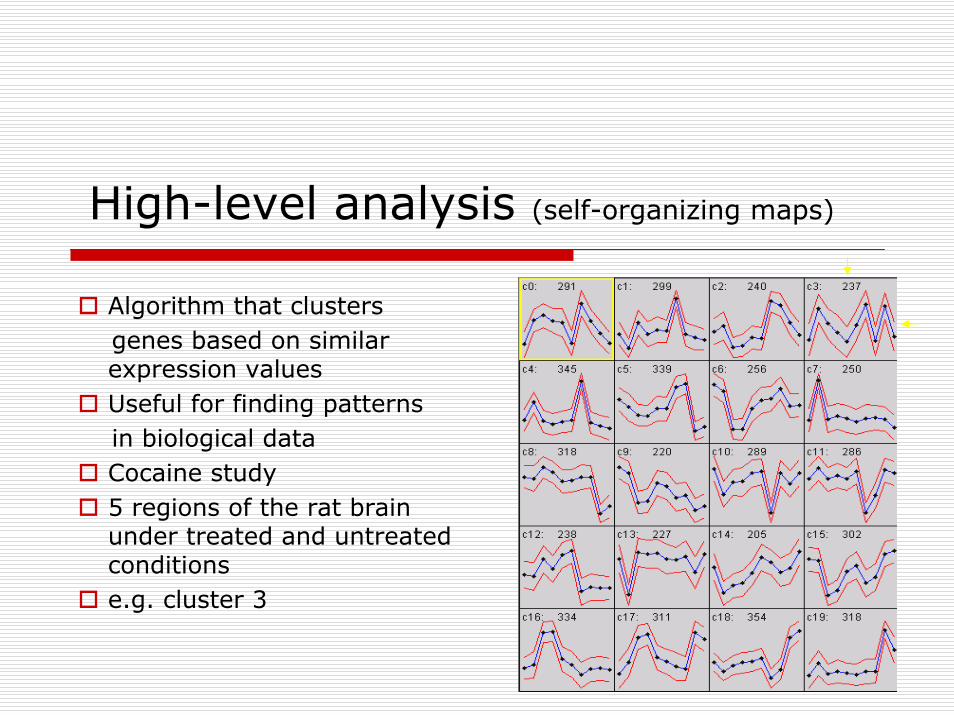
High-level analysis (self-organizing maps)
Algorithm that clustersgenes based on similar expression valuesUseful for finding patternsin biological dataCocaine study5 regions of the rat brain under treated and untreated conditionse.g. cluster 3

Overall Goal
>10,000 genes <50 genes
Identify potential
therapeutic targets
Experimental confirmation

Potential Problems
Local contamination

Array Contamination

Potential Problems
Local contaminationNormalizationStatistical significance of difference in expressioncDNA arrays
- must have the genes cloned- need relatively pure product
Affymetrix arrays- need sequence information

Additional Reading
Affymetrix website: www.affymetrix.comStanford University: genome-www.stanford.eduNature Genetics, vol. 21 supplement, “The Chipping Forecast”www.microarray.orgwww.gene-chips.com/ihome.cuhk.edu.hk/~b400559/array.htmlwww.stat.wisc.edu/~yandell/statgen/reference/array.html