biochemical conversion of fruit rind of telfairia occidentalis · 46 biochemical conversion of...
TRANSCRIPT

Biochemical conversion of fruit rind of Telfairia occidentalis
(Fluted Pumpkin) and poultry manure
Olatunde Samuel Dahunsi Corresp., 1 , Solomon U Oranusi Corresp., 2 , Vincent E Efeovbokhan 3 , Munachi Enyinnaya 1 ,
Soraya Zahedi 4 , John Ojediran 5 , Peter Oluyori 6 , John Izebere 1
1 Biological Sciences, Landmark University, Omu-Aran, Kwara, Nigeria
2 Biological Sciences, Covenant University, Ota, Ogun, Nigeria
3 Chemical Engineering, Covenant University, Ota, Ogun, Nigeria
4 Environmental Technology, University of Cadiz, Cadiz, Spain
5 Agricultural and Biosystems Engineering, Landmark University, Omu-Aran, Kwara, Nigeria
6 Physical Sciences, Landmark University, Omu-Aran, Kwara, Nigeria
Corresponding Authors: Olatunde Samuel Dahunsi, Solomon U Oranusi
Email address: [email protected], [email protected]
This study evaluated the potentials of Fluted pumpkin fruit rind and poultry manure for
biogas generation. Mechanical and thermo-alkaline pre-treatments were applied to two
samples labelled ‘O’ and ‘P’ while the third sample (Q) had no thermo-alkaline treatment.
The physicochemical characteristics of the substrates revealed richness in nutrients and
mineral elements. The modelling was done using the Response Surface Methodology and
Artificial Neural Networks and statistical prediction showed the process optimal conditions
to be 30.02 o C, 7.90, 20.03 days, 5.94 g/kg and 4.01 g/kg for temperature, pH, retention
time, total solids and volatile solids. Using the above set values, the biogas yield was
predicted to be 2614.1, 2289.9 and 1003.3 10-3m3/kg VS for digestions ‘O’, ‘P’ and ‘Q’
respectively. The results showed that use of combination of pre-treatment methods
enhanced the biogas yield in the pre-treated substrates. Analysis of the gas composition
showed 66.5 ± 2.5 % Methane, 25 ± 1% Carbon dioxide; 58.5 ± 2.5 % Methane, 26 ± 1%
Carbon dioxide; 54.5 ± 1.5 % Methane, 28 ± 2% Carbon dioxide for the three experiments
respectively. All the obtained values show the models had a high predictive ability.
However, the coefficient of determination (R2) for RSM was lower compared to that of ANN
which is an indication that ANNs model is more accurate than RSM model in predicting
biogas generation from the anaerobic co-digestion of rind of Fluted pumpkin and poultry
manure. The substrates should be further used for energy generation.
PeerJ Preprints | https://doi.org/10.7287/peerj.preprints.26564v1 | CC BY 4.0 Open Access | rec: 22 Feb 2018, publ: 22 Feb 2018

1 Manuscript Title
2 Biochemical conversion of fruit rind of Telfairia occidentalis (Fluted Pumpkin) and Poultry
3 manure
4
5 Authors
6 Dahunsi SO
7 Oranusi S
8 Efeovbokhan VE
9 Enyinnaya M
10 Zahedi S
11 Ojediran JO
12 Oluyori AP
13 Izebere JO
14
15 Affiliations
16 Dahunsi SO
17 1. Biomass and Bioenergy Group, Environment and Technology Research Cluster,
18 Landmark University, Nigeria
19 2. Biological Sciences Department, Landmark University, Omu-Aran, Nigeria
20 Oranusi S
21 1. Biological Sciences Department, Covenant University, Ota, Nigeria
22 Efeovbokhan VE
23 1. Chemical Engineering Department, Covenant University, Ota, Nigeria
24 Enyinnaya M
25 1. Biomass and Bioenergy Group, Environment and Technology Research Cluster,
26 Landmark University, Nigeria
27 Zahedi S
28 1. Department of Environmental Technology, Cadiz University, Faculty of Marine and
29 Environmental Sciences, Cadiz, Spain
30 Ojediran JO
31 1. Department of Agricultural and Biosystems Engineering, Landmark University, Omu-
32 Aran, Nigeria
33 Oluyori AP
34 1. Department of Physical Sciences, Landmark University, Omu-Aran, Nigeria
35 Izebere JO
36 1. Biological Sciences Department, Landmark University, Omu-Aran, Nigeria
37
38 Corresponding Author
39 Dahunsi SO
40 E-mail Address: [email protected]
41 Oranusi S
42 E-mail Address: [email protected];
43
44
45
PeerJ Preprints | https://doi.org/10.7287/peerj.preprints.26564v1 | CC BY 4.0 Open Access | rec: 22 Feb 2018, publ: 22 Feb 2018

46 Biochemical conversion of fruit rind of Telfairia occidentalis (Fluted Pumpkin) and Poultry
47 manure
48 Dahunsi S.O1,2*, Oranusi S3*, Efeovbokhan VE4, Enyinnaya M1, Zahedi S1,5, Ojediran JO1,6, Oluyori
49 AP7, Izebere JO2
50 1Biomass and Bioenergy Group, Environment and Technology Research Cluster,
51 Landmark University, Nigeria
52 2Biological Sciences Department, Landmark University, Omu-Aran, Nigeria
53 3Biological Sciences Department, Covenant University, Ota, Nigeria
54 4Chemical Engineering Department, Covenant University, Ota, Nigeria
55 5Department of Environmental Technology, Cadiz University, Faculty of Marine and
56 Environmental Sciences, Cadiz, Spain
57 6Department of Agricultural and Biosystems Engineering, Landmark University, Omu-Aran,
58 Nigeria
59 7Department of Physical Sciences, Landmark University, Omu-Aran, Nigeria
60 Corresponding address: [email protected];
62 Abstract
63 This study evaluated the potentials of Fluted pumpkin fruit rind and poultry manure for biogas
64 generation. Mechanical and thermo-alkaline pre-treatments were applied to two samples labelled
65 ‘O’ and ‘P’ while the third sample (Q) had no thermo-alkaline treatment. The physicochemical
66 characteristics of the substrates revealed richness in nutrients and mineral elements. The
67 modelling was done using the Response Surface Methodology and Artificial Neural Networks
68 and statistical prediction showed the process optimal conditions to be 30.02 o C, 7.90, 20.03
69 days, 5.94 g/kg and 4.01 g/kg for temperature, pH, retention time, total solids and volatile solids.
70 Using the above set values, the biogas yield was predicted to be 2614.1, 2289.9 and 1003.3 10-
71 3m3/kg VS for digestions ‘O’, ‘P’ and ‘Q’ respectively. The results showed that use of
72 combination of pre-treatment methods enhanced the biogas yield in the pre-treated substrates.
73 Analysis of the gas composition showed 66.5 ± 2.5 % Methane, 25 ± 1% Carbon dioxide; 58.5 ±
74 2.5 % Methane, 26 ± 1% Carbon dioxide; 54.5 ± 1.5 % Methane, 28 ± 2% Carbon dioxide for
75 the three experiments respectively. All the obtained values show the models had a high
76 predictive ability. However, the coefficient of determination (R2) for RSM was lower compared
77 to that of ANN which is an indication that ANNs model is more accurate than RSM model in
78 predicting biogas generation from the anaerobic co-digestion of rind of Fluted pumpkin and
79 poultry manure. The substrates should be further used for energy generation.
80 Keywords: Biogas, Methane, Microorganisms, Optimization, Pre-treatment, Rumen content
81
82 1. Introduction
83 The global increase in the generation of organic wastes from animal husbandry and other
84 agricultural activities is phenomenal, thus culminating in huge environmental pollution problems
85 in many nations (Zou et al., 2016). Also, the improper management of these wastes has been
86 reported to cause several environmental challenges such as water, land and air pollution and the
PeerJ Preprints | https://doi.org/10.7287/peerj.preprints.26564v1 | CC BY 4.0 Open Access | rec: 22 Feb 2018, publ: 22 Feb 2018

87 spread of pathogenic organisms which causes diverse diseases within the human population
88 (Fierro et al., 2016). However, the proper and adequate management/utilization of these solid
89 wastes can improve human’s living standards as well as ensuring environmental protecting via
90 the production of environmental-friendly biofuels and nutrient-rich digestate biofertilizers
91 (Dahunsi et al., 2016a, b).
92 A veritable way to achieve this is by employing anaerobic digestion (AD) systems which has the
93 capacity for reducing greenhouse gas (GHG) emissions by producing clean fuels such as biogas
94 (Dahunsi et al., 2017; Dahunsi, Oranusi & Efeovbokhan, 2017a, b, c). The AD technology for
95 methane generation has been reported to be a more efficient method for energy generation from
96 biomasses in contrast to other biological and thermo-chemical conversion systems (Zahedi et al.,
97 2016). AD is equally known to be particularly famous in developing countries where mostly the
98 produced gas is used as fuel for cooking while the digestate is used as fertilizer or soil
99 conditioner (Dahunsi & Oranusi, 2013; Abudi et al., 2016).
100 Biogas generation from the mono-fermentation of poultry manure has been extensively reported
101 in energy literature. However, the major challenges encountered were low C/N ratio and high
102 total ammonia levels of the substrate (Dalkilic & Ugurlu, 2015). It has therefore been opined that
103 for the best digestion and adequate gas yield, poultry dropping is better co-digested with other
104 high energy-yielding substrates such as grasses, silage and other green biomass (Pagliaccia et al.,
105 2016). The advantages of co-digestion over the conventional AD include adjustment/balances of
106 C/N ratio and nutrient, pH buffering capacity increase, decreases in ammonia toxicity and
107 accumulation of VFAs and upgrading of biochemical conditions for microbial proliferation
108 (Serrano et al., 2016).
PeerJ Preprints | https://doi.org/10.7287/peerj.preprints.26564v1 | CC BY 4.0 Open Access | rec: 22 Feb 2018, publ: 22 Feb 2018
109 T. occidentalis, Hook. f. (Fluted pumpkin) originated from Southern Nigeria (Akoroda et al.,
110 1990; Schippers, 2002) where it is regarded as an important leaf and seed vegetable all over
111 West and Central Africa. Its major dominance is in Nigeria, Ghana and Sierra Leone (Okoli &
112 Mgbeogwu, 1983). It is a large perennial plant of the family Cucurbitaceae with the ability to
113 grow to height of up to 20 m. It is known for climbing with the use of bifid and tendrils and
114 produces drooping and ellipsoid berry fruit (40 to 95 cm × 20 to 50 cm) usually weighing up to 6
115 kg, with 10 prominent ribs, pale green and covered with white bloom wax, fruit pulp yellow and
116 many embedded seeds (Eseyin, Sattar & Rathore, 2014). T. occidentalisis majorly cultivated in
117 different agricultural systems because of its nutritious leaves which have been shown to have
118 ≥21 % protein content, and is very high in vitamins, calcium, phosphorus and iron. Other uses of
119 the leaf include generation as concoction for anemic patients due to its hematinic abilities
120 (Eseyin, Sattar & Rathore, 2014). However, despite the huge biomass production from the fruit
121 rind of fluted pumpkin,it has remained grossly under-utilized in its different producing localities.
122 It is often thrown into the garbage bin or left in stock piles where they decay and serve as vehicle
123 for breeding and transmitting disease-causing microorganisms.
124 Thestructural and chemical properties of lignocellulosic biomass make them resistant/recalcitrant
125 to anaerobic degradation (Naran, Toor & Kim, 2016) and this factor is also responsible for their
126 limited commercial usage (Kim, Lee & Park, 2015; Menon et al., 2016). Application of
127 pretreatments therefore is a sure way to enhance the microbial degradation of feedstock before
128 anaerobic digestion (Monlau et al., 2015). Several pre-treatment methods have and are still being
129 investigated as a way of combating the initial recalcitrance often encountered in the usage of
130 lignocellulosic biomass. These methods includes ultrasound, high pressure and lysis, thermal,
131 ozonation, dilute acids, alkali, use of microorganisms, enzymes etc. Mechanical pre-treatments
PeerJ Preprints | https://doi.org/10.7287/peerj.preprints.26564v1 | CC BY 4.0 Open Access | rec: 22 Feb 2018, publ: 22 Feb 2018
132 are suitable for substrate particle size reduction and they are widely applied in the treatment of
133 animal wastes/manure, lignocellulosic materials and sludge from wastewater treatment plant
134 (Barakat et al., 2014). However, these methods are poor at pathogen removal/reduction besides
135 causing clogging of equipment (Zheng et al., 2014). Thermal pre-treatments are efficient at
136 pathogen reduction, high dewatering and viscosity reduction of digestate and these accounts for
137 their successful industrial application (Naran, Toor & Kim, 2016). Different temperature ranges
138 have been experimented for lignocellulosic biomass among which temperatures > 100o C
139 resulted in the pronounced/excessive lignin solubilisation and the subsequent production of
140 inhibitory phenolic compounds (Liu et al., 2012). More common is thermal treatment at
141 temperatures between 70 and 90o C and this has yielded positive results in terms of biogas
142 productionin several experiments (Appels et al., 2010; Liu et al., 2012; Dahunsi et al., 2017a, b,
143 c).
144 Preference for alkali pre-treatment is high in anaerobic digestion process due to the fact that a
145 successful digestion usually requires a pH buffering by increasing alkalinity (Naran, Toor &
146 Kim, 2016). In some recent studies, alkaline treatment was reported to enhance methane
147 production fromthe mono-digestion of substrates like sunflower stalks and sorghum forageand
148 from the co-digestion of Carica papayas fruit peels and poultry dropping, T. occidentalis fruit
149 peels and poultry manure, Chromolaena odorata and poultry manure and Arachis hypogaea
150 hulls (Liu et al., 2012; Dahunsi et al., 2016a, b; Dahunsi et al., 2017; Dahunsi, Oranusi &
151 Efeovbokhan, 2017a). Generally, chemical pre-treatments are not suitable for easily
152 biodegradable biomass due to their higher rate of degradation coupled with production and
153 accumulation ofvolatile fatty acids (VFA’s) which in turn may cause the total failure of
154 methanogenesis. The methods are however very idea for lignocellulosic biomass due to the
PeerJ Preprints | https://doi.org/10.7287/peerj.preprints.26564v1 | CC BY 4.0 Open Access | rec: 22 Feb 2018, publ: 22 Feb 2018
155 complex lignin-cellulose-hemicellulose matrix presents in them (Sambusiti et al., 2013). Usage
156 of combined treatment methods such as thermo-chemical,chemo-mechanical and others are also
157 widely reported especially in the mono-digestion of sludge from wastewater treatment plants and
158 these helped to improve on the limitations of single pre-treatment methods (Modenbach &
159 Nokes, 2012; Barakat et al., 2014; Yuan et al., 2016).
160 T. occidentalis is novel in biofuel research because this is the first reported study that established
161 the appropriate pre-treatment methods, optimized the important process parameters (Montingelli
162 et al., 2016), and assessed the mass and energy balance of the in co-digestion with poultry
163 manure as well as evaluating the economic feasibility of pre-treatments (Monlau et al., 2015).
164 Though biogas generation from the mono-digestion of T. occidentalis fruit rind has been
165 documented (Dahunsi et al., 2016b), there is gap in knowledge as the potentials of this biomass
166 for biogas generation in co-digestion alongside the standardization of its process parameters is
167 yet to be reported despite it abundance and year-round availability. In this research therefore, the
168 anaerobic co-digestion of Telfairia occidentalis fruit rind and poultry manure was carried out
169 after the application of different pre-treatment methods. Despite the massive biomass production
170 and year-round availability of fluted pumpkin, its fruit’s rind remains largely unused indicating
171 the need for a permanent and sustainable solution for this menace. Also, the optimization of the
172 process parameters, mass, energy and economic balances (Betiku et al., 2015; Dahunsi, Oranusi
173 & Efeovbokhan, 2017a) was evaluated in this research in order to set a future benchmark for the
174 use of fluted pumpkin’s fruit rind as a biomass for bioenergy production.
175
176
177
PeerJ Preprints | https://doi.org/10.7287/peerj.preprints.26564v1 | CC BY 4.0 Open Access | rec: 22 Feb 2018, publ: 22 Feb 2018

178 2. Materials and methods
179 2.1. Sample collection and digester design
180 Fruits of Telfairia occidentalis were collected from the farms at Landmark University, Omu-
181 Aran, Nigeria after which the seeds of the fruits were removed after cutting with a knife and the
182 rind to be used in this study was carefully separated and taken to the site of the experiment after
183 which it was air-dried to constant weight. Collection of fresh poultry manure was done at the
184 Teaching and Research Farms of the University while the Bovine rumen content to be used as
185 inoculums was obtained from the slaughter slab of the University’s cafeteria. Since the rind is a
186 lignocellulosic biomass and the need for pre-treatment arose, three different methods were
187 employed in order to establish the best pre-treatment procedure for the biomass prior to
188 anaerobic digestion. Pre-treatment of the first sample labelled ‘O’ was done using a combination
189 of mechanical, thermal and NaOH alkaline pre-treatment earlier reported (Dahunsi et al., 2016a,
190 b). To achieve the mechanical treatment of the biomass, a hammer mill was used for crushing
191 until a mesh size of ≤ 20 mm was obtained. The crushed biomass was then thermally treated (By
192 heating) in the Clifton, 88579, Nickel-Electro Ltd., England water bath at 80o C for an hour.
193 Prior to choosing the suitable temperature, duration of thermal treatment and quantity of alkali to
194 be used, the Central Composite Design (CCD) was used for the experimental design according
195 standard method (Dahunsi, Oranusi & Efeovbokhan, 2017a, b, c). In the design, a four-factor
196 model was used i.e. (i) Temperature for thermal pre-treatment (ii) Time/duration of thermal pre-
197 treatment (iii) Quantity of alkali for alkaline pre-treatment (iv) Time/duration for alkaline pre-
198 treatment. The pre-treatment temperature was varied between 70 and 200o C while a pre-
199 treatment time between 50 and 80 min was considered. For the quantity of alkali, a variation of 2
PeerJ Preprints | https://doi.org/10.7287/peerj.preprints.26564v1 | CC BY 4.0 Open Access | rec: 22 Feb 2018, publ: 22 Feb 2018
200 g/100 g TS to 5 g/100 g TS was used while a time variation of between 18 and 36 h was used for
201 the alkaline pre-treatment.
202 Immediately following the thermal procedure was alkaline pre-treatment with 3 g NaOH/100 g
203 TS at 55 o C for a 24 h period and at a solid loading of 35 g TS L-1. The second sample labelled
204 ‘P’ was pre-treated using the above mechanical and thermal methods but with KOH alkaline also
205 using 3 g KOH/100 g TS at 55o C for a 24 h. The choice of NaOH and KOH was premised on
206 earlier reports that among other widely used alkalis, they produced the best result for thermo-
207 alkaline pre-treatment (Li, Champagne & Anderson, 2015). The third sample ‘Q’ was treated
208 mechanically but without thermal and alkaline pre-treatment and served as control. The digester
209 earlier described (Alfa et al., 2014a; Dahunsi et al., 2016a, b) was used with the collection of
210 produced gas via liquid displacement method (Dahunsi & Oranusi, 2013; Alfa et al., 2014b).
211 2.2. Methane potential tests and experimental design
212 Prior to digestion, the potential methane production from the co-substrates was anaerobically
213 determined using already described standard method (Dahunsi et al., 2016a, b) while the same
214 method was used to evaluate the solid digestate for its residual methane content (Yap et al.,
215 2016). The CCD used in designing the pre-treatment procedures was also employed in the
216 experimental design of the anaerobic digestion of all the pre-treated and untreated samples of T.
217 occidentalis fruit rind and poultry manure due to the reported high efficiency of the model in
218 product optimization (Betiku et al., 2015; Zou et al., 2016). As shown in Tables S1 and S2
219 (Supplementary materials), 50 experimental runs were generated using the five-level-five-factors
220 design. Five importance process parameters: (Temperature (o C), pH, Retention time (days), Total
221 solids (g/kg) and Volatile solids (g/kg) were selected for the modelling and optimization and
222 each was designated as T1, T2 T3 T4and T5respectively. Temperature as reported in most previous
PeerJ Preprints | https://doi.org/10.7287/peerj.preprints.26564v1 | CC BY 4.0 Open Access | rec: 22 Feb 2018, publ: 22 Feb 2018
223 mesophilic digestion studies has been varied between 30 and 40o C (Naran, Toor & Kim, 2016).
224 Similarly, the common pH values reported in literature for anaerobic digestion ranges between
225 6.5 and 8 (Liao et al., 2016; Naran, Toor & Kim, 2016) while 20 to 30 days retention time is the
226 usual practice in most experiments (Naran, Toor & Kim, 2016; Saha et al., 2016). For the total
227 solids, a composition of < 15% and ≥ 4% has been severally proposed for liquid digestion
228 (Bayrakdar et al., 2016; Zhang et al., 2016). These were critically considered in the optimization
229 value ranges used in this study in order to obtain the optimal condition for the digestion of
230 Telfairia occidentalis fruit rind and poultry manure. The experimental data generated via the
231 CCD was also employed in the ANN module in which the determination of the optimum ANN
232 structure was done using mean square error (MSE). The higher coefficient R2 was also
233 determined and the effect of each optimized variable in the biogas yield was evaluated using
234 relative importance and 3-Dimensional curvature plots. The results of the ANN were then
235 compared with RSM while validation of both models was done under the set conditions as
236 predicted by the software (Dahunsi et al., 2016a, b).
237 2.3. Digestion
238 Anaerobic digestion was carried out for the three samples of T. occidentalis fruit rind in addition
239 with poultry manure. Since dilution of feedstock is a necessary step to eliminating ammonia
240 inhibition during digestion (Bayrakdar et al., 2016; Sun et al., 2016), T. occidentalis fruit rind
241 and poultry manure was mixed with water to form slurry at a solid loading of 35 g TS L-1 and
242 was introduced into each digester tank through an inlet pipe (Alfa et al., 2014a). This was carried
243 out for each of the pre-treated sample of T. occidentalis fruit rind and poultry manure. One (1) kg
244 of the rumen content was added to each of the pre-treated substrate before loading. In each case
245 after loading, the slurry occupied three quarter of the digester space and leaving one quarter
PeerJ Preprints | https://doi.org/10.7287/peerj.preprints.26564v1 | CC BY 4.0 Open Access | rec: 22 Feb 2018, publ: 22 Feb 2018
246 space for collection of produced gas. Measurement of daily biogas production was done daily,
247 while evaluation of microbial diversity and succession was done weekly. Temperature of the
248 digesters was measured twice daily for the average values while pH measurement was on weekly
249 basis using pH meter model pHS-2S, (SHANGHAI JINYKE REX, CHINA). Analyse of the
250 produced biogas for its constituents determination was done using a Gas Chromatography (GC)
251 (HP 5890, Avondale, USA) coupled with a Hayesep Q column (13m x 0.5m x 1/800) and a
252 flame ionization detector (FID) (Alfa et al., 2014b; Dahunsi et al., 2016a, b).
253 2.4. Analytical procedures
254 Substrates for anaerobic digestion must be adequately characterized prior to digestion (Lalak et
255 al., 2016). With this fact in mind, all the samples of T. occidentalis fruit rind, the poultry manure
256 and inoculums were analysed in order to quantify their important physical and chemical
257 parameters. These analyses were also carried out on the digestates at the end of the digestions.
258 The analyses were done in the Environmental Engineering laboratory (Civil Engineering
259 Department), Landmark University, Omu-Aran, Nigeria. Prior analyses, centrifugation was
260 carried out in order to separate the liquid from the solid portion in each sample and the latter was
261 used for all analyses except those of total phenol. All the chemical parameters were evaluated in
262 triplicates using the Palintest(R) Photometer 7500 (PHOT.1.1.AUTO.75) advanced digital-readout
263 colorimeter (Camlad, Cambridge, United Kingdom)which was operated at 0.5 absorbance and
264 450 nm wavelength as earlier described (Dahunsi et al., 2016a, b). These parameters include total
265 carbon, total nitrogen, total phosphorus, phosphates, sulphates, potassium, sodium, magnesium,
266 calcium, nitrates, ammonium, iron, copper, zinc, aluminium and manganese. The APHA, (2012)
267 method subsequently used by Dahunsi et al. [2014] was used to determine COD of all samples.
268 Determination of total and volatile solids was done using the SFS 3008 protocol of the Finnish
PeerJ Preprints | https://doi.org/10.7287/peerj.preprints.26564v1 | CC BY 4.0 Open Access | rec: 22 Feb 2018, publ: 22 Feb 2018
269 Standard Association, (1990). For TS, samples were dried at 105o C until constant weight was
270 achieved while for VS, known weights of the dried samples were ignited at 575 ± 25o C to
271 constant weight. Amicrotube test (Spectroquant, Merck) closely followed by a 4-aminoantipyrine
272 colorimetric measurement was used for total phenolic contents determination (Monlau et al.,
273 2015). A mild acid hydrolysis protocol with further quantification by the anthrone method was
274 used for soluble sugars i.e. sucrose and inulin extraction (Monlau et al., 2012). For the
275 quantification of structural carbohydrates i.e. glucose, xylose and arabinose anduronic acids i.e.
276 galacturonic and glucuronic acids, a strong acid hydrolysis protocol (Monlau et al., 2015;
277 Dahunsi et al., 2017a, b) was used. In determining the lignin content of the samples, 100 mg
278 dried samples was hydrolysed with 12 M H2SO4 for 1 h at room temperature. The solution was
279 then diluted to reach a 1.5 M final acid concentration and was kept at 100o C for 2 h before
280 centrifuging at 10000 rpm for 10 min. The Klason lignin content was thereafter determined as
281 the weight of the residue. The monomeric sugar content of the samples was used for cellulose
282 and hemicelluloses content determination (Barakat et al., 2015).
283 2.5. Preliminary energy balance and assessment of thermo-alkaline pre-treatment
284 efficiency
285 There is need to justify the investment into the thermo-alkaline pre-treatment applied in this
286 study. In doing this, an assessment was carried out to compare the energy generation and
287 consumption. The cost of obtaining heat energy and alkalis (NaOH and KOH) was compared
288 with the gain accrued from the sale of the additional energy obtained when thermo-alkaline pre-
289 treatments were applied to experiments ‘A’ and ‘B’. This helped to determine if the gain from
290 the sale of the extra gas (Obtained from the digestion of the pre-treated substrates) was enough to
291 cover the initial expenses on heat energy and alkalis. A simple computational equation was used
PeerJ Preprints | https://doi.org/10.7287/peerj.preprints.26564v1 | CC BY 4.0 Open Access | rec: 22 Feb 2018, publ: 22 Feb 2018
292 to first determine the thermal energy required (TER) in kWh t-1 TS for raising the temperature of
293 one ton TS of T. occidentalis fruit rind from 25 to 55 o C during pre-treatment. The equation is
294 shown thus:
295 TER = 𝑚 𝑥 𝑆ℎ ∗ (𝑄𝑓𝑖𝑛𝑎𝑙 ‒ 𝑄𝑖𝑛𝑖𝑡𝑖𝑎𝑙)296 297 (1)
298 where m(1000 kg) = mass of the mixture of T. occidentalis fruit rind and water (kg); Sh =
299 specific heat of water i.e. 4.18 kJ kg-1 C-1; Q initial (o C) is the initial temperature of substrate
300 i.e. 25 o C; Q final (o C) is the final temperature of substrate i.e. 55 o C. The United States
301 cost of NaOH and KOH were used.
302 2.6. Microbial enumeration
303 The aerobic organisms (Bacteria and fungi) associated with the fermenting substrates were
304 isolated and enumerated weekly using standard methods for total aerobic plate enumeration and
305 presumptive isolates confirmed with the aid of appropriate rapid Analytical Profile Index (API)
306 kits (BioMerieux, Leon, France) (Tsuneo, 2010; Dahunsi et al., 2016a, b). Members of the
307 genera Clostridium and other facultative anaerobes were serially isolated using specialized media
308 like Reinforced Clostridia medium, blood agar and Brain Heart Infusion agar in an anoxic
309 condition at 37º C for 5 to 7 days as earlier reported (Ayandiran et al., 2014). Confirmation of the
310 presumptive isolates was done with corresponding rapid API kits (Ayandiran & Dahunsi, 2017).
311 For members of the Achaea (Methanogens), a mineral-rich basal medium earlier described by
312 was compounded and used for the evaluation of members of the achaea following earlier
313 description by Ghosh, Jha & Vidyarthi (2014) was used. The medium was fortified with
314 minerals, trace elements and dyes and prepared according to standard prescription with resazurin
315 as the indicator dye (Stieglmeier et al., 2009).
3600
PeerJ Preprints | https://doi.org/10.7287/peerj.preprints.26564v1 | CC BY 4.0 Open Access | rec: 22 Feb 2018, publ: 22 Feb 2018

316 2.7. Statistical data analysis
317 The RSM was used to statistically analyse all data obtained from each of the three experiments
318 using the Design-Expert software version 9.0.3.1 (Stat-Ease Inc., Minneapolis, USA) while using
319 multiple regressions to fit the coefficient of the polynomial model of the responses. Fitting of the
320 model was afterwards done using the test of significance and analysis of variance (ANOVA) as
321 shown in the quadratic response model below:
322 𝑌 = 𝑏0+ 𝑘∑𝑖 = 1𝑏𝑖𝑋𝑖 + 𝑘∑𝑖 = 1𝑏𝑖𝑖𝑋2𝑖 + 𝑘∑𝑖 < 𝑗𝑏𝑖𝑗𝑋𝑖𝑋𝑗 + 𝑒 (2)323
324 Where: Y = the response variable; bo = intercept value; bi(i= 1, 2, k) = the first order model
325 coefficient; bij = the interaction effect; bii = the quadratic coefficients of Xi while e = the random
326 error.
327 3. Results
328 3.1. The effects of thermo-alkaline pre-treatment on the chemical composition of T.
329 occidentalis fruit rind
330 The results of the structural parameters analyses carried out on the raw T. occidentalis fruit rind,
331 the thermo-alkaline pre-treated and the untreated substrates used in the digestion process are
332 shown in Table 1. In both thermo-alkaline pre-treated samples i.e. ‘A’ and ‘B’, pronounced
333 solubilization of cellulose, hemicelluloses and klason lignin were reported compared to sample
334 ‘C’ which had no thermo-alkaline pre-treatment. After the pre-treatments, there were 56 and
335 43% reduction in cellulose concentration for experiments ‘A’ and ‘B’ respectively. For
336 hemicelluloses, the observed reductions were 47 and 32.28% while for klason lignin
337 concentration, reductions of 36 and 29% were reported respectively. There were changes in the
338 concentrations of uronic acids as reductions of 51.4 and 36.25 were reported respectively. For
339 the concentration of soluble sugars, there were increases of 68.03 and 65.18% as a result of the
340 pronounced solubilisation due to the application of thermo-alkaline pre-treatment to fruit rind of
PeerJ Preprints | https://doi.org/10.7287/peerj.preprints.26564v1 | CC BY 4.0 Open Access | rec: 22 Feb 2018, publ: 22 Feb 2018

341 T. occidentalis. Overall, higher solubilisation of components was reported in experiment ‘O’ as
342 against ‘P’.
343 3.2. Anaerobic digestion performance and stability
344 In the test for methane potential, production of biogas commenced on the 3rd, 4th and 7th
345 experimental days respectively in digestions ‘O’, ‘P’ and ‘Q’. Estimated average methane
346 content of the produced gas ranged from 64 to 68%, 58 to 61% and 53 to 58% respectively.
347 Table 1 further shows the results of samples of T. occidentals fruit rind and poultry manure
348 based on analyses of physical and chemical parameters prior to and after digestion and that of the
349 inoculum used. At the end of the digestion of the three samples, further solubilization of
350 structural components of the biomass was recorded. In experiment ‘A’, there were 36, 50.14, 31,
351 23 and 95.44% decrease in the values of cellulose, hemicelluloses, klason lignin, uronic acids
352 and phenol while the soluble sugar content increased by 40% at the end of the anaerobic
353 digestion. For experiment ‘B’, the record shows 31, 33.03, 19, 32 and 95% decrease in the values
354 of cellulose, hemicelluloses, klason lignin, uronic acids and phenol while the increase in soluble
355 sugar content was by 32.06%. Similarly, for experiment ‘C’, there was 20, 22.29, 25, 59 and
356 99% decrease in the values of cellulose, hemicelluloses, klason lignin, uronic acids and phenol
357 while soluble sugar content increased by 46% after the digestion. As shown in Figure 1, pH
358 values in all experiments remained at the slightly alkaline range throughout digestion thus
359 aligning with the values considered for experimental design (6.5 to 8). Similarly, temperature in
360 all experiments remained at the mesophilic range (30 to 40o C). In the chemical analyses results
361 after the termination of experiments, several parameters such as ash content, moisture content,
362 total nitrogen, total phosphorus, potassium, sulphate, phosphate, magnesium, manganese, iron,
363 zinc, aluminium and copper recorded increased values while others had reduction in values for
PeerJ Preprints | https://doi.org/10.7287/peerj.preprints.26564v1 | CC BY 4.0 Open Access | rec: 22 Feb 2018, publ: 22 Feb 2018

364 the three experiments. In terms of bulkiness, the table further revealed that the rumen content
365 alone was bulkier than the mixtures of T. occidentalis fruit rind and inoculums with respect to
366 total and volatile solids. Also, the results showed reduction in the average values for COD in all
367 experiments i.e. 67.29, 62.21 and 59.72 % reduction for experiment ‘O’, ‘P’ and ‘Q’
368 respectively. The raw T. occidentalis fruit rind recorded low C/N ratio with value of 10/1
369 whereas samples ‘A’, ‘B’ and ‘C’ had values of 17/1 and 16/1 and 18/1 respectively.
370 3.3. Volatile Fatty Acids (VFAs) dynamics and mass balance
371 Depending on the production and consumption rates, VFAs can accumulate in an anaerobic
372 system where they serve as inhibitors. In this study, the raw sample of T. occidentalis fruit rind
373 and poultry manure recorded low concentrations (0.06 g COD/g VS) for both acetate and
374 propionate. After the thermo-alkaline pretreatment, VFAS concentration of both treated samples
375 increased. For acetate, concentrations of 0.11 g COD/g VS and 0.10 g COD/g VS were recorded
376 for both experiments ‘A’ and ‘B’ while for propionate, values were 0.13 g COD/g VS and 0.11 g
377 COD/g VS. As the digestion progressed, accumulation of VFAs was also progressive till their
378 highest concentrations were recorded between 14th and 16th experimental days and this is
379 indicative of imbalance between the first two stage of anaerobic digestion i.e. hydrolysis and
380 acidogenesis and the last two stages i.e. acetogenesis and methanogenesis. Similarly,
381 accumulation of TVFAs reached its peak between the 14th and 15th experimental days in both
382 experiments ‘A’ and ‘B’ and the 13th day in experiment ‘C’. For concentration of Ammonia
383 (NH3), the peak was reached between the 13th and 16th days of digestion in the three experiments.
384
385
PeerJ Preprints | https://doi.org/10.7287/peerj.preprints.26564v1 | CC BY 4.0 Open Access | rec: 22 Feb 2018, publ: 22 Feb 2018

386 3.4. Optimization of pretreatment and biogas generation
387 According to the experimental design used for the thermo-alkaline pre-treatment procedure in
388 this study, the optimal condition for the treatment was: temperature of 80 o C, thermal treatment
389 duration of 60 min, alkali concentration of 3g/100 g TS and alkaline treatment for 24 hr. Among
390 all the tested experimental runs, the above stated condition gave the highest biogas yield of
391 1659.9010-3m3/kg VS in the mono-digestion of Telfairia occidentalis fruit rind as shown in table
392 2. Production of biogas in the three experiments commenced from between the 2nd and 4th, 5th
393 and 7th and 7th and 9th days in digestions ‘O’, ‘P’ and ‘Q’. Steady production continued till
394 between the 17th and 26th day before gradual decline till the end of the experiments as shown in
395 Figure 2. Table 4 (Supplementary materials) shows the biogas generation design matrix for both
396 RSM and ANNs with five independent variables using actual values. As shown in the table, the
397 most desired actual/experimental biogas yield for digestion ‘A’ was 2539.2 10-3m3/kg VS which
398 was higher than the 2239.2 10-3m3/kg VS and 0995.5 10-3m3/kg VS values obtained for
399 digestions ‘P’ and ‘Q’ respectively. The optimal value of each independent factor selected for the
400 biogas generation was obtained by solving the regression equation with the aid of the Design-
401 Expert software. The optimal value of each variable employed in this process was statistically
402 predicted as temperature (T1) = 30.02o C, pH (T2) = 7.90, retention time (T3) = 20.03 days, total
403 solids (T4) = 5.94 g/kg and volatile solids (T5) = 4.01 g/kg. Using these values, the biogas yield
404 was predicted to be 2614.1, 2289.9 and 1003.3 10-3m3/kg VS for digestions ‘O’, ‘P’ and ‘Q’
405 respectively as shown in Table 3. For verification of the predictive abilities of the RSM and
406 ANNs model, the optimal values were applied to three independent replicates for each of
407 experiment ‘O’, ‘P’ and ‘Q’, and the average biogas yield was 2612.58, 2245.71 and 0989.7 10-
408 3m3/kg VS, all of which are within the range of the predicted values. The composition of the
PeerJ Preprints | https://doi.org/10.7287/peerj.preprints.26564v1 | CC BY 4.0 Open Access | rec: 22 Feb 2018, publ: 22 Feb 2018
409 produced biogas as shown by chromatography was within the range of 66.5 ± 2.5% Methane, 25
410 ± 1% Carbon dioxide; 58.5 ± 2.5% Methane, 26 ± 1% Carbon dioxide; 54.5 ± 1.5% Methane, 28
411 ± 2% Carbon dioxide for experiments ‘O’, ‘P’ and ‘Q’ respectively.
412 3.5. Microbial composition
413 Aerobic bacteria implicated at the early period of anaerobic digestion in all three experiments
414 include Bacillus pantothenticus, Bacillus licheniformis, Bacillus stearothermophilus, Serratia
415 ficaria, Serratia plymuthica and Proteus vulgaris. Fungal isolates include Aspergillus niger,
416 Mucor, Rhizopus stolonifer and Penicillum. Facultative anaerobes include Fusobacterium
417 mortiferum, Bacteroides fragilis, Clostridium clostridioforme, Clostridium histolytica,
418 Clostridium spp, Clostridium barattii and Porphyromonas assacharolytica while methanogens of
419 the genera Methanosarcinales, Methanosaeta and Methanomicrobiales were implicated. The
420 highest count for aerobic bacteria was 2.6 x 10¹¹cfu/mL recorded in the first week that of fungi
421 was 1.5 x 10⁸cfu/mL also recorded in the first week. For the anaerobes, the highest count of 1.9 x
422 1011cfu/mL was recorded in the fourth week while that of methanogens was 2.1 x 10¹²cfu/mL
423 obtained in the sixth week of digestion.
424 3.6. Stoichiometry and mass balance
425 The mass balances of all the digested samples of T. occidentalis fruit rind and poultry manure in
426 terms of volatile VS degradation are shown in table 4. In computing the mass balance, ‘‘T.
427 occidentalis fruit rind’’ was considered to be the input variable while the ‘‘methane’’, ‘‘carbon
428 dioxide’’ contents of the gas and ‘‘the anaerobic digestate’’ were the output variables. In all three
429 digestions, mass balances of 39, 31 and 12 were recorded. Also, experiments ‘O’ and ‘P’ had
430 69.23 and 61.29% higher mass balance than experiment ‘Q’. In terms of VS degradation, the
PeerJ Preprints | https://doi.org/10.7287/peerj.preprints.26564v1 | CC BY 4.0 Open Access | rec: 22 Feb 2018, publ: 22 Feb 2018

431 three experiments recorded VS reduction of 51, 41 and 21% respectively. Also, there were 59
432 and 49 higher VS removal in experiments ‘O’ and ‘P’ respectively over ‘Q’.
433 3.7. RSM optimization of biogas data
434 Table S1 (Supplementary materials) shows all the five factors and their levels for response
435 surface for biogas generation. Similarly, Table S2 (Supplementary materials) show the
436 experimental design matrix by the CCD for the five-level-five-factor response surface study for
437 biogas generation. The table reveals the experimentally observed and predicted yields as well as
438 the residual values while the coefficients of the full regression model equation and their
439 statistical significance were also determined. Table 5 shows the results of test of significance and
440 that of the second-order response surface model’s fit as ANOVA for every regression coefficient.
441 Considering the F-values and their corresponding low p-values, a good number of the model
442 terms are significant with p< 0.05. In experiments ‘O’, ‘P’ and ‘Q’, the Model F-values of 4.03,
443 4.06 and 4.08 all shows significance of the model. Similarly, the ‘Adequate Precision’ values of
444 8.009, 9.017 and 10.006 for experiments ‘O’, ‘P’ and ‘Q’ suggests that the model is suitable for
445 the design.
446 The goodness of fit of the model was checked by the coefficient of determination (R2) and the
447 "Lack of Fit” F-values of 3.36, 3.52 and 3.44 obtained in the three experiment respectively
448 implied that the “Lack of Fit” are not significant. This further substiantiated the accuracy of the
449 model since non-significant “Lack of fit” values are appropriate for experimental prediction. The
450 relationship/interaction between the biogas yield (Y) and the coded values of the five variable i.e.
451 temperature (T1), pH (T2), retention time (T3), total solids (T4) and volatile solids (T5) was
452 described by a regression model equation 3 below:
453
PeerJ Preprints | https://doi.org/10.7287/peerj.preprints.26564v1 | CC BY 4.0 Open Access | rec: 22 Feb 2018, publ: 22 Feb 2018
454 Y =1770.17 + 13.16T1- 2.51T2-13.62T3 +50.41T4 +3.64T5+15.19T1T2+ (3)
455 71.23T1T3+52.31T1T4 +14.24T1T5 -9.47T2T3- 26.60T2T4-25.73T2T5+0.23T3T4
456 +17.33T3T5-1.79T4T5 +21.42T12+ 16.89T2
2- 20.48T32-55.72T4
2+7.04T52
457
458 Where Y = Biogas yield (m3/kg VS)
459
460 When the above equation was represented in figure forms, the three-dimensional (3D) plots
461 formed are shown in Figure 3(a-j). Figure 4 shows the importance level of each independent
462 variable as shown by the ANNs’ architecture (Experiment ‘O’).
463 4. Discussion
464 The use of mechanical grinding, thermal and alkaline (NaOH and KOH) for pre-treatment
465 brought about enormous solubilisation of all tested structural components of the biomass (T.
466 occidentalis fruit rind). Similarly, the optimized conditions obtained via the CCD contributed to
467 the breakdown of these structural materials and the subsequent high biogas yield obtained
468 especially in the thermo-alkaline treated samples. Cellulose and hemicellulose breakdown as a
469 result of thermo-alkaline pre-treatment (steam explosion, dilute acids, ammonia fibre expansion,
470 ionic liquids, thermal, thermo-alkaline, alkaline thermo-mechanical and the fenton process)
471 applications is well reported in literature and such treatments usually led to higher biogas yield
472 (Dahunsi et al., 2016a, b; Mahdy, Ballesteros & Gonzalez-Fernandez, 2016; Mustafa, Poulsen &
473 Sheng, 2016; Tufaner & Avsar, 2016). Similarly, lignin solubilization as a result of pre-treatment
474 application to different biomasses has been reported. Notable is the work of Naran, Toor & Kim
475 (2016) where high lignin breakdown was reported when NaOH alkaline-thermal treatment was
476 applied. Similar results have been obtained from other studies (Sambusiti et al., 2013; Monlau et
477 al., 2015; Dahunsi et al., 2017a, b, c). Another major observation caused by the application of
478 thermo-alkaline pre-treatments in this study was the higher soluble sugar yield in the pre-treated
479 experiments and this compares favourably with the results of Monlau et al. (2015). These sugars
PeerJ Preprints | https://doi.org/10.7287/peerj.preprints.26564v1 | CC BY 4.0 Open Access | rec: 22 Feb 2018, publ: 22 Feb 2018

480 are beneficial to acidogenic and hydrolytic bacteria who utilize them during substrate
481 degradation and this usually boost microbial population, activities as well as diversity. When
482 these happen, intermediate acids are produced serving as raw materials for the subsequent
483 acetogenesis and methanogenesis stages of digestion. Production of phenols was another
484 evidence of structural breakdown in this study and this is further evident in the concentrations of
485 these compounds recorded in experiments ‘A’ and ‘B’. Such trend has been reported with the
486 application of alkaline pre-treatment (Monlau et al., 2015; Dahunsi et al., 2017a, c). The 17 and
487 16 C/N ratios obtained for experiments ‘A’ and ‘B’ after pre-treatment further confirms the
488 potency of the method for treating the biomass and this agree with the 17 C/N obtained by
489 Degueurce et al. (2016) from the digestion of spent cow beddings.
490 The pH range recorded in this study is in tandem with previous studies which reported values
491 between 6.5 and 8 as the most suitable for efficient methanogenesis (Dahunsi & Oranusi, 2013;
492 Dahunsi et al., 2016a, b; Zahedi et al., 2016). Similarly, temperature has been reported to be an
493 important factor in anaerobiosis especially for the anaerobic bacteria to function efficiently (Jain
494 et al., 2015; Mao et al., 2015). All the three samples of T. occidentalis fruit rind used in this
495 study were shown to be rich in nutrients and mineral elements required for microbial growth and
496 functioning in a fermentation process as shown by the analysis in Table 2. The nutrient status of
497 the three anaerobic digestates were found to be higher after the various digestion compared to the
498 levels prior to digestion with digestion ‘O’ being the highest followed by ‘P’ and ‘Q’ was the
499 least. The increased nutrient content of the three anaerobic digestates suggests the usefulness of
500 such preparation as efficient fertilizers in order to increase fertility of soils as well as enhancing
501 yield of crop. In most cropping systems in the tropics, there is over-dependence of the use of
502 chemical inorganic fertilizers which has brought untold environmental hardships such as
PeerJ Preprints | https://doi.org/10.7287/peerj.preprints.26564v1 | CC BY 4.0 Open Access | rec: 22 Feb 2018, publ: 22 Feb 2018

503 depletion/loss of soil nutrients, pollution of soil water, toxicity to soil microorganisms,
504 eutrophication and many others. One of the ways to overcome these challenges is the use of
505 organic manure/fertilizer such as produced in this study. The possibility of using nutrient-rich
506 anaerobic digestates as biofertilizers or soil conditioners has been demonstrated in few studies
507 while many others are ongoing (Alfa et al., 2013a, b; Pivato et al., 2015; Sun et al., 2015). In this
508 study, the COD removal was higher than was reported in previous anaerobic digestion studies
509 (Alfa et al., 2014b; Dahunsi et al., 2016a, b). The Clostridium species which dominated the
510 microflora in the three digestions are well reported in anaerobic digestions processes. They are
511 known to converts acids to acetone and other intermediate products which will usually serve as
512 raw materials for the methanogenesis stage of digestion. Similarly, the diversity and high
513 population of these organism was instrumental to the high biomass degradation and subsequent
514 biogas generation obtained in this study especially in the thermo-alkaline pretreated substrates.
515 Members of the genera Methanosarcinales, Methanosaeta and Methanomicrobiales are also very
516 important and well reported in anaerobic digestion systems ecause they are efficient in
517 converting acetone and other products to methane in the metanogenesis stage. Abundance of
518 microbial species and population has been reported to enhance enormous substrate degradation
519 ultimately leading to higher biogas production (Dahunsi et al., 2017a, b, c). The quantity and
520 quality (methane contents) of the biogas produced in this study is higher than those from other
521 substrates previously utilized in anaerobic digestions (Dahunsi & Oranusi, 2013; Alfa et al.,
522 2014b). The highest biogas yield obtained in experiment ‘O’ could be as a result of the combined
523 use of mechanical, thermal and alkaline (NaOH) pretreatments and this proved more effective in
524 the substrate degradation than experiment ‘P’ where KOH was used instead and this was also
525 better than experiment ‘Q’ which was mechanically treatment only. Application of combination
PeerJ Preprints | https://doi.org/10.7287/peerj.preprints.26564v1 | CC BY 4.0 Open Access | rec: 22 Feb 2018, publ: 22 Feb 2018

526 of pretreatments as earlier proposed therefore is a promising alternative to achieving biomass
527 degradation and higher biogas generation (Dahunsi et al., 2016a, b; Mthews, Grunden & Pawlak,
528 2016; Dahunsi et al., 2017). This already reflected in the results of the stoichiometry and mass
529 balance i this study which shows pronounced substrate interactionsand VS consumption which
530 was highest in experiment ‘A” followed by ‘B’ and then ‘C’.
531 Considering the concentrations of VFAs reported in this study,there is an indication of
532 pronounced synergy between the two last stages of digestion i.e. acetogenesis and
533 methanogenesis which is caused by the high population and diversity of anaerobes especially the
534 Clostridium species coupled with favorable pH and temperature (Riggio et al., 2017). These
535 bacteria are efficient in amino acids degradation leading to the release of acids and ammonia as
536 end-products of the acetogenesis stage (Degueurce et al., 2016). The concentration of ammonia
537 reported in this study shows there was buffering of process leading to the maintenance of neutral
538 pH and process stability.
539 The regression model used in this study was proved to be significant by the low p-value (0.0183,
540 0.0150 and 0.0190) of the model F-value with in experiments ‘O’, ‘P’ and ‘Q’) respectively. The
541 goodness of fit of the model was checked by the coefficient of determination (R2). Pei et al.
542 (2014) have reported that R2 value should be at least 0.80 for a model to be fit. In this study, the
543 R2 value of 0.8996, 0.9067 and 0.8993 showed that the sample variation of 89.96, 90.67 and
544 89.93% obtained for biogas yield in experiments ‘O’, ‘P’ and ‘Q’ is a function of the five
545 independent variables (T1, T2, T3, T4, and T5) employed in the modelling. The ‘Adequate
546 Precision’ is a measure of the signal to noise ratio and a value greater than 4 is desirable for the
547 good fitting of a model. In this study, values of 8.009, 9.017 and 10.006 were obtained in
PeerJ Preprints | https://doi.org/10.7287/peerj.preprints.26564v1 | CC BY 4.0 Open Access | rec: 22 Feb 2018, publ: 22 Feb 2018
548 experiments ‘O’, ‘P’ and ‘Q’ which further validated the suitability of the model. The ‘Lack-of-
549 fit’ values of 0.174, 0.169 and 0.176 obtained for the three experiments were not significant and
550 this means that the model is very suitable in theoretical prediction of the biogas generation from
551 the anaerobic co-digestion of T. occidentalis fruit rind and poultry manure since a non-significant
552 lack of fit is desirable.
553 All the 3D plots for the expression of the model’s regression equation revealed different
554 curvatures’ nature brought about by the variable interactions. Plots a, d, g and i of RSM showed
555 low interactions between the concerned variables; plots b, e and h displayed moderate
556 interactions while plots c, f and j all showed pronounced relationships between T1, T2, T3, T4, and
557 T5. However, all the ANNs plots showed pronounced interactions revealing that ANNs model
558 accommodated more variable interactions than RSM and this phenomenon had earlier been
559 documented (Betiku et al., 2015). In all, the ANNs model proved more accurate than RSM with
560 respect to the roots mean squared error (RSME) and the coefficient of determination (R2) values
561 in all experiments.
562 The combined heat and power (CHP) system was used to assess the energy balance as well as the
563 economic feasibility of thermo-alkaline pre-treatment application to T. occidentalis fruit rind. In
564 doing this, a 50% thermal efficiency and 35% electrical efficiency was adopted as shown in table
565 6. In using this system, the possibility that the profit obtained from the sale of the extra thermal
566 and electrical energies will be sufficient to replenish the cost of procuring heat for thermal pre-
567 treatment and chemicals (NaOH and KOH) used for the alkaline pre-treatment. In determining
568 the TER for thermo-alkaline pre-treatment of T. occidentalis fruit rind therefore, the energy
569 needed to raise the temperature of 35 g TS L-1 T. occidentalis fruit rind mixture from 25 to 55 o C
570 was determined using 4.18 kJ kg-1o C-1 as the specific heat of water in order to evaluate the
PeerJ Preprints | https://doi.org/10.7287/peerj.preprints.26564v1 | CC BY 4.0 Open Access | rec: 22 Feb 2018, publ: 22 Feb 2018

571 specific heat of the mixture while heat loss was neglected (Zupancic & Ros, 2003). The result
572 show that for experiment ‘O’, the 1147 kWh t-1 TS thermal energy gain at a solid loading of 35 g
573 TS L-1 was higher than the TER for the thermo-alkaline pre-treatment which was 1088 kWh t-1
574 TS when heat and NaOH were used. For experiment ‘P’ the thermal energy gain of 1049 kWh t-1
575 TS was lower than the TER of 1109 kWh t-1 TS needed for pre-treatment using heat and KOH.
576 Earlier researches have proposed the use of heat exchanger during digester heating and/or
577 biomass pre-treatment as a way of boosting up to 80% heat recovery (Dhar, Nakhla & Ray,
578 2012; Zabranska et al., 2006).
579 For the electrical energy assessment, only the electric energy used for the substrate mixing was
580 considered while the energy used during mechanical grinding was neglected since this was also
581 done for experiment ‘Q’ which had no thermo-alkaline pre-treatment (Menardo, Airoldi &
582 Balsari, 2012). The result show that the estimated net electrical energies at a solid loading of 35
583 g TS L-1was 430 kWh t-1 TS and 223 kWh t-1 TS for experiments ‘O’ and ‘P’ respectively. The
584 possibility of injecting these energies into the energy grid or being sold for a fixed cost is high as
585 this will generate extra income and also compensate for the resources used for the pre-treatment.
586 In accounting for the economic value of the used alkalis, the 335 and 100 dollars ton -1 US cost
587 of NaOH and KOH were used.
588 Table 7 shows heat balance of different biomasses anaerobically digested with prior thermal and
589 thermo-alkaline pre-treatments. In all, substrate degradation and higher biogas generation were
590 achieved due to the pre-treatments. Most of these researchers studied ways of minimizing the
591 TER for carrying out pre-treatments and reported that the rate of solid loading and heat recovery
592 from pre-treatment are the major factors responsible for a high TER why some of the studies
593 emphasised the use of low solid loadings (Fdz-Polanco et al., 2008; Monlau et al., 2013; Passos,
PeerJ Preprints | https://doi.org/10.7287/peerj.preprints.26564v1 | CC BY 4.0 Open Access | rec: 22 Feb 2018, publ: 22 Feb 2018

594 Garcia & Ferrer, 2013), others supported high solid loading of 15% solids w/w or above when
595 thermo-alkaline pre-treatments are employed (Schell et al., 2003; Modenbach & Nokes, 2012).
596 Conclusion
597 As shown in this study, the richness of the co-substrates (T. occidentalis fruit rind and poultry
598 manure) in terms of minerals and elemental composition showed them as suitable materials for
599 biogas and biofertilizer generation. Result of optimization and modeling study showed that both
600 RSM and ANNs models are suitable and very efficient in predicting gas production from T.
601 occidentalis fruit rind and poultry manure. It was equally showed that the combination of
602 mechanical and thermo-alkaline pretreatment produced higher biogas quantity and methane
603 content as well as higher mass, energy and economic balances. T. occidentalis is a crop that is
604 well adapted to several geographical locations especially in the tropics whereas poultry manure
605 is generally available as an environmental scourge in most locations around the globe. Therefore,
606 further usage of T. occidentalis fruit rind and poultry manure as energy feedstock is proposed.
607 Acknowledgement
608 Authors are grateful to our students who assisted in the project.
609 Conflict of interest
610 Authors declare no conflict of interest.
611 References
612 Abudi ZN, Hu Z, Sun N, Xiao B, Raja N, Liu C, Guo D. 2016. Batch anaerobic co-digestion of
613 OFMSW (organic fraction of municipal solid waste), TWAS (thickened waste activated sludge)
614 and RS (rice straw): Influence of TWAS and RS pretreatment and mixing ratio. Energy 107:
615 131-140.
616
617 Akoroda MO, Ogbechie-Odiaka NI, Adebayo ML, Ugwo OE, Fuwa B. 1990. Flowering,
618 pollination and fruiting in fluted pumpkin (Telfairia occidentalis).Scientia Horticulturae 43:
619 197–206.
PeerJ Preprints | https://doi.org/10.7287/peerj.preprints.26564v1 | CC BY 4.0 Open Access | rec: 22 Feb 2018, publ: 22 Feb 2018

620 Alfa IM, Adie DB, Igboro SB, Oranusi US, Dahunsi SO, Akali DM. 2014. Assessment of
621 biofertilizer quality and health implications of anaerobic digestion effluent of cow dung and
622 chicken droppings. Renewable Energy 63: 681-686.
623 Alfa IM, Adie DB, Iorhemen OT, Okafor CC, Ajayi, SA, Dahunsi SO. 2013. Assesment of
624 mesophilic co-digestion of cow dung with lemon grass for biogas production. Nigerian Journal
625 of Technology 32(3): 478–484.
626
627 Alfa IM, Dahunsi SO, Iorhemen OT, Okafor CC, Ajayi SA. 2014. Comparative evaluation of
628 biogas production from poultry droppings, cow dung and lemon grass. Bioresource Technology
629 157: 270–277.
630 Alfa IM, Otun JA, Igboro SB, Dahunsi SO, Ajayi SA, Akali DM. 2013. Between and betwixt
631 soil fertility improvement and disease transmission: an assessment of the suitability of anaerobic
632 digestion effluent for direct application as fertilizer. Nigerian Journal of Technology 32(3): 492–
633 497.
634
635 Appels L, Degreve J, Bruggen BV, Impe JV, Dewil R. 2010. Influence of low temperature
636 thermal pre-treatment on sludge solubilization, heavy metal release and anaerobic digestion.
637 Bioresource Technology 101: 5743–5748.
638
639 Ayandiran TA, Ayandele AA, Dahunsi SO, Ajala OO. 2014. Microbial assessment and
640 prevalence of antibiotic resistance in polluted Oluwa River, Nigeria. Egyptian Journal of Aquatic
641 Research 40: 291-299.
642
643 Ayandiran TA, Dahunsi SO. 2017. Microbial evaluation and occurrence of antidrug multi-
644 resistant organisms among the indigenous Clarias species in River Oluwa, Nigeria. Journal of
645 King Saud University– Science 29: 96-105.
646
647 Barakat A, Chuetor S, Monlau F, Solhy A, Rouau X. 2014. Eco-friendly dry chemo-mechanical
648 pretreatments of lignocellulosic biomass: Impact on energy and yield of the enzymatic
649 hydrolysis. Applied Energy 113: 97–105.
650
651 Barakat A, Monlau F, Solhy A, Carrere H. 2015. Mechanical dissociation and fragmentation of
652 lignocellulosic biomass: Effect of initial moisture, biochemical and structural proprieties on
653 energy requirement. Applied Energy 142: 240–246.
654
655 Bayrakdar A, Molaey R, Sürmeli RO, Sahinkaya E, Çalli B. 2016. Biogas production from
656 chicken manure: Co-digestion with spent poppy straw. International Biodeterioration and
657 Biodegradation doi.org/10.1016/j.ibiod.2016.10.058.
658
659 Betiku E, Okunsolawo SS, Ajala SO, Odedele OS. 2015. Performance evaluation of artificial
660 neural network coupled with generic algorithm and response surface methodology in modeling
661 and optimization of biodiesel production process parameters from shea tree (Vitellaria paradoxa)
662 nut butter. Renewable Energy 76: 408-417.
663
PeerJ Preprints | https://doi.org/10.7287/peerj.preprints.26564v1 | CC BY 4.0 Open Access | rec: 22 Feb 2018, publ: 22 Feb 2018
664 Dahunsi SO, Oranusi S, Owolabi JB, Efeovbokhan VE. 2016. Comparative biogas generation
665 from fruit peels of Fluted Pumpkin (Telfairia occidentalis) and its optimization. Bioresource
666 Technology 221: 517-525.
667
668 Dahunsi SO, Oranusi S, Owolabi JB, Efeovbokhan VE. 2016. Mesophilic anaerobic co-digestion
669 of poultry droppings and Carica papaya peels: Modelling and process parameter optimization
670 study. Bioresource Technology 216: 587-600.
671 Dahunsi SO, Oranusi US. 2013. Co-digestion of food waste and human excreta for biogas
672 production. British Biotechnology Journal 3(4): 485-499.
673 Dahunsi SO, Owamah HI, Ayandiran TA, Oranusi SU. 2014. Drinking water quality and public
674 health of selected towns in South Western Nigeria. Water Quality Exposure and Health 6: 143-
675 153.
676 Dahunsi SO, Oranusi S, Efeovbokhan VE. 2017. Bioconversion of Tithonia diversifolia
677 (Mexican Sunflower) and Poultry Droppings for Energy Generation: Optimization, Mass and
678 Energy Balances, and Economic Benefits. Energy and Fuels 31: 5145−5157.679
680 Dahunsi SO, Oranusi S, Efeovbokhan VE. 2017. Cleaner energy for cleaner production:
681 Modeling and optimization of biogas generation from Carica papayas (Pawpaw) fruit peels.
682 Journal of Cleaner Production 156: 19-29.
683
684 Dahunsi SO, Oranusi S, Efeovbokhan VE. 2017. Optimization of pretreatment, process
685 performance, Mass and Energy balance in the anaerobic digestion of Arachis hypogaea (Peanut)
686 hull. Energy Conversion and Management 139: 260–275.
687
688 Dahunsi SO, Oranusi S, Owolabi JB, Efeovbokhan VE. 2017. Synergy of Siam weed
689 (Chromolaena odorata) and poultry manure for energy generation: Effects of pretreatment
690 methods, modeling and process optimization. Bioresource Technology 225: 409–417.
691
692 Dalkılıc K, Ugurlu A. 2015. Biogas production from chicken manure at different organic loading
693 rates in a mesophilic-thermopilic two stage anaerobic system. Journal of Biosciences and
694 Bioengineering 120(3): 315-322.
695
696 Degueurce A, Tomas N, Le Roux S, Martinez J, Peu P. 2016. Biotic and abiotic roles of leachate
697 recirculation in batch mode solid-state anaerobic digestion of cattle manure. Bioresource
698 Technology 200: 388–395.
699
700 Dhar BR, Nakhla G, Ray MB. 2012. Techno-economic evaluation of ultrasound and thermal
701 pretreatments for enhanced anaerobic digestion of municipal waste activated sludge. Waste
702 Management 32: 542–549.
703
704 Eseyin OA, Sattar MA, Rathore HA. 2014. A Review of the Pharmacological and Biological
705 Activities of the Aerial Parts of Telfairia occidentalis Hook. f. (Cucurbitaceae). Tropical
706 Journal of Pharmacy Research 13(10): 1761-1769.
PeerJ Preprints | https://doi.org/10.7287/peerj.preprints.26564v1 | CC BY 4.0 Open Access | rec: 22 Feb 2018, publ: 22 Feb 2018

707 Fdz-Polanco F, Velazquez V, Perez-Elvira I, Casas C, del Barrio D, Cantero FJ, Fdz-Polanco F,
708 Rodriguez P, Panizo L, Serra J, Rouge P. 2008. Continuous thermal hydrolysis and energy
709 integration in sludge anaerobic digestion plants. Water Science and Technology 57(8): 1221–
710 1226.
711
712 Fierro J, Martinez EJ, Rosas JG, Fernández RA, López R, Gomez X. 2016. Co-Digestion of
713 Swine Manure and Crude Glycerine: Increasing Glycerine Ratio Results in Preferential
714 Degradation of Labile Compounds. Water Air and Soil Pollution 227: 78. DOI 10.1007/s11270-
715 016-2773-7.
716
717 Finnish Standard Association SFS 3008. 1990. Determination of total residue and total fixed
718 residue in water, sludge and sediment.
719
720 Ghosh S, Jha P, Vidyarthi AS. 2014. Unravelling the microbial interactions in coal organic
721 fermentation for generation of methane—A classical to metagenomic approach. International
722 Journal of Coal Geology 125: 36–44.
723
724 Jain S, Jain S, Wolf IT, Lee J, Tong YW. 2015. A comprehensive review on operating
725 parameters and different pretreatment methodologies for anaerobic digestion of municipal solid
726 waste. Renewable and Sustainable Energy Reviews 52: 142–154.
727
728 Kim D, Lee K, Park LY. 2015. Enhancement of biogas production from anaerobic digestion of
729 waste activated sludge by hydrothermal pre-treatment. International Biodeterioration and
730 Biodegradation 101: 42-46.
731
732 Lalak J, Kasprzycka A, Martyniak D, Tys J. 2016. Effect of biological pretreatment of
733 Agropyrone longatum ‘BAMAR’ on biogas production by anaerobic digestion. Bioresource
734 Technology 200: 194–200.
735
736 Li C, Champagne P, Anderson BC. 2015. Enhanced biogas production from anaerobic co-
737 digestion of municipal wastewater treatment sludge and fat, oil and grease (FOG) by a modified
738 two-stage thermophilic digester system with selected thermo-chemical pre-treatment. Renewable
739 Energy 83: 474-482.
740
741 Liao X, Li H, Zhang Y, Liu C, Chen Q. 2016. Accelerated high-solids anaerobic digestion of
742 sewage sludge using low-temperature thermal pretreatment. International Biodeterioration and
743 Biodegradation 106: 141-149.
744
745 Liu X, Wang W, Gao X, Zhou Y, Shen R. 2012. Effect of thermal pretreatment on the physical
746 and chemical properties of municipal biomass waste. Waste Management 32: 249–255.
747
748 Mahdy A, Ballesteros M, González-Fernández C. 2016. Enzymatic pretreatment of Chlorella
749 vulgaris for biogas production: Influence of urban wastewater as a sole nutrient source on
750 macromolecular profile and biocatalyst efficiency. Bioresource Technology 199: 319–325.
751
PeerJ Preprints | https://doi.org/10.7287/peerj.preprints.26564v1 | CC BY 4.0 Open Access | rec: 22 Feb 2018, publ: 22 Feb 2018
752 Mao C, Feng Y, Wang X, Ren G. 2015. Review on research achievement of biogas from
753 anaerobic digestion. Renewable and Sustainable Energy Reviews 45: 540–555.
754
755 Mathews SL, Grunden AM, Pawlak J. 2016. Degradation of lignocellulose and lignin by
756 Paenibacillus glucanolyticus. International Biodeterioration and Biodegradation 110: 79-86.
757
758 Menardo S, Airoldi G, Balsari P. 2012. The effect of particle size and thermal pretreatment on
759 the methane yield of four agricultural by-products. Bioresource Technology 104: 708–714.
760
761 Menon A, Ren F, Wang JY, Giannis A. 2016. Effect of pretreatment techniques on food waste
762 solubilization and biogas production during thermophilic batch anaerobic digestion. Journal of
763 Material Cycles and Waste Management 18: 222-230.
764
765 Modenbach AA, Nokes SE. 2012. The use of high-solids loading in biomass pretreatment – a
766 review. Biotechnology and Bioengineering 109: 1430–1442.
767
768 Monlau F, Barakat A, Steyer JP, Carrere H. 2012. Comparison of seven types of thermo-
769 chemical pretreatment on the structural features and anaerobic digestion of sunflower stalks.
770 Bioresource Technology 120: 241–247.
771
772 Monlau F, Latrille E, Da Costa AC, Steyer J, Carrère H. 2013. Enhancement of methane
773 production from sunflower oil cakes by dilute acid pretreatment. Applied Energy 102: 1105–
774 1113.
775
776 Monlau F, Sambusiti C, Antoniou N, Barakat A, Zabaniotou A. 2015. A new concept for
777 enhancing energy recovery from agricultural residues by coupling anaerobic digestion and
778 pyrolysis process. Applied Energy 148: 32–38.
779
780 Montingelli ME, Benyounis KY, Quilty B, Stokes J, Olabi AG. 2016. Optimisation of biogas
781 production from the macroalgae Laminaria sp. at different periods of harvesting in Ireland.
782 Applied Energy 177: 671–682.
783
784 Mustafa AM, Poulsen TG, Sheng K. 2016. Fungal pretreatment of rice straw with Pleurotus
785 ostreatus and Trichoderma reesei to enhance methane production under solid-state anaerobic
786 digestion. Applied Energy 180: 661–671.
787
788 Naran E, Toor UA, Kim D. 2016. Effect of pretreatment and anaerobic co-digestion of food
789 waste and waste activated sludge on stabilization and methane production. International
790 Biodeterioration and Biodegradation 113: 17-21.
791
792 Okoli B.E. Mgbeogwu CM. 1983. Fluted pumpkin, Telfairia occidentalis: West African
793 vegetable crop. Economic Botany 37(2): 145–147.
794
795 Pagliaccia P, Gallipoli A, Gianico A, Montecchio D, Braguglia CM. 2016. Single stage
796 anaerobic bioconversion of food waste in mono and co-digestion with olive husks: Impact of
PeerJ Preprints | https://doi.org/10.7287/peerj.preprints.26564v1 | CC BY 4.0 Open Access | rec: 22 Feb 2018, publ: 22 Feb 2018

797 thermal pretreatment on hydrogen and methane production. International Journal of Hydrogen
798 Energy 41: 905-915.
799
800 Passos F, Garcia J, Ferrer I. 2013. Impact of low temperature pretreatment on the anaerobic
801 digestion of microalgal biomass. Bioresource Technology 138: 79–86.
802
803 Pei P, Zhang C, Li J, Chang S, Li S, Wang J, Zhao M, Jiang L, Yu M, Chen X. Optimization of
804 NaOH pretreatment for enhancement of biogas production of banana pseudo-stem fibre using
805 Response Surface Methodology. BioResources 9(3): 5073-5087.
806 Pivato A, Vanin S, Raga R, Lavagnolo MC, Barausse A, Rieple A, Laurent A, Cossu R. 2015.
807 Use of digestate from a decentralized on-farm biogas plant as fertilizer in soils: An
808 ecotoxicological study for future indicators in risk and life cycle assessment. Waste Management 809 http://dx.doi.org/10.1016/j.wasman.2015.12.009.
810
811 Riggio S, Torrijos M, Debord R, Esposit G, van Hullebusch ED, Steyer JP, Escudié B. 2017.
812 Mesophilic anaerobic digestion of several types of spent livestock bedding in a batch leach-bed
813 reactor: substrate characterization and process performance. Waste Management 59: 129-139.
814
815 Saha BC, Qureshi N, Kennedy GJ, Cotta MA. 2016. Biological pretreatment of corn stover with
816 white-rot fungus for improved enzymatic hydrolysis. International Biodeterioration and
817 Biodegradation 109: 29-35.
818
819 Sambusiti C, Ficara E, Malpei F, Steyer JP, Carrere H. 2013. Benefit of sodium hydroxide
820 pretreatment of ensiled sorghum forage on the anaerobic reactor stability and methane
821 production. Bioresource Technology 144: 149–155.
822
823 Schell DJ, Farmer J, Newman M, McMillan JD. 2003. Dilute-sulfuric acid pretreatment of corn
824 stover in pilot-scale reactor: investigation of yields, kinetics, and enzymatic digestibilities of
825 solids. Applied Biochemistry and Biotechnology 105–108: 69–85.
826
827 Schippers RR. 2002. African indigenous vegetables, an overview of the cultivated species 2002.
828 Revised edition on CD-ROM. National Resources International Limited, Aylesford, United
829 Kingdom.
830
831 Serrano A, Siles JA, Martín MA, Chica AF, Estevez-Pastor FS, Toro-Baptista E. 2016.
832 Improvement of anaerobic digestion of sewage sludge through microwave pre-treatment. Journal
833 of Environmental Management 177: 231-239.
834
835 Stieglmeier M, Wirth R, Kminek G, Moissl-Eichinger C. 2009. Cultivation of anaerobic and
836 facultatively anaerobic bacteria from spacecraft-associated clean rooms. Applied and
837 Environmental Microbiology 75: 3484–3491.
838
839 Sun C, Cao W, Banks CJ, Heaven S, Liu R. 2016. Biogas production from undiluted chicken
840 manure and maize silage: a study of ammonia inhibition in high solids anaerobic digestion.
841 Bioresource Technology 218: 1215-1223.
PeerJ Preprints | https://doi.org/10.7287/peerj.preprints.26564v1 | CC BY 4.0 Open Access | rec: 22 Feb 2018, publ: 22 Feb 2018
842 Sun R, Guo X, Wang D, Chu H. 2015. Effects of long-term application of chemical and organic
843 fertilizers on the abundance of microbial communities involved in the nitrogen cycle. Applied
844 Soil Ecology 95: 171–178.
845
846 Tsuneo A. 2010. Pictorial atlas of soil for seed fungi: Morphologies of cultural fungi for key to
847 species. Third Edition, CRC Press.
848
849 Tufaner F, Avsar Y. 2016. Effects of co-substrate on biogas production from cattle manure: a
850 review. International Journal of Environmental Science and Technology 13: 2303-2312.
851
852 Yap SD, Astals S, Jensen D, Batstone DJ, Tait S. 2016. Pilot-scale testing of a leachbed for
853 anaerobic digestion of livestock residues on-farm. Waste Management 854 http://dx.doi.org/10.1016/j.wasman.2016.02.031.
855
856 Yuan H, Yu B, Cheng P, Zhu N, Yin C, Ying L. 2016. Pilot-scale study of enhanced anaerobic
857 digestion of waste activated sludge by electrochemical and sodium hypochlorite combination
858 pretreatment. International Biodeterioration and Biodegradation 110: 227-234.
859
860 Zabranska J, Dohanyos M, Jenicek P, Kutil, J. 2006. Disintegration of excess activated sludge –
861 evaluation and experience of full-scale applications. Water Science and Technology 53: 229–
862 236.
863
864 Zahedi S, Solera R, Micolucci F, Cavinato C, Bolzonella D. 2016. Changes in microbial
865 community during hydrogen and methane production in two-stage thermophilic anaerobic co-
866 digestion process from biowaste. Waste Management
867 2016;http://dx.doi.org/10.1016/j.wasman.2016.01.016
868
869 Zhang J, Loh K, Li W, Lim JW, Dai Y, Tong YW. 2016. Three-stage anaerobic digester for food
870 waste. Applied Energy http://dx.doi.org/10.1016/j.apenergy.2016.10.116.
871
872 Zheng Y, Zhao J, Xu F, Li Y. 2014. Pretreatment of lignocellulosic biomass for enhanced biogas
873 production. Progress in Energy and Combustion Science 42: 35–53.
874
875 Zou S, Wang H, Wang X, Zhou S, Li X, Feng Y. 2016. Application of experimental design
876 techniques in the optimization of the ultrasonic pretreatment time and enhancement of methane
877 production in anaerobic co-digestion. Applied Energy 179: 191–202.
878
879 Zou S, Wang X, Chen Y, Wan H, Feng Y. 2016. Enhancement of biogas production in anaerobic
880 co-digestion by ultrasonic pretreatment. Energy Conversion and Management 112: 226–235.
881
882 Zupancic GD, Ros M. 2003. Heat and energy requirements in thermophilic anaerobic sludge
883 digestion. Renewable Energy 28: 2255–2267.
884
885 Figure Captions
886
PeerJ Preprints | https://doi.org/10.7287/peerj.preprints.26564v1 | CC BY 4.0 Open Access | rec: 22 Feb 2018, publ: 22 Feb 2018
887 Figure 1: The figure shows the graph of pH fluctuations during the anaerobic digestion of
888 Telfairia occidentalis fruit peels
889 Figure 2: The figure shows the graph of average daily biogas yield for the anaerobic digestion of
890 Telfairia occidentalis fruit peels
891 Figure 3 (a-j): The figure shows the RSM and ANNs curvatures’ nature of 3D surfaces plots for
892 biogas generation from Telfairia occidentalis fruit peels
893 Figure 4: This figure show the importance level of all the five independent variables used in the
894 optimization study
895
896
897
898
899
900
PeerJ Preprints | https://doi.org/10.7287/peerj.preprints.26564v1 | CC BY 4.0 Open Access | rec: 22 Feb 2018, publ: 22 Feb 2018
Table 1(on next page)
Physical and chemical characteristics of Telfairia occidentalis fruit rind, poultry manure
and cattle rumen content
Each value indicates the composition of the respective parameter in the tested samples
PeerJ Preprints | https://doi.org/10.7287/peerj.preprints.26564v1 | CC BY 4.0 Open Access | rec: 22 Feb 2018, publ: 22 Feb 2018
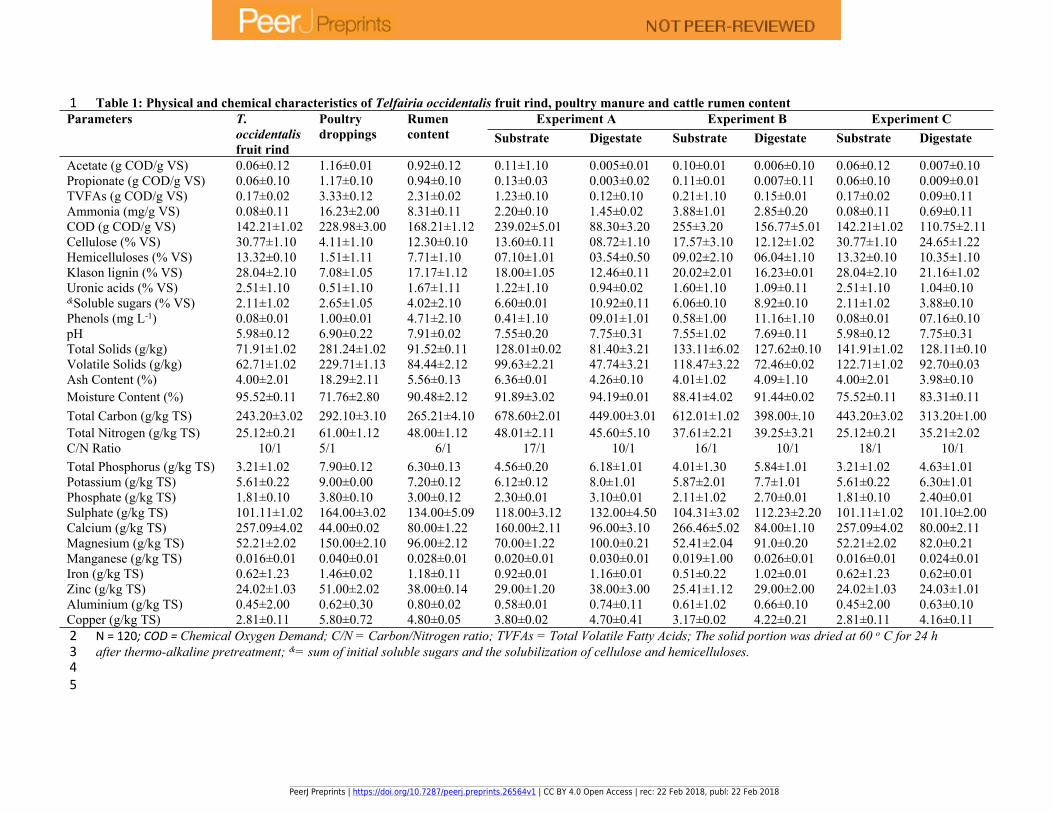
1 Table 1: Physical and chemical characteristics of Telfairia occidentalis fruit rind, poultry manure and cattle rumen content
Experiment A Experiment B Experiment CParameters T.
occidentalis
fruit rind
Poultry
droppings
Rumen
content Substrate Digestate Substrate Digestate Substrate Digestate
Acetate (g COD/g VS) 0.06±0.12 1.16±0.01 0.92±0.12 0.11±1.10 0.005±0.01 0.10±0.01 0.006±0.10 0.06±0.12 0.007±0.10
Propionate (g COD/g VS) 0.06±0.10 1.17±0.10 0.94±0.10 0.13±0.03 0.003±0.02 0.11±0.01 0.007±0.11 0.06±0.10 0.009±0.01
TVFAs (g COD/g VS) 0.17±0.02 3.33±0.12 2.31±0.02 1.23±0.10 0.12±0.10 0.21±1.10 0.15±0.01 0.17±0.02 0.09±0.11
Ammonia (mg/g VS) 0.08±0.11 16.23±2.00 8.31±0.11 2.20±0.10 1.45±0.02 3.88±1.01 2.85±0.20 0.08±0.11 0.69±0.11
COD (g COD/g VS) 142.21±1.02 228.98±3.00 168.21±1.12 239.02±5.01 88.30±3.20 255±3.20 156.77±5.01 142.21±1.02 110.75±2.11
Cellulose (% VS) 30.77±1.10 4.11±1.10 12.30±0.10 13.60±0.11 08.72±1.10 17.57±3.10 12.12±1.02 30.77±1.10 24.65±1.22
Hemicelluloses (% VS) 13.32±0.10 1.51±1.11 7.71±1.10 07.10±1.01 03.54±0.50 09.02±2.10 06.04±1.10 13.32±0.10 10.35±1.10
Klason lignin (% VS) 28.04±2.10 7.08±1.05 17.17±1.12 18.00±1.05 12.46±0.11 20.02±2.01 16.23±0.01 28.04±2.10 21.16±1.02
Uronic acids (% VS) 2.51±1.10 0.51±1.10 1.67±1.11 1.22±1.10 0.94±0.02 1.60±1.10 1.09±0.11 2.51±1.10 1.04±0.10&Soluble sugars (% VS) 2.11±1.02 2.65±1.05 4.02±2.10 6.60±0.01 10.92±0.11 6.06±0.10 8.92±0.10 2.11±1.02 3.88±0.10
Phenols (mg L-1) 0.08±0.01 1.00±0.01 4.71±2.10 0.41±1.10 09.01±1.01 0.58±1.00 11.16±1.10 0.08±0.01 07.16±0.10
pH 5.98±0.12 6.90±0.22 7.91±0.02 7.55±0.20 7.75±0.31 7.55±1.02 7.69±0.11 5.98±0.12 7.75±0.31
Total Solids (g/kg) 71.91±1.02 281.24±1.02 91.52±0.11 128.01±0.02 81.40±3.21 133.11±6.02 127.62±0.10 141.91±1.02 128.11±0.10
Volatile Solids (g/kg) 62.71±1.02 229.71±1.13 84.44±2.12 99.63±2.21 47.74±3.21 118.47±3.22 72.46±0.02 122.71±1.02 92.70±0.03
Ash Content (%) 4.00±2.01 18.29±2.11 5.56±0.13 6.36±0.01 4.26±0.10 4.01±1.02 4.09±1.10 4.00±2.01 3.98±0.10
Moisture Content (%) 95.52±0.11 71.76±2.80 90.48±2.12 91.89±3.02 94.19±0.01 88.41±4.02 91.44±0.02 75.52±0.11 83.31±0.11
Total Carbon (g/kg TS) 243.20±3.02 292.10±3.10 265.21±4.10 678.60±2.01 449.00±3.01 612.01±1.02 398.00±.10 443.20±3.02 313.20±1.00
Total Nitrogen (g/kg TS) 25.12±0.21 61.00±1.12 48.00±1.12 48.01±2.11 45.60±5.10 37.61±2.21 39.25±3.21 25.12±0.21 35.21±2.02
C/N Ratio 10/1 5/1 6/1 17/1 10/1 16/1 10/1 18/1 10/1
Total Phosphorus (g/kg TS) 3.21±1.02 7.90±0.12 6.30±0.13 4.56±0.20 6.18±1.01 4.01±1.30 5.84±1.01 3.21±1.02 4.63±1.01
Potassium (g/kg TS) 5.61±0.22 9.00±0.00 7.20±0.12 6.12±0.12 8.0±1.01 5.87±2.01 7.7±1.01 5.61±0.22 6.30±1.01
Phosphate (g/kg TS) 1.81±0.10 3.80±0.10 3.00±0.12 2.30±0.01 3.10±0.01 2.11±1.02 2.70±0.01 1.81±0.10 2.40±0.01
Sulphate (g/kg TS) 101.11±1.02 164.00±3.02 134.00±5.09 118.00±3.12 132.00±4.50 104.31±3.02 112.23±2.20 101.11±1.02 101.10±2.00
Calcium (g/kg TS) 257.09±4.02 44.00±0.02 80.00±1.22 160.00±2.11 96.00±3.10 266.46±5.02 84.00±1.10 257.09±4.02 80.00±2.11
Magnesium (g/kg TS) 52.21±2.02 150.00±2.10 96.00±2.12 70.00±1.22 100.0±0.21 52.41±2.04 91.0±0.20 52.21±2.02 82.0±0.21
Manganese (g/kg TS) 0.016±0.01 0.040±0.01 0.028±0.01 0.020±0.01 0.030±0.01 0.019±1.00 0.026±0.01 0.016±0.01 0.024±0.01
Iron (g/kg TS) 0.62±1.23 1.46±0.02 1.18±0.11 0.92±0.01 1.16±0.01 0.51±0.22 1.02±0.01 0.62±1.23 0.62±0.01
Zinc (g/kg TS) 24.02±1.03 51.00±2.02 38.00±0.14 29.00±1.20 38.00±3.00 25.41±1.12 29.00±2.00 24.02±1.03 24.03±1.01
Aluminium (g/kg TS) 0.45±2.00 0.62±0.30 0.80±0.02 0.58±0.01 0.74±0.11 0.61±1.02 0.66±0.10 0.45±2.00 0.63±0.10
Copper (g/kg TS) 2.81±0.11 5.80±0.72 4.80±0.05 3.80±0.02 4.70±0.41 3.17±0.02 4.22±0.21 2.81±0.11 4.16±0.11
2 N = 120; COD = Chemical Oxygen Demand; C/N = Carbon/Nitrogen ratio; TVFAs = Total Volatile Fatty Acids; The solid portion was dried at 60 o C for 24 h
3 after thermo-alkaline pretreatment; &= sum of initial soluble sugars and the solubilization of cellulose and hemicelluloses.
4
5
PeerJ Preprints | https://doi.org/10.7287/peerj.preprints.26564v1 | CC BY 4.0 Open Access | rec: 22 Feb 2018, publ: 22 Feb 2018

Table 2(on next page)
Experimental design of Telfairia occidentalis fruit rind’s pretreatment prior to digestion
Each value indicates the range of values considered during the optimization of the biomass
pretreatment prior to anaerobic digestion
PeerJ Preprints | https://doi.org/10.7287/peerj.preprints.26564v1 | CC BY 4.0 Open Access | rec: 22 Feb 2018, publ: 22 Feb 2018
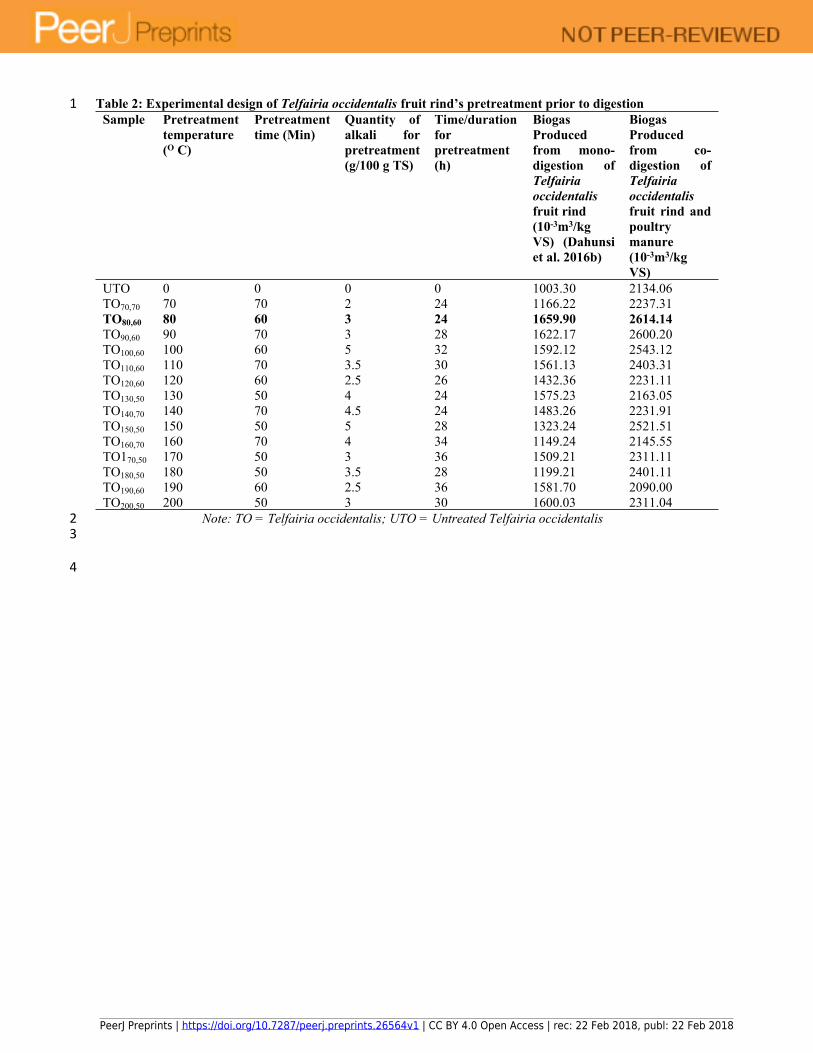
1 Table 2: Experimental design of Telfairia occidentalis fruit rind’s pretreatment prior to digestion
Sample Pretreatment
temperature
(O C)
Pretreatment
time (Min)
Quantity of
alkali for
pretreatment
(g/100 g TS)
Time/duration
for
pretreatment
(h)
Biogas
Produced
from mono-
digestion of
Telfairia
occidentalis
fruit rind
(10-3m3/kg
VS) (Dahunsi
et al. 2016b)
Biogas
Produced
from co-
digestion of
Telfairia
occidentalis
fruit rind and
poultry
manure
(10-3m3/kg
VS)
UTO 0 0 0 0 1003.30 2134.06
TO70,70 70 70 2 24 1166.22 2237.31
TO80,60 80 60 3 24 1659.90 2614.14
TO90,60 90 70 3 28 1622.17 2600.20
TO100,60 100 60 5 32 1592.12 2543.12
TO110,60 110 70 3.5 30 1561.13 2403.31
TO120,60 120 60 2.5 26 1432.36 2231.11
TO130,50 130 50 4 24 1575.23 2163.05
TO140,70 140 70 4.5 24 1483.26 2231.91
TO150,50 150 50 5 28 1323.24 2521.51
TO160,70 160 70 4 34 1149.24 2145.55
TO170,50 170 50 3 36 1509.21 2311.11
TO180,50 180 50 3.5 28 1199.21 2401.11
TO190,60 190 60 2.5 36 1581.70 2090.00
TO200,50 200 50 3 30 1600.03 2311.04
2 Note: TO = Telfairia occidentalis; UTO = Untreated Telfairia occidentalis
3
4
PeerJ Preprints | https://doi.org/10.7287/peerj.preprints.26564v1 | CC BY 4.0 Open Access | rec: 22 Feb 2018, publ: 22 Feb 2018

Table 3(on next page)
Experimental Design for Biogas generation from the co-digestion of Telfairi aoccidentalis
fruit rind and poultry manure with five independent variables for RSM and ANNs using
actual values
Each value shows the range of values chosen for the experimental design of the study
PeerJ Preprints | https://doi.org/10.7287/peerj.preprints.26564v1 | CC BY 4.0 Open Access | rec: 22 Feb 2018, publ: 22 Feb 2018

1Table 3: Experimental Design for Biogas generation from the co-digestion of Telfairi aoccidentalis fruit rind and poultry
2manure with five independent variables for RSM and ANNs using actual values
Independent Factors Digestion O Digestion P Digestion Q
Ru
n
T1
T2
T3
T4
T5
Act
ual
bio
gas
yie
ld (
10
-3
m3/k
g V
S)
RS
M
Pre
dic
ted
b
iogas
yie
ld (
10
-3 m
3/k
g V
S)
AN
Ns
Pre
dic
ted
bio
gas
yie
ld (
10
-3 m
3/k
g V
S)
Act
ual
bio
gas
yie
ld (
10
-
3m
3/k
g V
S)
RS
M
Pre
dic
ted
b
iogas
yie
ld (
10
-3 m
3/k
g V
S)
AN
Ns
Pre
dic
ted
bio
gas
yie
ld (
10
-3 m
3/k
g V
S)
Act
ual
bio
gas
yie
ld (
10
-
3m
3/k
g V
S)
RS
M
Pre
dic
ted
b
iogas
yie
ld (
10
-3 m
3/k
g V
S)
AN
Ns
Pre
dic
ted
bio
gas
yie
ld (
10
-3 m
3/k
g V
S)
1 30.02 7.90 20.03 5.94 4.01 2539.2 2614.1 2540.3 2239.2 2289.9 2249.5 0995.5 1003.3 0997.4
2 39.98 7.90 29.88 11.45 11.83 2480.9 2462.5 2484.3 2260.9 2290.9 2221.2 0990.6 1008.3 0921.5
3 30.43 7.99 20.05 6.64 4.11 2365.1 2408.1 2368.5 2265.1 2201.6 2203.4 0988.7 1001.6 0979.8
4 39.85 6.59 25.46 11.79 11.60 2473.3 2540.8 2459.6 2203.9 2220.8 2203.6 1000.5 1007.5 0977.2
5 39.98 6.53 29.57 11.98 7.08 2600.1 2612.1 2597.0 2200.1 2211.6 2200.5 0950.6 0978.3 0967.2
6 39.52 6.52 25.39 10.86 11.51 2523.1 2606.2 2523.5 2280.1 2211.3 2285.6 0986.5 1001.0 0985.4
7 40.00 7.72 29.99 11.03 10.89 2484.2 2486.2 2484.4 2241.2 2200.2 2240.3 0964.6 0979.9 0980.5
8 39.93 7.08 29.23 11.89 9.23 2435.9 2481.8 2435.9 2225.9 2201.9 2226.3 0945.3 0979.5 0952.6
9 39.68 6.68 29.68 9.99 11.24 2563.3 2572.9 2560.2 2263.3 2283.9 2263.1 0943.6 1007.4 0952.4
10 39.56 7.41 29.89 11.42 11.77 2851.1 2872.6 2836.2 2251.1 2201.7 2251.2 0958.8 1002.4 0929.5
11 39.77 6.74 29.92 8.40 11.45 2907.1 3065.6 2588.3 2207.1 2252.9 2207.1 0937.4 0920.3 0904.5
12 30.22 7.92 20.09 7.46 4.05 2681.0 2664.9 2588.2 2221.0 2252.5 2219.5 1002.4 1002.2 0978.2
13 39.17 6.68 26.24 10.69 11.97 2591.6 2608.6 2591.5 2291.6 2206.4 2290.2 1001.2 0997.2 0951.5
14 39.96 6.63 25.40 11.30 11.62 2551.1 2557.3 2553.7 2209.1 2216.6 2266.5 1002.1 0959.5 0937.8
15 39.97 6.99 29.35 11.91 9.24 2501.2 2556.3 2503.3 2221.2 2208.1 2221.6 0941.1 0967.5 0950.1
16 39.96 6.55 27.00 11.29 10.30 2511.9 2555.9 2509.9 2204.9 2226.5 2266.5 0984.5 1001.7 0976.1
17 39.21 6.74 27.19 11.70 11.23 1002.5 1054.9 1002.5 2228.0 2209.2 2266.5 0938.3 1001.7 0949.4
18 39.97 7.74 29.72 10.86 11.42 2732.0 2749.8 2731.6 2232.0 2201.6 2266.5 0996.3 1004.7 0952.2
19 40.00 7.70 29.65 11.89 11.58 2727.3 2749.4 2734.6 2277.3 2201.4 2277.1 0977.6 1000.9 0957.3
20 39.99 7.19 29.94 11.53 9.40 2700.9 2743.7 2700.4 2203.9 2204.7 2201.5 0990.4 0964.1 0971.2
21 39.95 7.42 29.84 10.21 10.96 2700.1 2733.3 2705.6 2291.1 2202.9 2285.4 0931.5 0982.5 0919.9
22 40.00 7.75 30.00 10.57 9.57 2597.2 2610.9 2600.5 2297.2 2202.9 2294.9 0907.9 0992.8 0940.7
23 40.00 8.00 28.83 10.84 4.00 2556.1 2504.6 2555.7 2256.1 2287.9 2255.8 0955.6 0998.3 0990.1
24 40.00 8.00 29.55 10.73 4.00 2642.1 2701.3 2643.5 2242.1 2287.6 2242.1 0942.8 0971.3 0984.7
25 30.00 8.00 20.00 7.95 5.56 2398.1 2377.9 2397.5 2288.1 2207.8 2289.3 0968.1 0983.1 0959.7
26 40.00 8.00 29.82 11.05 4.01 2350.1 2476.6 2588.2 2250.0 2287.4 2250.0 0901.7 0977.6 0951.4
27 40.00 8.00 29.53 11.26 5.38 2569.0 2673.6 2567.5 2269.0 2385.5 2281.5 0966.7 1005.1 0950.1
28 40.00 8.00 29.18 9.85 5.07 2410.0 2473.3 2404.4 2210.0 2383.6 2210.3 0950.6 1000.4 0978.7
29 30.00 7.53 20.00 6.58 4.00 2400.0 2457.9 2588.2 2250.0 2383.1 2250.7 0940.8 1003.1 0951.6
30 40.00 8.00 26.91 10.30 4.45 3456.0 3429.5 3456.3 2276.0 2382.9 2276.3 0979.3 1002.6 0955.8
31 38.00 7.82 28.99 10.03 10.19 2681.02 2540.8 2836.1 2201.1 2332.2 2221.3 0948.1 1003.1 0959.3
32 37.93 7.08 29.23 11.89 9.03 2691.62 2612.1 2588.3 2307.1 2316.3 2214.3 0904.6 1006.1 0950.7
33 38.68 6.58 28.68 9.29 10.24 2551.14 2606.2 2588.2 2351.0 2398.9 2243.2 0941.9 1001.2 0963.2
34 38.56 7.41 29.89 10.42 10.17 2601.25 2486.7 2591.5 2292.6 2301.2 2289.4 0977.3 1001.3 0975.8
35 37.77 6.74 29.92 8.40 11.45 2531.97 2581.8 2553.8 2310.1 2322.3 2203.8 0941.5 1002.1 0956.6
36 36.22 7.62 20.09 7.46 4.05 1902.58 2572.9 2503.3 2211.2 2323.9 2221.1 0901.3 0983.3 1001.6
37 39.17 6.58 26.24 10.69 10.97 2742.63 2872.6 2509.9 2234.9 2343.2 2240.0 0984.5 1003.6 1004.8
PeerJ Preprints | https://doi.org/10.7287/peerj.preprints.26564v1 | CC BY 4.0 Open Access | rec: 22 Feb 2018, publ: 22 Feb 2018
38 38.96 6.63 25.40 11.30 10.62 1037.32 1265.6 1002.5 2223.0 2300.1 2254.6 0913.7 1000.4 0964.4
39 38.97 6.69 29.65 10.91 9.24 2700.91 2964.9 2731.5 2262.0 2301.3 2269.7 0989.9 1001.2 0959.7
40 37.96 6.55 27.00 10.29 10.30 2710.14 2618.6 2735.6 2207.3 2312.9 2209.0 0904.6 1002.4 0969.3
41 39.21 6.75 27.19 11.70 10.23 2457.25 2657.3 2730.4 2211.9 2343.3 2224.8 0981.9 1002.3 0929.4
42 39.97 7.74 29.42 10.86 11.42 2456.13 2506.3 2705.6 2231.1 2376.3 2242.2 0981.7 1006.4 0950.7
43 40.00 7.71 29.45 11.89 10.58 2652.12 2585.9 2600.6 2297.2 2302.3 2299.9 1007.8 1002.3 0947.1
44 39.99 7.19 29.94 11.53 9.40 2693.31 2554.9 2535.8 2259.1 2311.2 2263.2 1005.8 1006.8 0926.2
45 38.95 7.45 29.64 10.21 10.96 2450.58 2749.8 2643.5 2242.1 2393.2 2256.6 0949.1 1003.8 0956.6
46 40.00 7.55 30.00 10.57 8.57 2569.34 2749.4 2497.5 2288.1 2301.2 2296.6 0999.6 1005.6 1006.2
47 38.00 8.00 29.08 9.85 6.07 2410.33 2743.6 2588.2 2250.0 2362.2 2258.8 0987.0 1002.5 1008.7
48 30.00 7.53 20.00 6.58 4.00 2400.62 2733.3 2567.4 2229.0 2325.3 2231.1 0929.7 1005.6 1001.6
49 37.00 8.00 26.91 10.30 5.45 3245.92 2620.9 2504.3 2220.0 2316.5 2219.6 0907.7 1001.6 1002.2
50 38.00 7.52 27.59 10.03 10.89 3215.42 2534.6 2553.8 2251.4 2361.6 2259.4 0958.5 1001.2 0968.2
3 T1 = Temperature; T2 = pH; T3 = Retention time; T4 = Total solids: T5 = Volatile solids
4
5
PeerJ Preprints | https://doi.org/10.7287/peerj.preprints.26564v1 | CC BY 4.0 Open Access | rec: 22 Feb 2018, publ: 22 Feb 2018

Table 4(on next page)
Stoichiometry and mass balance for one ton of Telfairia occidentalis fruit rind and
poultry manure from the anaerobic digestions
Each value is the result of stoichometry and mass balance between the substrates employed
in the co-digestion study
PeerJ Preprints | https://doi.org/10.7287/peerj.preprints.26564v1 | CC BY 4.0 Open Access | rec: 22 Feb 2018, publ: 22 Feb 2018
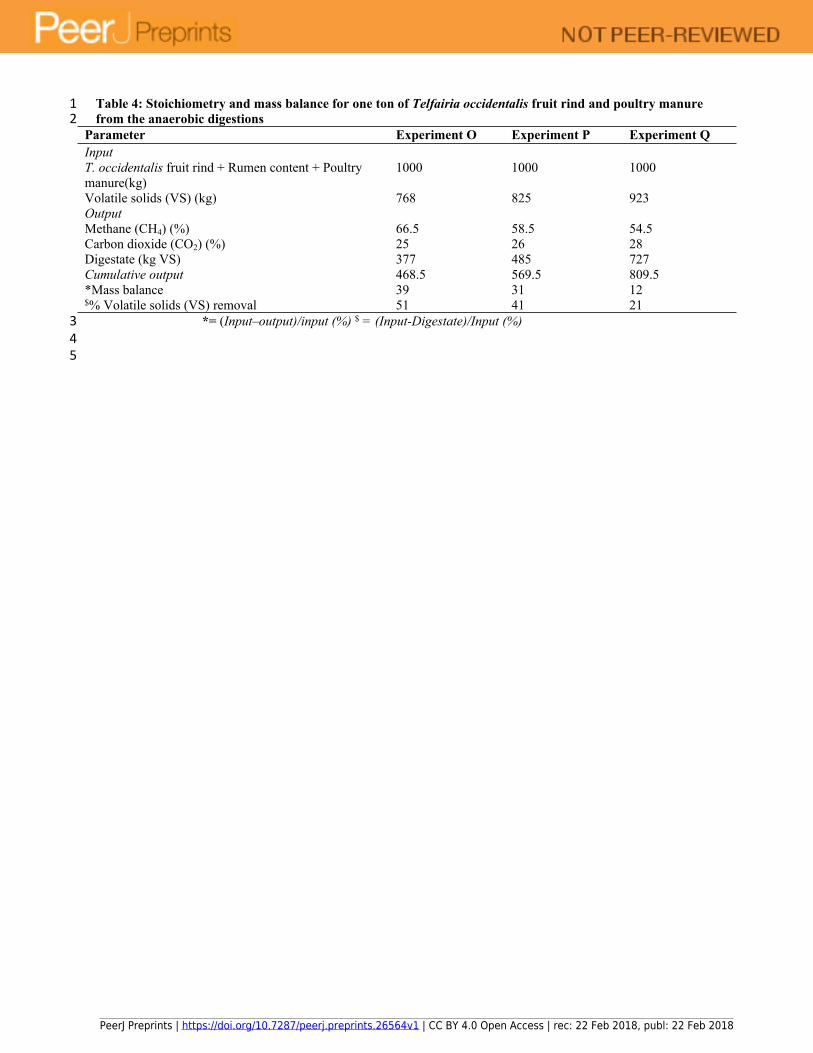
1 Table 4: Stoichiometry and mass balance for one ton of Telfairia occidentalis fruit rind and poultry manure
2 from the anaerobic digestions
Parameter Experiment O Experiment P Experiment Q
Input
T. occidentalis fruit rind + Rumen content + Poultry manure(kg)
1000 1000 1000
Volatile solids (VS) (kg) 768 825 923Output
Methane (CH4) (%) 66.5 58.5 54.5Carbon dioxide (CO2) (%) 25 26 28Digestate (kg VS) 377 485 727Cumulative output 468.5 569.5 809.5*Mass balance 39 31 12$% Volatile solids (VS) removal 51 41 21
3 *= (Input–output)/input (%) $ = (Input-Digestate)/Input (%)
4
5
PeerJ Preprints | https://doi.org/10.7287/peerj.preprints.26564v1 | CC BY 4.0 Open Access | rec: 22 Feb 2018, publ: 22 Feb 2018

Table 5(on next page)
Test of significance and Analysis of variance (ANOVA) for all regression coefficient terms
for biogas generation from Telfairia occidentalis fruit rind and poultry manure
Each value indicates the corresponding result of the analysis of variance carried out on the
data generated during the anaerobic co-digestion processes
PeerJ Preprints | https://doi.org/10.7287/peerj.preprints.26564v1 | CC BY 4.0 Open Access | rec: 22 Feb 2018, publ: 22 Feb 2018
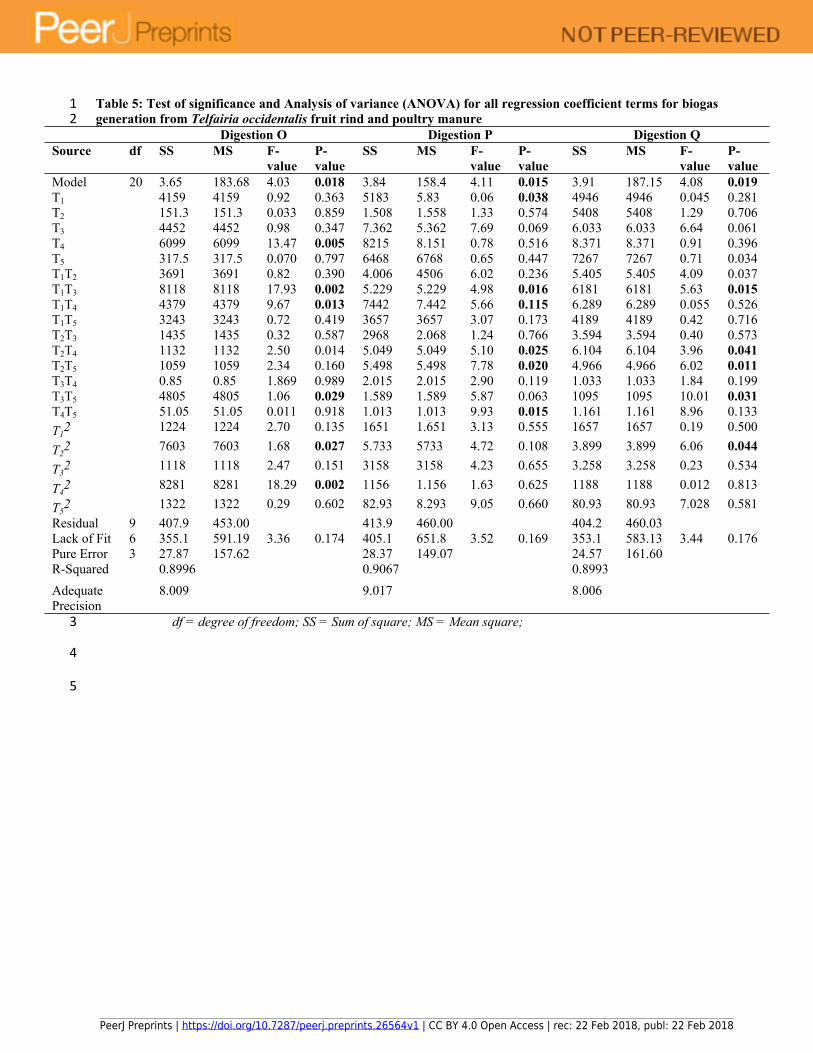
1 Table 5: Test of significance and Analysis of variance (ANOVA) for all regression coefficient terms for biogas
2 generation from Telfairia occidentalis fruit rind and poultry manure
Digestion O Digestion P Digestion Q
Source df SS MS F-
value
P-
value
SS MS F-
value
P-
value
SS MS F-
value
P-
value
Model 20 3.65 183.68 4.03 0.018 3.84 158.4 4.11 0.015 3.91 187.15 4.08 0.019
T1 4159 4159 0.92 0.363 5183 5.83 0.06 0.038 4946 4946 0.045 0.281
T2 151.3 151.3 0.033 0.859 1.508 1.558 1.33 0.574 5408 5408 1.29 0.706
T3 4452 4452 0.98 0.347 7.362 5.362 7.69 0.069 6.033 6.033 6.64 0.061
T4 6099 6099 13.47 0.005 8215 8.151 0.78 0.516 8.371 8.371 0.91 0.396
T5 317.5 317.5 0.070 0.797 6468 6768 0.65 0.447 7267 7267 0.71 0.034
T1T2 3691 3691 0.82 0.390 4.006 4506 6.02 0.236 5.405 5.405 4.09 0.037
T1T3 8118 8118 17.93 0.002 5.229 5.229 4.98 0.016 6181 6181 5.63 0.015
T1T4 4379 4379 9.67 0.013 7442 7.442 5.66 0.115 6.289 6.289 0.055 0.526
T1T5 3243 3243 0.72 0.419 3657 3657 3.07 0.173 4189 4189 0.42 0.716
T2T3 1435 1435 0.32 0.587 2968 2.068 1.24 0.766 3.594 3.594 0.40 0.573
T2T4 1132 1132 2.50 0.014 5.049 5.049 5.10 0.025 6.104 6.104 3.96 0.041
T2T5 1059 1059 2.34 0.160 5.498 5.498 7.78 0.020 4.966 4.966 6.02 0.011
T3T4 0.85 0.85 1.869 0.989 2.015 2.015 2.90 0.119 1.033 1.033 1.84 0.199
T3T5 4805 4805 1.06 0.029 1.589 1.589 5.87 0.063 1095 1095 10.01 0.031
T4T5 51.05 51.05 0.011 0.918 1.013 1.013 9.93 0.015 1.161 1.161 8.96 0.133
T12 1224 1224 2.70 0.135 1651 1.651 3.13 0.555 1657 1657 0.19 0.500
T22 7603 7603 1.68 0.027 5.733 5733 4.72 0.108 3.899 3.899 6.06 0.044
T32 1118 1118 2.47 0.151 3158 3158 4.23 0.655 3.258 3.258 0.23 0.534
T42 8281 8281 18.29 0.002 1156 1.156 1.63 0.625 1188 1188 0.012 0.813
T52 1322 1322 0.29 0.602 82.93 8.293 9.05 0.660 80.93 80.93 7.028 0.581
Residual 9 407.9 453.00 413.9 460.00 404.2 460.03
Lack of Fit 6 355.1 591.19 3.36 0.174 405.1 651.8 3.52 0.169 353.1 583.13 3.44 0.176
Pure Error 3 27.87 157.62 28.37 149.07 24.57 161.60
R-Squared 0.8996 0.9067 0.8993
Adequate
Precision
8.009 9.017 8.006
3 df = degree of freedom; SS = Sum of square; MS = Mean square;
4
5
PeerJ Preprints | https://doi.org/10.7287/peerj.preprints.26564v1 | CC BY 4.0 Open Access | rec: 22 Feb 2018, publ: 22 Feb 2018

Table 6(on next page)
Energy and economic evaluation for the anaerobic co-digestion of Telfairia occidentalis
fruit rind and poultry manure
Each value shows the result of energy and economic evaluation for the anaerobic co-
digestion of Telfairia occidentalis fruit rind and poultry manure
PeerJ Preprints | https://doi.org/10.7287/peerj.preprints.26564v1 | CC BY 4.0 Open Access | rec: 22 Feb 2018, publ: 22 Feb 2018

1 Table 6: Energy and economic evaluation for the anaerobic co-digestion of Telfairia occidentalis fruit rind
2 and poultry manure
Energy parameters Experiment O Experiment P Experiment Q
Produced electrical and thermal energy from combined heat and power (CHP)
1785 1699 1155
Produced thermal energy (kWh t-1 TS) 1645 1547 498Produced electrical energy (kWh t-1 TS) 770 563 340Thermal balance
*Thermal energy gain (kWh t-1 TS) 1147 1049 -Thermal energy requirement (kWh t-1 TS) 1088 1109 -Thermal energy requirement with 80% of heat recovery (kWh t-1 TS)
218 210 -
#Net thermal energy (kWh t-1 TS) 59 -60 -Net thermal energy with 80% of heat recovery (kWh t-1 TS) -929 -839 -Electrical balance$Electrical energy gain 430 223 -Energy for mixing during pretreatment - - -Net electrical energy 430 223Economic evaluation
Cost of NaOH (є t-1 TS)
3 * = difference of thermal energies produced by the pretreated experiment minus the untreated; # = difference
4 between the thermal energy gain and the thermal energy requirement for the thermo-alkaline pretreatment; $ =
5 difference of electricity energies produced by pretreated experiment minus the untreated.
6
7
PeerJ Preprints | https://doi.org/10.7287/peerj.preprints.26564v1 | CC BY 4.0 Open Access | rec: 22 Feb 2018, publ: 22 Feb 2018
Table 7(on next page)
Energy balances of thermal and thermo-chemical pretreatment procedures as applied
to different substrates
Each value indicates the result of energy balances of thermal and thermo-chemical
pretreatment procedures as applied to different substrates
PeerJ Preprints | https://doi.org/10.7287/peerj.preprints.26564v1 | CC BY 4.0 Open Access | rec: 22 Feb 2018, publ: 22 Feb 2018
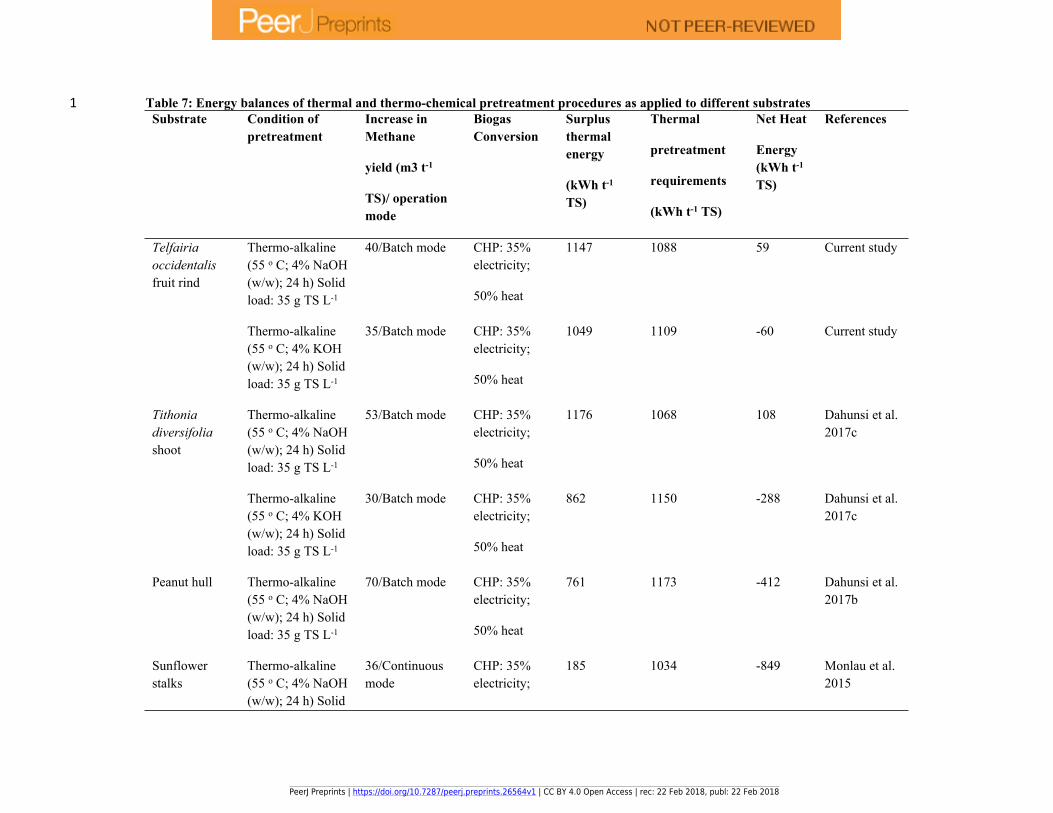
1 Table 7: Energy balances of thermal and thermo-chemical pretreatment procedures as applied to different substrates
Substrate Condition of
pretreatment
Increase in
Methane
yield (m3 t-1
TS)/ operation
mode
Biogas
Conversion
Surplus
thermal
energy
(kWh t-1
TS)
Thermal
pretreatment
requirements
(kWh t-1 TS)
Net Heat
Energy
(kWh t-1
TS)
References
Thermo-alkaline
(55 o C; 4% NaOH
(w/w); 24 h) Solid
load: 35 g TS L-1
40/Batch mode CHP: 35%
electricity;
50% heat
1147 1088 59 Current studyTelfairia
occidentalis
fruit rind
Thermo-alkaline
(55 o C; 4% KOH
(w/w); 24 h) Solid
load: 35 g TS L-1
35/Batch mode CHP: 35%
electricity;
50% heat
1049 1109 -60 Current study
Tithonia
diversifolia
shoot
Thermo-alkaline
(55 o C; 4% NaOH
(w/w); 24 h) Solid
load: 35 g TS L-1
53/Batch mode CHP: 35%
electricity;
50% heat
1176 1068 108 Dahunsi et al.
2017c
Thermo-alkaline
(55 o C; 4% KOH
(w/w); 24 h) Solid
load: 35 g TS L-1
30/Batch mode CHP: 35%
electricity;
50% heat
862 1150 -288 Dahunsi et al.
2017c
Peanut hull Thermo-alkaline
(55 o C; 4% NaOH
(w/w); 24 h) Solid
load: 35 g TS L-1
70/Batch mode CHP: 35%
electricity;
50% heat
761 1173 -412 Dahunsi et al.
2017b
Sunflower
stalks
Thermo-alkaline
(55 o C; 4% NaOH
(w/w); 24 h) Solid
36/Continuous
mode
CHP: 35%
electricity;
185 1034 -849 Monlau et al.
2015
PeerJ Preprints | https://doi.org/10.7287/peerj.preprints.26564v1 | CC BY 4.0 Open Access | rec: 22 Feb 2018, publ: 22 Feb 2018
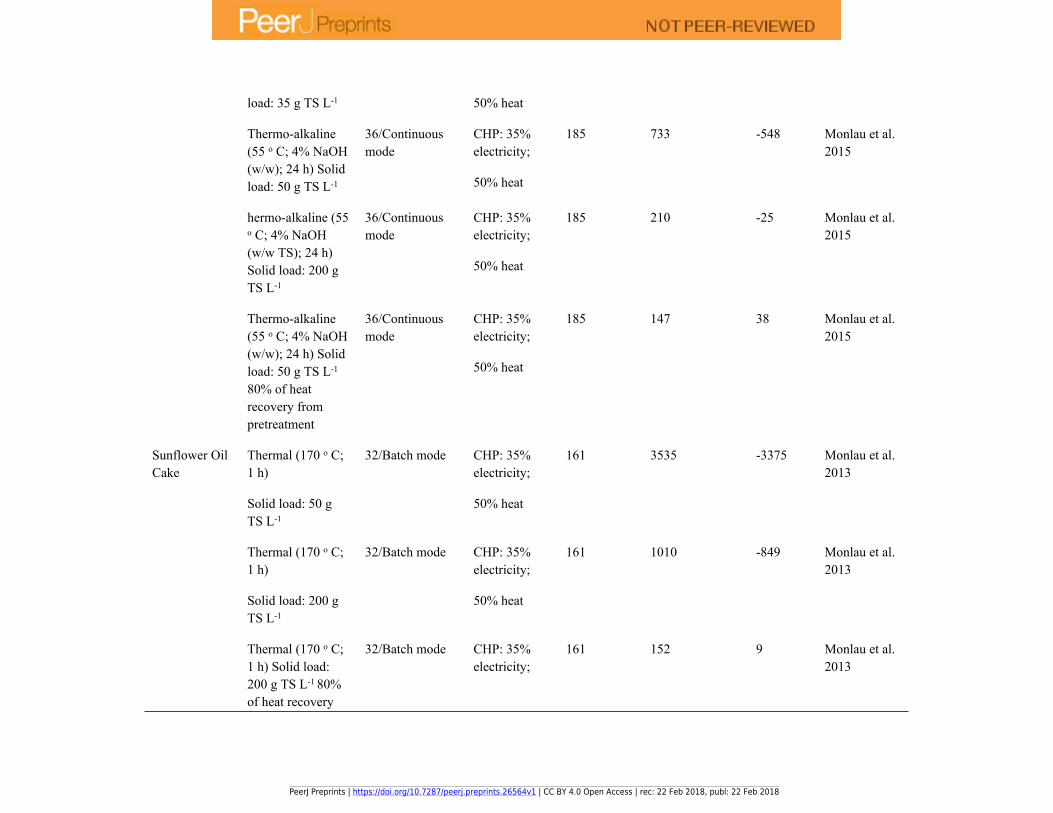
load: 35 g TS L-1 50% heat
Thermo-alkaline
(55 o C; 4% NaOH
(w/w); 24 h) Solid
load: 50 g TS L-1
36/Continuous
mode
CHP: 35%
electricity;
50% heat
185 733 -548 Monlau et al.
2015
hermo-alkaline (55 o C; 4% NaOH
(w/w TS); 24 h)
Solid load: 200 g
TS L-1
36/Continuous
mode
CHP: 35%
electricity;
50% heat
185 210 -25 Monlau et al.
2015
Thermo-alkaline
(55 o C; 4% NaOH
(w/w); 24 h) Solid
load: 50 g TS L-1
80% of heat
recovery from
pretreatment
36/Continuous
mode
CHP: 35%
electricity;
50% heat
185 147 38 Monlau et al.
2015
Thermal (170 o C;
1 h)
Solid load: 50 g
TS L-1
32/Batch mode CHP: 35%
electricity;
50% heat
161 3535 -3375 Monlau et al.
2013
Thermal (170 o C;
1 h)
Solid load: 200 g
TS L-1
32/Batch mode CHP: 35%
electricity;
50% heat
161 1010 -849 Monlau et al.
2013
Sunflower Oil
Cake
Thermal (170 o C;
1 h) Solid load:
200 g TS L-1 80%
of heat recovery
32/Batch mode CHP: 35%
electricity;
161 152 9 Monlau et al.
2013
PeerJ Preprints | https://doi.org/10.7287/peerj.preprints.26564v1 | CC BY 4.0 Open Access | rec: 22 Feb 2018, publ: 22 Feb 2018
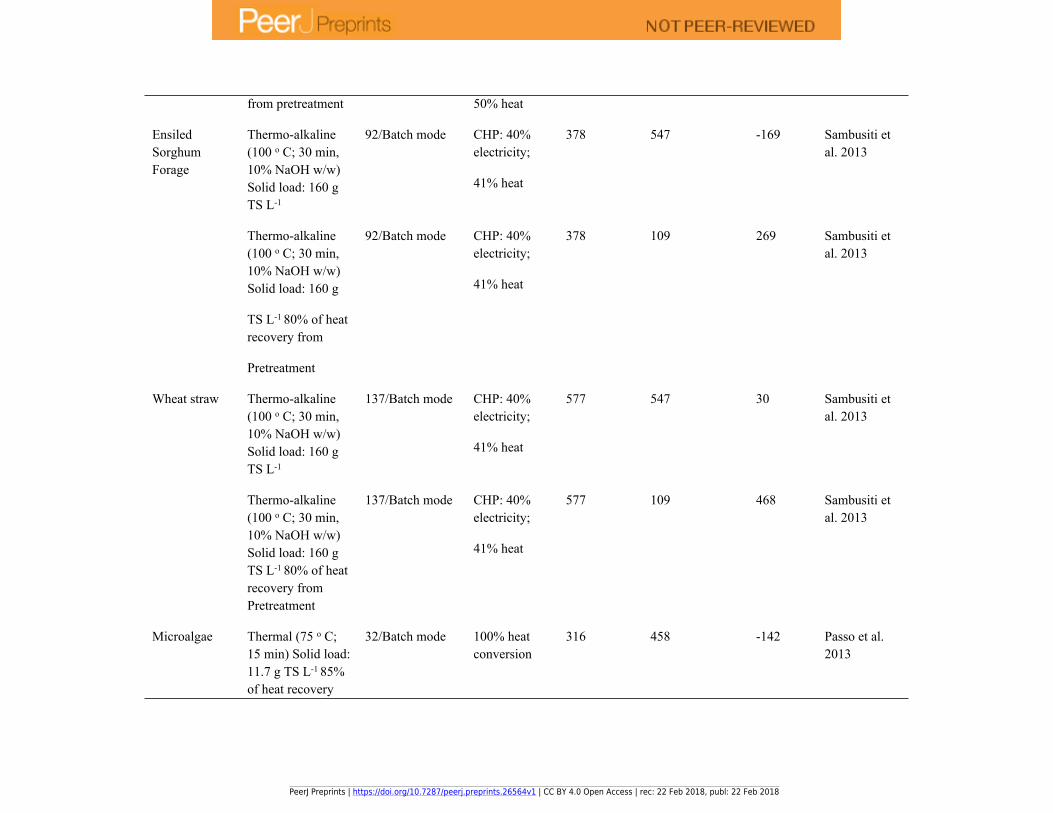
from pretreatment 50% heat
Thermo-alkaline
(100 o C; 30 min,
10% NaOH w/w)
Solid load: 160 g
TS L-1
92/Batch mode CHP: 40%
electricity;
41% heat
378 547 -169 Sambusiti et
al. 2013
Ensiled
Sorghum
Forage
Thermo-alkaline
(100 o C; 30 min,
10% NaOH w/w)
Solid load: 160 g
TS L-1 80% of heat
recovery from
Pretreatment
92/Batch mode CHP: 40%
electricity;
41% heat
378 109 269 Sambusiti et
al. 2013
Thermo-alkaline
(100 o C; 30 min,
10% NaOH w/w)
Solid load: 160 g
TS L-1
137/Batch mode CHP: 40%
electricity;
41% heat
577 547 30 Sambusiti et
al. 2013
Wheat straw
Thermo-alkaline
(100 o C; 30 min,
10% NaOH w/w)
Solid load: 160 g
TS L-1 80% of heat
recovery from
Pretreatment
137/Batch mode CHP: 40%
electricity;
41% heat
577 109 468 Sambusiti et
al. 2013
Microalgae Thermal (75 o C;
15 min) Solid load:
11.7 g TS L-1 85%
of heat recovery
32/Batch mode 100% heat
conversion
316 458 -142 Passo et al.
2013
PeerJ Preprints | https://doi.org/10.7287/peerj.preprints.26564v1 | CC BY 4.0 Open Access | rec: 22 Feb 2018, publ: 22 Feb 2018
from Pretreatment
Thermal (75 o C;
15 min) Solid load:
20 g TS L-1 85% of
heat recovery from
Pretreatment
32/Batch mode 100% heat
conversion
316 268 48 Passo et al.
2013
Thermal (75 o C;
15 min) Solid load:
30 g TS L-1 85% of
heat recovery from
Pretreatment
32/Batch mode 100% heat
conversion
316 173 143 Passo et al.
2013
2
3
4
5
6
7
8
9
10
PeerJ Preprints | https://doi.org/10.7287/peerj.preprints.26564v1 | CC BY 4.0 Open Access | rec: 22 Feb 2018, publ: 22 Feb 2018

Figure 1(on next page)
pH dynamic during the anaerobic digestion process
Each data point indicates the daily pH value obtained during the anaerobic digestion process
PeerJ Preprints | https://doi.org/10.7287/peerj.preprints.26564v1 | CC BY 4.0 Open Access | rec: 22 Feb 2018, publ: 22 Feb 2018
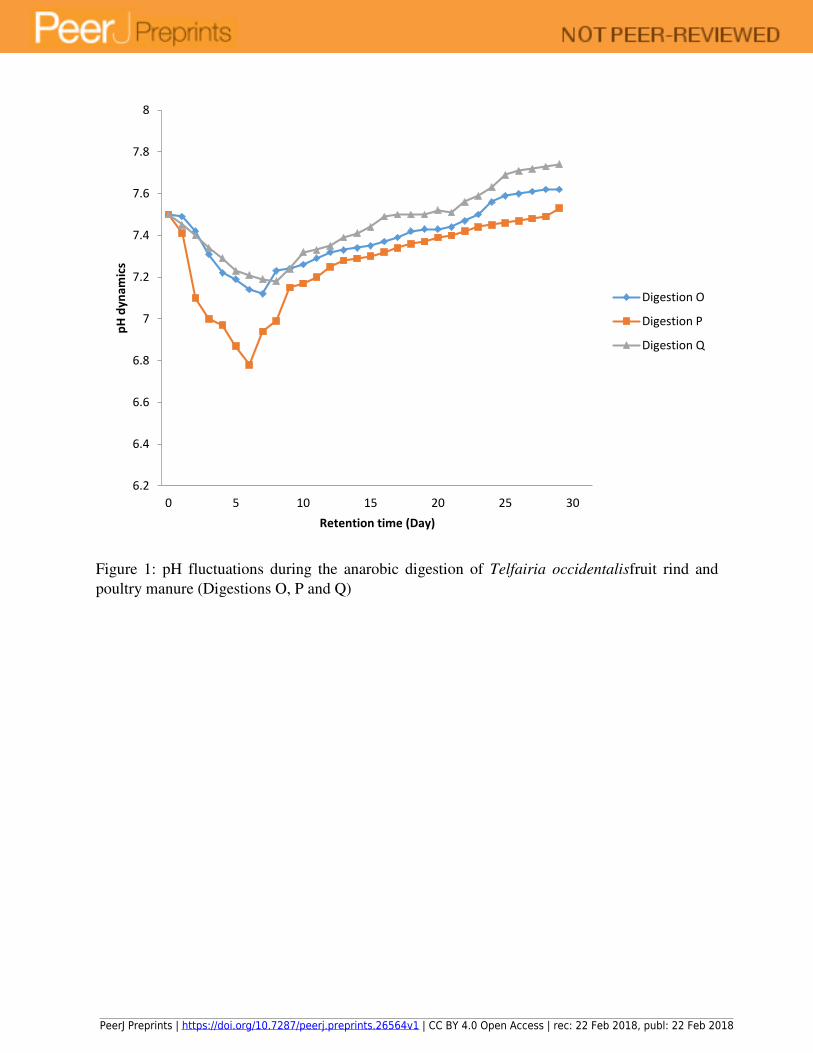
Figure 1: pH fluctuations during the anarobic digestion of Telfairia occidentalisfruit rind and
poultry manure (Digestions O, P and Q)
6.2
6.4
6.6
6.8
7
7.2
7.4
7.6
7.8
8
0 5 10 15 20 25 30
pH
dy
na
mic
s
Retention time (Day)
Digestion O
Digestion P
Digestion Q
PeerJ Preprints | https://doi.org/10.7287/peerj.preprints.26564v1 | CC BY 4.0 Open Access | rec: 22 Feb 2018, publ: 22 Feb 2018
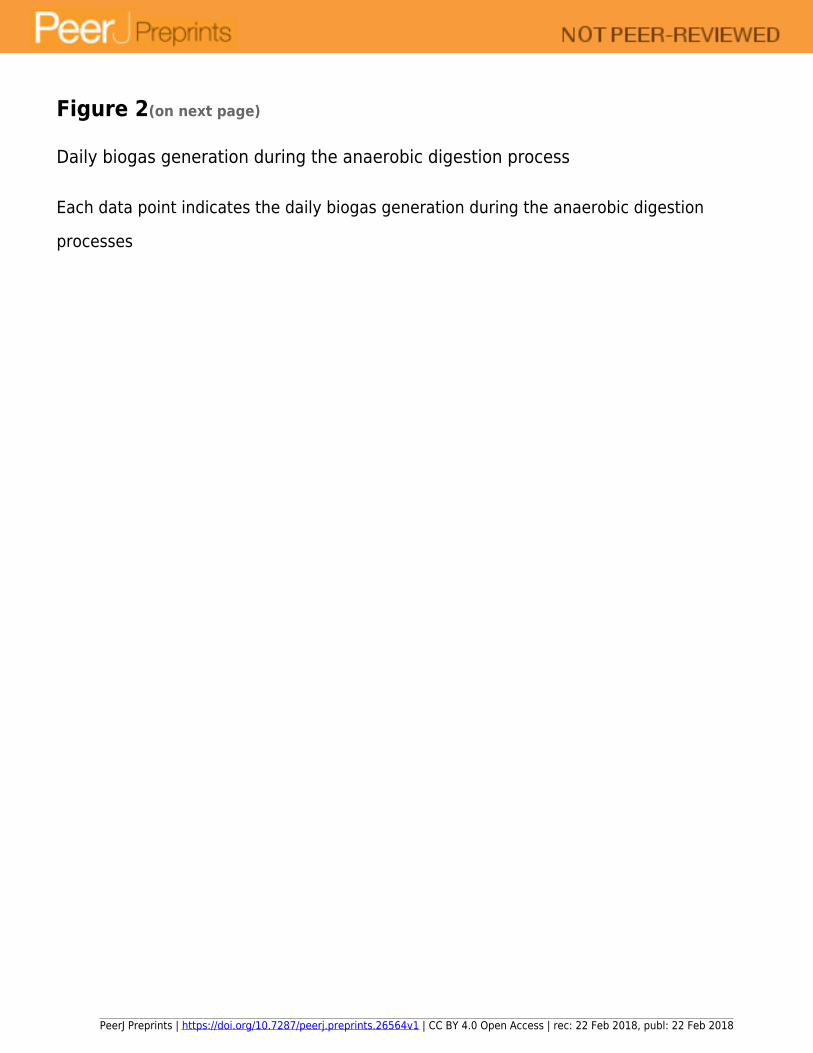
Figure 2(on next page)
Daily biogas generation during the anaerobic digestion process
Each data point indicates the daily biogas generation during the anaerobic digestion
processes
PeerJ Preprints | https://doi.org/10.7287/peerj.preprints.26564v1 | CC BY 4.0 Open Access | rec: 22 Feb 2018, publ: 22 Feb 2018
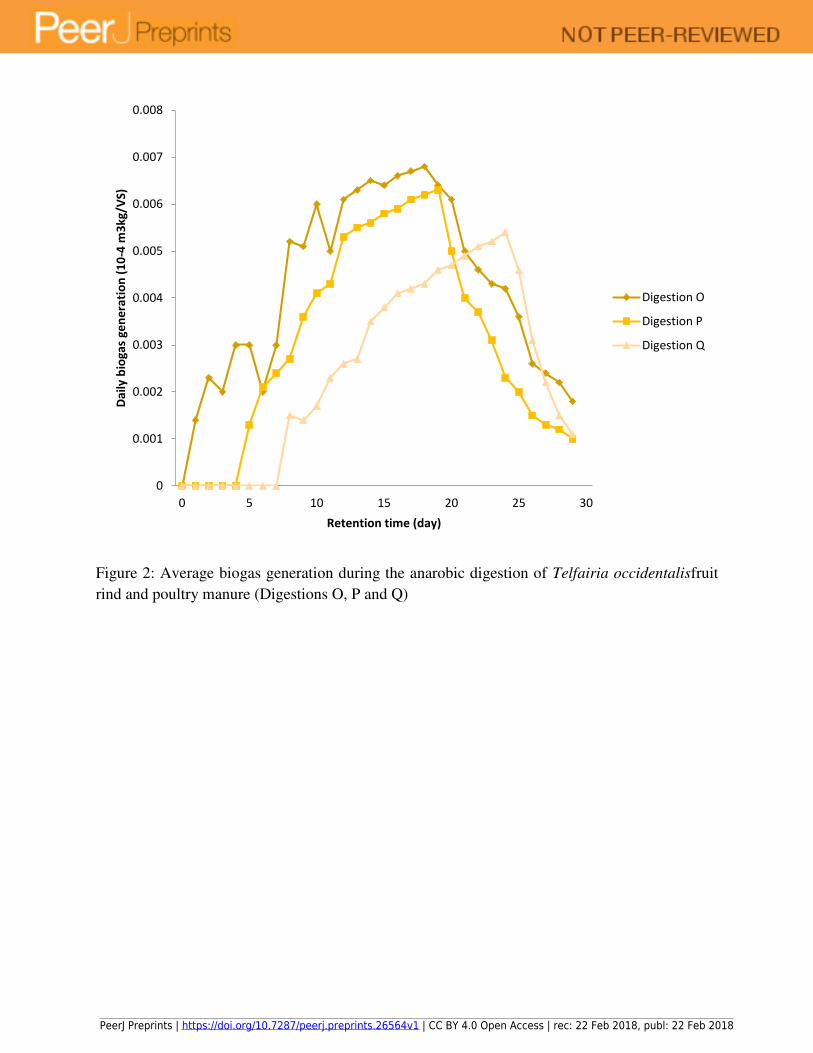
Figure 2: Average biogas generation during the anarobic digestion of Telfairia occidentalisfruit
rind and poultry manure (Digestions O, P and Q)
0
0.001
0.002
0.003
0.004
0.005
0.006
0.007
0.008
0 5 10 15 20 25 30
Da
ily
bio
ga
s g
en
era
tio
n (
10
-4 m
3k
g/V
S)
Retention time (day)
Digestion O
Digestion P
Digestion Q
PeerJ Preprints | https://doi.org/10.7287/peerj.preprints.26564v1 | CC BY 4.0 Open Access | rec: 22 Feb 2018, publ: 22 Feb 2018
Figure 3(on next page)
RSM and ANNs surface plots for the optimization of data during the digestion processes
Each figure shows the RSM and ANNs surface plot showing the interactions between the
variables employed in the optimization study
PeerJ Preprints | https://doi.org/10.7287/peerj.preprints.26564v1 | CC BY 4.0 Open Access | rec: 22 Feb 2018, publ: 22 Feb 2018
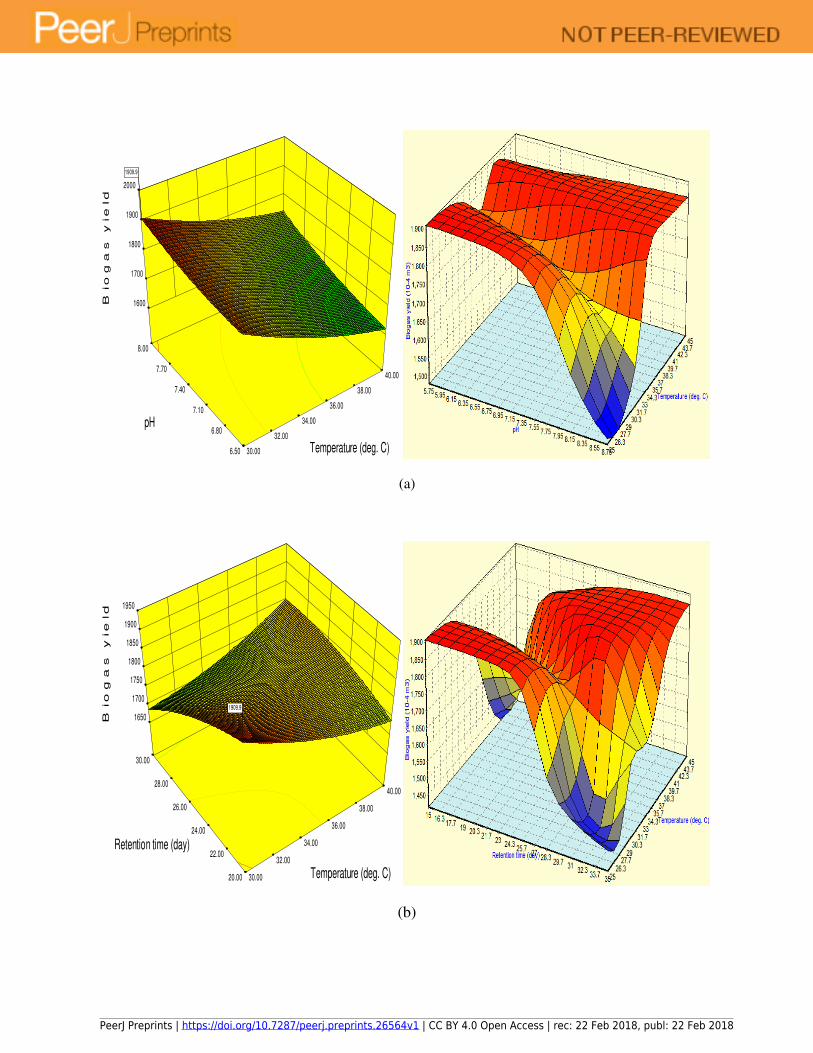
(a)
(b)
6.50
6.80
7.10
7.40
7.70
8.00
30.00
32.00
34.00
36.00
38.00
40.00
1600
1700
1800
1900
2000
B
io
ga
s y
ie
ld
Temperature (deg. C)
pH
1909.91909.9
20.00
22.00
24.00
26.00
28.00
30.00
30.00
32.00
34.00
36.00
38.00
40.00
1650
1700
1750
1800
1850
1900
1950
B
io
ga
s y
ie
ld
Temperature (deg. C)
Retention time (day)
1909.91909.9
PeerJ Preprints | https://doi.org/10.7287/peerj.preprints.26564v1 | CC BY 4.0 Open Access | rec: 22 Feb 2018, publ: 22 Feb 2018

(c)
(d)
4.00
6.00
8.00
10.00
12.00
30.00
32.00
34.00
36.00
38.00
40.00
1650
1700
1750
1800
1850
1900
1950
B
io
ga
s y
ie
ld
Temperature (deg. C)
Total solids (g/kg)
1909.91909.9
4.00
6.00
8.00
10.00
12.00
30.00
32.00
34.00
36.00
38.00
40.00
1650
1700
1750
1800
1850
1900
1950
B
io
ga
s y
ie
ld
Temperature (deg. C)
Volatile solids (g/kg)
1909.91909.9
PeerJ Preprints | https://doi.org/10.7287/peerj.preprints.26564v1 | CC BY 4.0 Open Access | rec: 22 Feb 2018, publ: 22 Feb 2018

(e)
(f)
20.00
22.00
24.00
26.00
28.00
30.00
6.50
6.80
7.10
7.40
7.70
8.00
1650
1700
1750
1800
1850
1900
1950
B
io
ga
s y
ie
ld
pH
Retention time (day)
1909.91909.9
4.00
6.00
8.00
10.00
12.00
6.50
6.80
7.10
7.40
7.70
8.00
1780 1800
1820 1840
1860 1880
1900 1920
B
io
ga
s y
ie
ld
pH Total solids (g/kg)
1909.91909.9
PeerJ Preprints | https://doi.org/10.7287/peerj.preprints.26564v1 | CC BY 4.0 Open Access | rec: 22 Feb 2018, publ: 22 Feb 2018

(g)
(h)
4.00
6.00
8.00
10.00
12.00
6.50
6.80
7.10
7.40
7.70
8.00
1800
1820
1840
1860
1880
1900
1920
B
io
ga
s y
ie
ld
pH Volatile solids (g/kg)
1909.91909.9
4.00
6.00
8.00
10.00
12.00
20.00
22.00
24.00
26.00
28.00
30.00
1600
1700
1800
1900
2000
B
io
ga
s y
ie
ld
Retention time (day) Total solids (g/kg)
1909.91909.9
PeerJ Preprints | https://doi.org/10.7287/peerj.preprints.26564v1 | CC BY 4.0 Open Access | rec: 22 Feb 2018, publ: 22 Feb 2018
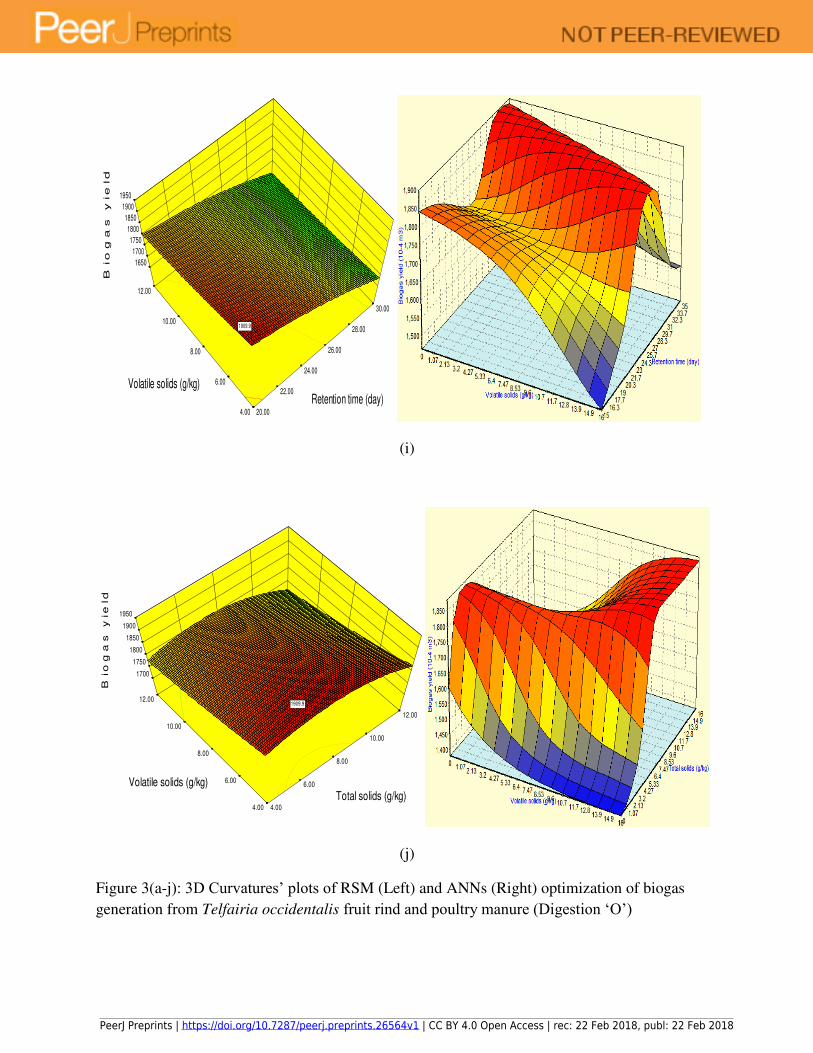
(i)
(j)
Figure 3(a-j): 3D Curvatures’ plots of RSM (Left) and ANNs (Right) optimization of biogas
generation from Telfairia occidentalis fruit rind and poultry manure (Digestion ‘O’)
4.00
6.00
8.00
10.00
12.00
20.00
22.00
24.00
26.00
28.00
30.00
1650
1700
1750
1800
1850
1900
1950
B
io
ga
s y
ie
ld
Retention time (day) Volatile solids (g/kg)
1909.91909.9
4.00
6.00
8.00
10.00
12.00
4.00
6.00
8.00
10.00
12.00
1700
1750
1800
1850
1900
1950
B
iog
as
y
ield
Total solids (g/kg) Volatile solids (g/kg)
1909.91909.9
PeerJ Preprints | https://doi.org/10.7287/peerj.preprints.26564v1 | CC BY 4.0 Open Access | rec: 22 Feb 2018, publ: 22 Feb 2018

Figure 4(on next page)
Importance level of each parameter
Each point indicates the order of importance of all the five variables employed in the
optimization study
PeerJ Preprints | https://doi.org/10.7287/peerj.preprints.26564v1 | CC BY 4.0 Open Access | rec: 22 Feb 2018, publ: 22 Feb 2018
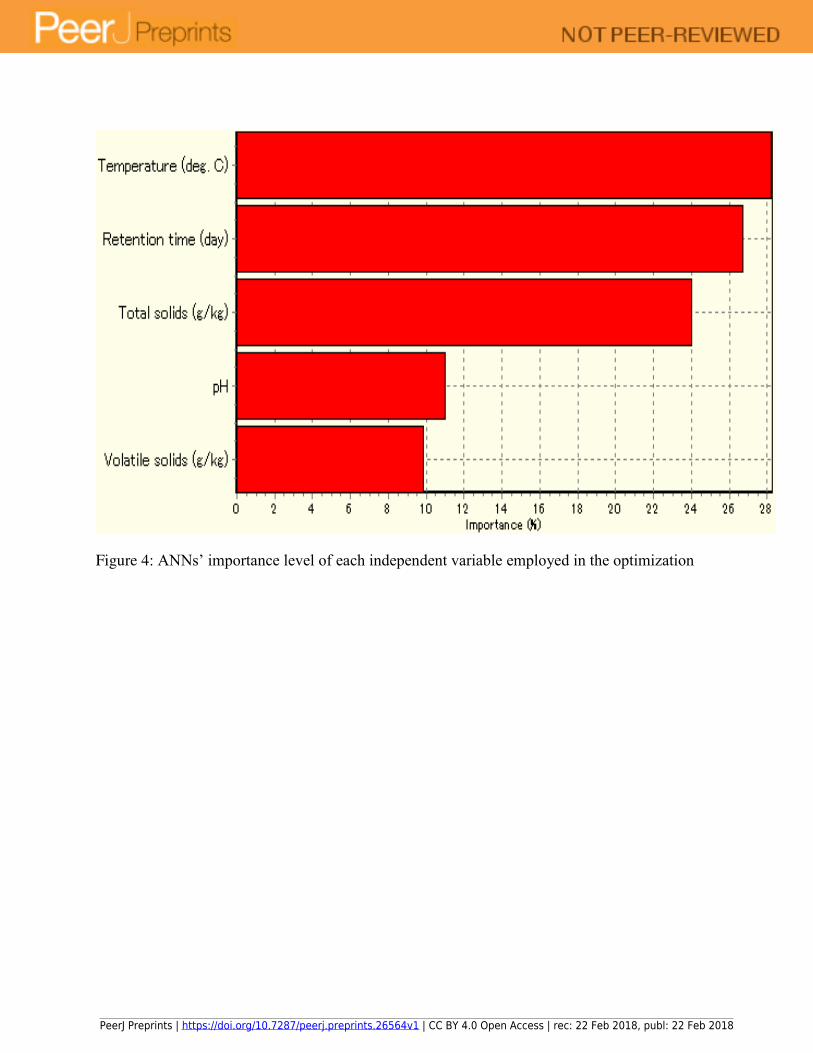
Figure 4: ANNs’ importance level of each independent variable employed in the optimization
PeerJ Preprints | https://doi.org/10.7287/peerj.preprints.26564v1 | CC BY 4.0 Open Access | rec: 22 Feb 2018, publ: 22 Feb 2018