bioassay of reserpine for possibl ... cance institutr e carcinogenesis technical repor seriet s no....
TRANSCRIPT
National Cancer Institute CARCINOGENESIS Technical Report Series No. 193 NTP No. 80-16
BIOASSAY OF
RESERPINE
FOR POSSIBLE CARCINOGENICITY
CAS No. 50-55-5
NCI-CG-TR-193
NTP-80-16
U.S. DEPARTMENT OF HEALTH AND HUMAN SERVICES Public Health Service National Institutes of Health


BIOASSAY OF
RESERPINE
FOR POSSIBLE CARCINOGENICITY
Carcinogenesis Testing Program National Cancer Institute
National Institutes of Health Bethesda, Maryland 20205
and National Toxicology Program
Research Triangle Park Box 12233
North Carolina 27709
U.S.DEPARTMENT OF HEALTH AND HUMAN SERVICES Public Health Service
National Institutes of Health
NIH Publication No. 80-1749 Reprinted November 1982
(Because a portion of Table 8 on page 33 was omitted inadvertently from the August 1980 issue.)

ii

BIOASSAY OF RESERPINE
FOR POSSIBLE CARCINOGENICITY
Carcinogenesis Testing Program National Cancer Institute/National Toxicology Program
FOREWORD
This report presents the results of the bioassay of reserpine conducted for the Carcinogenesis Testing Program, National Cancer Institute (NCI)/ National Toxicology Program (NTP). This is one of a series of experiments designed to determine whether selected chemicals have the capacity to produce cancer in animals. A negative result, in which the test animals do not have a greater incidence of cancer than control animals, does not necessarily mean that the test chemical is not a carcinogen, inasmuch as the experiments are conducted under a limited set of circumstances. A positive result demonstrates that the test chemical is carcinogenic for animals under the conditions of the test and indicates that exposure to the chemical is a potential risk to man. The actual determination of the risk to man from chemicals found to be carcinogenic in animals requires a wider analysis.
CONTRIBUTORS
This bioassay of reserpine was conducted by Southern Research Institute, Birmingham, Alabama, initially under direct contract to NCI (1) and later under a subcontract to Tracor Jitco, Inc., Rockville, Maryland, prime contractor for the NCI Carcinogenesis Testing Program.
The experimental design and doses were determined by Drs. J. D. Prejean (2) and 0. G. Fitzhugh (3,4). The principal investigator was Dr. Prejean (2). Mr. J. Belzer (2) and Mr. I. Brown (2) were responsible for the care of the laboratory animals and the administration of the test chemical. Data management and retrieval were performed by Ms. C. A. Prejean (2). Histopathologic examinations were performed by Drs. R. B. Thompson (2) and J. C. Peckham (2). The diagnoses included in this report represent the interpretations of Drs. Thompson and Peckham, whose findings were reviewed by Drs. Morton H. Levitt (5), John Sagartz (3), and Sherman Stinson (1) with Quality Review by Dr. Jerry Hardisty (6).
Animal pathology tables and survival tables were compiled at EG&G Mason Research Institute (7). Statistical analyses were performed by Dr. J. R. Joiner (3), using methods selected for the bioassay program by Dr. J. J. Gart (8). Chemicals used in this bioassay were analyzed at Midwest Research Institute (9) under the direction of Dr. E. Murrill. Dosage analysis was performed by Ms. L. Burford (2) and Ms. R. James (2). The results of these analyses were reviewed by Dr. C. W. Jameson (3,10).
ill
This report was prepared at Tracer Jitco (3) under the direction of NCI. Those responsible for the report at Tracor Jitco were Dr. C. R. Angel, Acting Director of the Bioassay Program; Dr. S. S. Olin, Deputy Director for Science; Dr. J. F. Robens (11), toxicologist; Drs. R. L. Schueler and J. W. Sagartz, pathologists; Ms. L. A. Owen and Mr. W. D. Reichardt, bioscience writers; and Dr. E. W. Gunberg, technical editor, assisted by Ms. Y. E. Presley.
The following scientists at NCI/NTP were responsible for evaluating the bioassay experiment, interpreting the results, and reporting the findings: Dr. Kenneth C. Chu, Dr. Cipriano Cueto Jr. (12), Dr. J. Fielding Douglas, Dr. Richard A. Griesemer, Dr. Charles K. Grieshaber, Dr. Thomas E. Hamm, Dr. William V. Hartwell, Dr. Morton H. Levitt, Dr. Harry Mahar, Dr. Harry A. Milman, Dr. Thomas W. Orme, Dr. A. R. Patel (13), Dr. Marcelina B. Powers, Dr. Sherman F. Stinson, Dr. Jerrold M. Ward, and Dr. Carrie E. Whitmire.
(1) Carcinogenesis Testing Program, National Cancer Institute, National Institutes of Health, Bethesda, Maryland and National Toxicology Program, Research Triangle Park, North Carolina.
(2) Southern Research Institute, 2000 Ninth Avenue South, Birmingham, Alabama.
(3) Tracor Jitco, Inc., 1776 East Jefferson Street, Rockville, Maryland. (4) 4208 Dresden Street, Kensington, Maryland. (5) Office of Director, Division of Cancer Cause and Prevention, National
Cancer Institute, National Institutes of Health, Bethesda, Maryland. (6) Experimental Pathology Laboratories, Inc., Herndon, Virginia. (7) EG&G Mason Research Institute, 1530 East Jefferson Street, Rockville,
Maryland. (8) Mathematical Statistics and Applied Mathematics Section, Biometry
Branch, Field Studies and Statistics, Division of Cancer Cause and Prevention, National Cancer Institute, National Institutes of Health, Bethesda, Maryland.
(9) Midwest Research Institute, 425 Volker Boulevard, Kansas City, Missouri.
(10) Now with the Carcinogenesis Testing Program. (11) Now with Bureau of Veterinary Medicine, Food and Drug Administration,
5600 Fishers Lane, Rockville, Maryland. (12) Now with Litton Bionetics, Inc., 5516 Nicholson Lane, Kensington,
Maryland. (13) Special Programs, Division of Cancer Cause and Prevention, National
Cancer Institute, National Institutes of Health, Bethesda, Maryland.
iv

SUMMARY
A bioassay for possible carcinogenicity of reserpine, an antihypertensive drug for human use, was conducted by administering the test chemical in feed to F344 rats and B6C3F1 mice.
Groups of 50 rats and 50 mice of each sex were administered reserpine at two doses, 5 ppm or 10 ppm, for 103 weeks and then observed for an additional 2 weeks. Matched controls consisted of groups of 50 untreated rats and 50 untreated mice of each sex. All surviving animals were killed and necropsied at the end of 104 or 105 weeks.
The significant effects that could be related to administration of reserpine at the doses used were decreased body weight and increased tumor formation in dosed male rats and in mice of both sexes. Dosed male rats had an increased incidence of adrenal medullary pheochromocytomas. Among dosed mice, some males developed undifferentiated carcinomas of the seminal vesicles, which rarely occur in control mice, and females had an increased incidence of mammary cancer.
It was concluded that, under the conditions of the bioassay, reserpine was carcinogenic in male rats and in mice of both sexes, producing three different kinds of cancers. Reserpine was not carcinogenic for female rats, but they may not have received a high enough dose for maximum test sensitivity.
v

•H

TABLE OF CONTENTS
I. Introduction
II. Materials and Methods.
A. Chemical 5 B. Dietary Preparation 5 C. Animals 6 D. Animal Maintenance 7 E. Subchronic Studies 8 F. Chronic Studies 11 G. Clinical Examinations and Pathology 11 H. Data Recording and Statistical Analyses 13
III. Results - Rats 15
A. Body Weights and Clinical Signs (Rats) 15 B. Survival (Rats) 15 C. Pathology (Rats) 15 D. Statistical Analyses of Results (Rats) 18
IV. Results - Mice 27
A. Body Weights and Clinical Signs (Mice) 27 B. Survival (Mice) 27 C. Pathology (Mice) 27 D. Statistical Analyses of Results (Mice) 32
V. Discussion 35
VI. Bibliography 39
APPENDIXES
Appendix A Summary of the Incidence of Neoplasms in Rats Administered Reserpine in the Diet 43
Table Al Summary of the Incidence of Neoplasms in Male Rats Administered Reserpine in the Diet 45
Table A2 Summary of the Incidence of Neoplasms in Female Rats Administered Reserpine in the Diet 49
Appendix B Summary of the Incidence of Neoplasms in Mice Administered Reserpine in the Diet 53
Vll

Table Bl Summary of the Incidence of Neoplasms in Male Mice Administered Reserpine in the Diet 55
Table B2 Summary of the Incidence of Neoplasms in Female Mice Administered Reserpine in the Diet 59
Appendix C Summary of the Incidence of Nonneoplastic Lesions in Rats Administered Reserpine in the Diet 63
Table Cl Summary of the Incidence of Nonneoplastic Lesions in Male Rats Administered Reserpine in the Diet 65
Table C2 Summary of the Incidence of Nonneoplastic Lesions in Female Rats Administered Reserpine in the Diet 70
Appendix D Summary of the Incidence of Nonneoplastic Lesions in Mice Administered Reserpine in the Diet 75
Table Dl Summary of the Incidence of Nonneoplastic Lesions in Male Mice Administered Reserpine in the Diet
Table D2 Summary of the Incidence of Nonneoplastic Lesions in Female Mice Administered Reserpine in the Diet 81
Appendix E Analysis of Reserpine 85
Appendix F Analyses of Formulated Diets for Concentrations of Reserpine
Appendix G Analyses of Formulated Diets for Stability of Reserpine
Appendix H Analyses of the Incidence of Adrenal Lesions in Male Rats as Reported by Capen, G. G., Holland, J. M., and Nielson, S. W 101
TABLES
Table 1 Dose Levels, Survival, and Mean Body Weights of Rats and Mice Fed Reserpine for 14 Days 9
Vlll

Table 2 Dose Levels, Survival, and Mean Body Weights of F344 Rats and B6C3F1 Mice Fed Reserpine for 13 Weeks 10
Table 3 Experimental Design for Chronic Reserpine Feeding Studies in F344 Rats and B6C3F1 Mice 12
Table 4 Incidence of Adrenal Medullary Tumors in Male Rats 19
Table 5 Analyses of the Incidence of Primary Tumors in Male Rats Administered Reserpine in the Diet 21
Table 6 Analyses of the Incidence of Primary Tumors in Female Rats Administered Reserpine in the Diet 24
Table 7 Incidence of Inflammatory, Proliferative, and Neoplastic Lesions of the Seminal Vesicles in Male and Mammary Glands in Female Mice 31
Table 8 Analyses of the Incidence of Primary Tumors in Male Mice Administered Reserpine in the Diet 33
Table 9 Analyses of the Incidence of Primary Tumors in Female Mice Administered Reserpine in the Diet 34
FIGURES
Figure 1 Growth Curves for Rats Administered Reserpine in the Diet 16
Figure 2 Survival Curves for Rats Administered Reserpine in the Diet 17
Figure 3 Growth Curves for Mice Administered Reserpine in the Diet 28
Figure 4 Survival Curves for Mice Administered Reserpine in the Diet 29
Figure 5 Infrared Absorption Spectrum of Reserpine 90
Figure 6 Nuclear Magnetic Resonance Spectrum of Reserpine 91
ix

I. INTRODUCTION
CH30
OOC
OCH3RESERPINE
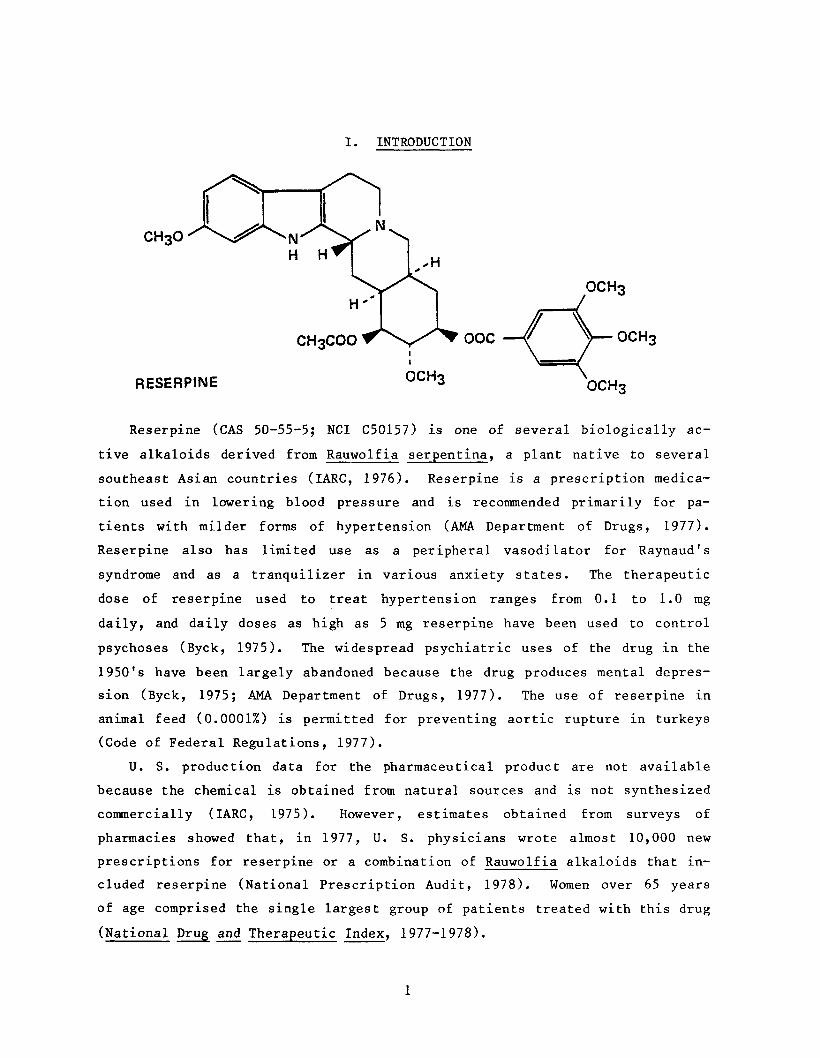
Reserpine (CAS 50-55-5; NCI C50157) is one of several biologically ac
tive alkaloids derived from Rauwolfia serpentina, a plant native to several
southeast Asian countries (IARC, 1976). Reserpine is a prescription medica
tion used in lowering blood pressure and is recommended primarily for pa
tients with milder forms of hypertension (AMA Department of Drugs, 1977).
Reserpine also has limited use as a peripheral vasodilator for Raynaud's
syndrome and as a tranquilizer in various anxiety states. The therapeutic
dose of reserpine used to treat hypertension ranges from 0.1 to 1.0 mg
daily, and daily doses as high as 5 mg reserpine have been used to control
psychoses (Byck, 1975). The widespread psychiatric uses of the drug in the
1950's have been largely abandoned because the drug produces mental depres
sion (Byck, 1975; AMA Department of Drugs, 1977). The use of reserpine in
animal feed (0.0001%) is permitted for preventing aortic rupture in turkeys
(Code of Federal Regulations, 1977).
U. S. production data for the pharmaceutical product are not available
because the chemical is obtained from natural sources and is not synthesized
commercially (IARC, 1975). However, estimates obtained from surveys of
pharmacies showed that, in 1977, U. S. physicians wrote almost 10,000 new
prescriptions for reserpine or a combination of Rauwo1fia alkaloids that in
cluded reserpine (National Prescription Audit, 1978). Women over 65 years
of age comprised the single largest group of patients treated with this drug
(National Drug and Therapeutic Index, 1977-1978).

The Rauwolfia alkaloids deplete norepinephrine from tissues (Byck,
1975). This hormone normally binds to receptors on post-ganglionic nerve
endings of the sympathetic nervous system, where it serves as a transmitter
substance. Following its synthesis, norepinephrine is stored in cytoplasmic
granules to prevent its destruction by intracellular monoamine oxidase
(Koelle, 1975). Extremely low concentrations of reserpine block the ATP-
catalyzed uptake of norepinephrine at these storage sites, resulting in a
sharp reduction in the physiological levels of norepinephrine (Koelle,
1975). Depletion occurs in the brain, the heart, and in the adrenal medulla
as well as in adrenergic nerve endings (Gosselin et al., 1976; Innes and
Nickerson, 1975). the cardiovascular effects, i.e., the antihypertensive
effect, and many other pharmacological effects of reserpine are attributed
to this blocking action (Nickerson and Collier, 1975; AMA Department of
Drugs, 1977). Reserpine also has other actions, including peripheral vaso
dilatation in normal and sympathectomized human extremities when adminis
tered intraarterially, direct depression of myocardial function, and a vari
ety of endocrine actions in experimental animals, e.g., altering secretion
of hypothalamic regulatory hormones and increasing prolactin secretion
(Nickerson and Collier, 1975). 14
Reserpine-C given intravenously to rats was cleared from the blood
rapidly and reached a peak in tissues in 1 hour. After 24 hours, the label
was found only in fat tissue and the liver (Sheppard et al., 1955). In
mice, 70% of a radiolabeled material was recovered in urine 24 hours after
oral feeding of reserpine C (Numerof et al., 1954).
Reserpine is rapidly absorbed from the gastrointestinal tract in man
(Maass et al., 1969; Byck, 1975). The rate of clearance from plasma is bi
phasic, with the first phase having a half-life of 4.5 hours and the second
271 hours. Although between 63% and 75% of the drug is excreted in 4 days,
elimination is still apparent at 11 days (Maass et al., 1969). Pharmaco
logical effects persist after elimination is complete (Byck, 1975).
In a study to test the effects of alkaloids on chromosomes, cultures of
human peripheral leucocytes were exposed to aqueous suspensions of reser
pine. At concentrations ranging from 2.5 to 25.0 /ig/ml, no chromosomal ab
errations were observed, but a definite increase in the number of mitotic
figures occurred at all concentrations (Bishun et al., 1975).
The LD_n of reserpine administered intravenously to rats of unidenti
fied strain was reported to be 15 rag/kg body weight (Usdin and Efron, 1972).
In mice (unidentified strain), the oral LD was 500 mg/kg and the intra
peritoneal LD was 70 mg/kg (Usdin and Efron, 1972).
Reserpine was selected by the Carcinogenesis Bioassay Program because
reports from the Boston Collaborative Drug Surveillance Program (1974) as
well as other epidemiological studies indicated that women receiving long-
term therapy with reserpine had an increased incidence of breast cancer.
Although these results have not been corroborated (IARC, 1976), they indi
cated the necessity for a bioassay for possible carcinogenicity of this drug.


II. MATERIALS AND METHODS
A. Chemical
The reserpine used for the study was obtained in a single batch (Lot No.
6230-LOA-2) from S. B. Penick and Company, Lyndhurst, New Jersey. The purity
of this batch, according to the manufacturer, met United States Pharmacopeia
(USP) specifications. The identity and purity of the batch was confirmed
and the USP specifications verified by analysis at Midwest Research Insti
tute. The analyses included elemental analysis, melting point, optical
rotation, nonaqueous titration with perchloric acid, thin-layer and high
pressure liquid chromatography, and ultraviolet, infrared, and nuclear
magnetic resonance spectrometry (Appendix E). The melting point was 260
to 267 C with decomposition. Elemental analyses (C, H, N) were correct
for C,,H,0N20-, the molecular formula of reserpine. A purity of
97.8%̂ 1.0% was determined by comparing a sample of the test compound with a
USP reserpine reference standard using visible spectrometric analysis. Non-
aqueous titration of secondary amine groups with perchloric acid indicated
a purity of 101.0%+0.7(j)%. Thin-layer chromatography showed a major spot
that was identical to that of a USP reserpine reference standard along with
two trace impurities. High-pressure liquid chromatography indicated a 0.5%
impurity that was not identified. Ultraviolet, visible, infrared and nu
clear magnetic resonance spectra were consistent with the structure.
The chemical was stored in the original container at room temperature.
Values similar to those at the initiation of the bioassay were obtained upon
reanalysis of this batch at the completion of the bioassay.
B. Dietary Preparation
Dosed feed mixtures were prepared every 2 weeks by mixing a known amount
of the reserpine with a small amount of Wayne Lab-Blox Meal (Allied Mills,

Chicago, 111.) and then adding this premix to the required amount of animal
meal and mixing in an 8-quart twin-shell blender for 10 to 15 minutes.
The batch was divided and the half used for feeding the first week was
kept at 22 C. The other half was stored at 5 C and used for feeding the
second week. During use, the second portion was stored at 22 C.
Theoretical concentrations of reserpine in formulated diets were checked
analytically at intervals during the chronic study to assess the accuracy of
the diet preparation and the homogeneity of the mixture. Results are sum
marized in Appendix F. At each dietary concentration (5 ppm and 10 ppm),
the mean of the analytical concentration for the samples checked was within
12% of the theoretical concentration, and the coefficient of variation did
not exceed 22.9%.
The stability of reserpine in feed was satisfactory, as indicated by its
presence in aliquots for analysis of chemical/vehicle mixtures stored at
5 C for various lengths of time up to 11 months and in chemical/vehicle
mixtures stored up to a week (at 22 C, the conditions of the bioassay).
For example, mean values were 10.4 ppm (+0.25) for the high dose (10 ppm)
stored at 5 C and 11.7 ppm (_+0.1&) for the dose stored at 22 C for ap
proximately 1 week (Appendix G).
C. Animals
Male and female F344 rats and B6C3F1 mice were obtained as 4-week old
weanlings, all within 3 days of the same age, from the NCI Frederick Cancer
Research Center (Frederick, Md.). The animals were acclimated within the
test facility for 1 week and then assigned to cages on a weight basis. The
initial weights of male rats used in the chronic study ranged from 73 to 106
g; female rats, 62 to 89 g; male mice, 15 to 21 g; and female mice, 13 to 17
g. Individual animals were identified by ear punch.

D. Animal Maintenance
The animals were housed five per cage in stainless steel solid bottom
cages (Hahn Roofing and Sheet Metal Co., Birmingham, Ala.): rats in 16" x
16" x 6" cages, and mice in 9" x 6" x 4" cages. The bedding used was heat-
treated hardwood chips (Beta-Chips, Northeastern Products Corp., Warrens-
burg, N.Y.). Rat and mouse cages were covered with disposable filter caps
(Negus Animal Container Co., Madison, Wis.). Wayne Lab-Blox meal (Allied
Mills, Inc., Chicago, 111.) was used during the period the reserpine was ad
ministered and pellets were used thereafter. The feed was provided
ad libitum and replenished once per week. Tap water (with no further addi
tives) was supplied ad libitum.
Cages, cage covers, and fresh bedding were replaced twice a week. Feed
hoppers and water bottles with sipper tubes and stoppers were provided once
a week. All equipment was washed in industrial tunnel-type cage washers us
ing Elect detergent (sodium tripolyphosphate, sodium silicate, sodium car
bonate, and modified polyethyloxylated alcohol; percentages not available)
at 82 C. Disposable cage filter bonnets were changed once a month.
Animal rooms were maintained at 20 to 24 C, and relative humidity
was 40% to 60%. Incoming air and exhaust air were passed through fiberglass
roughing filters at a rate that allowed 15 changes per hour. Air pressure
in the animal rooms was positive to the hallway and negative to the rest of
the building, with no movement of air between rooms. Fluorescent lighting
was used 9 hours per day.
Rats fed reserpine were housed in the same room with rats fed FANFT (2
formylamino-4-(5-nitro-2-furyl)thiazole) (CAS 24554-26-5) between day 94 and
day 289 of the reserpine study. On day 229 of the reserpine study, FANFT
diets were replaced with control diets and the animals that had been treated
with FANFT were observed for an additional 60 days. Mice were housed with
mice being treated with the following chemicals:
(CAS 23214-92-8) adriamycin (CAS 645-05-6) hexamethylmelamine (CAS 7008-42-6) acronycine (CAS 3546-10-9) phenesterin
At week 80, the mice fed reserpine and their controls were moved to a separate room.
E. Subchronic Studies
Two Subchronic feeding studies were conducted to determine the concen
trations to be used in the chronic studies (referred to in this report as
"low" and "high" doses).
Preliminary to the chronic study, a 14-day feeding study was performed
with groups of five male and five female rats and mice which were fed diets
containing one of five doses. Table 1 shows the doses fed, survival of ani
mals, and mean body weight of each dosed group at the end of the 14-day
study. At the end of the 14 days, the animals were killed and necropsied.
Histopathologic changes consisted of suppressed spermatogenesis in male rats
at 600 or 200 ppm, spleen and thymus atrophy in most male or female rats at
600 or 200 ppm and in most male or female mice at 20 ppm or greater, and
bone marrow atrophy in most male and female rats at 60 ppm or greater. At
20 ppm, 2/5 male and 0/5 female mice survived, with bone marrow atrophy in
2/5 females. No lesions, except thymus atrophy in one female mouse, oc
curred in the rats or mice fed 6 ppm, the concentration selected as the high
dose for the 13-week Subchronic study.
In the 13-week Subchronic study, groups of 10 male and 10 female rats
and mice were fed diets containing reserpine at one of five doses, and
groups of 10 control animals of each sex were fed basal diet. Each animal
was observed twice a day and was weighed once a week. Table 2 shows the
doses fed, the survival of animals in each dosed group at the end of the
study, and the mean body weight of each dosed group at week 13, expressed as
a percentage of the mean body weight of the corresponding controls. At the
end of the 13 weeks, the animals were killed and necropsied.
No deaths occurred in any of the control or dosed groups of rats or
mice. No decreases in mean body weight were observed in the rats; but meas
urable depression occurred in the mean body weights of dosed groups of mice.
No gross or microscopic lesions that could be related to feeding of reser
pine were observed in either species.
The low and high doses for the chronic studies were set at 5 ppm and 10
ppm for both rats and mice.

__
Table 1. Dose Levels, Survival, and Mean Body Weights of Rats and Mice Fed Reserpine for 14 Days
Dose (ppm)
Rats
6
20
60
200
600
Mice
6
20
60
200
600
Male
Survival (a)
5/5
5/5
5/5
4/5
0/5
5/5
2/5
0/5
0/5
0/5
Mean Body Weight at Day 14 (grams)
186
153
115
60
—
17
13
—
—
Female
Survival(a)
5/5
5/5
5/5
0/5
0/5
5/5
0/5
0/5
0/5
0/5
Mean Body Weight at Day 14 (grams)
129
116
79
—
—
15
—
—
—
—
(a) Number surviving/number in group.

Table 2. Dose Levels, Survival, and Mean Body Weights of F344 Rats and B6C3F1 Mice Fed Reserpine for 13 Weeks
Male Female
Mean Weight Mean Weight at Week 13 at Week 13
Dose as % of as % of (ppm) Survival (a) Control Survival (a) Control
Rats
0 10/10 100 10/10 100
0.4 10/10 107 10/10 105
0.8 10/10 106 10/10 107
1.5 10/10 100 10/10 101
3.0 10/10 100 10/10 101
6.0 10/10 103 10/10 106
Mice
0 10/10 100 10/10 100
0.4 10/10 91 10/10 93
0.8 10/10 94 10/10 89
1.5 10/10 85 10/10 93
3.0 10/10 88 10/10 93
6.0 10/10 85 10/10 85
(a) Number surviving/number in group.
10

F. Chronic Studies
The number of animals per group, doses administered, and durations of
the chronic feeding studies are shown in Table 3.
G. Clinical Examinations and Pathology
All animals were observed twice daily, and observations of sick, tumor-
bearing, and moribund animals were recorded. Clinical examination and pal
pation for masses were performed each month, and the animals were weighed at
least once per month. Moribund animals and animals that survived to the end
of the bioassay were killed using carbon dioxide and necropsied.
Gross and microscopic examinations were performed on major tissues,
major organs, and all gross lesions from killed animals and from animals
found dead. The tissues were preserved in 10% neutral buffered formalin,
embedded in paraffin, sectioned, and stained with hematoxylin and eosin.
The following tissues were examined microscopically: skin (abdominal),
lungs and bronchi, trachea, bone, bone marrow (femur) and thigh muscle,
spleen, lymph nodes, thymus, heart, salivary glands, liver, pancreas, esoph
agus, stomach, duodenum, jejunum, ileum, cecum, colon, kidney, urinary
bladder, pituitary, adrenal, thyroid, parathyroid, testis, prostate, mammary
gland, uterus, ovary, brain, epididymus, eye, and all tissue masses. Pe
ripheral blood smears also were made for all animals, whenever possible.
Necropsies were performed on all animals found dead, unless precluded in
whole or in part by autolysis or cannibalization. Thus, the number of ani
mals from which particular organs or tissues were examined microscopically
varies and does not necessarily represent the number of animals that were
placed on study in each group.
11

Table 3. Experimental Design for Chronic Reserpine Feeding Studies in F344 Rats and B6C3F1 Mice
Sex and Initial Reserpine Time on Study Test No. of in Diet (b) Dosed Observed Group Animals (a) (ppm) (weeks) (weeks)
Male
Matched-Control 50 0 104
Low-Dose 50 5 103 2
High-Dose 50 10 103 1-2
Female
Matched-Control 50 0 104
Low-Dose 50 5 103 2
High-Dose 50 10 103 2
(a) All animals were 5 weeks of age when placed on study. (b) Test and control diets were provided ad libitum 7 days per week.
12

H. Data Recording and Statistical Analyses
Data on this experiment were recorded in the Carcinogenesis Bioassay
Data System (Linhart et al., 1974). The data elements include descriptive
information on the chemicals, animals, experimental design, clinical obser
vations, survival, body weight, and individual pathologic results, as recom
mended by the International Union Against Cancer (Berenblum, 1969).
Probabilities of survival were estimated by the product-limit procedure
of Kaplan and Meier (1958) and are presented in this report in the form of
graphs. Animals were statistically censored as of the time that they died
of other than natural causes or were found to be missing; animals dying from
natural causes were not statistically censored. Statistical analyses for a
possible dose-related effect on survival used the method of Cox (1972) for
testing two groups for equality and Tarone's (1975) extensions of Cox's
methods for testing for a dose-related trend. One-tailed P values have been
reported for all tests except the departure from linearity test, which is
reported only when its two-tailed P value is less than 0.05.
The incidence of neoplastic or nonneoplastic lesions has been given as
the ratio of the number of animals bearing such lesions at a specific ana
tomic site (numerator) to the number of animals in which that site is ex
amined (denominator). In most instances, the denominators included only
those animals for which that site was examined histologically. However,
when macroscopic examination was required to detect lesions prior to histo
logic sampling (e.g., skin or mammary tumors), or when lesions could have
appeared at multiple sites (e.g., lymphomas), the denominators consist of
the numbers of animals necropsied.
The purpose of the statistical analyses of tumor incidence is to deter
mine whether animals receiving the test chemical developed a significantly
higher proportion of tumors than did the control animals. As a part of
these analyses, the one-tailed Fisher exact test (Cox, 1970) was used to
compare the tumor incidence of a control group with that of a group of dosed
animals at each dose level. When results for two dosed groups are compared
simultaneously with those for a control group, a correction to ensure an
13

overall significance level of 0.05 may be made. The Bonferroni inequality
(Miller, 1966) requires that the P value for any comparison be less than or
equal to 0.025.
The Cochran-Armitage test for linear trend in proportions, with continu
ity correction (Armitage, 1971), was also used. Under the assumption of a
linear trend, this test determines if the slope of the dose-response curve
is different from zero at the one-tailed 0.05 level of significance. Unless
otherwise noted, the direction of the significant trend is a positive dose
relationship. This method also provides a two-tailed test of departure from
linear trend.
The approximate 95 percent confidence interval for the relative risk of
each dosed group compared to its control was calculated from the exact in
terval on the odds ratio (Gart, 1971).
The lower and upper limits of the confidence interval of the relative
risk have been included in the tables of statistical analyses. The interpre
tation of the limits is that, in approximately 95% of a large number of
identical experiments, the true ratio of the risk in a dosed group of ani
mals to that in a control group would be within the interval calculated from
the experiment. When the lower limit of the confidence interval is greater
than one, it can be inferred that a statistically significant result has oc
curred (P less than 0.025 one-tailed test when the control incidence is not
zero, P less than 0.050 when the control incidence is zero). When the lower
limit is less than unity, but the upper limit is greater than unity, the
lower limit indicates the absence of a significant result while the upper
limit indicates that there is a theoretical possibility of the induction of
tumors by the test chemical, which could not be detected under the condi
tions of this test.
14
III. RESULTS - RATS
A. Body Weights and Clinical Signs (Rats)
Mean body weights of the dosed male rats were lower than those of the
corresponding controls through week 80 of the bioassay but were unaffected
thereafter. Mean body weights of the female rats were unaffected by the
test chemical (Figure 1). Drooping eyelids, noted as soon as the second
day, occurred in each animal in the dosed groups, but not in the controls.
B. Survival (Rats)
Estimates of the probabilities of survival for male and female rats fed
reserpine in diets at the doses of this bioassay, and for the matched con
trols, are shown by the Kaplan and Meier curves in Figure 2. The result of
the Tarone test is not significant in either sex.
In males, 44/50 (88%) of the high-dose, 40/50 (80%) of the low-dose, and
38/50 (76%) of the control groups survived for 90 weeks, and in females,
39/50 (78%) of the high-dose, 40/50 (80%) of the low-dose, and 44/50 (88%)
of the control groups survived for 90 weeks.
Sufficient numbers of rats of each sex were at risk for the development
of late-appearing tumors.
C. Pathology (Rats)
Histopathologic findings on neoplasms in rats are summarized in Appendix
A, Tables Al and A2; findings on nonneoplastic lesions are summarized in Ap
pendix C, Tables Cl and C2.
15

a
a °
DO A
O A
o g 2 a
o o
o A
X o 111
a o CD o
a
MALE RATS
D MATCHED CONTROL
O LOW DOSE
A HIGH DOSE
40 50 60 70
TIME ON STUDY (WEEKS)
I 300- Q55 g g5UJ A
Q a O CD
FEMALE RATS
D MATCHED CONTROL
O LOW DOSE
A HIGH DOSE
40 50 60 70
TIME ON STUDY (WEEKS)
Figure 1. Growth Curves for Rats Administered Reserpine in the Diet
16

PR
OB
AB
ILIT
Y O
F S
UR
VIV
AL
PR
OB
AB
ILIT
Y O
F S
UR
VIV
AL

A variety of neoplasms occurred in both the matched-control and dosed
groups. Some types of neoplasms occurred only, or with a greater frequency,
in rats of dosed groups as compared with controls. These lesions, except for
those of the adrenal, appeared independent of any administration of the test
chemical.
Table 4 indicates that an increased incidence of adrenal medullary tu
mors in the dosed male rats appeared to be related to administration of the
test chemical.
Pheochromocytomas diagnosed as malignant were usually characterized by
extensive growth with only a compressed rim of cortex remaining. In some
instances, the proliferating medullary cells extended to the capsule. The
cell nuclei were usually large and hyperchromatic with a reticulated chroma
tin pattern and a large prominent nucleolus. Cells were arranged in clumps
or packets and were separated by thin connective tissue septa. Binucleate
cells were seen in some tumors.
Benign pheochromocytomas were usually arranged in well-demarcated is
lands of proliferating medullary cells. These cells appeared to be well
differentiated. Cells varied in appearance; some cells had small round
basophilic nuclei and scant cytoplasm while others had a more open nucleus
and abundant vacuolated cytoplasm. Focal hyperplasias of the adrenal medul
la were small foci of pheochromocytes with nuclei resembling those of normal
medullary cells and slightly basophilic cytoplasm.
A number of degenerative, proliferative, and inflammatory changes en
countered in animals of the dosed and control groups are commonly seen in
aged F344 rats.
The histopathologic examination provided evidence that an increased in
cidence of adrenal pheochromocytomas occurred in male F344 rats fed reser
pine under conditions of this bioassay.
D. Statistical Analyses of Results (Rats)
Tables 5 and 6 contain the statistical analyses of the incidences of
those primary tumors that occurred in at least two animals of one group and
at an incidence of at least 5% in one or more than one group.
18

Table 4. Incidence of Adrenal Medullary Tumors in Male Rats
MatchedControl
Low Dose
High Dose
Number of Rats Examined MicroscopicallyMorphology^3'
Focal Hyperplasia
Pheochromocytoma
Pheochromocytoma, Malignant
48
3(6%)
2(4%)
1(2%)
49
4(8%)
14(29%)
4(8%)
48
3(6%)
15(31%)
9(19%)
(a) Most advanced lesion diagnosed for each rat with a lesion.
19
In male rats, the result of the Cochran-Armitage test for the incidence
of pheochromocytomas of the adrenal is significant (P less than 0.001). The
Fisher exact test shows that the incidence in each dosed group is signifi
cantly higher than that in the controls (P less than 0.001). The results of
the statistical tests on the incidence of adrenal tumors in female rats are
not significant. The results of statistical analysis indicates that the in
cidence of adrenal tumors in male rats is associated with the administration
of reserpine.
In female rats, results of the Fisher exact test used to compare the in
cidences of chromophobe carcinomas of the pituitary in the low-dose and con
trol groups (P=0.031) were above the 0.025 level required for significance
by the Bonferroni inequality criterion for multiple comparison. The histor
ical incidence of this tumor in untreated female rats is 401/2,194 (18%),
which is much lower than the 21/46 (46%) seen in the untreated controls in
this study. The results of the statistical tests are also not significant
when the incidences of chromophobe carcinomas and adenomas are combined for
analysis.
Significant results in the negative direction are observed in the inci
dence of tumors of the hematopoietic system and in the combined incidence of
chromophobe carcinomas and adenomas of the pituitary in male rats as well as
in the incidences of C-cell carcinomas of the thyroid and of endometrial
stromal polyps of the uterus in female rats. The results of the statistical
analysis suggest that the incidence of adrenal medullary tumors in male rats
is associated with the administration of reserpine.
20

Table 5. Analyses of Che Incidence of Primary Tumors in Male Rats Administered Reserpine in the Diet (a)
Topography: Morphology
Integumentary System: Fibroma of the Subcutaneous Tissue (b)
P Values (c,d)
Relative Risk (e) Lower Limit Upper Limit
Weeks to First Observed Tumor
Hematopoietic System: Lymphoma or Leukemia (b)
P Values (c,d)
Relative Risk (e) Lower Limit Upper Limit
Weeks to First Observed Tumor
Pituitary: Chromophobe Carcinoma (b)
P Values (c,d)
Relative Risk (e) Lower Limit Upper Limit
Weeks to First Observed Tumor
Pituitary: Chromophobe Carcinoma or Adenoma (b)
P Values (c,d)
Relative Risk (e) Lower Limit Upper Limit
Weeks to First Observed Tumor
Matched Control
0/49 (0)
N.S.
—
21/49 (43)
P-0.049 (N)
66
4/49 (8)
N.S.
95
17/49 (35)
P=0.009 (N)
77
Low Dose
1/50 (2)
N.S.
Infinite 0.053 Infinite
83
18/50 (36)
N.S.
0.840 0.488 1.438
72
3/49 (6)
N.S.
0.750 0.115 4.201
77
13/49 (27)
N.S.
0.765 0.386 1.481
49
High Dose
3/50 (6)
N.S.
Infinite 0.590 Infinite
98
13/50 (26)
N.S.
0.607 0.319 1.117
86
0/47 (0)
N.S.
0.000 0.000 1.123
—
6/47 (13)
P-0.011 (N)
0.368 0.131 0.883
104
21

Table 5. Analyses of the Incidence of Primary Tumors in Male Rats Administered Reserpine in the Diet (a)
(continued)
Topography: Morphology
Adrenal: Pheochromocytoma or Pheochromocytoraa, Malignant (b)
P Values (c,d)
Relative Risk (e) Lower Limit Upper Limit
Weeks to First Observed Tumor
Thyroid: Follicular-cell Adenoma or Carcinoma (b)
P Values (c,d)
Relative Risk (e) Lower Limit Upper Limit
Weeks to First Observed Tumor
Thyroid: C-cell Adenoma or Carcinoma (b)
P Values (c,d)
Relative Risk (e) Lower Limit Upper Limit
Weeks to First Observed Tumor
Pancreatic Islets: Islet-cell Carcinoma (b)
P Values (c,d)
Relative Risk (e) Lower Limit Upper Limit
Weeks to First Observed Tumor
MatchedControl
3/48 (6)
P less than 0.001
104
1/49 (2)
N.S.
83
3/49 (6)
N.S.
97
2/49 (4)
N.S.
103
Low Dose
18/49 (37)
P less than 0.001
5.878 1.875 29.103
93
3/49 (6)
N.S.
3.000 0.251
154.197
103
2/49 (4)
N.S.
0.667 0.058 5.565
97
0/47 (0)
N.S.
0.000 0.000 3.519
High Dose
24/48 (50)
P less than 0.001
8.000 2.684 38.147
86
0/50 (0)
N.S.
0.000 0.000 18.285
—
2/50 (4)
N.S.
0.653 0.057 5.457
104
4/49 (8)
N.S.
2.000 0.302 21.298
100
22

Table 5. Analyses of the Incidence of Primary Tumors in Male Rats Administered Reserpine in the Diet (a)
(continued)
Matched Low High Topography: Morphology Control Dose Dose
Pancreatic Islets: Islet-cell Carcinoma or Adenoma (b) 4/49 (8) 2/47 (4) 5/49 (10)
P Values (c,d) N.S. N.S. N.S.
Relative Risk (e) 0.521 1.250 Lower Limit 0.049 0.286 Upper Limit 3.450 5.947
Weeks to First Observed Tumor 103 94 100
Testis: Interstitial-cell Tumor (b) 43/49 (88) 37/48 (77) 38/50 (76)
P Values (c,d) N.S. N.S. N.S.
Relative Risk (e) 0.878 0.866 Lower Limit 0.739 0.730 Upper Limit 1.080 1.067
Weeks to First Observed Tumor 78 80 61
(a) Dosed groups received 5 or 10 ppm. (b) Number of tumor-bearing animals/number of animals examined at site (percent). (c) Beneath the incidence of tumors in the control group is the probability level for the Cochran-
Armitage test when P is less than 0.05; otherwise, not significant (N.S.) is indicated. Beneath the incidence of tumors in a dosed group is the probability level for the Fisher exact test for the comparison of that dosed group with the matched-control group when P is less than 0.05; otherwise, not significant (N.S.) is indicated.
(d) A negative trend (N) indicates a lower incidence in a dosed group than in a control group. (e) The 95% confidence interval of the relative risk between each dosed group and the control
group.
23
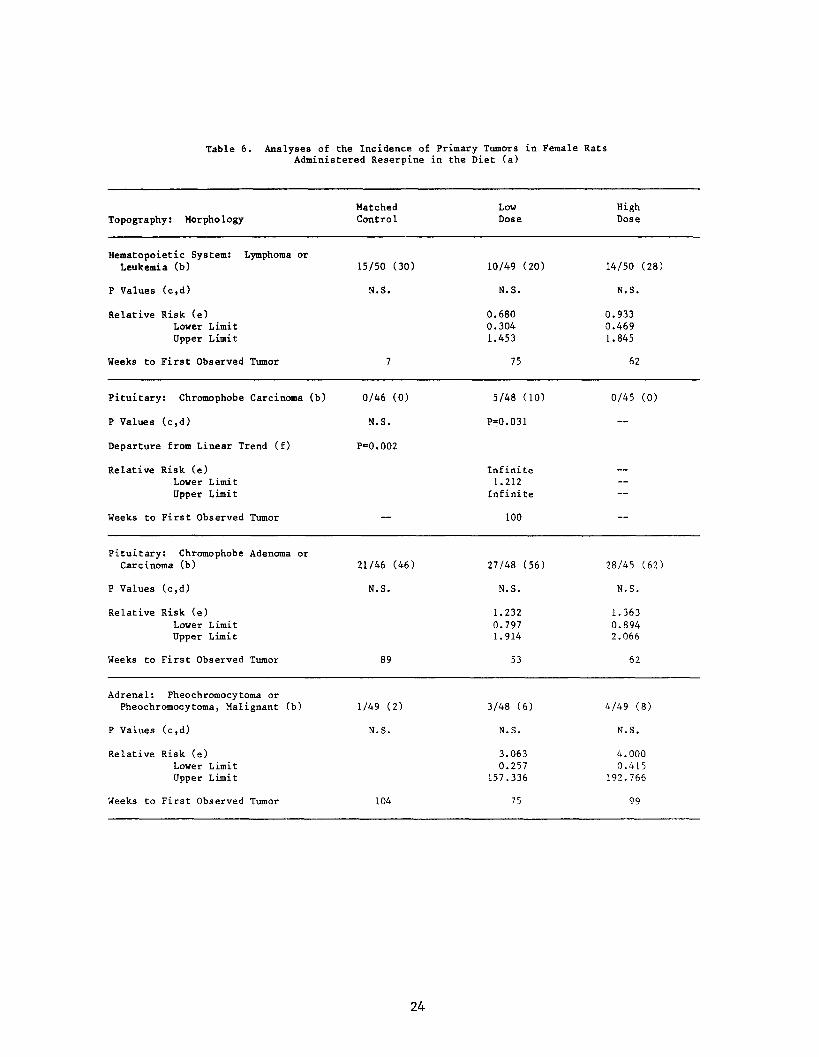
Table 6. Analyses of the Incidence of Primary Tumors in Female Rats Administered Reserpine in the Diet (a)
Topography: Morphology
Hematopoietic System: Lymphoma or Leukemia (b)
P Values (c,d)
Relative Risk (e) Lower Limit Upper Limit
Weeks to First Observed Tumor
Pituitary: Chromophobe Carcinoma (b)
P Values (c,d)
Departure from Linear Trend (f)
Relative Risk (e) Lower Limit Upper Limit
Weeks to First Observed Tumor
Pituitary: Chromophobe Adenoma or Carcinoma (b)
P Values (c,d)
Relative Risk (e) Lower Limit Upper Limit
Weeks to First Observed Tumor
Adrenal: Pheochromocytoma or Pheochromocytoma, Malignant (b)
P Values (c,d)
Relative Risk (e) Lower Limit Upper Limit
Weeks to First Observed Tumor
Matched Control
15/50 (30)
N.S.
7
0/46 (0)
N.S.
P=0.002
21/46 (46)
N.S.
89
1/49 (2)
N.S.
104
Low Dose
10/49 (20)
N.S.
0.680 0.304 1.453
75
5/48 (10)
P=0.031
Infinite 1.212
Infinite
100
27/48 (56)
N.S.
1.232 0.797 1.914
53
3/48 (6)
N.S.
3.063 0.257
157.336
75
High Dose
14/50 (28)
N.S.
0.933 0.469 1.845
62
0/45 (0)
—
— — —
—
28/45 (62)
N.S.
1.363 0.894 2.066
62
4/49 (8)
N.S.
4.000 0.415
192.766
99
24

Table 6. Analyses of the Incidence of Primary Tumors in Female Rats
Administered Reserpine
(continued)
Matched Topography: Morphology Control
Thyroid: C-cell Carcinoma (b) 4/48 (8)
P Values (c,d) P=0.037 (N)
Relative Risk (e) Lower Limit Upper Limit
Weeks to First Observed Tumor 104
Thyroid: C-cell Carcinoma or Adenoma (b) 6/48 (13)
P Values (c,d) N.S.
Relative Risk (e) Lower Limit Upper Limit
Weeks to First Observed Tumor 104
Mammary Gland: Fibroadenoma (b) 14/50 (28)
P Values (c,d) N.S.
Relative Risk (e) Lower Limit Upper Limit
Weeks to First Observed Tumor 97
Uterus: Endometrial Stromal Polyp (b) 10/50 (20)
P Values (c,d) P=0.010 (N)
Relative Risk (e) Lower Limit Upper Limit
Weeks to First Observed Tumor 30
in the Diet (a)
Low Dose
2/48 (4)
N.S.
0.500 0.047 3.311
103
5/48 (10)
N.S.
0.833 0.215 3.055
88
18/49 (37)
N.S.
1.312 0.698 2.509
75
5/49 (10)
N.S.
0.510 0.147 1.510
66
High Dose
0/48 (0)
N.S.
0.000 0.000 1.077
—
2/48 (4)
N.S.
0.333 0.034 1.754
100
14/50 (28)
N.S.
1.000 0.496 2.018
97
2/49 (4)
P=0.015 (N)
0.204 0.023 0.894
100
25

Table 6. Analyses of the Incidence of Primary Tumors in Female Rats Administered Reserpine in the Diet (a)
(continued)
(a) Dosed groups received 5 or 10 ppm. (b) Number of tumor-bearing animals/number of animals examined at site (percent). (c) Beneath the incidence of tumors in the control group is the probability level for the Cochran-
Arraitage test when P is less than 0.05; otherwise, not significant (N.S.) is indicated. Beneath the incidence of tumors in a dosed group is the probability level for the Fisher exact test for the comparison of that dosed group with the matched-control group when P is less than 0.05; otherwise, not significant (N.S.) is indicated.
(d) A negative trend (N) indicates a lower incidence in a dosed group than in a control group. (e) The 95% confidence interval of the relative risk between each dosed group and the control
group. (f) The probability level for departure from linear trend is given when P is less than 0.05 for any
comparison.
26

IV. RESULTS - MICE
A. Body Weights and Clinical Signs (Mice)
Mean body weights of all dosed groups of male and female mice were lower
than those of corresponding controls and were dose related throughout the
bioassay (Figure 3). Partial closure or ptosis of the eyelids occurred in
each animal among the dosed male and female mice but not in controls and was
first observed as early as 2 days from the start of the study.
B. Survival (Mice)
Estimates of the probabilities of survival for male and female mice ad
ministered reserpine in the diet at the doses of this bioassay, together
with those of the matched controls, are shown by the Kaplan and Meier curves
in Figure 4. The result of the Tarone test is not significant in either sex.
In males, 41/50 (82%) of the high-dose, 35/50 (70%) of the low-dose, and
38/50 (76%) of the matched-control groups lived to the end of the study, and
in females, 38/50 (76%) of the high-dose, 35/50 (70%) of the low-dose, and
44/50 (88%) of the matched-control groups lived to the end of the study.
C. Pathology (Mice)
Histopathologic findings on neoplasms in mice are summarized in Appendix
B, Tables Bl and B2; findings on nonneoplastic lesions are summarized in Ap
pendix D, Tables Dl and D2.
A variety of neoplasms occurred in both the matched-control and dosed
groups. With the exception of proliferative and neoplastic lesions of the
seminal vesicles in males and mammary glands in females, the neoplasms ap
peared with approximately equal frequency in dosed and control groups of
mice. The incidence of inflammatory, proliferative, and neoplastic lesions
27

D P
D
O
D
O
D D
O
D
O
D
O
DD
O
D
O
O
O
D
O
D
OO
DOC D O
DO
A
D O
A A A A
A A
OA
A A
A A A A
Q O m Z
UJ 5
20
°0 °AA
D OA AA
AA
MALE MICE
D MATCHED CONTROL
O LOW DOSE
A HIGH DOSE
—r— 10 100 110
TIME ON STUDY (WEEKS)
O o m z
UJ
5
20
aan
DD 0° ° „
D00 AA
go .A I 1A
AA A
A
a
O
A
D
O
A
a n
a n
o o
AO
a
A
a
o
A
a
o
A
D
o
A
a n o n
A
o o
A A
o o
FEMALE MICE
a
o
D MATCHED CONTROL
O LOW DOSE
A HIGH DOSE
TIME ON STUDY (WEEKS)
Figure 3. Growth Curves for Mice Administered Reserpine in the Diet
28

cc o.eo u>
CO< 0.40<
CO o CC 0. 0.30
MALE MICE
- D MATCHED CONTROL
O LOW DOSE
A HIGH DOSE
45 60 75
TIME ON STUDY (WEEKS)
o (
A ° ?,
'̂"% O-
"\,^
i A'l! ̂ 4'^
(K )
< > >
(A u. o
H _l
^ 0.40
03 O CC
FEMALE MICE
] MATCHED CO
C) LOW DOSE
^\ HIGH DOSE
TIME ON STUDY (WEEKS)
Figure 4. Survival Curves for Mice Administered Reserpine in the Diet
29

of the seminal vesicles in males and mammary glands in females are shown in
Table 7.
The unusual neoplastic lesions in the seminal vesicles were reported as
undifferentiated carcinomas. These tumors were characterized by consider
able cellular pleomorphism and appeared to involve the glandular epithelium
and muscular wall of the seminal vesicles, although their origin was uncer
tain. There were some areas of extensive spindle-cell proliferation with
multiple discrete areas of anaplastic epithelial-like cells. The spindle
cells had oval or elongated nuclei with variable amounts of streaming cyto
plasm and appeared to be derived from the anaplastic cells. The anaplastic
cells were pleomorphic with round, oval, or angular nuclei. The nuclei were
often vesicular with a prominent nucleolus. Cytoplasm was usually abundant,
but the borders were indistinct. In the areas of two tumors the cells were
arranged in trabecular pattern.
Inflammatory lesions involving the seminal vesicles consisted of lympho
cytic infiltration and fibrosis of the smooth muscle wall. A few dosed mice
had focal papillary hyperplasia of the seminal vesicle epithelium. Focal
areas of hyperplasia had variable degrees of atypia such as nuclear enlarge
ment, prominent nucleoli, and vacuolated pale cytoplasm. Cells often ap
peared columnar rather than cuboidal. Neoplastic and inflammatory lesions
of the seminal vesicles were confined to the dosed male mice; no lesions
were observed in the control male mice.
An increased incidence of mammary gland tumors was observed in the dosed
female mice as compared with the matched controls. Malignant mixed tumors
have also been classified as adenocarcinoma Type C and fibroadenomas and
were interpreted as being low-grade malignant. Mammary tumors in this study
appeared to be compound related since none of the lesions occurred in the
control females.
In addition to the neoplastic lesions, a number of degenerative, prolif
erative, and inflammatory changes were also encountered in animals of the
dosed and control groups. For the most part, the nonneoplastic lesions are
commonly seen in aged mice and were not associated with increased mortali
ties or decreased life spans, except for those previously noted.
30

Table 7. Incidence of Inflammatory, Proliferative, and Neoplastic Lesions of the Seminal Vesicles in Male and
Mammary Glands in Female Mice
Topography: Morphology
SEMINAL VESICLES: (No. of Animals Examined)Inflammation, ChronicFibrosisHyperplasia, EpithelialUndifferentiated Carcinoma
MAMMARY GLANDS (No. of Animals Examined)Adenocarcinoma, NOSAdenosquamous CarcinomaMixed Tumor, MalignantCystic Ducts
Matched Low High Control Dose Dose
50 50 49 0(0%) 10(20%) 8(16%)
0(0%) 13(26%) 5(10%) 0(0%) 4(8%) 4(8%)
0(0%) 1(2%) 5(10%)
50 49 48 0(0%) 2(4%) 1(2%)
0(0%) 1(2%) 1(2%) 0(0%) 4(8%) 5(10%)
0(0%) 4(8%) 6(13%)
31

The histopathologic examination provided evidence that, under the condi
tions of this bioassay, reserpine increased the incidences of undifferenti
ated carcinomas and inflammatory lesions of the seminal vesicles in males
and of mammary tumors in female B6C3F1 mice.
D. Statistical Analysis of Results (Mice)
Tables 8 and 9 contain the statistical analyses of the incidences of
those primary tumors that occurred in at least two animals of one group and
at an incidence of at least 5% in one or more than one group.
In male mice, the result of the Cochran-Armitage test on the incidence
of undifferentiated carcinomas of the seminal vesicle is significant
(P=0.010). The Fisher exact comparison of the incidences of the high-dose
and control groups shows a P value of 0.027, which is above the 0.025 level
required for significance when the Bonferroni inequality is used for multi
ple comparison. However, the historical records of this laboratory show no
such tumor in a total of 586 B6C3F1 male mice. Using 1/586 as the parameter
and assuming a binomial distribution, the probability of obtaining 5 or more
tumors out of a sample size of 49 is less than 0.001.
The result of the Cochran-Armitage test on the incidence of female mice
with all types of malignant tumors of the mammary gland is significant
(P=0.011). Also, the result of the Fisher exact test shows that the inci
dence in each dosed group is significantly higher than that in the control
group, P=0.006 in low-dose group and P=0.005 in high-dose group.
Significant results in the negative direction are observed in the com
bined incidence of hepatocellular carcinomas and adenomas of the liver in
male mice.
The results of the statistical evaluation indicate that the incidences
of undifferentiated carcinomas of the seminal vesicle in male mice and of
tumors of the mammary gland in female mice are associated with administra
tion of the test chemical.
32

Table 8. Analyses of the Incidence of Primary Tumors in Male Mice Administered Reserpine in the Diet (a)
To pog ra phy:M or pholo gy
Lung: Alveofar/Bronchiofar Carcinoma (b)
P Values (c,d) Relative Risk (e)
Lower Limit Upper Limit
Weeks to First Observed Tumor
Lung: Alveolar/Bronchiolar Adenoma or Carcinoma (b)
P Values (c,d) Relative Risk (e)
Lower Limit Upper Limit
Weeks to First Observed Tumor
Mat ched Low High Control Dose Dose
5/50 (10) 3/50 (6) 1/46 (2) N.S. N.S. N.S.
0.600 0.217 0.098 0.005 2.910 1.841
96 98 105
9/50 (18) 9/50 (18) 6/46 (13) N.S. N.S. N.S.
1.000 0.725 0.384 0.229 2.603 2.093
72 93 14
Hematopoietic System: Lymphoma or Leukemia (b)
P Values (c ,d) 8/50 (16) N.S.
6/50 (12) N.S.
8/49 (16) N.S.
Relative Risk (e) 0.750 1.020 Lower Limit 0.231 0.363 Upper Limit 2.281 2.869
Weeks to First Observed Tumor 86 76 88
Liver: HepatocellularP Values (c,d)
Carcinoma (b) 6750 (12) N . S .
"8/50 (16) N.S.
1/48 (2) N.S.
Relative Risk (e) 1.333 0.174 Lower Limit 0.438 0.004 Upper Limit 4.331 1.355
Weeks to First Observed Tumor 92 96 95
Liver: Hepatocellular Carcinoma or Adenoma (b)
P Values (c,d) 12/50 (24) P=0.038 (N)
14/50 (28) N.S.
4/48 (8) P-0.033 (N)
Relative Risk (Matched Control)(e) 1.167 0.347 Lower Limit 0.559 0.087 Upper Limit 2.475 1.054
Weeks to First Observed Tumor 92 96 95
Seminal Vesicle: Undifferentiated Carcinoma (b)
P Values (c ,d) Relative Risk (Matched Control)(e)
Lower Limit Upper Limit
Weeks to First Observed Tumor
Harder!an Gland: Adenoha ,NO~S~ (bT P Values (c,d) Relative Risk (Matched Control)(e)
Lower Limit Upper Limit
Weeks to First Observed Tumor
0/50 (0) P=0.010
N.S.
102
1/50 (2) N.S. Infinite 0.054 Infinite
99
~275~CT N.S . 1.000 0.075
13.326 91
5/49 (10) P-0.027 Infinite 1.287 Infinite
98
N.S . 2.041 0.308
21.737 97
(a) Dosed groups received doses of 5 or 10 ppm in the diet. (b) Number of tumor-bearing animals/number of animals examined at site (percent). (c) Beneath the incidence of tumors in the control group is the probability level for the
Cochran-Armitage test when P is less than 0.05; otherwise, not significant (N .S . ) is indicated. Beneath the incidence of tumors in a dosed group is the probability level for the Fisher exact test for the comparison of that dosed group with the untreated-control group when P is less than 0.05; otherwise, not significant (N.S.)
is indicated. (d) A negative trend (N) indicates a lower incidence in a dosed group than in a control
group.
(e) The 95 percent confidence interval of the relative risk between each dosed group and the control group.

Table 9. Analyses of the Incidence of Primary Tumors in Female Mice Administered Reserpine in Che Diet (a)
Matched Low High Topography: Morphology Control Dose Dose
Lung: Alveolar/Bronchiolar Carcinoma or Adenoma (b) 4/50 (8) 4/49 (8) 4/48 (8)
P Values (c,d) N.S. N.S. N.S.
Relative Risk (e) 1.020 1.042 Lower Limit 0.201 0.205 Upper Limit 5.183 5.286
Weeks to First Observed Tumor 104 105 94
Hematopoietic System:Leukemia (b)
Lymphoma or 11/50 (22) 7/49 (14) 10/48 (21)
P Values (c,d) N.S. N.S. N.S.
Relative Risk (e) Lower Limit Upper Limit
0.649 0.232 1.676
0.947 0.398 2.223
Weeks to First Observed Tumor 85 84 73
Mammary Gland: Malignant Tumors, All Types (b) 0/50 (0) 7/49 (14) 7/48 (15)
P Values (c,d) P=0.011 P=0.006 P=0.005
Relative Risk (e) Infinite Infinite Lower Limit 1.981 2.023 Upper Limit Infinite Infinite
Weeks to First Observed Tumor 60 84
(a) Dosed groups received 5 or 10 ppm. (b) Number of tumor-bearing animals/number of animals examined at site (percent). (c) Beneath the incidence of tumors in the control group is the probability level for the Cochran-
Armitage test when P is less than 0.05; otherwise, not significant (N.S.) is indicated. Beneath the incidence of tumors in a dosed group is the probability level for the Fisher exact test for the comparison of that dosed group with the matched-control group when P is less than 0.05; otherwise, not significant (N.S.) is indicated.
(d) A negative trend (N) indicates a lower incidence in a dosed group than in a control group. (e) The 95% confidence interval of the relative risk between each dosed group and the control
group.
34

V. DISCUSSION
Mean body weights, 'slightly lower among dosed male rats than those of
the corresponding controls through week 80, were essentially unaffected
among females receiving the test chemical. Mean body weights of dosed
groups of male and female mice were lower than those of corresponding con
trols and were dose-related throughout the study. Survival in the dosed and
control groups of rats and mice was 76% or greater at week 90. The female
rats may have been able to tolerate higher doses.
In male F344 rats, the incidence of pheochromocytomas of the adrenal me
dulla was dose-related (P less than 0.001), and the incidence in each dose
group was significantly higher (P less than 0.021) when compared directly
with the control group. Pheochromocytomas have been reported among 6.7% of
119 aging male F344 rats examined by Sass et al. (1975) and in the adrenal
medulla of 8.8% of 158 two-year old male F344 rats by Goodman et al. (1979).
In the study reported here, pheochromocytomas in male F344 rats were de
tected in 6% (3/48) of the matched control, 37% (18/49) of the low-dose, and
50% (24/48) of the high-dose group. To verify these findings and assure ac
curacy of the diagnoses, specimens including tissues containing the lesions
were examined by each member of an independent panel of experts who had no
knowledge of the treatment groups (Capen, Holland and Nielsen, 1979). With
in minor variations in tumor incidences and related descriptive phraseology,
the findings of the panel (Appendix H) corroborated the conclusion of tumor
induction based on findings reported by the pathologists in residence at the
performing laboratory and the quality assurance panel that reviewed the ini
tial diagnosis. In addition, according to Hollander and Snell (1976), it
may be difficult to distinguish between hyperplasia and small pheochromocy
tomas. Thus, the majority of proliferative medullary lesions were neo
plasms, as we have diagnosed, rather than hyperplasias. These findings
relate the incidence of adrenal medullary pheochromocytomas in male F344
rats to the administration of reserpine. The induction of pheochromo
cytomas, which usually secrete epinephrine and norepinephrine (Chalfie and
Perlman, 1976), possibly may be due to the existence of a compensating
mechanism of the adrenal gland involving its depletion of bioamine stores by
reserpine.
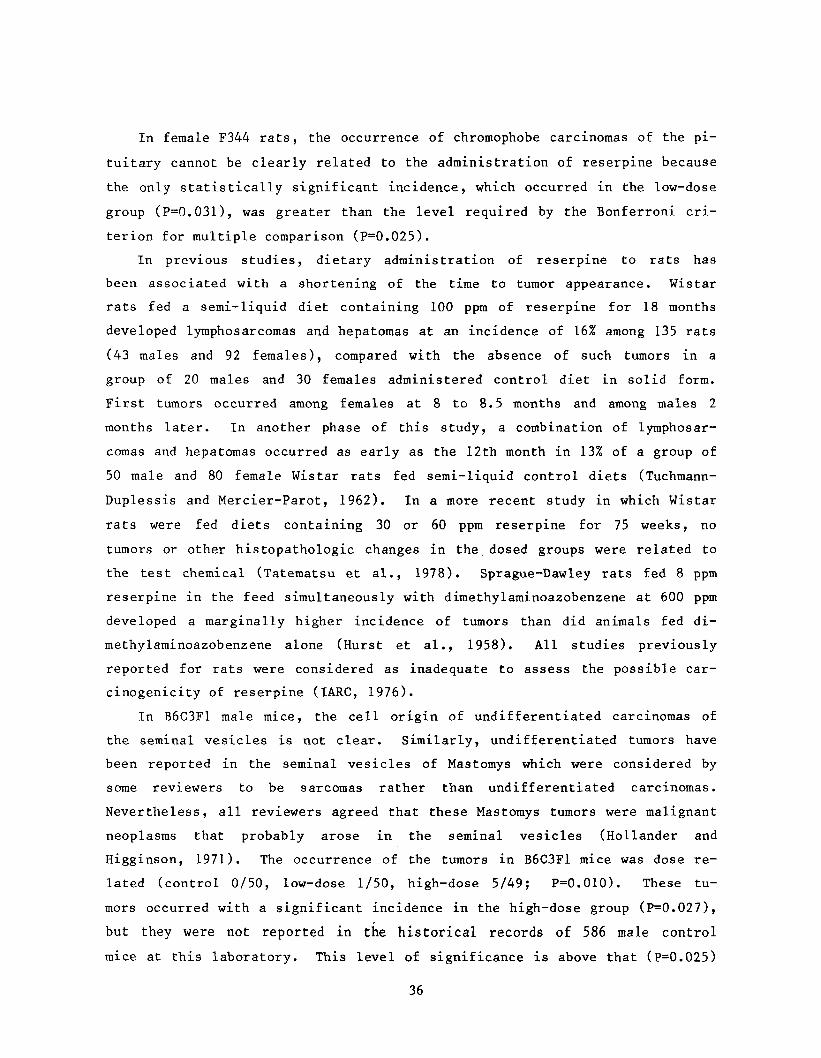
In female F344 rats, the occurrence of chromophobe carcinomas of the pi
tuitary cannot be clearly related to the administration of reserpine because
the only statistically significant incidence, which occurred in the low-dose
group (P=0.031), was greater than the level required by the Bonferroni cri
terion for multiple comparison (P=0.025).
In previous studies, dietary administration of reserpine to rats has
been associated with a shortening of the time to tumor appearance. Wistar
rats fed a semi-liquid diet containing 100 ppm of reserpine for 18 months
developed lymphosarcomas and hepatomas at an incidence of 16% among 135 rats
(43 males and 92 females), compared with the absence of such tumors in a
group of 20 males and 30 females administered control diet in solid form.
First tumors occurred among females at 8 to 8.5 months and among males 2
months later. In another phase of this study, a combination of lymphosar
comas and hepatomas occurred as early as the 12th month in 13% of a group of
50 male and 80 female Wistar rats fed semi-liquid control diets (Tuchmann-
Duplessis and Mercier-Parot, 1962). In a more recent study in which Wistar
rats were fed diets containing 30 or 60 ppm reserpine for 75 weeks, no
tumors or other histopathologic changes in the.dosed groups were related to
the test chemical (Tatematsu et al., 1978). Sprague-Dawley rats fed 8 ppm
reserpine in the feed simultaneously with dimethylaminoazobenzene at 600 ppm
developed a marginally higher incidence of tumors than did animals fed di
methylaminoazobenzene alone (Hurst et al., 1958). All studies previously
reported for rats were considered as inadequate to assess the possible car
cinogenicity of reserpine (IARC, 1976).
In B6C3F1 male mice, the cell origin of undifferentiated carcinomas of
the seminal vesicles is not clear. Similarly, undifferentiated tumors have
been reported in the seminal vesicles of Mastomys which were considered by
some reviewers to be sarcomas rather than undifferentiated carcinomas.
Nevertheless, all reviewers agreed that these Mastomys tumors were malignant
neoplasms that probably arose in the seminal vesicles (Hollander and
Higginson, 1971). The occurrence of the tumors in B6C3F1 mice was dose re
lated (control 0/50, low-dose 1/50, high-dose 5/49; P=0.010). These tu
mors occurred with a significant incidence in the high-dose group (P=0.027),
but they were not reported in the historical records of 586 male control
mice at this laboratory. This level of significance is above that (P=0.025)
36

required for significance by the Bonferroni criterion for multiple compari
son, but if a binomial distribution is assumed and the parameter of 1/586 is
used, the probability of obtaining 5 or more of these tumors in a sample
size of 49 is less than 0.001. In addition, the occurrence of nonneoplastic
lesions of the seminal vesicles of dosed animals, including inflammation,
fibrosis, and epithelial hyperplasia, supports the conclusion that the un
differentiated carcinomas of the seminal vesicle were associated with the
administration of reserpine.
In B6C3F1 female mice, the occurrence of malignant tumors of the mammary
gland was associated with administration of the test chemical. The inci
dences in the dosed groups were significantly higher (high-dose, P=0.005;
low-dose, P=0.006) than those in the control group, and the results of the
test for a dose-related trend were significant (P=0.011). Malignant tumors
of the mammary gland may be related to the known action of reserpine in
stimulating mammary growth and lactation in experimental animals (Gaunt et
al., 1963).
In previous studies, dietary administration of reserpine to female mice
predisposed to mammary cancer (45% - 55% spontaneous incidence) has been as
sociated with shortening the time to tumor appearance as well as with a pos
sible increase in the incidence of mammary tumors. Female C3H/He mice fed an
average dietary dose of 0.24 micrograms of reserpine per day for 18 months
developed mammary tumors at an incidence of 15/24 (62.5%), compared with an
incidence of 12/22 (54.5%) among controls. The earliest tumors in the dosed
animals appeared by day 216, with most occurring between the 8th and llth
months; the earliest tumors in the controls appeared by day 320, with all
occurring between the llth and 17th months (Lacassagne and Duplan, 1959). In
comparable tests using a resistant strain of female mice (XVII nc), no tu
mors developed in either dosed or control groups. These studies were con
sidered as inadequate to assess the possible carcinogenicity of reserpine in
mice.
Several epidemiological studies have been performed on the incidence of
tumors among humans exposed to reserpine. Available evidence does not link
the use of reserpine with tumor incidence in males. Occurrence of breast
cancer among women has been associated with the use of reserpine in several
surveys, but the indicated risk from exposure is inconsistent. The lack of
37
adequate testing in earlier experimental animal studies precluded any con
clusion regarding the existence of a risk (IARC, 1976). Our present study
in rats and mice strongly indicates a potential risk to humans.
Under the conditions of this bioassay, reserpine was carcinogenic in
male F344 rats, inducing pheochromocytomas of the adrenal, and in B6C3F1
mice, inducing malignant tumors of the mammary gland in females and undif
ferentiated carcinomas of the seminal vesicles in males. Reserpine was not
carcinogenic for female F344 rats.
38
VI. BIBLIOGRAPHY
AMA Department of Drugs, AMA Drug Evaluations, PSG Publishing Co., Inc., Littleton, Mass., 1977, pp. 34-35, 53, and 60-61.
Armitage, P., Statistical Methods rn Medical Research, John Wiley & Sons, Inc., New York, 1971, pp. 362-365.
Berenblum, I., ed., Carcinogenicity Testing: A Report of the Panel on Carcinogenicity of the Cancer Research Commission of UICC, Vol. 2_, International Union Against Cancer, Geneva, 1969.
Bishun, N., Smith, N., and Williams, D., Chromosomes, mitosis, and reserpine. Lancet, 19 April 1975, p. 926.
Boston Collaborative Drug Surveillance Program, Reserpine and breast cancer. Lancet, Sept. 21, 1974, pp. ii and 669.
Byck, R., Drugs and the treatment of psychiatric disorders. In: The Pharmacological Basis of Therapeutics, Goodman, L. S. and Gilman, A., eds., Macmillan Publishing Co., Inc., New York, 1975, pp. 152, 167-169.
Capen, C. C., Holland, J., and Nielsen, S., Written Communication, September 17, 1979.
Chalfie, M. and Perlman, R., Studies of a transplantable rat pheochromocytoma: biochemical characterization and catecholamine secretion. J_. Pharmacol. Exp. Ther. 197:615-622, 1976.
Code of Federal Regulations, 21 CFR 558.505, 1977
Cox, D. R., Analysis of_ Binary Data, Methuen & Co., Ltd., London, 1970, pp. 48-52.
Cox, D. R., Regression models and life tables. J_. R. Statist. Soc. li 34:187-220, 1972. ~ ~
Gart, J. J., The comparison of proportions: a review of significance tests, confidence limits and adjustments for stratification. Rev. Int. Stat. Inst. 39:148-169, 1971.
Gaunt, R., Chart, J. J., and Renzi A. A., Interactions of drugs with endocrines. Ann. Rev. Pharmacol. 3_: 109-128, 1963.
Goodman, D. G., Ward, J. M., Squire, R. A., Chu, K. C., and Linhart, M. S., Toxicology and Applied Pharmacology 48, 1979, pp. 237-248.
Gosselin, R. E., Hodge, H. C., Smith, R. P., and Gleason, M. N., Reserpine. In: Clinical Toxicology of_ Commercial Products, 4th Edition, Williams and Wilkins, Baltimore, Md., 1976, pp. 289-293.
39
Hayden et al., "IR and UV Spectra of Some USP and NF Reference Standards," J. Assoc. Off. Anal. Chem., 45(4):854-855, 1962.
Hollander, C. and Higginson, J., Spontaneous cancer in Praomys (Mastomys) matalesnis. J. Nat. Cancer Inst. 46_:1343-1355, 1971.
Hollander, C. and Snell, K., Tumours of the adrenal gland. In: Pathology of Tumours in Laboratory Animals, Vol. I. Tumours of the Rat, Part 2, International Agency for Research on Cancer, Lyon, 1976, pp. 273-288.
Hurst, L., Lacassagne, A., and Rosenberg, A. J., Action de la reserpine sur la cancerisation du foie chez le Rats. Societe de Biologie 152:441-443, 1958.
Innes, I. R. and Nickerson, M., Atropine, scopolamine, and related antimuscarinic drugs. In: The Pharmacological Basis of Therapeutics, Goodman, L.S. and Oilman, A., eds., Macmillan Publishing Co., Inc., New York, 1975, pp. 514-518.
IARC, Reserpine. In: IARC Monographs on the Evaluation of Carcinogenic Risk £f_ Chemicals _to Man, Some Naturally Occurring Substances, Vol. 10, World Health Organization, Lyon, France, 1976, pp. 217-229.
Kaplan, E. L. and Meier, P., Nonparametric estimation from incomplete observations. £. Am. Statist. Assoc. _5_3 :457-481, 1958.
Koelle, G., Neurohumoral transmission and the autonomic nervous system. In: The Pharmacological Basis £f Therapeutics, Goodman, L. S. and Gilman, A., eds., Macmillan Publishing Co., In., New York, 1975, pp. 424-426.
Lacassagne, A. and Duplan, J., Le mecanisme de la cancerisation de la mamelle chez la Souris, considere d'apres les resultats d'experiences au moyen de la reserpine. Comptes Rendus Acad. Sci 249:810-812, 1959.
Linhart, M. S., Cooper, J. A., Martin, R. L., Page, N.P., and Peters, J. A., Carcinogenesis bioassay data system. Comp. and Biomed. Res. ̂ 7:230-248, 1974.
Maass, A. R., Jenkins, B., Shen, Y., and Tannenbaum, P., Studies on absorption, excretion, and metabolism of ^n-reserpine in man. Clin. Pharmacol. Ther. H):366-371, 1969.
Miller, R. G., Jr., Simultaneous Statistical Inference, McGrawHill Book Co., New York, 1966, pp. 6-10.
National Drug and Therapeutic Index, IMS, America, Ambler, Pa., July, 1977 June, 1978, pp. 848-852.
National Prescription Audit - Basic Data Report (1977). IMS America Ltd., Ambler, Pa, 1978.
Neuss, N. H., Boaz, H. E., and Forbes, J. H., Rauwolfia Serpentina alkaloids, I. Structure of reserpine. J_. Am. Chem. Soc. _76.;2463, 1954.
40

Nickerson, M. and Collier, B., Drugs inhibiting adrenergic nerves and struc
tures innervated by them. In: The Pharmacological Basis of Therapeutics, Macmillan Publishing Co., Inc., New York, 1975, pp. 557-559 and 719-720.
Numerof, P., Gordon, M., 'and Kelly, J. M., Abst. 126th Meeting. Amer. Chem. Soc., 1954, p. 82C. Cited in: Sheppard H., Lucas, R. C. and Tsien, W. H., The metabolism of reserpine-C-'- . Arch, int. Pharmacodyn. CIIl(2-3), 256268, 1955.
Official Methods £f Analysis £f the Association of^ Official Analytical Chemists, 12th Edition, 1975.
Pharmacopeia £f_ the United States £f America, 18th Revision, USP, Bethesda, Maryland, p. 587, 1970.
Sadtler, Standard Spectra, Sadtler Research Laboratories, Philadelphia, Pa., I.R. No. 7397.
Sass, B., Rabstein, L. S., Madison, R., Nims, R. M., Peters, R. L., and Kelloff, G. J., Incidence of spontaneous neoplasms in F344 rats throughout the natural life-span. J. Nat. Cancer Inst. 54: 1449-1456, 1975.
Sheppard, H., Lucas, R. C., and Tsien, W. H., Metabolism of reserpineC14 . Arch. Int. Pharmacodyn. CIII (2-3):256-268, 1955.
Tarone, R. E., Tests for trend in life table analysis. Biometrika 62_( 3): 679-682, 1975.
Tatematsu, M., Takahashi, M., Tsuda, H., Ogiso, T., and Ito, N., The administration of reserpine to rats for 75 weeks. Toxicol. Letters JL:201-205, 1978.
Tuchmann-Duplessis, H., and Mercier-Parot, L., Apparition de tumeurs malignes dans une lignee de rats (Wistar). _J. Comptes Rendus Ac ad. Sci. 254:1535-1537, 1962.
Usdin, E. and Efron, D. H., Pschotropic Drugs and Related Compounds, 2nd Edition, U. S. Department of Health, Education, and Welfare, Washington, D.C., 1972, p. 111.
41

42

APPENDIX A
SUMMARY OF THE INCIDENCE OF NEOPLASMS IN RATS ADMINISTERED RESERPINE IN THE DIET
43

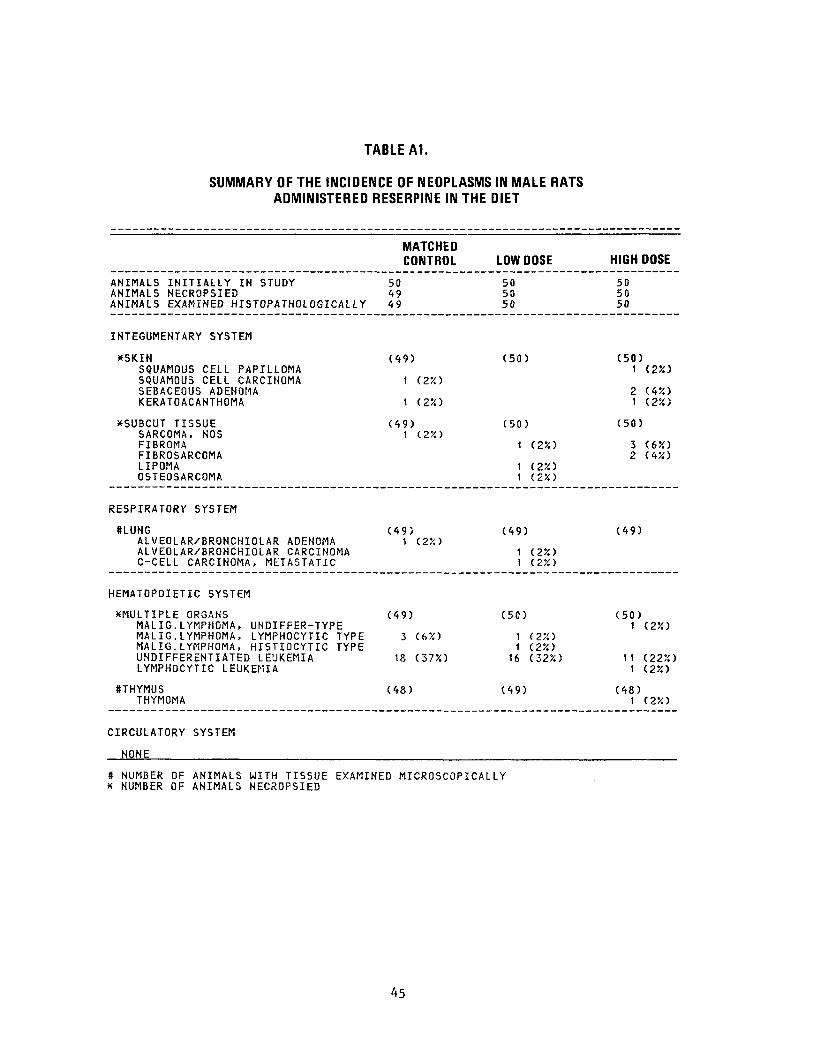
TABLE A1.
SUMMARY OF THE INCIDENCE OF NEOPLASMS IN MALE RATS ADMINISTERED RESERPINE IN THE DIET
MATCHED CONTROL LOW DOSE
ANIMALS INITIALLY IN STUDY 50 ANIMALS NECROPSIED 49 ANIMALS EXAMINED HISTOPATHOLOGICALLY 49
50 50 50
INTEGUMENTARY SYSTEM
*SKIN (49) (50) SQUAMOUS CELL PAPILLOMA SQUAMOUS CELL CARCINOMA 1 (2%) SEBACEOUS ADENOMA KERATOACANTHOMA 1 (2%)
*SUBCUT TISSUE (49) (50) SARCOMA, NOS 1 (25O FIBROMA 1 (2%) FIBROSARCOMA LIPOMA 1 (2%) OSTEOSARCOMA 1 (2%)
RESPIRATORY SYSTEM
ffLUNG (49) (49) ALVEOLAR/BRONCHIOLAR ADENOMA 1 (25O ALVEOLAR/BRONCHIOLAR CARCINOMA 1 (250 C-CELL CARCINOMA, META3TATIC 1 (2%)
HEMATOPOIETIC SYSTEM
"MULTIPLE ORGANS (49) (50) MALIG.LYMPHOMA, UNDIFFER-TYPE MALIG.LYMPHOMA, LYMPHOCYTIC TYPE 3 (65O 1 (25O MALIG.LYMPHOMA, HISTIOCYTIC TYPE 1 (250 UNDIFFERENTIATED LEUKEMIA 18 (37X) 16 (32%) LYMPHOCYTIC LEUKEMIA
ftTHYMUS (48) (49) THYMOMA
CIRCULATORY SYSTEM
NONE
NUMBER OF ANIMALS WITH TISSUE EXAMINED MICROSCOPICALLY NUMBER OF ANIMALS NECROPSIED
HIGH DOSE
50 50 50
(50) 1 (2%)
2 (45O 1 (2X)
(50)
3 (650 2 (45O
(49)
(50) 1 (25O
11 (225O 1 (2%)
(48) 1 (250
45

TABLE A1.MALE RATS: NEOPLASMS (CONTINUED)
DIGESTIVE SYSTEM
XTOHGUE SOilAMOUS CELL PAPILLOMA SQUAMOUS CELL CARCINOMA
ttLIVER HEPATOCELLULAR ADENOMA
ttPANCREAS ACIMAR-CELL ADENOMA
BSTOMACH SQUAMOUS CELL PAPILLOMA
ftSMALL INTESTINE ADENOCARCINOMA, NOS MUCINOUS ADENOCARCINOMA
UJEJUHUM FIBROSARCOMA
URINARY SYSTEM
i fURINARY ' B L A D D E R TRANSITIONAL-CELL PAPILLOMA
ENDOCRINE SYSTEM
SPITUITARY CHROMOPHOBE ADENOMA CHROMOPI IODE C A R C I N O M A ACIDOPHIL ADENOMA
IIADREiiAl C O R T I C A L CARCINOMA P H C O C H R O M O C Y T U M A PHEOCHROMOCYTOMA, MALIGNANT
l iADREHAL MEDULLA N E U R O B L A S T O M A
«THY!:OII) F O L I . I C U L A R - C E L L ADENOMA
MATCHED CONTROL LOW DOSE HIGH DOSE
(49)2 (4X) (50)
1 (2X) (50)
1 (2X)
(49) (49)1 (2X)
(50) 1 (2X)
1 (2X) (49)
1 (2X)
(49)1 C2JO (49) (50)
(49)2 (4X) (44) (49)
1 (250
(49) (44) (49) 1 (2X)
( 4.5 ) (47)
( 4 9 ) 13 (775O
( 4 9 )10 (20:0
( 4 7 ) 6 ( 13X)
4 ( S X ) 3 (65O 1 (2X)
(43) ( 4 9 ) (48) 1 ( 2 % ) 1 ( 2 X ) 3 ( 6 X > 14 (29?.') 15 (3 IX ) \ ( 2X ) 4 (8X) 9 ( 19X)
(48) (49 ) (48) 1 (25O
( 4 9 ) ( 4 9 ) ( 5 0 ) 1 ( 2 X ) 2 ( 4 X )
l-'UrinirR Or ANIMALS WITH TISSUE EXAMINED MICROSCOPICALLY NUMBER OF ANIMALS HECROPSIEi)
46

TABLE A1. MALE RATS: NEOPLASMS (CONTINUED)
FOLLICULAR-CELL CARCINOMA C-CELL ADENOMA C-CELL CARCINOMA
SPANCREATIC ISLETS ISLET-CELL ADENOMA ISLET-CELL CARCINOMA
REPRODUCTIVE SYSTEM
XMAMMARY GLAND ADENOCARCINOMA, NOS FIBROADENOMA
XPREPUTIAL GLAND ADENOMA, NOS
XSEMINAL VESICLE ADENOMA, NOS
#TESTIS INTERSTITIAL-CELL TUMOR
NERVOUS SYSTEM
#BRAIN SARCOMA, NOS, UNC PRIM OR META
SPECIAL SENSE ORGANS
HEAR CANAL SQUAMOUS CELL CARCINOMA
MUSCULOSKELETAL SYSTEM
NONE
BODY CAVITIES
XMESENTERY LI. POMA
MATCHED CONTROL
2 (4%) 1 12%)
(49)2 (450 2 (4X)
(49) 1 (2%) 1 (2%)
(49) 1 (2X)
(49) 1 (.27.)
(49) 43 (88%)
(49) 1 (2%)
(49)
(49)
HIGH DOSE
1 (250 1 (2%)
(49) 1 (25O 4 (8%)
(50)
(50) 1 (2%)
(50)
(50) 38 (76X)
(49)
(50) 1 (2%)
(50)
LOW DOSE
1 (2X) 1 (2%) 1 (2X)
(47)2 (45O
(50)
1 (2X)
(50)
(50)
(48)37 (77X)
(49)
(50)
(50)1 (2X)
tt NUMBER OF ANIMALS WITH TISSUE EXAMINED MICROSCOPICALLY x NUMBER OF ANIMALS NECROPSIED
47

TABLE A1. MALE RATS: NEOPLASMS (CONTINUED)
XTUNICA VAGINALIS MESOTHELIOMA, N05
ALL OTHER SYSTEMS
XMULTIPLE ORGANS SARCOMA, NOS SARCOMA, NOS, METASTATIC MESOTHELIOMA, NOS MESOTHELIOMA, MALIGNANT
ANIMAL DISPOSITION SUMMARY
ANIMALS INITIALLY IN STUDY NATURAL DEATHS MORIBUND SACRIFICE SCHEDULED SACRIFICE ACCIDENTALLY KILLED TERMINAL SACRIFICE ANIMAL MISSING
INCLUDES AUTOLYZED ANIMALS
TUMOR SUMMARY
TOTAL ANIMALS WITH PRIMARY TUMORS* TOTAL PRIMARY TUMORS
TOTAL ANIMALS WITH BENIGN TUMORS TOTAL BENIGN TUMORS
TOTAL ANIMALS WITH MALIGNANT TUMORS TOTAL MALIGNANT TUMORS
TOTAL ANIMALS WITH SECONDARY TUMORS*TOTAL SECONDARY TUMORS
TOTAL ANIMALS WITH TUMORS UNCERTAINBENIGN OR MALIGNANT
TOTAL UNCERTAIN TUMORS
TOTAL ANIMALS WITH TUMORS UNCERTAINPRIMARY OR METASTATIC
TOTAL UNCERTAIN TUMORS
MATCHED CONTROL LOW DOSE HIGH DOSE
(49)1 (2%)
(50) (50) 1 (2X)
(49)
1 (2JO
(50)1
1
(2%)
(2%)
(50)
2 (45O
50 StJ. 50 4 7 8
24 23 14
22 20 28
49 48 48 109 105 109
47 44 44 73 74 72
29 28 29 34 31 34
1 1 1 1
1 3 1 3
1 1
X PRIMARY TUMORS: ALL TUMORS EXCEPT SECONDARY TUMORS # SECONDARY TUMORS: METASTATIC TUMORS OR TUMORS INVASIVE INTO AN ADJACENT ORGAN
48

TABLE A2.
SUMMARY OF THE INCIDENCE OF NEOPLASMS IN FEMALE RATS ADMINISTERED RESERPINE IN THE DIET
ANIMALS INITIALLY IN STUDYANIMALS NECROPSIEDANIMALS EXAMINED HISTOPATHOLOGICALLY
INTEGUMENTARY SYSTEM
XSUBCUT TISSUEBASAL-CELL CARCINOMASARCOMA, NOSFIBROMAFIBROSARCOMA
RESPIRATORY SYSTEM
#LUNGSQUAMOUS CELL CARCINOMASARCOMA, NOS, METASTATICOSTEOSARCOMA, METASTATIC
HEMATOPOIETIC SYSTEM
^MULTIPLE ORGANSMALIG.LYMPHOMA, UNDIFFER-TYPEMALIG.LYMPHOMA, HISTIOCYTIC TYPEUNDIFFERENTIATED LEUKEMIALYMPHOCYTIC LEUKEMIA
ftPANCREATIC L.NODEMALIGNANT LYMPHOMA, NOS
CIRCULATORY SYSTEM
NONE
DIGESTIVE SYSTEM
*TONGUE SQUAMOUS CELL PAPILLOMA
MATCHED CONTROL
50 50
50
(50) 1 (2%)
1 (25O
(48)
2 (4X)
(50) 1 (2%)
14 (285;)
(50) 1 (2X)
(50)
LOW DOSE
50 49 49
(49)
1 (2X)
(48) 1 (2%)
1 (25O 1 (2%)
(49)
10 (SOX)
(48)
(49) 1 (2X)
HIGH DOSE
50 50 50
(so 1 (2*)
2 (4X)
(50)
(50)
1 (25O 12 (24")
1 (2X)
(50)
(50)
f NUMBER OF ANIMALS WITH TISSUE EXAMINED MICROSCOPICALLY X NUMBER OF ANIMALS NECROPSIED
49

TABLE A2. FEMALE RATS: NEOPLASMS (CONTINUED)
MATCHED CONTROL LOW DOSE
#LIVER (50) (49) HEPATOCELLULAR ADENOMA 1 C25O
ttJEJUNUM (47) (48) LEIOMYOSARCOMA 1 (250
KRECTAL MUCOUS MEMBRA (50) (49) SARCOMA, NOS 1 (2%)
URINARY SYSTEM
8KIDNEY/PELVIS (50) (49) TRANSITIONAL-CELL CARCINOMA 1 (2%)
ENDOCRINE SYSTEM
#PITUITARY (46) (48)ADENOMA, NOS 1 (25O CHROMOPHOBE ADENOMA 21 (46%) 22 (46*) CHROMOPHOBE CARCINOMA 5 (10*)
ttADRENAL (49) (48) CORTICAL ADENOMA 1 (25O 1 (2%) PHEOCHROMOCYTOMA 1 (2?O 3 (6>O PHEOCHROMOCYTOMA, MALIGNANT
#THYROID (48) (48) FOLLICULAR-CELL ADENOMA FOLLICULAR-CELL CARCINOMA C-CELL ADENOMA 2 (4%) 3 (6%) C-CELL CARCINOMA 4 (85O 2 (4X)
ttPANCREATIC ISLETS (50) (48)ISLET-CELL ADENOMA 1 (25O ISLET-CELL CARCINOMA 1 (2X)
REPRODUCTIVE SYSTEM
XMAMMARY GLAND (50) (49) ADENOCARCINOMA, NOS 1 (2X) CYSTADENOMA, NOS
# NUMBER OF ANIMALS WITH TISSUE EXAMINED MICROSCOPICALLY x NUMBER OF ANIMALS NECROPSIED
HIGH DOSE
(50)
(48)
(50)
(47)
(45)
28 (625O
(49)1 (25O 3 (6*) 1 (2%)
(48)1 (25O 1 (2X) 2 (4X)
(49)
(50)
1 (2%)
50

TABLE A2. FEMALE RATS: NEOPLASMS (CONTINUED)
CYSTADENOCARCINOMA, NOS PAPILLARY CYSTADENOMA, NOS ACINAR-CELL ADENOMA FIBROADENOMA
XPREPUTIAL GLAND CARCINOMA, NOS ADENOMA, NOS
SUTERUS CARCINOMA, NOS SARCOMA, NOS ENDOMETRIAL STROMAL POLYP ENDOMETRIAL STROMAL SARCOMA
ttUTERUS/ENDOMETRIUM ADENOCARCINOMA, NOS
SUTERUS/MYOMETRIUM LEICMYOMA
NERVOUS SYSTEM
SBRAIN EPENDYMOMA
SPECIAL SENSE ORGANS
NONE
MUSCULOSKELETAL SYSTEM
XFEMUR OSTEOSARCOMA
*TIBIA OSTEOSARCOMA
BODY CAVITIES
NONE
MATCHED CONTROL
1 (2X) 14 (28%)
(50)
(50)
10 (20%)
(50) 1 (2%)
(50) 1 (2%)
(50)
(50)
(50)
HIGH DOSE
1 (2X) 1 (2X)
14 (28X)
(50) 1 (250
(49)
1 (2X) 2 (45O
(49)
(49)
(49)1 (2X)
(50)
(50)
LOW DOSE
18 (37X)
(49)
2 (4%)
(49) 1 (22)
5 (10%) 1 (25O
(49)
(49)
(48)
(49) 1 (2SO
(49) 1 (2%)
•# NUMBER OF ANIMALS WITH TISSUE EXAMINED MICROSCOPICALLY * NUMBER OF ANIMALS NECROPSIED
51

TABLE A2. FEMALE RATS: NEOPLASMS (CONTINUED)
ALL OTHER SYSTEMS
^MULTIPLE ORGANS SARCOMA, NOS
ANIMAL DISPOSITION SUMMARY
ANIMALS INITIALLY IN STUDY NATURAL DEATHS) MORIBUND SACRIFICE SCHEDULED SACRIFICE ACCIDENTALLY KILLED TERMINAL SACRIFICE ANIMAL MISSING
3) INCLUDES AUTOLYZED ANIMALS
TUMOR SUMMARY
TOTAL ANIMALS WITH PRIMARY TUMORS* TOTAL PRIMARY TUMORS
TOTAL ANIMALS WITH BENIGN TUMORS TOTAL BENIGN TUMORS
TOTAL ANIMALS WITH MALIGNANT TUMORS TOTAL MALIGNANT TUMORS
TOTAL ANIMALS WITH SECONDARY TUMORS*TOTAL SECONDARY TUMORS
TOTAL ANIMALS WITH TUMORS UNCERTAINBENIGN OR MALIGNANT
TOTAL UNCERTAIN TUMORS
TOTAL ANIMALS WITH TUMORS UNCERTAINPRIMARY OR METASTATIC
TOTAL UNCERTAIN TUMORS
MATCHED CONTROL LOW DOSE HIGH DOSE
(50) 1
(49) 2 (45O
(50)
50 50 50 5 4 4 12 15 21
33 31 25
42 45 45 77 86 76
37 39 35 53 57 55
23 22 20 24 29 21
2 2 2 2
* PRIMARY TUMORS'- ALL TUMORS EXCEPT SECONDARY TUMORS 8 SECONDARY TUMORS: METASTATIC TUMORS OR TUMORS INVASIVE INTO AN ADJACENT ORGAN
52
APPENDIX B
SUMMARY OF THE INCIDENCE OF NEOPLASMS IN MICE ADMINISTERED RESERPINE IN THE DIET
53

54

TABLE B1.
SUMMARY OF THE INCIDENCE OF NEOPLASMS IN MALE MICE ADMINISTERED RESERPINE IN THE DIET
ANIMALS INITIALLY IN STUDY ANIMALS MISSING ANIMALS NECROPSIED ANIMALS EXAMINED HISTOPATHOLOGICALLY
INTEGUMENTARY SYSTEM
XSKIN SQUAMOUS CELL PAPILLOMA SQUAMOUS CELL CARCINOMA SARCOMA, NOS FIBROMA
RESPIRATORY SYSTEM
SLUNG ALVEOLAR/BRONCHIOLAR ADENOMA ALVEOLAR/BRONCHIOLAR CARCINOMA
HEMATOPOIETIC SYSTEM
^MULTIPLE ORGANS MALIGNANT LYMPHOMA, NOS MALIG.LYMPHOMA, LYMPHOCYTIC TYPE MALIG. LYMPHOMA, HISTIOCYTIC TYPE MALIGNANT LYMPHOMA, MIXED TYPE LYMPHOCYTIC LEUKEMIA
SMANDIBULAR L. NODE MAST-CELL TUMOR
8MESENTERIC L. NODE MALIC. LYMPHOMA, LYMPHOCYTIC TYPE MALIG.LYMPHOMA, HISTIOCYTIC TYPE
SLIVER MALIG.LYMPHOMA, HISTIOCYTIC TYPE
8PEYERS PATCH MALIG.LYMPHOMA, LYMPHOCYTIC TYPE
MATCHED CONTROL
50
50 50
(50)
1 (2K) 1 (25O
(50) 4 (8?O 5 (10%)
(50)
1 (2X) 3 (6%) 1 (2X) 2 (4X)
(50)
(50) 1 (2JO
(50)
(50)
LOW DOSE
50
50 50
(50) 1 (2X) 1 (2X)
(50) 7 (14JO 3 (650
(50) 1 (2%) 2 (45O 1 (25O
(50) 1 (2X)
(50)
(50) 1 (2%)
(50) 1 (2X)
HIGH DOSE
50 1
49 49
(49) 1 (2X)
1 <2X)
(46) 5 (11X) 1 (23O
(49)
3 (650
1 (2JO
(48)
(48)
2 (4JO
(48)
(48)2 (4X)
# NUMBER OF ANIMALS WITH TISSUE EXAMINED MICROSCOPICALLY * NUMBER OF ANIMALS NECROPSIED
55

TABLE B1. MALE MICE: NEOPLASMS (CONTINUED)
MATCHED CONTROL LOW DOSE HIGH DOSE
CIRCULATORY SYSTEM
KSUBCUT TISSUE (50) (50) (49) HEMANGIOSARCOMA 1 (25O
ttSPLEEN (50) (50) (47) HEMANGIOMA 1 (2%) HEMANGIOSARCOMA 1 (2X) 1 (2%)
SLIVER (50) (50) (48) HEMANGIOMA 1 (25O
XMESENTERY (50) (50) (49) HEMANGIOSARCOMA 1 (2*)
DIGESTIVE SYSTEM
ULIVER (50) (50) (48)HEPATOCELLULAR ADENOMA 7 (14JO 3 (65O HEPATOCELLULAR CARCINOMA 6 (12X) 8 (165O 1 (2X)
tfSTOMACH (50) (50) (48) SIGNET RING CARCINOMA 1 (25O
ftDUODENUM (50) (50) (48) ADENOCARCINOMA, NOS 1 (2*)
URINARY SYSTEM
ftURINARY BLADDER (50) (50) (48) TRANSITIONAL-CELL CARCINOMA
ENDOCRINE SYSTEM
ftADRENAL (50) (50) (48) CORTICAL ADENOMA 1 (25O PHEOCHROMOCYTOMA, MALIGNANT
iTHYROID (48) (49) (45) FOLLICULAR-CELL ADENOMA 1 (2X)
* NUMBER OF ANIMALS WITH TISSUE EXAMINED MICROSCOPICALLY * NUMBER OF ANIMALS NECROPSIED
56

TABLE B1. MALE MICE: NEOPLASMS (CONTINUED)
MATCHED CONTROL LOW DOSE HIGH DOSE
REPRODUCTIVE SYSTEM
XSEMINAL VESICLE (50) (50) (49? UNDIFFERENTIATED CARCINOMA 1 (23O 5 (10?O
NERVOUS SYSTEM
NONE
SPECIAL SENSE ORGANS
*HARDERIAN GLAND (50) (50) (49) ADENOMA, NOS 2 (4JO 2 (4?O 4 (8SO
MUSCULOSKELETAL SYSTEM
NONE
BODY CAVITIES
*MESENTERY (50) (50) (49) LIPOMA 2 (4%)
ALL OTHER SYSTEMS
^MULTIPLE ORGANS (50) (50) (49) SARCOMA, NOS 1 (2K)
ANIMAL DISPOSITION SUMMARY
ANIMALS INITIALLY IN STUDY 50 50 50 NATURAL DEATHS 2 MORIBUND SACRIFICE 10 SCHEDULED SACRIFICE ACCIDENTALLY KILLED TERMINAL SACRIFICE 38 35 41 ANIMAL MISSING 1
a INCLUDES AUTOLYZED ANIMALS
»# NUMBER OF ANIMALS WITH TISSUE EXAMINED MICROSCOPICALLY x NUMBER OF ANIMALS NECROPSIED
57

TABLE B1. MALE MICE: NEOPLASMS (CONTINUED)
TUMOR SUMMARY
TOTAL ANIMALS WITH PRIMARY TUMORS* TOTAL PRIMARY TUMORS
TOTAL ANIMALS WITH BENIGN TUMORS TOTAL BENIGN TUMORS
TOTAL ANIMALS WITH MALIGNANT TUMORS TOTAL MALIGNANT TUMORS
TOTAL ANIMALS WITH SECONDARY TUMORS8 TOTAL SECONDARY TUMORS
TOTAL ANIMALS WITH TUMORS UNCERTAINBENIGN OR MALIGNANT
TOTAL UNCERTAIN TUMORS
TOTAL ANIMALS WITH TUMORS UNCERTAINPRIMARY OR METASTATIC
TOTAL UNCERTAIN TUMORS
MATCHED CONTROL LOW DOSE HIGH DOSE
30 34 25 40 45 31
14 18 13 16 21 14
22 18 14 24 23 17
1 1
* PRIMARY TUMORS: ALL TUMORS EXCEPT SECONDARY TUMORS # SECONDARY TUMORS: METASTATIC TUMORS OR TUMORS INVASIVE INTO AN ADJACENT ORGAN
58
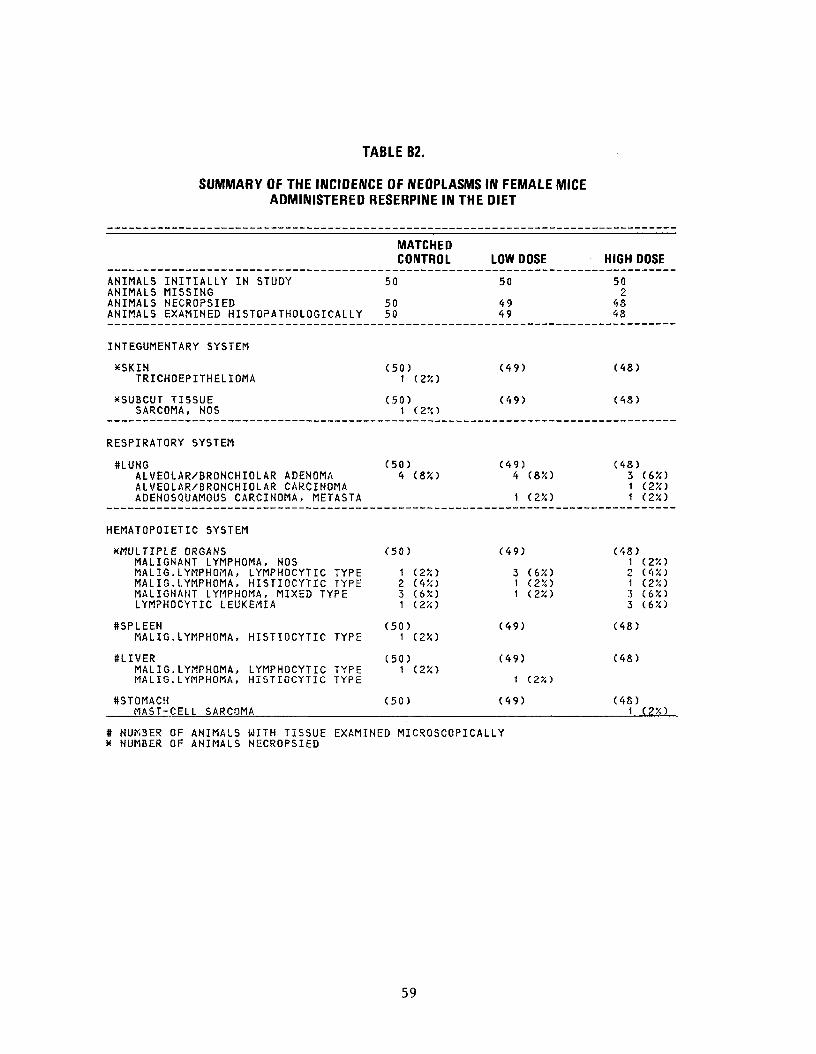
TABLE B2.
SUMMARY OF THE INCIDENCE OF NEOPLASMS IN FEMALE MICE ADMINISTERED RESERPINE IN THE DIET
MATCHED CONTROL LOW DOSE HIGH DOSE
ANIMALS INITIALLY IN STUDY 50 50 50 ANIMALS MISSING 2 ANIMALS NECROPSIED 50 49 48 ANIMALS EXAMINED HISTOPATHOLOGICALLY 50 49 48
INTEGUMENTARY SYSTEM
*SKIN (50) (49) (48) TRICHOEPITHELIOMA 1 (2*)
XSUBCUT TISSUE (50) (49) (48) SARCOMA, NOS 1 (2*)
RESPIRATORY SYSTEM
SLUNG (50) (49) (48) ALVEOLAR/BRONCHIOLAR ADENOMA 4 (85O 4 (8X) 3 (6X) ALVEOLAR/BRONCHIOLAR CARCINOMA 1 (2X) ADENOSQUAMOUS CARCINOMA, METASTA 1 (2%) 1 (2%)
HEMATOPOIETIC SYSTEM
^MULTIPLE ORGANS (50) (49) (48)MALIGNANT LYMPHOMA, NOS 1 (2X) MALIG. LYMPHOMA, LYMPHOCYTIC TYPE 1 (2X) 3 (6%) 2 (4%) MALIG. LYMPHOMA, HISTIOCYTIC TYPE 2 (4%) 1 (2S) 1 (2%) MALIGNANT LYMPHOMA, MIXED TYPE 3 (650 1 (2X) 3 (6%) LYMPHOCYTIC LEUKEMIA 1 (2%) 3 (6X)
SSPLEEN (50) (49) (48) MALIG. LYMPHOMA, HISTIOCYTIC TYPE 1 (2%)
ttLIVER (50) (49) (48) MALIG. LYMPHOMA, LYMPHOCYTIC TYPE 1 (2%) MALIG. LYMPHOMA, HISTIOCYTIC TYPE 1 (2X)
ftSTOMACH (50) (49) (48)MAST-CELL SARCOMA 1 (2%)
# NUMBER OF ANIMALS WITH TISSUE EXAMINED MICROSCOPICALLY x NUMBER OF ANIMALS NECROPSIED
59

TABLE B2. FEMALE MICE: NEOPLASMS (CONTINUED)
MATCHED CONTROL LOW DOSE _HIGH_DOSE
8PEYERS PATCH (50) (49) (.42) MALIGNANT LYMPHOMA, NOS 1 (2%) MALIG.LYMPHOMA, LYMPHOCYTIC TYPE 1 (2*)
ttDUODENUM (50) (49) (48) MALIG.LYMPHOMA, LYMPHOCYTIC TYPE 1 (2%)
CIRCULATORY SYSTEM
*SUBCUT TISSUE (50) (49) (48) HEMANGIOMA 1 (2X) 1 (2%)
DIGESTIVE SYSTEM
t t L IVER ( 5 0 ) (49 ) (48) H E P A T O C E L L U L A R ADENOMA 2 (4?O 1 (25O
SGASTRIC MUCOSA (50 ) (49 ) (48) ADENOMA, NOS 1 (2%)
URINARY SYSTEM
NONE
ENDOCRINE SYSTEM
ttPITUITARY (48) (47) (47) CHROMOPHOBE ADENOMA 1 (2%) ACIDOPHIL ADENOMA 1 (25O
STHYROID (50) (46) (48) F O L L I C U L A R - C E L L ADENOMA 1 (2%) 2 (4%) C-CELL ADENOMA 1 (2%)
JtPANCREATIC ISLETS (50) (49) (48) ISLET-CELL ADENOMA 1 (2%)
REPRODUCTIVE SYSTEM
XMAMMARY GLAND (50) (49) (48) ADENOCARCINOMA, N05 2
# NUMBER OF ANIMALS WITH TISSUE EXAMINED MICROSCOPICALLY * NUMBER OF ANIMALS NECROPSIED
60
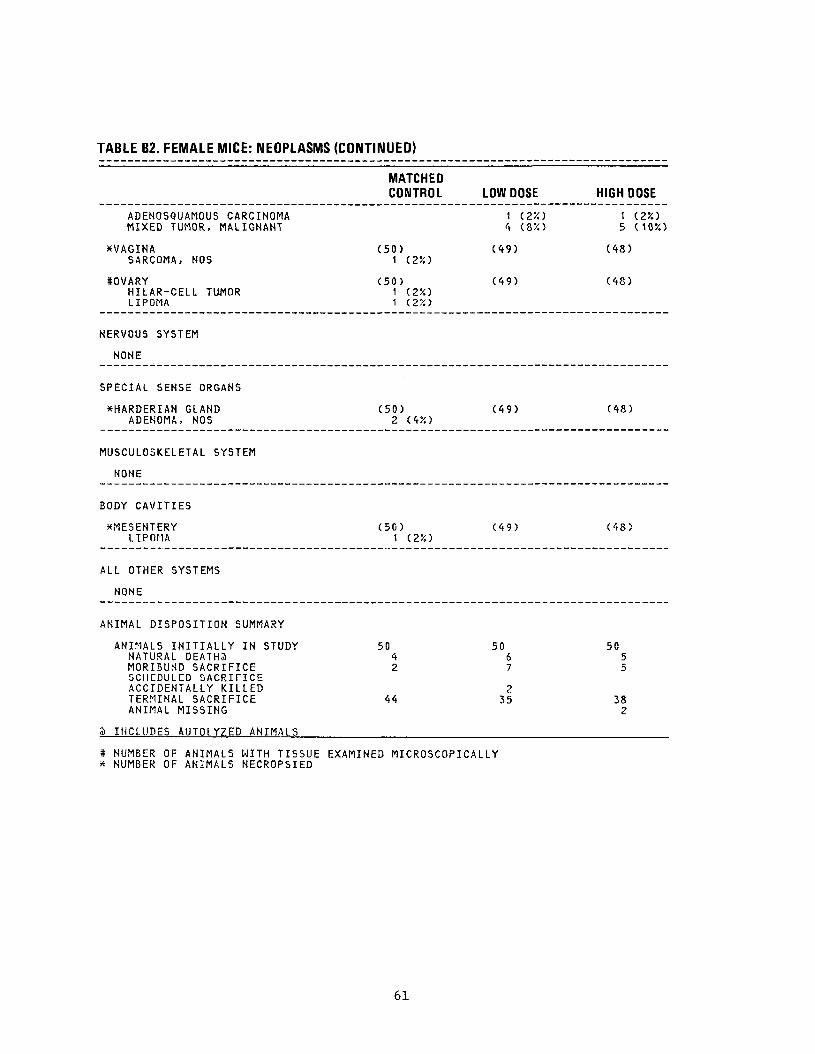
TABLE B2. FEMALE MICE: NEOPLASMS (CONTINUED)
MATCHED CONTROL LOW DOSE HIGH DOSE
ADENOSQUAMOUS CARCINOMA 1 (2%) 1 (2X) MIXED TUMOR, MALIGNANT 4 (3%) 5 (10%)
XVAGINA (50) (49) (48) SARCOMA, NOS 1 (2X)
ttOVARY (50) (49) (48) HILAR-CELL TUMOR 1 (2%) LIPOMA 1 (2%)
NERVOUS SYSTEM
NONE
SPECIAL SENSE ORGANS
XHARDERIAN GLAND (so) (49) (48) ADENOMA, NOS 2 (4X)
MUSCULOSKELETAL SYSTEM
NONE
BODY CAVITIES
^MESENTERY (50) (49) (48) LIPOHA 1 (2X)
ALL OTHER SYSTEMS
NONE
ANIMAL DISPOSITION SUMMARY
ANIMALS INITIALLY IN STUDY 50 50 50 NATURAL DEATH3 6 MORIBUND SACRIFICE 7 SCHEDULED SACRIFICE ACCIDENTALLY KILLED 2 TERMINAL SACRIFICE 44 35 38 ANIMAL MISSING 2
3 INCLUDES AUTOLYZED ANIMALS
# NUMBER OF ANIMALS WITH TISSUE EXAMINED MICROSCOPICALLY * NUMBER OF ANIMALS NECROPSIED
61
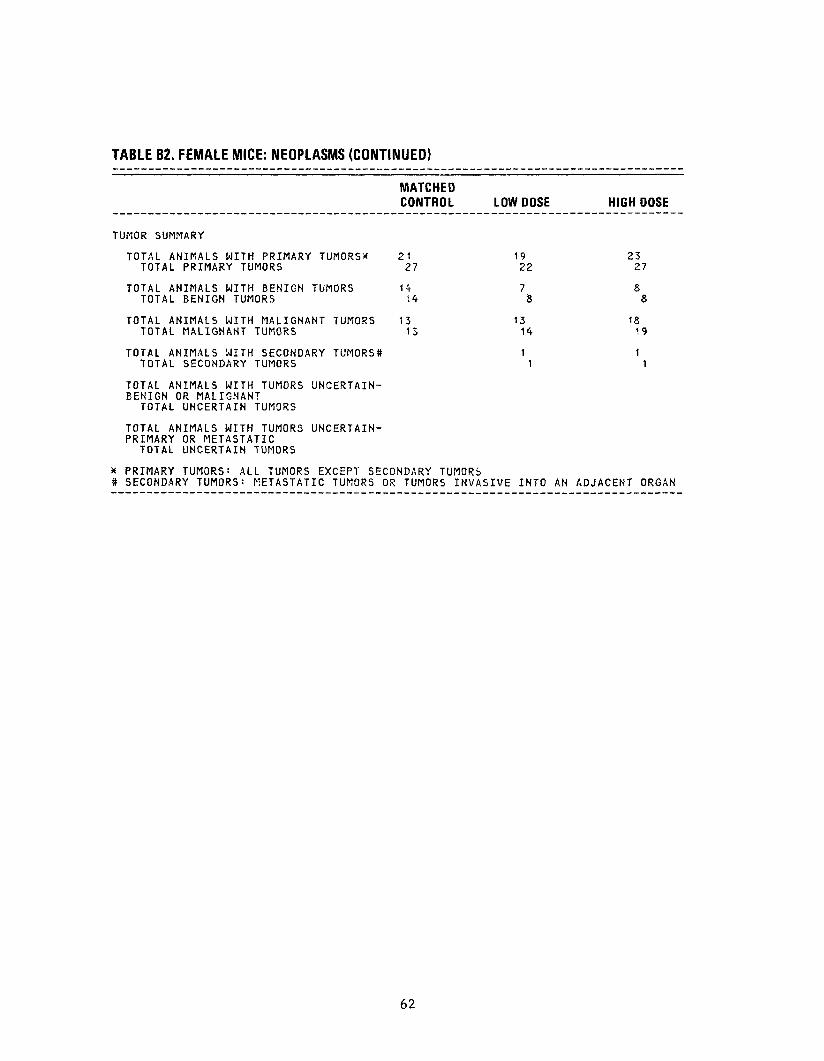
TABLE B2. FEMALE MICE: NEOPLASMS (CONTINUED)
MATCHED CONTROL LOW DOSE HIGH DOSE
TUMOR SUMMARY
TOTAL ANIMALS WITH PRIMARY TUMORS* 21 19 23 TOTAL PRIMARY TUMORS 27 22 27
TOTAL ANIMALS WITH BENIGN TUMORS U 7 8 TOTAL BENIGN TUMORS 14 & 8
TOTAL ANIMALS WITH MALIGNANT TUMORS 13 13 18 TOTAL MALIGNANT TUMORS 13 14 19
TOTAL ANIMALS WITH SECONDARY TUMORSft 1 1 TOTAL SECONDARY TUMORS 1 1
TOTAL ANIMALS WITH TUMORS UNCERTAINBENIGN OR MALIGNANT
TOTAL UNCERTAIN TUMORS
TOTAL ANIMALS WITH TUMORS UNCERTAINPRIMARY OR METASTATIC
TOTAL UNCERTAIN TUMORS
* PRIMARY TUMORS: ALL TUMORS EXCEPT SECONDARY TUMORS 3 SECONDARY TUMORS: METASTATIC TUMORS OR TUMORS INVASIVE INTO AN ADJACENT ORGAN
62

APPENDIX C
SUMMARY OF THE INCIDENCE OF NONNEOPLASTIC LESIONS IN RATS ADMINISTERED RESERPINE IN THE DIET
63

64
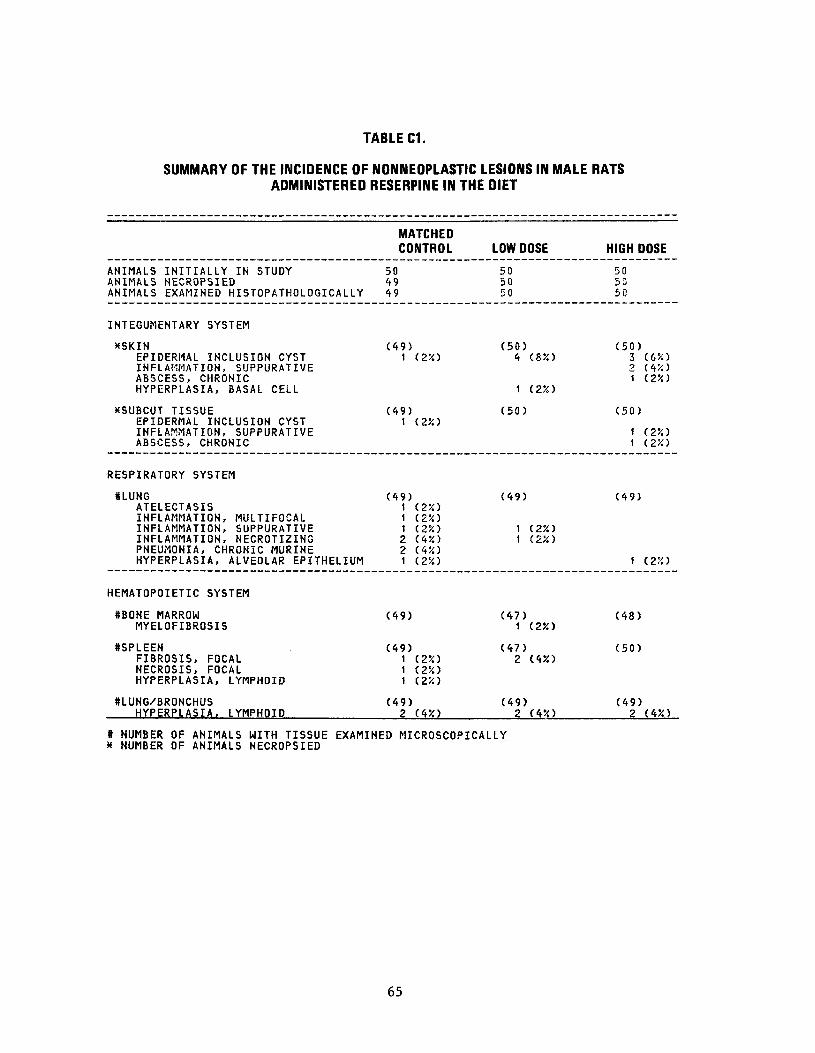
TABLE C1.
SUMMARY OF THE INCIDENCE OF NONNEOPLASTIC LESIONS IN MALE RATS ADMINISTERED RESERPINE IN THE DIET
MATCHED CONTROL LOW DOSE
ANIMALS INITIALLY IN STUDY 50 50 ANIMALS NECROPSIED 49 50 ANIMALS EXAMINED HISTOPATHOLOGICALLY 49 50
INTEGUMENTARY SYSTEM
XSKIN EPIDERMAL INCLUSION CYST INFLAMMATION, SUPPURATIVE
(49) 1 (2X)
(50)4 (SX)
ABSCESS, CHRONIC HYPERPLASIA, BASAL CELL 1 (25O
XSUBCUT TISSUE EPIDERMAL INCLUSION CYST INFLAMMATION, SUPPURATIVE
(49) 1 (2JO
(50)
ABSCESS, CHRONIC
RESPIRATORY SYSTEM
tfLUNG ATELECTASIS INFLAMMATION, MULTIFOCAL INFLAMMATION, SUPPURATIVE INFLAMMATION, NECROTIZING PNEUMONIA, CHRONIC MURINE HYPERPLASIA, ALVEOLAR EPITHELIUM
(49)1 (2%) 1 (2X) 1 (2%) 2 (45O 2 (4%) 1 (2*)
(49)
1 (2%) 1 (25O
HEMATOPOIETIC SYSTEM
ttBONE MARROW MYELOFIBROSIS
(49) (47)1 (25O
#SPLEEN FIBROSIS, FOCAL NECROSIS, FOCAL HYPERPLASIA, LYMPHOID
(49) 1 (2Ji) 1 (2%) 1 (2%)
(47) 2 (45O
*LUNG/BRONCHUS HYPERPLASIA, LYMPHOID
(49) 2 (45O
(49) 2 (4%)
« NUMBER OF ANIMALS WITH TISSUE EXAMINED MICROSCOPICALLY X NUMBER OF ANIMALS NECROPSIED
HIGH DOSE
50 50 50
(50) 3 (65i) 2 (4X) 1 (2X)
(50)
1 (25O 1
(49)
1 (2?O
(48)
(50)
(49) 2 (4X)
65

TABLE C1. MALE RATS: NONNEOPLASTIC LESIONS (CONTINUED)
MATCHED CONTROL LOW DOSE
CIRCULATORY SYSTEM
*MESENTERIC I. NODE (49) (49) LYMPHANGIECTASIS
ttHEART/ATRIUM (49) (49) THROMBUS, ORGANIZED 1 (2%)
^AURICULAR APPENDAGE (49) (49)THROMBUS, ORGANIZED 2 (4%)
MYOCARDIUM (49) (49) INFLAMMATION, INTERSTITIAL 26 (53%) 17 (35%)
XAORTA (49) (50) INFLAMMATION, CHRONIC 1 (2%)
XMESENTERY (49) (50) PERIARTERITIS
DIGESTIVE SYSTEM
SLIVER CONGESTION, PASSIVE
(49) (49)
CYTOPLASMIC VACUOLIZATION BASOPHILIC CYTO CHANGE CYTOLOGIC ALTERATION, NOS
2 (4%) 21 (4%) (2%)
»BILE DUCT HYPERPLASIA, NOS
(49) 1 (2%)
(49)
ttPANCREAS INFLAMMATION, INTERSTITIAL INFLAMMATION, CHRONIC
(49) 3 (6%) 1 (2JO
(47) 2 (4%)
#STOMACH INFLAMMATION, NECROTIZING
(49) 2 (4X)
(49)
#GASTRIC MUCOSA MINERALIZATION
(49) 1 (2%)
(49)
SGASTRIC SUBMUCOSA EDEMA, NOS
(49) 1 (2X)
(49)
NUMBER OF ANIMALS WITH TISSUE EXAMINED MICROSCOPICALLY NUMBER OF ANIMALS NECROPSIED
HIGH DOSE
(50)1 (2X)
(49)1 (2%)
(49) 1 (2%)
(49) 25 (51%)
(50)
(50) 1 (2%)
(50) 1 (2%) 1 (2%)
1 (2%)
(50) 2 (4%)
(49) 3 (6%)
(50)
(50)
(50)
66
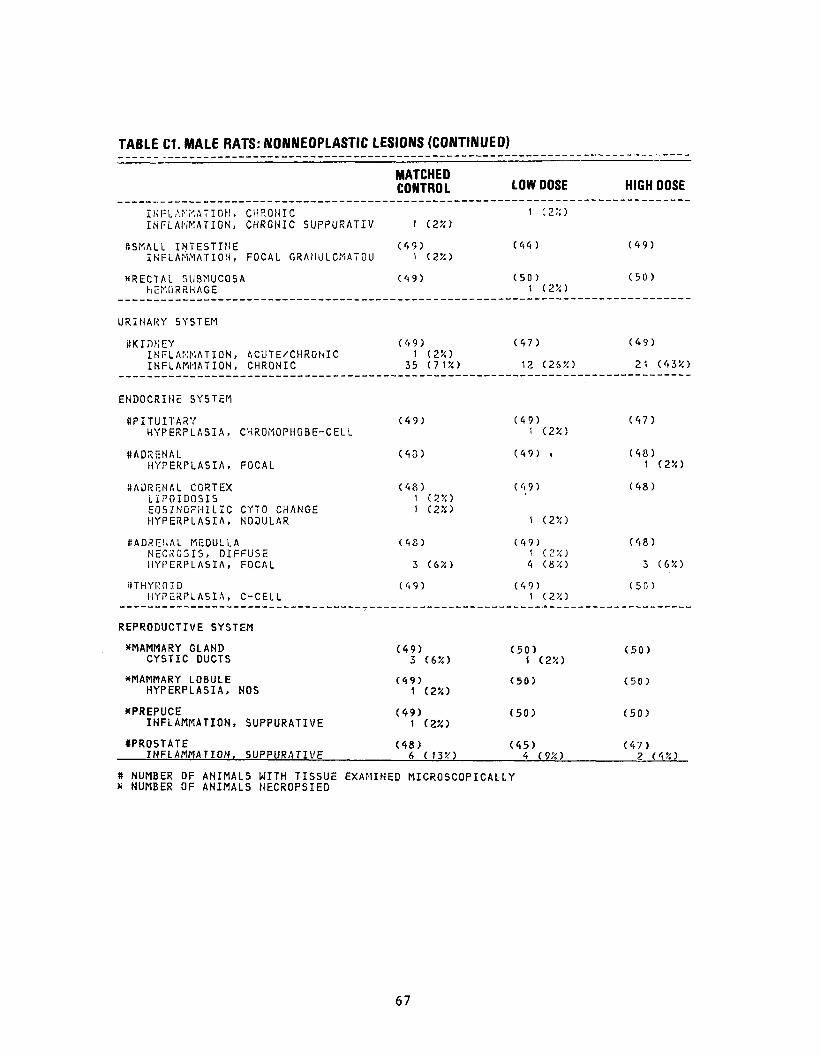
TABLE C1. MALE RATS: NONNEOPLASTIC LESIONS (CONTINUED)
MATCHED CONTROL LOW DOSE HIGH DOSE
INFLAMMATION, CHROMIC 1 (2X) INFLAMMATION, CHRONIC SUPPURATIV 1 (2X)
ftSMALL INTESTINE (49) (44) (49) INFLAMMATION, FOCAL GRAIIULOMATOU 1 (2X)
KRECTAL SUBMUCOSA (49) (50) (50) HEMORRHAGE 1 (2X)
URINARY SYSTEM
itKIDHEY (49) (47) (49) INFLAMMATION, ACUTE/CHRONIC 1 (2X) INFLAMMATION, CHRONIC 35 (71X) 12 (26X) 21 (43JO
ENDOCRINE SYSTEM
f t P I T U I T A R Y ( 4 9 ) ( 4 9 ) ( 47 ) H Y P E R P L A S I A , CHROMOPHOBE-CELL 1 (2X)
D A D R E N A L ( 4 3 ) ( 4 9 ) . (48 ) HYPERPLASIA, FOCAL 1 ( 2X )
i lAORENAL C O R T E X (4f l) ( 4 9 ) (48 ) L IPOIDOSIS 1 ( 2 X > EOSINOPI-IILIC CYTO CHANGE 1 (2X) H Y P E R P L A S I A , NODULAR 1 ( 2 X )
S A D R C N A L MEDULLA (4f i ) ( 4 9 ) (48 ) NECROSIS, DIFFUSE 1 ( 2 % ) I IY f 'ERPLASIA , FOCAL 3 ( 6 X ) 4 ( 8 X ) 3 ( 6 X )
UTHYROID ( 4 9 ) ( 4 9 ) ( 5 0 ) H Y P E R P L A S I A , C-CELL 1 ( 2 X )
REPRODUCTIVE SYSTEM
XMAMMARY GLAND (49) (50) (50) CYSTIC DUCTS 3 (6X) 1 (2X)
^MAMMARY L O B U L E (49) (50) (50) HYPERPLASIA, NOS 1 (2X)
*PREPUCE (49) (50) (50) INFLAMMATION, SUPPURATIVE 1 (2X)
#PROSTATE (48) (45) (47)INFLAMMATION. SUPPURATIVE 6 (15^) 4 (9X) 2
# NUMBER OF A N I M A L S WITH TISSUE EXAMINED MICROSCOPICALLY * NUMBER OF ANIMALS NECROPSIED
67

TABLE C1. MALE RATS: NONNEOPLASTIC LESIONS (CONTINUED)
INFLAMMATION, CHRONIC SUPPURATIV FIBROSIS
NERVOUS SYSTEM
ftCEREBRUM MALACIA
ftBRAIN HEMORRHAGE INFLAMMATION, FOCAL GRANULOMATOU
^CEREBELLUM HEMORRHAGE
SPECIAL SENSE ORGANS
XEYE/RETINAATROPHY, NOS
XEYELID INFLAMMATION, FOCAL INFLAMMATION, SUPPURATIVE
*MIDDLE EAR INFLAMMATION, SUPPURATIVE
MUSCULOSKELETAL SYSTEM
NONE
BODY CAVITIES
^MESENTERY STEATITIS
ALL OTHER SYSTEMS
NONE
MATCHED CONTROL LOW DOSE
1 (2*) 1 (2X)
(49) (49) 1 (25i)
(49) (49) 3 (6*)
1 (25O
(49) (49) 1 (2%)
(49) (50)1 (2SO
(49) (50)1 (2%)
(49) (50) 1 (2%)
(49) (50) 3 (6X) 2 (4%)
HIGH DOSE
(49)
(49)
(49)
(50)
(50)
1 (250
(50)
(50) 3 (6%)
# NUMBER OF ANIMALS WITH TISSUE EXAMINED MICROSCOPICALLY X NUMBER OF ANIMALS NECROPSIED
68
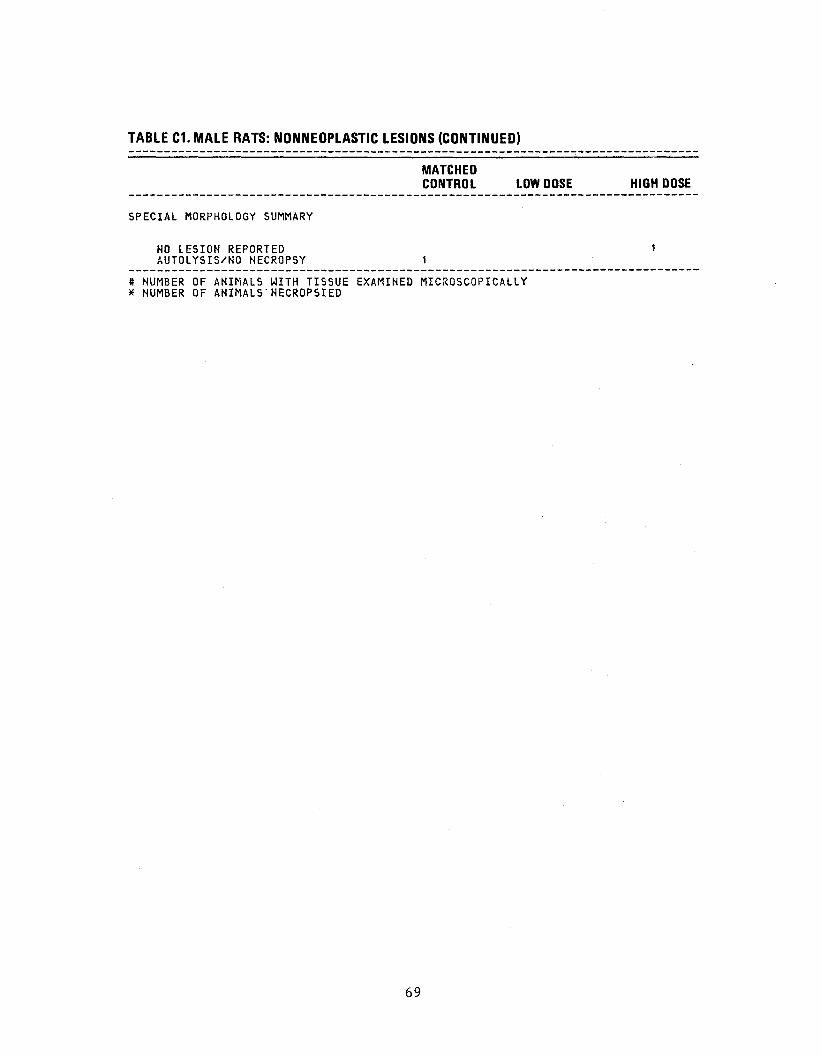
TABLE C1. MALE RATS: NONNEOPLASTIC LESIONS (CONTINUED)
MATCHED CONTROL LOW DOSE HIGH DOSE
SPECIAL MORPHOLOGY SUMMARY
NO LESION REPORTEDAUTOLYSIS/NO NECROPSY 1
ft NUMBER OF ANIMALS WITH TISSUE EXAMINED MICROSCOPICALLY * NUMBER OF ANIMALS'NECROPSIED
1
69

TABLE C2.
SUMMARY OF THE INCIDENCE OF NONNEOPLASTIC LESIONS IN FEMALE RATS ADMINISTERED RESERPINE IN THE DIET
MATCHED CONTROL LOW DOSE HIGH DOSE
ANIMALS INITIALLY IN STUDY 50 50 50 ANIMALS NECROPSIED 50 49 50 ANIMALS EXAMINED HISTOPATHOLOGICALLY 50 49 50
INTEGUMENTARY SYSTEM
*SKIN (50) (49) (50) ULCER, FOCAL 1 (2!O INFLAMMATION, CHRONIC 1 (25O INFLAMMATION, CHRONIC SUPPURATIV 1 (2X)
RESPIRATORY SYSTEM
^TRACHEA (49) (48) (50) INFLAMMATION, SUPPURATIVE 1 (2X)
#LUNG (48) (48) (50) INFLAMMATION, MULTIFOCAL 1 (2X) INFLAMMATION, SUPPURATIVE 1 (2X) PNEUMONIA, CHRONIC MURINE 1 (2X) INFLAMMATION, CHRONIC SUPPURATIV 1 (25O
HEMATOPOIETIC SYSTEM
#BONE MARROW (50) (49) (50) HYPERPLASIA, RETICULUM CELL 1 (2K)
SSPLEEN (49) (48) (49) HEMATOPOIESIS 2 (4K) 4 (85O 1 (2X)
SLUNG/BRONCHUS (48) (48) (50) HYPERPLASIA, LYMPHOID 1 (2?O 1 (2K)
CIRCULATORY SYSTEM
SHEART/ATRIUM (49) (49) (50) THROMBUS, ORGANIZED
# NUMBER OF ANIMALS WITH TISSUE EXAMINED MICROSCOPICALLY x NUMBER OF ANIMALS NECROPSIED
70

TABLE C2. FEMALE RATS: NONNEOPLASTIC LESIONS (CONTINUED)
MATCHED CONTROL LOW DOSE
^MYOCARDIUM (49) (49)INFLAMMATION, INTERSTITIAL 3 (16%) 1 1 (22%)
DIGESTIVE SYSTEM
SLIVER (50) (49)CYTOPLASMIC VACUOLIZATION 1 (2%) BASOPHILIC CYTO CHANGE 5 (10%)
ttPANCREAS (50) (48) INFLAMMATION, INTERSTITIAL
URINARY SYSTEM
ftKIDNEY (50) (49) PYELONEPHRITIS, NOS 1 (2%) INFLAMMATION, CHRONIC 2 (4%)
ENDOCRINE SYSTEM
ftPITUITARY (46) (48) HYPERPLASIA, CHROMOPHOBE-CELL 1 (2%) 1 (2%)
ftADRENAL (49) (43) HEMORRHAGE CYTOPLASMIC VACUOLIZATION
8ADRENAL CORTEX (49) (48) CYTOPLASMIC VACUOLIZATION 1 (2%) 1 (2%)
#THYROID (48) (43)HYPERPLASIA, C-CELL 1 (2%) 3 (6%)
REPRODUCTIVE SYSTEM
XMAMMARY GLAND (50) (49)CYSTIC DUCTS 10 (20%) 17 (35%)
- *MAMMARY LOBULE (50) (49) HYPERPLASIA, NOS 1 (2%)
# NUMBER OF ANIMALS WITH TISSUE EXAMINED MICROSCOPICALLY * NUMBER OF ANIMALS NECROPSIED
HIGH DOSE
(50)10 (20%)
(50) 5 (10%) 2 (4%)
(49) 1 (2%)
(47)
1 (2%)
(45) 2 (4%)
(49) 1 (2%) 1 (2%)
(49) 1 (25O
(48)
(50)12 (24%)
(50)1 (2%)
71

TABLE C2. FEMALE RATS: NONNEOPLASTIC LESIONS (CONTINUED)
MATCHED CONTROL LOW DOSE HIGH DOSE
*PREPUTIAL GLAND (50) (49) ( 5 0 ) METAPLASIA, SQUAMOUS 1 (2%)
#UTERUS (50) (49) ( 49 ) INFLAMMATION, SUPPURATIVE 1 (2%)
ttUTERUS/ENDOMETRIUM (50) (49) (49 ) INFLAMMATION, SUPPURATIVE 8 (16%) 5 (10%) 5 (10*) INFLAMMATION, CHRONIC SUPPURATIV 1 (2%) HYPERPLASIA, NOS 7 (14JO 6 (12%) HYPERPLASIA, EPITHELIAL 1 C25O HYPERPLASIA, FOCAL 1 (2%) HYPERPLASIA, CYSTIC 12 (24%) 4 (8%) 5 (10%)
ftOVARY (50) (49) ( 5 0 )INFLAMMATION, SUPPURATIVE 2 ( 4 % ) INFLAMMATION, CHRONIC SUPPURATIV 2 1 (2%) 1 ( 2 % )
NERVOUS SYSTEM
NONE
SPECIAL SENSE ORGANS
NONE
MUSCULOSKELETAL SYSTEM
NONE
BODY CAVITIES
XMESENTERY (50) (49) (50) STEATITIS 4 (8%) 1 (2%) 2 (4%) ABSCESS, CHRONIC 1 (2%)
ALL OTHER SYSTEMS
DIAPHRAGM STEATITIS
# NUMBER OF ANIMALS WITH TISSUE EXAMINED MICROSCOPICALLY * NUMBER OF ANIMALS NECROPSIED
72

TABLE C2. FEMALE RATS: NONNEOPLASTIC LESIONS (CONTINUED)
MATCHED CONTROL LOW DOSE HIGH DOSE
— — — — — — •«_ _ _ _ __ ____ ™ _ _ _ _ _ _ _„___„_••,_____, _ .. _ «. — _____________.. ___— — __ — _— — — — — __ — — _ ____ _
SPECIAL MORPHOLOGY SUMMARY
NO LESION REPORTED 2 1 2 AUTOLYSIS/NO NECROPSY 1
# NUMBER OF ANIMALS WITH TISSUE EXAMINED MICROSCOPICALLY x NUMBER OF ANIMALS NECROPSIED
73

74

APPENDIX D
SUMMARY OF THE INCIDENCE OF NONNEOPLASTIC LESIONS IN MICE ADMINISTERED RESERPINE IN THE DIET
75

76

TABLE D1.
SUMMARY OF THE INCIDENCE OF NONNEOPLASTIC LESIONS IN MALE MICE ADMINISTERED RESERPINE IN THE DIET
MATCHED CONTROL LOW DOSE HIGH DOSE
ANIMALS INITIALLY IN STLTOY 50 50 50 ANIMALS MISSING 1 ANIMALS NECROPSIED 50 50 49 ANIMALS EXAMINED HISTOPATHOLOGICALLY 50 50 49
INTEGUMENTARY SYSTEM
XSKIN (50) (50) (49) EPIDERMAL INCLUSION CYST 1 (2JO
*SUBCUT TISSUE (50) (50) (49) INFLAMMATION, FOCAL 1 (2X) ABSCESS, CHRONIC 1 (2%) INFLAMMATION, FOCAL GRANULOMATOU 1 (2%)
RESPIRATORY SYSTEM
ttLUNG (50) (50) (46) INFLAMMATION, NECROTIZIHG 1 (25O HYPERPLASIA, ALVEOLAR EPITHELIUM 1 (2X)
SLUNG/ALVEOLI (50) (50) (46) INFLAMMATION, SUPPURATIVE 1 (2X) INFLAMMATION, ACUTE FOCAL 1 (25O
HEMATOPOIETIC SYSTEM
^MULTIPLE ORGANS (50) (50) (49) HYPERPLASIA, LYMPHOID 1 (25O
ftSPLEEN (50) (50) (47) FIBROSIS, FOCAL 1 (2X) HYPERPLASIA, LYMPHOID 2 (45O HEMATOPOIESIS 1 (25O 4 (9%)
SMESENTERIC L. NODE (50) (50) (48) HYPERPLASIA, LYMPHOID 1 (2X)
SRENAL LYMPH NODE (50) (50) (48) HYPERPLASIA, LYMPHOID 1 (2X)
# NUMBER OF ANIMALS WITH TISSUE EXAMINED MICROSCOPICALLY * NUMBER OF ANIMALS NECROPSIED
77

TABLE D1. MALE MICE: NONNEOPLASTIC LESIONS (CONTINUED)
MATCHED CONTROL LOW DOSE
flINGUINAL LYMPH NODE (50) (50) INFLAMMATION, SUPPURATIVE HYPERPLASIA, LYMPHOID
ttHVER (50) (50)HEMATOPOIESIS 1 (2X)
ttPEYERS PATCH (50) (50)HYPERPLASIA, LYMPHOID 1 (2%)
SKIDNEY (50) (50) HYPERPLASIA, LYMPHOID 1 (2%)
CIRCULATORY SYSTEM
fiHEART/ATRIUM (49) (50) THROMBUS, ORGANIZED 1 (2%)
SMYOCARDIUM (49) (50) INFLAMMATION, INTERSTITIAL 1 (2X)
DIGESTIVE SYSTEM
ffLIVER (50) (50) NECROSIS, COAGULATIVE 1 (2%) CYTOPLASMIC VACUOLIZATION 1 (2%) 2 (4«) BASOPHILIC CYTO CHANGE ANGIECTASIS 1 (2%)
#PANCREATIC ACINUS (50) (49) ATROPHY, FOCAL 1 (2%)
URINARY SYSTEM
ftKIDNEY (50) (50) LYMPHOCYTIC INFLAMMATORY INFILTR 1 <2SO
ttKIDNEY/CAPSULE (50) (50) INFLAMMATION, SUPPURATIVE
ENDOCRINE SYSTEM
NONE
ft NUMBER OF ANIMALS WITH TISSUE EXAMINED MICROSCOPICALLY * NUMBER OF ANIMALS NECROPSIED
HIGH DOSE
(48)1 (2X) 1 (2X)
(48)
(48)
(48)
(47)
(47)
(48) 1 (2%)
1 (2%) 1 (2X)
(4S)
(48)
(48)1 (2%)
78

TABLE 01. MALE MICE: NONNEOPLASTIC LESIONS (CONTINUED)
MATCHED CONTROL LOW DOSE
REPRODUCTIVE SYSTEM
*PREPUTIAL GLAND (50) (50) 1 DILATATION, NOS CYSTIC DUCTS
11 (2%) (2%) 1 (2%)
INFLAMMATION, SUPPURATIVE INFLAMMATION, ACUTE/CHRONIC 1 (2%) INFLAMMATION, CHRONIC SUPPURATIV 1 (2%)
XSEMINAL VESICLE HEMORRHAGE INFLAMMATION, MULTIFOCAL INFLAMMATION, CHRONIC
(50) (so: 1
10
1
(2%) (20%)
INFLAMMATION, CHRONIC FOCAL FIBROSIS FIBROSIS, FOCAL HYPERPLASIA, EPITHELIAL
12 1 4
(24%) (2%) (8%)
NERVOUS SYSTEM
NONE
SPECIAL SENSE ORGANS
*EYE (50) (50) PHTHISIS BULBI 1 (2%)
MUSCULOSKELETAL SYSTEM
XKNEE JOINT (50) (50) EXOSTOSIS 1 (2%)
BODY CAVITIES
XMESENTERY (50) (50)STEATITIS 1 (2%)
ALL OTHER SYSTEMS
NONE
# NUMBER OF ANIMALS WITH TISSUE EXAMINED MICROSCOPICALLY ^ NUMBER OF ANIMALS NECROPSIED
HIGH DOSE
(49)
1 (2%)
(49)1 (2%)
6 (12%) 2 (4%) 5 ( 10%)
4 (8%)
(49)
(49)
(49) 1 (2%)
79

TABLE 01. MALE MICE: NONNEOPLASTIC LESIONS (CONTINUED)
MATCHED CONTROL LOW DOSE HIGH DOSE
SPECIAL MORPHOLOGY SUMMARY
NO LESION REPORTED 15ANIMAL MISSING/NO NECROPSY
* NUMBER OF ANIMALS WITH TISSUE EXAMINED MICROSCOPICALLY * NUMBER OF ANIMALS NECROPSIED
9 16 1
80

TABLE 02.
SUMMARY OF THE INCIDENCE OF NONNEOPLASTIC LESIONS IN FEMALE MICE ADMINISTERED RESERPINE IN THE DIET
MATCHED CONTROL LOW DOSE
ANIMALS INITIALLY IN STUDY 50 50 ANIMALS MISSING ANIMALS NECROPSIED 50 49 ANIMALS EXAMINED HISTOPATHOLOGICALLY 50 49
INTEGUMENTARY SYSTEM
*SUBCUT TISSUE (50) (49) HEMATOMA, NOS
RESPIRATORY SYSTEM
NONE
HEMATOPOIETIC SYSTEM
XMULTIPLE ORGANS (50) (49) HYPERPLASIA, LYMPHOID 6 (125O 1 (2X)
ttBONE MARROW (50) (48) MYELOFIBROSIS 5 (1050
ftSPLEEN (50) (49) HYPERPLASIA, LYMPHOID 3 (6X) 1 (2%) HEMATOPOIESIS
8MESENTERIC L. NODE (50) (49) INFLAMMATION, GRANULOMATOUS 1 (2%)
8RENAL LYMPH NODE (50) (49) HYPERPLASIA, LYMPHOID 1 (2X)
tLUNG/BRONCHUS (50) (49) HYPERPLASIA, LYMPHOID
SLUNG (50) (49) HYPERPLASIA, LYMPHOID 3 (6X) 1 (2X)
ttLIVER (50) (49) HYPERPLASIA, LYMPHOID
tt NUMBER OF ANIMALS WITH TISSUE EXAMINED MICROSCOPICALLY * NUMBER OF ANIMALS NECROPSIED
HIGH DOSE
50 2 48 43
(48) 1 (2*)
(48) 2 (4JO
(48)
(48) 1 (23O 1 (2X)
(48)
(48)
(48)1 C25O
(48)2 (4X)
(48) 1 (2%)
81

TABLE D2. FEMALE MICE: NONNEOPLASTIC LESIONS (CONTINUED)
MATCHED CONTROL LOW DOSE
HEMATOPOIESIS 1 (2%)
8KIDNEY/PELVIS HYPERPLASIA, LYMPHOID
(50) (49) 1 (25O
CIRCULATORY SYSTEM
XPULMONARY ARTERY HYPERTROPHY, NOS
(50) 1 (2%)
(49)
DIGESTIVE SYSTEM
ttLIVER NECROSIS, COAGULATIVE
(50) (49)
CYTOPLASMIC VACUOLIZATION 1 (2%)
URINARY SYSTEM
SKIDNEY INFLAMMATION, CHRONIC
(50)1 (2%)
(49)
ENDOCRINE SYSTEM
SRIGHT ADRENAL GLAND ATROPHY, NOS
(50) 1 (25O
(49)
SLEPT ADRENAL GLAND HYPERTROPHY, COMPENSATORY
(50) 1 (2%)
(49)
SADRENAL CORTEX HYPERPLASIA, FOCAL
(50) (49) 1 (2X)
STHYROID CYSTIC FOLLICLES
(50) 2 (4*)
(46) 1 (2X)
REPRODUCTIVE SYSTEM
XMAMMARY GLAND CYSTIC DUCTS
(50) (49) 4 (85O
ttUTERUS DECIDUAL ALTERATION, NOS
(50) (49) 1 (2X)
* NUMBER OF ANIMALS WITH TISSUE EXAMINED MICROSCOPICALLY x NUMBER OF ANIMALS NECROPSIED
HIGH DOSE
(48)
(48)
(48) 1 (2X)
(48)
(48)
(48)
(48)
(48)
(48) 6 (13X)
(47) 1 (2%)
32

TABLE 02. FEMALE MICE: NONNEOPLASTIC LESIONS (CONTINUED)
MATCHED CONTROL LOW DOSE HIGH DOSE
ttUTERUS/ENDOMETRIUM (50) (49) (47) EDEMA, NOS 1 (2X) INFLAMMATION, SUPPURATIVE 1 (2%) HYPERPLASIA, NOS 2 (4X) HYPERPLASIA, CYSTIC 42 (84%) 18 (37%) 14 (30%)
*OVARY (50) (49) (48) FOLLICULAR CYST, NOS 1 (2%) 1 (2%) INFLAMMATION, CHRONIC SUPPURATIV 1 (2%) HYPERPLASIA, STROMAL 1 (2%)
NERVOUS SYSTEM
NONE
SPECIAL SENSE ORGANS
XEYE (so) (49) (48) INFLAMMATION, OSSIFYING 1 (2%) PHTHISIS BULBI 1 (2%)
*HARDERIAN GLAND (50) (49) (48) FIBROSIS 1 (2%)
MUSCULOSKELETAL SYSTEM
NONE
BODY CAVITIES
NONE
ALL OTHER SYSTEMS
NONE
SPECIAL MORPHOLOGY SUMMARY
NO LESION REPORTED 1 13 10
# NUMBER OF ANIMALS WITH TISSUE EXAMINED MICROSCOPICALLY * NUMBER OF ANIMALS NECROPSIED
83
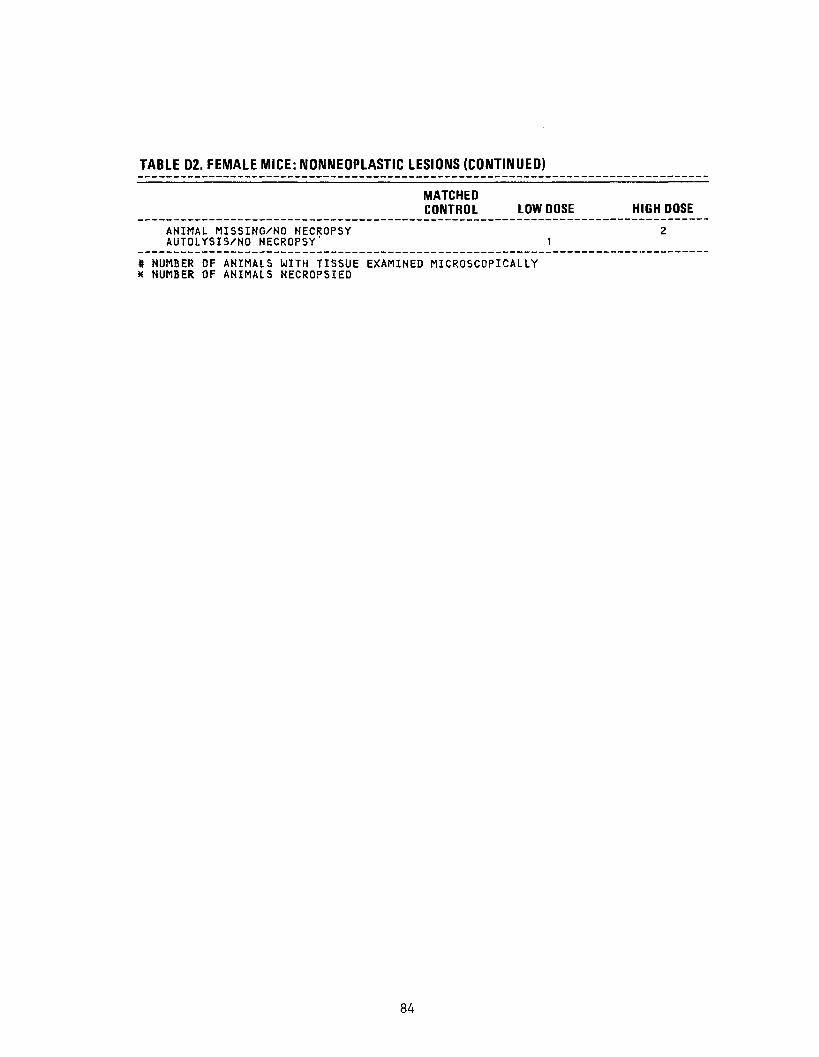
2
TABLE D2. FEMALE MICE: NONNEOPLASTIC LESIONS (CONTINUED)
MATCHED CONTROL LOW DOSE HIGH DOSE
ANIMAL MISSING/NO NECROPSYAUTOLYSIS/NO NECROPSY' 1
# NUMBER OF ANIMALS WITH TISSUE EXAMINED MICROSCOPICALLY X NUMBER OF ANIMALS NECROPSIED
84

APPENDIX E
ANALYSIS OF RESERPINE
85

86

APPENDIX E
Analysis of Reserpine Midwest Research Institute
A. Elemental Analysis
Element: C H N Theory: 65.11 6.62 4.60 Found: 65.22 6.48 4.54
65.01 6.57 4.59
B. Physical Properties
1. Melting point Literature: 264-267°C decomp. (Neuss et al., 1954).
Found: 260-267°C decomp.
7 f\2. Optical rotation Literature: [a]o = ~H5 for a
1.03% solution in chloroform (Neuss et al., 1954). 39
Found: [alD = -114.94 for a 1.03% solution in chloroform.
C. Thin-Layer Chromatography
Plate used: Silica gel F-254 Visualization: Ultraviolet, 254 and 365 nm and
ferricyamide-ferric chloride Reference Standard: Reserpine (USP Reference Standard)
An Rst =1.0 signifies Rf(sample) identical Rf values for
Rf (standard) test sample and standard,
System I: Chloroform:methanol (42:8) Results: Rf 0.89 (major), 0.80 (trace), 0.13 (trace)
Rst 1.00 (major), 0.90 (trace), 0.15 (trace)
System II: Benzene:diethylamine (95:5) Results: Rf 0.25 (major), 0.03 (trace), origin (trace)
Rst 1.00 (major), 0.12 (trace), origin (trace)
87

D. High-Pressure Liquid Chromatography
Instrument: ALC 202 with Solvent Programmer 660 Detector: U.V., 254 nm Column: Micropak Porasil, 30 cm x 4 mm ID Solvent: 5 to 25% isopropanol in chloroform Results: Major peak at 7.8 minutes (identical to USP
standard reserpine), with trace impurity (< 0.5% of major peak) at 11.6 minutes
E. Nonaqueous Titration of Secondary Amine Group with Perchloric Acid
101.0+0.7 (&)%
F. Visible Spectrometric Analysis (The Pharmacopeia, 1970) (Gary 118), compared with USP Reserpine reference standard
97.8+1.0 (&)% (USP limits: 97% to 101%)
G. Spectral Data
1. Infrared; The infrared absorption spectrum (Figure 5) was consistent with the spectrum given in the literature (Sadtler Standard Spectra).
2. Ultraviolet/ Visible; (Gary 118)
Determined Calculated from literature spectrum (Hayden et al., 1962)
«maxooc. = 1.013+0.004(i) x 104 €maxoot. = ~ 1.00 x 10⁴ 29D nm — , 2 9 5 nm , «max0,0 = 1.706+0.008(6) x 10 fmaxoc_ = ~ 1.64x 10
2oo nm — 267 nm No absorbance from 350 to 800 nm at
1 mg/ml
Solvent: CHC13 MeOH (3.6:1.4) Solvent:CHCl3 MeOH (3.6:1.4) (Neuss et al, 1954)
= 10,200
267 = 17'°°° <max = 61,700
Solvent: Methanol
88
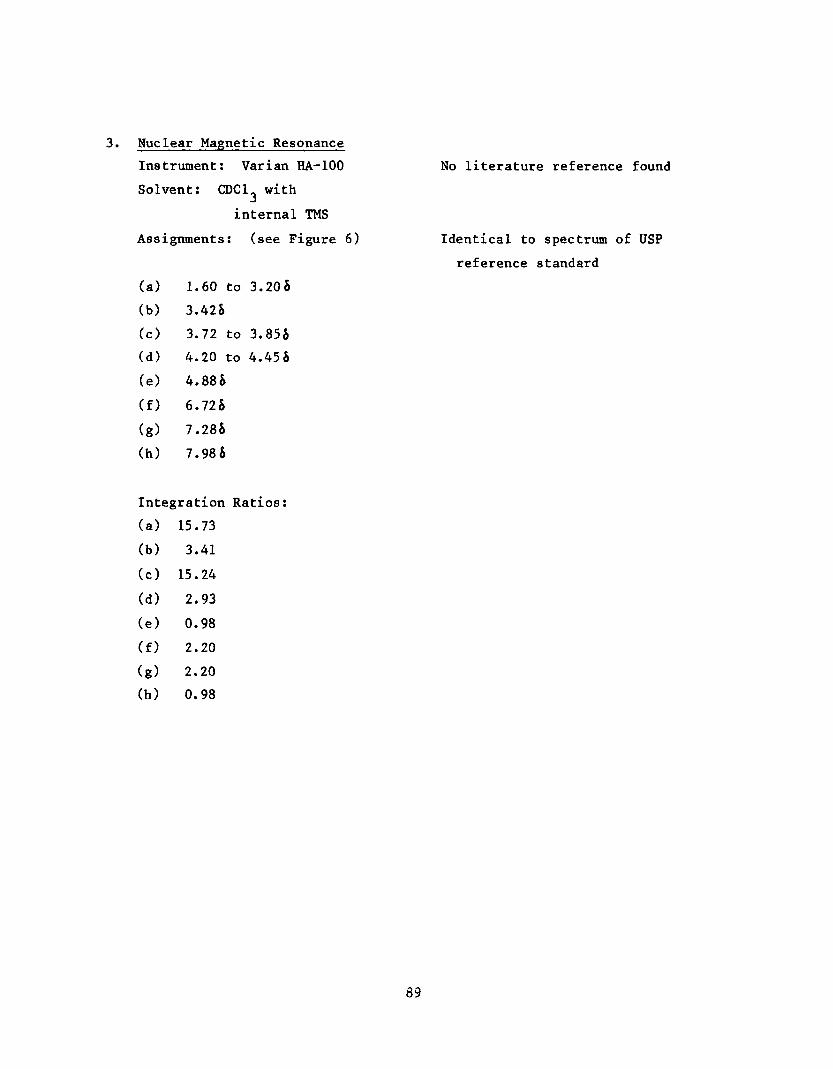
3. Nuclear Magnetic Resonance
Instrument: Varian HA-100 No literature reference found
Solvent: CDC1. with
internal IMS
Assignments: (see Figure 6) Identical to spectrum of USP
reference standard
(a) 1.60 to 3.20&
(b) 3.42&
(c) 3.72 to 3.S5&
(d) 4.20 to 4.4S&
(e) 4.S8&
(f ) 6.72&
(g) 7.2S&
(h) 7.986
Integration Ratios:
(a) 15.73
(b) 3.41
(c) 15.24
(d) 2.93
(e) 0.98
(f) 2.20
(g) 2.20
(h) 0.98
89

WAVIUMGtM M MfC*O*5
o
j ...j
. . .
*.
..
._
. --
:-.
FIGURE 5. INFRARED ABSORPTION SPECTRUM OF RESERPINE

I M»
MM**
Jfatfp'*
t
FIGURE 6. NUCLEAR MAGNETIC RESONANCE SPECTRUM OF RESERPINE

92
APPENDIX F
ANALYSES OF FORMULATED DIETS FOR
CONCENTRATIONS OF RESERPINE
93

94
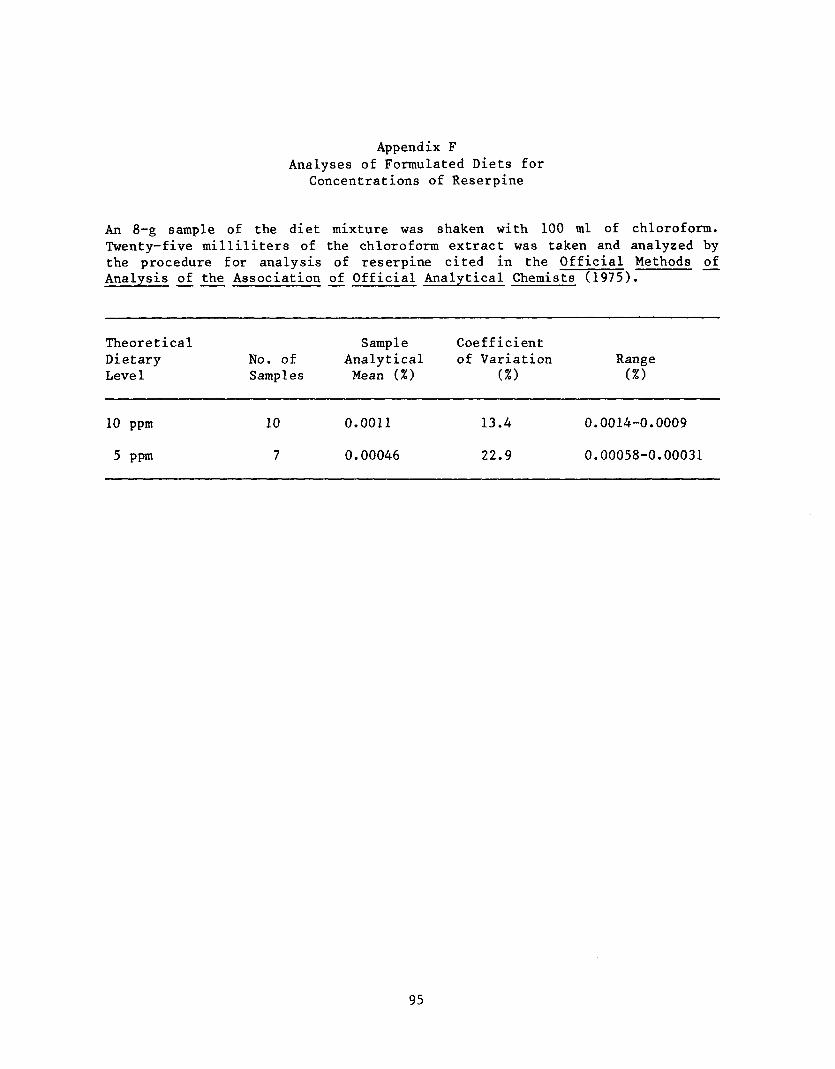
Appendix F Analyses of Formulated Diets for
Concentrations of Reserpine
An 8-g sample of the diet mixture was shaken with 100 ml of chloroform. Twenty-five milliliters of the chloroform extract was taken and analyzed by the procedure for analysis of reserpine cited in the Official Methods of Analysis £f_ the Association oj: Official Analytical Chemists (1975).
Theoretical Sample Coefficient Dietary No. of Analytical of Variation Range Level Samples Mean (%)
10 ppm 10 0.0011 13.4 0.0014-0.0009
5 ppm 1 0.00046 22.9 0.00058-0.00031
95

96

APPENDIX G
ANALYSES OF FORMULATED DIETS FOR STABILITY OF RESERPINE
97

98

Appendix G
Analyses of Formulated Diets for Stability of Reserpine
Theoretical Concentration Concentration Found Storage Mix Analysis Elapsed
(ppm) (ppm) Temperature Date Date Time
A.(a) 10.0 11.0 5°C 10-01-75 08-26-76 ~ 11 mos. 10.0 9.5 5°C 11-15-75 08-26-76 — 9.5 mos. 10.0 14.0 5°C 12-27-75 P8-26-76 — 8 mos. 10.0 10.4 5°C 02-24-76 08-26-76 — 6 mos . 10.0 8.6 5°C 03-21-76 08-26-76 — 5 mos . 10.0 5.6 5°C 05-11-76 08-26-76 ~ 3.5 mos . 10.0 8.5 5°C 06-24-76 08-26-76 •—• 2 mos. 10.0 9.5 5°C 07-21-76 11-30-76 — • 4 mos . 10.0 12.0 5°C 08-28-76 11-30-76 — 3 mos . 10.0 12.0 5°C 09-06-76 11-30-76 — 3 mos . 10.0 12.0 5°C 03-10-77 03-22-77 ~- 2 wka. 10.0 9.4 5°C 04-14-77 04-22-77 — 1 wk. 10.0 12.1 5°C 06-07-77 06-28-77 3 wks.
B.(b) 10.0 13.0 22°C 09-15-77 09-21-77 -~ 1 wk. 10.0 10.0 22°C 09-15-77 09-21-77 — 1 wk. 10.0 12.0 22°C 09-15-77 09-21-77 — 1 wk.
C.(c) 5.0 4.7 5°C 10-01-75 08-26-76 ~ 11 mos. 5.0 3.5 5°C 11-15-75 08-26-76 ~ 9.5 mos . 5.0 5.6 5°C 12-27-75 08-26-76 ~ 8 mos . 5.0 3.1 5°C 02-24-76 08-26-76 ~~ 6 mos . 5.0 3.7 5°C 04-29-76 08-26-76 ~ 4 mos . 5.0 4.3 5°C 10-18-76 11-30-76 ~ 1.5 mos . 5.0 5.5 5°C 02-24-77 03-22-77 ~ 1 mos . 5.0 5.8 5°C 06-07-77 06-28-77 3 wks.
D,(d) 5.0 5.7 22°C 09-15-77 09-21-77 — 1 wk. 5.0 5.3 22°C 09-15-77 09-21-77 ~ 1 wk. 5.0 7.2 22°C 09-15-77 09-21-77 ~ 1 wk.
The mean + standard deviation is 10.4+_2 The mean +_ standard deviation is 11.7+1 The mean +_ standard deviation is 4.5+1 The mean + standard deviation is 6.1+ .8
99

100

Appendix H
ANALYSES OF THE INCIDENCE OF ADRENAL LESIONS IN MALE RATS AS REPORTED BY CAPEN, C. C., HOLLAND, J. M.,
and NIELSON, S. W.
101

102

Appendix H
Analyses of the Incidence of Adrenal Lesions in Male Rats as Reported by Capen, C. C., Holland, J. M., and Nielson, S. W. (a)
Matched Low Topography: Morphology Control Dose
Adrenal Medulla: Hyperplasia (Nodular) (b) 7/48 (15) 10/49 (20)
P Values (c,d) N.S. N.S.
Relative Risk (Matched Control) (e) 1.399 Lower Limit 0.526 Upper Limit 3.979
Adrenal: Pheochromocytoma or Pheochromocytoma, Malignant (b) 1/48 (2) 9/49 (18)
P Values (c,d) P=0.001 P=0.008
Relative Risk (Matched Control) (e) 8.816 Lower Limit 1.299 Upper Limit 376.985
Adrenal Medulla: Neuroblastoma (b) 0/48 (0) 1/49 (2)
P Values (c,d) N.S. N.S.
Relative Risk (Matched Control) (e) Infinite Lower Limit 0.053 Upper Limit Infinite
Adrenal: Hyperplasia (Nodular) or Pheochromocytoma or Pheochromocytoma, Malignant (b) 8/48 (17) 20/49 (41)
P Values (c,d) P=0.001 P=0.008
Relative Risk (Matched Control) (e) 2.449 Lower Limit 1.158 Upper Limit 5.737
103
High Dose
10/48 (21)
N.S.
1.429 0.537 4.056
13/49 (27)
P less than 0.001
13.000 2.088
536.977
0/48 (0)
N.S.
—
23/48' (49)
P = 0.001
2.875 1.401 6.549

Appendix H (continued)
Analyses of the Incidence of Adrenal Lesions in Male Rats as Reported by Capen, C. C., Holland, J. M., and Nielson, S. W. (a)
(a) Dosed groups received 5 or 10 ppm. (b) Number of tumor-bearing animals/number of animals examined at site (percent). (c) Beneath the incidence of tumors in the control group is the probability level for the
Cochran-Armitage test when P is less than 0.05; otherwise, not significant (N.S.) is indicated. Beneath the incidence of tumors in a dosed group is the probability level for the Fisher exact test for the comparison of that dosed group with the matched-control group when P is less than 0.05; otherwise, not significant (N.S.) is indicated.
(d) A negative trend (N) indicates a lower incidence in a dosed group than in a control group.
(e) The 95% confidence interval of the relative risk between each dosed group and the control group.
104

Review of the Bioassay of Reserpine* for Carcinogenic!ty by the Data Evaluation/Risk Assessment Subgroup
of the Clearinghouse on Environmental Carcinogens
May 1, 1979
The Clearinghouse on Environmental Carcinogens was established In May, 1976, in compliance with DHEW Committee Regulations and the Provisions of the Federal Advisory Committee Act. The purpose of the Clearinghouse is to advise the Director of the National Cancer Institute of the Institute's bioassay program to identify and evaluate chemical carcinogens in the environment to which humans may be exposed. The members of the Clearinghouse have been drawn from academia, industry, organized labor, public interest groups, and State health officials. Members have been selected on the basis of their experience in carcinogenesis or related fields and, collectively, provide expertise in chemistry, biochemistry, biostatistics, toxicology, pathology, and epidemiology. Representatives of various Governmental agencies participate as ad hoc members. The Data Evaluation/Risk Assessment Subgroup of the Clearinghouse is charged with the responsibility of providing a peer review of reports prepared on NCI-sponsored bioassays of chemicals studied for carcinogenic!ty. It is in this context that the below critique is given on the bioassay of Reserpine.
A representative of CIBA-GEIGY presented a public statement regarding the report on the bioassay study of Reserpine. He said that the conclusion of an increased tumor formation in treated male rats and treated mice of both sexes were not substantiated by data in the tumor summary tables. He commented on several specific tumor incidences and types, which he regarded as inconsistencies or omissions in the report. A pathologist, representing CIBA-GEIGY, noted a number of discrepancies between his pathologic findings and those given in the report. He particularly challenged the accuracy and completeness of the findings with respect to rat adrenal tumors; the CIBA-GEIGY analysis indicating no significant increase of primary medullary tumors. In regard to seminal vesicle tumors in mice, he explained that the tumors were probably metastatic in origin and not Reserpine-related. Finally, he said that the mammary gland tumors in dosed female mice were not associated with treatment. In continuing the presentation, the company's original spokesman stated that CIBA-GEIGY did not agree that the study would indicate that Reserpine posed a possible risk to human beings. He cited an 1977 FDA Toxicology Advisory Committee report on anti-psychotic drugs in support of their contention that potential risk of mammary cancer cannot be extrapolated from rodents to man. He recommended that a panel of distinguished pathologlsts be commissioned to review the discrepancies between the NCI and CIBA-GEIGY findings.
105
Based on the information available in the NCI bioassay report, the primary reviewer agreed with the conclusion that Reserpine, under the conditions of test, produced an increased incidence of tumors at selected sites in treated rats and mice. She summarized the experimental design and said that she considered the study well conducted. Despite the difficulty in discerning between benign and malignant pheochromocytomas, there appeared to be a real increase of this tumor type in treated male rats. The primary reviewer wondered about the relationship between the inflammatory lesions, hyperplasia, and undifferentiated carcinomas of the seminal vesicles observed in treated male mice.
The secondary reviewer agreed with the previous assessment of the study. He suggested that a pathology review would be appropriate, although it should be independent of the Subgroup's consideration of the bioassay report. Findings of the pathology review could be appended later to the bioassay report or sent to the proper regulatory agency. He added that the pathology review called for by CIBA-GEIGY should be paid for by industry.
Based on the report, the third reviewer said that he supported the NCI's staff conclusion on the carcinogenic!ty of the drug. He also agreed with the suggestion regarding the pathology review. He suggested that an analysis of the conflicting epidemiologic studies, and perhaps a new one, would be advisable.
In regard to the seminal vesicles tumors, a staff pathologist said that the inflammatory lesions and epithelial hyperplasia in treated male mice made him more confident that the tumors were primary in origin. He did not recall seeing any of these tumors in several thousand mice which he personally had examined. Another staff pathologist showed and described photomicrographs of lesions observed in the seminal vesicles. He said that, to his knowledge, there were no other tumors in the mice that would suggest the tumors in the seminal vesicles were metastatic in origin. He emphasized the extremely rare nature of the tumor.
One Subgroup member questioned if the study was proper for testing a substance that may exert its effect through hormonal mechanisms. Another member speculated that Reserpine may be an endocrine-affecting substance. Until the mechanism of action of Reserpine is known, a third member argued that the drug should be regarded as posing a potential risk to humans, especially since it is carcinogenic in two species.
In commenting on the CIBA-GEIGY presentation, one Subgroup member said that the company's assertion concerning no tumor increase was misleading. CIBA-GEIGY referred to total tumors, whereas the appropriate method for comparison is on a site-by-site basis. He also dismissed the significance of CIBA-GEIGY's allusions to a reduced tumor incidence at certain sites among treated animals. The Subgroup member objected to the recommendation that another group of pathologists review areas
106

of disagreement. He considered such a review unnecessary and more appropriate as part of the regulatory process.
A discussion ensued as to the need to retest Reserpine, possibly using an experimental design more appropriate for assessing endocrine-related tumors. One Subgroup member thought another study would be proper because of the therapeutic value of the drug and the number of people exposed. Another Subgroup member said that any new study should not be the NCI's responsibility. It was recommended that additional studies should be paid for by industry.
After some discussion regarding the framing of a motion, it was moved that the report on the bioassay of Reserpine be accepted as written. The motion was seconded and approved unanimously. As a second motion, it was moved that areas of pathology concern be reviewed by an independent group of pathologists. This motion was seconded and approved by a vote of three to one.
Clearinghouse Members Present:
Arnold L. Brown (Chairman), University of Wisconsin Medical School David B. Clayson, University of Nebraska Medical Center Joseph Highland, Environmental Defense Fund W i l l i a m Lijinsky, Frederick Cancer Research Center Sheldon Samuels, AFL-CIO Michael Shimkin, University of California at San Diego Louise Strong, University of Texas Health Sciences Center Kenneth Wilcox, Michigan State Health Department
* Subsequent to this review, changes may have been made in the bioassay report either as a result of the review or for other reasons, Thus, certain comments and criticisms reflected in the review may no longer be applicable.
ftU.S. GOVERNMENT PRINTING OFFICE: 1982-381-132:718
107


AC/National Cancer Institute
NIH Publication No. 80-1749 Reprinted November 1982