bio world congress - 2014 gomes... · uranium elemental carbon ... • trends in demand • degree,...
TRANSCRIPT

BIO World Congress - 2014

General Information

BNDES Highlights
Founded on June 20th, 1952.
100% state-owned company under private law.
Key instrument for implementation of Federal Government’s
industrial and infrastructure policies.
Main provider of long-term financing in Brazil.
Emphasis on financing investment projects.
Support to micro, small and medium-sized companies.
Support to Export and Internationalization of Brazilian companies.

InfrastructureInfrastructure
Heavy Industry – Consumer GoodsHeavy Industry – Consumer Goods
Technological DevelopmentTechnological Development
Time Line
Imports SubstitutionImports Substitution
EnergyEnergy
AgribusinessAgribusiness
ExportsExports
Privatization ProgramPrivatization Program
Urban and Social DevelopmentUrban and Social Development
Social InclusionSocial Inclusion
InnovationInnovation
SustainabilitySustainability
Small BusinessSmall Business
50’s 60’s 70’s 80’s 90’s 00’s Today

BNDES Uruguay Montevideo(2009)
BNDES Limited London (UK) (2009)
Rio de Janeiro
Brasília
Recife
São Paulo
2.872 employees February, 2014
BNDES - Headquarters & Offices
Subsidiary
BNDES Africa Johannesburg (2013)

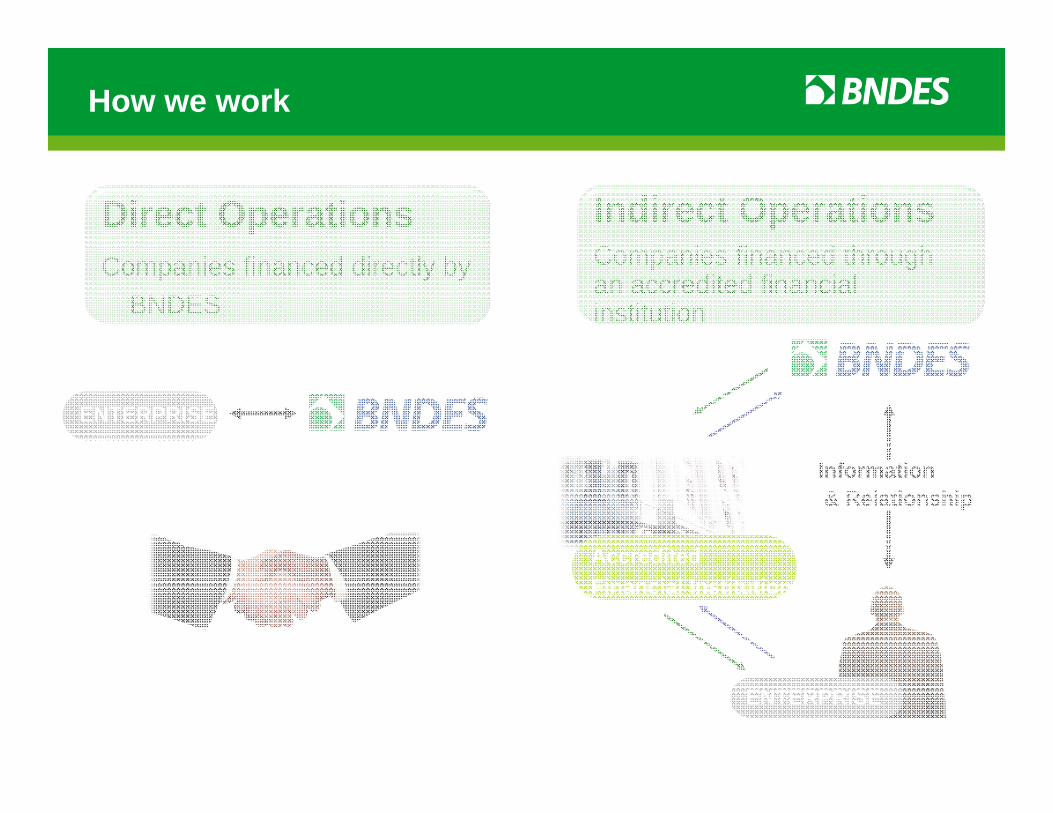
How we work
How we work
ENTERPRISE
AccreditedFinancial Institution
ENTERPRISE
Information& Relationship
Direct OperationsCompanies financed directly by
BNDES
Indirect OperationsCompanies financed through an accredited financial institution

Direct Operations
Power Plants Oil Rigs
ArenasIndustries
Examples:

What does BNDES support?
Innovation Industrial Projects Infra-structure Projects
Agriculture Equipments Exports Capital Market Operations
Equipment, and Services

Capital Market

Capital Market
The BNDESPAR plays a key role owing to:
Its commitment to long-term projects.
The size and quality of its portfolio.
Its performance in moments of higher volatility in the market.
Its capacity to attract other investors.
Its focus on corporate governance.
Its capacity to invest in all market sectors.

Capital Market
CriatecFundCriatecFund
Venture Capital FundsVenture Capital Funds
Private Equity FundsPrivate Equity Funds
Initial Public Offerings (IPO)Initial Public Offerings (IPO)
Public OfferingsPublic Offerings
Capital Markets

General Indicators

3,9 4,0 3,9
5,96,4
4,2
6,6
8,3
11,3
6,7
5,5
7,1
2002 2003 2004 2005 2006 2007 2008 2009 2010 2011 2012 2013
Disbursements to Finance Exports
US$ billion Converted to US dollar on the disbursement dates

R$ bilhões
156,1
43,547,1
168,4
137,4 139,7
52,364,9 92,2
190,4
17,328,5
16,2
41,165,5
9,919,6
146,4
2005 2006 2007 2008 2009 2010 2011 2012 2013
Desembolsos BNDES Emissões na Bovespa
16 Firms48%*
20 Firms(includes Petrobras R$120 bi share offering)26%*
(*) Foreign investors participation
In R$ Billion
BNDES vs. Capital Market
75 Firms75%*

Chemical Industry
Diversification Study

17
Brazilian Chemical Industry ‐ 2013
Imports ExportsUS$ billions FOB
Trade balance ‐ Chemicals
Source: MDIC/Secex

• Technical Sector Agenda – Products from renewable sources
• Structured initiatives - Capacity building in human capital
• Infrastructure improvements
• Regulations for chemicals used for crop protection
• Chemical industry diversification study on Diversification of the Chemical Industry
• Incentivize the use of locally available raw materials
• Incentives for investment
• Incentives for innovation
• Policies to encourage the use of natural gas as a feedstock
STRATEGIC AGENDA(SHORT TERM)
STRUCTURAL AGENDA (MEDIUM TERM)
The Study is part of the “Plano Brasil Maior”, that has additional short and long term initiatives
• Identify and analyze opportunities for diversifying the Brazilian chemical industry, including specialties, value added products and new technologies- Commodity thermoplastic resins (PP, PE, PVC and PET), pharmaceuticals (drugs, vaccines, hormones and active ingredients) and fertilizers (N, P and K) are not part of the primary focus of the study
• Suggest instruments and actions as part of an industrial policy for the Brazilian chemical sector.- With an integrated view of the short, medium and long term
19
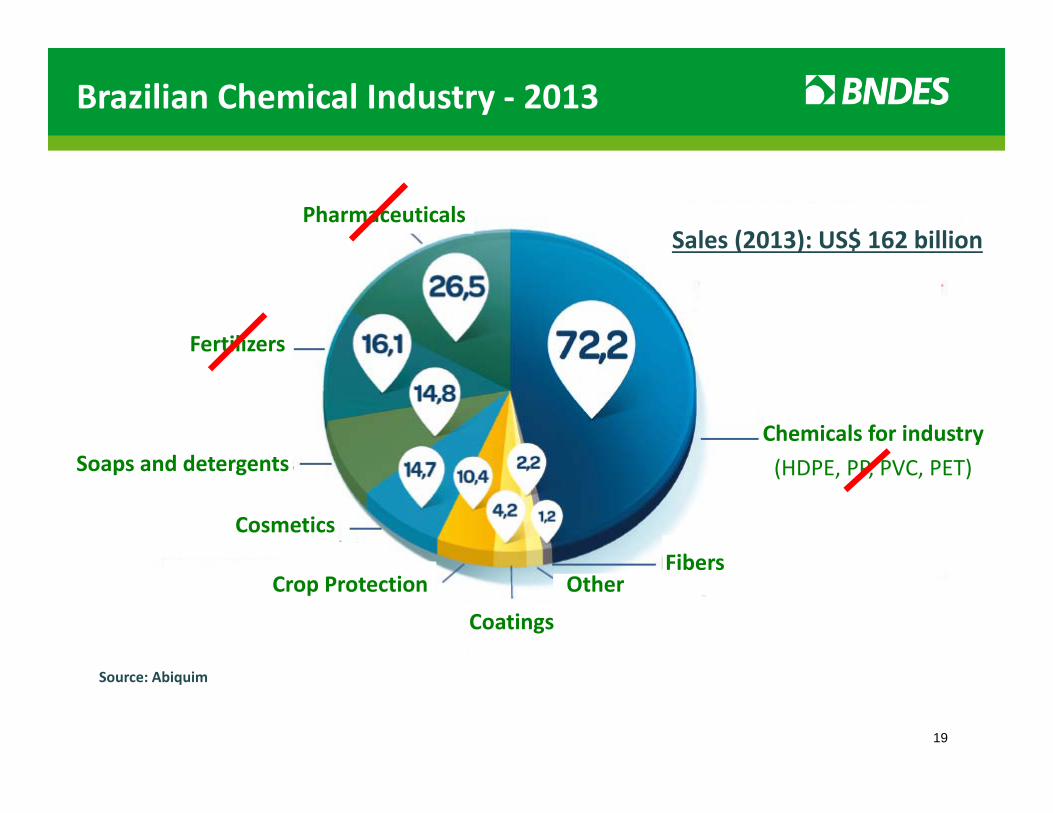
Brazilian Chemical Industry ‐ 2013
Pharmaceuticals
Fertilizers
Soaps and detergents
Cosmetics
Crop Protection
Coatings
Chemicals for industry(HDPE, PP, PVC, PET)
FibersOtheOther
Sales (2013): US$ 162 billion
Source: Abiquim

Project Schedule
Report 722/aug/14
Business model design
Financial and economic analysis
Initial prioritiza‐tionof segments
Mapping and Segmenta‐tion
Research on selected segments
Priortization and validation
Mapping of existing dev. policies and
identification of int’l best practice
S2
S1
S4
IP
1/jul/13
9/sep/13
Design of development policies
May Jun Jul Aug Sep Oct Nov Dec Jan Feb Mar Apr May Jun Jul Aug
IP
Detailed evaluation of opportunitiesScenario planning and development policies
Initial prioritization and segmentation of chemicals
S Seminars IPIndustry Panels
Final prioritization of opportuni-ties
S3
Report 53/jun/14
Report 428/apr/14
Report 3fev/14
Report 66/aug/14
Individual interveiws
22/may/14Report 3fev/14

64 segments and a business perspective
Tarderiv.
Organics
Acrylicacid anddeivati
Metacrylicacid andderiv.
Fattyacids and
deriv.Aromatics
Butadiene, isopreneandderiv.
Celluloseand
deriv.
Waxes and
paraffins
Copolymers
Cumeneand
deriv.
Elastomers
Ethylenederiv.
Methanederiv.
Ethyleneoxide and
deriv..
Propenederiv.
Vinylderiv.Lubricants
Fine chemicals intermediaries
Polymers intermediaries
Special Polymers
Aramids Carbonfibers
Polycar-bonates Polycetals
Specialpolyamides
High tenacitypolyester
Polyetherpolyols andpolyurethane
Politetra-metileno éter glicol
Resinas epóxidas
Polibutileneterephthalate
Catalysts and additives
Food additives Constructionchemicals
Leatherchemicals
Mining chemicals
O&G Chemicals
Polymersadditives Catalysts Flavor and
fragrances
Dyes, pigments andcoatings
Synteticdyes
Printinginks Coating
Soaps, cleaning andcosmetics
Cleaningproducts Cosmetics
Other
Explo-sives
Refrigerants Reagents
Glues andsealantsGlues,
adhesivesand
sealants
Pesticides
Pesticides
Photographics
Photographics
Chain
Inorganics
Inorganicacids
Aluminum deriv.
Boronderiv.
Chlorineand
Alkalis
Cobaltderiv.
Phosphorus andderiv.
Industrial gases
Iodineand
deriv.
Radioactivemat.
Nickelderiv.
Titaniumdioxideand
deriv.
Niobiumderiv.
Sulfphates Rare earthderiv. Uranium
Elemental carbonderiv.
Siliconderiv.
Note: Pharmaceuticals, fertilizers and commodity plastics resines (HDPE, PP, PVC and PET are out of the scope of the study.
Industrial intermediaries
Market

Market and production factors guided the selection of segments to deep dive
A multi‐criteria analysis tool was used to ensure the robustness of the results
• Imports +Exports (US$)- Average 08-12
• Production (US$)- Average 07-11
• CAGR imports + exports (%)
• Unit Price (US$/kg)-Average 08-12
• Trends in Demand
• Degree, current and future, of availability and cost competitiveness of raw materials
• Degree of technological dominion and the potential to develop or purchase it
• Availability of qualified labor
• Quality of available infrastructure
• Regulatory restrictions
• Necessity for investment
Dem
and
Con
ditio
nsFa
ctor
s of
Pro
duct
ion
Infra-structure
CRITERIA
• Size
Capital
Legal Environ.Labor
• Growth
• Value‐added
• Technology
• Raw Materials
INDICATORS SOURCEQua
ntita
tive
Qua
litative
• Trends
• Aliceweb
• Consortium
• Validation from the school of chemistry
• Global Insight
• Macro tendencies
• Aliceweb
• Associations
• PIA

23
Step 3 ‐ Segments Prioritized
Crop ProtectionLubricants Oleochemicals Construction chemicals Chemicals for E & P Chemicals for mining
Special polyamides High tenacity polyesterFragrances and flavors Food additives Cellulose derivatives Cosmetics
Methacrylic acid and derivatives Industrial additives Catalysts Chlorine and alkalies Glues, Adhesives and Sealants Synthetic organic dyes
Methane derivativesElastomers Propylene derivativesTitanium oxide and derivatives Cleaning products and intermediates Laboratory reagents Coatings and related products
Aromatics Leather chemicalsButadiene and derivatives Polyurethanes Silicon derivatives Carbon fibers Surfactants
Hig
h Pr
iorit
yM
edia
nPr
iorit
y

Selected segments represent ~70% of imports and exports
Média das importações e exportações por segmentos(US$B, 2008-2012, exceto produtos fora do escopo)
Fonte: AliceWeb, Receita Federal, Análise Bain e Gas Energy
Alta prioridade Média prioridade Baixa prioridade
Legenda

Growth is backed up by the strong demand for goodsPerspective is positive
Note: Only the top 10 markets are represented in 2017 (estimated). These countries should represent ~ 64% of the world market in 2017 Source: Euromonitor; Bain / Gas Energy Analysis
The cosmetics and personal care industries, by country(US$B)
Forecast
Cosmetics

Cleaning products: perspective is also positive
Note: For domestic useSource: Abipla Annual Report, 2013
Cleaning products

Pre-salt will generate demand for biodegradable drillingfluids; Renewables have advantages
Source: Bain / Gas Energy Analysis
Demanda de químicos para E&P no Brasil(US$B)
Fonte: Freedonia; Análise Bain / Gas Energy
Projeção
EstimulaçãoCimentaçãoCompletaçãoProduçãoPerfuração
18% 18%
• Drilling fluids represented 72% of Brazilian demand for chemicals for E&P in 2011
• The base, vehicle where the additives are submerged, represent 80% to 90% of the cost of these fluids
• IBAMA e a Petrobras signed an agreement setting minimum standards for the toxicity biodegradability and toxicity of drilling fluids: bases (currently made from tradi onal paraffin) should be replaced, as of 2015, by bases made from oleochemical n‐paraffins, olefins or fatty esters
E&P chemicals

28
Preliminary analysis
SegmentBrazil Market ($ million) % Brazil
Brazil CAGR (07‐12)
Imports ($million)
Exports ($million)
Balance ($ milion)
Crop Protection 9.700 20,5% 16,1% 5.400 500 (4.900)Lubricants 4.500 2,6% 2,6% 1.120 210 (910)Oleochemicals 7.700 4,6% 4,0% 515 1.800 1.285O&G Chemicals 600 3,3% 23,0% 84 9 (75)Food additives (animal) 690 10,8% 15,0%Flavours and fragrances 1.200 4,6% 303 452 149Cosmetics 41.800 9,7% 12,4% 830 580 (250)Carbon Fibers 47 5,2% 40,0% 97 0 (97)

29
Preliminary analysis
Segment Some opportunities Crop Protection All segments
Lubricants Re-refining and bio-lubricants
Oleochemicals Soy, palm, palm oil, sugar and tallow derivatives
O&G Chemicals Demulsifiers and corrosion inhibitors, Petrobras pre salt projects
Food additives (animal) Aminoacids: Lysine
Flavours and fragrances Value added natural essences
Cosmetics Bio based products, cluster strenghtening, aerosol deodorants
Carbon Fibers Wind blades

*Sum of the financial value of imports and exports (average (2008‐2012)**Average value of imports and exports in 2012 Source: AliceWeb, Bain / Gas Energy Analysis
PRELIMINARY
Some clusters to be strenghtened
New technologies (bio and nano)
will be analyzed horizontally
Oleochemicals
Consumer Goods
Surfactants
Construction
Crop Protection
Aromatics
C1,C2,C3
C4Distance between bubbles:“economic distance” of segments
Size of the bubble: Imports + Exports (US$300M)
Potential clusters

Final Remarks
•The government is investing in creating a stable environment for the chemical industry and in other related infrastructure
•Key segments of the chemical industry with strong fundamentals were selected for a deep dive: Oleochemicals, Surfactants, E&P Chemicals and Cosmetics are some examples that can be produced from Renewable sources, through Biotechnology
•Cosmetics and cleaning products in Brazil are growing above global rates and the opportunity for E&P chemicals is huge. Oleochemicals’ demand perspectives are strong: imports grew 12%p.a. from 2008 to 2012 MARKET OPPORTUNITY
•Clusters that are able to integrate the value chain, from renewable raw materials to valued added downstream industries, would benefit from scale gains and would increase the robustness of the projects
•Detailed information about the study can be obtained at BNDES website
