bio 2010 field study techniques tanbc
DESCRIPTION
Field Study Techniques by Ms TanTRANSCRIPT

rgsbio09
10 Field Study Techniques
Introduction
General Background:
Within an ecosystem the organisms are rarely distributed evenly and therefore it can be very difficult to
count their numbers accurately. Scientists therefore need to adopt an appropriate sampling technique to
achieve a realistic estimate of population numbers.
Sampling Methods:
Quadrat sampling
A quadrat is a sampling unit of known area and are usually square frames. They are of various sizes and
the size depends very much on the particular habitat and type of organisms likely to be encountered.
Plant quadrats for use on grasslands are usually 0.5m x 0.5m but larger scale types are employed for
larger ecosystems.
There are two types of quadrats:
i. point-quadrats (usually ten pins in a metal frame)
Figure 1 : Point-quadrat frame typically used to estimate the percentage cover of species in a grassland
or in this case in the salt marsh. The percentage cover/abundance is calculated as the number of pins that
touch a particular species out of a total of ten pins. E.g. if species X touches 3 pins out of the ten pins,
percentage cover is 30%.
page 1 / 10
rgsbio09
10 Field Study Techniques
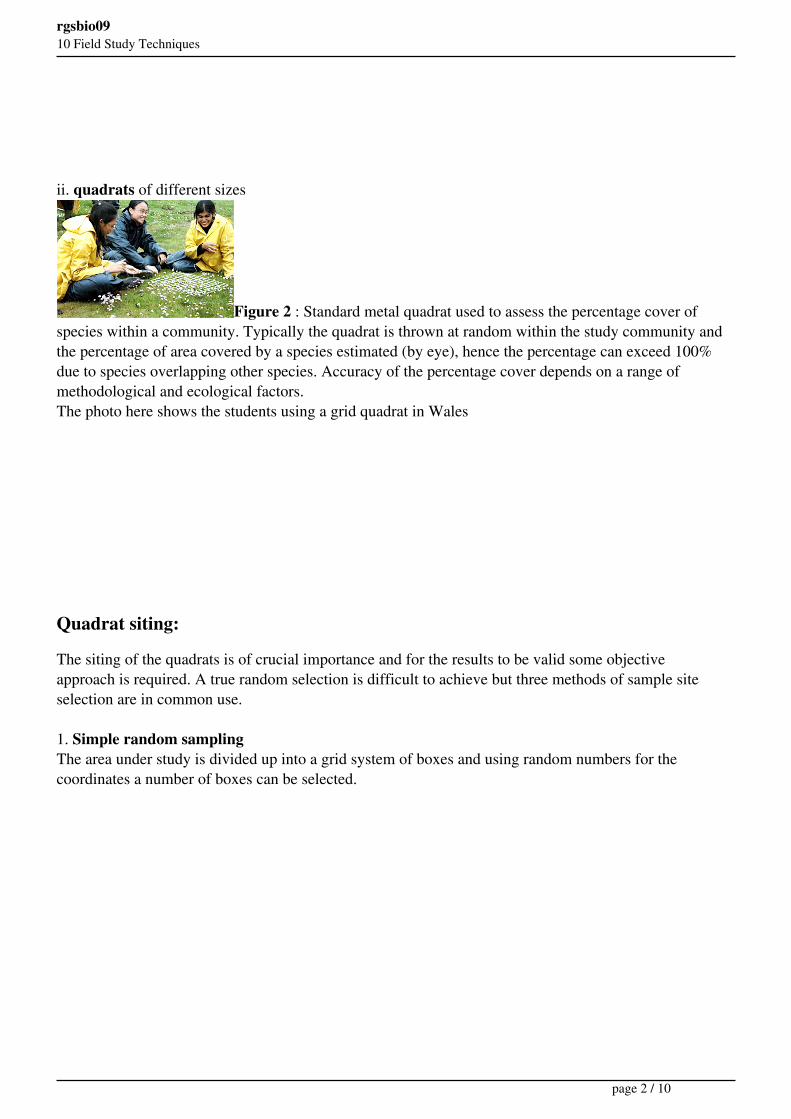
ii. quadrats of different sizes
Figure 2 : Standard metal quadrat used to assess the percentage cover of
species within a community. Typically the quadrat is thrown at random within the study community and
the percentage of area covered by a species estimated (by eye), hence the percentage can exceed 100%
due to species overlapping other species. Accuracy of the percentage cover depends on a range of
methodological and ecological factors.
The photo here shows the students using a grid quadrat in Wales
Quadrat siting:
The siting of the quadrats is of crucial importance and for the results to be valid some objective
approach is required. A true random selection is difficult to achieve but three methods of sample site
selection are in common use.
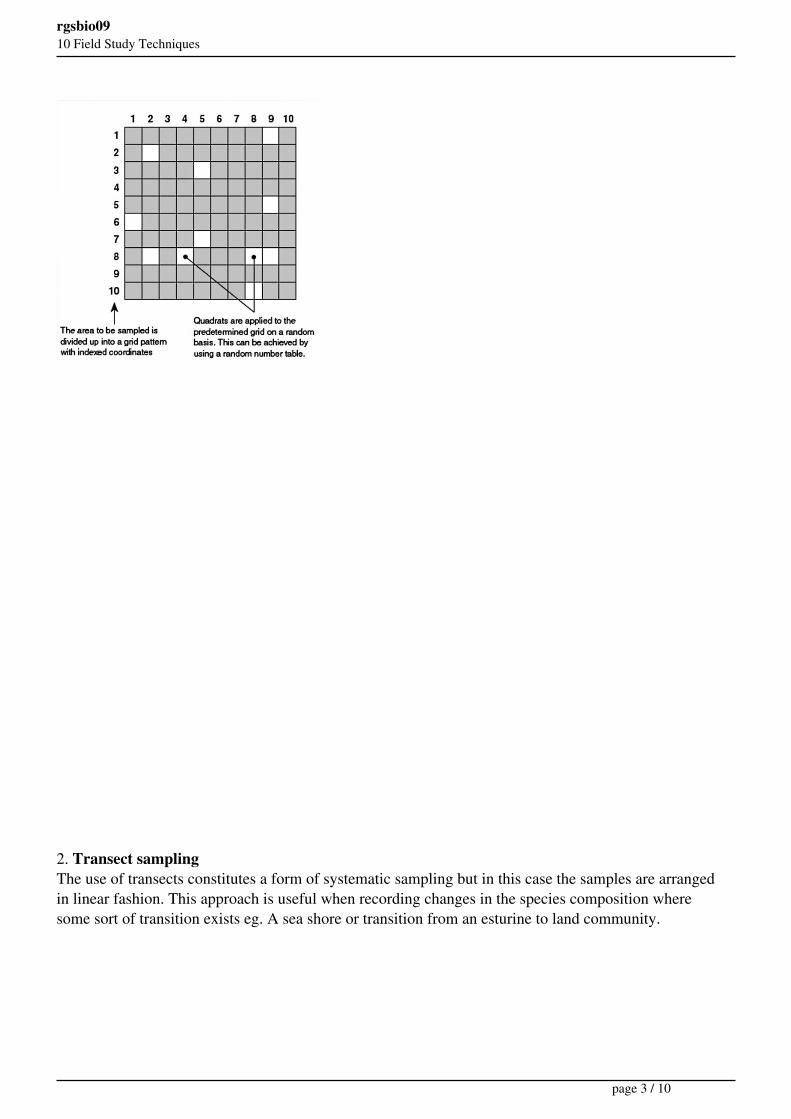
1. Simple random sampling
The area under study is divided up into a grid system of boxes and using random numbers for the
coordinates a number of boxes can be selected.
page 2 / 10
rgsbio09
10 Field Study Techniques
2. Transect sampling
The use of transects constitutes a form of systematic sampling but in this case the samples are arranged
in linear fashion. This approach is useful when recording changes in the species composition where
some sort of transition exists eg. A sea shore or transition from an esturine to land community.
page 3 / 10
rgsbio09
10 Field Study Techniques
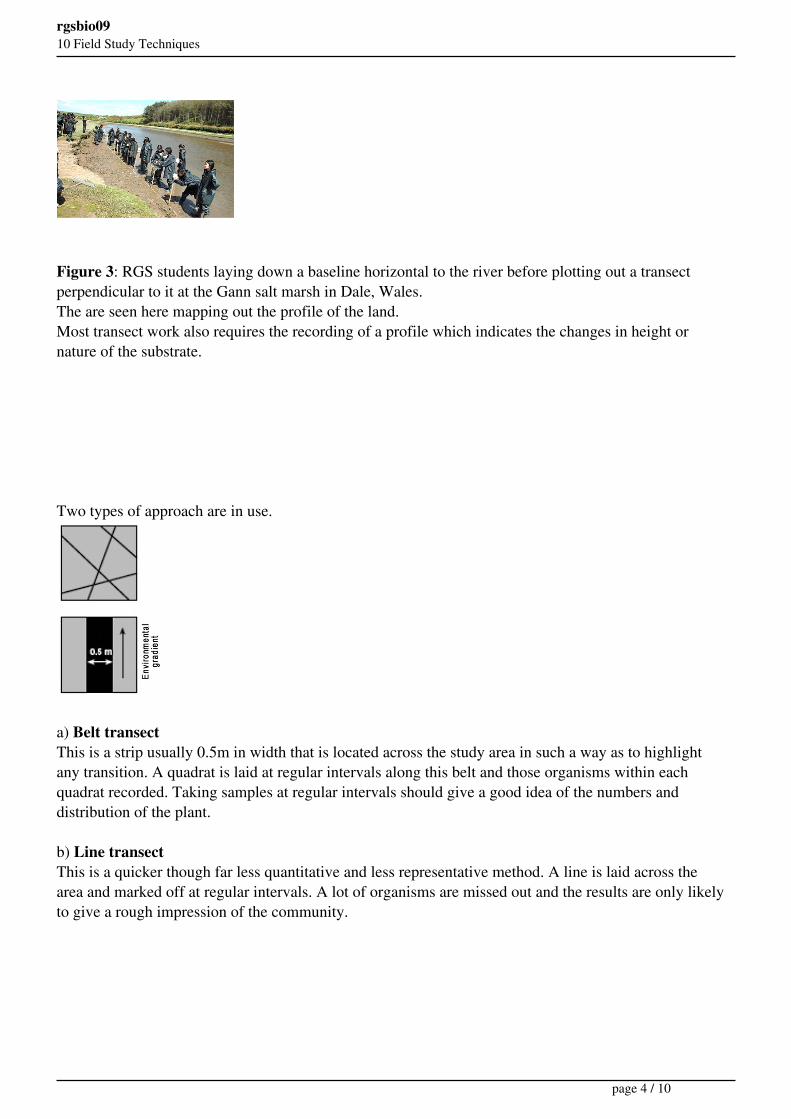
Figure 3: RGS students laying down a baseline horizontal to the river before plotting out a transect
perpendicular to it at the Gann salt marsh in Dale, Wales.
The are seen here mapping out the profile of the land.
Most transect work also requires the recording of a profile which indicates the changes in height or
nature of the substrate.
Two types of approach are in use.
a) Belt transect
This is a strip usually 0.5m in width that is located across the study area in such a way as to highlight
any transition. A quadrat is laid at regular intervals along this belt and those organisms within each
quadrat recorded. Taking samples at regular intervals should give a good idea of the numbers and
distribution of the plant.
b) Line transect
This is a quicker though far less quantitative and less representative method. A line is laid across the
area and marked off at regular intervals. A lot of organisms are missed out and the results are only likely
to give a rough impression of the community.
page 4 / 10

rgsbio09
10 Field Study Techniques
In summary:
WHAT CAN WE MEASURE?
Measurements of abundance:
Quadrats are useful when attempting to determine the species composition of an area and also when
assessing the abundance of those species in the study area. The four measurements of abundance most
often used are;
1. Cover - The percentage of ground covered by that species in the sample zone.
2. Frequency - The number or percentage of sampling points in which that species occurs.
3. Density - The mean number of individuals per unit area
4. Biomass - The measure of the weight of that species in the sample zone.
1. Cover
1a. Abundance scale (Qualitative)
A variety of methods are available to an ecologist to assess the abundance of plant species, these can be
broadly divided into qualitative and quantitative techniques. Qualitative techniques are infrequently
used, as the technique is descriptive and comparisons between population, communities or between
studies are not possible. The most commonly used qualitative method in plant abundance studies is
ACFOR, where species are simply listed into one of five types of abundance;
page 5 / 10
rgsbio09
10 Field Study Techniques
Dominant (D)
Abundant (A)
Common (C)
Frequent (F)
Occasional (O)
Rare (R)
Wherever possible you should use a quantitative method for assessing plant abundance. Different
quantitative techniques in estimating plant abundance can be used.
1b. Percentage abundance (Quantitative)
The most common method for assessing plant abundance is the percentage of ground covered by the
species being investigated. Rather than simply quoting the percentage cover of a species, species can be
grouped into categories or scales of abundance. This, in part, overcomes the problem of accuracy that is
especially important when combining data collected by more than one observer when individual biases
may occur in estimating percentage cover. DACFOR Scale is a common type of scale that is widely
used across Europe.
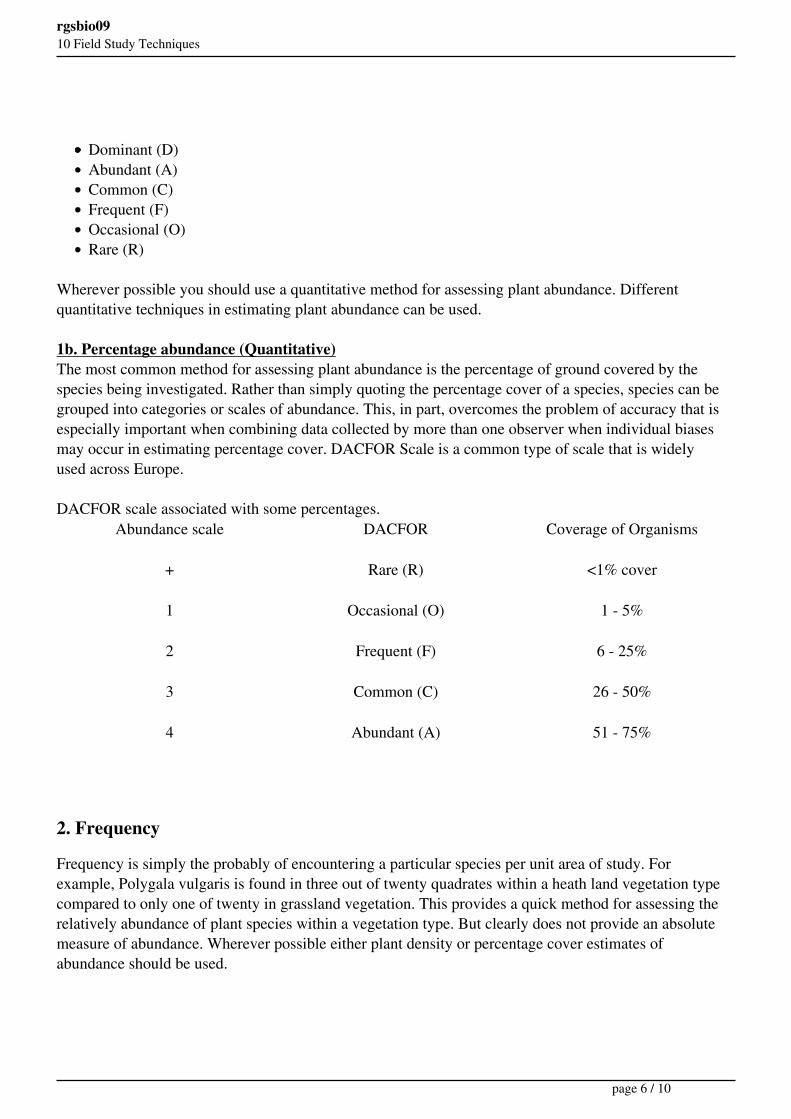
DACFOR scale associated with some percentages.
Abundance scale DACFOR Coverage of Organisms
+ Rare (R) <1% cover
1 Occasional (O) 1 - 5%
2 Frequent (F) 6 - 25%
3 Common (C) 26 - 50%
4 Abundant (A) 51 - 75%
2. Frequency
Frequency is simply the probably of encountering a particular species per unit area of study. For
example, Polygala vulgaris is found in three out of twenty quadrates within a heath land vegetation type
compared to only one of twenty in grassland vegetation. This provides a quick method for assessing the
relatively abundance of plant species within a vegetation type. But clearly does not provide an absolute
measure of abundance. Wherever possible either plant density or percentage cover estimates of
abundance should be used.
page 6 / 10
rgsbio09
10 Field Study Techniques
3. Plant density
Plant density is defined as the number of individual plants per unit area (e.g. ten plants per Metre
Square, or twenty per hectare). This is of course simple to calculate when individual plants can be
separated, i.e. species exhibit a discrete growth form, and such as an individual tree or rosette forming
herbaceous species. However, a continuous, carpet-forming growth form of some plant species (such as
grasses), means that plant density is almost impossible to estimate.
Methodological considerations in assessing plant abundance
Plant density is always the best method to use in assessing plant abundance, as it gives the observer a
direct measure of plant abundance, and quantifiable for the unit of study (i.e. two plants per metre
square, etc.). Percentage cover is, however, highly dependent on the precise methodology you use. The
accuracy and therefore reliability of percentage cover estimates is dependent upon five interactive
factors;
the size of the plant you are studying,
the size of the quadrat you are using,
the spatial distribution of the plant your studying,
the spatial distribution of the quadrats, and;
the number of quadrats you use in estimating the species abundance.
Practical on Quadrat Sampling in RGS
Objective:
You will be using quadrats to evaluate the percentage cover of grass at two sites in RGS; a disturbed and
an undisturbed site.
Locations:
Disturbed site:
Grass patch located between D-block and E-block, facing J-block.
(It is the patch where the dental container is usually laid)
Undisturbed site:
Grass patch infront of block J (in the school field) between the 2 Eucalyptus trees.
Apparatus:
Clipboard
30m long measuring tape
Grid quadrat of 0.5m
Instructions:
page 7 / 10