binational summary report: mercury · pdf filedraft document of the identification task team 1...
TRANSCRIPT

DRAFT DOCUMENT OF THE IDENTIFICATION TASK TEAM
1
Binational Summary Report: Mercury
1. Overview:
Annex 3 - Chemicals of Mutual Concern commits the Parties to identify and designate, on an on-going basis, Chemicals of Mutual Concern (CMCs) in the Great Lakes, which originate from anthropogenic sources and that are agreed to by both Parties as being potentially harmful to the environment or human health.
As such, the Annex 3 Subcommittee (C3) has charged an Identification Task Team with reviewing and critically evaluating relevant existing data and information, in accordance with the Binational Considerations developed by the C3, in order to determine which of a suite of seven candidate chemicals / classes should be recommended as CMCs.
This Binational Summary Report documents the application of the Binational Considerations to the candidate CMC mercury. This report was developed with input and review of the entire ITT and the recommendations presented within were reached by a vote of the full ITT.
With respect to mercury, there was sufficient data and information available to effectively apply the Binational Considerations, and based on their application of the considerations, the ITT has unanimously recommended that Mercury be designated as a CMC.
The ITT has concluded that despite long-term downward trends in mercury concentrations in most environmental media of the Great Lakes basin; given that concentrations in sediment and in some fish species still routinely exceed relevant guidelines; and that a recent stabilization of the downward trend in concentrations in some media has been observed, mercury is considered to be present at concentrations of concern in the Great Lakes basin and therefore poses a threat to the environment and to human health in the basin.
The ITT has also concluded that while many risk management and science activities are ongoing for mercury under federal and provincial/state programs, there are still needs and opportunities for additional activities, many of which would benefit from enhanced Canada – U.S. coordination and collaboration in the Great Lakes, including:
Implementing and measuring performance of forthcoming federal activities to reduce atmospheric emissions from electric power generation;
Coordinating to address the issue of mercury in products in the Great Lakes;
Continuing to remediate mercury-contaminated sediment in designated Areas of Concern;
Continuing to undertake monitoring of abiotic (air, water, and sediment) and biotic (fish, birds) components of the Great Lakes ecosystem to: continue tracking long-term trends; provide data to protect human health through provision of fish consumption advice; provide data to protect wildlife consumers of aquatic biota and measure the performance of ongoing and forthcoming risk management activities
Conduct research to better understand the sources of mercury entering the Great Lakes ecosystem;
Conduct research to fill knowledge gaps with respect to methylation dynamics and the differential impacts of mercury in nearshore versus offshore environments;

DRAFT DOCUMENT OF THE IDENTIFICATION TASK TEAM
2
2. Chemical background:
Chemical Identity:
Mercury is a heavy metal that is present in the environment in many different forms. Elemental mercury is naturally present in the Earth's crust, in raw materials such as coal, crude oil and other fossil fuels, and in minerals such as limestone, soils and metal ores (including copper, gold and zinc) (Evers et al., 2011). Mercury also enters the environment as a result of natural processes such as forest fires and volcanic activity (Evers et al., 2011).
Mercury can also be released into the environment as a result of anthropogenic activities, such as the combustion of coal and refined petroleum products, the extraction of metals from ore, and the use and disposal of consumer products containing mercury (e.g. batteries, light bulbs and electrical switches) (Evers et al., 2011).
Since industrialization (circa 1850), the amount of mercury mobilized and released to the environment has increased significantly due to human activities. Current North American ambient atmospheric concentrations are approximately 1.6 ng/m3, compared with pre-industrial estimates of 0.5 - 0.8 ng/m3
(EC-HC, 2010).
Once in the environment, mercury can be converted to various forms. For example, mercury can be transformed into a highly toxic compound called methylmercury, which can accumulate in living organisms and biomagnify (i.e., increase in concentration) as it moves up the food chain (EC-HC, 2010).
Although most of the mercury in air, , water, soil and sediment exists in inorganic forms (e.g. elemental mercury), nearly all of the mercury accumulated by fish and higher trophic levels is methylmercury (Wiener et al., 2012). Indeed, the primary form of mercury that humans are exposed to, through consumption of fish and other seafood, is methylmercury (Evers et al., 2011).
Additionally, elemental (inorganic) mercury does not break down in the environment. Once released, it persists and can cycle between air, water, soil, plants and animals for extended periods (Figure 1) (EC-HC, 2010).
Because elemental mercury evaporates relatively easily and is persistent in the environment, mercury emissions can also be transported on wind currents, either as vapor or bound to particles (EC-HC, 2010). These emissions can circulate in the atmosphere for a year or more, travelling long distances before being deposited far from their original source, known as long range atmospheric transport and deposition (EC-HC, 2010).

DRAFT DOCUMENT OF THE IDENTIFICATION TASK TEAM
3
Figure 1: The Mercury Cycle. (EC-HC, 2010)
Canadian and US Domestic Program Status:
In Canada, mercury is a listed on Schedule 1 List of Toxic Substances, under the Canadian Environmental Protection Act, 1999 (CEPA 1999). Mercury (and its compounds) has been subject to extensive federal risk management activities since the 1970's, many of which predate CEPA 1999 – see Section 4 of this report (EC-HC, 2010).
In Ontario, mercury is a prescribed toxic substance set out in Regulation 455/09 under the Ontario Toxics Reduction Act (OMOECC, 2014).
In the US, the Environmental Protection Agency (EPA) works with partners in state, local and tribal governments to implement a variety of programs, laws, regulations and standards designed to reduce mercury pollution and impacts (US EPA, 2014)
Many of the EPA's environmental regulations and programs, including for mercury, are implemented at the state level. In addition, as of 2012, all eight Great Lakes states had developed and/or implemented state-level mercury actions, laws or regulations (ECOS, 2012).
DRAFT DOCUMENT OF THE IDENTIFICATION TASK TEAM
4
3. Review of existing scientific data and a qualitative evaluation of their significance:
Is the candidate chemical present in the Great Lakes ecosystem and does it present a potential threat to ecological or human health in the Great Lakes Basin?
Canadian Releases, Sources, and Uses:
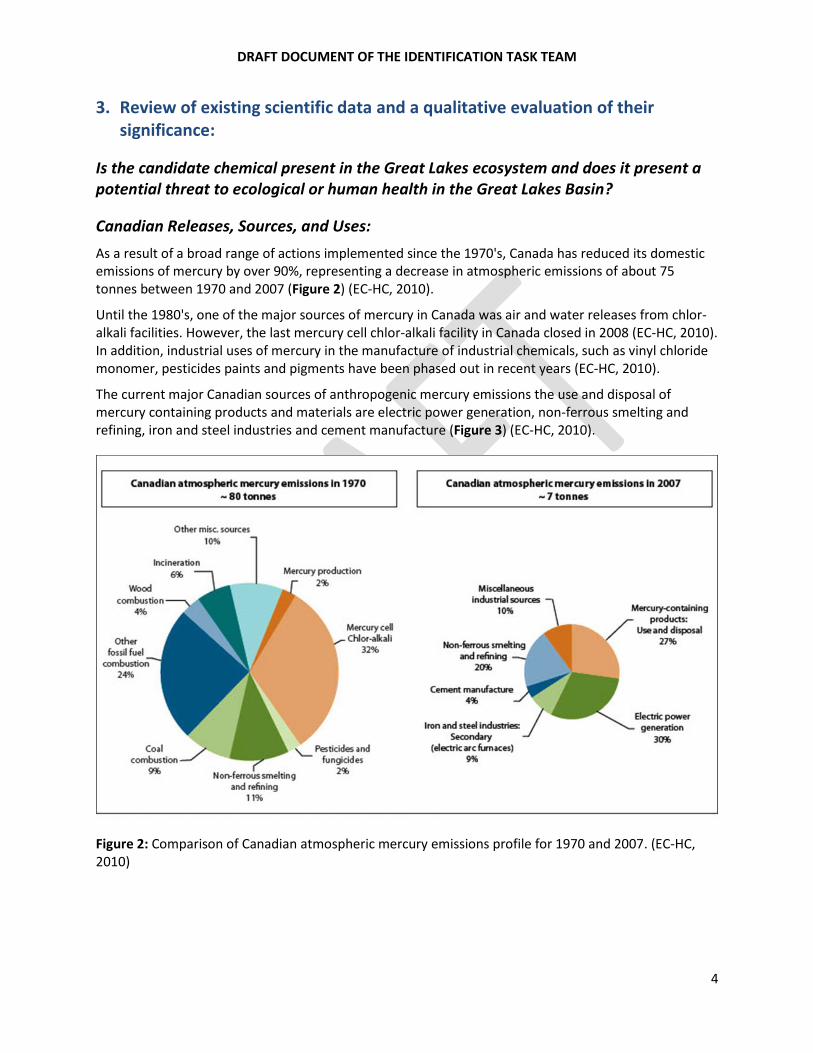
As a result of a broad range of actions implemented since the 1970's, Canada has reduced its domestic emissions of mercury by over 90%, representing a decrease in atmospheric emissions of about 75 tonnes between 1970 and 2007 (Figure 2) (EC-HC, 2010).
Until the 1980's, one of the major sources of mercury in Canada was air and water releases from chlor-alkali facilities. However, the last mercury cell chlor-alkali facility in Canada closed in 2008 (EC-HC, 2010). In addition, industrial uses of mercury in the manufacture of industrial chemicals, such as vinyl chloride monomer, pesticides paints and pigments have been phased out in recent years (EC-HC, 2010).
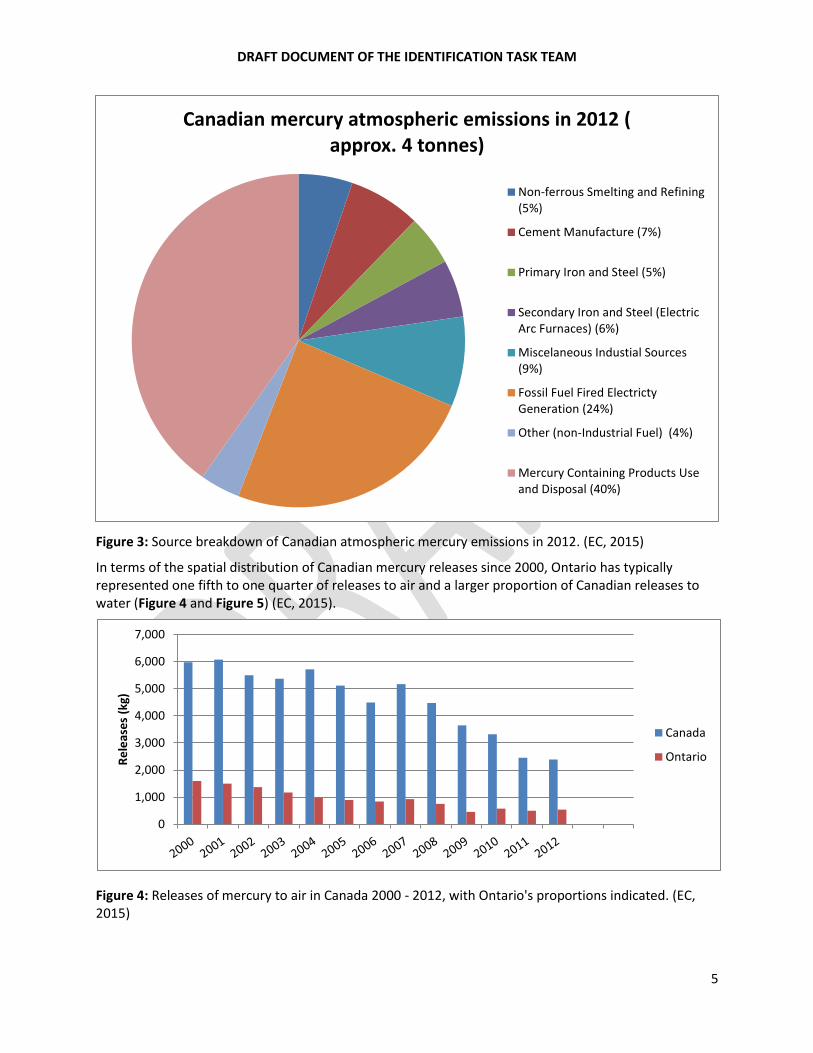
The current major Canadian sources of anthropogenic mercury emissions the use and disposal of mercury containing products and materials are electric power generation, non-ferrous smelting and refining, iron and steel industries and cement manufacture (Figure 3) (EC-HC, 2010).
Figure 2: Comparison of Canadian atmospheric mercury emissions profile for 1970 and 2007. (EC-HC, 2010)
DRAFT DOCUMENT OF THE IDENTIFICATION TASK TEAM
5
Figure 3: Source breakdown of Canadian atmospheric mercury emissions in 2012. (EC, 2015)
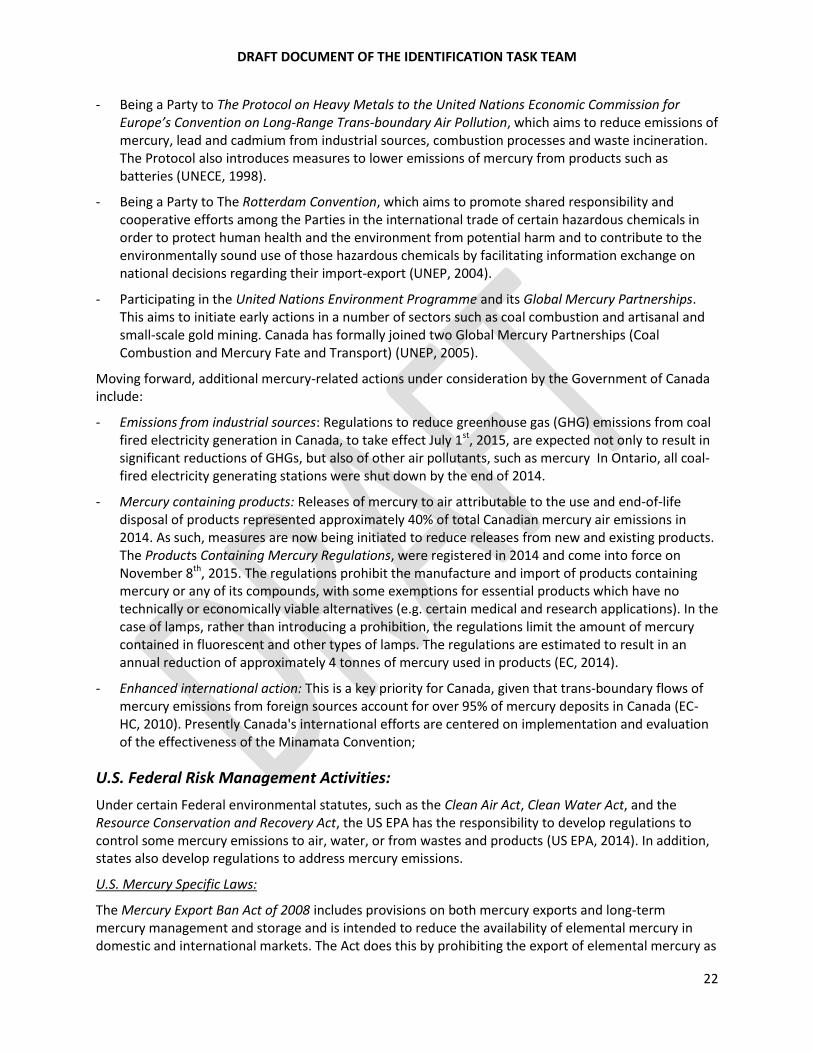
In terms of the spatial distribution of Canadian mercury releases since 2000, Ontario has typically represented one fifth to one quarter of releases to air and a larger proportion of Canadian releases to water (Figure 4 and Figure 5) (EC, 2015).
Figure 4: Releases of mercury to air in Canada 2000 - 2012, with Ontario's proportions indicated. (EC, 2015)
Canadian mercury atmospheric emissions in 2012 ( approx. 4 tonnes)
Non-ferrous Smelting and Refining(5%)
Cement Manufacture (7%)
Primary Iron and Steel (5%)
Secondary Iron and Steel (ElectricArc Furnaces) (6%)
Miscelaneous Industial Sources(9%)
Fossil Fuel Fired ElectrictyGeneration (24%)
Other (non-Industrial Fuel) (4%)
Mercury Containing Products Useand Disposal (40%)
0
1,000
2,000
3,000
4,000
5,000
6,000
7,000
Re
leas
es
(kg)
Canada
Ontario

DRAFT DOCUMENT OF THE IDENTIFICATION TASK TEAM
6
Figure 5: Releases of mercury to water in Canada 2000 - 2012, with Ontario's proportions indicated. (EC,
2015)
In terms of mercury deposition (wet and dry) in Canada, it is estimated that of the 65 tonnes of anthropogenic mercury that were deposited in 2006, foreign sources (including the US) accounted for over 95%, with China identified as the largest source (~ 42%), followed by the US (~17%) (EC-HC, 2010).
In 2008, approximately 13 tonnes of elemental mercury were imported into Canada, and an estimated 9 tonnes were imported in finished products. Some of these imports are used to manufacture mercury-containing products, such as lamps, which are then exported for sale (EC-HC, 2010).
Canada also exports mercury wastes, primarily to the US for reclamation and/or disposal at hazardous waste facilities. In 2003, approximately 6 tonnes of mercury waste were exported to the US for this purpose (EC-HC, 2010).
US Releases, Sources and Uses:
In 2005, approximately 100 tonnes of mercury were emitted from anthropogenic sources. Between 1990 and 2005, total US anthropogenic mercury emissions declined by approximately 59%, with the largest decreases occurring from hospital and municipal incinerators (95-99%), and chlor-alkali facilities (97%) (Figure 6) (Evers et al., 2011).
0
100
200
300
400
500
600R
ele
ase
s (k
g)
Canada
Ontario

DRAFT DOCUMENT OF THE IDENTIFICATION TASK TEAM
7
Figure 6: Comparison of US anthropogenic mercury emissions profile for 1990 and 2005. (Evers et al., 2011)
The US EPA compiles a National Emissions Inventory (NEI), based on state emissions inventories combined with national-level emissions estimates (GLRC, 2010). A summary of the 2005 NEI for mercury emissions in the Great Lakes States, aggregating broad source categories, is presented in Table 1 (GLRC, 2010).
In the Great Lakes states, coal-fired utility boilers and metal productions represent the source-sectors accounting for the most mercury emissions, at 57% and 14%, respectively (GLRC, 2010).
Table 1: 2005 Mercury emissions by sector for the Great Lakes states (tonnes). (GLRC, 2010)

DRAFT DOCUMENT OF THE IDENTIFICATION TASK TEAM
8
Source Category 1990 (tpy)
Baseline NEI for HAPs, 11/14/2005
2005 (tpy) MATS proposal
3/15/2011
2008 (tpy)
2008NEIv3
2011 (tpy)
2011NEIv2
Utility Coal Boilers (Electricity Generation Units – EGUs, combusting coal) 58.8 52.2 29.4 26.8
Hospital, Medical, Infectious Waste Incineration (HMIWI) 51 0.2 0.1 0.1
Municipal Waste Combustors 57.2 2.3 1.3 1.0
Industrial, Commercial, Institutional Boilers and Process Heaters 14.4 6.4 4.2 3.6
Mercury Cell Chlor-Alkali Plants 10 3.1 1.3 0.5
Electric Arc Furnaces (EAF)
7.5 7 4.8 5.4
Commercial/Industrial Sold Waste Incineration (CISWI) Not available 1.1 0.02 0.01
Hazardous Waste Incineration 6.6 3.2 1.3 0.7
Portland Cement Manufacturing 5 7.5 4.2 2.9
Gold Mine Ore Processing and Production 4.4 2.5 1.7 0.8
Sewage sludge incineration 2 0.3 0.3 0.3
Mobile Not available 1.2 1.8 1.3
Other 29.5 18 10.7 13
TOTAL TONS 246 105 61 56
Table 2: US mercury emission trends 1990 – 2011 from National Emissions Inventory data. (US EPA, 2015)
Environmental and Human Health Data:
As noted above, mercury is listed as a toxic substance under Schedule 1 of CEPA, 1999.
As noted in Section 2, elemental mercury is persistent in the environment and the environmental methylation of mercury results in methylmercury, which accumulates in living organisms and can biomagnify as it moves up the food chain (EC-HC, 2010). For example, fish-eating predators such as

DRAFT DOCUMENT OF THE IDENTIFICATION TASK TEAM
9
loons and top predator fish such as walleye and lake trout have been observed to bioaccumulate high levels of methylmercury (EC-HC, 2010)
Within the environment and depending on the level of exposure, effects on, fish, birds, mammals and other wildlife can include slower growth, reproductive failure, and the development of abnormal behaviours that can affect survival (EC-HC, 2010). In addition, research indicates that the endocrine system of fish, which plays an important role in fish development and reproduction, may be altered by exposure to methylmercury (US EPA, 2014).
Adverse biological effects from mercury exposure to benthic (sediment-dwelling) organisms include lethality, reduced fertilization, and impaired development of early life stages (CCME, 1999a).
Mercury poses a series of human health risks as well, both in its elemental form and in more toxic forms, such as methylmercury. The primary pathway for human exposure to methylmercury sources is through consumption of fish and other seafood (EC-HC, 2010; US EPA, 2014).
Studies have shown that methylmercury is a neurotoxin that is readily absorbed, distributed and passed through the protective blood-brain barrier, affecting the central nervous system (EC-HC, 2010). In pregnant women, it can cross the placenta into the fetus, accumulating in the fetal brain and other tissues. Methyl mercury can also be passed to infants through breast milk and is particularly damaging to the development of infants and young children, who are especially vulnerable given that their nervous systems are still developing (EC-HC, 2010).
Environmental and Human Health Benchmarks Guidelines:
Guideline Media Value
Health Canada Blood Guidance Value
(HC, 2013)
Blood (adult males > 18 and females > 50)
20 µg/L
Blood (pregnant women, females < 49 and males < 18)
8 µg/L
United States Environmental Protection Agency Blood Mercury Threshold
Blood (sensitive populations) 5.8 µg/L
Health Canada guidelines for mercury levels in fish General commercial fish 0.5 µg/g ww
Commercial predatory fish 1.0 µg/g ww
Canadian Water Quality Guidelines for the Protection of Aquatic Life (CCME, 2003)
Freshwater (inorganic Mercury) 26 ng/L
Freshwater (Methyl mercury) 4 ng/L
Canadian Sediment Quality Guidelines for the Protection of Aquatic Life (CCME, 1999)
Freshwater Sediment (TEL) 0.17 µg/g dw
Freshwater Sediment (PEL) 0.49 µg/g dw
Canadian Tissue Residue Guidelines for the Protection of Wildlife Consumers of Aquatic Biota (CCME, 2000)
Mammal / Avian Consumers
(Methyl mercury) 0.033 µg/g
ww
Table 3: Environmental quality guidelines and human health guidance values for mercury.

DRAFT DOCUMENT OF THE IDENTIFICATION TASK TEAM
10
OMOE* OMOE* EPA** 1987 GLWQA+ Consortium++
Meals / Month
General Population
Sensitive Population
Sensitive Population
Sensitive Population
Sensitive Population
8 0-0.61 0-0.26 0.05
4 0.61-1.23 0.26-0.52 0.3
0.11-0.22
2 1.23-1.84 0.22-0.95
0 >1.84 >0.52 >0.5 >0.95
* Ontario guidelines for mercury from the Guide to Eating Ontario Sport Fish (OMOECC, 2014); ** US Environmental Protection Agency mercury criteria for protection of human health (US EPA, 2014); + Concentration established under the 1987 Canada – United States Great Lakes Water Quality Agreement ++ Consumption limits for sensitive populations using the Protocol for a Uniform Great Lakes Sport Fish Consumption Advisory (MDOH, 2013)
Table 4: Fish Consumption Advisory Guidelines for mercury from the Great Lakes basin (µg/g).
All of the Great Lake states have developed state-level criteria for mercury concentrations in sport fish. For sensitive populations, the complete restriction concentrations (i.e. 0 meals / month) range from 0.5 to 2.8 µg/g ww (IJC, 2005).
Great Lakes Monitoring and Surveillance Data:
Air and Atmospheric Deposition:
An analysis of data from the Mercury Deposition Network through 2005 showed that concentrations of mercury in precipitation were decreasing for nearly half of the network’s sites, particularly across Pennsylvania and into the Northeast. However, the sites in the Great Lakes region do not generally show this decreasing trend, except for 1 site in Indiana (Prestbo and Gay, 2009). In 2012, concentrations ranged from 7 – 13 ng/L in the Great Lakes region (NADP, 2013).
A recent analysis of annual and weekly mercury concentrations, precipitation depths, and mercury wet deposition in the Great Lakes region found that mercury wet deposition was mostly unchanged from 2002 to 2008, with any small decreases in concentration offset by increases in precipitation (Risch et al., 2011).
However, total atmospheric mercury emissions from inventoried anthropogenic sources in the Great Lakes declined by approximately 50% between 1990 and 2005 (Evers et al., 2011).
Additionally, US EPA modeling using the Community Multi-scale Air Quality (CMAQ) system found that the proportion of mercury deposition to the Great Lakes region resulting from sources outside of North America varies greatly, and is higher in the upper lakes than in the lower lakes (GLRC, 2010). CMAQ estimates that the non-US / Canada proportion of mercury deposition to the Great Lakes contributed by global sources ranges from more than 87.5% in Lake Superior, to less than 62.5% in Lake Erie (GLRC, 2010). The share of mercury deposition to the Great Lakes contributed by global sources is expected to continue growing while emissions in North America decline.
The CMAQ modeling also demonstrates the importance of proximity of individual sources of mercury to the Great Lakes in regulating mercury deposition. The closer a mercury emissions source is to the Great Lakes, the more deposition it contributes (GLRC, 2010; NOAA, 2007). The results show that the proportion of mercury deposition caused by nearby sources (within 100km) is estimated to account for up to 40% in some locations (e.g. Southern Lake Erie and Lake Ontario) (GLRC, 2010). In areas that are more distant from local mercury emissions sources, the contribution from nearby sources is relatively

DRAFT DOCUMENT OF THE IDENTIFICATION TASK TEAM
11
small; for example CMAQ results indicate that over most of Lake Superior basin, North American anthropogenic sources account for < 12.5% of mercury deposition (GLRC, 2010).
By far, the largest remaining source of mercury emissions in the Great Lakes basin is US coal-fired utility boilers, which accounted for almost 60% of 2005 emissions from inventoried sources (Evers et al., 2011; GLRC, 2010; NOAA, 2007). After coal-fired power generation, the largest sources of mercury emissions within the Great Lakes basin include metals production, waste incineration, cement production, fuel combustion at non-utility stationary sources and mercury cell chlor-alkali plants (GLRC, 2010; NOAA, 2007). On a basin-wide scale, these local sources, associated with urban areas, can contribute significantly to mercury loadings in the nearby (<100km) environment.
In summary, emissions of mercury in the Great Lakes have declined considerably since the 1970’s and long-range atmospheric transport and deposition from out-of-basin sources is now a primary contribution to atmospheric mercury loadings within the basin. However, emissions of mercury from within the basin continue to contribute significantly to atmospheric mercury loadings in the lower Great Lakes. The US electrical power generating sector is the largest remaining source of mercury emissions within the Great Lakes basin.
Surface Water:
Mercury is found in trace concentrations in the surface waters of the Great Lakes, but due to the processes of bioconcentration and bioaccumulation, even low water concentrations can result in bioaccumulation that can adversely affect higher organisms (EC-USEPA, 2013).
Recent (2003-2009) offshore surface water concentrations of mercury throughout most of the Great Lakes are within a relatively narrow range, from about 0.24 to 0.54ng/L (EC-USEPA, 2013), which is approximately 50-100 times below the Canadian Water Quality Guideline for the Protection of Aquatic Life (see guidelines above) of 26ng/L. The lowest concentrations are observed in Lake Huron and Georgian Bay (mean 0.24 and 0.3ng/L respectively), intermediate concentrations are observed in Lake Superior and Lake Ontario (mean 0.35ng/L), and the highest concentrations are observed in Lake Michigan and Lake Erie (0.49ng/L and 0.54ng/L, respectively) (EC-USEPA, 2013).
Near-shore concentrations of mercury are higher than open lake concentrations in all lakes except Lake Huron, were concentrations are approximately equivalent (Dove et al., 2012).

DRAFT DOCUMENT OF THE IDENTIFICATION TASK TEAM
12
Figure 7: Spatial distribution of total mercury in Great Lakes surface waters 2006-2009. (Dove et al., 2012)
Currently, mercury concentrations tend to be highest in the western basin of Lake Erie, where proximity to urban areas and probable historical sources contribute to elevated mercury surface water concentrations (EC-USEPA, 2013). The average concentration of total mercury in waters from the western basin of Lake Erie was 12.4ng/L in 2009 (Dove et al., 2012); still less than half of the Canadian guideline of 26ng/L (see guidelines section above).
Long term trends of mercury in Great Lakes surface waters appear to be declining (Krabbenhoff, 2012). Over the relatively short time period of 2003-2009, a decline in total mercury concentrations of approximately 40-50% (in open waters) has been observed in the Great Lakes (Dove et al., 2012). Data from the Niagara River indicate an average decrease in mercury concentrations of 18% upstream, (Fort Erie) and 30% downstream (Niagara on the Lake) over the time period 1986 – 2009 (Dove et al., 2012).
In summary, measured concentrations of mercury in offshore waters are declining in all of the Great Lakes and, at present, are below the 26 ng/L Canadian Water Quality Guideline for the Protection of Aquatic Life. However, because these are largely offshore Great Lakes concentrations, samples taken closer to shore or closer to potential sources are likely to yield higher values.
Sediments:
The comparison of surficial sediment contaminant concentrations with sub-surface maximum concentrations indicates that mercury concentrations have declined by as much as 89% over the past four decades (Table 5) (EC-US EPA, 2013). Lake Superior is the largest, coldest and deepest of the Great Lakes and as a result, rates of decrease in concentrations of legacy chemicals in sediment are the slowest (EC-US EPA, 2013). This is especially true for the heavy metals such as mercury, given the nature of the watershed (pre-Cambrian shield significant natural source of mercury) and historical regional sources associated with mining and smelting around Lake Superior (EC-US EPA, 2013).
Lake Ontario Lake Erie Lake St. Clair Lake Huron Lake Superior
73% 37 % 89 % 82 % 0 %

DRAFT DOCUMENT OF THE IDENTIFICATION TASK TEAM
13
Table 5: Percentage mercury declines in Great Lakes sediment, 1970-2010. (EC-USEPA, 2013)
Studies by Marvin et al. (2003, 2005) and Gewurtz et al. (2008) examined the spatial and temporal trends in mercury sediment contamination in four of the Great Lakes as well as Georgian Bay, and compared observed environmental concentrations to the Canadian Sediment Quality Guidelines for the Protection of Aquatic Life probable effects level (PEL) of 0.486µg/g dw and threshold effects level (TEL) of 0.17µg/g dw. A summary of these results is presented in the following table.
Superior Huron G. Bay Ontario Erie
%>TEL %>PEL %>TEL %>PEL %>TEL %>PEL %>TEL %>PEL %>TEL %>PEL
15 0 0 0 5 0 83 59 60 58
Mean = 0.089 Mean = 0.039 Mean = 0.05 Mean = 0.586 Mean = 0.202
Table 6: Mercury surficial sediment concentrations compared to Canadian threshold effects level (0.17 µg/g dw) and probable effects level (0.486 µg/g dw). (Marvin et al., 2003 & 2005; Gewurtz et al., 2008)
The spatial distribution of mercury surficial sediment concentrations is illustrated in Figure 8. The highest concentrations are observed in offshore depositional areas characterized by fine-grain sediments. The spatial distributions in Lake Erie and Lake Ontario are strongly influenced by industrial activities along the shoreline and in the watersheds of major tributaries (e.g. Detroit River) (EC-USEPA, 2013).
Figure 8: Spatial distribution of mercury contamination in surface sediments in open-lake areas and tributaries of the Great Lakes. (EC-US EPA, 2013)
In summary, measured concentrations of mercury in surficial sediment have declined significantly over the past four decades. Concentrations are typically very low across the western Great Lakes basin. However, concentrations in sediments of Lake Erie and Lake Ontario continue to routinely exceed the Canadian Sediment Quality Guidelines for the Protection of Aquatic Life. The higher concentrations of mercury observed in the eastern Great Lakes basin are likely representative of the greater proportion

DRAFT DOCUMENT OF THE IDENTIFICATION TASK TEAM
14
of existing local sources (e.g. electric power generation) and the fact that deposition rates are highest within close proximity of local sources.
Fish and other Wildlife:
Persistent toxic chemicals have been monitored in the eggs of Herring Gulls from the Great Lakes since the early 1970's. Current (2009) concentrations of mercury from 15 sites covering all five Great Lakes range from 0.0064µg/g (wet weight) at Chantry Island, Lake Huron, to 0.246 µg/g at Middle Island, Lake Erie (Weseloh et al., 2011).
Mercury concentrations at 14 of 15 of these sites showed declines of 22.6 to 85.8% between 1974-2009, with one site from Lake Erie (Middle Island) showing a 10.5% increase (Weseloh et al., 2011). These declining temporal trends were significant at 10 of 15 sites; however, no significant trends were observed over the last 15 years (Weseloh et al., 2011). Furthermore, after adjusting concentrations for dietary changes, most sites (11) no longer exhibited significant declines, suggesting that only part of the long-term decreases observed were the result of reduction in mercury levels in the environment; changes in diet may also play an important role in the observed decline in mercury concentrations (Weseloh et al., 2011).
Figure 9: Temporal trend in Great Lakes herring gull egg mercury concentrations, 1974 – 2009. (Evers et al., 2011)
Mercury has also been monitored in many fish species from the Great Lakes basin, and in many cases, this monitoring also began in the 1970's (EC-US EPA, 2013).An assessment of two representative top-predator fish species, walleye and largemouth bass, showed a declining temporal trend in mercury concentrations from 1970-2009, with spatial trends of increasing mercury concentrations from south to north and west to east across the Great Lakes basin (Monson et al., 2011). However, since the 1990's, a shift to an upward trend in mercury concentrations in top-predator fish species (e.g. walleye and lake trout) is evident (i.e. non-linearity) (Monson et al., 2011; Zanaski et al., 2011).
Concentrations of mercury recently (1999-2009) found in Great Lakes top-predator fish ranged from 67 to 343 ng/g for lake trout and walleye from Lakes Ontario, Erie, Huron and Michigan and concentrations observed in Lake Superior 96 to 484 ng/g (Bhavsar et al., 2010, Zanaski et al., 2011). Concentrations recently observed and reported through U.S. Great Lakes Fish Monitoring Program are consistent, with

DRAFT DOCUMENT OF THE IDENTIFICATION TASK TEAM
15
concentrations of mercury generally between 110 to 250ng/g across all lakes, except for Lake Superior, where elevated concentrations where observed, up to 415ng/g (Carlson and Swackhamer, 2006; US EPA, 2014).
It should be noted that over 97% of these recently observed sport fillet mercury concentrations are below the 0.5µg/g (500ng/g) target established under the 1987 Canada-United States Great Lakes Water Quality Agreement (Bhavsar et al., 2010; Zanaski et al., 2011; US EPA, 2014). While it is evident that a large number of consumption advisories still exist on the basis of mercury concentrations, these are generally only minimally (i.e. 8 meals / month) to moderately restrictive (4 meals / month) (US EPA, 2014).
Figure 10: Total mercury in sport fish fillets from the Great Lakes. (US EPA, 2014)
Figure 11: Temporal trend in fillet mercury concentrations for fish from the Great Lakes. (Evers et al., 2011)
Year
1998 2000 2002 2004 2006 2008 2010 2012 2014
Co
nce
ntr
atio
n (
ug
/g)
0.05
0.10
0.15
0.20
0.25
0.30
0.35
0.40
USEPA
OMOE

DRAFT DOCUMENT OF THE IDENTIFICATION TASK TEAM
16
Figure 12: Total mercury concentrations (median and inter-quartile range) for individual (Environment Canada) and composited (US EPA) whole-body lake trout of walleye (Lake Erie) collected from each of the Great Lakes. (EC-USEPA, 2013)
Information from the OMOECC (Bhavsar et al., 2011; OMOECC, 2014) demonstrate that the majority of restrictive fish consumption advisories for the Canadian waters of the Great Lakes issued by the OMOECC, based on the most restrictive contaminant, are attributable to polychlorinated biphenyls and dioxins/furans and that mercury currently causes about <1-2.5% and < 10% of the restrictive advisories for the general population and sensitive populations (children <15 and women of child-bearing age), respectively. They found that in the absence of other contaminants, mercury would replace some of the current advisories caused by other contaminants; however, the overall advisories would be minimally to moderately restrictive (Bhavsar et al., 2011). Their results, combined with decreasing mercury trends for

DRAFT DOCUMENT OF THE IDENTIFICATION TASK TEAM
17
Great Lakes fish (except Lake Erie), suggest that current mercury levels in Canadian Great Lakes fish are of very minor concern for the general population and of moderate concern for the sensitive population (Bhavsar et al., 2011 and OMOECC, 2014).
With regards to fish health, a recent screening level study by Sandheinrich et al. (2011) indicated that fish at a substantive number of locations within the Great Lakes region are potentially at risk from methylmercury contamination and would benefit from reductions in mercury concentrations. In many of the studies described above, concentrations exceeded the Canadian tissue residue guidelines for the protection of consumers of aquatic life of 0.033 µg/g ww.
In summary, long-term (1970-2010) mercury concentrations in most Great Lakes herring gull and fish have shown significant declines; however since approximately 1990 a stabilization or slight increasing trend has been observed in some species in some locations (e.g. Lake Erie walleye and gull eggs). Additionally, there are a substantive number of locations within the Great Lakes basin in which mercury levels in fish-eating fish and wildlife are sufficiently high to be of concern. Fish consumption advisories due to mercury contamination remain in effect in some locations in the Great Lakes basin, however these are relatively minor to moderate, when compared with consumption advisories due to other contaminants of concern.
Human Biomonitoring:
At present, there are no systematic Great Lakes specific human biomonitoring programs to monitor human exposure to persistent chemicals. Therefore, nationwide studies and results from individual epidemiological studies undertaken in the Great Lakes are used as a means to evaluate mercury concentrations in humans in the Great Lakes basin. As such, spatial and/or temporal trends across the Great Lakes basin cannot be defined.
Health Canada’s Canada Health Measures Survey (CHMS) has recently examined mean blood concentrations of total mercury (elemental, inorganic and organic) in Canadians (HC, 2010 and 2013). Previous studies have shown that inorganic mercury comprises between 14% - 26% of total blood mercury, and thus, a measurement of total blood mercury consists primarily of methylmercury (i.e. organic) (HC, 2010).
CHMS results show that the geometric mean blood mercury level of Canadians aged 3 – 79 is 0.70µg/L, with approximately 90% of persons having concentrations above the detection limit of 0.10µg/L. However, fewer than 1% of Canadians aged 20 – 79 have total mercury concentrations above the Health Canada blood guidance value of 20µg/L established for the general population (HC, 2010 and 2013).
A collaborative project between the University of Michigan and the Aamjiwnaang First Nation (located near Sarnia, within the Great Lakes basin) examined total blood mercury levels of children and their mothers living on the reserve in 2013 and compared their findings to those of the CHMS for the general Canadian population (Basu et al., 2013). The study showed that organic mercury exposure of the Aamjiwnaang people (blood, hair and urine) are within the reference range defined by the CHMS results, which likely reflects limited local fish consumption by community members (Basu et al., 2013).
A recent study of Ontario First Nations (FNFNES 2013) found that the mean mercury concentration in hair from First Nations adults living on-reserve in Ontario was 0.64µg/g, with over 95% of study samples (n=765) falling below the Health Canada mercury guideline of 6µg/g in hair for the general population.
The First Nations Biomonitoring Initiative (FNBI) examined the concentration of mercury in the blood of Canadian First Nations populations in 2011 (AFN, 2013). Total mercury levels in blood observed in the

DRAFT DOCUMENT OF THE IDENTIFICATION TASK TEAM
18
FNBI samples (total and male) are similar (i.e. not significantly different) than levels observed in the CHMS (AFN, 2013). Female FNBI levels were to unreliable to be published due to their associated coefficient of variation being too high (AFN, 2013). The FNBI also included a breakdown by ecozone, one of which was the Great Lakes: concentrations in the Great Lakes ecozone (1.07 µg/L) were higher than those of the general First Nations populations and those of the general Canadian population but still below all relevant guidelines listed in Table 2. However, these FNBI summary results should be used with caution, as there is a high coefficient of variability (16.6% - 33.3%) associated with the survey estimates (AFN, 2013)
Since implementation of the US Great Lakes Restoration Initiative began, the Agency for Toxic Substances and Disease Registry has conducted four separate cross-sectional biomonitoring studies for environmental contaminants, including mercury, in the Great Lakes population to: 1) evaluate current body burdens, 2) compare these to national data and, 3) generate biomonitoring data to guide public health actions by state health departments, in order to advance the protection of people in their jurisdiction who are at increased exposure risks to Great Lakes contaminants (US EPA, 2014). Results from these studies should be available in 2015, and should help to establish spatial and temporal trends in mercury blood concentrations across the Great Lakes as well as a baseline comparison of the Great Lakes population to national averages.
The Minnesota Department of Health’s Mercury in Newborns in the Lake Superior Basin Study (2011) assessed population-level mercury exposure for newborns in the U.S. portion of the Lake Superior basin. Residual dried blood spots from 1,465 were collected and analyzed for total mercury. Most infants were found to have low or undetected total mercury levels. However, 8% of tested newborns had total mercury levels above the 5.8μg/l U.S. EPA reference dose for methylmercury. Babies born during the summer months were more likely to have an elevated mercury level. This seasonal effect suggests that increased consumption of locally-caught fish during the warm months is an important source of pregnant women’s mercury exposure in this region (MDOH, 2011).
In summary, given the limited availability of human biomonitoring data specific to the Great Lakes, it is not possible to establish any spatial or temporal trends in blood mercury concentrations within the region at this time. Some studies have found concentrations in First Nations across the Great Lakes and Ontario that are comparable to concentrations found across Canada that are below Health Canada’s Blood Guidance Value of 20ng/L.
This could be representative of an important data gap with respect to mercury in the Great Lakes, as mercury fish tissue concentrations in the Great Lakes remain above levels warranting consumption advisories and / or restrictions and that diet, primarily the consumption of fish, has been identified as a primary source of human exposure to methylmercury.
Conclusions:
Media Summary
Air
- Mercury ambient air concentrations, emissions and deposition within the Great Lakes region have decreased significantly since the 1970s; however concentrations in precipitation and wet deposition rates appear to have stabilized since 2000;
- Long range atmospheric transport and deposition from out of basin sources is now the most significant contributor to Great Lakes mercury deposition and the relative importance of out of basin sources is increasing;

DRAFT DOCUMENT OF THE IDENTIFICATION TASK TEAM
19
Media Summary
- At present, coal-fired utility boilers represent the largest (> 55%) in-basin source of mercury emissions, which contribute significantly to nearby (within 100km) deposition;
Water
- Measured concentrations of mercury in offshore waters have declined significantly since the 1970’s and continue to decline in all of the Great Lakes, with the exception of western Lake Erie, where concentrations have stabilized;
- At present, concentrations of mercury in offshore waters are significantly below the Canadian Water Quality Guideline for the Protection of Aquatic Life for mercury;
Sediment
- Measured concentrations of mercury in surficial sediments have declined over the past four decades;
- Concentrations are typically very low across the western Great Lakes basin; however, concentrations in Lake Erie and Lake Ontario still routinely exceed the Canadian Sediment Quality Guidelines for the Protection of Aquatic Life for mercury;
- The spatial distribution of mercury in sediments of Lake Erie and Lake Ontario are strongly influenced by industrial activities along the shoreline and in the watersheds of major tributaries (e.g. Detroit River);
Wildlife
- Mercury concentrations in herring gull eggs and most Great Lakes fish have shown significant declines over 1970 - 2010;
- However, since approximately 1990, a stabilization or slight increasing trend has been observed in some fish species and herring gull eggs from some locations (e.g. Lake Erie walleye and herring gull eggs);
- Fish consumption advisories due to mercury remain in effect throughout the Great Lakes basin;
- However, the majority of advisories are minimally to moderately restrictive and that mercury currently causes about <1-2.5% and < 10% of the restrictive advisories for the general population and sensitive populations in Ontario;
Biomonitoring
- Extremely limited human biomonitoring data are available specific to the Great Lakes and therefore it is not possible to establish any spatial or temporal trends;
- Some studies have found concentrations in First Nations across the Great Lakes and Ontario which are comparable to concentrations found across Canada and are below Health Canada’s Blood Guidance Value;
Despite long-term downward trends in mercury concentrations in most environmental media of the Great Lakes basin, given that concentrations in sediment and in some fish species still routinely exceed relevant guidelines and that a recent stabilization of the downward trend in concentrations in some media has been observed, mercury is considered to be present at concentrations of concern in the Great Lakes basin and poses a threat to the environment and to human health in the basin.

DRAFT DOCUMENT OF THE IDENTIFICATION TASK TEAM
20
4. Review of past, present and/ or planned science and risk management actions:
Is there a need for additional risk management and/or science activities and are there resources and/or tools available to support the delivery of such activities?
Canadian Federal Risk Management Activities:
Over the past several decades, the Government of Canada has implemented a wide range of regulatory and non-regulatory initiatives in collaboration with provincial and territorial governments, industry and other stakeholders. A summary of these initiatives, relative to annual mercury emissions, is presented below in Figure 13 (EC-HC, 2010).
Figure 13: Canadian mercury emissions trend from 1970 to 2007. (EC-HC, 2010)
A) 1970 - 1980: Closure of 10 of 15 mercury cell-chlor-alkali facilities; B) 1972: Alkali Mercury Liquid Effluent Regulations; C) 1975: Closure of Pinchi Lake primary mercury mine; D) 1978: Chlor-Alkali Mercury National Emissions Standards Regulations; E) 1992 - 1993: Process change by the Hudson Bay Mining & Smelting Co. facility in Flin Flon, Manitoba; F) 1996: National Guidelines for the Use of Hazardous and Non-Hazardous Wastes as Supplementary Fuels in
Cement Kilns; G) 1998: National Emission Guideline for Cement Kilns and Mercury-based pesticide active ingredients no longer
registered for use; H) 2000: Canada-wide Standards for Mercury Emissions from Incineration and Base Metal Smelting I) 1994 - 2000: Accelerated Reduction / Elimination of Toxics Program; J) 2001: Environmental Codes of Practice for Integrated and Non-Integrated Steel Mills as well as Canada-wide
Standards for Mercury-Containing Lamps and on Mercury for Dental Amalgam Waste K) 2005: Surface Coating Materials Regulations;

DRAFT DOCUMENT OF THE IDENTIFICATION TASK TEAM
21
L) 2006: Canada-wide Standards for Mercury Emissions from Coal-Fired Electric Power Generation Plants, Environmental Codes of Practice for Base Metals Smelters and Refineries, Pollution Prevention Plans in respect of Specified Toxic Substances Released from Base Metal Smelters and Refineries and Zinc Plants as well as addition to the Cosmetic Ingredients Hotlist of the Cosmetic Regulations;
M) 2007: Pollution Prevention Plans in Respect of Mercury Releases from Mercury Switches in End-of-Live Vehicles Processes by Steel Mills;
N) 2010: Pollution Prevention Plans in Respect of Mercury Releases from Dental Amalgam Waste;
The Government of Canada has also undertaken a number of additional actions to protect Canadians from exposure to mercury, including the development of guidelines in a variety of areas, as described previously in this report under the environmental and human health benchmarks section (EC-HC 2010).
In addition the Government of Canada supports a range of science activities aimed at both strengthening our understanding of mercury, and informing domestic and international decision makers on the design and implementation of effective mercury response strategies (EC-HC 2010). Specifically, current Canadian federal research, monitoring and assessment activities aim to:
- Track changes in domestic and global mercury emissions and levels in the environment;
- Monitor and assess exposure to mercury among Canadians (including vulnerable populations), including monitoring mercury levels in Canadian food sources such as fish;
- Assess the effectiveness and compliance promotion of risk management actions intended to reduce environmental and human exposure to mercury,; and
- Predict the influence of current and projected domestic and global mercury emissions on Canada.
Canada is presently completing a national mercury science assessment report, the results of which will be made publically available.
Domestic releases of mercury have been reported since 1993, through the National Pollutant Release Inventory (NPRI), Canada’s legislated, publically accessible inventory of pollutant releases (to air, water and land), disposals and transfers for recycling (EC-HC, 2010).
Internationally, Canada is actively engaged in a number of bilateral and multi-lateral environmental agreements and activities, which directly or indirectly, are aimed at addressing the adverse human health and environmental effects associated with the trans-boundary flows of mercury (EC-HC, 2010). This includes:
- Being a signatory to the Minamata Convention on Mercury, a global treaty to protect human health and the environment from the adverse effects of mercury. The major highlights of the Minamata Convention include a ban on new mercury mines, the phase-out of existing ones, the phase out of the manufacture, import, or export of listed manufactured products to which mercury is added, control measures on air emissions and the international regulation of the informal sector for artisanal and small-scale gold mining (UNEP, 2014) Additionally, there is a plan to deliver an effectiveness evaluation of the Convention;
- Being a Party to The Basel Convention on the Control of Trans-boundary Movements of Hazardous Wastes and their Disposal, which aims to protect human health and the environment from adverse effects resulting from the generation, management, storage, trans-boundary movement and disposal of wastes, including mercury. Relevant initiatives under the Basel Convention include the development of Technical Guidelines for the Environmentally Sound Management of Wastes Consisting of, Containing, or Contaminated with Mercury;
DRAFT DOCUMENT OF THE IDENTIFICATION TASK TEAM
22
- Being a Party to The Protocol on Heavy Metals to the United Nations Economic Commission for Europe’s Convention on Long-Range Trans-boundary Air Pollution, which aims to reduce emissions of mercury, lead and cadmium from industrial sources, combustion processes and waste incineration. The Protocol also introduces measures to lower emissions of mercury from products such as batteries (UNECE, 1998).
- Being a Party to The Rotterdam Convention, which aims to promote shared responsibility and cooperative efforts among the Parties in the international trade of certain hazardous chemicals in order to protect human health and the environment from potential harm and to contribute to the environmentally sound use of those hazardous chemicals by facilitating information exchange on national decisions regarding their import-export (UNEP, 2004).
- Participating in the United Nations Environment Programme and its Global Mercury Partnerships. This aims to initiate early actions in a number of sectors such as coal combustion and artisanal and small-scale gold mining. Canada has formally joined two Global Mercury Partnerships (Coal Combustion and Mercury Fate and Transport) (UNEP, 2005).
Moving forward, additional mercury-related actions under consideration by the Government of Canada include:
- Emissions from industrial sources: Regulations to reduce greenhouse gas (GHG) emissions from coal fired electricity generation in Canada, to take effect July 1st, 2015, are expected not only to result in significant reductions of GHGs, but also of other air pollutants, such as mercury In Ontario, all coal-fired electricity generating stations were shut down by the end of 2014.
- Mercury containing products: Releases of mercury to air attributable to the use and end-of-life disposal of products represented approximately 40% of total Canadian mercury air emissions in 2014. As such, measures are now being initiated to reduce releases from new and existing products. The Products Containing Mercury Regulations, were registered in 2014 and come into force on November 8th, 2015. The regulations prohibit the manufacture and import of products containing mercury or any of its compounds, with some exemptions for essential products which have no technically or economically viable alternatives (e.g. certain medical and research applications). In the case of lamps, rather than introducing a prohibition, the regulations limit the amount of mercury contained in fluorescent and other types of lamps. The regulations are estimated to result in an annual reduction of approximately 4 tonnes of mercury used in products (EC, 2014).
- Enhanced international action: This is a key priority for Canada, given that trans-boundary flows of mercury emissions from foreign sources account for over 95% of mercury deposits in Canada (EC-HC, 2010). Presently Canada's international efforts are centered on implementation and evaluation of the effectiveness of the Minamata Convention;
U.S. Federal Risk Management Activities:
Under certain Federal environmental statutes, such as the Clean Air Act, Clean Water Act, and the Resource Conservation and Recovery Act, the US EPA has the responsibility to develop regulations to control some mercury emissions to air, water, or from wastes and products (US EPA, 2014). In addition, states also develop regulations to address mercury emissions.
U.S. Mercury Specific Laws:
The Mercury Export Ban Act of 2008 includes provisions on both mercury exports and long-term mercury management and storage and is intended to reduce the availability of elemental mercury in domestic and international markets. The Act does this by prohibiting the export of elemental mercury as

DRAFT DOCUMENT OF THE IDENTIFICATION TASK TEAM
23
of January 1, 2013, and requires the Department of Energy to designate and operate a facility (or facilities) for the purpose of long-term management and storage of elemental mercury generated in the United States. The Act also prohibits the transfer of elemental mercury held by federal agencies as of the date of enactment (except to facilitate long-term storage and management) in order to further control the flow of elemental mercury in the domestic market.
The Mercury Containing and Rechargeable Battery Management Act of 1996 phases out the use of mercury in batteries, and provides for the efficient and cost-effective disposal of used nickel cadmium (Ni-Cd) batteries, used small sealed lead-acid (SSLA) batteries, and certain other regulated batteries. The statute applies to battery and product manufacturers, battery waste handlers, and certain battery and product importers and retailers.
Other U.S. Laws that Limit Mercury Exposures:
The Clean Air Act regulates 187 air toxics, including mercury and directs the US EPA to establish technology based standards for certain sources that emit these air toxics and sources are also required to obtain Clean Air Act operating permits and to comply with all applicable standards. On December 16, 2011, US EPA issued the Mercury and Air Toxics Rule, which set technology-based emissions limitation standards for mercury and other toxic air pollutants, reflecting levels achieved by the best-performing sources currently in operation. The rules marks the national standards for mercury emissions from coal-fired power plants in the US.
Under the Clean Water Act, states adopt water quality standards for their rivers, streams, lakes, and wetlands. These standards identify levels for pollutants, including mercury that must be met in order to protect human health, fish, and wildlife. No person may discharge pollutants, including mercury, into waters unless the person has a permit. Under the Act, either US EPA or states issue permits, which must include limits that ensure the water quality standards are met. In addition, US EPA and states issue information to the public on waters contaminated with mercury and on the harmful effects of mercury, identify the mercury sources and reductions needed to achieve water quality standards, and warn people about eating fish containing high levels of methylmercury.
Under the Resource Conservation and Recovery Act (RCRA), the US EPA manages hazardous wastes, including mercury wastes, from the time they are generated, through storage and transportation, to their ultimate treatment and disposal. The US EPA has established treatment and recycling standards that must be met before these wastes can be disposed of. Certain mercury wastes -- mercury-containing household hazardous waste and waste generated in very small quantities -- are exempt from some RCRA hazardous waste requirements. RCRA also sets emission limits for mercury-containing hazardous waste that is combusted. U.S. states are largely responsible for implementing the RCRA program and their requirements can be more stringent than federal requirements; for example, some states have identified specific mercury-containing wastes, such as dental amalgam, as warranting more stringent treatment and disposal.
Under the Safe Drinking Water Act, the US EPA sets standards for drinking water that apply to public water systems. These standards protect people by limiting levels of mercury and other contaminants in drinking water. Mercury contamination in drinking water can come from erosion of natural deposits of mercury, discharges into water from refineries and factories, and runoff from landfills and cropland. U.S. states have the primary responsibility for enforcing drinking water standards.
Mercury Regulations and Standards:
Regulations and standards issued by the US EPA for mercury include:

DRAFT DOCUMENT OF THE IDENTIFICATION TASK TEAM
24
- In 2013, a final rule to reduce toxic air emissions (including mercury) from industrial, commercial and institutional boilers and process heaters;
- In 2012, a significant new use rule (SNUR) which requires notification before manufacture, import, or processing of mercury in barometers, manometers, hygrometers and psychrometers;
- In 2011, the first national standards for mercury pollution from power plants;
- In 2010, a final rule to limit emissions of mercury and other toxics from Portland cement plants;
- In 2010 a final SNUR which requires notification before manufacture, import or processing of mercury used in flow meters, natural gas manometers and pyrometers;
- In 2007, a final national emission standard for hazardous air pollutants (including mercury) rule for electric arc furnaces and steel making facilities;
- In 2007, a SNUR for import or processing of elemental mercury for use in convenience light switches, anti-lock brake systems, and active ride control switches in certain motor vehicles;
- In 2005, a direct final rule amending the work practice requirements for materials certification and scrap selection and inspection programs;
- In 2004, a regulation to control emissions from iron and steel foundries;
- In 2003, a final rule to reduce toxic air pollutants from mercury cell chlor-alkali plants;
- Universal Waste Regulations, which streamline the collection requirements for certain wastes, including mercury containing batteries, pesticides, lamps and thermostats;
- Solid Waste Combustion Rules, which establish air emission regulations for municipal waste combustors; hospital, medical and infectious waste incinerators; and commercial and industrial solid waste incinerators; and
- Land Disposal Regulations, which aim to minimize hazards from the land disposal of hazardous wastes by setting treatment standards for mercury that must be achieved before disposal;
Internationally, the US is actively engaged in a number of international activities related to mercury pollution. The US is a Party to the Protocol on Heavy Metals to the United Nations Economic Commission for Europe’s Convention on Long-Range Trans-boundary Air Pollution (LRTAP), to reduce emissions of mercury, lead and cadmium from industrial sources, combustion processes and waste incineration. In addition, the US was the first country to join the Minamata Convention on Mercury, and is engaged in activities leading up the implementation of the Convention. These include participating on a technical expert group developing guidance to be adopted by the Conference of the Parties on the control of emissions from coal-fired power plants and industrial boilers, certain industrial facilities related to cement and non-ferrous metals production, and waste incineration facilities. Similarly, under the United Nations Environment Program (UNEP) Global Mercury Partnership, the US is actively engaged in multiple areas, including leading the partnerships related to mercury in products and mercury reduction in chlor-alkali.
Previous Great Lakes Specific Activities:
Mercury was identified as a Level I substance under the Canada – United States Great Lakes Binational Toxics Strategy, for which Canada and the US established challenge goals of seeking, by 2000, a 90% reduction in the release of mercury and seeking, by 2006, a 50% reduction in the release and deliberate use of mercury, respectively (GLBTS, 2010). Both Canada and the US were successful in achieving their

DRAFT DOCUMENT OF THE IDENTIFICATION TASK TEAM
25
challenge goals, through the implementation of the federal activities including those described above. (GLBTS, 2010)
Under the Great Lakes Regional Collaboration (GLRC), the Great Lakes Mercury Emission Reduction Strategy was finalized in December 2010 (GLRC, 2010). The Emission Reduction Strategy contained 34 recommendations for reducing mercury emissions in seven source sectors, as well as cross-cutting actions to track progress of implementation (GLRC, 2010).
As of 2014, 75% of the Emission Reduction Strategy recommendations are currently completed or are ongoing across the eight Great Lakes states (GLRC, 2014). Overall, the Great Lakes States have been most successful in implementing the recommendations related to Portland cement manufacturing, metals production and fossil fuel electric power generation (GLRC, 2014)
Under the GLRC, the Great Lakes Mercury in Products Phase down Strategy was finalized in 2008, and outlined 60 recommendations for reducing mercury emissions in five selected products and sectors (GLRC, 2013).
Overall, the Great Lakes states have been most successful in implementing the recommendations related to thermometers (79%), followed by households (71%) and schools (70%). The Great Lakes states have completed 69% of the recommendations for steel manufacturing, scrap metal melting facilities, and scrap yards; 68% of the recommendations related to thermostats; and 66% of the recommendations related to lamps. Collectively, the Great Lakes states have implemented 58% of the recommendations for heavy industry; 53% of the recommendations related to cross-cutting strategies; 50% of the recommendations for switches, relays, and measurement and control devices; and 42% of the recommendations for dental amalgam. The states have had limited success in implementing the three recommendations for health care, however, with only 25% of the recommendations completed for this sector (GLRC, 2013).
Provincial and State - Level Actions:
In Ontario, mercury is a prescribed toxic substance set out in Regulation 455/09 under the Ontario Toxics Reduction Act (OMOECC, 2014). The OTRA requires that regulated manufacturing and mineral processing facilities which use or create prescribed toxic substances:
- Undertake toxic substance accounting (i.e. track and quantify the prescribed toxic substances they use and create);
- Prepare and make publically available a reduction plan to reduce the use and creation of prescribed toxic substances; and
- Submit an annual report to the Government regarding implementation of the plan and make some of this information available to the public (note: implementation of the reduction plan is voluntary and is not required under the Act);
- As of 2014, there were 32 facilities reporting on mercury under the OTRA, 11 of which had implemented plans for reduction.
In Illinois, state regulations are in place with regards to mercury releases from hazardous waste and the federal MACT rules and wastewater treatment permit limits are implemented where appropriate. Additionally, a number of initiatives to address mercury containing products have been implemented, including a phase-out of the sale of mercury fever thermometers and mercury novelty products, of electrical switches and relays (with exceptions), and of mercury and mercury containing products in public schools (K-12) (ECOS, 2012).

DRAFT DOCUMENT OF THE IDENTIFICATION TASK TEAM
26
In Indiana, state regulations are in place on mercury releases from sewage sludge incinerators, hazardous waste, municipal solid waste incinerators, medical waste incinerators, cement kilns and broken mercury-containing products and spills. Additionally, the federal MACT for commercial and industrial solid waste incinerators had been adopted. Finally, the statewide sale of mercury containing thermometers and novelties has been phased out and a number of mercury waste and mercury-containing product collection programs have been implemented. Activities are coordinated through a state-level mercury reduction strategy (ECOS, 2012)
In Michigan, state regulations are in place for mercury releases from wastewater treatment and industrial facilities, municipal waste incinerators and medical waste incinerators. Air permits for certain sources, such as shredders and sewage sludge incinerators also include mercury specific limits or best-management practices requirements. Additionally, a number of initiatives to address mercury containing products have been implemented, including a mercury-free purchasing policy for state procurement and phase-outs for mercury containing thermometers and of mercury and mercury containing products in public schools (K-12). Activities are coordinated through a state-level mercury reduction strategy (ECOS, 2012).
In Minnesota, state regulations are in place for mercury releases from wastewater treatment, municipal solid waste incinerators, medical waste incinerators, and broken mercury-containing products and spills. Also, a number of initiatives to address mercury containing products have been implemented, including a phase-out of the sale of mercury-containing dairy barn manometers, toys, games, thermometers, inks, pigments, dyes, paints, fungicides, switches in tax-exempt wearing apparel as well as a ban on all mercury containing product disposal in solid waste. Additionally, it is mandatory to remove all mercury switches from end-of-life vehicles and voluntary removal from on the road passenger vehicles is promoted. Activities are coordinated through a state-level mercury reduction strategy. Activities are coordinated through a state-level mercury reduction strategy (ECOS, 2012; MPCA, 2014).
In New York, state regulations are in place for mercury releases from electric arc furnaces, steel recycling facilities, wastewater treatment, hazardous wastes, municipal solid waste incinerators, and spills. Additionally, the use and possession of non-encapsulated mercury is prohibited and standards for the recycling of dental amalgam waste are in effect. Also, a number of initiatives to address mercury containing products have been implemented, including a mercury-free purchasing policy for New York schools and prohibiting the sale of mercury containing novelties, thermometers and batteries (which exceed allowable mercury amounts) as well as the incineration of mercury-added products. . Activities are coordinated through a state-level mercury reduction strategy (ECOS, 2012; NYSDEC, 2014).
In Ohio, state-level activities include bans / phase-outs in place for measuring devices, novelty items, toys, and for switches and relays, as well as voluntary programs to address dental mercury and coordination with the medical community to address mercury waste management issues (ECOS, 2012).
In Pennsylvania state regulations are in place for mercury releases from wastewater treatment plants and case-by-case emission limits are required through air permits on new and minor emission sources. Also, a number of initiatives to address mercury containing products have been implemented, including a state-level Universal Waste Rule which applies to mercury devices and voluntary collection programs for elemental mercury and mercury containing products from schools, dental offices, farms, non-profits and individuals (ECOS, 2012).
In Wisconsin state regulations are in place for industrial mercury releases from coal-fired power plants and wastewater treatment facilities. Also, a number of initiatives to address mercury containing products have been implemented, including community mercury reduction programs focused on

DRAFT DOCUMENT OF THE IDENTIFICATION TASK TEAM
27
medical, dental, auto switch and dairy farming products as well as voluntary mercury collection programs for elemental mercury, mercury waste and mercury containing products (ECOS, 2012).
Identification of Gaps in Management and/or Science Activities:
(1) Are environmental levels below applicable benchmarks and are there any discernable environmental trends?
- Concentrations of mercury still exceed applicable guidelines in sediment in Lakes Erie and Ontario and concentrations across all of the lakes in some sport fish species warrant long-standing fish consumption advisories, due to fillet mercury concentrations;
- Long-term declines in concentrations have been observed in the environmental media of the Great Lakes basin; however, rates of decline have slowed considerably and in some cases (e.g. Lake Erie walleye, herring gull eggs) have stabilized;
(2) Is the GLB-relevant human health exposure being adequately addressed?
- The primary source of human exposure to mercury is through the consumption of fish and other seafood and presently concentrations of mercury in some Great Lakes sport fish exceed relevant federal and provincial/state guidelines and result in fish consumption advisories;
- Therefore, it is reasonable to expect that there are still exposures of concern, from a human health perspective, across the Great Lakes basin, especially when vulnerable populations are considered;
(3) Are applicable/available objectives for the substances being met?
- As described in the report, considerable progress has been made towards reducing anthropogenic releases of mercury in both Canada and the United States, as well as towards reducing levels in the environment of the Great Lakes basin;
- Additionally, both Canada and the US met their respective GLBTS challenge goals for mercury emissions;
(4) If no objectives exist for the substance, is progress being made towards reducing levels in the environment, generating needed data, etc.?
- As per question 3 above;
(5) If progress is not being made, are actions in place to expect progress (e.g., regulations that have yet to take effect);
- Forthcoming actions and regulations in both Canada and the US (described in section 4) should greatly reduce releases from the electrical power generation sector, the largest remaining domestic mercury emission source; however performance will need to be measured via continued monitoring activities;
(6) Gaps in risk management, research or monitoring for the substance (e.g., ongoing releases of concern, knowledge needs, lack of monitoring data) and possible actions that would fill these gaps:
- Noting that actions and regulations to address coal-fired electric generation are forthcoming in Canada and the US and that all coal-fired utility boilers in Ontario have already been shut down, as

DRAFT DOCUMENT OF THE IDENTIFICATION TASK TEAM
28
these actions remain to be implemented across the rest of Canada and the US, until such a time that they enter into force, this should be considered a gap in risk management;
- Noting that Canadian regulations will soon enter into force, there is a need and opportunity to further explore coordinated and collaborative activities with regards to the use and disposal of mercury containing products;
- Exploring opportunities to further reduce respective mercury emissions from remaining domestic industrial sources (e.g. cement and metals manufacturing etc.);
- Knowledge need: continue to monitor long-term trends in air, sediment (with focus on Lake Erie and Ontario) and biota (top-predator and prey fish and herring gull) in order to continue to track long-term trends; explore recent stabilizing trend in some media; track issue of long range atmospheric transport and deposition; and evaluate the performance of existing and forthcoming risk management activities for mercury;
- Knowledge needs: continue research with respect to methylation dynamics; assessing the differential influence and impacts of mercury in the nearshore and offshore environment; and how changes in food-web dynamics, deforestation and climate change influence the environmental cycling of mercury in the Great Lakes basin;
Conclusions:
Significant regulatory and non-regulatory activities in both Canada and the US at the federal, state / provincial and local levels have resulted in significant decreases in anthropogenic releases of mercury to the Great Lakes basin and in significant decreases of concentrations of mercury observed in the environmental media of the Great Lakes basin.
Additionally, forthcoming risk management activities in both Canada and the US are expected to begin addressing releases of mercury from two of the largest remaining domestic emission sources: coal-fired utility boilers and the use and disposal of mercury containing products.
However, recent evidence would suggest that the relative contribution of long-range atmospheric transport to deposition of mercury into the Great Lakes from sources outside of North America is increasingly significant. Therefore, conditional on the success of international agreements and efforts, levels in the Great Lakes environment may still routinely exceed benchmarks, particularly for fish.
This being said, there are opportunities to continue promoting projects specific to the Great Lakes basin with respect to the sound disposal of consumer products containing mercury (e.g. education and outreach).
Finally, to better understand and continue tracking the recent stabilization and, in some cases, increases in temporal trends in mercury concentrations in the Great Lakes basin, as well as to continue informing the public with regards to limiting their exposure to mercury through fish consumption advisories, monitoring of mercury in abiotic and, biotic components of the Great Lakes ecosystem should continue.

DRAFT DOCUMENT OF THE IDENTIFICATION TASK TEAM
29
5. Final Recommendation:
With respect to mercury, there was sufficient data and information available to effectively apply the Binational Considerations, and based on their application of the considerations, the ITT has unanimously recommended that Mercury be designated as a CMC.
DRAFT DOCUMENT OF THE IDENTIFICATION TASK TEAM
30
6. References:
A. Dove, B. Hill, P. Klawunn, J. Waltho, S. Backus and R.C. McCrea. 2012. Spatial distribution and trends of total mercury in waters of the Great Lakes and connecting channels using an improved sampling technique. Environmental Pollution 161: 328 – 334.
Assembly of First Nations. 2014. First Nations food, nutrition and environment study: Results from Ontario 2011 – 2012. Available from: http://www.fnfnes.ca/docs/FNFNES_Ontario_Regional_Report_2014_final.pdf
B. Monson, D. Staples, S. Bhavsar, T. Holsen, C. Schrank, S. Moses, D. McGoldrick, S. Backus and K. Williams. 2011. Spatiotemporal trends of mercury in walleye and largemouth bass from the Laurentian Great Lakes region. Ecotoxicology 20: 1555 – 1567.
B.Sandheinrich, S. Bhavasar, R. Bodaly and T. Holsen. 2011. Ecological risk of methylmercury to piscivorous fish of the Laurentian Great Lakes. Ecotoxicology 20: 1577 – 1587.
Canadian Council of Ministers of the Environment (CCME). 1999. Canadian sediment quality guidelines for the protection of aquatic life: Mercury. Available from: http://ceqg-rcqe.ccme.ca/download/en/241
Canadian Council of Ministers of the Environment (CCME). 2000. Canadian tissue residue guidelines for the protection of mammalian and avian consumers of aquatic life: Methylmercury. Available from: http://ceqg-rcqe.ccme.ca/download/en/294
Canadian Council of Ministers of the Environment (CCME). 2003. Canadian water quality guidelines for the protection of aquatic life: Mercury. Available from: http://ceqg-rcqe.ccme.ca/download/en/191
C. Marvin, C. Murray, G. Stern, E. Braekevelt, E. Reiner and S. Painter. 2003. Spatial and temporal trends in sediment contamination in Lake Ontario. Journal of Great Lakes Research 29(2): 317 – 331.
C. Marvin and W. Forsythe. 2005. Analyzing the spatial distribution of sediment contamination in the lower Great Lakes. Water Quality Research Journal of Canada 40(4): 389 – 401.
C. Weseloh, D. Moore, C. Herbert, S. Solla, B. Braune, D. McGoldrick. 2011. Current concentrations and spatial and temporal trends in mercury in Great Lakes Herring Gull eggs, 1974 – 2009. Ecotoxicology 20: 1644 – 1658.
D. Carlson and D. Swackhamer. 2006. Results from the U.S. Great Lakes Fish Monitoring Program and effects of lake processes on bioaccumulative contaminant concentrations. Journal of Great Lakes Research 32: 370 – 385.
D. Evers, J. Wiener, C. Driscoll, D. Gay, N. Basu, B. Monson, K. Lambert, H. Morrison, J. Morgan,K. Williams, and A. Soehl. 2011. Great Lakes mercury connections: the extent and effects of mercury pollution in the Great Lakes region. Biodiversity Research Institute Report BRI 2011-18. Available from: http://www.briloon.org/uploads/BRI_Documents/Mercury_Center/Mercury_Connections/GLMC_FinalReport.pdf
Environment Canada (EC). 2010. Website: Major Pollutants: Mercury. Last modified: 2010-04-26. Available from: https://www.ec.gc.ca/mercure-mercury/default.asp?lang=En&n=D64997D2-1
Environment Canada (EC). 2014. Products Containing Mercury Regulations. Available from: http://www.ec.gc.ca/lcpe-cepa/eng/regulations/detailReg.cfm?intReg=203
Environment Canada (EC). 2015. National Pollutant Release Inventory Database. Available from: http://www.ec.gc.ca/inrp-npri/default.asp?lang=En&n=B85A1846-1

DRAFT DOCUMENT OF THE IDENTIFICATION TASK TEAM
31
Environment Canada and Health Canada (EC-HC). 2010. Risk Management Strategy for Mercury. Available from: http://www.ec.gc.ca/doc/mercure-mercury/1241/index_e.htm Environment Canada and the United States Environmental Protection Agency (EC-US EPA). 2009. Great Lakes Binational Toxics Strategy: 2009 Biennial Report. Available from: http://www.epa.gov/bns/
Environment Canada and the United States Environmental Protection Agency (EC-US EPA). 2013. State of the Great Lakes 2011 Technical Indicator Reports. Available from: http://binational.net/solec/sogl2011/sogl-2011-technical-report-en.pdf
Environmental Council of the States (ECOS). 2012. Third Compendium of States’ Mercury Activities- Quicksilver Caucus. Available from: http://www.ecos.org/section/committees/cross_media/quick_silver/third_compendium_of_states_mercury_activities/
E. Prestbo and D. Gay. 2009. Wet deposition of mercury in the U.S. and Canada, 1996 – 2005: Results and analysis of the NADP Mercury Deposition Network. Atmospheric Environment 43: 4223 – 4233.
Government of Ontario, 2009. Ontario Toxics Reduction Act; Available from: http://www.e-laws.gov.on.ca/html/regs/english/elaws_regs_090455_e.htm
Great Lakes Regional collaboration (GLRC). 2008. Great Lakes mercury in products phase down strategy. Available from: http://glrc.us/documents/MercuryPhaseDownStrategy06-19-2008.pdf
Great Lakes Regional Collaboration (GLRC). 2010. Great Lakes mercury emissions reduction strategy. Available from: http://glrc.us/documents/Mercury-Emissions-Reduction-Strategy_07Dec2010.pdf
Great Lakes Regional Collaboration (GLRC). 2013. Great Lakes Mercury in Products Phase-Down Strategy Progress Report. 2013, Available from: http://glrc.us/initiatives/toxics/MercuryPhaseDown.pdf
Great Lakes Regional Collaboration (GLRC). 2014. Great Lakes Mercury Emission Reduction Strategy Progress Report. Available from: http://glrc.us/initiatives/toxics/FINAL_MercuryEmissionsReductionStrategyProgressReport_19Jun2014.pdf
Health Canada (HC). 2010. The first report on human biomonitoring of environmental chemicals in Canada. Available from: http://www.hc-sc.gc.ca/ewh-semt/pubs/contaminants/chms-ecms/index-eng.php
Health Canada (HC). 2013. The second report on human biomonitoring of environmental chemicals in Canada. Available from: http://www.hc-sc.gc.ca/ewh-semt/pubs/contaminants/chms-ecms-cycle2/index-eng.php
J. Wiener, D. Evers, D. Gay, H. Morrison and K. Williams. 2012. Mercury contamination in the Laurentian Great Lakes region: Introduction and overview. Environmental Pollution 161: 243 – 251.
Minnesota Department of Health (MDOH). 2011. Mercury Levels in Blood from Newborns in the Lake Superior Basin. Available from: http://www.health.state.mn.us/divs/eh/hazardous/topics/studies/glnpo.pdf
Minenesota Department of Health (MDOH). 2013. Consumption limits for sensitive populations created for the Protocol for a Uniform Great Lakes Sport Fish Consumption Advisory. Available from: http://www.health.state.mn.us/divs/eh/fish/consortium/index.html
Minnesota Pollution Control Agency (MPCA). 2014. Mercury. Available from: http://www.pca.state.mn.us/index.php/topics/mercury/index.html

DRAFT DOCUMENT OF THE IDENTIFICATION TASK TEAM
32
M. Risch, D. Gay, K. Fowler, G. Keeler, S. Backus, P. Blanchard, J. Barres and J. Dvonch. 2011. Spatial patterns and temporal trends in mercury concentrations, precipitation depths, and mercury wet deposition in the North American Great Lakes region, 2002 – 2008. Environmental Pollution 161: 261 – 271.
National Oceanic and Atmospheric Administration (NOAA). 2007. Report to congress: Mercury contamination in the Great Lakes. Available from: www.arl.noaa.gov/documents/reports/NOAA_GL_Hg.pdf
N. Basu, D. Cryderman, F. Miller, S. Johnston, C. Rogers and W. Plain. 2013. Multiple chemical exposure assessment at Aamjiwnaang. McGill Environmental Health Sciences Lab Occasional Report 2013-1.
Ontario Ministry of Environment and Climate Change (OMOECC). 2014a. Guide to Eating Ontario Sport Fish. Available from: https://www.ontario.ca/environment-and-energy/guide-eating-ontario-sport-fish
Ontario Ministry of the Environment and Climate Change (OMOECC). 2014b. Regulation 455/09 - Ontario Toxics Reduction Act. Available from: http://www.elaws.gov.on.ca/html/regs/english/elaws_regs_090455_e.htm#BK11
S. Bhavsar, E. Awad, C. Nahon and S. Petro. 2011. Great Lakes fish consumption advisories: is mercury a concern? Ecotoxicology 20: 1588 – 1598.
S. Gewurtz, L. Shen, P. Helm, J. Waltho, E. Reiner, S. Painter, I. Brindle and C. Marvin. 2008. Spatial distribution of legacy contaminants in sediments of Lakes Huron and Superior. Journal of Great Lakes Research 34(1): 153 – 168.
T. Zananski, T. Holsen, P. Hopke and B. Crimmins. 2011. Mercury temporal trends in top predator fish of the Great Lakes. Ecotoxicology 20: 1568 – 1576.
United States Environmental Protection Agency (US EPA). 2013. Mercury Homepage. Available from: http://www.epa.gov/mercury/about.htm
United States Environmental Protection Agency (US EPA). 2014. Data from the Great Lakes Fish Monitoring and Surveillance Program: Mercury.
United States Environmental Protection Agency (US EPA). 2015. Data from the National Emissions Inventory: Mercury.

DRAFT DOCUMENT OF THE IDENTIFICATION TASK TEAM
33
Appendix A:
Binational Considerations When Evaluating Candidate Chemicals of Mutual Concern

DRAFT DOCUMENT OF THE IDENTIFICATION TASK TEAM
34
BINATIONAL CONSIDERATIONS FOR IDENTIFYING CANDIDATE CHEMICALS OF MUTUAL CONCERN IN THE GREAT LAKES
BASIN (Box 4. from the Annual Process for Recommending CMCs Flowchart)
Rev
iew
Exi
stin
g Sc
ien
tifi
c D
ata
Is the proposed Substance Present in the Great Lakes Basin?
Great Lakes Monitoring &
Surveillance Data
Environmental Levels & Trends
Chemical Data
(e.g., Use, Release, Exposure)
Is the proposed Substance a Potential Threat to Ecological or Human Health in the Great Lakes Basin?
Environmental & Health Benchmarks Environmental & Health Data
Rev
iew
exi
stin
g ac
tio
ns
and
d
eter
min
e n
eed
s an
d a
vaila
bili
ty f
or
furt
her
act
ion
Review Current Management Status of the proposed Substance (regulatory and voluntary)
CDN and U.S. Federal Chemical
Actions
Provincial and State Actions Stakeholder Actions
Determine whether further efforts regarding the proposed Substance are warranted
Are current chemical
management actions sufficient?
Is further action benefiting the
Great Lakes Basin warranted?
Are resources and tools available
to support efforts?
Identify Management Opportunities
Recommended as a Candidate
Chemical of Mutual Concern
Proposed
Canadian and
U.S. Chemicals
Identify the Reasons for Concern
Report includes a
review of available
information
supporting the
recommendation
Does the proposed substance have additional or other factors to consider or evaluate?
Report may include a
summary of findings
and rationale
Report may include a
summary of findings
and identification of
potential information
gaps
Not Recommended as a Candidate
Chemical of Mutual
Concern
Insufficient Information on which to base a Determination

DRAFT DOCUMENT FOR USE IN THE DELIBERATIONS OF THE IDENTIFICATION TASK TEAM
35
This page intentionally left blank