binary pattern deflectometry - university of arizona · the binary pattern deflectometry technique...
TRANSCRIPT

Binary pattern deflectometry
Guillaume P. Butel,* Greg A. Smith, and James H. BurgeCollege of Optical Sciences, University of Arizona, 1630 E. Univ. Blvd., Tucson, Arizona 85721, USA
*Corresponding author: [email protected]
Received 12 November 2013; revised 3 January 2014; accepted 4 January 2014;posted 10 January 2014 (Doc. ID 201095); published 6 February 2014
Deflectometry is widely used to accurately calculate the slopes of any specular reflective surface,ranging from car bodies to nanometer-level mirrors. This paper presents a new deflectometry techniqueusing binary patterns of increasing frequency to retrieve the surface slopes. Binary Pattern Deflectom-etry allows almost instant, simple, and accurate slope retrieval, which is required for applications usingmobile devices. The paper details the theory of this deflectometry method and the challenges of itsimplementation. Furthermore, the binary pattern method can also be combined with a classic phase-shifting method to eliminate the need of a complex unwrapping algorithm and retrieve the absolutephase, especially in cases like segmented optics, where spatial algorithms have difficulties. Finally,whether it is used as a stand-alone or combined with phase-shifting, the binary patterns can, withinseconds, calculate the slopes of any specular reflective surface. © 2014 Optical Society of AmericaOCIS codes: (120.3940) Metrology; (120.5050) Phase measurement; (120.3930) Metrological
instrumentation; (120.6650) Surface measurements, figure.http://dx.doi.org/10.1364/AO.53.000923
1. Introduction
Deflectometry is used in a wide range of metrologyapplications, such as: plastic lens and car body in-spection with sub-micrometer level accuracy [1],aspheric optic metrology to nanometer-level accuracy[2,3], and evenmeasurements accurate to fractions ofa nanometer for x-ray mirrors [4]. A deflectometryapparatus consists of digital display and camera,which are used to measure the slopes of a specularreflective surface by triangulation [1–9]. Phase-shifting the displayed pattern is commonly usedto reach sub-pixel level accuracy and fast dataacquisition [5]. To unwrap the phase, it is commonpractice to use spatial phase unwrapping techniques[10]. Spatial phase unwrapping uses neighboringpixels to reconstruct the true phase from thewrapped phase [11–15]; however, computationalpower (desktop or laptop) is needed because thealgorithms are complex. Furthermore, noise sensitiv-ity [10] and phase discontinuities make spatial phase
unwrapping even more difficult. However, temporalphase unwrapping techniques can also be used in de-flectometry. Temporal phase unwrapping algorithmsuse a series of pictures spaced in time to locate the�−π; π� zones and apply the correct offset [16–25].Various patterns are used, such as: binary patterns(or gray-code) [20–25] (common in 3D shapemeasurement [16–25]), color codes [18], or phasemarkers [17].
In this paper, we show that temporal phaseunwrapping in deflectometry using binary patternsis advantageous for portable devices because it allowsus to work around aspects out of our control such as:low computational power, automatic gain control,boundary errors, and matrix multiplication. As astand-alone method, binary pattern deflectometryworks very well on portable devices. However, weexpand the binary technique and show that wecan improve the measurement’s accuracy by combin-ing binary patterns with sinusoidal patterns andstill retrieve the phase and surface slopes within sec-onds. An overview of this hybrid phase-shiftingmethod and experimental results are presented inSection 3.
1559-128X/14/050923-08$15.00/0© 2014 Optical Society of America
10 February 2014 / Vol. 53, No. 5 / APPLIED OPTICS 923
2. Binary Patterns Theory and Implementation forDeflectometry
The binary pattern deflectometry technique displayson the screen a sequence of increasing frequencybinary patterns, allowing us to find which pixel onthe screen illuminates a given pixel on the mirror.A simple, yet powerful idea is to illuminate thescreen pixel by pixel, then determine which mirrorpixel is associated with the screen pixel being lit.This is, in essence, the original idea of a fast andlow-cost deflectometry measurement proposed bySu et al. in [5]. However, this process is very slow be-cause of the large number of pictures required. Amuch faster solution uses binary code.
The principle of this method is to create a uniquebinary code for each individual pixel on the mirrorthat uniquely registers it to a screen pixel location.The idea of uniquely encoding an object using phaseiswidely described inmany domains and applicationslike security encryption [26]. If we were lightingseveral pixels on the display screen at the same time,several mirror pixels would have the same code orsignature. We call this ambiguity. The goal of thismethod is to avoid any ambiguous pixels so that wedo not need to unwrap the phase. This methodachieves a registration between the location of agiven mirror pixel and a location on the screen, byassociating a sequence of binary patterns, thatisolates a unique screen region. As the frequencyincreases, the size of the screen region decreases toreach, at the highest frequency, a unique pixel-to-pixel correspondence.
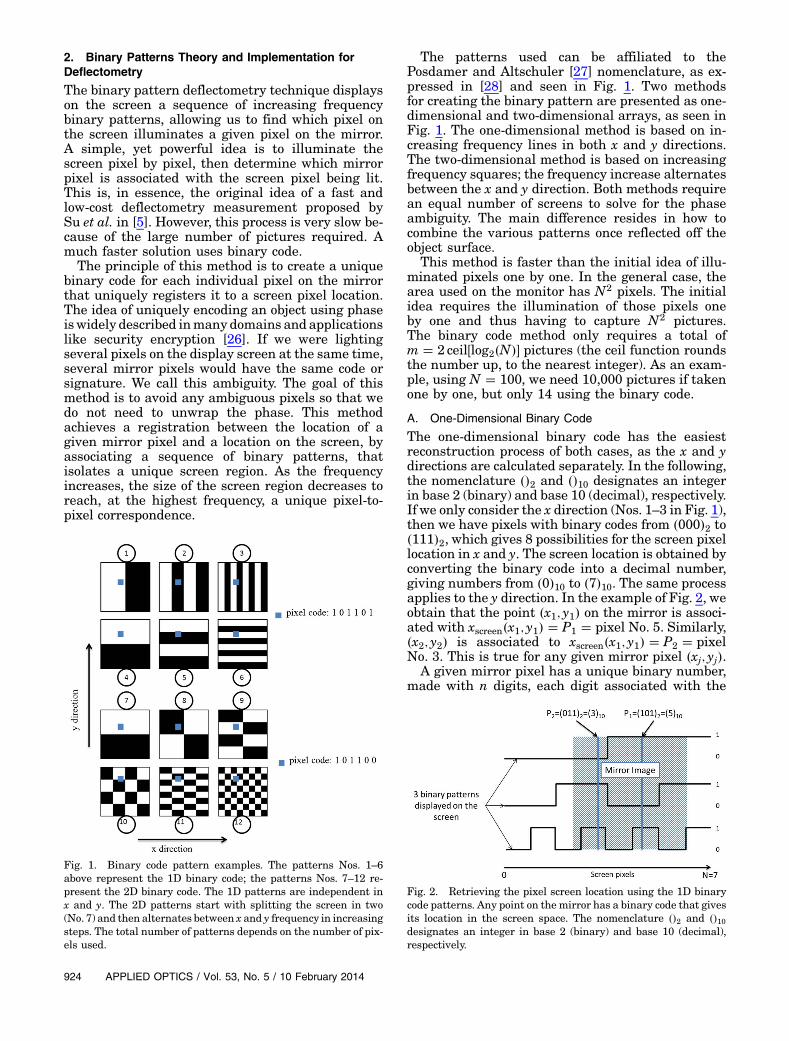
The patterns used can be affiliated to thePosdamer and Altschuler [27] nomenclature, as ex-pressed in [28] and seen in Fig. 1. Two methodsfor creating the binary pattern are presented as one-dimensional and two-dimensional arrays, as seen inFig. 1. The one-dimensional method is based on in-creasing frequency lines in both x and y directions.The two-dimensional method is based on increasingfrequency squares; the frequency increase alternatesbetween the x and y direction. Both methods requirean equal number of screens to solve for the phaseambiguity. The main difference resides in how tocombine the various patterns once reflected off theobject surface.
This method is faster than the initial idea of illu-minated pixels one by one. In the general case, thearea used on the monitor has N2 pixels. The initialidea requires the illumination of those pixels oneby one and thus having to capture N2 pictures.The binary code method only requires a total ofm � 2 ceil�log2�N�� pictures (the ceil function roundsthe number up, to the nearest integer). As an exam-ple, using N � 100, we need 10,000 pictures if takenone by one, but only 14 using the binary code.
A. One-Dimensional Binary Code
The one-dimensional binary code has the easiestreconstruction process of both cases, as the x and ydirections are calculated separately. In the following,the nomenclature ��2 and ��10 designates an integerin base 2 (binary) and base 10 (decimal), respectively.If we only consider the x direction (Nos. 1–3 in Fig. 1),then we have pixels with binary codes from �000�2 to�111�2, which gives 8 possibilities for the screen pixellocation in x and y. The screen location is obtained byconverting the binary code into a decimal number,giving numbers from �0�10 to �7�10. The same processapplies to the y direction. In the example of Fig. 2, weobtain that the point �x1; y1� on the mirror is associ-ated with xscreen�x1; y1� � P1 � pixel No. 5. Similarly,�x2; y2� is associated to xscreen�x1; y1� � P2 � pixelNo. 3. This is true for any given mirror pixel �xj; yj�.
A given mirror pixel has a unique binary number,made with n digits, each digit associated with the
Fig. 2. Retrieving the pixel screen location using the 1D binarycode patterns. Any point on the mirror has a binary code that givesits location in the screen space. The nomenclature ��2 and ��10designates an integer in base 2 (binary) and base 10 (decimal),respectively.
Fig. 1. Binary code pattern examples. The patterns Nos. 1–6above represent the 1D binary code; the patterns Nos. 7–12 re-present the 2D binary code. The 1D patterns are independent inx and y. The 2D patterns start with splitting the screen in two(No. 7) and then alternates between x and y frequency in increasingsteps. The total number of patterns depends on the number of pix-els used.
924 APPLIED OPTICS / Vol. 53, No. 5 / 10 February 2014

value obtained in the picture (0 or 1). The conversionof this binary number into a decimal number willgive the screen location xscreen�xj; yj� in unit of pixels.To get the real distance xscreen�xj; yj� in meters, thescreen has to be located in the coordinate systemof the mirror and the camera, and the pixels con-verted to meters using the pixel pitch. Equation (1)shows the calculation:
xscreen�xj; yj� � ��Pj�10 �Rj�pitch;∀ �xj; yj� ∈ Mirror; (1)
where Rj is the offset in pixels from the y axis tothe edge of the area of patterns display (Fig. 3)and “pitch” the pixel pitch. A similar formulaexists for yscreen�xj; yj�, using Tj for the offset fromthe x axis.
B. Two-Dimensional Binary Code
For the 2D pattern, we do not treat each directionindependently. The sequence of patterns shown inFig. 1 (Nos. 7–12) could be arranged differently,yet we would still follow the same path as the onewe will present now. There are N2 pixels used onour monitor and m � 2n � 2 ceil�log2�N�� picturesto be taken. To design the patterns, the number oflighted squares (or rectangles) has to be calculated.The numbers of squares in x�Nx� and y�Ny� vary
whether the pattern index i is odd or even, as shownin Eq. (2):
if i odd�Nx � 2floor�i∕2�
Ny � 2floor�i∕2��1
if i even�Nx � 2floor�i∕2�
Ny � Nx; (2)
where the floor function rounds a number down tothe nearest integer. We only have squares when iis even, because Ny � Nx. For an odd i, the x fre-quency is double the y frequency because Ny � 2Nx.
When we display those patterns onto the monitor,the camera will see their reflection from the mirrorand, thus, each mirror pixel will have a sequence of 0and 1 that registers it to a unique screen pixel. Usingmatrix multiplication, we can isolate the screen pixelfor each mirror pixel and have a map of the screenlocations, as shown in Eq. (3).
Sx0;y0 �Ymi�1
�U −Mi�1−αi �Mi�αi ; (3)
where Sx0;y0 is the final matrix we obtained after miterations for the mirror pixel �x0; y0�, Mi the N2 ma-trix representing the pattern displayed on the screenat the ith step of the iteration, αi the value of the mir-ror pixel in the ith picture (0 or 1), andU the unityN2
matrix filled with 1. If αi is 1, then thematrixMi usedis the same as the one displayed on the screen; how-ever, if αi is 0, we mirror the matrix using the unitymatrixU to turn 0 into 1 and vice-versa. We multiplysuccessively the screen patterns that were displayedwhen the pictures were taken to be able to associate amirror pixel �x0; y0� to a screen location. The resultwe obtain for Sx0;y0 is a matrix with a single white(value 1) pixel. This final matrix represents theunique screen pixel that illuminated the mirror pixelwhen the data was acquired. Therefore, we have amirror pixel �x0; y0� associated with one screen pixel,whose coordinates can be retrieved by reading thecoordinates of the white pixel in Sx0;y0 .
The single white pixel in Figs. 4 and 5 has thexscreen and yscreen information in unit of display pixels
Fig. 3. Screen coordinates calculation in the 1D case. The pointsPj are located on the area of patterns display thanks to their binarycode and we calculate xscreen using Rj and the pixel pitch.
Fig. 4. Example of pixel-to-pixel multiplication used to sequentially isolate a screen pixel (a white pixel means 1 and a black pixel 0). Thetop row represents the pictures taken by the camera, the bottom row the matrix multiplication process. In this example, we consider amirror pixel �x0; y0�. Based on the first picture, the value at �x0; y0� is 1, so the matrix used in the product defined in Eq. (3) isM1. Using thesecond picture (i � 2), α2 � 0 so the matrix used is (U −M2). The intermediate product is, thus, M1�U −M2�. The same process goes untilwe reach i � m (m � 6 here).
10 February 2014 / Vol. 53, No. 5 / APPLIED OPTICS 925

for a single mirror pixel �x0; y0�. This process has tobe repeated for every mirror pixel in the picturestaken by the camera. Similar to the 1D case, a changeof coordinate system and unit conversion have to beperformed to be able to obtain the xscreen�xj; yj� andyscreen�xj; yj� in meters for any mirror pixel �xj; yj�,using Eq. (1).
The calculation process is found to be a bit slowerwith the 2D algorithm (from 20 s to a minute), andthe matrix multiplication is more computationallyintensive. The 1D algorithm is almost instantaneous,usually less than a second.
C. Implementation of the Binary Patterns Method
When used in a real system, the binary patterns arestrongly affected by the camera’s modulation trans-fer function (MTF). The MTF alters the high fre-quency in a signal; however, turning the perfectbinary shapes into round-edged shapes (Fig. 6) andsetting up an efficient threshold is more difficult.With the wide variety of cameras and monitors avail-able to acquire the data, other problems can occur,like nonlinearity and saturation. The threshold thusneeds to be adjusted very carefully. This is a ratherdifficult process, especially if the algorithm has to
be automated without the user’s intervention. Toprevent this pitfall, a better algorithm, called“shifted binary patterns,” is introduced. It requiresmore pictures to be taken, but it is more robustagainst the errors at the binary boundaries.
The algorithm creates an undetermined, or inter-mediate region, separated by two threshold values,as shown in Fig. 7. The pictures then becomeseparated into three regions, with the pixels in theintermediate region to be determined. The minimum“Min” is obtained by averaging a picture illuminatedby a “black” display and the maximum “Max” byaveraging a picture illuminated by a “white” display.
To achieve this goal, we use a different set of im-ages that depict the same binary patterns shifted byhalf a period: the period being the size of a binarystructure in the highest frequency binary pattern.Figure 8 shows the shifted binary pattern, as wellas a profile along the y axis. A similar idea has beenpresented by Zhang et al. [24], but they used a higherfrequency complementary binary pattern. Here, weare using the same frequency pattern, but shiftedin space. Their technique is developed for profilome-try and seems to work well in that case. However,when applying their algorithm for our deflectometrypurposes, some phase errors were found at the boun-daries of the binary patterns.
The pixels that belong to the intermediate regionfor the first set of images will not be undeterminedfor the shifted set of images and can, thus, be usedas data in the slopes maps. Two slopes maps, oneper binary patterns set, have to be computed. Thesecondmap, generated from the shifted patterns, willbe used to fill the gaps of the main one. The shift off-set has to be taken into account when calculating thesecond map to obtain the real values. As shown inFig. 9, any white pixels in the left map will be usingthe value of the corresponding pixel in the middlemap. The result is the map on the right of Fig. 4,where all the white pixels have disappeared butone, certainly due to noise. This map representsthe xscreen�x; y� values for any mirror pixel �x; y�.The slopes of the mirror can then be calculated usingthe approximation
Fig. 5. Screen coordinates calculation in the 2D case. The matrixmultiplication isolates a single pixel that gives the coordinates xand y for the mirror pixel �x0; y0�. xscreen�xj; yj� and yscreen�xj; yj� areobtained using Eq. (1) that changes the coordinates of the pixellocation from the original matrix Sx0 ;y0 to a real space coordinatesystem.
Fig. 6. Real data from a spherical mirror. The picture (left) clearly shows the different zones. The y-profile (right) displays a cross sectionof the picture.
926 APPLIED OPTICS / Vol. 53, No. 5 / 10 February 2014

XSlopes�x;y� � 12zs
�xmirror�x;y�− xscreen�x; y��
� 12zc
�xmirror�x; y�− xcamera�x;y��; (4)
where zs and zc are the distances from the mirror tothe display screen and to the camera, respectively(similar for YSlopes�x; y�). Equation (4) assumesthe sag is much smaller than the distance betweenthe mirror and the screen, and that the viewing an-gles between camera, mirror, and screen are small.
If the intermediate region is bigger than the size ofthe shift, then the process breaks down. This hap-pens when using patterns with frequencies not farfrom the cutoff frequency and for noisy environ-ments. In most cases, the histogram of a picture willshow that only a few numbers of pixels will belong tothe intermediate region and, thus, this region, eventhough wide in intensity counts (Fig. 7), is narrow inactual pixels, and much smaller than the size of awhite/black stripe.
This method is extremely fast (less than a second)because the slopes are directly obtained from the pic-tures. Their accuracy is built up bit-by-bit, by addinghigher frequency binary patterns. The total timeneeded to obtain the slopes maps is the time neededto take the pictures; processing the data is instanta-neous. Furthermore, there are no ambiguities in themaps, because of the unique mapping performed bythe binary patterns.
D. Limitations of a Binary Code Method
As demonstrated above, it is possible to obtain slopesmaps using purely binary patterns. However, twomain limitations to this method remain. The firstone is the mapping accuracy. The algorithm cannotmap a mirror pixel to an area on the display smaller
than a screen pixel, as the calculated location cannotbe smaller than a pixel. At the theoretical limit, wehave a one-to-one mapping, but we cannot do betterthan 1 pixel in the screen space.
The falling contrast that is experienced in thepictures taken by the camera represents the secondlimitation. As seen in Fig. 10, the theoretical limitbased on screen resolution, is for pattern No. 14; how-ever, the contrast has already fallen to 0 since pat-tern number 11. The first limitation thus becomesirrelevant due to the MTF of the system, and themethod is therefore limited by the MTF of thecamera.
To improve accuracy to about 1∕100th pixel, we canuse the binary code together with phase-shifting, asphase-shifting can reach sub-pixel accuracy [29].This process of combining binary code and phase-shifting is presented in the following section.
3. Direct Application: Phase Unwrapping Elimination
A. Implementation of the Hybrid Method
Combining binary patterns and phase-shifting iscommonly used in profilometry [20–25], and wasoriginally introduced by Bergmann [23]. In deflec-tometry, this combining technique has not been usedas an unwrapping technique because the fringes andthe binary patterns are not in focus. The critical as-pect of such a technique is matching the boundariesof the binary patterns to end points of a sine waveperiod.
In Fig. 10, each pattern index (on the x axis) isrelated to a frequency in x and y directions thatcan be calculated at every step. The binary code al-lows us to locate small areas on the screen, ratherthan individual pixels. The phase-shifting can deter-mine a wrapped (and incomplete) phase value forevery pixel. In the following, we show that the un-wrapping ambiguity can be overcome using thebinary method. The binary code provides an offsetmap K at a given frequency. K is calculated by binarycode conversion or matrix multiplication dependingon the binary code patterns. K only contains integervalues ranging between 0 and p-1, where p beingthe total number of sine wave periods. It can besummarized with the formula
Fig. 7. Two thresholds now create an undetermined regionbetween the 0 and 1 regions, with Δ � ��Max −Min�∕5�.
Fig. 8. Shifted binary patterns. The shifted mirror picture (middle) depicts a shift of half the size of a white stripe compared with mirrorpicture from Fig. 6 (left, for reference). The profile (right) shows a cross section of the shifted patterns picture.
10 February 2014 / Vol. 53, No. 5 / APPLIED OPTICS 927

Φtrue�x; y� � Φwrapped�x; y� � 2K�x; y�π∀ �x; y� ∈ Mirror:
(5)
To correctly use the binary code information, thebinary patterns are aligned in space with the sinewaves, as shown below in Fig. 11. The frequency ofthe sine wave is determined by the desired contrast.
As stated in Section 2, two methods can be usedto obtain K , one-dimensional or two-dimensional.Figure 4 shows the one-dimensional procedure. Theonly difference from Section 2 is that we stop thebinary process retrieval at the frequency/contrastvalue chosen from Fig. 10 to give nonzero contrast.Since the sine wave locations match the offset zonesin space (Fig. 11), the obtained phase offsets will becorrect. Once we know K, we can recover the truephase Φtrue, for any point on the mirror usingEq. (5). The screen location can be calculated as ascaled version of the phase, as shown in Eq. (6):
xscreen�x; y� �Φx
true�x; y�2pπ
N; (6)
where Φxtrue is the phase for the x direction, N is the
total number of screen pixels, and p the total numberof sine periods used (similar equation for yscreen�x; y�).Equation (2) is then used to calculate the slopes ofthe mirror.
B. Experimental Results
We tested a spherical mirror using binary codecombined with phase-shifting and compared the re-sults with using phase-shifting alone. The mirrorwas masked to show how algorithms can unwrapthe phase in the case of segmented optics, wherethe mirror is only composed of “islands” of data.The results show the phase maps in x and y direc-tions. The raw data used in both cases is the same,but the unwrapping algorithm is different: temporal(binary) or spatial [15]. The 2D binary algorithm hasbeen used for the mirror under test.
The mirror is spherical, has a radius of curvatureof 203.2 mm, and its f number is 2. The experimentwas performed with a laptop camera and a laptopmonitor (Fig. 12), placed at a distance of 220 mm.8-period sine waves were used for the phase-shiftingpatterns. The displayed phase, therefore, goes from 0to 16π rad. The true phase seen on the mirror can gofrom 0 to 16π rad but its range is usually smaller, asthe mirror magnifies the object.
Figure 13 shows the phase maps obtained from theexperiment. Map (a) shows the difference betweenthe full and segmented mirrors, both spatially
Fig. 9. Mirror maps representing the screen coordinates forstandard (left), shifted (middle) patterns, and final map (right).The white lines show the intermediate regions.
Fig. 10. Contrast obtained in the pictures taken by the camera.
Fig. 11. Matching the square wave to the sine wave gives thecorrect offsets in decimal. Multiplying the offset values by 2π andadding them to the wrapped phase will give the true phase. In thisexample, K has 4 different values, �0�10, �1�10, �2�10, and �3�10.
Fig. 12. Experimental setup. The patterns are displayed on thescreen (left) and reflected off the mirror (right). Part of the mirrorwas masked to simulate a segmented mirror (close-up). Thecamera (left) takes pictures.
928 APPLIED OPTICS / Vol. 53, No. 5 / 10 February 2014
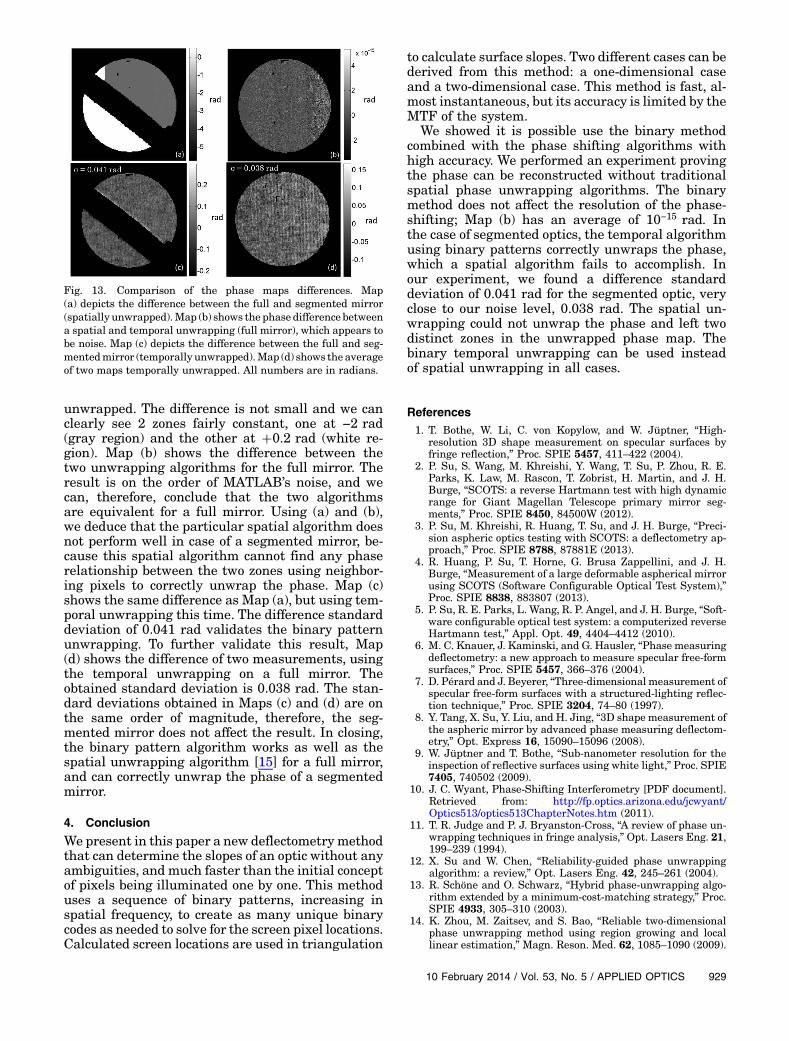
unwrapped. The difference is not small and we canclearly see 2 zones fairly constant, one at −2 rad(gray region) and the other at �0.2 rad (white re-gion). Map (b) shows the difference between thetwo unwrapping algorithms for the full mirror. Theresult is on the order of MATLAB’s noise, and wecan, therefore, conclude that the two algorithmsare equivalent for a full mirror. Using (a) and (b),we deduce that the particular spatial algorithm doesnot perform well in case of a segmented mirror, be-cause this spatial algorithm cannot find any phaserelationship between the two zones using neighbor-ing pixels to correctly unwrap the phase. Map (c)shows the same difference as Map (a), but using tem-poral unwrapping this time. The difference standarddeviation of 0.041 rad validates the binary patternunwrapping. To further validate this result, Map(d) shows the difference of two measurements, usingthe temporal unwrapping on a full mirror. Theobtained standard deviation is 0.038 rad. The stan-dard deviations obtained in Maps (c) and (d) are onthe same order of magnitude, therefore, the seg-mented mirror does not affect the result. In closing,the binary pattern algorithm works as well as thespatial unwrapping algorithm [15] for a full mirror,and can correctly unwrap the phase of a segmentedmirror.
4. Conclusion
We present in this paper a new deflectometry methodthat can determine the slopes of an optic without anyambiguities, and much faster than the initial conceptof pixels being illuminated one by one. This methoduses a sequence of binary patterns, increasing inspatial frequency, to create as many unique binarycodes as needed to solve for the screen pixel locations.Calculated screen locations are used in triangulation
to calculate surface slopes. Two different cases can bederived from this method: a one-dimensional caseand a two-dimensional case. This method is fast, al-most instantaneous, but its accuracy is limited by theMTF of the system.
We showed it is possible use the binary methodcombined with the phase shifting algorithms withhigh accuracy. We performed an experiment provingthe phase can be reconstructed without traditionalspatial phase unwrapping algorithms. The binarymethod does not affect the resolution of the phase-shifting; Map (b) has an average of 10−15 rad. Inthe case of segmented optics, the temporal algorithmusing binary patterns correctly unwraps the phase,which a spatial algorithm fails to accomplish. Inour experiment, we found a difference standarddeviation of 0.041 rad for the segmented optic, veryclose to our noise level, 0.038 rad. The spatial un-wrapping could not unwrap the phase and left twodistinct zones in the unwrapped phase map. Thebinary temporal unwrapping can be used insteadof spatial unwrapping in all cases.
References1. T. Bothe, W. Li, C. von Kopylow, and W. Jüptner, “High-
resolution 3D shape measurement on specular surfaces byfringe reflection,” Proc. SPIE 5457, 411–422 (2004).
2. P. Su, S. Wang, M. Khreishi, Y. Wang, T. Su, P. Zhou, R. E.Parks, K. Law, M. Rascon, T. Zobrist, H. Martin, and J. H.Burge, “SCOTS: a reverse Hartmann test with high dynamicrange for Giant Magellan Telescope primary mirror seg-ments,” Proc. SPIE 8450, 84500W (2012).
3. P. Su, M. Khreishi, R. Huang, T. Su, and J. H. Burge, “Preci-sion aspheric optics testing with SCOTS: a deflectometry ap-proach,” Proc. SPIE 8788, 87881E (2013).
4. R. Huang, P. Su, T. Horne, G. Brusa Zappellini, and J. H.Burge, “Measurement of a large deformable aspherical mirrorusing SCOTS (Software Configurable Optical Test System),”Proc. SPIE 8838, 883807 (2013).
5. P. Su, R. E. Parks, L. Wang, R. P. Angel, and J. H. Burge, “Soft-ware configurable optical test system: a computerized reverseHartmann test,” Appl. Opt. 49, 4404–4412 (2010).
6. M. C. Knauer, J. Kaminski, and G. Hausler, “Phase measuringdeflectometry: a new approach to measure specular free-formsurfaces,” Proc. SPIE 5457, 366–376 (2004).
7. D. Pérard and J. Beyerer, “Three-dimensional measurement ofspecular free-form surfaces with a structured-lighting reflec-tion technique,” Proc. SPIE 3204, 74–80 (1997).
8. Y. Tang, X. Su, Y. Liu, and H. Jing, “3D shape measurement ofthe aspheric mirror by advanced phase measuring deflectom-etry,” Opt. Express 16, 15090–15096 (2008).
9. W. Jüptner and T. Bothe, “Sub-nanometer resolution for theinspection of reflective surfaces using white light,” Proc. SPIE7405, 740502 (2009).
10. J. C. Wyant, Phase-Shifting Interferometry [PDF document].Retrieved from: http://fp.optics.arizona.edu/jcwyant/Optics513/optics513ChapterNotes.htm (2011).
11. T. R. Judge and P. J. Bryanston-Cross, “A review of phase un-wrapping techniques in fringe analysis,” Opt. Lasers Eng. 21,199–239 (1994).
12. X. Su and W. Chen, “Reliability-guided phase unwrappingalgorithm: a review,” Opt. Lasers Eng. 42, 245–261 (2004).
13. R. Schöne and O. Schwarz, “Hybrid phase-unwrapping algo-rithm extended by a minimum-cost-matching strategy,” Proc.SPIE 4933, 305–310 (2003).
14. K. Zhou, M. Zaitsev, and S. Bao, “Reliable two-dimensionalphase unwrapping method using region growing and locallinear estimation,” Magn. Reson. Med. 62, 1085–1090 (2009).
Fig. 13. Comparison of the phase maps differences. Map(a) depicts the difference between the full and segmented mirror(spatially unwrapped).Map (b) shows the phase difference betweena spatial and temporal unwrapping (full mirror), which appears tobe noise. Map (c) depicts the difference between the full and seg-mentedmirror (temporally unwrapped).Map (d) shows the averageof two maps temporally unwrapped. All numbers are in radians.
10 February 2014 / Vol. 53, No. 5 / APPLIED OPTICS 929

15. G. Valadao and J. Bioucas-Dias, “PUMA: phaseunwrapping via max flows,” Proceedings of Conference on Tele-communications—ConfTele, Peniche, Portugal (2007),pp. 609–612.
16. H. H. Rapp, Reconstruction of Specular Reflective SurfacesUsing Auto-Calibrating Deflectometry (KIT ScientificPublishing, 2012), retrieved from Universität Karlsruhe(Record ID: oai:EVASTAR-Karlsruhe.de:1000030538).
17. H. Cui, W. Liao, N. Dai, and X. Cheng, “A flexible phase-shifting method phase marker retrieval,” Measurement 45,101–108 (2012).
18. X. Chen, C. Lu, M. Ma, X. Mao, and T. Mei, “Color-coding andphase-shift method for absolute phase measurement,” Opt.Commun. 298, 54–58 (2013).
19. H. O. Saldner and J. M. Huntley, “Temporal phase-unwrapping: application to surface profiling of discontinuousobjects,” Appl. Opt. 36, 2770–2775 (1997).
20. S. Li, S. Liu, and H. Zhang, “3D shape measurement of opticalfree-form surface based on fringe projection,” Proc. SPIE8082, 80822Z (2011).
21. G. Sansoni, M. Carocci, and R. Rodella, “Three-dimensionalvision based on a combination of gray-code and phase-shiftlight projection: analysis and compensation of the systematicerrors,” Appl. Opt. 38, 6565–6573 (1999).
22. G. Sansoni, S. Corini, S. Lazzari, R. Rodella, and F. Docchio,“Three-dimensional imaging based on gray-code light projec-tion: characterization of the measuring algorithm and devel-opment of a measuring system for industrial applications,”Appl. Opt. 36, 4463–4472 (1997).
23. D. Bergmann, “New approach for automatic surfacereconstruction with coded light,” Proc. SPIE 2572, 2–9 (1995).
24. Q. Zhang, X. Su, L. Xiang, and X. Sun, “3-D shape measure-ment based on complementary gray-code light,” Opt. LasersEng. 50, 574–579 (2012).
25. S. Zhang, “Composite phase-shifting algorithm for absolutephase measurement,” Opt. Lasers Eng. 50, 1538–1541 (2012).
26. J. Ohtsubo and A. Fujimoto, “Practical image encryption anddecryption by phase-coding for optical security systems,”Appl. Opt. 41, 4848–4855 (2002).
27. J. L. Posdamer and M. D. Altschuler, “Surface measurementby space encoded projected beam systems,” Comput. Graph.Image Process. 18, 1–17 (1982).
28. J. Salvi, J. Pagès, and J. Batlle, “Pattern codification strategiesin structured light systems,” Pattern Recogn. 37, 827–849(2004).
29. G. P. Butel, G. A. Smith, and J. H. Burge, “Optimization ofdynamic structured illumination for surface slope measure-ments,” Proc. SPIE 8493, 84930S (2012).
930 APPLIED OPTICS / Vol. 53, No. 5 / 10 February 2014