billy m. farmer and daniel g. carfagno april 25,1978
TRANSCRIPT

: <
0' •1
y
/ ^ . ^ ^
MLM-2515
Annual Environmental Monitoring
Report: Calendar Year 1977
Billy M. Farmer and Daniel G. Carfagno
April 25,1978
Monsanto
MOUND FACILITY M i a m i s b u r g , Ohio
o p e r a t e d b y
MONSANTO RESEARCH CORPORATION a subs id i a r y o f M o n s a n t o Connpany
f o r t l i e
U. S. DEPARTMENT OF ENERGY C o n t r a c t N o . E Y - y B - C - a 4 - Q 0 5 3
m^*A MASTER P r T f " - OV 0^ T,^'a DC '"Wer^T 3 UNUMiTEii

DISCLAIMER
This report was prepared as an account of work sponsored by an agency of the United States Government. Neither the United States Government nor any agency Thereof, nor any of their employees, makes any warranty, express or implied, or assumes any legal liability or responsibility for the accuracy, completeness, or usefulness of any information, apparatus, product, or process disclosed, or represents that its use would not infringe privately owned rights. Reference herein to any specific commercial product, process, or service by trade name, trademark, manufacturer, or otherwise does not necessarily constitute or imply its endorsement, recommendation, or favoring by the United States Government or any agency thereof. The views and opinions of authors expressed herein do not necessarily state or reflect those of the United States Government or any agency thereof.

DISCLAIMER Portions of this document may be illegible in electronic image products. Images are produced from the best available original document.

PRINTED IN THE UNITED STATES OF AMERICA
Available from
National Technical Information Service U. S. Department of Commerce
5285 Port Royal Road Springfield, Virginia 22161
Price: Printed Copy $4.50; Microfiche $3.00

MLM-2515 UC-4!
Annual Environmental Monitoring Report: Calendar Year 1977
Billy M. Farmer and Daniel G. Carfagno
Issued: April25. 1978
MOUND FACILITY Miamisburg, Ohio •453-42
opera ted by
MONSANTO RESEARCH CORPORATION
a subsidiary of Monsan to Company
fo r the
U. S. DEPARTMENT OF ENERGY C o n t r a c t No E Y - 7 B - C - 0 4 - 0 0 5 3

Foreword This report was prepared by the Environmental Assessment and Planning Section of the
Safety and Environmental Technology Function in the Administrative Services Department
at Mound Facility. Sample analyses and data reduction were performed by the Environ
mental Evaluation and Environmental Laboratory groups of the Environmental Assessment
and Planning Section. Particulate samples offsite are collected by the Air Pollution
Control Section of the Montgomery County Combined General Health District which acts
as the Regional Air Pollution Control Agency in this area for the Ohio Environmental
Protection Agency.
2

INTRODUCTION . . . . . . . . . . . . . . . . . 4
SUMMARY. . . . . . . . . . . . . . . . . . . . . , 8
ENVIRONMENTAL SURVEILLANCE
Air - Radioactive . . . . . . . . . . . . . . . 9 Air - Nonradioactive. 14 Water - Radioactive . . . . . . . . . . . . . 14 Water - Nonradioactive, . , 23 Foodstuffs and Vegetation - Radioactive . . . . . . . . . . 24 Silt - Radioactive. . . . . . . . . . . . . . . . . . . . . . . . . . 27 Soil - Radioactive. , 27
EVALUATION OF POTENTIAL DOSE TO THE PUBLIC 30
REFERENCES . . . . . . . . . . . . . . . . . . . . . 34
APPENDIX
Applicable Standards. . . . . . . . . . . . . . . 37 Dose Equivalent Calculations. . . . . . . . . . . . . 39 Person-Rem Calculations . . . . . . . . . . 40
DISTRIBUTION . . . . . . . . . . . . . . . . . . . . . . . . .
3

Introduction Mound Facility is situated on 180 acres
of land in Miamisburg, Ohio. This loca
tion is approximately 16 km (10 mi) south
west of Dayton. The predominant geograph
ical feature in the five-county region
surrounding the Facility is the Great
Miami River which flows from northeast to
southwest through Miamisburg. This river
valley, area is generally highly indus
trialized. The remainder of the region
is predominantly agricultural with some
light industry and scattered residential
communities. The location and population
of these communities are shown in Figure 1.
Figure 2 shows the population distribution
around Mound Facility. Drinking water for
the area is obtained from a buried valley
aquifer which generally follows the Great
Miami River. The primary agricultural
activity in the area is raising field
crops such as corn and soybeans. Approxi
mately 10% of the land area in agricultur
al use is devoted to pasturing livestock
[1]. Weather conditions in the area are
moderate. The average annual precipita
tion is approximately 91 cm (36 in.) and
is evenly distributed throughout the year.
Winds are predominantly from the south
or west except during the summer months
when a higher frequency is recorded from
out of the southwest. The wind speed
averages about 16 km/hr (10 mi/hr) an
nually [2]. Figure 3 shows the wind rose
compiled at Wright Patterson AFB which is
located approximately 13 miles northeast
from Mound.
Mound Facility began operations in 1949.
Its mission currently includes research,
development, engineering, production and
surveillance of components for the Depart
ment of Energy (DOE) weapon programsi
separation, purification, and sale of
stable isotopes of the noble gases ? the
fabrication of radioisotopic heat sources
fueled with plutonium-238 for thermoelec
tric generators. The radionuclides of
primary concern currently being handled
include plutonium-238 and tritium.
Radionuclides in particulate form are re
moved from process air effluents from nu
clear operations facilities by high effi
ciency particulate air (HEPA) filters. The
air effluents are filtered first at the
points of origin, i.e., glove boxes, and
just prior to the release point, i.e.,
the stack. The filtering system at the
stack consists of two banks of HEPA filters
in series, each bank with a collection
efficiency of 99.9%. Radionuclides are
removed from liquid effluents such as pro
cess waste liquids by chemical processing.
Solid radioactive wastes are packaged and
shipped offsite for burial at approved
burial sites. Airborne and liquid wastes
generated in the processing of explosive
materials are collected and disposed of
according to the Army Materiel Command
Regulation 385-100.
An onsite sanitary waste treatment plant
provides secondary treatment in accordance
with U. S. Environmental Protection Agency
(EPA) requirements [3] using an activated
sludge process operating in the extended
aeration mode. All domestic sewage gen
erated onsite is treated in this facility.
The influent and effluent at the sewage
treatment plant are also monitored for
radioactivity to ensure no undetected re
lease can occur to the environment via
the sanitary sewage plant. The digested
sludge from the sewage plant is shipped
offsite for burial at an approved burial
site. Nonradioactive solid wastes are
4

A.119
A A I R SAMPLING STATIONS POPULATIONS OF CITIES
#2500-5000 05000-10,000 B 10,000-15,000
< g > 15,000
BELL8R00K
FIGURE 1 - Offsite air sampling locations.

/ 10,928
/ 13,H0 i l,Slh
KST 11,8|I 59.370
INDIANA
\ *''* \
-N- X .
1
NORTH
. j f \ ^ 16,612 I
^ / * > y P Greenville \ \
! " ' • ' » ^ ^ M 0 9 \
/ / 1 0 , o w ^ ^ ^
1 8,552 ^ N V ) g ]u ,bona \
7 I 5 , 0 « ^ ? * ' ^ ' ° \ ^ / \
28,5
/ *6 707\vJ ' ^^ ' \ '"''^^ fX ^ ^ ^ v - ' ' ' ^ ^ ^ ^ ' C \ Lontlo\
3,070 |''.738 1 / l Miomisburgl 24,0031 |9,20I 1 5,259
I ___X.----"'"'^ )
" """'"x ''''* .^\^^ \ 38,255 V. / ' ' ' ^ ' ' s ^ ^ i i S ^
/ ^ \ 25,57* A/!)™**'**J " ' * ' '
K ^ ' i ^ O v . 5'0.069 ~J7 i w ^ / x ^ ' * * x j \ y^K^/Cincinnati
S / K E N T U C K Y i-j / ^ s ; ; r ' ^ X , ^ 242,1132 cJtngton ^
SSUTO
/~"""'~~~--*-.--_ 1 6,296 EA$T
/ v 5,969/ ^ | " ~ ' ~ ~ " ~ ' - - L ^ 1
\7\y • • '" / / L>\ ,.«y^/ '"y
\
11,884 \ r y^s^ /
^ y ^ 5,9W yf ^ V
11.335 ^ ^ ^ I 0 . 4 9 8 y /
1 15,132 ^ y ^
Cuaiulatlv® Population Tota ls Present P i ^ u U t i s n 0 - SO M I I M
0-20 895,941 0-3S 1,341,13S 0-40 2,307,726 0-50 2,778.388
nmrn *.%.*.-%
FIGURE 2 - 1970 population within 50 miles of Mound Facility.

be taken thus ensuring that concentrations
are well within existing standards.
If,*- Surface Wind Speed, mph
41? 13 24
ALL OBSERVATIONS (97,0331
% Frequency
0 5 10 16
FIGURE 3 -• The relative frequency and strength of winds from different directions for Mright-Patterson Air Force Base.
disposed of according to a recycling
and reclamation program.
White paper, scrap metal and wood are
sold for reclamation. General refuse
was transported during 1977 to the
Franklin Reclamation Center, Franklin,
Ohio, for processing and eventual use in
recycled products. Waste solvents and
chemicals are removed offsite by a com
mercial industrial-waste-disposal firm.
Conformance to regulations prescribed
by DOE pertaining to the safety of em
ployees and the public has been demon
strated during the history of Mound
Facility. The fundamental objective of
the Mound Facility Environmental Control
Program, which has been in existence
throughout the history of the Facility,
is the containment of radioactive efflu
ents to levels well within the existing
standards. As part of this function,
effluents are monitored and controlled
at each operating step resulting in only
low-level releases of airborne or liquid
wastes to the environment. Because of
early detection, control techniques can
As part of the Mound Environmental Program
monitoring functions, air, water, foodstuff,
and soil samples are collected from the en
vironment at distances up to 45 km (28 mi)
from the Facility boundaries. These samples
are analyzed for the specific radionuclides
handled at the Facility.
A quality control program for environmental
analytical procedures has been in effect
for several years. There are two parts to
the program: internal and external. The
internal portion consists of blank and du
plicate analyses for each group of samples.
The blank values have been consistently
small in comparison with sample values
indicating good control during analytical
procedures. The duplicate results for
1977 were in the range expected. Chemical
recoveries were greater than 50%. The ex
ternal portion of the program consists of
sending duplicate samples to an independent
laboratory. These results for 1977 were
also satisfactory. Mound Facility partici
pated in DOE'S Quality Assurance Program
conducted by the Environmental Measurements
Laboratory (EML) during CY-1977. Sample
media such as air, water, soil, vegetation,
and tissue were analyzed for various radio
nuclides such as plutonium-238, plutonium-
239, uranium-234, uranium-235, uranium-238,
and tritium. In this program. Mound along
with other facilities received and analyzed
samples of various media and submitted data
for comparison with EML values. Overall,
the ratio of Mound to EML values averaged
0,85 + 0.24 with a range of 0.40 to 1.14
which indicates good agreement with the
Environmental Measurements Laboratory.
The results of the environmental analyses
for calendar year 1977 are provided in
7

this report. Error limits, when given,
reflect standard deviations in the data
from counting statistics at the 95% con-
ficence level. A lower detection limit
(LDL) is provided for each set of data.
This LDL is composed of the average blank
for the set of analyses plus 2a of the
average of the blanks for those analyses
involving chemical processes. The LDL
for data consisting of analyses by count
ing procedures only is equal to 2a of
the counting error of the blank. In some
special instances, where an inadequate
number of blanks exist, the average blank
plus 2a of the counting error is used for
those analyses involving chemical pro
cedures ,
Summary The local environment surrounding Mound
Facility was monitored for tritium and
plutonium-238. The results are reported
for calendar year 1977. The environment
al parameters analyzed included air, water,
foodstuffs, soil and silt. The average
concentrations of plutonium-238 and tri
tium were within the applicable stringent
standards for radioactive species adopted
by the U. S. DOE. Mound Facility drinking
water has been brought into compliance
with the new EPA standard for tritium in
community drinking water systems, and
Mound has undertaken a program to achieve
compliance for nine private wells adjacent
to the Facility site. The program has
partially achieved its objective by bring
ing Mound wells and some of the nine
affected private wells in the vicinity of
Mound Facility into compliance with the
U. S. EPA standard and significantly re
ducing tritium concentration in the re
maining wells. Data concerning nonradio
active species in air and water are also
presented and compared to federal, state,
and local standards, where applicable.
The average concentrations of plutonium-
238 and tritium oxide in air measured at
all offsite locations during CY-1977 were
<0.75 X lO"!" and <0.63 x IQ-ll pCi/ml,
respectively. These correspond to <0.037%
and<0.009% of their respective Radioactiv
ity Concentration Guides (RCG). Details
of the applicable standards are given in
the Appendix.
The average concentrations of plutonium-
238 and tritium measured at all locations
in the Great Miami River during CY-1977 were
<0.27 X 10⁻¹⁰ an(3 <1,4 x 10⁻⁶ yCi/ml, re
spectively. These correspond to <0.0014%
and <0.14% of the respective RCG.
The average concentrations of plutonium-238
and tritium found during CY-1977 in surface
water and the drinking water of the area
municipalities were also a fraction of each
respective DOE RCG and EPA standard.
Although there are no specific standards
(RCG) for plutonium-238 and tritium in
foodstuffs, the concentrations found, if
compared to the water standard, are also
a small fraction of the RCG. In addition,
there is no evidence of other than minimal
uptake of plutonium-238 from soil. [4]
Mound Facility has been granted a National
Pollutant Discharge Elimination System
permit. Analyses during 1977 indicate com
pliance with permit conditions except for
two minor exceptions involving suspended
solids during July. All results indicated
that Mound effluent streams have no signifi
cant effect on the Great Miami River and
certainly do not cause Ohio Stream Standards
to be exceeded.
The effluent data are summarized in Table
1. In addition, the person-rem calculated
out to 80 km for CY-1977 was 12.2 person-rem.
8

These data demonstrate the status of com
pliance with various current regulatory
agency standards.
1 Table 1 - EFFLUENT DATA
Radionuclide Media
Tritium
Tritium
Plutonium-238
Plutonium-238
Uranium-233
air
water
air
water
water
FOR CY-1977 -,
Quantity
4896 Ci
56.7 Ci
0.012 mCi
2.8 mCi
3.3 mCi
Environmental surycillancc Air - radioactive An offsite air sampling network consist
ing of 14 continuously operating air-
sampling stations which are used for
sampling both tritium oxide and plutonium
and a fifteenth sampler used for sampling
plutonium only were used during CY-1977.
Ten sampling stations are located approxi
mately within a 1.6 km (1 mi) radius of
the Facility and four samplers are lo
cated in or near population centers. The
remaining sampler (#119) is approximately
44.8 kg (28 mi) from the Facility in the
least prevailing wind direction. This
site receives no measurable contribution
from Mound operations and serves as a
baseline sample for comparison purposes.
The samplers currently in operation are
located at critical distances and direc
tions based on a diffusion model developed
for Mound Facility. The locations of the
sampling stations are shown in Figure 1.
Two types of samples are collected at
each sampling station. One is a particu
late air sample for plutonium~238 analy
sis and the other is a bubbler type sample
for tritium oxide analysis. The particu
late sample is collected on a 200-mm
diameter Microsorban disk by a continuously
operating (24 hr/day, 7 days/week) high-
volume air sampler. The air is sampled at
an average rate of 1.3 x 10 cm /min (-45 3
ft /min). The Microsorban disk is changed
weekly and represents a sample of approxi
mately 13,000 m of air. Plutonium-238
analyses were performed on a monthly com
posite for three sampling locations, 122,
123 and 124, and on quarterly composites
for the other offsite locations.
The analytical scheme for plutonium-238
incorporates the following basic steps;
addition of a known amount of plutonium-242
tracer, ignition to 600°C, dissolution with
nitric acid, separation of plutonium with
anion exchange resin, electrodeposition of
plutonium, and finally alpha spectrometry.
The results reported represent total con
centrations of the analyzed radionuclides
including contribution from atmospheric
fallout.
The average offsite plutonium-238 air con
centration for all locations was <0.75 x
10-17 pci/ml which is <0.037% of the DOE
RCG. The RCG used for comparison is the
guide for the soluble form of the isotope
and for the general population. This is
the most restrictive RCG for plutonium-238
and is applied since the solubility of
the measured particles in the human body
is unknown. The analytical results are
summarized in Table 2. Samples reported
as less than (<) the Lower Detection Limit
(LDL) are, for averaging purposes, con
sidered to be the value of LDL. This pro
vides a conservative approach to low level
environmental data.
Also included in Table 2 are ratios of plu
tonium-238 to plutonium-239 for each samp
ling location.
9

Table
Location
101
102
103
104
105
108
110
111
112
115
118
119
122
123
124
2 - CONCEN
Number of
Samples
51
52
51
52
52
48
51
52
48
51
51
51
47
52
52
TRATIONS OF PLUTONIUM IN AIR AT OFF
238py
Range d o " " MC1/ml)
0.15
0.52
0.42
0.22
<0.076
<0.076
<0.076
<0.076
<0.076
<0.076
0.25
<0.076
0.61
0.54
0.35
- 3.2
- 1.3
- 0.88
- 0.50
- 0.23
- 0.29
- 0.15
- 0,32
- 0.21
- 0.21
- 1.2
- 0.11
- 6.3
- 9.6
- 4.2
Average^^^^^ ( 1 0 " ! ' pCi/ml)
1.0 ±0 .05
0.81 ± 0.08
0.62 ± 0.07
0.37 ± 0.06
<0.15 ± 0.04
<0.15 ± 0.04
<0.09 ± 0.04
<0.21 ± 0.05
<0.16 ± 0.04
<0.13 ± 0.04
0.75 ± 0.08
<0.10 ± 0.04
2.1 ± 0.22
2.9 + 0.26
1.7 ± 0.20
SITE SAMPLING LOCATIONS IN 1977 .
23Sp^
Percent Average'''' ' " ^ P u / of RCG d o " " yCi/ml) " ^ P u
0.05
0.04
0.03
0.02
<0.01
<0.01
<0.01
<0.01
<0.01
<0.01
0.04
<0.01
0.11
0.15
0.09
' Lower Detection L imi t (LDL) fo r ^'^Pu in a i r f o r samplers 101 0.076 X 10"!^ yCi/ral and the LDL fo r samplers 122 through 124 This is 0.004% and 0.013%, respect ively of the RCG.
' 'Radioact iv i ty Concentration Guide (RCG) = 2000 x lO '^ ' ' pCi/ml ^^*Pu fo r the general populat ion.
''The LDL the LDL
fo r ^'^Pu in a i r f o r samplers 101 through 119 for samplers 122 through 124 is 0.121 x 1 0 " "
Error l im i t s include only ( ;ount1ng s fcatistics at 95%
is 0.03: yC1/ml.
2.4
2.2
2.1
2.2
2.0
2.7
2.3
2.5
2.1
2.5
2.5
2.1
1.6
2.1
2,4
through is 0.25E
± 0.13
± 0.13
± 0.13
± 0.13
± 0.12
± 0.14
± 0.13
± 0.14
± 0.13
± 0.14
± 0.14
± 0.13
± 0.19
± 0.22
± 0.23
119 is I X 1 0 ' "
f o r the soluble
X 10~i '
confidence level
y d / m l
0.42
0.39
0.30
0.17
<0.08
<0.06
<0.04
<0.0B
<0.08
<0.05
0.30
<0.05
1.3
1.4
0.71
jaCi/ml.
form of
and
The gas bubbler sample is also collected
on a continuous basis by bubbling air at 3 3 approximately 3 x 10 cm /min through 200
ml of ethylene glycol. Ethylene glycol
is used because this material eliminates
evaporation and freezing problems asso
ciated with sample collection [5]. Any
tritium (oxide) in the air is collected
in the solution. Tritium oxide rather
than elemental tritium is sampled and
analyzed because the RCG for the oxide is
200 times more restrictive than it is for
elemental tritium [6]. A sample represent-
ing -30 m of air is collected and an
10
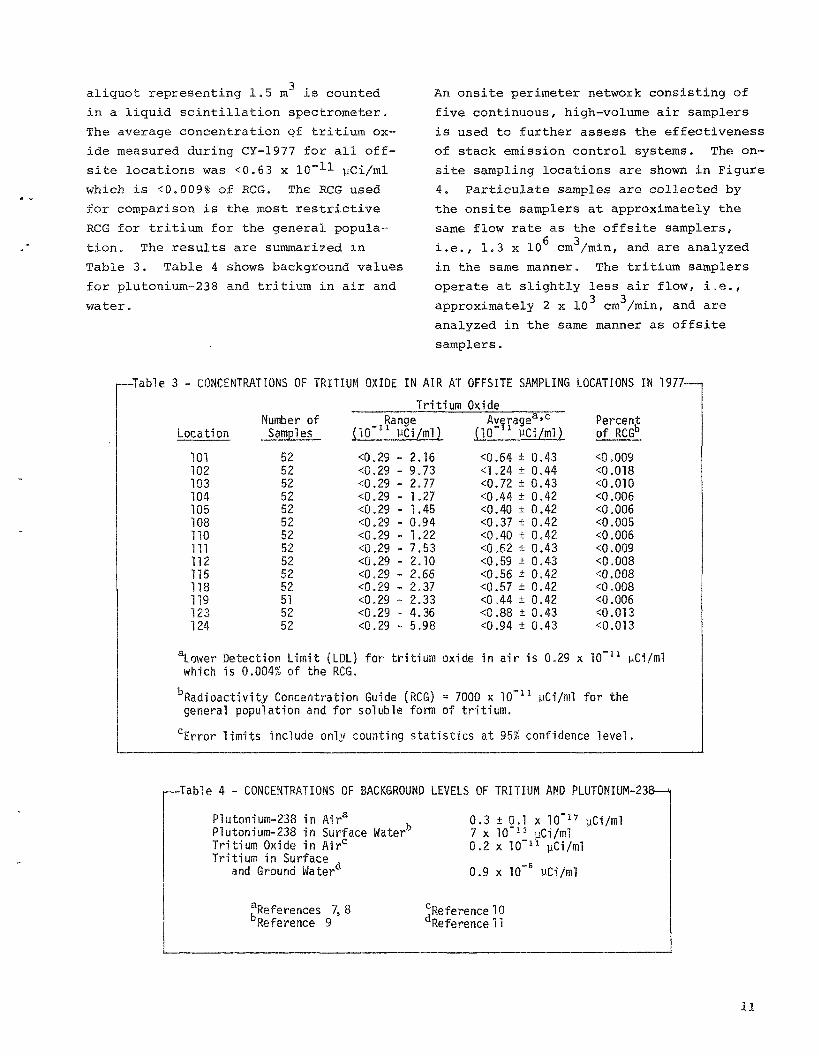
aliquot representing 1.5 m is counted
in a liquid scintillation spectrometer.
The average concentration of tritium ox
ide measured during CY-1977 for all off-
site locations was <0,63 x 10"11 yCi/ml
which is <0.009% of RCG. The RCG used
for comparison is the most restrictive
RCG for tritium for the general popula
tion. The results are summarized in
Table 3. Table 4 shows background values
for plutonium-238 and tritium in air and
water.
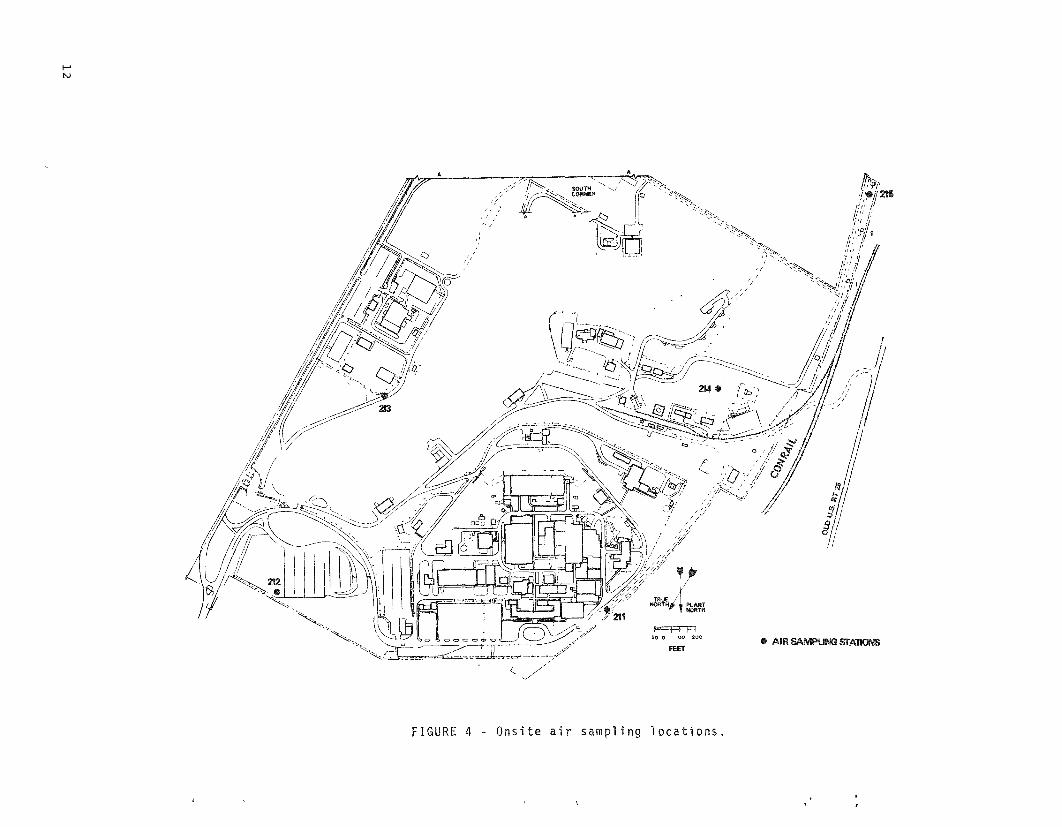
An onsite perimeter network consisting of
five continuous, high-volume air samplers
is used to further assess the effectiveness
of stack emission control systems. The on-
site sampling locations are shown in Figure
4. Particulate samples are collected by
the onsite samplers at approximately the
same flow rate as the offsite samplers,
i.e., 1.3 X 10 cm /min, and are analyzed
in the same manner. The tritium samplers
operate at slightly less air flow, i.e., 3 3
approximately 2 x 10 cm /min, and are analyzed in the same manner as o f f s i t e samplers.
r—Table 3 - CONCENTRATIONS OF TRITIUM OXIDE
Number of Location Samples
101 102 103 104 105 108 110 111 112 115 118 119 123 124
\ower which
52 52 52 52 52 52 52 52 52 52 52 51 52 52
Detection Limit is 0.004% of the
.Ran (10 " y
<0.29 -<0.29 -<0.29 -<0.29 -<0.29 -<0.29 -<0.29 -<0.29 -<0.29 -<0.29 -<0.29 -<0.29 -<0.29 -<0.29 -
IN AIR AT OFFSITE SAMPLING
Tritium Oxide ge Ci/ml)
2.16 9.73 2.77 1.27 1.45 0.94 1.22 7.53 2.10 2.66 2.37 2.33 4.36 5.98
(LDL) for tritium RCG .
Radioactivity Concentration Guide (RCG) general population and
''Error
for
limits include only
soluble
counting
form
stati
Average^'" (10"" PCi/ml)
<0.64 ± 0.43 <1.24 ± 0.44 <0.72 ± 0.43 <0.44 ± 0.42 <0.40 ± 0.42 <0.37 ± 0.42 <0.40 ± 0.42 <0.62 ± 0.43 <0.59 ± 0.43 <0.56 ± 0.42 <0.57 ± 0.42 <0.44 ± 0.42 <0.88 ± 0.43 <0.94 ± 0.43
3X1 de in air is 0.29
= 7000 X 10"" pCi/ml Df tritium.
LOCATIONS IN 1977—,
Percent of RCG^
<0.009 ' <0.018 <0.010 <0.006 <0.006 <0.005 <0.006 <0.009 <0.008 <0.008 <0.008 <0.006 <0.013 <0.013
X 10"" pCi/ml
for the
sties at 95% confidence level.
- T a b l e 4 - CONCENTRATIONS OF BACKGROUND LEVELS OF TRITIUM AND PLUTONIUM-238—^
Plutonium-238 in Air"* Plutonium-238 in Surface Water° Tritium Oxide in Air" Tritium in Surface
and Ground Mater
0.3 ± 0.1 X 10"" pCi/ml 7 X 10"" pCi/ml 0.2 X 10"" pC1/ml
0.9 X 10"' PCi/ml
^References 1, 8 ^Reference 9
^Reference 10 ' Reference 11
I I
• AIR SAMPUr« STATWe
FIGURE 4 - Onsite air sampling locations.

The average plutonium-238 concentra t ion
measured for a l l l oca t ions o n s i t e was
4,02 X 10⁻¹⁷ pCi/ml which i s 0.057% of
the RCG. The r e s u l t s a re summarized in
Table 5.
The average ons i t e t r i t i u m oxide concentra
t ion for a l l loca t ions was <2.0 x 10-^-^
liCi/ml which i s <0.01% of the RCG. The
r e s u l t s are summarized in Table 6.
-Table 5 - CONCENTRATION OF 238
Location
211 212 213 214 215
Number of Samples
43 43 43 43 43
Pu IN AIR AT ONSITE SAMPLING LOCATIONS IN 1977-
^'«Pu a,d
'Pu Range Average^'" Percent Average'^
(10'^' pC1/ml) d o " " PCi/ml) of RCGb (10"" pCi/ml)
2.4 0.98 4.2 0.98 0.37
10.1 11.7 14.8 8.5 2.9
5.1 2.5 8.1
± 0.34 ± 0.24 ± 0.42
3.1 ± 0.27 1.3 ± 0.18
0.07 0.04 0.12 0.04 0.02
2.0 1.9 3.1 1.9
<1.7
0.22 0.21 0.27 0.21 0.20
\ o w e r Detection Limit (LDL) fo r " ' P u in a i r is 0.258 x 1 0 " " pCi/ml which is 0.004% of the RCG.
' 'Radioact iv i ty Concentration Guide (RCG) = 7000 x 1 0 " " yCi/ml for the soluble form of pluton1um-238 fo r indiv iduals in the population.
"Lower Detection Limit (LDL) fo r " ^ P u in a i r is 0.121 x 1 0 " " yCi/ml.
Error l im i t s include only counting s t a t i s t i c s at 95% confidence l eve l .
-Table 6 - CONCENTRATION OF TRITIUM OXIDE IN AIR AT ONSITE SAMPLING LOCATIONS IN 1977-
Tr i t ium in Oxide
Location
211 212 213 214 215
Number Sampl(
51 40 35 52 52
of 5S
Range d o " " pCi/ml)
<0.73 - 27.8 <0.73 - 14.3 <0.73 - 6.7 <0.73 - 6.8 <0.73 - 6.4
Average^'c d o " " pCi/ml)
<1.8 ± 1.1 <3.0 ± 1.1 <2.0 ± 1.1 <1.6 ± 1.1 <1.6 ± 1.1
Percent of RCGb
<0.009 <0.015 <0.010 <0.008 <0.008
\ower Detection Limit (LDL) for tr i t ium oxide in air is 0.73 x 10" " pCi/ml which is 0.004% of the RCG.
''Radioactivity Concentration Guide (RCG) = 20,000 x 10 " " pCi/ml for individuals in the population and soluble form of t r i t ium.
"Error l imits include only counting stat ist ics at 95% confidence level.
13

The RCGs used for onsite comparisons are
those applicable for exposed individuals
in the population. The total amounts of
plutonium-238 and tritium discharged to
the atmosphere were 0.012 mCi and 4896 Ci
respectively. Comparison of these quan
tities to the RCG is not valid.
Air ' nonradioactive
The Mound steam power supply has been
converted from fuel oil to natural gas
(on an interruptable basis). During un
usually cold weather, natural gas supply
to Mound is interrupted, and fuel oil
with <1% sulfur content is burned. The
average sulfur content of the fuel oil
burned was approximately 0.4%. During
1977 Mound steam supply was fired almost
equally by fuel oil and natural gas.
Approximately 990,000 gal of No, 2 fuel
oil were burned.
Additional sources of airborne emissions
are as follows. A water-wash, paint
spray booth is operated intermittently
in the Mound paint shop. Wastes from
operations involving explosives are dis
posed of by open burning. A shipping
container fire test facility for testing
shipping containers for radioactive
wastes is used on the average of once per
month. A maintenance grinding operation
and a carpenter shop are also operated on
an intermittent basis. Firefighter train
ing excercises are held at an open out
door facility.
Emissions from sources registered with
the Regional Air Pollution Control Agency
(RAPCA) and the Ohio EPA which have
applicable emission standards are summar
ized in Table 7. The emissions were es
timated from emission factors established
by the USEPA or from material balances [12]
The emission from the shipping container
fire test facility is controlled with a
forced air supply and water spray nozzles
at the fuel-flame interface to an average
opacity of <20%. The particulates from
the grinding and carpenter shop operations
are captured by cyclone air cleaners rated
at 95% efficiency. Nonradioactive airborne
emissions at Mound Facility were all within
applicable standards and had minimal impact
on ambient air quality. This is further
demonstrated by the particulate concentra
tion data summarized in Table 8. The data
presented are weekly particulate concentra
tions measured at Mound's offsite air samp
ling sites. The particulate concentration
appears to be independent of distance from
Mound which demonstrates no influence from
Mound operations. For comparison purposes,
the State of Ohio - Ambient Air Quality
Standard for airborne particulates is 60
pg/m .
Water - Madioactivc Water sampling locations along the bank of
the Great Miami River were selected accord
ing to guidelines recommended by the 0. S.
EPA [13] . The locations, shown in Figure
5, provide samples which are representative
of river water after suitable mixing of the
effluent from Mound has occurred. Water
samples are normally collected at these
locations five days per week and are sub
jected to specific analyses for plutonium-
238 and tritium.
The plutonium-238 river water analyses have
been improved by a procedure developed at
Mound Facility to maximize the sensitivity
in detection of plutonium-238 in water.
Large volume water samples are analyzed by
compositing daily samples for a semiannual
14

Emission Source
Power House
Power House
Paint Shop
Explosives Burning Area
F i re f igh ter Training
^Ohio EPA Ai 3745-21-01
—Table 7 - NONRADIOACTIVE AIRBORNE
Pol lutant Emission
Part iculates 0.12 Ib/lO* Btu Input
Sulfur Oxides 0.39 Ib/lO^ Btu Input
Organics 0.32 lb/day
Part iculates '^ 10 Ib /y r
Part iculates '^ 330 lb
EMISSIONS 1977
Emission Standard^
0.25 lb/10^ Btu Input
1.6 lb/10^ Btu Input
40 lb/day
NA
NA
r Pol lut ion Regulations 3745-1701 through 3745-17-13 through 3745-21-08.
NA - not appl icable.
% of Standard
48
24
0.8
NA
NA
and
Table 8 -CONCENTRA
Location
101 102 103 104 105 108
no 111 112 115 118 119 122 123 124
^Ohio Ambient Ai
These data are ing program and
1977 WEEKLY TION DATAa
Range (yg/m3)
13-189 19-123 16- 84 16-131 24- 91 16-143 15- 88 21-123 17- 98 22-110 13-113
2- 94 21-123 31-108
5-100
PARTIClil.ATF
Average
iml^ 72 56 40 56 45 72 44 63 45 50 52 33 43 51 47
3 r Quality Standard = 60 yg/m
obtained by Mound's a i r monitor-are ind ica t i ve only of the par-
t i cu la te a i r loading in the Dayton metropolitan area. Mound's in Table 7 make the surrounding
par t icu la te discharges presented a negl ig ib le area.
contr ibut ion to
analysis. The average concentration of
plutonium-23B measured for all locations
in the Great Miami River was <0.27 x 10~10
pCi/ml which is <0.0014% of the RCG for the
general population and the most restrictive
standard for plutonium-238. These results
are summarized in Table 9.
Tritium analyses are performed on a weekly
composite of daily samples. The average
concentration of tritium measured at all
locations in the Great Miami River was
<1.4 x 10~6 yCi/ml which is <0,14% of the
RCG for the general population and the most
restrictive standard for tritium. These
results are summarized in Table 10.
Results of plutonium-238 and tritium analy
sis for three offsite sampling locations on
the abandoned Miami-Erie Canal and adjacent
ponds shown in Figure 6 are reported in
Tables 11 and 12, respectively. However,
two of these locations, 6 and 7, went dry
during the early part of the year which
15

t i - i i i ^
I. RIVER SAMPLING LOCATIONS 1,2,3,4,5
LOCATIONS 6,7 8
_ SURFACE WATER IPONDSI • SAMPLING LOCATIONS
10,11.12,13,14 15,16,17
A PRIVATE WELL SAMPLING LOCATIONS
KILOMETERS
16
FIGURE 5 - Offsite water sampling locations.

' ' '• • ; - ' . . . ' - • • • .
P-
•- •'' '• 's"".,;:?..;? -'•1 ,-•/ ' j ; . ; ' - *
:.. " < : . ' i - '
•
, « » • . . . • ' ; -
. ( . • • « . , * #
^ . , • ' ! * * • "
.4f,'^^''S^ •
M '.-^•'; 'X7»"«-,
•"'•" ' i ^ ! ^ -
-> -m
J^J
FIGURE 6 - Aerial view (from the north) of offsite abandoned canal and pond system.
17

T a h i o Q _ rnMrPWTDflTTnW np 22°D. i TM THP riDCflT MTflMT DTUPD TM 1077
238
Number of Range Location Samples^ (10"^° PCi/ml)
1 210 2 210 <0.1 - 0.21 3 210 0.16 - 0.23 4 210 <0.1 - 1.5 5 210
Two composite large volume water samples col lected during CY-1977.
^Lower Detedtion Limit (LDL) fo r "®Pu in which is 0.0005% of the RCG.
Pu Average'^''' Percent
(10'^° PCi/ml) of RCGc
<0.10 ± 0.01 <0.0005 <0.16 ± 0.02 <0.0008 0.20 ± 0.01 0.0010
<0.80 ± 0.05 <0.0040 <0.10 ± 0.03 <0.0005
for each locat ion from water
water is 0.1 x 10"'° yCi/ml
'^Radioactivity Concentration Guide (RCG) = 20,000 x 10'^° yCi/ml fo r the general population and the soluble form of pluton1um-238.
'^Error l im i t s include only counting s ta t i st ies at 95° confidence l e v e l .
-Table 10 - CONCENTRATION OF TRITIUM IN THE GREAT MIAMI RIVER IN 1977-
Tritium Number of Range Average '*^ Percent
Location Samples (10'^ yCi/ml) (10"' MCi/ml) of RCG
1 210 <0.20 - 4.3 <1.0±0.35 <0.10 2 210 <0.20 - 16.8 <1.5 ± 0.36 <0.15 3 210 <0.20 - 8.3 <1.9 + 0.36 <0.19 4 210 <0.20 - 23.4 <1.6 ± 0.36 <0.16 5 210 <0.20 - 4.5 <1.0 ± 0.35 <0.10
\ower Detection Limit (LDL) for t r i t ium in water is 0,20 X 10"« pCi/ml which 1s 0.02% of the RCG.
''DOE Radioactivity Concentration Guide (RCG) which 1s compared to tr i t ium concentration in water not used for drinking purposes = 1000 X 10-^ )iCi/ml for the general population and the soluble form of t r i t ium.
'^Error l imits include only counting statist ics at 95% confidence level,
18

- T a b l e 11 - CONCENTRATION OF ^^^Pu IN WATER FROM CANAL/POND AREA IN 1 9 7 7 -
238p^^
Number of Range Average' ' Percent Location^ Samples^ (10"'° JiCi/ml) (10"" yCi/ml) of RCG*
8 (South Canal) 210 26.0 - 45.0 35.5 + 0.20 0.18
\ocations are shown in Figure 5.
Two composite large volume water sample for each location from water collected during CY-1977.
''Lower Detection Limit (LDL) for "^Pu in Water is 0.1 x 10"" pCi/ml which is 0.0005% of the RCG.
'^Radioactivity Concentration Guide (RCG) = 20,000 x 10"" yCi/ml for the general population and soluble form of plutonium-238.
^Error limits include only counting statistics at 95% confidence level.
-Table 12 - CONCENTRATION OF TRITIUM IN WATER FROM CANAL/POND AREA IN 1977
Tritium Number of Range Average^''^ Percent
Location^ Samples (10"^ uCi/ml) (10"^ yCi/ml) of RCG'
6 (North Pond) 20 6.8 - 11 8.9 ± 0.46 0.89 7 (North Canal) 12 0.6 - 7.7 5.2 + 0.41 0.52 8 (South Canal) 200 4.7 - 44 24 ± 0.63 2.4
\ocations are shown in Figure 5.
''Lower Detection Limit (LDL) for tritium in water is 0.2 x 10"^ pCi/ml which is 0.02% of the RCG.
^DOE Radioactivity Concentration Guide (RCG) which is compared to tritium concentration in water not used for drinking purposes = 1000 x 10"^ yCi/ml for the general population and soluble form of tritium.
' Error limits Include only counting statistics at 95% confidence level.

prevented samples from being taken. Total
annual data on sample location 8, however,
is shown. These values represent levels
from the site drainage ditch which dis
charges into the offsite canal-pond sys
tem prior to mixing with the Great Miami
River. These values, as expected, are
higher than those concentrations found in
the Great Miami River where mixing and
dilution occur. The total amounts of
plutonium-2 38, tritium and uranium-233
discharged to the Great Miami River were
2.8 mCi, 56.7 Ci, and 3.3 mCi, respec
tively. The concentrations were 0.09%,
2.3%, and 0.01% of the most restrictive
RCG for individuals in the population.
From the uranium-233 concentrations found
in the effluent streams, estimated concen
trations offsite from Mound operations
would be undistinguishable from any back
ground. This can be readily seen by com
paring plutonium-238 quantities found in
the effluent streams with concentrations
found offsite.
Eight additional surface water locations
such as ponds in all quadrants surround
ing Mound Facility are sampled annually.
These samples, used for plutonium-238
determination, are large volume water
samples of approximately 40 liters each.
The large volume of sample increases the
sensitivity of the analysis. A smaller
aliquot (10 ml) was taken for the tri
tium analysis. The average concentra
tions of plutonium-238 and tritium for
all locations were <0.1 x 10"-'-' and
<1.01 X 10~6 yci/ml, respectively, which
are <0.0005% and <0.10% of the respective
RCG for the general population. The re
sults of the surface water samples are
summarized in Tables 13 and 14. Back
ground levels of plutonium-238 and tri
tium for the surface water are shown in
Table 5.
Drinking water from communities in the
surrounding area is sampled and analyzed
annually for tritium with the exception of
drinking water from Miamisburg which is
sampled and analyzed quarterly. These
communities and their relative locations
are shown in Figure 1. The average con
centration of tritium for all locations was
1.1 X 10"^ pCi/ml which is 5.5% of the new
standard which was adopted by the U. S. EPA
in 1977 for community drinking water sys
tems. Data from the analyses of community
drinking water samples are summarized in
Table 15.
Several private wells in the vicinity of
Mound Facility were analyzed semi-monthly for
for tritium. The average concentration
in these wells was 35.3 x 10"^ yCi/ml. Al
though these wells were always well within
the prevailing AEC and ERDA standard for
tritium effluent and drinking water, the
O. S. EPA's new drinking water standards
for radiological, biological, and chemical
elements in water, which became effective
in June 1977, placed some of the wells in a
noncompliance status because the new stan
dard for radioactivity is 50 times less
than the old standard. The average concen
tration for 1977 exceeds the new standard
by a factor of 1.8.
Private well analyses results are summar
ized in Table 16. As shown by the data,
concentrations in these wells are higher
than in municipal wells in the area. This
situation resulted from Mound Facility re
leasing tritiated waste water to the Great
Miami River via the site drainage ditch
and Miami-Erie Canal over a period of years
prior to 1970. Some of the water migrated
into the aquifer adjacent to Mound Facility
and increased the concentration of tritium
in the aquifer.
20

-Table 13 - SUMMARY OF SURFACE WATER MONITORING FOR PLUTONIUM-238 in 1977-
"Vu
Location Number of Range Average^'"^ Percent Samples^ ( 1 0 " " j iCi/ml) ( 1 0 " " yCi/ml) of RCG'
10 210 <0.1 - 0.13 <0.12 ± 0.02 <0.0006 11 210 - <0.1 ± 0.01 <0.0005 12 210 - <0.1 ± 0.01 <0.0005 13 210 - <0.1 ± 0.01 <0.0005 14 210 - <0.1 ± 0.01 <0.0005 15 210 - <0.1 ± 0.01 <0.0005 16 210 - <0.1 ± 0.01 <0.0005 17 210 - <0.1 ± 0.01 <0.0005
^Two composite large volume water samples were used for each locat ion.
\ o w e r Detection Limit (LDL) fo r "«Pu in water 1s 0.1 x 10"i° yC1/ml which is 0.0005% of the RCG.
'^Radioactivity Concentration Guide (RCG) fo r ^'^Pu in water = 20,000 x lO" ! " yCi/ml f o r the general population and soluble form of plutonium-238.
•^Error l im i t s include only counting s t a t i s t i c s at 95% confidence l eve l .
-Table 14 - SUMMARY OF SURFACE WATER MONITORING FOR TRITIUM IN 1977-
Tr i t ium
Location
10 11 12 13 14 15 16 17
Number of Samples
3 4 4 4 4 4 4 3
Range do"' liCi/ml)
<0.4 - 1.4 <0.4 - 0.9 <0.4 - 0.7 1.0 - 1.3
<0.4 - 1.4 0.8 - 1.5 0.6 - 1.0 1.5 - 2.3
Average^''^ (10 ^ yCl/ml)
<0.8 + 0.6 <0.5 ± 0.6 <0.5 ± 0.5 1.1 ± 0.6
<1.1 ± 0.6 1.3 ± 0.6 0.8 ± 0.6 1.9 ± 0.6
Percent of RCG^
<0.08 <0.06 <0.05 0.11 <0.11 0.13 0.08 0.19
\ower Detection Limit (LDL) for tritium in water is 0.4 x 10"^ yCi/ml which is 0.04% of the RCG.
' DOE Radioactivity Concentration Guide (RCG) which is compared to tritium concentration in water not used for drinking purposes = 1000 x 10"' yCi/ml for the general population and soluble form of tritium.
^Error limits include only counting statistics at 95% confidence level.
21

1 Table 15 - SUMMARY OF TRITIUM
Number of Location Samples
Bellbrook 1 j Centerville 1 1 Dayton 1
Franklin 1 Germantown 1 Kettering 1 Miamisburg 3 Middletown 1 Moraine 1 Springboro 1 Waynesville 1 West Carroll ton 1
\ower Detection Limit (LDL)
LEVELS IN COMMUNITY DRINKING WAT
Tritium Range
(10 ' uCi/ml)
_ -----
1.9 - 4.6 _ „
_ „
-
for tritium oxide
Average^'*^ (10 ' uCi/ml)
0.5 ± 0.4 1.1 ± 0.4 0.5 ± 0.4 1.3 + 0.4 0.8 + 0.4 0.8 ± 0.4 2.8 ± 0.6 0.9 ± 0.4 0.7 ± 0.4 1.3 ± 0.4 0.6 ± 0.4 2.0 ± 0.4
is 0.25 X 10"'
ER IN 1977 1
Percent of RCG
2.5 5.5 2.5 6.5 4.0 4.0 14.0 4.5 3.5 6.5 3.0 10,0
uC1/ml which is 1.2% of the EPA Standard for community drinking water. EPA Drinking Water Standard for tritium
- 20 x 10 pCi/ml for community drinking water systems. Error limits include only counting statistics at 95% confidence level.
Location
B-1 B-2 B-3 J-1
-Table 16 - TRITIUM IN PRIVATE WELLS IN 1977-
Tri t ium Number of Samples
25 25 25 24
Range (10"' pCi/ml)
33.0 - 59.0 23.6 - 35.7 22.4 - 37.3 19.4 - 49.3
Average^^b,d Percent (10"' pCi/ml) Standard
46.7 ± 1.4 29.9 ± 1.1 31.1 ± 1.2 33.3 ± 1.2
233 149 155 165
These concentrations are the average levels for 1977. The latest data obtained in March 1978 show that these levels have been reduced considerably as follows: B-1 = 22.6, B-2 = 22.3, B-3 = 20.9, and J-1 = 27.4 (x 10~' pCi/ml). All wells are approaching compliance with the new EPA standard of 20 X 10-' yCi/ml.
^Lower Detection Limit (LDL) for tritium in water is 0.4 x 10-' laCi/ml which is 0.04% of the EPA Standard.
^EPA Standard for tritium in community drinking water systems = 20 x 10"' viCi/ml. Mound is using the EPA Standard as a guide for the private water supplies.
Error limits include only counting statistics at 95% confidence level.
22

There is no health problem associated
with the levels of tritium in local water
supplies although they exceed the new
EPA standard. The EPA's very conservative
regulations for tritium are essentially a
nondegradation standard and are not based
on new toxicological or epidemiological
evidence of deleterious health effects
and do not condemn water supplies that
exceed the new standards.
Since 1970, changes in operating proced
ures reduced the Mound Facility tritium
effluent concentration by a factor of
almost 50 and resulted in a continuing
decrease of tritium in the private wells.
In order to accelerate the rate at which
tritium was being dissipated from the
aquifer and to achieve compliance of the
private wells with the new EPA standard
at the earliest possible time. Mound ini
tiated a forced water-turnover program for
the aquifer using a high-capacity well at
the Mound site and an old well no longer
used by the City of Mxamisburg. These
wells pumped continuously from spring of
1977 for the remainder of the year. In
creased water infiltration to and dis
charge from the aquifer have brought some
of the wells into compliance with the EPA
standard. It is anticipated that the
pumping program will result in all pri
vate wells achieving compliance during
1978. This program has been approved by
the Ohio EPA and D. S. EPA. Mound has
a continuing commitment to keep these
agencies appraised of the program pro
gress to achieve compliance by the
affected wells.
A study to determine the impact of rain-
out of tritium from airborne emissions of
tritium was conducted during 1977. Pre
cipitation samples were collected at var
ious locations around Mound Facility and
analyzed for tritium. In addition, on
several occasions, rainwater runoff was
collected and analyzed.
The total 1977 rainfall was 34.88 in., with
an average tritium concentration of 4
nCi/liter. A calculated total of 10.94 Ci
of tritium was in the rainfall over an
area of 1-km radius around Mound Facility
during the year, of which an estimated 2.8
Ci infiltrated the aquifer. This represents
less than 0.1% of the total tritium released
to the atmosphere from Mound Facility and
only 7% of the total amount withdrawn from
the aquifer during the aquifer pumping pro
gram. Because a large portion of the total
collected tritium fell during periods of
heavy rain, with a resultant increased run
off, the total contribution to the aquifer
could be much lower than 2.8 Ci.
Runoff water exhibited an average tritium
concentration of 5 nCi/liter and never ex
ceeded 10 nCi/liter. This concentration
is well within the U. S. EPA standard for
drinking water and is similar to the meas
ured average tritium concentration in rain
water.
Two private wells and Miamisburg city
water were sampled and analyzed monthly
for plutonium-238. These samples were
large volume water samples averaging 40
liters. The average plutonium-238 concen
tration for these locations was <0.46 x 10"^
yCi/ml which is <0.002% of the applicable
DOB RCG for the general population. These
results are shown in Table 17.
Water - Noeradioacti¥C Mound Facility has a discharge permit under
the National Pollutant Discharge Elimina
tion System (NPDES) issued by Region V of
the U. S. EPA. The permit specifies
23

Table 17 - PLUTONIUM-238 IN PRIVATE WELLS AND MIAMISBURG
MUNICIPAL DRINKING WATER IN 1977
238p^
Number of Range ' ^ Percent Location Samples^ ( 1 0 " " nCi/ml) ( 1 0 " " yCi/ml) of RCG
Miamisburg 2 - <0.1 ± 0.01 <0.0005 B-1 2 - <0.1 ± 0.01 <0.0005 B-2 2 - <0.1 ± 0.01 <0.0005 B-3 2 0.21 - 2.8 1.5 ± 0.08 0.0075 J-1 2 <0.1 - 0.9 <0.5 ± 0.02 <0.0Q25
^Two composite large volume water samples were analyzed from each locat ion from water col lected during CY-1977.
^Lower Detection L imi t (LDL) fo r " ' P u is 0.1 x 1 0 " " liCi/ral which is 0.0005% of the RCG.
'^Applicable DOE Radioact iv i ty Concentration Guide (RCG) fo r "^Pu in water = 20,000 x l O " " |iCi/ml fo r the general population and soluble form of ^^ 'Pu.
Error l im i t s include only counting s t a t i s t i c s at 95% confidence l eve l .
l i m i t a t i o n s for p o l l u t a n t s in the two e f f luen t streams from Mound t h a t discharge to the Great Miami River . The discharge from o u t f a l l number 001 includes the d i s charge from the s an i t a ry waste t reatment p l a n t , r ad ioac t ive waste d isposa l f a c i l i t y , s ing le -pass cool ing water , z e o l i t e softener backwash, and some storm water runoff. The discharge from o u t f a l l number 002 cons i s t s of s ing le -pass cooling water , cooling-tower blowdown, b o i l e r - p l a n t blowdown, z e o l i t e softener backwash, and most of the storm water runoff. A 24-hr composite sample of each e f f luen t stream i s co l l ec t ed au to ma t i ca l ly . The volume of samples co l l ec t ed i s p ropor t iona l to the flow in the stream. The composite e f f luen t water samples are analyzed for water q u a l i t y parameters according to standard methods [14] . The r e s u l t s of e f f luen t stream analyses for 1977 are summarized in Tables 18 and 19. Only two exceptions occurred during 1977. The exceptions were s l i g h t l y e levated suspended so l ids discharged from o u t f a l l 001 during Ju ly . These waterborne
e f f luen t s had no s i g n i f i c a n t e f f ec t on the River s ince the r i v e r flow, even under low flow cond i t ions , was approximately 350 times the maximum flow discharge from Mound during 1977. These data show t h a t the Mound r e leases to the Miami River did not cause the Ohio Stream Standards to be exceeded.
Foodstuffs and vegetation -radioactive Various locally grown foodstuffs and vege
tation samples are collected from the sur
rounding area. The intent of this portion
of the Environmental Monitoring Program is
to determine whether there is any uptake
and concentration of radionuclides by plant
or animal life. Where possible, sampling
sites are chosen at maximum deposition lo
cations predicted on the basis of the dif
fusion model developed for Mound Facility
(15]. Field crops and vegetables are col
lected on the basis of this diffusion model.
Milk is collected from individual farms
closest to the Facility. Aquatic life is
trapped from the Miami River generally
24

Table 18 - 1977 NATIONAL POLLUTANT DISCHARGE ELIMINATION SYSTEM-PERMIT DATA FOR STATION 001
Parameter
Fl ow , MGD
BOD5
Fecal Coliform
Suspended Solids
Dissolved Oxygen
Residual Chlorine
Oil and Grease
pH
Organic Carbon
Ammonia
Reported Permit
Reported Permi t
Reported Permit
Reported Permi t
Reported Permi t
Reported Permit
Reported Permit
Reported Permit
Reported
Reported
No. Samples
Cont.
88
12
104
240
52
52
240
52
20
Minimum
0.07
0.3
NO
1.2
5.2
ND
NO
6.2 5.0
1
0.1
Maximum
0.34 0.92
7.3 45
52 400
32.5 45
10.9
0.6 0.8
8.1 10
9.0 9.0
86
0.1
Average
0.18 0.53
2.2 30.0
15 200
12 30
8.4 5
0.1
1.3
30
0.1
^ND - none detectable.
MGD - million gallons per day.
Values for fecal coliform are number of coliform per 100 ml of water and pH is reported in pH units.
All other values are in minigrams per liter.
Standards are those in effect ohrough June 30, 1977. More restrictive standards went into effect on July 1. These are given in the Appendix.
25

, Table 19 - 1977 NATIONAL POLLUTANT DISCHARGE ELIMINATION —-, SYSTEM PERMIT DATA FOR STATION 002^
Parameter
Flow, MGD
Suspended Solids
Dissolved Oxygen
Residual Chlorine
Oil and Grease
pH
Dissolved Solids
*ND - none
Reported Permit
Reported Permi t
Reported Permit
Reported Permi t
Reported Permi t
Reported Permit
Reported Permit
detectable.
MGD - million gallons
All other
Standards restricti given in
values are
are those i ve standards the Appendix
No. Samples
Cont.
68
22
38
40
180
65
per day.
in milligrams
Minimum
0.18
3.0
5.1
<0.05
ND
6.0 6.0
242
per liter.
Maximum
0.90
24.6 25.0
12.0
0.05 0.10
7.0 10.0
9.0 9.0
2918 3000
except pH.
Average
0.38 0.53
10.6 20.0
9.2 >5.0
<0.05
0.8
913 2000
n effect through June 30^ 1977. More went into effect on July 1. These are
downstream of Miamisburg anta from adja
cent waterways, depending upon avail
ability of fish. Grass samples are
collected in the vicinity of the surface
water locations shown in Figure 5. The
plutonium-238 content of the foodstuff
and vegetation samples including milk
is determined by ashing the samples and
then proceeding with the same techniques
used for plutonium-238 analyses of air
samples (see section on Air - Radio
active) . Milk samples are analyzed for
tritium oxide by distilling the water
fraction from an aliquot. The distillate
is then analyzed for tritium by liquid
scintillation spectrometry in the same
manner as the water samples (see section
on Water - Radioactive). The results of
the foodstuff and vegetation analyses are
summarized in Tables 20 and 21. The con
centration is given in terms of the sample
weight (wet weight) before ashing. The
vegetables analyzed were turnips and
potatoes. The sample of aquatic life
analyzed included only the edible fleshy
portions of fish. No evidence has been
found that there is any significant up
take or concentration by plant or animal
26

1 Table 20 -
Type of Sample
Milk
Vegetables
Grass
Aquatic Life
^Lower Detection
Lower Detection
' Lower Detection
Lower Detection
PLUTONIUM-238 IN FOODSTUFFS AND VEGETATION IN 1977— ,
"«Pu Number of Range Average '' '' ''* Samples (lO"" yCi/q) (10"''' yCi/g)
3
4
25
4
Limit (LDL)
Limit (LDL)
Limit (LDL)
Limit (LDL)
<2.0 - 2.1
<7.5 - n.o
<6.6 - 44.6
<5.3 - 9.6
for ' 'Pu in milk is
for ^"Pu in vegetabl
for '"'Pu in grass is
for ^^^Pu in aquatic
<2.0 ± 0.8
<8.4 ± 2.8
13.1 ± 6.2
<5.7 ± 1.4
2.0 X lO'i" yCi/g
es is 7.5 X 10"'° pCi/g
6.6 X 10"'° viCi/g
life is 5.3 x 10"" pCi/g
^Error limits include only counting statistics at 95X confidence level.
-Table 21 - TRITIUM IN FOODSTUFFS AND VEGETATION IN 1977-
Type of Sample
Number of Samples
Milk
Tritium Range
(10"^ tiCi/g)
0.27 - 0.45
Average^'^ (10"« yCi/g)
0.38 ± 0.23
\DL fo r t r i t i u m in milk = 0.16 x lO"*' wCi/g.
^Error l im i t s include only counting s t a t i s t i c s at 95% confidence level
l i f e of the rad ionucl ides handled a t Mound F a c i l i t y .
The r e s u l t s of the s i l t sample analyses are found in Tables 22, 23, and 24.
Silt - radioactive
Silt samples were collected from the
surface water sample locations shown in
Figure 5, These samples were obtained
by filtration of sediment (silt) from
the water that was collected from these
locations.
Soil - radioactive
During CY-1977, emphasis was placed on
completing Mound's Soil Inventory for plu
tonium-238. Essentially all the soil
samples taken and analyzed during CY-1977
were related to the Soil Inventory Program,
27

1 Table 22 -MONITORING
j Number of Location Samples
1 1 2
2 2
3 2
4 2
5 2
PLUTONIUM-238 IN SILT FROM RIVER , LOCATIONS IN 1977
\ower Detection Limit (LDL)
238py
Range
0.51 - 1.1
0.48 - 14.4
2.6 - 2.8
4.4 - 5.1
<0.3 - 1.6
for "«Pu in silt
Error limits include only counting statistics
238py
Average*'^
0.8 ± 0.05
7.4 ± 0.07
2.7 ± 0.12
4.7 ± 0.15
<0.9 ± 0.04
is 0.3 x 10"6 pCi/g.
at 95% confidence level.
-Table 23 - PLUTONIUM-238 IN SILT FROM SURFACE MATER MONITORING LOCATIONS IN 1977-
Location
10
11 12
13
14 15
16 17
Number Sampl {
2
2
2 2 2
2
2 2
of 5S (10
<0
238py
Range
.a
_a
_a
_a
_a __a
_a
3 - 0.55
238pu
Average^»^ (.1P~ yCi/g)
<0.3 ± 0.02
<0.3 ± 0.01
<0.3 ± 0.01
<0.3 ± 0.03
<0.3 ± 0.02
<0.3 ± 0.001
<0.3 ± 0.05
<0.4 ± 0.05
\ower Detection Limit (LDL) for ""Pu is 0.3 x 10"^ pCi/g.
Error limits include only counting statistics at 95% confidence level,
r Table 24 - PLUTONIUM-238 IN SILT FROM CANAL/POND AREA SILT IN 1977 — ,
238py 238py
Number of Range Average^'"^ Locationa Samples (10"* pCi/g) (10"* yCi/g)
8 (South Canal) 2 61.1 - 263.9
^Locations are shown in Figure 5.
''Lower Detection Limit (LDL) for *'Pu in silt is
* Error limits include only counting statistics at
162.5 ± 0.63
0.3 x 10"* pCi/g.
95? confidence level.
The purpose of the soil inventory was to
establish the quantity of plutonium-238
which was deposited in the environment
from Mound Facility stack emissions. A
preliminary soil inventory was performed
in 1975; however, soil sampling was not
completed, and additional samples were
taken in 1977, to extend the soil iso-
pleths to background concentrations.
Soil core sample values around and with
in the Facility site boundary were used
to arrive at an estimate of deposition
of airborne plutonium~238 from Facility
operations. The core sample depths in
most cases were 30 cm with a core diam
eter of ~8 cm. Ten cores were collected
at each sampling location. The ten cores
were composited, dried, crushed, and
passed through a quarter-inch mesh screen.
The sample was then riffled down to
approximately 3 kg and pulverized to pass
a 60-mesh sieve. Aliquots of 500 g or
1000 g, depending on soil location, were
then taken from this homogenized sample
for analysis. The analytical scheme used
for these analyses was essentially the
HASL (now EML) Procedure No. E~Pu-06
using plutonium-24 2 as the internal
tracer.
A series of soil sampling locations
sampled earlier were reinforced by 31
additional locations in 16 different
directions and distances from the Facil
ity. A total of 79 soil sampling loca
tions were used in the inventory.
values for fallout or background plutonium
[23]. The plutonium-238 values in these 2
samples averaged 0.1 mCi/km and any value
exceeding that level was assumed to be the
result of past emissions from Mound
facilities.
The soil sampling values along each of 16
equally spaced radials originating in the
center of Mound Facility were fit to power
function curves by a least squares program.
The concentration along each of the 16
radials is represented by the equation:
y = ax 2
where y = concentration, mCi/km
a = constant
X = distance, km
b = exponent, <0
Table 25 shows the values a, b, and the
correlation coefficient for each of the
16 radials. The distances between each
radial were obtained by a data smoothing
technique. The isopleths were then
completed and the area between isopleths
was measured by planimetry. The concen
tration calculated at the midpoint dis
tance between each isopleth was used as
the average concentration for the area be
tween the isopleths. The isopleth plot
is shown in Figure 7.
The total quantity of plutonium-238 in the
offsite environment due to airborne emis
sions from Mound operations is estimated
by this technique to be 360 mCi. The error
associated with this value is estimated to
be +35% which includes errors due to chem
ical analysis, counting, area measurement,
and sampling. Radiation dose to the public
due to resuspended plutonium, even from the
areas of maximum concentration, is well
within the proposed EPA standard for trans
uranium elements in soil.
Soil background levels were obtained by
collecting four additional samples at
0°, 90°, 180° and 270° at distance rang
ing from 34 to 51 km (21 to 32 mi). The
ratio of plutonium-239 to plutonium-238
ranged from 22 to 27 for these samples
which is in good agreement with accepted
29

-Table 25 - CONSTANTS FOR THE EQUATION: y = ax" AND CORRELATION COEFFICIENTS SHOMING GOODNESS OF FIT
Direct ion Radial
(degrees)
0
22.5
45
67.5
90
112.5
135
157.5
180
202.5
225
247.5
270
292.5
315
337.5
Constai a
10.59
16.33
6.57
11.08
14.16
6.41
4.07
1.32
0.83
i.n 3.30
13.53
5.30
6.67
6.08
2.02
Evaluation of potential dose to the public A dose assessment was performed for radio
nuclides in the environment from Mound
Facility operations. These radionuclides
are plutonium-238 and tritium. Tritium
(oxide) is the only radionuclide at Mound
Facility for which the critical organ is
the whole body. The critical organs for
plutonium-238 are asssumed to be the lung
for insoluble material and the bone for
soluble material. The solubility of plu
tonium-238 in the receptor is unknown;
therefore each dose evaluation for both
lung and bone were based on total con
centration of plutonium-238 found in the
environment. This approach gives a very
conservative estimate of dose equivalents.
Exponent b
-1.96
-1.98
-1.65
-1.93
-1.97
-1.89
-1.55
-1.49
-0.90
-1.03
-1.58
-2.06
-1.66
-2.24
-2.43
-1.92
Correlation Coefficient
-0.98
-0.98
-0.98
-0.97
-0.97
-0.99
-0.98
-0.99
-0.98
-0.99
-0.93
-0.91
-0.96
-0.99
-0.99
-0.99
Pltttomiiiii-238 assumptions
and methodology The dose equivalent estimates for pluton
ium-238 were based on environmental moni
toring data for CY-1977. The estimates for
maximum dose equivalent to the lung at the
site boundary and maximum dose equivalent
to the lung in individuals were based on
the maximum onsite average concentration
of plutonium-238 in air from onsite sam
plers (sampler 213) since the samplers are
in close proximity to the site boundary.
The maximum dose equivalent to the lung in
population group(s) was based on the maxi
mum offsite average concentration of plu-
tonium-23B in air (sampler 123).
The estimates for maximum dose equivalent
to the bone at the site boundary and in
30

POPULATIONS OF CITIES
#2500-5000
05000-10,000
• 10,000-15,000
^ > 15,000
PLUTONIUM-238 IN SOIL ISOPLETHS
mCi/km^
. ™ . . _ _ _ . 0.6
. . . . . . . . . . . . 100
FIGURE 7 - Plutonium-238 1n soil isopleths (mCi/km^).
31

individuals were also based on the maxi
mum onsite average concentration of plu
tonium-238 in air and the maximum offsite
average concentration of plutonium-238
in drinking water (average of B-1, B-2,
B-3). The maximum dose equivalent to
the bone for individuals in population
group(s) was based on the maximum offsite
average concentrations of plutonium-238
in air and water (Miamisburg drinking
water). The total dose equivalent for
bone was obtained by the addition of the
dose equivalent of plutonium in air and
the dose equivalent of plutonium in water.
The term "maximum dose equivalent at the
site boundary" and "maximum dose equiva
lent to individuals" refer to the maxi
mum dose equivalent possible for individ
uals to receive assuming they remain at
the site boundary 24 hr/day and 365 days/
yr. The term "maximum dose equivalent
for individuals in population group (s),"
refer to those individuals who reside in
a location adjacent to Mound Facility who
receives the maximum dose equivalent
values found in the offsite environment.
The calculational methods can be found
in the Appendix.
Tritium (oxide) assumptions
and methodology The dose equivalent estimates for tri
tium (oxide) were also based on environ
mental monitoring data for CY-1977. The
concentrations used for dose equivalent
estimates for tritium (oxide) were
arrived at by the same method as that
used for plutonium. The maximum average
onsite air concentration was measured at
sampler 212, and the maximum drinking
water concentration was the average of
B-1, B-2, and B-3. The maximum average
offsite air concentration was measured
at sampler 102, and the maximum concentra
tion of drinking water for individuals
in a population group was Miamisburg
drinking water. The total dose equivalent
for the whole body was obtained by addi
tion of the dose equivalent of tritium
(oxide) in air and the dose equivalent
of tritium (oxide) in water. The calcu
lational methods can be found in the
Appendix. The results of the dose esti
mate calculations are shown in Table 26.
The 80-km (50-mi) person-rem (whole body)
dose equivalent estimates were based on
average tritium (oxide) data from environ
mental air sampling stations, average tri
tium (oxide) data in coramunity drinking
water, and atmospheric dispersion estiiaates.
Two ranges of dose equivalent estimates
based on distance from Mound Facility,
were considered to obtain the 80-km (50-mi)
person-rem dose estimate. The first range
was from 0 to 3.2 km (2 mi). The second
range was from 3.2 to 80 km (50 mi).
The 0 to 3.2 km (2 mi) range dose estimate
for airborne tritium oxide was obtained
from the average concentration (less back
ground) of nine offsite tritium (oxide)
samplers with a 3.2 km (2 mi) radius of
Mound Facility. The dose in this distance
range from tritium (oxide) in water was
obtained from a weighted average of drink
ing water concentrations. These dose
equivalents from tritium (oxide) in air and
in water were summed.
The 3.2 to 80 km (50 mi) range dose esti
mate was obtained by finding the midpoint
distance where the average tritium (oxide)
concentration of the remaining offsite
samplers would be located. This value is
32

-Table 26 - DOSE EQUIVALENT ESTIHATES
SB (m . Lung Bone Mhole Body
Maximum dose equivalent at the site boundary
Maximum dose equivalent to an individual
Maximum dose equivalent to an individual in the population group(s)
Plutonium-238 (mrem/yr) Tritium Oxide (mrem/yr)
0.11
0.11
0.047
0.047
0.036 0.016
3.47
3.47
0.21
estimated at 6.3 km (4 mi) [21]. From
this distance and average concentrations
of tritium (oxide) at sampling locations
from 3.2 to 32 km (20 mi), it was deter
mined that the maximum distance of in
fluence from Mound Facility is -32 km.
Beyond 32 km the levels are calculated
to be background concentrations.
For comparison, the person-rem values from
natural radiation, including cosmic rays
and terrestrial radiation, would be approx
imately 320,000 person-rem for the 0 to
80 km (50 mi) range [22]. The dose com
mitment due to natural background tritium
alone is 80 person-rem for the 0 to 80 km
range.
The dose equivalent for tritium (oxide)
from 3.2 to 32 km (20 mi) was based on
the average of the remaining tritium
(oxide) air sample concentrations and the
average of the remaining community drink
ing water concentrations. The calcula
tions are shown in the Appendix.
These calculated doses were then weighted
by the population in each range. The
total person-rem from 0 to 32 km is equal
to 12.2 person-rem in addition to back
ground. Based on diffusion model calcu
lations, the remaining population from 32
to 80 km (50 mi) is not receiving dose
from tritium (oxide) emissions from
Mound Facility; therefore, the total per
son-rem from 0 to 80 km from tritium (ox
ide) emissions from Mound Facility is
equal to 12.2 person-rem.
33

Eefcrenccs 1. statistical Abstracts of Ohio -- 1969,
Economic Research Division, State of
Ohio, March 1969, p. 6.
2. B^PO£t_for_ConsultatiOTo^
Metropolitan Dayton Intrastate Air
Quality Control Region, U. S. Depart
ment of Health, Education and Welfare,
Public Health Service, Consumer Pro
tection and Environmental Health Ser
vice, National Air Pollution Control
Administration, September 1969, p. 11.
3. 40 CFR 133, Environmental Protection
Agency Regulations on Secondary Treat
ment Information.
4. R. C. Menzil, "Soil-Plant Relation
ship of Radioactive Elements," Health
Phys., 11, 1325-1332 (1965).
5. W. E. Sheehan, M. L. Curtis, and P,
C. Carter, Development of a Low-Cost
Versatile Method for Measurement of
HTO and HT in Air, MLM-2205 (February
14, 1975), 15 pp.
6. ERDA Manual Chapter 0524.
7. Fallout Program Quarterly Report,
HASL-281, New York Operations Office,
Health and Safety Laboratory (April 1,
1974), pp. B-104 and B-105.
2- Radiation Data and Reports, Vol. 15,
Numbers 5, 6, 9, and 10, U. S. En
vironmental Protection, 1974.
9. D. Edgington, Argonne National Lab
oratory, "The Behavior of Plutonium
in the Miami River Watershed," Pri
vate Communication in regard to
Schedule 18 9.
10. A. P. Hull, Health Physics and Safety
Division, Brookhaven National Labora
tory, Private Communication, June 28,
1974.
11. USEPA, Estimate of Ionizing Radiation
Doses in the United STates, 1960-2000,
ORP/CSD, 72-1.
12. Compilation of Air Pollutant Emission
Factors, 2nd edition, U. S. Environ
mental Protection Agency, Ap-42, March
1975.
13. Environmental Radioactivity Surveil
lance Guide, ORP/SID, 72-2, U. S. En
vironmental Protection Agency, Office
of Radiation Programs, June 1972.
14. M. J. Taras, et al. (ed), Standard
Methods for the Examination of Water
and Waste Water, Thirteenth Edition,
American Public Health Association,
Washington, D. C , 1971, 874 pp.
15. E. C. Eimutis, L. B. Mote, Develop
ment of an Atmospheric Diffusion
Model for Optimum Location of Sampling
Sites in the Mound Laboratory Environ
ment, February 20, 1976.
16. "Report of International Commission on
Radiological Protection Committee II on
Permissible Dose for Internal Radiation
(1959)," Health Phys., 3, 15 (1960).
17. ICRP Task Group on Lung Dynamics, "Depo
sition and Retention Models for In
ternal Dosimetry of the Human Respir
atory Tract," Health Phys., 12, 1973
(1966) .
34

The Metabolism of Compounds of Plu
tonium and Other Actinides, ICRP
Publication 19, International
Commission on Radiological Protec
tion, Pergamon Press, New York
(1972).
International Commission on Radio
logical Protection, "Progress Report
from ICRP," Health Phys., 17, 389
(1969).
Basic Radiation Protection Criteria,
National Council on Radiation Pro
tection and Measurements, Report
No. 39 (January 15, 1971), p. 83.
21. D. Bruce Turner, Workbook of Atmos
pheric Dispersion Estimates, AP-26,
U. S. Environmental Protection Agency
(July 1971), p. 14.
22. D. G. Carfagno and B. Robinson,
Annual Environmenta.1 Monitoring
Report; Calendar Year 1974, MLM-
2232 (April 30, 1975), 40 pp.
23. E. P. Hardy, P. W. Krey and H. L.
Volchek, Global Inventory and Dis
tribution of Pu-238 from SNAP 9A,
HASL 250 (March 1, 1972).
35


Appendix Applicable standards RADIOACTIVE STANDARDS
In conformance with DOE Manual Chapter
0524, "Standards for Radiation Protec
tion," offsite sample results are com
pared with RCG's established for the gen
eral population. These RCG's are derived
by dividing the RCG's for an uncontrolled
area by three.
Onsite sample results are compared with
the uncontrolled area RCG's which are
applicable for individuals in the popu
lation.
The RCG values (in microcuries per
milliliter - yCi/ml) used for comparison
purposes for the various types of samples
in this report are listed below. In
all cases, these are the most restric
tive RCG's
Plutonium-238 (Soluble Form)
Air
General Population 2x10"^'* laCi/ml
Uncontrolled Area 7xl0~14 pci/ml
(Individuals in
the Population)
Water (DOE RCG is compared to water not
used for drinking purposes)
Water
General Population
Uncontrolled Area
(Individuals in
the Population)
Tritium (Soluble Form)
Air
General Population
Uncontrolled Area
(Individuals in
the Population)
2xl0~6
5x10⁻⁶
pCi/ml
yCi/ml
7x10"^ pCi/ml
2x10"" liCi/ml
General Population
Uncontrolled Area
(Individuals in
the Population)
1x10"-^ pCi/ml
3x10"^ pCi/ml
As of June 24, 1977, community drinking
water quality is regulated by the EPA
National Interim Primary Drinking Water
Regulations for Radionuclides. The new
standard = 20 x lO'^ vici/ml (20,000 pCi/1)
Foodstuffs
There are no RCG values specified for
foodstuffs.
Soil
There are no guidelines established for
radioactive species in soil. (The U. S.
EPA has guidelines under consideration.)
NONRADIOACTIVE STANDARDS
Water
Region V of the USEPA has issued a dis
charge permit under NPDES regulations cov
ering both Mound Facility liquid effluent
streams. The discharge limitations for
each effluent stream through June 30, 1977,
are as follows:
Outfall Number 001
Flow (106 gal/day)
BOD-5 Day (mg/liter)
Suspended Solids
(mg/liter)
Dissolved Oxygen
(mg/liter)
Residual Chlorine
(mg/liter)
Oil and Grease
(mg/liter)
Fecal Coliform
(No./lOO ml)
pH
Daily Average
0.
30
30
5
200
6-9
.53
Daily Maximum
0.92
45
45
-
0.8
10
400
37

Outfall Number 002
Flow (106 gal/day)
Suspended Solids
(mg/liter)
Dissolved Oxygen
October-April
(mg/liter)
May-September
(mg/liter)
Residual Chlorine
(mg/liter)
Dissolved Solids
(mg/liter)
Oil and Grease
(mg/liter)
pH
Daily Average
0.53
20
Daily Maximum
25
>8
>5
0.1
2000
6-9
3000
10
The discharge limitations for each efflu
ent stream as of July 1, 1977, became
more restrictive and are as follows:
Outfall Number 001
Flow (10^ gal/day)
BOD-5 Day (mg/liter)
Suspended Solids
(mg/liter)
Dissolved Oxygen
(mg/liter)
Residual Chlorine
(mg/liter)
Oil and Grease
(mg/liter)
pH
Outfall Number 002
Flow (10^ gal/day)
Suspended Solids
(mg/liter)
Dissolved Oxygen
(mg/liter
Oc tobe r-Apri1
(mg/liter)
0.53
10
10
5
-
_
6-9
Daily Average
0.53
15
8
Outfall Number 002
May-September
(mg/liter)
Residual Chlorine
(mg/liter)
Oil and Grease
(mg/liter)
Dissolved Solids
(mg/liter)
pH
Daily Average
Daily Maximum
0.05
10
1500
6-9
2000
The Ohio EPA has established Water Quality
Standards (3745-1-01-3745-1-09). The
standards listed below are excerpted from
these regulations. These standards are
stream standards and apply to a stream
beyond a suitable mixing zone permitted
for discharges. They should not be com
pared with effluent concentrations.
ws:
0.92
15
15
_
0.5
10
-
Daily Maximum
-
20
-
Constituent
Dissolved
pH
Oxygen
Fecal Coliform
Dissolved
Ammonia
Arsenic
Barium
Cadmium
Chloride
Chromium
Solids
(Hexavalent)
Cyanide (Free)
Fluoride
Foaming Agents (MBAS)
Iron
Lead
Manganese
Mercury
Oil & Grease
Phenols
Selenium
Silver
Copper
Zinc
Average Concentration
(mg/liter)
5.0
6-9
200 per 100 ml
1500
1.5
0.05
0.8
0.005
250
0.05
0.005
1.3
0.5
1
0.04
1
0.0005
5
0.01
0.005
0.001
0.005 - 0.075*
0.075 - 0.5*
•Dependent on CaCo., hardness
38
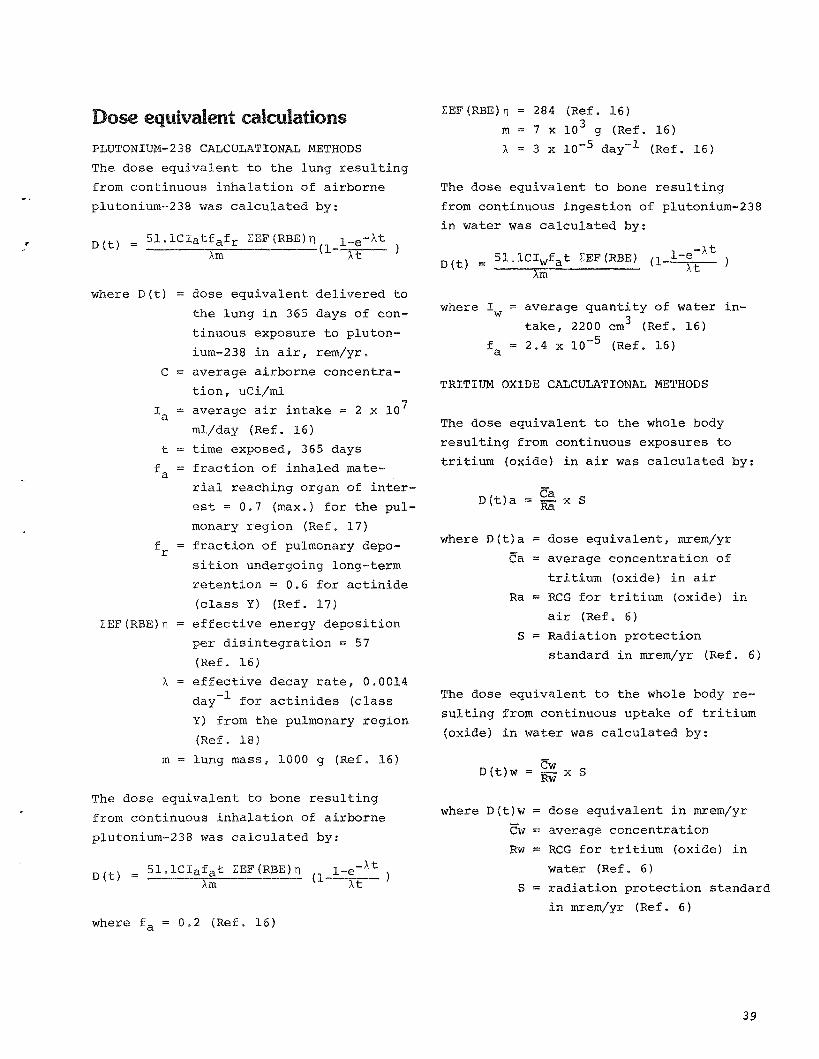
Dose equivalent calculations PLUTONIUM-238 CALCULATIONAL METHODS
The dose equivalent to the lung resulting
from continuous inhalation of airborne
plutonium-238 was calculated byi
D(t) S l . l C I a t f a f i - EEP(RBE)n i_p-Xt
( 1 - ^ Xm Xt
where D(t) dose equivalent delivered to
the lung in 365 days of con
tinuous exposure to pluton
ium-238 in air, rem/yr.
average airborne concentra
tion, yCi/ml 7
average air intake = 2 x 1 0
ml/day (Ref. 16)
time exposed, 365 days
fraction of inhaled mate
rial reaching organ of inter
est = 0.7 (max.) for the pul
monary region (Ref. 17)
fraction of pulmonary depo
sition undergoing long-term
retention = 0.6 for actinide
(class Y) (Ref. 17)
effective energy deposition
per disintegration = 57
(Ref. 16)
X = effective decay rate, 0.0014
day" for actinides (class
Y) from the pulmonary region
(Ref. 18)
m = lung mass, 1000 g (Ref. 16)
The dose equivalent to bone resulting
from continuous inhalation of airborne
plutonium-238 was calculated by:
I;EF(RBE)TI
D(t) Sl.lCIafat EEF(RBE)TI (1-: 1-e
-Xt
TF )
EEF(RBE)n = 284 (Ref. 16)
m = 7 x 10" g (Ref. 16)
X = 3 X 10"^ day"^ (Ref. 16)
The dose equivalent to bone resulting
from continuous ingestion of plutonium-238
in water was calculated by:
,-Xt D(t) = SLici^f^t J:EF(RBE) (1. 1-e
Tin TT )
where I = average quantity of water in
take, 2200 cm- (Ref. 16)
f„ = 2.4 X 10 -5 (Ref. 16)
TRITIUM OXIDE CALCULATIONAL METHODS
The dose equivalent to the whole body
resulting from continuous exposures to
tritium (oxide) in air was calculated by:
D(t)a =
where D(t)a =
Ca =
Ra =
Ca Ra x S
dose equivalent, mrem/yr
average concentration of
tritium (oxide) in air
RCG for tritium (oxide) in
air (Ref. 6)
Radiation protection
standard in mrem/yr (Ref. 6)
The dose equivalent to the whole body re
sulting from continuous uptake of tritium
(oxide) in water was calculated by:
D(t)w = g x S
where D(t)w = dose equivalent in mrem/yr
Cw = average concentration
Rw ~ RCG for tritium (oxide) in
water (Ref. 6)
S = radiation protection standard
in mrem/yr (Ref. 6) where f = 0.2 (Ref. 16)
39

Those dose equivalent values were
divided by 1.7 in order to reflect the
quality factor of one as recommended by
the International Commission on Radio
logical Protection [19] and the National
Council on Radiation Protection and
Measurements [20].
Person-rem calculations The equations used for this calculation
.in the 0-3.2 km range were:
D(t)a = If X S 0 - 3.2 t<a
where D(t)a = dose equivalent from 0 to 0 - 3.2
3.2 km from tritium (oxide)
in air
Ca = average tritium (oxide)
concentration in air from
0 to 3.2 km
Ra = RCG for tritium (oxide)
in air (Ref. 6)
S = radiation protection
standard for tritium (oxide)
in air in mrem/yr (Ref. 6)
D(t)w = ^ X S 0 -3.2 R w
where D(t)w = dose equivalent from 0 to 0-3.2
3.2 km from tritium (oxide)
in water
Cw = average tritium (oxide)
concentration in water
from 0 to 3.2 km
Rw = RCG for tritium (oxide)
in water (Ref. 6)
S = radiation protection stand
ard for tritium (oxide)
in water, mrem/yr (Ref. 6)
where D(t)a = dose equivalent from 3.2 to 3.2 - 3 2
32 km from tritium (oxide)
in air
Ca = average tritium (oxide) con
centrations in air from 3.2
to 32 km
Ra = RCG for tritium (oxide) in
air (Ref. 6)
S = Radiation Protection Standard
for tritium (oxide) in air,
mrem/yr (Ref. 6)
D(t)w = ^ X S 3.2.32 Rw
where D'(t)w = dose equivalent from 3.2 to 3.2-3 2
32 km from tritium (oxide)
in water
Cw = average tritium (oxide) con
centration in water from 3.2
to 32 km
Rw = RCG for tritium (oxide) in
water (Ref. 6)
S = Radiation Protection Standard
for tritium (oxide) in water,
mrem/yr (Ref. 6)
The total person-rem from 0 to 32 km is
obtained by;
ZK =/D(t)a + D(t) 0 \0-3.2 0-3.2 ") 7 ii (t)a + D(t)w\ 1; 2-3 2 3.2-3 2/3.
32 P 2
where IB. = person-rem within 32 km 3.2
IP = population from 0 to 3.2 km =
14,700 32 SP = population from 3.2 to 32 km = 3.2
881,241
The equations for these calculations in
the 3.2 to 32 km range are:
D(t)a 3.2 - 3 2
Ca Ri: X S
40
Other County and City Departments (Continued)
Distribution EXTERNAL
TID-4500, UC41 (266)
Consultants
W. E. Moddeman University of Dayton
A. Shapiro University of Cincinnati
Montgomery County Combined General Health District
William T. Burkhart Supervisor, Regional Air Pollution Control Agency
David B. Peden Director, Environmental Health
Dr. Robert A. Vogel Health Commissioner
Other County and City Departments
Dr. Kenneth Arn Director, Public Health City of Oakwood
Paul Asmussen Director of Public Health City of Middletown
Thomas Saygers Asst. Superintendent of Water Supply & Treatment Department of Water City of Dayton
Benton Wahl Health Commissioner Warren County
Dr. Paul Popp, Director Environmental Services Montgomery County
Dr. Arnold Leff Health Commissioner City of Cincinnati
David Morgan Village Engineer Springboro
John R. Harvey Butler County Health Commissioner Hamilton, Ohio
Miami Conservancy District
Donald T. Williams Chief Engineer
State of Ohio
Charles W. Forsthoff, Chief SW District Office, Ohio EPA
James Wynd Engineer-in-Charge Radiological Health Unit Ohio Department of Health
Ned E. Williams, Director Ohio EPA
Dr. John H. Ackerman Director Ohio Department of Health
Andrew Turner, Chief Div. of Industrial Wastewater Ohio EPA
Ernest C. Neal, Chief Office of District Operations Ohio EPA
Dr. K. L. Applegate, Chief Div. of Water Quality Ohio EPA
Major General James C. Clem Adjutant General
Lt. Col. James R. Williams Radiation Maintenance Offices Ohio Disaster Services Agency
J. Earl Richards Asst. Director Ohio EPA
Jack Wunderle, Chief Office of Air Pollution Control Ohio EPA
Ernie Rotering, Chief Div. of Wastewater Pollution Control Ohio EPA
James L. Kennedy, Chief Office of the Ten-Year Forecast Ohio Power Siting Commission
41

U.S. EPA - Cincinnati
Ernie Minor, Director Public Affairs
Gilbert M. Gigliotti, Director Technical Information
U.S. EPA - Washington, D. C.
James Martin Waterside Mall
Jay S. Silhanik Sanitary Engineer
U.S. EPA - Michigan-Ohio District Office
Director Michigan-Ohio District Office
U.S. EPA - Region V (Chicago)
Donald Wallgren Deputy Director Surveillance and Analysis Division
Iton Mustard, Chief federal Facilities Branch
Irving Bernstein Surveillance and Analysis Division
Pete Tedeschi Air and Hazardous Materials Division
U.S. EPA - Las Vegas, NV
Dr. Paul Hahn, Chief Actinide Analysis Section
U.S. EPA - Montgomery, AL
Dr. Richard L. Blanchard Eastern Environmental Radiation Facility
U.S. Nuclear Regulatory Commission
Dr. Daniel Montgomery Region II Altanta, GA
Monsanto Co., St. Louis
Dr. Carl D. Bohl Dept. of Medicine and Environ. Health
Monsanto Co., St. Louis (Continued)
P. P. Cunningham Engineering Director Env. and Util. Rate Cont.
Margaret E. Madden Research Center Corporate Research Department
J. R. Sayers Director, Environ. Practices Environ. Policy Staff
Monsanto Technical Library, St. Louis
Monsanto Research Corporation, Dayton
Richard K. Flitcraft (3) President
H. L. Williams, Acting Director Dayton Laboratory
Dr. D. J. Dahm, Manager Environ. Analytical Services Center
Dr. William H. Hedley
Manager, Environ. Control Section
Dr. A. D. Snyder
Steven Hoadley
Other Monsanto
Alexander Munn, Director Medicine and Environmental Health Monsanto Europe S.A.
DOE Headquarters
Walter G. Belter, Leader Regional Studies Program Div. Biomed. and Environ. Research
Maj. General Joseph K. Bratton Director, Div. of Military Application
John W. King, Director Office of Public Affairs
Dr. Lawrence E. Killion, Assoc. Director Division of Laser Fusion
Dr. F. C. Gilbert Deputy Director Div. of Military Application
42

DOE,ALO
R. R. Fredlund, Jr., Director Classification and Technical
Information Division
John F. Burke Asst. Manager for Operations
Jack R. Roeder, Director (12) Operational Safety Division
James E. Randall, Attorney Office of Chief Counsel
Other DOE
R. M. Munson, Acting Manager Dayton Area Office
Edward P. Hardy Environmental Measurements Laboratory
Other DOE Contractors
H. W. Patterson, Dept. Head Hazards Control Dept. University of California Lawrence Livermore Laboratory
Dr. George L. Voelz Health Division Leader University of California Los Alamos Scientific Laboratory
R. D. Baker, Division Leader Chemistry - Materials Science Div. University of California Los Alamos Scientific Laboratory
Duane C. Sewell Deputy Director University of California Lawrence Livermore Laboratory
R. G. Jordan, Manager Office of Safety and Environ. Protection Union Carbide Corp.
D. N. Edgington Ecological Sciences Section Radiological and Environ. Research Div. Argonne National Laboratory
R. B. Craner - 4010 Sandia Laboratories, Albuquerque
W. J. Howard, Executive Vice Pres. Sandia Laboratories, Albuquerque
L. M. Jercinovic, Mgr. Safety Standards and Engineering Dept. Sandia Laboratories, Albuquerque
Other DOE Contractors (Continued)
C. P. McKay, Manager Environ, and Health Services The Bendix Corporation
E. P. Forest, Manager Environ. Health and Safety Programs General Electric Company
R. E. Yoder, Director Health, Safety and Environment Rockwell International
W. D. Burnett, Manager Environ. Health Dept. Sandia Laboratories, Albuquerque
D. P. O'Neil, Director Occupational Health and Safety Division Argonne National Laboratories
J. D. McLendon, Superintendent Radiological Safety Dept. Union Carbide Corp.
Donald A. McKown Health Physicist - Radiation Safety Officer
Battelle Memorial Institute
Andrew P. Hull Environ. Protection Section HP and Safety Division Brookhaven National Lab
J. W. McCaslin, Branch Manager Safety Standards Aerojet Nuclear Co.
Dr. W. J. Bair, Manager Environmental and Safety Research Battelle, Pacific Northwest Lab
J. J. Fix Occupational and Environmental Safety Department
Battelle, Pacific Northwest Lab
J. P. Corley Occupational and Environmental Safety Department
Battelle, Pacific Northwest Lab
C. M. Patterson Superintendent, Health Physics B. I. duPont deNemours and Co.
Herman Phillips Health and Safety Director Mason and Hanger - Silas Mason
Company, Inc.
43

other DOE Contractors (Continued)
M. W. Boback, Chief Industrial Hygiene and Radiation Dept. National Lead of Ohio
Ralph F. Hoffer Manager, Health and Safety Energy System Program General Electric Company
Vergil S. Emler Supt. General Safety and Environ. Management
Goodyear Atomic Corporation
Dr. Norbert Golchert Argonne National Laboratory
Mr. Bill P. Smith Reynolds Electrical and Engr. Co. Inc.
Other
Mr. David T. Clark Ky. Radiation Control Branch
Dr. Eugene L. Saenger University of Cincinnati
Dr. Lawrence Wilding Ohio State University
Dr. McDonald E. Wrenn Dept. of Environmental Medicine New York University Medical Center
Dr. C. R. Cothern University of Dayton
INTERNAL
P. C. A. G. B. E. C. T. R. T. D. G. W. T. H. I. D. A. B. M. R. C. W. E. C. W. L. V. B. R. J. R. H. E. M. L. R. A. E. J. R. E. A. P.
Adams Barnett Baughn Bishop Braun Carfagno Cave Charbeneau Edling Farmer (100) Herman Huffman Huntington Jones Kokenge McClain Meyer Mullins Neff Reagan Vallee Vollmer
Publications (25) Records Management Library (15)
44