bill richardson nm & msa highlights market page 2 - 5 · bill richardson governor highlights Š...
TRANSCRIPT

Volume 33, No. 10, November 30, 2004
Conroy ChinoConroy ChinoConroy ChinoConroy ChinoConroy ChinoSecretarySecretarySecretarySecretarySecretary
Prepared by Economic Research and AnalysisP.O. Box 1928, Albuquerque, N.M. 87103Ph: (505) 841-8645
Bill RichardsonBill RichardsonBill RichardsonBill RichardsonBill RichardsonGovernorGovernorGovernorGovernorGovernor
HIGHLIGHTS � October 2004
LLLLLaborMMMMMarketRRRRReport
New MexicoNew MexicoNew MexicoNew MexicoNew Mexico
www.dol.state.nm.us
NM & MSA Highlights
Page 2 - 5
NM Household Data HistoryPage 6
Total Nonfarm Growth
NM Ranking
Page 6
NM Labor Force Estimates
Page 7
Unemployment Rate Rankings
by County and State
Page 8 & 9
Nonfarm Employment:
State & MSAs
Page 10-14
Average Hours & Earnings
& US Consumer Price Index
Page 15
NM Unemployment Insurance
Page 15
NM Economic Activity by AreaPage 16-17
IIIIINSIDE
Current Regional Nonfarm Employment Growth
October 2004 over October 2003 - Not Seasonally Adjusted
Beginning with the release of data for January 2005 in March, a redesigned method forproducing labor force estimates will be implemented. The redesigned method encompassesa number of changes including the implementation of improved time-series regressionmodels and the introduction of real-time benchmarking to national Current PopulationSurvey (CPS) estimates of employment and unemployment. In addition, the estimates willreflect routine annual updates to population estimates from the U.S. Census Bureau. Thesechanges will result in improved seasonal adjustment and ensure that estimates of employ-ment and unemployment for the states add to national totals. This also means that majoreconomic events, such as the onset of recessions, will be reflected in the state estimates ona more timely basis. This, along with other improvements, will reduce end-of-year revi-sions.
All historical data will be replaced going back to 1976. More information on the redesign isavailable from the BLS, Division of Local Area Unemployment Statistics Web site at
http://www.bls.gov/lau/lauschanges2005.htm
Upcoming Changes to Labor Force Estimates
4.9%
3.2%
2.5%
2.0% 1.9%1.6% 1.5%
1.3%1.0% 0.9%
0.0%
0.5%
1.0%
1.5%
2.0%
2.5%
3.0%
3.5%
4.0%
4.5%
5.0%
NV UT AZ NM WY US CO TX OK CA
Gro
wth U
.S. A
vera
ge

-2-
New Mexico Labor Force and Payroll Employment
New Mexico Prel. Revised Change FromSeasonally Adjusted Oct 2004 Sep 2004 Oct 2003 Sep 2004 Oct 2003Civilian Labor Force 911,600 910,600 902,700 +1,000 +8,900Employment 864,100 861,700 843,800 +2,400 +20,300Unemployment 47,500 48,700 58,900 -1,400 -11,400Rate 5.2% 5.4% 6.5%Rate (not seasonally adjusted) 5.1% 5.4% 6.3%
New Mexico�s seasonally adjusted unemployment rate was 5.2percent in October 2004, down from a revised rate of 5.4 percentin September. A year ago New Mexico�s unemployment rate was6.5 percent. Nationally the unemployment rate was 5.5 percent inOctober, which was higher than New Mexico�s rate.
In October, New Mexico had 200 more manufacturing jobs thanthis time last year. The increase is just a small proportion of thestate�s manufacturing base but is a significant milestone markinga turning point in the industry�s fortunes. Weakened by thenational recession and an emerging trend of jobs moving over-seas, the state lost 6,000 manufacturing jobs since October 2000.New Mexico has waited almost three and a half years to be able toreport a job count that is again higher than it was in the previousyear. Although we still carry the loss of 14 percent of the state�smanufacturing base, the prospects for manufacturing in NewMexico are better than they have been for many years. The SantaTeresa Industrial Park in Doña Ana County continues to attractnew tenants. The bus manufacturing plant in Roswell has openedagain, promising to deliver the first bus by the end of the year.Also, Eclipse Aviation continues to pursue an aggressive strategyto produce its Eclipse500 jet and plans to add 300 more workersover the next three years. It appears that the manufacturingemployment that remains in the state has emerged leaner and fitterfrom troubled times and is poised to continue recent modestemployment gains.
Overall job growth in New Mexico has held steady, at or abovetwo percent, for five consecutive months. The October year agocomparison was 2.0 percent higher, continuing recent solid per-formance. The state has added 15,900 jobs since last year and weremain one of the fastest growing states in the nation for employ-ment.
For a while two industries, mining and construction, have takenturns in holding the honor of being the state�s fastest growingemployers. This month, mining posted a 7.0 percent increase onthe year, and construction grew 6.4 percent. The mining industrycontinues to receive a tremendous boost from sustained higherprices for oil and natural gas. Higher prices justify the investmentin equipment and new exploration that is needed for expansion.Other types of mining in New Mexico are also showing improve-ment. Construction has added 3,100 jobs since last year, mostlydue to sustained higher demand for new homes as a result ofinterest rates that still remain very low by historical standards, buthave started to rise.
The educational and health services industry has slowed a littlerecently but continues to add jobs at a fairly strong pace. Sincethis industry is so large, the 3.4 percent growth rate translates into3,400 jobs. Many health services components have added asignificant number of jobs. The recent slowing of this industry�srapid growth is due to a number of factors including the homehealth care services component reaching a plateau level, havingalmost tripled in size since 2000 due to changes in state Medicaidpolicy. Job growth abruptly ended and this component was down100 jobs over the year. Private educational services also remainsstuck at last year�s employment level and social assistance em-ployment grew just 0.5 percent, adding only 100 jobs, which isalso a big reduction from the higher levels of growth of sixmonths ago. Other components continue to increase at a moderaterate, maintaining the overall industry�s vitality.
The professional and business services industry has done well toturn around earlier job losses into a 2,400-job gain in October.Prospects for this industry have improved, following three diffi-cult years. The employment services component has gatheredstrength as a sign that the rest of the economy is improving.Employment services increased employment 6.1 percent, adding1,000 jobs. Business support services has increased 20.4 percent,also adding 1,000 jobs. Another sign of general improvement inthe state�s job market can be seen in retail trade, which has added1,900 jobs since last year. Retail trade had been unable to add thismany jobs since the late 1990s. Wholesale trade increased em-ployment by 400 jobs from last year�s employment level.
The financial activities industry has added 700 jobs, mostly in thereal estate category that has benefited from the booming housingmarket. Leisure and hospitality employment continues to dofairly well due to expanding employment in food services anddrinking places, especially at full-service restaurants.
Government employment has increased 2,100 jobs since last year,growing a relatively slow 1.1 percent. Most of the new govern-ment jobs were in local government, especially in new or expand-ing tribally-owned casinos and resorts around the state. Stategovernment has added just 300 jobs. Federal government employ-ment continues the recent downward trend, dropping 300 jobs onthe year.
The information industry remains the only area where employ-ment levels have not recovered from hard times. Information wasdown 1,600 jobs on the year, all of them in the telecommunica-tions component of the industry. The recent MCI call centerclosure is reflected in these numbers.
-3-
(Bernalillo, Sandoval & Valencia Counties)
Albuquerque MSA Labor Force and Payroll Employment
Albuquerque Prel. Revised Change FromSeasonally Adjusted Oct 2004 Sep 2004 Oct 2003 Sep 2004 Oct 2003Civilian Labor Force 402,900 400,900 397,000 +2,000 +5,900Employment 383,700 382,500 374,100 +1,200 +9,600Unemployment 19,200 18,400 22,900 +800 -3,700Rate 4.8% 4.6% 5.8%Rate (not seasonally adjusted) 4.7% 4.9% 5.8%
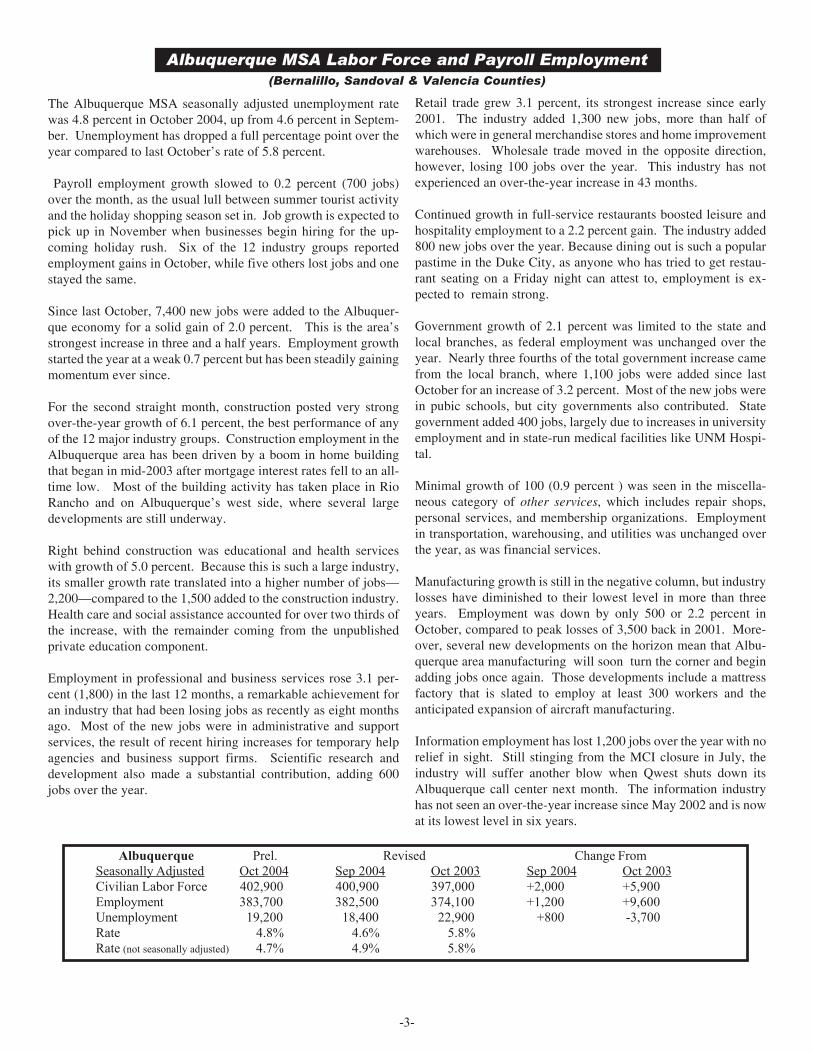
The Albuquerque MSA seasonally adjusted unemployment ratewas 4.8 percent in October 2004, up from 4.6 percent in Septem-ber. Unemployment has dropped a full percentage point over theyear compared to last October�s rate of 5.8 percent.
Payroll employment growth slowed to 0.2 percent (700 jobs)over the month, as the usual lull between summer tourist activityand the holiday shopping season set in. Job growth is expected topick up in November when businesses begin hiring for the up-coming holiday rush. Six of the 12 industry groups reportedemployment gains in October, while five others lost jobs and onestayed the same.
Since last October, 7,400 new jobs were added to the Albuquer-que economy for a solid gain of 2.0 percent. This is the area�sstrongest increase in three and a half years. Employment growthstarted the year at a weak 0.7 percent but has been steadily gainingmomentum ever since.
For the second straight month, construction posted very strongover-the-year growth of 6.1 percent, the best performance of anyof the 12 major industry groups. Construction employment in theAlbuquerque area has been driven by a boom in home buildingthat began in mid-2003 after mortgage interest rates fell to an all-time low. Most of the building activity has taken place in RioRancho and on Albuquerque�s west side, where several largedevelopments are still underway.
Right behind construction was educational and health serviceswith growth of 5.0 percent. Because this is such a large industry,its smaller growth rate translated into a higher number of jobs�2,200�compared to the 1,500 added to the construction industry.Health care and social assistance accounted for over two thirds ofthe increase, with the remainder coming from the unpublishedprivate education component.
Employment in professional and business services rose 3.1 per-cent (1,800) in the last 12 months, a remarkable achievement foran industry that had been losing jobs as recently as eight monthsago. Most of the new jobs were in administrative and supportservices, the result of recent hiring increases for temporary helpagencies and business support firms. Scientific research anddevelopment also made a substantial contribution, adding 600jobs over the year.
Retail trade grew 3.1 percent, its strongest increase since early2001. The industry added 1,300 new jobs, more than half ofwhich were in general merchandise stores and home improvementwarehouses. Wholesale trade moved in the opposite direction,however, losing 100 jobs over the year. This industry has notexperienced an over-the-year increase in 43 months.
Continued growth in full-service restaurants boosted leisure andhospitality employment to a 2.2 percent gain. The industry added800 new jobs over the year. Because dining out is such a popularpastime in the Duke City, as anyone who has tried to get restau-rant seating on a Friday night can attest to, employment is ex-pected to remain strong.
Government growth of 2.1 percent was limited to the state andlocal branches, as federal employment was unchanged over theyear. Nearly three fourths of the total government increase camefrom the local branch, where 1,100 jobs were added since lastOctober for an increase of 3.2 percent. Most of the new jobs werein pubic schools, but city governments also contributed. Stategovernment added 400 jobs, largely due to increases in universityemployment and in state-run medical facilities like UNM Hospi-tal.
Minimal growth of 100 (0.9 percent ) was seen in the miscella-neous category of other services, which includes repair shops,personal services, and membership organizations. Employmentin transportation, warehousing, and utilities was unchanged overthe year, as was financial services.
Manufacturing growth is still in the negative column, but industrylosses have diminished to their lowest level in more than threeyears. Employment was down by only 500 or 2.2 percent inOctober, compared to peak losses of 3,500 back in 2001. More-over, several new developments on the horizon mean that Albu-querque area manufacturing will soon turn the corner and beginadding jobs once again. Those developments include a mattressfactory that is slated to employ at least 300 workers and theanticipated expansion of aircraft manufacturing.
Information employment has lost 1,200 jobs over the year with norelief in sight. Still stinging from the MCI closure in July, theindustry will suffer another blow when Qwest shuts down itsAlbuquerque call center next month. The information industryhas not seen an over-the-year increase since May 2002 and is nowat its lowest level in six years.

-4-
(Doña Ana County)
Las Cruces MSA Labor Force and Payroll Employment
Annual Nonfarm Job Growth Rates - NM and Las Cruces
Las Cruces Prel. Revised Change FromSeasonally Adjusted Oct 2004 Sep 2004 Oct 2003 Sep 2003 Oct 2003Civilian Labor Force 80,700 81,600 79,500 -900 +1,200Employment 75,700 76,100 73,300 -400 +2,400Unemployment 5,000 5,500 6,200 -500 -1,200Rate 6.2% 6.7% 7.8%Rate (not seasonally adjusted) 5.5% 6.1% 6.9%
-1.0%
0.0%
1.0%
2.0%
3.0%
4.0%
5.0%
6.0%
Jan-
00
Apr
-00
Jul-0
0
Oct
-00
Jan-
01
Apr
-01
Jul-0
1
Oct
-01
Jan-
02
Apr
-02
Jul-0
2
Oct
-02
Jan-
03
Apr
-03
Jul-0
3
Oct
-03
Jan-
04
Apr
-04
Jul-0
4
Oct
-04
New MexicoLas Cruces
The seasonally adjusted unemployment rate in the Las CrucesMSA was 6.2 percent in October 2004, down from September�srevised rate of rate of 6.7 percent. A year ago the area�s unem-ployment rate was 7.8 percent.
The Las Cruces area added 200 jobs in October 2004. The newjobs were in state government, which includes New MexicoState University. All other industry segments remained at thesame level as the previous month.
The rate of over-the-year job growth for the Las Cruces area was3.0 percent comparing October 2004 with the same month a yearago. The Las Cruces area has added 1,900 jobs over the year.This rate of job growth is in the moderate range and is consistentwith recent performance.
A number of the industry groups have added a significantnumber of jobs within the county. Manufacturing employmentcontinues to do especially well. Over the last year, Doña AnaCounty has added 9.4 percent to its manufacturing base. Most ofthe 300 new jobs are at the Santa Teresa Industrial Park. Alsoadding 300 jobs, growing 8.1 percent, the construction industrycontinues to do well. The boom has come from low interestrates, which made housing more affordable to consumers.
Retail trade has done well to add 300 jobs, increasing 4.4 percentfrom a year ago. Another 300 jobs were also added to theeducational and health services industry, all in the private educa-tion component. This is better performance than the industry has
shown for a while, but still constrained compared to ear-lier years. The health services component has seen fiercecompetition between rival hospitals that overheated theindustry for a while until employment settled at lower butmore sustainable levels.
Government employment grew 1.4 percent, adding 300jobs. Federal government added 100 jobs and state gov-ernment remained at last year�s employment level. Localgovernment has added 200 jobs since last year.
Prospects for wholesale trade employment have improvedrecently with the addition of 200 new jobs, an increase of20 percent from a relatively small employment base. An-other 200 new jobs were added to the leisure and hospital-ity industry, mostly working at local eating and drinkingestablishments. The transportation, warehousing and utili-ties industry gained 100 jobs, growing 6.2 percent. Finan-cial activities added 100 jobs in the real estate componentof the industry.
Two private industries still have reduced employmentcompared to a year ago. The information industry andprofessional and business services were down 100 work-ers each. The professional and business services industrywas hard hit by the loss of the Excell call center at the endof last year. Information employment has suffered in mostareas of the state due to weakness in the telecommunica-tions segment.

-5-
(Santa Fe & Los Alamos Counties)
Santa Fe MSA Labor Force and Payroll Employment
Annual Nonfarm Job Growth Rates - NM and Santa Fe
Santa Fe Prel. Revised Change FromSeasonally Adjusted Oct 2004 Sep 2004 Oct 2003 Sep 2004 Oct 2003Civilian Labor Force 86,200 83,800 83,600 +2,400 +2,600Employment 83,500 81,200 80,600 +2,300 +2,900Unemployment 2,700 2,600 3,000 +100 -300Rate 3.1% 3.1% 3.6%Rate (not seasonally adjusted) 3.2% 3.2% 3.7%
-1.0%
-0.5%
0.0%
0.5%
1.0%
1.5%
2.0%
2.5%
3.0%
3.5%
4.0%
Jan-
00
Apr
-00
Jul-0
0
Oct
-00
Jan-
01
Apr
-01
Jul-0
1
Oct
-01
Jan-
02
Apr
-02
Jul-0
2
Oct
-02
Jan-
03
Apr
-03
Jul-0
3
Oct
-03
Jan-
04
Apr
-04
Jul-0
4
Oct
-04
New MexicoSanta Fe
The seasonally adjusted unemployment rate in the Santa FeMSA remained at 3.1 percent in October 2004, unchangedsince June this year. A year ago, the area had a higherunemployment rate of 3.6 percent.
The Santa Fe area lost another 200 jobs in October 2004, ontop of the 200 jobs lost the previous month. Such job lossesare typical this time of year as the area�s tourist seasonfizzles, and some of the associated employment declines.The leisure and hospitality industry had 400 fewer jobs thanlast month, with fewer jobs at area hotels and at places likethe Santa Fe Opera. Wholesale trade and construction alsodropped by 100 jobs each. Offsetting some of the seasonaljob losses were an additional 100 jobs in private education, atsuch places as the College of Santa Fe, and also 100 addi-tional jobs in the transportation, warehousing and utilitiesindustry. Government employment rose 200 jobs, increasingboth local and state government job counts.
Over-the-year job growth for the Santa Fe area was 1.9percent, adding 1,500 jobs. The rate of job growth in SantaFe has been below the statewide average since April this year.Seven industries have added jobs, one industry has lost jobs,and four others remain at last year�s levels.
Santa Fe�s large government sector has added more jobs thanany individual private industry, gaining 500 jobs on the year,a 1.8 percent increase. Federal government employment didnot increase, but state government added 300 jobs, and local
government added 200 jobs. Employment at Los AlamosNational Laboratory is included in state government becausethe University of California runs the facility.
The professional and business services industry has added300 jobs since last year, which is the best this industry hasdone since January. Educational and health services alsoadded 300 jobs; the heath care and social assistance compo-nent was responsible for 200 of the jobs, while private educa-tion added the other 100 jobs.
Retail trade added 200 jobs, growing 2.2 percent over theyear and following in the statewide trend of improvement forthis industry. Another 100 jobs were added to the miscella-neous other services industry. Manufacturing employmentincreased 100 jobs, marking the second straight month ofincreased employment following more than four years ofdeclines. Financial activities added 100 jobs, growing 2.9percent.
Troubles in the information industry have finally caught upwith Santa Fe. After two years of maintaining ground, em-ployment dropped 100 lower than a year ago. The fourindustries reporting employment levels unchanged from lastyear were leisure and hospitality; wholesale trade; transporta-tion, warehousing & utilities; and construction. The absenceof any employment gains in the construction industry makesthe Santa Fe area a rare exception to the housing boom that ishappening elsewhere in the state.

-6-
New Mexico � Seasonally Adjusted
Labor Force, Employment, Unemployment, & Unemployment Rate
Total Nonfarm Employment Growth Rankings
New Mexico and United States
Civilian Un- Unadj.Labor Employ- Employ- Rate RateForce ment ment % %
1984 628,000 581,000 47,000 7.5%1985 644,000 587,000 57,000 8.9%1986 678,000 616,000 62,000 9.1%1987 682,000 622,000 60,000 8.8%1988 689,000 635,000 54,000 7.8%1989 697,000 651,000 46,000 6.6%1990 708,400 662,300 46,100 6.5%1991 728,500 676,500 52,000 7.1%1992 744,400 692,000 52,400 7.0%1993 761,100 702,500 58,600 7.7%1994 781,500 732,500 49,000 6.3%1995 797,000 747,000 50,000 6.3%1996 806,900 741,900 65,000 8.1%1997 825,900 774,300 51,600 6.2%1998 845,100 792,900 52,200 6.2%1999 824,300 778,000 46,300 5.6%2000 854,100 811,800 42,300 5.0%2001 860,100 818,500 41,600 4.8%2002 875,300 827,600 47,700 5.4%2003 896,900 839,700 57,200 6.4%
2003 JAN 888,100 835,200 52,900 6.0% 6.1%FEB 888,400 835,800 52,600 5.9% 5.8%MAR 890,400 836,000 54,400 6.1% 5.9%APR 892,400 837,000 55,400 6.2% 5.9%MAY 894,400 837,700 56,700 6.3% 6.3%JUN 898,400 838,500 59,900 6.7% 7.6%JUL 900,300 839,900 60,400 6.7% 7.1%AUG 900,300 840,800 59,500 6.6% 6.6%SEP 900,700 841,200 59,500 6.6% 6.5%OCT 902,700 843,800 58,900 6.5% 6.3%NOV 903,000 844,700 58,300 6.5% 6.2%DEC 903,400 845,500 57,900 6.4% 5.9%
2004 JAN 897,200 846,200 51,000 5.7% 5.8%FEB 898,000 847,700 50,300 5.6% 5.5%MAR 901,100 850,600 50,500 5.6% 5.4%APR 903,600 853,400 50,200 5.6% 5.3%MAY 905,500 856,400 49,100 5.4% 5.3%JUN 906,400 857,100 49,300 5.4% 6.4%JUL 905,700 857,300 48,400 5.3% 5.8%AUG 910,900 861,700 49,200 5.4% 5.4%SEP 910,600 861,700 48,900 5.4% 5.4%OCT 911,600 864,100 47,500 5.2% 5.1%NOVDEC
# CHANGE FROMMonth Ago 1,000 2,400 -1,400 -0.2% -0.3%Year Ago 8,900 20,300 -11,400 -1.3% -1.2%2 Yrs. Ago 30,400 32,400 -2,000 0.3% -0.3%3 Yrs. Ago 51,300 46,700 4,600 0.3% 0.3%
% CHANGE FROMMonth Ago 0.1% 0.3% -2.9%Year Ago 1.0% 2.4% -19.4%2 Yrs. Ago 3.4% 3.9% -4.0%3 Yrs. Ago 6.0% 5.7% 10.7%
October October %State Rank 2003 2004 Change ChangeNevada 1 1,109.5 1,163.9 54.4 4.9%Idaho 2 579.7 599.6 19.9 3.4%Utah 3 1,085.5 1,119.7 34.2 3.2%Hawaii 4 570.9 588.2 17.3 3.0%Arizona 5 2,319.5 2,377.8 58.3 2.5%Washington 6 2,692.8 2,754.4 61.6 2.3%Virginia 7 3,532.3 3,612.9 80.6 2.3%Oregon 8 1,587.0 1,621.6 34.6 2.2%Wisconsin 9 2,809.9 2,867.9 58.0 2.1%New Mexico 10 782.5 798.4 15.9 2.0%Florida 11 7,331.1 7,476.5 145.4 2.0%Maryland 12 2,507.4 2,556.4 49.0 2.0%Kansas 13 1,319.8 1,345.4 25.6 1.9%Wyoming 14 254.5 259.3 4.8 1.9%DC 15 417.9 425.7 7.8 1.9%New Jersey 16 4,014.8 4,082.9 68.1 1.7%United States 130,924.0 132,990.0 2,066.0 1.6%West Virginia 17 729.6 741.0 11.4 1.6%Montana 18 403.6 409.5 5.9 1.5%Colorado 19 2,156.9 2,188.3 31.4 1.5%New Hampshire 20 624.3 633.3 9.0 1.4%North Carolina 21 3,852.1 3,905.0 52.9 1.4%Texas 22 9,398.8 9,520.2 121.4 1.3%Missouri 23 2,707.3 2,741.8 34.5 1.3%South Carolina 24 1,830.3 1,852.9 22.6 1.2%Alaska 25 301.0 304.7 3.7 1.2%Pennsylvania 26 5,637.2 5,697.9 60.7 1.1%Oklahoma 27 1,455.6 1,469.8 14.2 1.0%Delaware 28 667.7 674.1 6.4 1.0%Maine 29 615.9 621.8 5.9 1.0%Minnesota 30 2,683.2 2,707.9 24.7 0.9%California 31 14,506.1 14,634.2 128.1 0.9%Rhode Island 32 491.4 495.7 4.3 0.9%Vermont 33 303.1 305.7 2.6 0.9%Georgia 34 3,893.3 3,925.7 32.4 0.8%Alabama 35 1,882.3 1,896.9 14.6 0.8%Mississippi 36 1,124.9 1,133.4 8.5 0.8%Nebraska 37 911.4 918.2 6.8 0.7%South Dakota 38 381.7 384.4 2.7 0.7%Kentucky 39 1,798.0 1,810.7 12.7 0.7%New York 40 8,474.7 8,532.6 57.9 0.7%Iowa 41 1,461.1 1,469.6 8.5 0.6%Tennessee 42 2,687.5 2,702.9 15.4 0.6%Arkansas 43 1,154.4 1,161.0 6.6 0.6%North Dakota 44 340.0 341.4 1.4 0.4%Indiana 45 2,934.1 2,944.0 9.9 0.3%Connecticut 46 1,648.5 1,653.7 5.2 0.3%Illinois 47 5,868.6 5,876.2 7.6 0.1%Massachusetts 48 3,205.6 3,208.4 2.8 0.1%Louisiana 49 1,918.4 1,915.5 -2.9 -0.2%Ohio 50 5,424.4 5,409.9 -14.5 -0.3%Michigan 51 4,461.1 4,429.7 -31.4 -0.7%Source: U.S. Department of Labor, Bureau of Labor Statistics
Employment numbers are not seasonally adjusted.
Employment numbers are in thousands.
-7-
1/ All estimates are made in strict accordance with methodology provided by the U. S. Department of Labor, Bureau of Labor Statistics2/ Metropolitan Statistical Area - Bernalillo, Sandoval & Valencia Counties3/ Metropolitan Statistical Area - DoÒa Ana County4/ Metropolitan Statistical Area - Santa Fe and Los Alamos Counties
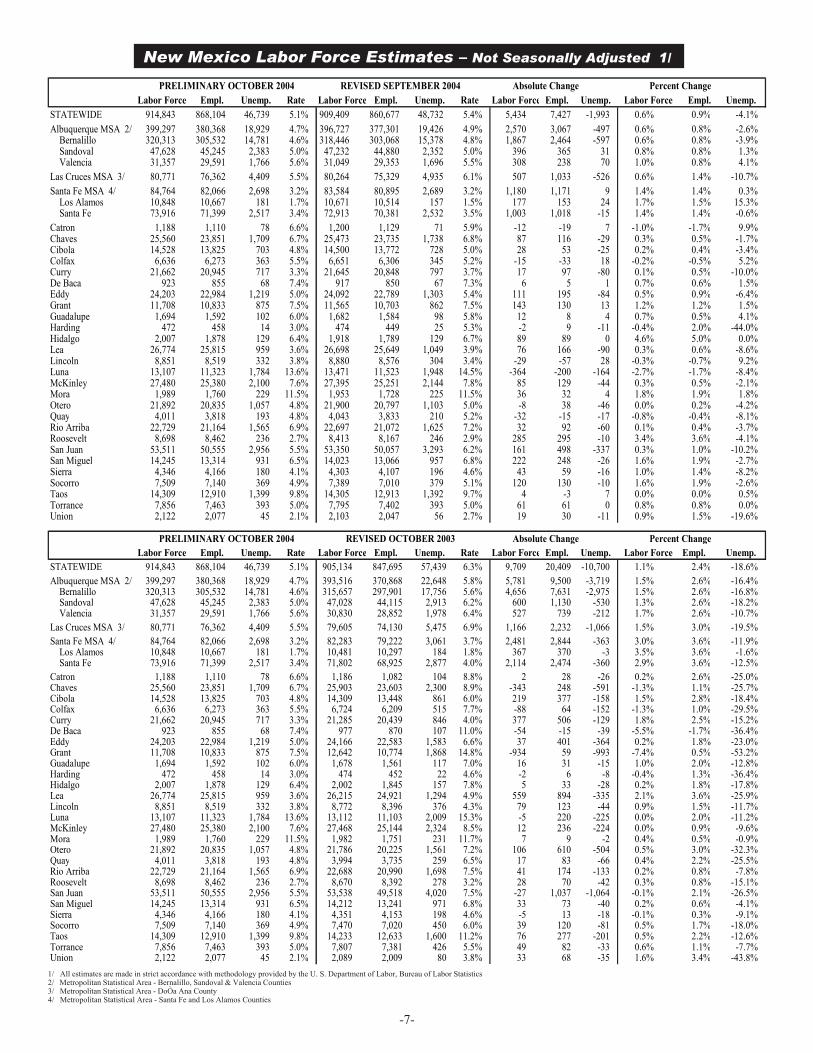
New Mexico Labor Force Estimates � Not Seasonally Adjusted 1/
PRELIMINARY OCTOBER 2004 REVISED SEPTEMBER 2004 Absolute Change Percent ChangeLabor Force Empl. Unemp. Rate Labor Force Empl. Unemp. Rate Labor Force Empl. Unemp. Labor Force Empl. Unemp.
STATEWIDE 914,843 868,104 46,739 5.1% 909,409 860,677 48,732 5.4% 5,434 7,427 -1,993 0.6% 0.9% -4.1%Albuquerque MSA 2/ 399,297 380,368 18,929 4.7% 396,727 377,301 19,426 4.9% 2,570 3,067 -497 0.6% 0.8% -2.6% Bernalillo 320,313 305,532 14,781 4.6% 318,446 303,068 15,378 4.8% 1,867 2,464 -597 0.6% 0.8% -3.9% Sandoval 47,628 45,245 2,383 5.0% 47,232 44,880 2,352 5.0% 396 365 31 0.8% 0.8% 1.3% Valencia 31,357 29,591 1,766 5.6% 31,049 29,353 1,696 5.5% 308 238 70 1.0% 0.8% 4.1%Las Cruces MSA 3/ 80,771 76,362 4,409 5.5% 80,264 75,329 4,935 6.1% 507 1,033 -526 0.6% 1.4% -10.7%Santa Fe MSA 4/ 84,764 82,066 2,698 3.2% 83,584 80,895 2,689 3.2% 1,180 1,171 9 1.4% 1.4% 0.3% Los Alamos 10,848 10,667 181 1.7% 10,671 10,514 157 1.5% 177 153 24 1.7% 1.5% 15.3% Santa Fe 73,916 71,399 2,517 3.4% 72,913 70,381 2,532 3.5% 1,003 1,018 -15 1.4% 1.4% -0.6%Catron 1,188 1,110 78 6.6% 1,200 1,129 71 5.9% -12 -19 7 -1.0% -1.7% 9.9%Chaves 25,560 23,851 1,709 6.7% 25,473 23,735 1,738 6.8% 87 116 -29 0.3% 0.5% -1.7%Cibola 14,528 13,825 703 4.8% 14,500 13,772 728 5.0% 28 53 -25 0.2% 0.4% -3.4%Colfax 6,636 6,273 363 5.5% 6,651 6,306 345 5.2% -15 -33 18 -0.2% -0.5% 5.2%Curry 21,662 20,945 717 3.3% 21,645 20,848 797 3.7% 17 97 -80 0.1% 0.5% -10.0%De Baca 923 855 68 7.4% 917 850 67 7.3% 6 5 1 0.7% 0.6% 1.5%Eddy 24,203 22,984 1,219 5.0% 24,092 22,789 1,303 5.4% 111 195 -84 0.5% 0.9% -6.4%Grant 11,708 10,833 875 7.5% 11,565 10,703 862 7.5% 143 130 13 1.2% 1.2% 1.5%Guadalupe 1,694 1,592 102 6.0% 1,682 1,584 98 5.8% 12 8 4 0.7% 0.5% 4.1%Harding 472 458 14 3.0% 474 449 25 5.3% -2 9 -11 -0.4% 2.0% -44.0%Hidalgo 2,007 1,878 129 6.4% 1,918 1,789 129 6.7% 89 89 0 4.6% 5.0% 0.0%Lea 26,774 25,815 959 3.6% 26,698 25,649 1,049 3.9% 76 166 -90 0.3% 0.6% -8.6%Lincoln 8,851 8,519 332 3.8% 8,880 8,576 304 3.4% -29 -57 28 -0.3% -0.7% 9.2%Luna 13,107 11,323 1,784 13.6% 13,471 11,523 1,948 14.5% -364 -200 -164 -2.7% -1.7% -8.4%McKinley 27,480 25,380 2,100 7.6% 27,395 25,251 2,144 7.8% 85 129 -44 0.3% 0.5% -2.1%Mora 1,989 1,760 229 11.5% 1,953 1,728 225 11.5% 36 32 4 1.8% 1.9% 1.8%Otero 21,892 20,835 1,057 4.8% 21,900 20,797 1,103 5.0% -8 38 -46 0.0% 0.2% -4.2%Quay 4,011 3,818 193 4.8% 4,043 3,833 210 5.2% -32 -15 -17 -0.8% -0.4% -8.1%Rio Arriba 22,729 21,164 1,565 6.9% 22,697 21,072 1,625 7.2% 32 92 -60 0.1% 0.4% -3.7%Roosevelt 8,698 8,462 236 2.7% 8,413 8,167 246 2.9% 285 295 -10 3.4% 3.6% -4.1%San Juan 53,511 50,555 2,956 5.5% 53,350 50,057 3,293 6.2% 161 498 -337 0.3% 1.0% -10.2%San Miguel 14,245 13,314 931 6.5% 14,023 13,066 957 6.8% 222 248 -26 1.6% 1.9% -2.7%Sierra 4,346 4,166 180 4.1% 4,303 4,107 196 4.6% 43 59 -16 1.0% 1.4% -8.2%Socorro 7,509 7,140 369 4.9% 7,389 7,010 379 5.1% 120 130 -10 1.6% 1.9% -2.6%Taos 14,309 12,910 1,399 9.8% 14,305 12,913 1,392 9.7% 4 -3 7 0.0% 0.0% 0.5%Torrance 7,856 7,463 393 5.0% 7,795 7,402 393 5.0% 61 61 0 0.8% 0.8% 0.0%Union 2,122 2,077 45 2.1% 2,103 2,047 56 2.7% 19 30 -11 0.9% 1.5% -19.6%
PRELIMINARY OCTOBER 2004 REVISED OCTOBER 2003 Absolute Change Percent ChangeLabor Force Empl. Unemp. Rate Labor Force Empl. Unemp. Rate Labor Force Empl. Unemp. Labor Force Empl. Unemp.
STATEWIDE 914,843 868,104 46,739 5.1% 905,134 847,695 57,439 6.3% 9,709 20,409 -10,700 1.1% 2.4% -18.6%Albuquerque MSA 2/ 399,297 380,368 18,929 4.7% 393,516 370,868 22,648 5.8% 5,781 9,500 -3,719 1.5% 2.6% -16.4% Bernalillo 320,313 305,532 14,781 4.6% 315,657 297,901 17,756 5.6% 4,656 7,631 -2,975 1.5% 2.6% -16.8% Sandoval 47,628 45,245 2,383 5.0% 47,028 44,115 2,913 6.2% 600 1,130 -530 1.3% 2.6% -18.2% Valencia 31,357 29,591 1,766 5.6% 30,830 28,852 1,978 6.4% 527 739 -212 1.7% 2.6% -10.7%Las Cruces MSA 3/ 80,771 76,362 4,409 5.5% 79,605 74,130 5,475 6.9% 1,166 2,232 -1,066 1.5% 3.0% -19.5%Santa Fe MSA 4/ 84,764 82,066 2,698 3.2% 82,283 79,222 3,061 3.7% 2,481 2,844 -363 3.0% 3.6% -11.9% Los Alamos 10,848 10,667 181 1.7% 10,481 10,297 184 1.8% 367 370 -3 3.5% 3.6% -1.6% Santa Fe 73,916 71,399 2,517 3.4% 71,802 68,925 2,877 4.0% 2,114 2,474 -360 2.9% 3.6% -12.5%Catron 1,188 1,110 78 6.6% 1,186 1,082 104 8.8% 2 28 -26 0.2% 2.6% -25.0%Chaves 25,560 23,851 1,709 6.7% 25,903 23,603 2,300 8.9% -343 248 -591 -1.3% 1.1% -25.7%Cibola 14,528 13,825 703 4.8% 14,309 13,448 861 6.0% 219 377 -158 1.5% 2.8% -18.4%Colfax 6,636 6,273 363 5.5% 6,724 6,209 515 7.7% -88 64 -152 -1.3% 1.0% -29.5%Curry 21,662 20,945 717 3.3% 21,285 20,439 846 4.0% 377 506 -129 1.8% 2.5% -15.2%De Baca 923 855 68 7.4% 977 870 107 11.0% -54 -15 -39 -5.5% -1.7% -36.4%Eddy 24,203 22,984 1,219 5.0% 24,166 22,583 1,583 6.6% 37 401 -364 0.2% 1.8% -23.0%Grant 11,708 10,833 875 7.5% 12,642 10,774 1,868 14.8% -934 59 -993 -7.4% 0.5% -53.2%Guadalupe 1,694 1,592 102 6.0% 1,678 1,561 117 7.0% 16 31 -15 1.0% 2.0% -12.8%Harding 472 458 14 3.0% 474 452 22 4.6% -2 6 -8 -0.4% 1.3% -36.4%Hidalgo 2,007 1,878 129 6.4% 2,002 1,845 157 7.8% 5 33 -28 0.2% 1.8% -17.8%Lea 26,774 25,815 959 3.6% 26,215 24,921 1,294 4.9% 559 894 -335 2.1% 3.6% -25.9%Lincoln 8,851 8,519 332 3.8% 8,772 8,396 376 4.3% 79 123 -44 0.9% 1.5% -11.7%Luna 13,107 11,323 1,784 13.6% 13,112 11,103 2,009 15.3% -5 220 -225 0.0% 2.0% -11.2%McKinley 27,480 25,380 2,100 7.6% 27,468 25,144 2,324 8.5% 12 236 -224 0.0% 0.9% -9.6%Mora 1,989 1,760 229 11.5% 1,982 1,751 231 11.7% 7 9 -2 0.4% 0.5% -0.9%Otero 21,892 20,835 1,057 4.8% 21,786 20,225 1,561 7.2% 106 610 -504 0.5% 3.0% -32.3%Quay 4,011 3,818 193 4.8% 3,994 3,735 259 6.5% 17 83 -66 0.4% 2.2% -25.5%Rio Arriba 22,729 21,164 1,565 6.9% 22,688 20,990 1,698 7.5% 41 174 -133 0.2% 0.8% -7.8%Roosevelt 8,698 8,462 236 2.7% 8,670 8,392 278 3.2% 28 70 -42 0.3% 0.8% -15.1%San Juan 53,511 50,555 2,956 5.5% 53,538 49,518 4,020 7.5% -27 1,037 -1,064 -0.1% 2.1% -26.5%San Miguel 14,245 13,314 931 6.5% 14,212 13,241 971 6.8% 33 73 -40 0.2% 0.6% -4.1%Sierra 4,346 4,166 180 4.1% 4,351 4,153 198 4.6% -5 13 -18 -0.1% 0.3% -9.1%Socorro 7,509 7,140 369 4.9% 7,470 7,020 450 6.0% 39 120 -81 0.5% 1.7% -18.0%Taos 14,309 12,910 1,399 9.8% 14,233 12,633 1,600 11.2% 76 277 -201 0.5% 2.2% -12.6%Torrance 7,856 7,463 393 5.0% 7,807 7,381 426 5.5% 49 82 -33 0.6% 1.1% -7.7%Union 2,122 2,077 45 2.1% 2,089 2,009 80 3.8% 33 68 -35 1.6% 3.4% -43.8%

-8-
Unemployment Rates in New Mexico (Not Seasonally Adjusted)
For fast and easy access to the latest labor market information, please visit the New Mexico Department of Labor's website.There you will find a wide variety of information and tools for all kinds of people, including job seekers, employers, teachers,grant writers, career counselors, and students. All of our publications, including the one you are reading now, can be accessedonline and are available sooner than if delivered by mail. This website also includes information on Department of Laborprograms, contact names and addresses, and frequently asked questions about Department functions. In addition, all NMDOLemployer forms can be downloaded from our website for easy access. Also provided are links to other related websites,including America's Job Bank for nationwide job searches. All this and more is available on our website at:
Need Labor Market Information?We have several major publications detailing New Mexicoís:
Current economic conditions and trendsWages by occupations and areasLarger employersGrowing jobs with skills and training needsJob market with hints for finding and keeping a job
They are available, at no cost, by dropping by any NMDOL office.
www.dol.state.nm.us
...Check Out Our Website!
PRELIMINARY OCTOBER 2004 REVISED SEPTEMBER 2004 REVISED OCTOBER 2003
AREAS RANK RATE AREAS RANK RATE AREAS RANK RATE
LUNA 1 13.6% LUNA 1 14.5% LUNA 1 15.3%MORA 2 11.5% MORA 2 11.5% GRANT 2 14.8%TAOS 3 9.8% TAOS 3 9.7% MORA 3 11.7%MCKINLEY 4 7.6% MCKINLEY 4 7.8% TAOS 4 11.2%GRANT 5 7.5% GRANT 5 7.5% DE BACA 5 11.0%DE BACA 6 7.4% DE BACA 6 7.3% CHAVES 6 8.9%RIO ARRIBA 7 6.9% RIO ARRIBA 7 7.2% CATRON 7 8.8%CHAVES 8 6.7% CHAVES 8 6.8% MCKINLEY 8 8.5%CATRON 9 6.6% SAN MIGUEL 9 6.8% HIDALGO 9 7.8%SAN MIGUEL 10 6.5% HIDALGO 10 6.7% COLFAX 10 7.7%HIDALGO 11 6.4% SAN JUAN 11 6.2% SAN JUAN 11 7.5%GUADALUPE 12 6.0% LAS CRUCES MSA 2/ 12 6.1% RIO ARRIBA 12 7.5%COLFAX 13 5.5% CATRON 13 5.9% OTERO 13 7.2%LAS CRUCES MSA 2/ 14 5.5% GUADALUPE 14 5.8% GUADALUPE 14 7.0%SAN JUAN 15 5.5% EDDY 15 5.4% LAS CRUCES MSA 2/ 15 6.9%STATEWIDE 5.1% STATEWIDE 5.4% SAN MIGUEL 16 6.8%EDDY 16 5.0% HARDING 16 5.3% EDDY 17 6.6%TORRANCE 17 5.0% COLFAX 17 5.2% QUAY 18 6.5%SOCORRO 18 4.9% QUAY 18 5.2% STATEWIDE 6.3%CIBOLA 19 4.8% SOCORRO 19 5.1% SOCORRO 19 6.0%OTERO 20 4.8% CIBOLA 20 5.0% CIBOLA 20 6.0%QUAY 21 4.8% OTERO 21 5.0% ALBUQUERQUE MSA 1/ 21 5.8%ALBUQUERQUE MSA 1/ 22 4.7% TORRANCE 22 5.0% TORRANCE 22 5.5%SIERRA 23 4.1% ALBUQUERQUE MSA 1/ 23 4.9% LEA 23 4.9%LINCOLN 24 3.8% SIERRA 24 4.6% HARDING 24 4.6%LEA 25 3.6% LEA 25 3.9% SIERRA 25 4.6%CURRY 26 3.3% CURRY 26 3.7% LINCOLN 26 4.3%SANTA FE MSA 3/ 27 3.2% LINCOLN 27 3.4% CURRY 27 4.0%HARDING 28 3.0% SANTA FE MSA 3/ 28 3.2% UNION 28 3.8%ROOSEVELT 29 2.7% ROOSEVELT 29 2.9% SANTA FE MSA 3/ 29 3.7%UNION 30 2.1% UNION 30 2.7% ROOSEVELT 30 3.2%
1/ Metropolitan Statistical Area - Bernalillo, Sandoval & Valencia Counties2/ Metropolitan Statistical Area - DoÒa Ana County3/ Metropolitan Statistical Area - Santa Fe and Los Alamos Counties

Unemployment Rate by State (Seasonally Adjusted)
-9-
Preliminary October Revised October2004 2003
State Rank Rate State Rank RateDistrict of Columbia 1 8.5 Alaska 1 8.1Alaska 2 7.2 Oregon 2 7.9Oregon 2 7.2 Michigan 3 7.6Michigan 4 6.6 Washington 4 7.5South Carolina 5 6.5 District of Columbia 5 7.1Mississippi 6 6.3 South Carolina 5 7.1Ohio 6 6.3 Illinois 7 6.8Illinois 8 6.1 Arkansas 8 6.7Arkansas 9 5.7 California 8 6.7California 9 5.7 Texas 8 6.7Louisiana 11 5.6 New Mexico 11 6.5Missouri 11 5.6 New York 12 6.4Texas 11 5.6 North Carolina 12 6.4Washington 11 5.6 Louisiana 14 6.2Alabama 15 5.5 Tennessee 15 6.1Pennsylvania 15 5.5 Kentucky 16 6.0United States 5.5 Mississippi 16 6.0Indiana 17 5.4 Ohio 16 6.0New Mexico 18 5.2 United States 6.0Idaho 18 5.2 Colorado 19 5.9New York 18 5.2 West Virginia 19 5.9Tennessee 21 5.1 Alabama 21 5.8West Virginia 21 5.1 Massachusetts 21 5.8Colorado 23 5.0 Oklahoma 23 5.7Wisconsin 23 5.0 New Jersey 24 5.6Arizona 25 4.8 Connecticut 25 5.5Iowa 25 4.8 Missouri 25 5.5Kansas 25 4.8 Wisconsin 25 5.5Montana 25 4.8 Pennsylvania 28 5.4North Carolina 25 4.8 Utah 28 5.4Utah 25 4.8 Kansas 30 5.3Kentucky 31 4.7 Arizona 31 5.2New Jersey 31 4.7 Idaho 31 5.2Connecticut 33 4.6 Maine 31 5.2Maine 33 4.6 Indiana 34 5.1Massachusetts 33 4.6 Minnesota 34 5.1Florida 36 4.5 Nevada 34 5.1Rhode Island 36 4.5 Rhode Island 37 5.0Oklahoma 38 4.4 Florida 38 4.9Minnesota 39 4.3 Montana 39 4.7Georgia 40 4.2 Vermont 39 4.7Delaware 41 4.0 Iowa 41 4.6Maryland 42 3.9 Hawaii 42 4.5Wyoming 43 3.8 Maryland 42 4.5North Dakota 44 3.7 Delaware 44 4.4Nevada 45 3.6 Georgia 44 4.4Nebraska 46 3.5 Wyoming 46 4.3New Hampshire 47 3.4 New Hampshire 47 4.2Hawaii 48 3.3 Nebraska 48 4.0South Dakota 48 3.3 North Dakota 49 3.9Virginia 48 3.3 Virginia 49 3.9Vermont 51 3.1 South Dakota 51 3.6Source: U.S. Department of Labor, Bureau of Labor Statistics

1.8
2.0
2.1
2.1
2.2
2.3
2.7
3.4
6.4
7.0
-10.3
0.5
0.7
1.1
Information
Mfg.
Other Services
Gov.
Wholesale Trade
Leisure & Hospitality
Financial Activities
Retail Trade
Trans, Warehsing, & Util.
Total
Pro & Bus. Services
Educ. & Health Services
Const.
Natural Res. & Mining
-10-
New Mexico Nonagricultural Wage and Salary Employment
New Mexico and Albuquerque Annual Nonfarm Job Growth Rates
NAICS Industries
Annual Growth Rates by Industry
Retail Trade12%
Information2%
Financial Activities4%
Pro & Bus. Services11%
Trans, Warehousing,& Utilit ies 3%
Gov.25%
OtherServices
4%
Natural Res.& Mining
2%
Leisure & Hospitality10%
Educ. & Health Services13%
Const.6%
Mfg.5%
Wholesale Trade3%
-11-
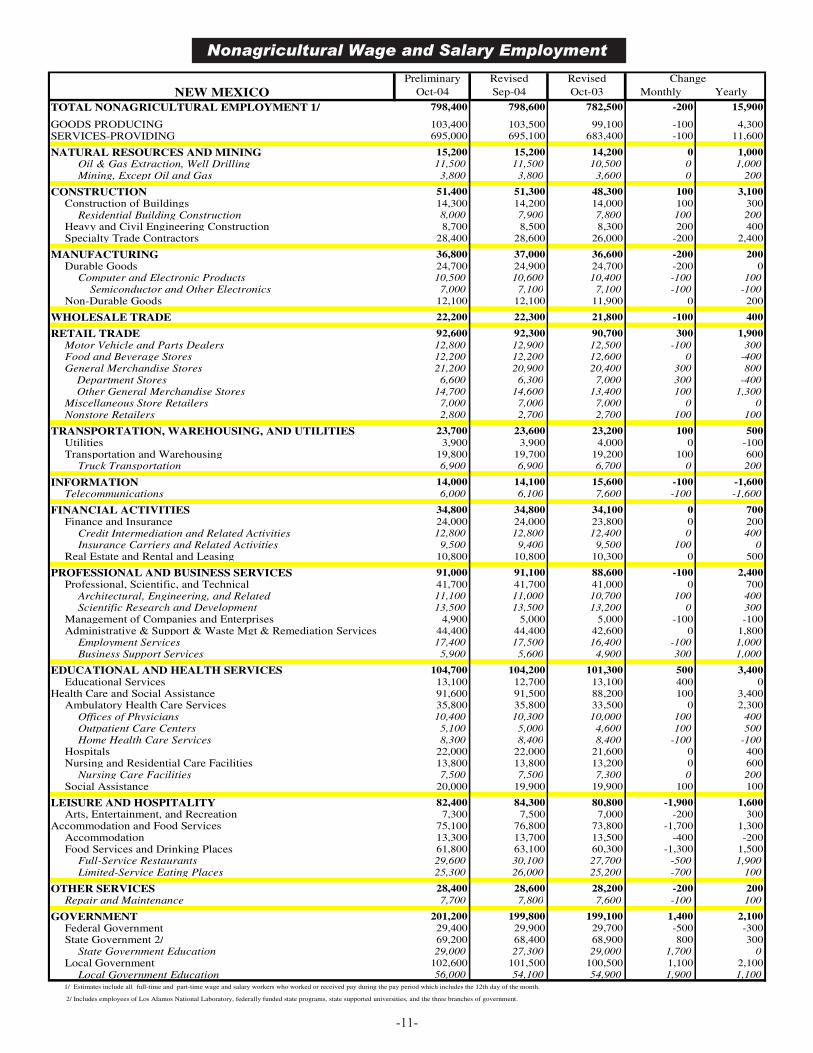
Nonagricultural Wage and Salary Employment
Preliminary Revised Revised ChangeOct-04 Sep-04 Oct-03 Monthly Yearly
TOTAL NONAGRICULTURAL EMPLOYMENT 1/ 798,400 798,600 782,500 -200 15,900
GOODS PRODUCING 103,400 103,500 99,100 -100 4,300SERVICES-PROVIDING 695,000 695,100 683,400 -100 11,600
NATURAL RESOURCES AND MINING 15,200 15,200 14,200 0 1,000Oil & Gas Extraction, Well Drilling 11,500 11,500 10,500 0 1,000Mining, Except Oil and Gas 3,800 3,800 3,600 0 200
CONSTRUCTION 51,400 51,300 48,300 100 3,100Construction of Buildings 14,300 14,200 14,000 100 300
Residential Building Construction 8,000 7,900 7,800 100 200Heavy and Civil Engineering Construction 8,700 8,500 8,300 200 400Specialty Trade Contractors 28,400 28,600 26,000 -200 2,400
MANUFACTURING 36,800 37,000 36,600 -200 200Durable Goods 24,700 24,900 24,700 -200 0
Computer and Electronic Products 10,500 10,600 10,400 -100 100 Semiconductor and Other Electronics 7,000 7,100 7,100 -100 -100
Non-Durable Goods 12,100 12,100 11,900 0 200
WHOLESALE TRADE 22,200 22,300 21,800 -100 400
RETAIL TRADE 92,600 92,300 90,700 300 1,900Motor Vehicle and Parts Dealers 12,800 12,900 12,500 -100 300Food and Beverage Stores 12,200 12,200 12,600 0 -400General Merchandise Stores 21,200 20,900 20,400 300 800 Department Stores 6,600 6,300 7,000 300 -400 Other General Merchandise Stores 14,700 14,600 13,400 100 1,300Miscellaneous Store Retailers 7,000 7,000 7,000 0 0Nonstore Retailers 2,800 2,700 2,700 100 100
TRANSPORTATION, WAREHOUSING, AND UTILITIES 23,700 23,600 23,200 100 500Utilities 3,900 3,900 4,000 0 -100Transportation and Warehousing 19,800 19,700 19,200 100 600
Truck Transportation 6,900 6,900 6,700 0 200
INFORMATION 14,000 14,100 15,600 -100 -1,600Telecommunications 6,000 6,100 7,600 -100 -1,600
FINANCIAL ACTIVITIES 34,800 34,800 34,100 0 700Finance and Insurance 24,000 24,000 23,800 0 200
Credit Intermediation and Related Activities 12,800 12,800 12,400 0 400Insurance Carriers and Related Activities 9,500 9,400 9,500 100 0
Real Estate and Rental and Leasing 10,800 10,800 10,300 0 500
PROFESSIONAL AND BUSINESS SERVICES 91,000 91,100 88,600 -100 2,400Professional, Scientific, and Technical 41,700 41,700 41,000 0 700
Architectural, Engineering, and Related 11,100 11,000 10,700 100 400Scientific Research and Development 13,500 13,500 13,200 0 300
Management of Companies and Enterprises 4,900 5,000 5,000 -100 -100Administrative & Support & Waste Mgt & Remediation Services 44,400 44,400 42,600 0 1,800
Employment Services 17,400 17,500 16,400 -100 1,000Business Support Services 5,900 5,600 4,900 300 1,000
EDUCATIONAL AND HEALTH SERVICES 104,700 104,200 101,300 500 3,400Educational Services 13,100 12,700 13,100 400 0
Health Care and Social Assistance 91,600 91,500 88,200 100 3,400Ambulatory Health Care Services 35,800 35,800 33,500 0 2,300
Offices of Physicians 10,400 10,300 10,000 100 400Outpatient Care Centers 5,100 5,000 4,600 100 500Home Health Care Services 8,300 8,400 8,400 -100 -100
Hospitals 22,000 22,000 21,600 0 400Nursing and Residential Care Facilities 13,800 13,800 13,200 0 600
Nursing Care Facilities 7,500 7,500 7,300 0 200Social Assistance 20,000 19,900 19,900 100 100
LEISURE AND HOSPITALITY 82,400 84,300 80,800 -1,900 1,600Arts, Entertainment, and Recreation 7,300 7,500 7,000 -200 300
Accommodation and Food Services 75,100 76,800 73,800 -1,700 1,300Accommodation 13,300 13,700 13,500 -400 -200Food Services and Drinking Places 61,800 63,100 60,300 -1,300 1,500
Full-Service Restaurants 29,600 30,100 27,700 -500 1,900Limited-Service Eating Places 25,300 26,000 25,200 -700 100
OTHER SERVICES 28,400 28,600 28,200 -200 200Repair and Maintenance 7,700 7,800 7,600 -100 100
GOVERNMENT 201,200 199,800 199,100 1,400 2,100Federal Government 29,400 29,900 29,700 -500 -300State Government 2/ 69,200 68,400 68,900 800 300
State Government Education 29,000 27,300 29,000 1,700 0Local Government 102,600 101,500 100,500 1,100 2,100
Local Government Education 56,000 54,100 54,900 1,900 1,1001/ Estimates include all full-time and part-time wage and salary workers who worked or received pay during the pay period which includes the 12th day of the month.
2/ Includes employees of Los Alamos National Laboratory, federally funded state programs, state supported universities, and the three branches of government.
NEW MEXICO

-12-
Nonagricultural Wage and Salary Employment
Preliminary Revised Revised Change
Oct-04 Sep-04 Oct-03 Monthly Yearly
TOTAL NONAGRICULTURAL EMPLOYMENT 1/ 370,200 369,500 362,800 700 7,400
GOODS PRODUCING 48,700 48,600 47,700 100 1,000
SERVICES-PROVIDING 321,500 320,900 315,100 600 6,400
NATURAL RESOURCES AND MINING & CONSTRUCTION 26,000 26,100 24,500 -100 1,500
Specialty Trade Contractors 16,300 16,400 14,800 -100 1,500
MANUFACTURING 22,700 22,500 23,200 200 -500
Computer and Electronic Products 9,500 9,600 9,700 -100 -200
Semiconductor and Other Electronics 6,600 6,700 6,700 -100 -100
WHOLESALE TRADE 12,700 12,800 12,800 -100 -100
RETAIL TRADE 42,600 42,100 41,300 500 1,300
Building Material and Garden Equipment 3,800 3,800 3,600 0 200
Food and Beverage Stores 4,600 4,600 4,700 0 -100
General Merchandise Stores 8,800 8,500 8,300 300 500
Department Stores 3,300 3,200 3,600 100 -300
TRANSPORTATION, WAREHOUSING, AND UTILITIES 10,500 10,400 10,500 100 0
INFORMATION 8,800 9,000 10,000 -200 -1,200
Telecommunications 4,600 4,700 5,600 -100 -1,000
FINANCIAL ACTIVITIES 19,000 19,100 19,000 -100 0
Finance and Insurance 13,600 13,600 13,700 0 -100
Credit Intermediation and Related Activities 6,000 6,000 5,900 0 100
Depository Credit Intermediation 4,100 4,000 4,000 100 100
Insurance Carriers 5,000 5,000 4,900 0 100
PROFESSIONAL AND BUSINESS SERVICES 59,400 59,000 57,600 400 1,800
Professional, Scientific, and Technical 28,700 28,500 28,200 200 500
Scientific Research and Development 11,900 11,800 11,300 100 600
Management of Companies and Enterprises 3,800 3,800 4,000 0 -200
Administrative & Support & Waste Mgt & Remediation Services 26,900 26,700 25,400 200 1,500
Employment Services 12,700 13,100 12,000 -400 700
Business Support Services 3,300 3,200 2,900 100 400
EDUCATIONAL AND HEALTH SERVICES 46,000 45,600 43,800 400 2,200
Health Care and Social Assistance 39,900 39,900 38,400 0 1,500
Ambulatory Health Care Services 16,900 16,800 15,600 100 1,300
Hospitals 9,700 9,700 9,300 0 400
LEISURE AND HOSPITALITY 36,500 37,200 35,700 -700 800
Food Services and Drinking Places 28,300 28,700 27,800 -400 500
Full-Service Restaurants 13,400 13,400 12,500 0 900
OTHER SERVICES 11,800 11,800 11,700 0 100
GOVERNMENT 74,200 73,900 72,700 300 1,500
Federal Government 13,800 13,900 13,800 -100 0
State Government /2 24,800 24,700 24,400 100 400
Local Government 35,600 35,300 34,500 300 1,100
1/ Estimates include all full-time and part-time wage and salary workers who worked or received pay during the pay period which included the 12th day of the month.
2/ Includes employees of federally funded state programs, state supported universities, and the three branches of state government.
ALBUQUERQUE

-13-
Nonagricultural Wage and Salary Employment
Preliminary Revised Revised ChangeOct-04 Sep-04 Oct-03 Monthly Yearly
TOTAL NONAGRICULTURAL EMPLOYMENT /1 64,500 64,300 62,600 200 1,900GOODS PRODUCING 7,500 7,500 6,900 0 600SERVICE PRODUCING 57,000 56,800 55,700 200 1,300
NATURAL RESOURCES MINING & CONSTRUCTION 4,000 4,000 3,700 0 300
MANUFACTURING 3,500 3,500 3,200 0 300
WHOLESALE TRADE 1,200 1,200 1,000 0 200
RETAIL TRADE 7,100 7,100 6,800 0 300
TRANSPORTATION, WAREHOUSING, AND UTILITIES 1,700 1,700 1,600 0 100
INFORMATION 1,100 1,100 1,200 0 -100
FINANCIAL ACTIVITIES 2,400 2,400 2,300 0 100
PROFESSIONAL & BUSINESS SERVICES 5,100 5,100 5,200 0 -100 Administrative & Support & Waste Mgt & Remediation Services 2,300 2,300 2,500 0 -200
EDUCATIONAL AND HEALTH SERVICES 9,400 9,400 9,100 0 300 Health Care & Social Assistance 8,400 8,500 8,500 -100 -100
LEISURE AND HOSPITALITY 6,400 6,400 6,200 0 200
OTHER SERVICES 1,400 1,400 1,400 0 0
GOVERNMENT 21,200 21,000 20,900 200 300 Federal 3,600 3,600 3,500 0 100 State 9,300 9,100 9,300 200 0 Local 8,300 8,300 8,100 0 200
Preliminary Revised Revised ChangeOct-04 Sep-04 Oct-03 Monthly Yearly
TOTAL NONAGRICULTURAL EMPLOYMENT /1 80,700 80,900 79,200 -200 1,500GOODS PRODUCING 6,200 6,300 6,100 -100 100SERVICE PRODUCING 74,500 74,600 73,100 -100 1,400
NATURAL RESOURCES, MINING & CONSTRUCTION 4,900 5,000 4,900 -100 0
MANUFACTURING 1,300 1,300 1,200 0 100
WHOLESALE TRADE 1,000 1,100 1,000 -100 0
RETAIL TRADE 9,100 9,100 8,900 0 200
TRANSPORTATION, WAREHOUSING, AND UTILITIES 800 700 800 100 0
INFORMATION 1,000 1,000 1,100 0 -100
FINANCIAL ACTIVITIES 3,600 3,600 3,500 0 100
PROFESSIONAL & BUSINESS SERVICES 9,200 9,200 8,900 0 300 Administrative & Support & Waste Mgt & Remediation Services 4,700 4,700 4,700 0 0
EDUCATIONAL AND HEALTH SERVICES 9,500 9,400 9,200 100 300 Health Care & Social Assistance 7,400 7,400 7,200 0 200
LEISURE AND HOSPITALITY 9,100 9,500 9,100 -400 0 Food Service & Drinking Places 6,300 6,400 5,900 -100 400
OTHER SERVICES 3,400 3,400 3,300 0 100
GOVERNMENT 27,800 27,600 27,300 200 500 Federal 1,400 1,400 1,400 0 0 State /2 18,600 18,500 18,300 100 300 Local 7,800 7,700 7,600 100 200
1/ Estimates include all full-time and part-time wage and salary workers who worked or received pay during the pay period which included the 12th day of the month.
2/ Includes employees of Los Alamos National Laboratory, federally funded state programs, state supported universities, and the three branches of state government.
LAS CRUCES MSA
SANTA FE MSA

Nonagricultural Wage and Salary Employment
- Seasonally Adjusted -
-14-
1/ Total includes the Information sector, which is not seasonally adjusted.
New MexicoUnemploymentInsurance DataThe Unemployment Insurance Bureau of the Depart-
ment of Labor has written a new publication, NewMexico Unemployment Insurance Data, Calendar Year2003. This annual publication provides statistics andanalysis of various unemployment insurance data,such as initial claims, weeks claimed, benefits paid,and the trust fund for calendar year 2003. For a freecopy please contact Rachel Moskowitz at the Depart-ment of Labor at (505) 841-9062, or email [email protected]
New Publication
NEW MEXICO Preliminary Revised Monthly
Oct-04 Sep-04 Change
TOTAL NONAGRICULTURAL EMPLOYMENT 1/ 794,100 793,700 400
NATURAL RESOURCES AND MINING 15,200 15,100 100
CONSTRUCTION 50,400 50,300 100
MANUFACTURING 36,000 35,300 700
TRADE, TRANSPORTATION AND UTILITIES 138,200 138,400 -200
INFORMATION (Not Seasonally Adjusted) 14,000 14,100 -100
FINANCIAL ACTIVITIES 34,900 34,700 200
PROFESSIONAL AND BUSINESS SERVICES 90,700 90,400 300
EDUCATIONAL AND HEALTH SERVICES 103,700 103,700 0
LEISURE AND HOSPITALITY 82,500 82,800 -300
OTHER SERVICES 29,200 29,200 0
GOVERNMENT 199,300 199,700 -400

-15-
New Mexico Unemployment Insurance^
Average Hours and EarningsPrepared in cooperation with the U.S. Bureau of Labor Statistics
Oct-04 Sep-04 Oct-03 Percent ChangeCLAIMS ACTIVITIES from Sept-04 From Oct-03 Initial Claims 4,676 4,133 6,137 13.1% -23.8% Continued Claims # 44,351 46,345 53,265 -4.3% -16.7% Insured Unemployed # 11,027 11,285 12,851 -2.3% -14.2% Insured Unemployment Rate 1.5% 1.6% 1.8%PAYMENT ACTIVITIES First Payments 1,953 1,869 2,587 4.5% -24.5% Final Payments 993 990 1,252 0.3% -20.7% Weeks Compensated 35,307 37,526 43,592 -5.9% -19.0% Net Benefit Payments $7,940,096 $8,426,201 $9,421,822 -5.8% -15.7% Average WBA* $215.25 $214.75 $207.72 0.2% 3.6% Average Duration (weeks)* 18.0 17.9 17.6 0.7% 2.4% Exhaustion Rate * 43.9% 43.6% 43.4%
^ Regular program only, not seasonally adjusted, does not include TEUC. * 12-month moving average. # Includes intrastate & interstate agent continued claims.Questions or comments? Please contact Actuarial Research @ (505) 841-9062 or [email protected]
Initial Claims
2,000
3,000
4,000
5,000
6,000
7,000
8,000
9,000
Jan-96
Jul-96
Jan-97
Jul-97
Jan-98
Jul-98
Jan-99
Jul-99
Jan-00
Jul-00
Jan-01
Jul-01
Jan-02
Jul-02
Jan-03
Jul-03
Jan-04
Jul-04
Not Seasonally Adjusted Seasonally Adjusted
AVERAGE WEEKLY EARNINGS AVERAGE WEEKLY HOURS AVERAGE HOURLY EARNINGS
NEW MEXICO Oct 04 Sep 04 Oct 03 Oct 04 Sep 04 Oct 03 Oct 04 Sep 04 Oct 03
NATURAL RES. & MINING $751.69 $749.52 $736.59 43.4 43.3 42.9 $17.32 $17.31 $17.17
CONSTRUCTION $599.47 $599.47 $603.20 39.7 39.7 40.0 $15.10 $15.10 $15.08
MANUFACTURING $517.45 $518.36 $513.50 39.5 39.6 39.5 $13.10 $13.09 $13.00
WHOLESALE TRADE $516.84 $516.84 $517.32 35.4 35.4 35.9 $14.60 $14.60 $14.41
RETAIL TRADE $336.00 $336.09 $331.84 32.0 32.1 32.0 $10.50 $10.47 $10.37
FINANCIAL ACTIVITIES $486.16 $481.38 $484.46 35.8 35.5 36.1 $13.58 $13.56 $13.42
ALBUQUERQUE MSA Oct 04 Sep 04 Oct 03 Oct 04 Sep 04 Oct 03 Oct 04 Sep 04 Oct 03
MANUFACTURING $592.97 $600.98 $555.43 39.4 39.8 38.2 $15.05 $15.10 $14.54
Estimates include all full-time and part-time wage and salary workers who worked or received pay during the pay period which includedthe 12th day of the month. Self-employed, family workers, household workers and members of the Armed Forces are excluded. Theaverage earnings are "gross" reflecting not only changes in basic hourly and incentive wage rates but also such factors as premiumpay for overtime and shift differentials. The work week information relates to the average hours for which pay was received,and is different from standard or scheduled hours due to absenteeism, labor turnover, part time work, overtime work etc.
U.S. Consumer Price IndexIndex Base Year 1982-84 = 100 PERCENT CHANGE
Oct 04 Sep 04 Oct 03 Month to Month Year to YearCPI-U 190.9 189.9 185.0 0.5% 3.2%CPI-W 186.5 185.4 180.7 0.6% 3.2% *CPI-U - All Urban Consumers *CPI-W - Urban Wage Earners and Clerical Workers - Source: U.S. Department of Labor, Bureau of Labor Statistics

-16-
(SOURCES: Published articles, government documents, private and public sector news releases and reports from local New Mexico Department of Labor Workforce Centers. In most cases, no attempt is made to verify accuracy of information from the above sources.)
New Mexico Area Economic Activity
Statewide:Governor Richardson announced the signing of a memorandum ofunderstanding with the Burlington Northern Santa Fe Railway forthe use of BNSF tracks for the planned commuter service in theRio Grande corridor. The Governor also announced that the stateis in the process of buying ten train cars for the project. The firstphase of the project that will initially link stations from Belen toBernalillo is slated for July 2005. A second phase, which willconnect the rail line to Santa Fe, is programmed for completion bythe fall of 2008.
Lions Gate Entertainment Inc. is planning to film a two-hourtelevision pilot for a possible teen series about a girl on a horsefarm. The show, titled ìWild Fire,î is being developed for theABC Family cable network. The company is scouting locationsthroughout the state but is looking primarily at the Albuquerquearea. Lions Gate had originally planned to produce the pilot inCanada but was attracted to the state by the efforts of the NewMexico Film Office. About 100 New Mexicans will be needed towork on the film.
Santa Fe Community College has enrolled 58 students in its newthree-semester Film Technicians Training Program. The school isrunning a pilot program designed to establish a training course toproduce qualified New Mexican film technicians and to serve as aprototype for other New Mexico community colleges to set upsimilar programs. Graduates of the training program will be quali-fied to join the International Alliance of Stage Employees (IATSE)Local 480.
Albuquerque Area, Bernalillo County:
Aviation Technology Group and Israeli Aircraft Industrieshave selected Albuquerqueís Double Eagle II aviation park as thesite of a factory to build the civilian version of its 2-seat highperformance jet airplane, the Javelin. No date has been announcedfor the official groundbreaking of the planned 100,000-square-foot manufacturing facility. Aviation Technologies Group believesthat it will need a local workforce of about 200 workers and itexpects to sell about 70 to 120 of the $2.5 million jets annually.
Georgia-based American Utilicraft Corporation has signed aletter of intent to manufacture its twin-engine air freighter on a 15-acre site at the Double Eagle aviation park. The company couldemploy as many as 400 workers. The company had been involvedin discussions with TSAY Corporation about locating the plant onSan Juan Pueblo.
The U.S. Forest Service is planning to make Albuquerque itslargest base of employment outside of Washington D.C. Theagency is seeking to centralize many of its operations that are
spread across hundreds of offices nationwide into the office inAlbuquerque. So far, the Forest Service has announced the loca-tion of 700 jobs to Albuquerque, and additional jobs may becoming as well. Only about 20 percent of the jobs are comingfilled, so a significant number of jobs will be available. Salaries ofavailable positions are expected to be in the range of $27,000 to$63,600 annually.
United Concordia Dental Insurance, the nation's sixth largestdental insurance carrier, has picked Albuquerque for the site of abilingual customer support center. The company is seeking anexisting 10,000-square-foot facility to house its operations andplans to be operational by the end of October. United Concordiaplans to bring about 125 jobs to Albuquerque over the next threeyears. Jobs with the company average about $12.15 per hour withbenefits.
Grants Area, Cibola County:
A new coal-burning power plant will be built about 45 miles northof Grants to serve as a test site for a new pollution control process.United States Department of Energy Secretary Spencer Abrahamannounced the award of $19.7 million to Peabody Energy and itspartner, Airborne Clean Energy, who are the developers of thepollution control technology. Peabody expects to obtain neededpermits and break ground on the project in 2006. When completedin 2009 or 2010, the plant will employ about 50 full time workers.
Clovis Area, Curry County:
An undisclosed company is actively considering Clovis for aninbound call center. The company is looking at the building thatfirst housed the call center operations of ClientLogic and laterMCI. Wages for the call center could average between $6.25 and$12 per hour, and 300 full-time and 300 part-time employeescould be needed.
Artesia Area, Eddy County:
The Federal Law Enforcement Training Center is expandingits facility at the former campus of the College of Artesia. A newthree-story office and a $6.5 million classroom complex are beingbuilt at the Center to accommodate the influx of new or expandedprograms. Some of the old portable classrooms have been movedto the firearms ranges to make way for new construction. TheBorder Patrol plans to make Artesia its major training site foragents.

-17-
Publication Updatedand Available Now!
Annual Social and Economic Indicators, formerly AnnualPlanning Indicators, is published by the New MexicoDepartment of Labor (NMDOL), Bureau of EconomicResearch and Analysis. This report is intended to aidplanners by providing information on the current andexpected labor market conditions by area, industry, andoccupation. This report also provides information on thecharacteristics of the persons who compose the labor force.
Carlsbad Area, Eddy County:
The availability of the local pool of skilled engineering and techni-cal workers has prompted Advanced Tentoe Inc. to open a newoffice in Carlsbad. The company plans to hire ten employees insoftware programming and software engineering to start, and mayexpand to 60 employees over the next five years. Wages at theCarlsbad office will range from $10 to $45 per hour.
Tucumcari Area, Quay County:
After nine years in operation, La Cita, a popular Tucumcarirestaurant, closed. La Cita owners, Karen Manning and SharonMcCauley, noted business problems rather than a lack of custom-ers for the late October closing. Two other popular Tucumcarirestaurants, Deanís and Meganís, have also recently closed.
EspaÒola Area, Rio Arriba County:
Computer Assets, an EspaÒola based software and network inte-gration company, has begun construction of a $3.5 million expan-sion project. The company plans to build three buildings onRailroad Avenue to accommodate the companyís headquarters,warehouse space, a coffee shop and to serve future needs. Com-puter Assets currently employs 54 workers and plans to add 80more over the next three years.
Construction of the Loweís Home Improvement Warehouse ismostly complete and the company is in the process of hiring 300workers for its new EspaÒola store. The new store on RiversideDrive is scheduled to open on December 8.
Rio Rancho Area, Sandoval County:
Rio Rancho city councilors gave preliminary approval to $16million in industrial revenue bonds for GarduÒoís to purchase andrenovate the 157,000-square-foot building formerly used by Ful-crum Direct. The company plans to locate its corporate offices, afood manufacturing operation and possibly a small restaurant inthe now vacant building. One of GarduÒoís plans includes market-ing its products in supermarkets nationwide. The company be-lieves that its Rio Rancho operations will create about 80 full-timeand 20 part-time jobs over the next five years.
Encino Area, Torrance County:
The economy of the little town of Encino suffered a serioussetback when 17 of the 25 workers at the Hanson Pedernal rockcrushing plant were laid off in mid-October. The remaining eightworkers will stay until the plant closes at the end of the year.About half of Encinoís current population of about 90 people isconnected to the plant in one way or another.

New Mexico Department of LaborEconomic Research and Analysis (CC6097)P.O. Box 1928Albuquerque, New Mexico 87103
Official BusinessPenalty for Private Use, $300
To be placed on our mailing list, orif your address has changed, or ifyou do NOT desire to continue re-ceiving this publication, please callor write to:
New Mexico Labor Market Reportis a monthly publication from the New MexicoDepartment of Labor
Gerry Bradley, ER&A Manager Economic Research and Analysis Bureau
Major Contributors: Mark Boyd, Economist Susan Beard, Economist Karl Romero, Graphic Artist
Other Contributors: Herb Greenwall, Economist Supervisor Theresa Sandoval, Economist Rachel Moskowitz, Economist
PRSRT STDUS POSTAGEPAIDALBUQUERQUE, NMPERMIT No. G-12
New MexicoDepartment of LaborEconomic Research & AnalysisP.O. Box 1928Albuquerque, NM 87103Phone: (505) 841-8673Fax: (505) 841-9007