bilingual education programs and english language … · programs and english language ... state...
TRANSCRIPT

Bilingual Education Programs and
English Language Learners in Illinois
SY 2012 (2011-2012 School Year) STATISTICAL REPORT
Data Analysis and Accountability Division English Language Learning Division Illinois State Board of Education
July 2013 Gery J. Chico, Chairman Christopher A. Koch, Ed.D. Illinois State Board of Education State Superintendent of Education

Bilingual Education Programs and English Language Learners in Illinois SY 2012 Statistical Report
FOREWORD
This school year 2011-2012 (SY 2012) statistical report has three parts:
Part A – Bilingual Education Programs in Illinois presents information that includes, but is not limited to, the number of certified teachers working with limited English proficient (LEP) students, types of instructional delivery models and instructional methods used by school districts in educating LEP students. The data for this part were extracted from the 2012 Bilingual Education Program Delivery Reports (PDRs) of districts. Note: English language learner (ELL) is preferred in Illinois and will be used in this report in lieu of LEP. Part B – English Language Learners (ELL) in Illinois presents the grade levels of and native languages spoken by ELL students, the concentration of the ELL population in counties across the state, and the participation of ELL students in school district ELL programs. This part also includes information about the performance of ELL students on Assessing Comprehension and Communication in English State-to-State for English Language Learners (ACCESS for ELLs®), a standards-based English language proficiency assessment, and on the state academic assessments, i.e., the Illinois Standards Achievement Test (ISAT). The data for this part were extracted from the SY 2012 SIS-LEP Enrollments and ELL Record Data, 2012 Title III District List, 2012 ACCESS for ELLs, 2006 through 2011 Longitudinal LEP/ACCESS Data , and 2012 ISAT. Part C - Annual Measurable Achievement Objectives (AMAO) presents results of the Annual Measurable Achievement Objectives (AMAOs), an NCLB, Title III, accountability piece, for SY 2012. In addition, an eight-year analysis of AMAOs in Illinois is presented.
The interpretations presented in this report do not necessarily reflect the positions or the policies of the Illinois State Board of Education (ISBE). For more information, please contact Dr. Seon Hwa Eun of the ISBE Division of English Language Learning (DELL) at 312-814-3850.

Bilingual Education Programs and English Language Learners in Illinois SY 2012 Statistical Report
i
TABLE OF CONTENTS
Background ..................................................................................................................................... 1
Identification of ELL Students ................................................................................................. 1 Program Options ....................................................................................................................... 1 Sources of Data ........................................................................................................................ 2
Part A: Bilingual Education Programs in Illinois ........................................................................... 3
Section 1: Types of Illinois School District Programs Serving the Educational Needs of ELL Students in SY 2011 ......................................................................... 3 Section 2: Qualifications of, and Professional Development Provided to, School District Staff Who Work with Illinois ELL Students ............................................................ 4
Part B: The English Language Learners (ELL) in Illinois ............................................................. 5
Section 5: ELL Student Demographics and Program Participation .......................................... 5 Section 6: English Language Proficiency Levels of Illinois ELL students ............................... 12 Section 7: Performance Levels of ELL Students on the Illinois Standards
Achievement Test (ISAT) ........................................................................................ 16
Part C: Annual Measurable Achievement Objectives (AMAOs) .................................................. 22
Section 8: Annual Measurable Achievement Objectives (AMAOs) – Accountability Model of NCLB, Title III ................................................................ 22
Appendix A ................................................................................................................................. 25 Appendix B ................................................................................................................................. 38 Appendix C ................................................................................................................................. 41

Bilingual Education Programs and English Language Learners in Illinois SY 2012 Statistical Report
ii
TABLE OF TABLES
Table 1. Number and Percentage of School Districts, by Type of Program Funding and
ELL Enrollments: SY 2012 .................................................................................................. 3 Table 2. Number and Percentage of Teachers from Funded Districts Who Are Qualified
to Teach ELL Students, by Type of Certification and Number and Percentage of Teachers Working in Title III Programs: SY 2012 .......................................................... 4 Table 3. Number and Percentage of ELL Students, by County: SY 2012 ......................................... 5 Table 4. Number and Percentage of Native Languages Spoken by ELL Students and
Language: SY 2012 .............................................................................................................. 6 Table 5. Number of ELL Students, by Language and Illinois Location: SY 2012 ............................ 7 Table 6. Number and Percentage of ELL Students by Grade Level and
Race/Ethnicity: SY 2012 ...................................................................................................... 8 Table 7. Number of ELL Students by Grade Cluster and Disability Status: SY 2012 ....................... 9 Table 8. Number and Percentage of ELL Students Enrolled in an ELL Program
and Type of Program Funding: SY 2012 ............................................................................. 10 Table 9. Number and Percentage of ELL Students Who Attained Proficiency in English Language,
by Number of Years in the Program: SY 2012 .................................................................... 11 Table 10. Number and Percentage of ELL Students, by Composite Proficiency Level (CPL) on the the ACCESS for ELLs® and Grade Cluster: SY 2012 ............................................................ 13 Table 11. Number and Percentage of ELL Students, by Literacy Proficiency Level (LPL) on the the ACCESS for ELLs® and Grade Cluster: SY 2012 ............................................................ 14 Table 12. Number and Percentage of ELL Students Meeting the English Language Proficiency Criteria on the
ACCESS for ELLs®, by Grade Cluster: SY 2012 ................................................................... 15 Table 13. Number and Percentage of Title III Districts Meeting/Not Meeting
AMAOs: FY12 ..................................................................................................................... 23 Table 14. Historical Summary of AMAO Status of Districts That Received Title III Funds in FY12 . 24

Bilingual Education Programs and English Language Learners in Illinois SY 2012 Statistical Report
iii
TABLE OF CHARTS
Chart 1. Comparison of Performance of ELL Students with Non-ELL Students on the 2012 ISAT-Reading, by Grade Level: SY 2012 ................................................................ 17 Chart 2. Achievement Gaps Between All ELL Students and Non-ELL Students on the 2012 ISAT-
Reading, by Grade Level: SY 2012 ......................................................................................... 17 Chart 3. Comparison of Performance of ELL Students with Non-ELL Students on the 2012 ISAT-Mathematics, by Grade Level: SY 2012 ......................................................... 18 Chart 4. Achievement Gaps Between All ELL Students and Non-ELL Students on the 2012 ISAT-
Mathematics, by Grade Level: SY 2012 .................................................................................. 18 Chart 5. Comparison of Performance of Transitioned ELL Students with Non-ELL Students on the 2012 ISAT-Reading, by Grade Level: SY 2012 ................................................................ 19 Chart 6. Achievement Gaps Between Transitioned ELL Students and Non-ELL Students on the 2012
ISAT-Reading, by Grade Level: SY 2012 ............................................................................... 20 Chart 7. Comparison of Performance of Transitioned ELL Students with Non-ELL Students on the 2012 ISAT-Mathematics, by Grade Level: SY 2012 ......................................................... 21 Chart 8. Achievement Gaps Between Transitioned ELL Students and Non-ELL Students on the 2012
ISAT-Mathematics, by Grade Level: SY 2012 ....................................................................... 21

Bilingual Education Programs and English Language Learners in Illinois SY 2012 Statistical Report
1
Background
IDENTIFICATION OF ELL STUDENTS
For the purpose of identifying students of a language background other than English, districts administer a Home Language Survey (HLS) to every newly enrolled student. If the survey indicates that a language other than English is spoken in the home, the district must assess the student for English language proficiency using the screening instrument prescribed by ISBE. The screening must take place within 30 days after the student enrolls in the district at the beginning of the school year to determine the student’s eligibility for ELL services and the appropriate placement for the student. Each student scoring as not “proficient,” as defined by the State Superintendent of Education, is considered an ELL student eligible for ELL services. Annual Examinations of ELL Students Section 14C-3 of the Illinois School Code (105 ILCS 5/14C-3) requires that all K-12 students identified as ELL be tested annually for English proficiency in four language domains: aural comprehension (listening), speaking, reading, and writing. Since SY 2006, ISBE has prescribed the ACCESS for ELLs® for the annual English proficiency assessment of ELL students.
PROGRAM OPTIONS 105 ILSC 5/14C-3 also requires that one of two types of programs be provided for all PK-12 ELL students to help them become proficient in English and transition into the general education curriculum. Transitional Bilingual Education (TBE) Legislation passed in 1973 requires Illinois school districts to offer a TBE program when 20 or more ELL students of the same language classification are enrolled in the same attendance center. TBE programs must provide instruction in the home language of students and in English in all required subject areas, as well as instruction in English as a second language (ESL). TBE teachers are required to be certified by the state of Illinois and possess the appropriate bilingual and/or ESL endorsement/approval. Bilingual teachers must demonstrate proficiency in the language(s) spoken by students and in English. Transitional Program of Instruction (TPI) If an attendance center has an enrollment of 19 or fewer ELL students from any single non-English language, it may elect to offer a TPI program in lieu of a TBE program. TPI programs must include instruction or other assistance in a student’s home language to the extent necessary as determined by the student’s level of English proficiency. TPI services may include, but are not limited to, instruction in ESL, language arts in the student’s home language, and history of the student’s native land and the United States. Like TBE teachers, TPI teachers must hold the proper teacher certifications and endorsements/approvals for their teaching assignments. Districts that provide at least five periods of TBE/TPI services a week to ELL students may apply for state TBE/TPI funding which reimburses some of the excess costs of providing these services based on a prorated formula.

Bilingual Education Programs and English Language Learners in Illinois SY 2012 Statistical Report
2
The No Child Left Behind Act of 2001 (NCLB) enables school districts in Illinois with state-funded TBE and/or TPI programs to apply for supplemental federal funding to support the educational needs of ELL students. This federally-funded program for ELL students is called Title III: Language Instruction Programs for Limited English Proficient and Immigrant Students.
SOURCES OF DATA
Data for this report were extracted and analyzed by the Data Analysis and Accountability Division from SY2012 SIS-LEP Enrollments, ELL Record Data, and the Bilingual Education Program Delivery Report (PDR). State test results were reported to ISBE by the respective testing contractors.
A. Demographic and Program Data ELL Data - Districts with ELL students are required to submit on SIS the demographic information on each ELL student enrolled in a district, including a student’s native language, grade level, gender, birth date, enrollment in language instructional programs, program entry and exit dates, and reasons for exiting the ELL program. Bilingual Education Program Delivery Report (PDR) - All districts that provide TBE/TPI services are required to submit a PDR to ISBE at the end of the school year. The PDR collects data including, but not limited to program staffing, staff professional development, parent involvement, and types of language instructional services provided to ELL students. The PDR is reported on the ISBE Web Application Security (IWAS) system.
B. ELL Assessment Data ACCESS for ELLs® - ACCESS for ELLs® stands for Assessing Comprehension and Communication in English State-to-State for English Language Learners. It is a large scale standards-based and criterion-referenced assessment designed to measure the English language proficiency of ELL students. This test is administered annually to all ELL students in Illinois. ISAT and PSAE - The Illinois Standards Achievement Test (ISAT) and the Prairie State Achievement Examination (PSAE) measure individual student achievement in mathematics, reading, writing, and science relative to the Illinois Learning Standards. ISAT is administered to children in grades 3-8 and the PSAE is administered to students in grade 11. Beginning in 2008, all ELL students were required to participate in these regular state assessments of academic achievement. In prior years, districts had the option of testing ELL students with the Illinois Measure of Annual Growth in English (IMAGE), a test using simplified English to test ELL students in math and reading. Now students who have been eligible for ELL language support services for fewer than five years (excluding preschool and kindergarten) may receive accommodations on the ISAT or PSAE. The accommodations are provided to allow them to access test content. ISAT and the PSAE are not administered to students with disabilities for whom regular state assessments are not appropriate. These students may take the Illinois Alternate Assessment (IAA) instead.

Bilingual Education Programs and English Language Learners in Illinois SY 2012 Statistical Report
3
PART A BILINGUAL EDUCATION PROGRAMS IN ILLINOIS Section 1: TYPES OF ILLINOIS SCHOOL DISTRICT PROGRAMS SERVING THE EDUCATIONAL
NEEDS OF ELL STUDENTS IN SY 2011 District/Educational Unit ELL Enrollments and Funding In SY 2012, 610 school districts/educational entities in Illinois enrolled 207,417 ELL students, an increase of about 10,000 students from SY 2011. Three hundred ten of these districts/educational entities received state bilingual funds for direct student services. The ELL enrollment by district/educational unit ranged from one student to 69,689 students with City of Chicago School District 299 or Chicago Public Schools (CPS), enrolling the most ELL students. The total ELL enrollment for the 310 educational units that received State bilingual funds was 203,922 students which represented 98.2 percent of total ELL enrollment statewide. (See Appendix A for ELL enrollment by educational entity.) Districts that receive State bilingual funds are also eligible to receive federal funds to supplement expenditures in educating ELL students. Of the 310 educational entities that received State bilingual funds, 202 received funds from Title III, a federal program to provide instructional support for limited English proficient and immigrant students. As indicated on page 1 of this report, there are two types of State funded bilingual education programs in Illinois: Transitional Bilingual Education (TBE) and Transitional Program of Instruction (TPI). The funding formula for these programs is based on the number of ELL students served, periods of service, grade level, and type of program. Table 1 shows the distribution of the 610 districts by type of funding and ELL enrollments. Table 1. Number and Percentage of School Districts, by Type of Program Funding and
ELL Enrollments: SY 2012
Number Pct of Total Number Pct of
Total State-Funded TBE only 13 2.1% 695 0.3%State-Funded TPI only 60 9.8% 2,521 1.2%State-Funded TBE and TPI 35 5.7% 3,186 1.5%State-Funded TBE and Federal-Funded Title III 15 2.5% 6,202 3.0%State-Funded TPI and Federal-Funded Title III 26 4.3% 4,599 2.2%State-Funded TBE and TPI and Federal-Funded Title III 161 26.4% 186,719 90.0%Non-State-Funded 300 49.2% 3,495 1.7%
Total 610 100.0% 207,417 100.0%
Districts ELL EnrollmentsType of Program Funding

Bilingual Education Programs and English Language Learners in Illinois SY 2012 Statistical Report
4
Of the 310 State-funded districts, 202 (65.2 percent) received both TBE and TPI State and Title III funds. These 202 districts enrolled 197,520 ELL students, 95.2 percent of total ELL enrollment of state-funded districts, and 96.9 percent of total ELL enrollment statewide. With funded districts enrolling practically all ELL students in Illinois (98.3 percent), the remaining analysis of program related data is limited to the PDRs of these 310 districts. Section 2: QUALIFICATIONS OF, AND PROFESSIONAL DEVELOPMENT PROVIDED TO, SCHOOL
DISTRICT STAFF WHO WORK WITH ILLINOIS ELL STUDENTS
Bilingual Education Program Information of State-Funded School Districts in SY 2012
Licensures/Certifications of Teachers Who Worked with ELL Students in SY 2012 7,414 teachers (84 percent of whom have Bilingual and/or ESL endorsements/approvals) taught ELL students in SY 2012 as reported by districts in their 2012 Bilingual Education Program Delivery Reports (PDR). Close to 51 percent of these teachers taught in Title III Language Instruction Educational Programs. (See Table 2.) Table 2. Number and Percentage of Teachers from Funded Districts Who Are Qualified to Teach
ELL Students, by Type of Certification and Number and Percentage of Teachers Working in Title III Programs: SY 2012
**Other certification includes but not limited to elementary, high school, and special education teaching certificates
NumberPct. of Total Number
Pct of All Teachers
Certificate with ESL Endorsements and/or Approval 2,052 27.7 1,042 50.8 Certificate with Bilingual Endorsements and/or Approval 2,096 28.3 504 24.0 ESL and Bilingual Endorsements 2,057 27.7 1,607 78.1 Type 29 (Transitional Bilingual Certificate) 717 9.7 526 73.4 English as a New Language (ENL) (Secondary only) 4 0.1 2 50.0 ENL - Bilingual (Secondary only) 3 0.0 - - Visiting International Teaching Certificate 36 0.5 25 69.4 Other Certification** 449 6.1 66 14.7
Total 7,414 100.0 3,772 50.9
All TeachersType of Certificate
Number of Teachers Currently working in Title III
Language Instruction Educational Programs

Bilingual Education Programs and English Language Learners in Illinois SY 2012 Statistical Report
5
PART B THE ENGLISH LANGUAGE LEARNERS (ELL) IN ILLINOIS Section 5: ELL STUDENT DEMOGRAPHICS AND PROGRAM PARTICIPATION
ELL STUDENT ENROLLMENT
Close to 59 percent of ELL students in Illinois public schools were enrolled in school districts located in Cook County, including Chicago Public School District 299 (CPS) (See Table 3). Surrounding counties of Cook County (Du Page, Lake, Kane and Will) enrolled 30 percent of ELL students. For information on SY 2012 ELL student enrollment by district/educational entity, see Appendix A.
Table 3. Number and Percentage of ELL Students, by County: SY 2012
County Number Percent County Number PercentADAMS 17 .01 LAWRENCE 7 .00ALEXANDER 3 .00 LEE 36 .02BOND 3 .00 LIVINGSTON 12 .01BOONE 1,084 .52 LOGAN 10 .00BROWN 2 .00 MACON 95 .05BUREAU 299 .14 MACOUPIN 7 .00CARROLL 2 .00 MADISON 796 .38CASS 547 .26 MARION 5 .00CHAMPAIGN 1,433 .69 MASON 1 .00CITY OF CHICAGO 69,689 33.60 MCDONOUGH 45 .02CLARK 10 .00 MCHENRY 3,637 1.75CLAY 4 .00 MCLEAN 704 .34CLINTON 84 .04 MENARD 3 .00COLES 27 .01 MONROE 4 .00COOK 51,650 24.90 MONTGOMERY 10 .00CRAWFORD 1 .00 MORGAN 45 .02DEKALB 874 .42 MULTI-COUNTY 15 .01DEWITT 12 .01 OGLE 600 .29DOUGLAS 103 .05 PEORIA 920 .44DUPAGE 16,466 7.94 PIATT 12 .01EDGAR 2 .00 PIKE 7 .00EDWARDS 5 .00 PUTNAM 15 .01EFFINGHAM 35 .02 RANDOLPH 9 .00FAYETTE 1 .00 ROCK ISLAND 1,905 .92FORD 54 .03 SALINE 3 .00FRANKLIN 7 .00 SANGAMON 194 .09FULTON 16 .01 SCHUYLER 28 .01GALLATIN 6 .00 SHELBY 1 .00GRUNDY 277 .13 ST.CLAIR 128 .06HAMILTON 6 .00 STARK 11 .01HANCOCK 13 .01 STEPHENSON 134 .06HENRY 139 .07 TAZEWELL 98 .05IROQUOIS 72 .03 UNION 100 .05JACKSON 324 .16 VERMILION 227 .11JASPER 1 .00 WABASH 2 .00JEFFERSON 8 .00 WARREN 188 .09JO DAVIESS 53 .03 WASHINGTON 3 .00JOHNSON 9 .00 WHITE 10 .00KANE 21,756 10.49 WHITESIDE 249 .12KANKAKEE 983 .47 WILL 8,089 3.90KENDALL 1,324 .64 WILLIAMSON 42 .02KNOX 146 .07 WINNEBAGO 3,972 1.91LAKE 16,741 8.07 WOODFORD 17 .01LASALLE 733 .35 Total 207,417 100.0

Bilingual Education Programs and English Language Learners in Illinois SY 2012 Statistical Report
6
NATIVE LANGUAGES OF ELL STUDENTS
ELL students in Illinois spoke at least 138 non-English native languages in SY 2012 with Spanish spoken by 81 percent of students. See Table 4.
Table 4. Number and Percentage of Native Languages Spoken, by ELL Students and Language: SY 2012
Language Count Pct Language Count Pct Language Count PctAFRIKAANS (TAAL) 61 .03 HAWAIIAN 2 .00 NORWEGIAN 11 .01
AKAN (FANTE/ASANTI/TWI) 76 .04 HEBREW 71 .03 ORIYA 17 .01ALBANIAN/GHEG (KOSOVO/MACEDONIA) 274 .13 HINDI 733 .35 OTHER 1,513 .73
ALBANIAN/TOSK (ALBANIA) 254 .12 HMONG 18 .01 OULOF (WOLOF) 31 .01
ALGONQUIN 1 .00 HUNGARIAN 32 .02 PALAUAN 1 .00
AMHARIC 179 .09 IBO/IGBO 119 .06 PAMPANGAN 5 .00
ARABIC 5,664 2.73 ICELANDIC 4 .00 PANJABI (PUNJABI) 215 .10
ARMENIAN 44 .02 ILOCANO 13 .01 PASHTO (PUSHTO) 30 .01
ASSAMESE 1 .00 ILONGGO (HILIGAYNON) 22 .01 PILIPINO (TAGALOG) 1,849 .89
ASSYRIAN (SYRIAC/ARAMAIC) 808 .39 INDONESIAN 54 .03 POLISH 5,850 2.82
BAGHELI 11 .01 ITALIAN 200 .10 PORTUGUESE 173 .08
BALINESE 6 .00 JAMAICAN 30 .01 PUEBLO 2 .00
BEMBA 10 .00 JAPANESE 585 .28 ROMANIAN 461 .22
BENGALI 183 .09 KACHE (KAJE/JJU) 4 .00 ROMANY (GYPSY) 3 .00
BISAYA (MALAYSIA) 19 .01 KANJOBAL 10 .00 RUSSIAN 1,215 .59
BOSNIAN 455 .22 KANNADA (KANARESE) 73 .04 SAMOAN 10 .00
BULGARIAN 435 .21 KANURI 3 .00 SERBIAN 409 .20
BURMESE 416 .20 KAREN (SGAW) 2 .00 SHANGHAI (CHINESE) 30 .01
CAMBODIAN (KHMER) 144 .07 KASHMIRI 2 .00 SHONA 9 .00
CANTONESE (CHINESE) 1,394 .67 KIKAMBA (KAMBA) 1 .00 SINDHI 13 .01
CEBUANO (VISAYAN) 47 .02 KONKANI 13 .01 SINHALESE 9 .00
CHALDEAN 9 .00 KOREAN 1,345 .65 SLOVAK 66 .03
CHAMORRO 1 .00 KPELLE 2 .00 SLOVENIAN 4 .00
CHAOCHOW/TEOCHIU (CHINESE) 47 .02 KRAHN 19 .01 SOMALI 202 .10
CHEROKEE 1 .00 KRIO 28 .01 SOTHO 2 .00
CHICHEWA (NYANJA) 1 .00 KURDISH 21 .01SOURASHTRA (SAURASHTRA) 7 .00
CROATIAN 70 .03 LAO 231 .11 SPANISH 167,331 80.67
CROW 2 .00 LATVIAN 10 .00 SWAHILI 150 .07
CZECH 139 .07 LINGALA 26 .01 SWEDISH 37 .02
DANISH 19 .01 LITHUANIAN 482 .23TAIWANESE/FORMOSAN/MIN NAN (CHINESE) 23 .01
DUTCH/FLEMISH 34 .02 LUGANDA / BANTU 24 .01 TAMIL 277 .13
EFIK 2 .00 LUO 2 .00 TELUGU (TELEGU) 629 .30
ESTONIAN 6 .00MAAY MAAY (MAYMAY) 23 .01 THAI 165 .08
EWE 137 .07 MACEDONIAN 71 .03 TIBETAN 12 .01
FARSI (PERSIAN) 212 .10 MALAY 34 .02 TIGRINYA (TIGRIGNA) 58 .03
FINNISH 4 .00 MALAYALAM 525 .25 TONGAN 3 .00
FRENCH 799 .39 MANDARIN (CHINESE) 1,272 .61 TULU 8 .00
FUKIEN/HOKKIEN (CHINESE) 37 .02 MANDINGO (MANDINKA) 14 .01 TURKISH 191 .09
GA 15 .01 MAORI 2 .00 UKRAINIAN 532 .26
GERMAN 166 .08 MARATHI 108 .05 URDU 2,798 1.35
GREEK 273 .13 MENDE 2 .00 UZBEK 29 .01
GUJARATI 1,777 .86 MENOMINEE 1 .00 VIETNAMESE 1,342 .65
GUYANESE 7 .00 MIEN (YAO) 1 .00 WINNEBAGO 1 .00
HAINANESE (CHINESE) 11 .01 MINA (GESER-GORAM) 34 .02 YOMBE 6 .00
HAITIAN-CREOLE 166 .08 MONGOLIAN 175 .08 YORUBA 308 .15
HAKKA (CHINESE) 3 .00 NAVAJO 4 .00 Total 207,417 100.00HAUSA 16 .01 NEPALI 497 .24

Bilingual Education Programs and English Language Learners in Illinois SY 2012 Statistical Report
7
The top ten languages spoken by ELL students were Spanish, Polish, Arabic, Urdu, Pilipino (Tagalog), Gujarati, Cantonese (Chinese), Korean, Vietnamese, and Mandarin (Chinese). Spanish is the predominant language spoken by ELL students in all geographic locations. Districts in the suburbs of city of Chicago (please see footnote for county coverage) enrolled over half of ELL students in Illinois (55.3). CPS enrolled 33.6 percent of ELL students, the highest enrollment for a district. (See Table 5.)
Table 5. Number of ELL Students, by Language and Illinois Location*: SY 2012
*East Central location includes the counties of CHAMPAIGN, MCLEAN, KANKAKEE, VERMILION, MACON, DOUGLAS, IROQUOIS, COLES, CLARK, KNOX, PIATT, FORD, LIVINGSTON, DEWITT, and EDGAR; Northern location includes the counties of MCHENRY, WINNEBAGO, KENDALL, BOONE, ROCK ISLAND, DEKALB, OGLE, LASALLE, GRUNDY, HENRY, BUREAU, WHITESIDE, STEPHENSON, JO DAVIESS, LEE, CARROLL, and STARK; Southern location includes the counties of MADISON, JACKSON, ST.CLAIR, UNION, WILLIAMSON, EFFINGHAM, CLINTON, JEFFERSON, SALINE, LAWRENCE, MARION, JOHNSON, FRANKLIN, WASHINGTON, GALLATIN, MONROE, PERRY, PULASKI, RANDOLPH, WABASH, CRAWFORD, EDWARDS, FAYETTE, and HAMILTON; Chicago Suburbs include the collar counties of COOK, KANE, LAKE, DUPAGE, and WILL; and West Central location includes the counties of ADAMS, BROWN, CASS, CHRISTIAN, FULTON, HANCOCK, LOGAN, MACOUPIN, MARSHALL, MASON, MCDONOUGH, MERCER, MORGAN, PEORIA, PIKE, PUTNAM,
LANGUAGEEAST
CENTRAL NORTHERN SOUTHERNCHICAGO SUBURBS
CITY OF CHICAGO
WEST CENTRAL TOTAL
Pct of TOTAL
SPANISH 2,853 12,651 1,215 88,885 60,310 1,417 167,331 80.7 POLISH 3 143 - 4,543 1,161 - 5,850 2.8 ARABIC 83 297 101 3,701 1,351 131 5,664 2.7 URDU 16 66 12 1,861 827 16 2,798 1.3 PILIPINO (TAGALOG) 42 79 16 1,291 398 23 1,849 0.9 GUJARATI 31 64 16 1,413 212 41 1,777 0.9 CANTONESE (CHINESE) 23 28 15 304 989 35 1,394 0.7 KOREAN 107 26 22 1,092 78 20 1,345 0.6 VIETNAMESE 94 109 17 628 466 28 1,342 0.6 MANDARIN (CHINESE) 128 79 49 625 320 71 1,272 0.6 RUSSIAN 14 60 12 1,019 88 22 1,215 0.6 ASSYRIAN (SYRIAC/ARAMAIC) 1 7 - 553 246 1 808 0.4 FRENCH 127 105 6 256 220 85 799 0.4 HINDI 28 22 4 570 94 15 733 0.4 TELUGU (TELEGU) 62 34 - 449 47 37 629 0.3 JAPANESE 16 12 14 500 33 10 585 0.3 UKRAINIAN 3 6 5 326 190 2 532 0.3 MALAYALAM 5 5 2 485 25 3 525 0.3 NEPALI 8 48 1 172 265 3 497 0.2 LITHUANIAN - 12 - 462 8 - 482 0.2 ROMANIAN 9 5 - 328 116 3 461 0.2 BOSNIAN - 19 - 206 230 - 455 0.2 BULGARIAN - 6 1 373 55 - 435 0.2 BURMESE - 150 1 83 159 23 416 0.2 SERBIAN - 32 - 298 78 1 409 0.2 YORUBA 3 7 - 126 167 5 308 0.1 TAMIL 21 11 - 209 25 11 277 0.1 ALBANIAN/GHEG (KOSOVO/MACEDONIA) 13 50 6 171 27 7 274 0.1 GREEK 2 20 - 199 52 - 273 0.1 ALBANIAN/TOSK (ALBANIA) - 23 7 156 65 3 254 0.1 LAO 10 79 1 132 7 2 231 0.1 PANJABI (PUNJABI) 5 11 3 174 18 4 215 0.1 FARSI (PERSIAN) 6 9 2 150 45 - 212 0.1 SOMALI - 16 - 77 109 - 202 0.1
OTHER (Unidentified) 44 598 7 639 216 9 1,513 0.7
OTHER (Identified) 136 453 71 2,246 992 157 4,055 2.0
TOTAL 3,893 15,342 1,606 114,702 69,689 2,185 207,417 100.0
Percent of TOTAL 1.9 7.4 0.8 55.3 33.6 1.1 100.0

Bilingual Education Programs and English Language Learners in Illinois SY 2012 Statistical Report
8
GRADE LEVEL, RACE/ETHNICITY, GENDER, AND DISABILITY STATUS OF ELL STUDENTS Fifty-six percent of all ELL students in Illinois in SY 2012 were in grades K-3. Twenty five percent were in grades 4 through 8, and ten percent were in high school. Hispanic students constitute 79 percent of all ELL students in Illinois. Other ELL students include 8.4 percent Asian, 9.5 percent white non-Hispanic, and 1.7 percent black non-Hispanic. (See Table 6.)
Table 6. Number and Percentage of ELL Students, by Grade Level and Race/Ethnicity: SY 2012
No.
Pct of Race/
Ethnicity Totals No.
Pct of Race/
Ethnicity Totals No.
Pct of Race/
Ethnicity Totals No.
Pct of Race/
Ethnicity Totals No.
Pct of Race/
Ethnicity Totals No.
Pct of Race/
Ethnicity Totals No.
Pct of Race/
Ethnicity Totals No.
Pct of Grade Level Totals
PK 15,705 9.6 112 11.3 1,517 8.7 291 8.3 30 10.8 1,827 9.3 247 17.5 19,729 9.5 K 24,500 14.9 190 19.1 2,883 16.5 424 12.1 56 20.1 3,702 18.8 267 18.9 32,022 15.4 1 24,659 15.0 142 14.3 2,717 15.6 397 11.3 41 14.7 3,400 17.2 212 15.0 31,568 15.2 2 22,667 13.8 141 14.2 2,387 13.7 368 10.5 28 10.0 2,933 14.9 175 12.4 28,699 13.8 3 19,281 11.8 80 8.0 1,648 9.4 314 9.0 20 7.2 2,034 10.3 113 8.0 23,490 11.3 4 12,352 7.5 62 6.2 964 5.5 214 6.1 14 5.0 1,035 5.2 65 4.6 14,706 7.1 5 9,658 5.9 54 5.4 823 4.7 186 5.3 14 5.0 771 3.9 61 4.3 11,567 5.6 6 7,489 4.6 36 3.6 666 3.8 211 6.0 11 3.9 667 3.4 45 3.2 9,125 4.4 7 6,651 4.1 48 4.8 638 3.7 190 5.4 12 4.3 697 3.5 53 3.8 8,289 4.0 8 6,118 3.7 42 4.2 662 3.8 195 5.6 16 5.7 685 3.5 44 3.1 7,762 3.7 9 6,394 3.9 35 3.5 839 4.8 209 6.0 12 4.3 680 3.4 42 3.0 8,211 4.0 10 4,032 2.5 20 2.0 698 4.0 210 6.0 12 4.3 515 2.6 45 3.2 5,532 2.7 11 2,552 1.6 18 1.8 562 3.2 161 4.6 7 2.5 452 2.3 25 1.8 3,777 1.8 12 1,993 1.2 14 1.4 438 2.5 134 3.8 6 2.2 339 1.7 16 1.1 2,940 1.4
Race/ Ethnicity
Totals164,051 79.1 994 0.5 17,442 8.4 3,504 1.7 279 0.1 19,737 9.5 1,410 0.7 207,417 100
Grade Level
Grade Level TotalsHispanic or Latino
American Indian or Alaska Native Asian
Black or African American
Native Hawaiian or Other Pacific
Islander WhiteTwo or More
Races
Race/Ethnicity

Bilingual Education Programs and English Language Learners in Illinois SY 2012 Statistical Report
9
Disability Status Table 7 shows that close to 17 percent of ELL students enrolled in Illinois public schools in SY 2012 have disabilities (16.9 percent), and 49 percent of these students were in grade 6 and higher. Within a grade cluster, the highest percentage of ELL students with disabilities is found among grades 6-8 students (26.7 percent); whereas the lowest percentage is found in Kindergarten (10.6 percent). Table 7. Number of ELL Students, by Grade Cluster and Disability Status: SY 2012
No.
Pct. of Grade Cluster Totals
No.
Pct. of Grade Cluster Totals
No.
Pct. of Grade Cluster Totals
PK 15,842 80.3 3,887 19.7 19,729 9.5
K 28,629 89.4 3,393 10.6 32,022 15.4
Gr 1-2 52,993 87.9 7,274 12.1 60,267 29.1
Gr 3-5 40,490 81.4 9,273 18.6 49,763 24.0
Gr 6-8 18,446 73.3 6,730 26.7 25,176 12.1
Gr 9-12 15,888 77.7 4,572 22.3 20,460 9.9 Disability Status
Totals 172,288 83.1 35,129 16.9 207,417 100.0
No Disability With DisabilityGrade Cluster Totals
Grade Cluster
Disability Status

Bilingual Education Programs and English Language Learners in Illinois SY 2012 Statistical Report
10
ENROLLMENT IN ELL LANGUAGE INSTRUCTIONAL PROGRAMS Table 8 shows the number and percentage of ELL students enrolled in various ELL programs. For a definition of each program, see Appendix B. Students are reported in all categories that apply. An ELL student may participate in several programs, thus the numbers shown in Table 8 are duplicated counts. The highest concentration of enrollment among these ELL students in state-funded programs was in transitional bilingual (54.8 percent), followed by Sheltered English Instruction (12.7 percent). Meanwhile, the majority of ELL students in non-state funded districts enrolled in Content Based ESL (20.8 percent) or Pull-Out (18.4 percent) programs. Table 8. Number and Percentage of ELL Students Enrolled in an ELL Program and Type of Program
Funding: SY 2012
*Includes Heritage Language, Content Area Tutoring, Structured English Immersion, and Inclusionary Support
Duplicated Count
Pct of Type of Funding Count
Duplicated Count
Pct of Type of Funding
Count
Duplicated Count
Pct of ELL Program Totals
Content Based ESL 727 20.8 23,096 11.3 23,823 11.5Developmental Bilingual 26 0.7 6,372 3.1 6,398 3.1
Push-In 285 8.2 4,008 2.0 4,293 2.1 Pull-Out 644 18.4 2,982 1.5 3,626 1.7Self-Contained 59 1.7 2,637 1.3 2,696 1.3Sheltered English Instruction 222 6.4 25,838 12.7 26,060 12.6Transitional Bilingual 166 4.7 111,750 54.8 111,916 54.0Two Way Immersion (Dual Language) 17 0.5 3,582 1.8 3,599 1.7Other Programs* 1,349 38.6 23,657 11.6 25,006 12.1
Type of Funding (Unduplicated Count) 3,495 100.0 203,922 100.0 207,417 100.0
Non State-Funded State-Funded
Type of FundingELL Program Totals
Type of ELL Program

Bilingual Education Programs and English Language Learners in Illinois SY 2012 Statistical Report
11
Transitioned Students and Years in an ELL Program Some ELL students stop receiving ELL program services (“exited” ELL program) because they have either been withdrawn by parents from bilingual programs, transferred, graduated from high school or dropped out from school (See Table 9). Sixty-four percent of ELL students of these students attained English Language proficiency*. On the other hand, 36 percent of ELLs stopped receiving ELL program services without obtaining English Language proficiency. The percentage of students attaining English Language proficiency (transition rate) was higher for ELL students who have been in bilingual programs longer than three years (41.2 percent) than those who had been in the program less than one year (31.3 percent) or 1-3 years (27.5 percent).
Table 9. Number and Percentage of ELL Students Who Attained Proficiency* in English Language, by Number of Years in the Program: SY 2012
*Attained a 4.2 proficiency level in literacy composite and 4.8 proficiency level in the overall compostite scores on ACCESS for ELLs. **Students transferred to another district; home schooling or private school. ***Death, expulsion or moved out of the US.
No.Pct. of Total
No.Pct. of Total
No.Pct. of Total
No.Pct. of Total
Exited10,413 31.3 9,149 27.5 13,713 41.2 33,275 64.3 16.0
9,466 51.2 1,991 10.8 7,045 38.1 18,502 35.7 8.9 Withdrawn by Parents 4,487 77.1 841 14.4 494 8.5 5,822 11.2 2.8 Transferred** 4,040 46.7 944 10.9 3,664 42.4 8,648 16.7 4.2 Graduated from High School 48 2.7 12 0.7 1,686 96.6 1,746 3.4 0.8 Dropped Out 575 41.3 78 5.6 738 53.1 1,391 2.7 0.7 Other*** 316 35.3 116 13.0 463 51.7 895 1.7 0.4
19,879 38.4 11,140 21.5 20,758 40.1 51,777 100.0
Exited and attained proficiency* in the English language Exited but have not attained proficiency in the English language
Total Exited
Reason for Exiting ELL Program
Years in an ELL Program Total Pct. of Total ELL
Enrollments (Including
PK)
Less than one One year to three More than three

Bilingual Education Programs and English Language Learners in Illinois SY 2012 Statistical Report
12
Section 6: ENGLISH LANGUAGE PROFICIENCY LEVELS OF ILLINOIS ELL STUDENTS
The Illinois School Code requires districts to annually assess the English language proficiency [including aural comprehension (listening), speaking, reading, and writing skills] of all enrolled ELL students in grades K-12 until they achieve a “proficient” score. In 2006, Illinois adopted the ACCESS for ELLs® as its statewide English proficiency assessment. ACCESS for ELLs®, which stands for “Assessing Comprehension and Communication in English State to State for English Language Learners,” is a large-scale test for K-12 ELL students developed by the World-Class Instructional Design and Assessment (WIDA) Consortium in partnership with the Center for Applied Linguistics (CAL). ACCESS for ELLs® is aligned with the WIDA English language proficiency (ELP) standards. Scale scores on the ACCESS for ELLs® (which range from 100 to 600), are converted to language proficiency levels that span the continuum of the language acquisition process from 1, entering the process, to 6, reaching the end of the continuum. These levels are used to determine expected performance and describe what ELL students can do within each language domain of the ELP standards. The performance definitions of ACCESS for ELLs® language proficiency levels are shown in Appendix C. ACCESS for ELLs® Tiers The ACCESS for ELLs® test items are arranged in three tiers: A (Beginning ELLS), B (Intermediate), and C (Advanced), and students in grades 1-12 are assigned to take one of these tiers based on their English language proficiency. Kindergarten students are assigned non-tiered tests adaptive to their performance levels. The level of difficulty of the test items increases as the tier level increases. With scoring established on a vertical scale, difficult test items are weighted more than less difficult items. Therefore, the same raw score would receive a lower scale score for the Tier A form and a higher scale score for the Tier C form. Finally, scale scores are assigned “interpretive” scores or proficiency levels (PL). To learn more about which tier is appropriate for which student, please go to: http://www.wida.us/assessment/access/tier_criteria.aspx Listening and Reading Caps Of the four language domains (listening, speaking, reading, and writing), only listening and reading are capped with a 4.0 PL for Tier A and 5.0 PL for Tier B. This means that in listening and reading, students who took the Tier A form could not receive a PL above 4.0, and students who took the Tier B form could not receive a PL above 5.0.

Bilingual Education Programs and English Language Learners in Illinois SY 2012 Statistical Report
13
COMPOSITE AND LITERACY PROFICIENCY LEVELS OF LEP STUDENTS ON THE ACCESS for ELLs® BY GRADE CLUSTER (Overall) Composite Proficiency Level (CPL) Twenty percent of K-12 students who took the ACCESS for ELLs in 2012 obtained at least a 4.8 Composite Proficiency Level (CPL). Of these students, close to 53 percent were in grades 3-5. In contrast, only 8.4 percent of ELL students in 6th-8th grade obtained at least a 4.8 CPL. (Table 10). In addition, forty-one percent of K-12 ELL students who took the ACCESS for ELLs in 2012 achieved an overall composite proficiency level of 4.0 (Expanding) or higher (See Appendix B for the definitions of WIDA-ACCESS for ELL proficiency levels). The majority of students at these proficiency levels were grades 3-5 (45.4 percent). Only four percent of Kindergarten students were at these levels. Table 10. Number and Percentage of ELL Students, by Composite Proficiency Level (CPL) on the ACCESS for
ELLs® and Grade Cluster: SY 2012
No.
Pct of Grade Cluster
Total No.
Pct of Grade Cluster
Total No.
Pct of Grade Cluster
Total No.
Pct of Grade Cluster
Total No.
Pct of Grade Cluster
Total No.
Pct of CPL Total
1 - Entering 20,096 66.4 3,094 5.3 866 1.8 915 3.9 1,162 6.8 26,133 14.8
2 - Beginning 3,935 13.0 12,231 21.0 2,607 5.5 3,109 13.2 2,175 12.6 24,057 13.6
3 - Developing 3,178 10.5 25,668 44.1 10,933 23.1 9,892 42.1 4,183 24.3 53,854 30.5
4 - Expanding 1,959 6.5 12,368 21.3 19,244 40.7 7,916 33.7 5,305 30.8 46,792 26.5
5 - Bridging 1,011 3.3 4,032 6.9 11,606 24.5 1,523 6.5 3,464 20.1 21,636 12.3
6 - Reaching 104 0.3 769 1.3 2,046 4.3 125 0.5 909 5.3 3,953 2.2Grade Cluster Totals 30,283 100.0 58,162 100.0 47,302 100.0 23,480 100.0 17,198 100.0 176,425 100.0
> = 4.8 CPL 1,514 4.2 6,445 18.1 18,875 52.9 2,994 8.4 5,836 16.4 35,664 20.2
Composite Proficiency Level (CPL)
Grade ClusterComposite
Proficiency Level (CPL) TotalsKindergarten 1-2 3-5 6-8 9-12

Bilingual Education Programs and English Language Learners in Illinois SY 2012 Statistical Report
14
Literacy Composite (reading and writing) Proficiency Level (LCPL) Twenty-six percent of K-12 students who took the ACCESS for ELLs in 2012 obtained at least a 4.2 Literacy (composite of reading and writing) proficiency level (LCPL). Of these students, 58 percent ELLs were in grades 3-5. In contrast, only 6.5 percent of ELL students in 6-8 grade obtained 4.2 or higher CPL in literacy. (Table 11). Since proficiency levels in reading and listening are capped in Tier A (maximum of 4.0 PL) and Tier B (maximum of 5.0 PL) and Kindergarten students’ tests on the ACCESS for ELLs are non-tiered, no Kindergarten student could attain a 6.0 PL (Reaching) in literacy (See Table 11). Moreover, because of the caps, only 30 percent of ELL students were in 4.0 and higher in literacy composite proficiency level with 56 percent of ELL students in grades 3-5. Table 11. Number and Percentage of ELL Students, by Literacy Proficiency Level (LPL) on the ACCESS for
ELLs® and Grade Cluster: SY 2012
No.
Pct of Grade Cluster
Total No.
Pct of Grade Cluster
Total No.
Pct of Grade Cluster
Total No.
Pct of Grade Cluster
Total No.
Pct of Grade Cluster
Total No.Pct of
LPL Total
1 - Entering 23,129 76.4 4,843 8.3 1,022 2.2 1,053 4.5 1,088 6.3 31,135 17.6
2 - Beginning 2,543 8.4 17,999 30.9 3,397 7.2 4,973 21.2 2,589 14.9 31,501 17.8
3 - Developing 2,576 8.5 27,056 46.5 13,275 28.0 13,276 56.5 4,960 28.6 61,143 34.6
4 - Expanding 1,515 5.0 5,670 9.7 19,804 41.8 3,798 16.2 4,792 27.6 35,579 20.1
5 - Bridging 522 1.7 2,346 4.0 8,437 17.8 365 1.6 3,018 17.4 14,688 8.3
6 - Reaching - 0.0 286 0.5 1,404 3.0 41 0.2 893 5.1 2,624 1.5Grade Cluster Totals 30,285 100.0 58,200 100.0 47,339 100.0 23,506 100.0 17,340 100.0 176,670 100.0
> = 4.2 LPL 1,924 4.2 6,591 14.3 26,744 58.1 2,985 6.5 7,815 17.0 46,059 26.1
Literacy Proficiency Level (LPL)
Grade ClusterLiteracy Proficiency Level (LPL) TotalsKindergarten 1-2 3-5 6-8 9-12
Bilingual Education Programs and English Language Learners in Illinois SY 2012 Statistical Report
15
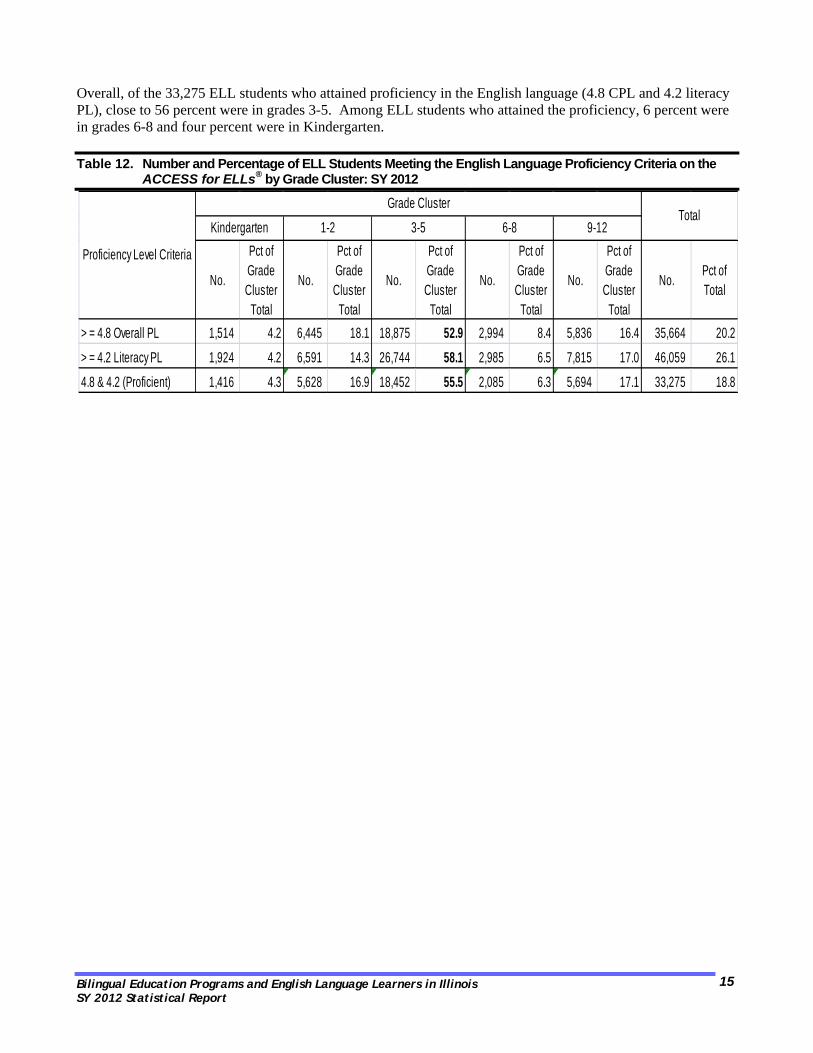
Overall, of the 33,275 ELL students who attained proficiency in the English language (4.8 CPL and 4.2 literacy PL), close to 56 percent were in grades 3-5. Among ELL students who attained the proficiency, 6 percent were in grades 6-8 and four percent were in Kindergarten. Table 12. Number and Percentage of ELL Students Meeting the English Language Proficiency Criteria on the
ACCESS for ELLs® by Grade Cluster: SY 2012
No.
Pct of Grade Cluster
Total
No.
Pct of Grade Cluster
Total
No.
Pct of Grade Cluster
Total
No.
Pct of Grade Cluster
Total
No.
Pct of Grade Cluster
Total
No.Pct of Total
> = 4.8 Overall PL 1,514 4.2 6,445 18.1 18,875 52.9 2,994 8.4 5,836 16.4 35,664 20.2
> = 4.2 Literacy PL 1,924 4.2 6,591 14.3 26,744 58.1 2,985 6.5 7,815 17.0 46,059 26.1
4.8 & 4.2 (Proficient) 1,416 4.3 5,628 16.9 18,452 55.5 2,085 6.3 5,694 17.1 33,275 18.8
Proficiency Level Criteria
Grade ClusterTotal
Kindergarten 1-2 3-5 6-8 9-12

Bilingual Education Programs and English Language Learners in Illinois SY 2012 Statistical Report
16
Section 7: PERFORMANCE LEVELS OF ELL STUDENTS ON THE ILLINOIS STANDARDS ACHIEVEMENT TEST (ISAT) AND THE PRAIRIE STATE ACHIEVEMENT EXAMINATION (PSAE)
The ISAT and PSAE measure individual student achievement relative to the Illinois Learning Standards. In 2011, the ISAT reading and mathematics tests were administered to students in grades 3-8 and science tests were administered at grades 4 and 7. The PSAE, which is the statewide high school achievement test, was administered to grade 11 students in the subject areas of reading, mathematics, and science. Starting in 2008, these regular state assessments were universally administered to ELL students. The ISAT and PSAE scores fall in four performance levels:
Exceeds Standards (E): Student work demonstrates advanced knowledge and skills in the subject. Students creatively apply knowledge and skills to solve problems and evaluate the results. Meets Standards (M): Student work demonstrates proficient knowledge and skills in the subject. Students effectively apply knowledge and skills to solve problems. Below Standards (B): Student work demonstrates basic knowledge and skills in the subject. Because of gaps in learning, students apply knowledge and skills in limited ways. Academic Warning (W): Student work demonstrates limited knowledge and skills in the subject. Because of major gaps in learning, students apply knowledge and skills ineffectively.
PERFORMANCE LEVELS OF ELL STUDENTS ON THE ILLINOIS STANDARDS ACHIEVEMENT TEST (ISAT) COMPARISON OF PERFORMANCE OF ELL STUDENTS WITH THE PERFORMANCE OF NON-ELL STUDENTS ON THE ISAT The ISAT performance of ELL students was compared with that of students who are not English language learners (non-ELL). As shown in Charts 1 through 4, ELL students lagged behind non-ELL students on all ISAT tested grades in both reading and mathematics (See Charts 1-4). The achievement gaps between ELL and non-ELL are particularly pronounced in grades 4 to 7 in reading (See Chart 1), with achievement gaps of at least 41 percentage points (See Chart 2). The achievement gaps in reading are smallest among grade 3 students with 32 percentage points and biggest among grade 5 students with 51 percentage points. ELL students performed better in mathematics than in reading on the 2012 state assessments resulting in smaller achievement gaps between non-ELL and ELL students in this subject (See Chart 3). Specifically, the achievement gaps in mathematics are smallest among grade 3 students, with a gap of 14 percentage points, and the biggest among grade 6 students, with a gap of 35 percentage points (See Chart 4). Overall, the achievement gaps between ELL and non-ELL students in ISAT-reading could be expressed as a 1:2 ratio, i.e., for every one ELL student that met/exceeded the State standards while two non-ELL students met/exceeded the State standards.

Bilingual Education Programs and English Language Learners in Illinois SY 2012 Statistical Report
17
Chart 1. Comparison of Performance of ELL Students with Non-ELL Students on the 2012 ISAT-
Reading, by Grade Level: SY 2012 (Source: 2012 ISAT)
Chart 2. Achievement Gaps Between All ELL Students and Non-ELL Students on the 2012 ISAT-
Reading, by Grade Level: SY 2012
80.7 79.9 81.584.4
80.6
88.0
49.1
38.7
30.3
35.9
29.9
49.0
0.0
10.0
20.0
30.0
40.0
50.0
60.0
70.0
80.0
90.0
100.0
3 4 5 6 7 8
Percent
of
Students
Grade Level
Non-ELL ELL
80.7 79.9 81.5 84.4 80.6 88.0
49.138.7 30.3
35.929.9
49.0
31.641.2 51.2
48.550.7
39.0
0.0
20.0
40.0
60.0
80.0
100.0
120.0
140.0
160.0
180.0
200.0
3 4 5 6 7 8
Perce
nt of
Stud
ents
Grade Level
Non-ELL ELL Gap

Bilingual Education Programs and English Language Learners in Illinois SY 2012 Statistical Report
18
Chart 3. Comparison of Performance of ELL Students with Non-ELL Students on the 2012 ISAT-
Mathematics, by Grade Level: SY 2012 (Source: 2012 ISAT Data)
Chart 4. Achievement Gaps Between All ELL Students and Non-ELL Students on the 2012 ISAT-
Mathematics, by Grade Level: SY 2012
89.8 90.085.9 87.0 86.3 86.5
75.9
69.6
55.551.9
54.4 54.9
0.0
10.0
20.0
30.0
40.0
50.0
60.0
70.0
80.0
90.0
100.0
3 4 5 6 7 8
Percent
of
Students
Grade Level
Non-ELL ELL
89.8 90.0 85.9 87.0 86.3 86.5
75.9 69.6
55.5 51.9 54.4 54.9
13.9 20.4
30.4 35.1 31.9 31.6
0.0
20.0
40.0
60.0
80.0
100.0
120.0
140.0
160.0
180.0
200.0
3 4 5 6 7 8
Perce
nt of
Stud
ents
Grade Level
Non-ELL ELL Gap

Bilingual Education Programs and English Language Learners in Illinois SY 2012 Statistical Report
19
COMPARISON OF PERFORMANCE OF ELL STUDENTS WHO WERE TRANSITIONED (OBTAINED A PROFICIENT SCORE) ON THE ACCESS FOR ELLS® WITH THE PERFORMANCE OF NON-ELL STUDENTS ON THE ISAT When the performance of non-ELL students on the ISAT was compared to ELL students who attained English language proficiency in SY 2012 (transitioned), the achievement gaps were reversed for some grades in reading and most grades in mathematics. (See Charts 5 to 8.) Not only were the achievement gaps reduced, but transitioned ELL students surpassed the achievement levels of non-ELL students. Specifically, higher percentages of transitioned ELL students in grades 6 to 8 met/exceeded standards compared to non-ELL students at the same grade levels in reading (See Charts 5 and 6). Chart 5. Comparison of Performance of Transitioned ELL Students* with Non-ELL Students on the 2012
ISAT- Reading, by Grade Level: SY 2012 (Sources: 2012 ISAT and 2012 ACCESS Data)
80.7 79.9 81.584.4
80.6
88.0
75.9
65.561.0
87.4
81.3
95.6
0.0
20.0
40.0
60.0
80.0
100.0
120.0
3 4 5 6 7 8
Percent
of
Students
Grade Level
Non-ELLTransitioned (Attained Proficiency) ELL

Bilingual Education Programs and English Language Learners in Illinois SY 2012 Statistical Report
20
Chart 6. Achievement Gaps* Between Transitioned ELL Students and Non-ELL Students on the 2012 ISAT- Reading, by Grade Level: SY 2012
Gaps in negative numbers indicate ELL students performing at higher levels than non-ELL students. In mathematics, except in grade 5, transitioned ELL students surpassed the achievement levels of non-ELL students. The achievement gap is highest among grade 8 students where 92.3 percent of transitioned ELL students met/exceeded standards compared to 86.5 percent of non-ELL students (See Charts 7 and 8). Overall, transitioned ELL students performed at 8 percentage points higher than non-ELL students in mathematics
80.7 79.9 81.5 84.4 80.6 88.0
75.965.5 61.0
87.481.3
95.6
4.814.4 20.5
-3.0 -0.7 -7.6
-50.0
0.0
50.0
100.0
150.0
200.0
3 4 5 6 7 8
Perce
nt of
Stud
ents
Grade Level
Non-ELL Transitioned (Attained Proficiency) ELL Gap

Bilingual Education Programs and English Language Learners in Illinois SY 2012 Statistical Report
21
Chart 7. Comparison of Performance of Transitioned ELL Students* with Non-ELL Students on the 2012 ISAT- Mathematics, by Grade Level: SY 2012 (Sources: 2012 ISAT and 2012 ACCESS Data)
*Transitioned ELL students obtained at least (overall) composite proficiency level of 4.8 and literacy composite proficiency level of 4.2 on the 2012 ACCESS for ELLs®. Chart 8. Achievement Gaps* Between Transitioned ELL Students and Non-ELL Students on the 2012
ISAT- Mathematics, by Grade Level: SY 2012
*Gaps in negative numbers indicate ELL students performing at higher levels than non-ELL students
89.8 90.0
85.9
87.086.3 86.5
92.6
90.2
82.0
90.090.6
92.3
76.0
78.0
80.0
82.0
84.0
86.0
88.0
90.0
92.0
94.0
3 4 5 6 7 8
Percent
of
Students
Grade Level
Non-ELLTransitioned (Attained Proficiency) ELL
89.8 90.0 85.9 87.0 86.3 86.5
92.6 90.282.0
90.0 90.6 92.3
-2.8 -0.2
3.9
-3.0 -4.3 -5.8
-50.0
0.0
50.0
100.0
150.0
200.0
3 4 5 6 7 8
Perce
nt of
Stude
nts
Grade Level
Non-ELL Transitioned (Attained Proficiency) ELL Gap

Part C: Annual Measurable Achievement Objectives
Bilingual Education Programs and English Language Learners in Illinois SY 2012 Statistical Report
22
PART C ANNUAL MEASURABLE ACHIEVEMENT OBJECTIVES (AMAOs) Section 8: ANNUAL MEASURABLE ACHIEVEMENT OBJECTIVES (AMAOS)—
ACCOUNTABILITY MODEL OF NCLB, TITLE III Illinois AMAO Criteria and Targets for SY 2012 As required under Title III, Annual Measurable Achievement Objectives (AMAOs) are calculated for each Title III subgrantee to measure district performance in educating ELL students. Districts lacking the minimum number of ELL students required to receive Title III funds partner with other districts to qualify for these funds. These district partnerships are called “consortia.” In SY 2012, 202 Illinois school districts received Title III funds, including some 22 district that formed consortia. Each multi-district consortium is considered a single subgrantee. AMAOs for consortia are calculated by compiling or combining ELP assessment and other applicable data for consortium members and determining whether the consortium has met the State’s AMAOs. Subgrantees that receive Title III funds are held accountable for attaining the State’s AMAOs. AMAOs have three criteria: 1) AMAO 1 – ELL students making progress in the English language, 2) AMAO 2 – ELL students attaining proficiency in the English language, and 3) AMAO 3 – Making Adequate Yearly Progress (AYP) for ELL subgroups. The Illinois State Board of Education (ISBE) has set the following targets and performance criteria for each AMAO for SY 2012:
1. Making Progress in the English Language (AMAO 1) — To meet AMAO 1, 57.4 percent of ELL students in the district/consortium must make progress on the ACCESS for ELLS®. This objective shall apply provided that the number of students in the cohort is no fewer than 45. ELL students make progress if they make a 6.0 proficiency level in the second of the two years compared, or make at least a 0.50 increase in their proficiency levels in two years in their overall (composite) proficiency levels. A 95 percent “confidence interval” is applied to the calculation.
2. Attaining English Language Proficiency (AMAO 2) — To meet AMAO 2, 9 percent of ELL
students in the district/consortium must attain proficiency in the English language. Students who attained proficiency in the English language achieved a level of 4.2 or higher in literacy and a level of 4.8 or higher on their overall scores in the ACCESS for ELLS®. This objective shall apply provided that the number of students tested is no fewer than 45.
3. Making Adequate Yearly Progress (AYP) for the ELL Subgroup (AMAO 3) — A school
district/consortium must make AYP for ELL students served by programs funded under Title III. Calculations are based on similar academic achievement formulas used for Title I AYP using any or all of the State tests: Illinois Standards Achievement Test, Prairie State Achievement Examination, and Illinois Alternate Assessment. AYP is calculated only if the school district has the minimum number (45) of ELL students in tested grades (grades 3 through 8 and/or grade 11).
Title III school districts/consortia must meet all three criteria to attain AMAOs.

Part C: Annual Measurable Achievement Objectives
Bilingual Education Programs and English Language Learners in Illinois SY 2012 Statistical Report
23
Illinois AMAO Results for SY 2011 Two hundred-two districts received Title III funds in FY 2012 with 22 districts in consortia. Of the 202 districts, 43 percent met all three AMAO criteria (See Table 13).
Table 13. Number and Percentage of Title III Districts Meeting/Not Meeting AMAOs: F12
*Districts indicated as No Status are the districts that did not have the number of ELL students required for AMAO calculations. For all three AMAOs, the minimum number ELLs required for AMAO calculations is 45. The Consequences for Not Attaining AMAOs School districts that do not meet AMAOs must inform all parents of children identified for participation in Title III-funded programs of the failure to meet AMAOs within 30 days of receipt of notification from the Illinois State Board of Education. School districts that do not meet AMAOs for two consecutive years are required to develop a District Improvement Plan (DIP) to ensure that the district meets these objectives in future years. The Illinois State Board of Education provides technical assistance in developing DIPs. After four consecutive years of not meeting AMAOs: 1. A school district is required to modify its curriculum, program, or method(s) of instruction; OR 2a. The Illinois State Board of Education can make a determination, in relation to the school district’s failure
to meet the objectives, as to whether the school district shall continue to receive funds; AND 2b. The Illinois State Board of Education can require the school district to replace educational personnel
relevant to the school district’s failure to meet the objectives.
NumberPct of Total Number
Pct of Total Number
Pct of Total
AMAO 1 - Making Progress in the English Language 3 1.5 0 0.0 199 98.5 202AMAO 2 - Attaining English Language Proficiency 3 1.5 1 0.5 198 98.0 202AMAO 3 - Making AYP for LEP Subgroup 35 17.3 112 55.4 55 27.2 202All Three AMAOs 3 1.5 112 55.4 87 43.1 202
Total - Title III
DistrictsAMAO Criteria
No Status* Did Not Meet Met

Part C: Annual Measurable Achievement Objectives
Bilingual Education Programs and English Language Learners in Illinois SY 2012 Statistical Report
24
Given their four-year AMAO performance, 76 of the 202 districts that received Title III funds in FY12 are required to write District Improvement Plans (DIP) (See Table 14). Title III districts that did not meet AMAO for two or more consecutive years are required to submit the DIP. Table 14. Historical Summary of AMAO Status of Districts That Received Title III Funds in FY12
AMAO Status No. of Districts
Not meet AMAO - one year only 37 Not meet AMAO - two years only 48 Not meet AMAO - four years and over 28
Required to write District Improvement Plan(DIP) for SY 2013 76

Appendix A
Bilingual Education Programs and English Language Learners in Illinois SY 2012 Statistical Report
25
Appendix A Number and Percentage of ELL Students, by Language and District: SY 2012
No. Col Pct No. Col Pct No. Row Pct
Addison SD 4 1,293 92.4 106 7.6 1,399 0.67
Adlai E Stevenson HSD 125 13 16.7 65 83.3 78 0.04
Alden Hebron SD 19 41 89.1 5 10.9 46 0.02
Alsip-Hazlgrn-Oaklwn SD 126 138 52.9 123 47.1 261 0.13
Altamont CUSD 10 2 100.0 0 0.0 2 0.00
Alton CUSD 11 19 63.3 11 36.7 30 0.01
AlWood CUSD 225 2 100.0 0 0.0 2 0.00
American Assocation of Univ 1 100.0 0 0.0 1 0.00
Anna CCSD 37 14 100.0 0 0.0 14 0.01
Annawan CUSD 226 - 0.0 6 100.0 6 0.00
Antioch CCSD 34 51 52.0 47 48.0 98 0.05
Aptakisic-Tripp CCSD 102 33 8.5 357 91.5 390 0.19
Arbor Park SD 145 131 66.2 67 33.8 198 0.10
Archdiocese of Chicago-Superior 1 100.0 0 0.0 1 0.00
Arcola CUSD 306 88 97.8 2 2.2 90 0.04
Argenta-Oreana CUSD 1 - 0.0 3 100.0 3 0.00
Argo CHSD 217 42 46.2 49 53.8 91 0.04
Arlington Heights SD 25 116 31.0 258 69.0 374 0.18
Arthur CUSD 305 6 100.0 0 0.0 6 0.00
Astoria CUSD 1 - 0.0 1 100.0 1 0.00
Athens CUSD 213 1 33.3 2 66.7 3 0.00
Atwood Hammond CUSD 39 1 100.0 0 0.0 1 0.00
Atwood Heights SD 125 45 91.8 4 8.2 49 0.02
Auburn CUSD 10 - 0.0 1 100.0 1 0.00
Aurora East USD 131 5,722 99.4 37 0.6 5,759 2.78
Aurora West USD 129 1,862 89.8 211 10.2 2,073 1.00
Aviston SD 21 - 0.0 2 100.0 2 0.00
Avoca SD 37 5 21.7 18 78.3 23 0.01
Ball Chatham CUSD 5 7 20.6 27 79.4 34 0.02
Bannockburn SD 106 1 9.1 10 90.9 11 0.01
Barrington CUSD 220 601 84.2 113 15.8 714 0.34
Bartonville SD 66 - 0.0 1 100.0 1 0.00
Batavia USD 101 184 78.6 50 21.4 234 0.11
Beach Park CCSD 3 302 92.6 24 7.4 326 0.16
Beardstown CUSD 15 472 86.3 75 13.7 547 0.26
Beecher CUSD 200U 26 96.3 1 3.7 27 0.01
Belle Valley SD 119 1 100.0 0 0.0 1 0.00
Belleville SD 118 6 66.7 3 33.3 9 0.00
Belleville Twp HSD 201 4 25.0 12 75.0 16 0.01
Bellwood SD 88 718 98.6 10 1.4 728 0.35
Belvidere CUSD 100 911 97.2 26 2.8 937 0.45
Bement CUSD 5 - 0.0 2 100.0 2 0.00
Benjamin SD 25 13 31.7 28 68.3 41 0.02
Bensenville SD 2 634 86.8 96 13.2 730 0.35
Benton CCSD 47 3 60.0 2 40.0 5 0.00
Benton Cons HSD 103 1 100.0 0 0.0 1 0.00
Berkeley SD 87 868 97.7 20 2.3 888 0.43
Berwyn North SD 98 836 95.8 37 4.2 873 0.42
SpanishNon-English Other Than
SpanishDISTRICT/ENTITY NAME
LANGUAGETotal

Appendix A
Bilingual Education Programs and English Language Learners in Illinois SY 2012 Statistical Report
26
Appendix A Number and Percentage of ELL Students, by Language and District: SY 2012 (Continued)
No. Col Pct No. Col Pct No. Row Pct
Berwyn South SD 100 982 96.8 32 3.2 1,014 0.49
Bethalto CUSD 8 1 6.7 14 93.3 15 0.01
Big Hollow SD 38 85 69.1 38 30.9 123 0.06
Bismarck Henning CUSD 2 100.0 0 0.0 2 0.00
Bloom Twp HSD 206 101 97.1 3 2.9 104 0.05
Bloomingdale SD 13 12 25.5 35 74.5 47 0.02
Bloomington SD 87 249 78.8 67 21.2 316 0.15
Blue Ridge CUSD 18 - 0.0 2 100.0 2 0.00
Bond County CUSD 2 2 66.7 1 33.3 3 0.00
Bourbonnais SD 53 28 82.4 6 17.6 34 0.02
Braceville SD 75 2 100.0 0 0.0 2 0.00
Bradford CUSD 1 1 100.0 0 0.0 1 0.00
Bradley Bourbonnais CHSD 307 12 85.7 2 14.3 14 0.01
Bradley SD 61 116 92.8 9 7.2 125 0.06
Breese SD 12 30 96.8 1 3.2 31 0.01
Bremen CHSD 228 65 62.5 39 37.5 104 0.05
Brookfield Lagrange Park SD 95 32 68.1 15 31.9 47 0.02
Brookwood SD 167 124 96.1 5 3.9 129 0.06
Brown County CUSD 1 2 100.0 0 0.0 2 0.00
Burbank SD 111 423 46.7 483 53.3 906 0.44
Bureau Valley CUSD 340 - 0.0 1 100.0 1 0.00
Bureau/Henry/Stark ROE 9 90.0 1 10.0 10 0.00
Burnham SD 154-5 25 96.2 1 3.8 26 0.01
Butler SD 53 1 14.3 6 85.7 7 0.00
Byron CUSD 226 4 57.1 3 42.9 7 0.00
Cahokia CUSD 187 2 40.0 3 60.0 5 0.00
Calumet City SD 155 189 94.0 12 6.0 201 0.10
Calumet Public SD 132 124 97.6 3 2.4 127 0.06
Cambridge Lakes Preschool 8 42.1 11 57.9 19 0.01
Canton Union SD 66 2 20.0 8 80.0 10 0.00
Carbon Cliff-Barstow SD 36 1 20.0 4 80.0 5 0.00
Carbondale CHSD 165 17 48.6 18 51.4 35 0.02
Carbondale ESD 95 101 63.5 58 36.5 159 0.08
Carmi-White County CUSD 5 3 30.0 7 70.0 10 0.00
Carroll/Jo Daviess/Stephenson ROE 3 100.0 0 0.0 3 0.00
Carterville CUSD 5 8 66.7 4 33.3 12 0.01
Carthage ESD 317 9 90.0 1 10.0 10 0.00
Cary CCSD 26 224 91.8 20 8.2 244 0.12
Casey-Westfield CUSD 4C 1 100.0 0 0.0 1 0.00
Cass SD 63 24 30.0 56 70.0 80 0.04
Catlin CUSD 5 - 0.0 1 100.0 1 0.00
CCSD 146 101 36.2 178 63.8 279 0.13
CCSD 168 62 98.4 1 1.6 63 0.03
CCSD 180 14 58.3 10 41.7 24 0.01
CCSD 62 1,043 65.2 556 34.8 1,599 0.77
CCSD 89 69 39.7 105 60.3 174 0.08
CCSD 93 341 51.5 321 48.5 662 0.32
DISTRICT/ENTITY NAME
LANGUAGETotal
SpanishNon-English Other Than
Spanish

Appendix A
Bilingual Education Programs and English Language Learners in Illinois SY 2012 Statistical Report
27
Appendix A Number and Percentage of ELL Students, by Language and District: SY 2012 (Continued)
No. Col Pct No. Col Pct No. Row Pct
Center Cass SD 66 11 34.4 21 65.6 32 0.02
Central A & M CUD 21 - 0.0 1 100.0 1 0.00
Central CHSD 71 19 100.0 0 0.0 19 0.01
Central CUSD 301 111 58.1 80 41.9 191 0.09
Central SD 104 7 77.8 2 22.2 9 0.00
Central SD 51 9 39.1 14 60.9 23 0.01
Central Stickney SD 110 94 77.7 27 22.3 121 0.06
Centralia HSD 200 2 100.0 0 0.0 2 0.00
Centralia SD 135 - 0.0 2 100.0 2 0.00
Champaign CUSD 4 328 46.7 374 53.3 702 0.34
Chaney-Monge SD 88 58 92.1 5 7.9 63 0.03
Channahon SD 17 10 83.3 2 16.7 12 0.01
Charleston CUSD 1 3 18.8 13 81.3 16 0.01
Cherished Children Early Lrng 6 100.0 0 0.0 6 0.00
Chester CUSD 139 5 71.4 2 28.6 7 0.00
Chicago Heights SD 170 640 99.5 3 0.5 643 0.31
Chicago Ridge SD 127-5 51 12.0 375 88.0 426 0.21
Childrens Ctr Cicero-Ber 57 100.0 0 0.0 57 0.03
Childrens Home and Aid Society 1 100.0 0 0.0 1 0.00
CHSD 117 3 100.0 0 0.0 3 0.00
CHSD 128 8 50.0 8 50.0 16 0.01
CHSD 155 57 90.5 6 9.5 63 0.03
CHSD 218 171 66.8 85 33.2 256 0.12
CHSD 94 151 92.6 12 7.4 163 0.08
CHSD 99 30 40.5 44 59.5 74 0.04
Cicero SD 99 7,667 99.5 38 0.5 7,705 3.71
City of Chicago SD 299 60,310 86.5 9,379 13.5 69,689 33.60
Clay City CUSD 10 - 0.0 1 100.0 1 0.00
Clinton CUSD 15 9 90.0 1 10.0 10 0.00
Coal City CUSD 1 3 100.0 0 0.0 3 0.00
Cobden SUD 17 81 100.0 0 0.0 81 0.04
Collinsville CUSD 10 441 95.9 19 4.1 460 0.22
Colona SD 190 1 100.0 0 0.0 1 0.00
Columbia CUSD 4 - 0.0 4 100.0 4 0.00
Comm Cons SD 59 1,641 73.6 588 26.4 2,229 1.07
Cons HSD 230 17 9.1 170 90.9 187 0.09
Cons SD 158 125 52.5 113 47.5 238 0.11
Cook County SD 130 1,001 97.5 26 2.5 1,027 0.50
Country Club Hills SD 160 14 48.3 15 51.7 29 0.01
County of Winnebago SD 320 55 96.5 2 3.5 57 0.03
Creston CCSD 161 2 100.0 0 0.0 2 0.00
Crete Monee CUSD 201U 71 76.3 22 23.7 93 0.04
Crystal Lake CCSD 47 495 87.0 74 13.0 569 0.27
CUSD 200 692 55.9 547 44.1 1,239 0.60
CUSD 201 54 65.9 28 34.1 82 0.04
CUSD 3 Fulton County 2 100.0 0 0.0 2 0.00
CUSD 300 2,333 88.6 301 11.4 2,634 1.27
Dakota CUSD 201 3 42.9 4 57.1 7 0.00
DISTRICT/ENTITY NAME
LANGUAGETotal
Spanish Non-English Other Than Spanish

Appendix A
Bilingual Education Programs and English Language Learners in Illinois SY 2012 Statistical Report
28
Appendix A Number and Percentage of ELL Students, by Language and District: SY 2012 (Continued)
No. Col Pct No. Col Pct No. Row Pct
Dalzell SD 98 1 100.0 0 0.0 1 0.00
Damiansville SD 62 3 100.0 0 0.0 3 0.00
Danville CCSD 118 174 86.6 27 13.4 201 0.10
Darien SD 61 122 54.5 102 45.5 224 0.11
Decatur SD 61 54 72.0 21 28.0 75 0.04
Deerfield SD 109 12 36.4 21 63.6 33 0.02
DeKalb CUSD 428 470 85.0 83 15.0 553 0.27
Delavan CUSD 703 2 100.0 0 0.0 2 0.00
DePue USD 103 195 98.0 4 2.0 199 0.10
Diamond Lake SD 76 337 95.2 17 4.8 354 0.17
Dimmick CCSD 175 4 100.0 0 0.0 4 0.00
District 50 Schools - 0.0 4 100.0 4 0.00
Dixon USD 170 22 61.1 14 38.9 36 0.02
Dolton SD 148 22 62.9 13 37.1 35 0.02
Dolton SD 149 15 78.9 4 21.1 19 0.01
Downers Grove GSD 58 142 59.9 95 40.1 237 0.11
Dunlap CUSD 323 17 8.9 175 91.1 192 0.09
DuPage HSD 88 142 82.6 30 17.4 172 0.08
Durand CUSD 322 1 100.0 0 0.0 1 0.00
Dwight Common SD 232 - 0.0 1 100.0 1 0.00
Early Explorations Inc 1 50.0 1 50.0 2 0.00
East Alton SD 13 1 100.0 0 0.0 1 0.00
East Dubuque USD 119 - 0.0 5 100.0 5 0.00
East Maine SD 63 450 34.2 867 65.8 1,317 0.63
East Moline SD 37 259 59.8 174 40.2 433 0.21
East Peoria SD 86 7 31.8 15 68.2 22 0.01
East Prairie SD 73 19 14.4 113 85.6 132 0.06
East St Louis SD 189 38 100.0 0 0.0 38 0.02
Eastland CUSD 308 1 50.0 1 50.0 2 0.00
Edwards County CUSD 1 1 20.0 4 80.0 5 0.00
Edwardsville CUSD 7 22 31.4 48 68.6 70 0.03
Effingham CUSD 40 27 87.1 4 12.9 31 0.01
Egyptian CUSD 5 3 100.0 0 0.0 3 0.00
El Paso-Gridley CUSD 11 - 0.0 2 100.0 2 0.00
Elmhurst SD 205 350 68.1 164 31.9 514 0.25
Elmwood CUSD 322 - 0.0 1 100.0 1 0.00
Elmwood Park CUSD 401 184 48.8 193 51.2 377 0.18
Elwood CCSD 203 2 100.0 0 0.0 2 0.00
ESD 159 27 77.1 8 22.9 35 0.02
Eswood CCSD 269 5 83.3 1 16.7 6 0.00
Evanston CCSD 65 651 69.1 291 30.9 942 0.45
Evanston Twp HSD 202 52 65.8 27 34.2 79 0.04
Evergreen Park CHSD 231 4 80.0 1 20.0 5 0.00
Evergreen Park ESD 124 121 90.3 13 9.7 134 0.06
Fairmont SD 89 36 100.0 0 0.0 36 0.02
Fairview SD 72 19 22.1 67 77.9 86 0.04
Farmington Central CUSD 265 - 0.0 1 100.0 1 0.00
Fenton CHSD 100 93 92.1 8 7.9 101 0.05
DISTRICT/ENTITY NAME
LANGUAGETotal
Spanish Non-English Other Than Spanish

Appendix A
Bilingual Education Programs and English Language Learners in Illinois SY 2012 Statistical Report
29
Appendix A Number and Percentage of ELL Students, by Language and District: SY 2012 (Continued)
No. Col Pct No. Col Pct No. Row Pct
Fieldcrest CUSD 6 12 92.3 1 7.7 13 0.01
Flora CUSD 35 2 66.7 1 33.3 3 0.00
Flossmoor SD 161 56 78.9 15 21.1 71 0.03
Ford Heights SD 169 1 100.0 - 0.0 1 0.00
Forest Park SD 91 60 74.1 21 25.9 81 0.04
Forest Ridge SD 142 76 52.8 68 47.2 144 0.07
Fox Lake GSD 114 56 93.3 4 6.7 60 0.03
Fox River Grove Cons SD 3 21 72.4 8 27.6 29 0.01
Frankfort CCSD 157C 9 27.3 24 72.7 33 0.02
Franklin Park SD 84 250 78.9 67 21.1 317 0.15
Freeburg CCSD 70 1 100.0 - 0.0 1 0.00
Freeport SD 145 103 92.8 8 7.2 111 0.05
Fremont SD 79 101 43.0 134 57.0 235 0.11
Galena USD 120 41 93.2 3 6.8 44 0.02
Galesburg CUSD 205 101 69.7 44 30.3 145 0.07
Gallatin CUSD 7 6 100.0 - 0.0 6 0.00
Gardner CCSD 72C 1 100.0 - 0.0 1 0.00
Gavin SD 37 71 91.0 7 9.0 78 0.04
Geneva CUSD 304 55 71.4 22 28.6 77 0.04
Genoa Kingston CUSD 424 93 93.0 7 7.0 100 0.05
Georgetown-Ridge Farm CUD 4 1 100.0 - 0.0 1 0.00
Germantown Hills SD 69 - 0.0 2 100.0 2 0.00
Germantown SD 60 5 100.0 - 0.0 5 0.00
Gibson City-Melvin-Sibley CUSD 5 - 0.0 5 100.0 5 0.00
Gillespie CUSD 7 - 0.0 2 100.0 2 0.00
Glen Ellyn SD 41 237 48.5 252 51.5 489 0.24
Glenbard Twp HSD 87 161 47.9 175 52.1 336 0.16
Glencoe SD 35 - 0.0 7 100.0 7 0.00
Glenview CCSD 34 315 47.4 350 52.6 665 0.32
Golf ESD 67 3 6.0 47 94.0 50 0.02
Got Kidz Inc 2 100.0 - 0.0 2 0.00
Gower SD 62 4 23.5 13 76.5 17 0.01
Grand Ridge CCSD 95 2 66.7 1 33.3 3 0.00
Granite City CUSD 9 141 91.0 14 9.0 155 0.07
Grant CCSD 110 3 75.0 1 25.0 4 0.00
Grant CHSD 124 20 76.9 6 23.1 26 0.01
Grant Park CUSD 6 3 75.0 1 25.0 4 0.00
Grayslake CCSD 46 394 72.3 151 27.7 545 0.26
Grayslake CHSD 127 64 79.0 17 21.0 81 0.04
Gurnee SD 56 227 84.1 43 15.9 270 0.13
Hall HSD 502 24 96.0 1 4.0 25 0.01
Hamilton CCSD 328 - 0.0 2 100.0 2 0.00
Hamilton Co CUSD 10 5 83.3 1 16.7 6 0.00
Hancock/McDonough ROE - 0.0 1 100.0 1 0.00
Harlem UD 122 162 64.5 89 35.5 251 0.12
Harmony Emge SD 175 - 0.0 4 100.0 4 0.00
Harrisburg CUSD 3 1 50.0 1 50.0 2 0.00
Harrison SD 36 19 82.6 4 17.4 23 0.01
DISTRICT/ENTITY NAME
LANGUAGETotal
SpanishNon-English Other Than
Spanish

Appendix A
Bilingual Education Programs and English Language Learners in Illinois SY 2012 Statistical Report
30
Appendix A
Number and Percentage of ELL Students, by Language and District: SY 2012 (Continued)
No. Col Pct No. Col Pct No. Row Pct
Harvard CUSD 50 705 98.7 9 1.3 714 0.34
Harvey SD 152 71 97.3 2 2.7 73 0.04
Hawthorn CCSD 73 539 72.0 210 28.0 749 0.36
Hazel Crest SD 152-5 2 100.0 - 0.0 2 0.00
Henderson/Mercer/Warren ROE - 0.0 1 100.0 1 0.00
Herrin CUSD 4 1 20.0 4 80.0 5 0.00
Herscher CUSD 2 1 100.0 - 0.0 1 0.00
Hiawatha CUSD 426 6 100.0 - 0.0 6 0.00
Highland CUSD 5 8 42.1 11 57.9 19 0.01
Highland Pk Com Nur Sch and DC 13 100.0 - 0.0 13 0.01
Hillsboro CUSD 3 1 50.0 1 50.0 2 0.00
Hillside SD 93 74 91.4 7 8.6 81 0.04
Hinsdale CCSD 181 27 36.0 48 64.0 75 0.04
Hinsdale Twp HSD 86 19 27.1 51 72.9 70 0.03
Homer CCSD 33C 17 23.9 54 76.1 71 0.03
Homewood Flossmoor CHSD 233 2 28.6 5 71.4 7 0.00
Homewood SD 153 20 71.4 8 28.6 28 0.01
Hononegah CHD 207 3 25.0 9 75.0 12 0.01
Hoopeston Area CUSD 11 18 85.7 3 14.3 21 0.01
Hoover-Schrum Memorial SD 157 91 92.9 7 7.1 98 0.05
IDJJ Sch Dist 428 8 88.9 1 11.1 9 0.00
Il Valley Central USD 321 12 57.1 9 42.9 21 0.01
Illini West H S Dist 307 1 100.0 - 0.0 1 0.00
Indian Creek CUSD 425 14 100.0 - 0.0 14 0.01
Indian Prairie CUSD 204 705 40.0 1,056 60.0 1,761 0.85
Indian Springs SD 109 238 27.8 617 72.2 855 0.41
Iroquois County CUSD 9 19 76.0 6 24.0 25 0.01
Iroquois West CUSD 10 47 100.0 - 0.0 47 0.02
Itasca SD 10 27 41.5 38 58.5 65 0.03
J S Morton HSD 201 861 98.7 11 1.3 872 0.42
Jacksonville SD 117 30 73.2 11 26.8 41 0.02
Jasper County CUD 1 1 100.0 - 0.0 1 0.00
Jewish Community Centers of - 0.0 1 100.0 1 0.00
John A Logan College Dist 530 - 0.0 1 100.0 1 0.00
Johnsburg CUSD 12 2 100.0 - 0.0 2 0.00
Joliet PSD 86 2,171 98.6 31 1.4 2,202 1.06
Joliet Twp HSD 204 219 98.2 4 1.8 223 0.11
Jonesboro CCSD 43 4 80.0 1 20.0 5 0.00
Kaneland CUSD 302 102 86.4 16 13.6 118 0.06
Kankakee SD 111 681 98.1 13 1.9 694 0.33
Keeneyville SD 20 209 65.5 110 34.5 319 0.15
Kenilworth SD 38 1 14.3 6 85.7 7 0.00
Kewanee CUSD 229 121 98.4 2 1.6 123 0.06
Kids Kingdom Preschool Inc - 0.0 1 100.0 1 0.00
Kildeer Countryside CCSD 96 102 31.6 221 68.4 323 0.16
Kinnikinnick CCSD 131 4 21.1 15 78.9 19 0.01
Kirby SD 140 27 19.4 112 80.6 139 0.07
Komarek SD 94 56 93.3 4 6.7 60 0.03
DISTRICT/ENTITY NAME
LANGUAGETotal
Spanish Non-English Other Than Spanish

Appendix A
Bilingual Education Programs and English Language Learners in Illinois SY 2012 Statistical Report
31
Appendix A Number and Percentage of ELL Students, by Language and District: SY 2012 (Continued)
No. Col Pct No. Col Pct No. Row Pct
La Grange SD 102 95 70.9 39 29.1 134 0.06
La Grange SD 105 South 192 84.2 36 15.8 228 0.11
La Salle ESD 122 95 96.9 3 3.1 98 0.05
La Salle-Peru Twp HSD 120 10 62.5 6 37.5 16 0.01
LaGrange Highlands SD 106 7 36.8 12 63.2 19 0.01
Lake Bluff ESD 65 21 67.7 10 32.3 31 0.01
Lake Forest CHSD 115 1 100.0 - 0.0 1 0.00
Lake Forest SD 67 3 30.0 7 70.0 10 0.00
Lake Park CHSD 108 13 40.6 19 59.4 32 0.02
Lake Villa CCSD 41 164 80.0 41 20.0 205 0.10
Lake Zurich CUSD 95 120 48.4 128 51.6 248 0.12
Lansing SD 158 111 87.4 16 12.6 127 0.06
Laraway CCSD 70C 85 97.7 2 2.3 87 0.04
Lasting Impressions Visions Inc 1 100.0 - 0.0 1 0.00
Lawrence County CUD 20 5 71.4 2 28.6 7 0.00
Leepertown CCSD 175 1 100.0 - 0.0 1 0.00
Lemont Twp HSD 210 6 42.9 8 57.1 14 0.01
Lemont-Bromberek CSD 113A 31 17.7 144 82.3 175 0.08
Lena Winslow CUSD 202 7 100.0 - 0.0 7 0.00
Lewistown CUSD 97 - 0.0 3 100.0 3 0.00
Lexington CUSD 7 - 0.0 1 100.0 1 0.00
Leyden CHSD 212 120 72.7 45 27.3 165 0.08
Libertyville SD 70 22 66.7 11 33.3 33 0.02
Lincoln CHSD 404 - 0.0 2 100.0 2 0.00
Lincoln ESD 156 263 98.1 5 1.9 268 0.13
Lincoln ESD 27 2 33.3 4 66.7 6 0.00
Lincoln Way CHSD 210 18 40.9 26 59.1 44 0.02
Lincolnshire-Prairieview SD 103 3 2.6 111 97.4 114 0.05
Lincolnwood SD 74 22 8.9 226 91.1 248 0.12
Lindop SD 92 38 92.7 3 7.3 41 0.02
Lisle CUSD 202 39 55.7 31 44.3 70 0.03
Litchfield CUSD 12 2 40.0 3 60.0 5 0.00
Lockport SD 91 16 84.2 3 15.8 19 0.01
Lockport Twp HSD 205 39 78.0 11 22.0 50 0.02
Lombard SD 44 180 50.4 177 49.6 357 0.17
Ludlow CCSD 142 16 100.0 - 0.0 16 0.01
Lyons SD 103 426 90.6 44 9.4 470 0.23
Lyons Twp HSD 204 43 81.1 10 18.9 53 0.03
Macomb CUSD 185 3 6.7 42 93.3 45 0.02
Madison CUSD 12 18 100.0 - 0.0 18 0.01
Maercker SD 60 52 34.9 97 65.1 149 0.07
Mahomet-Seymour CUSD 3 12 63.2 7 36.8 19 0.01
Maine Township HSD 207 146 48.2 157 51.8 303 0.15
Manhattan SD 114 19 90.5 2 9.5 21 0.01
Mannheim SD 83 944 93.5 66 6.5 1,010 0.49
Manteno CUSD 5 15 71.4 6 28.6 21 0.01
Marengo CHSD 154 7 87.5 1 12.5 8 0.00
Marengo-Union E Cons D 165 115 94.3 7 5.7 122 0.06
DISTRICT/ENTITY NAME
LANGUAGETotal
Spanish Non-English Other Than Spanish

Appendix A
Bilingual Education Programs and English Language Learners in Illinois SY 2012 Statistical Report
32
Appendix A Number and Percentage of ELL Students, by Language and District: SY 2012 (Continued)
No. Col Pct No. Col Pct No. Row Pct
Marion CUSD 2 13 54.2 11 45.8 24 0.01
Marissa CUSD 40 1 100.0 - 0.0 1 0.00
Maroa Forsyth CUSD 2 2 16.7 10 83.3 12 0.01
Marquardt SD 15 542 77.0 162 23.0 704 0.34
Marseilles ESD 150 4 100.0 - 0.0 4 0.00
Marshall CUSD 2C 6 66.7 3 33.3 9 0.00
Mascoutah CUD 19 6 35.3 11 64.7 17 0.01
Matteson ESD 162 40 88.9 5 11.1 45 0.02
Mattoon CUSD 2 10 90.9 1 9.1 11 0.01
Maywood-Melrose Park-Broadview 8 1,554 99.4 10 0.6 1,564 0.75
Mazon-Verona-Kinsman ESD 2C 2 100.0 - 0.0 2 0.00
McHenry CCSD 15 521 91.7 47 8.3 568 0.27
McHenry CHSD 156 37 92.5 3 7.5 40 0.02
McLean County USD 5 219 57.6 161 42.4 380 0.18
Medinah SD 11 52 42.3 71 57.7 123 0.06
Mendota CCSD 289 181 98.9 2 1.1 183 0.09
Mendota Twp HSD 280 62 100.0 - 0.0 62 0.03
Meridian CUSD 223 90 91.8 8 8.2 98 0.05
Michelles Place Child Care Ctr - 0.0 1 100.0 1 0.00
Midlothian SD 143 13 76.5 4 23.5 17 0.01
Midwest Central CUSD 191 1 100.0 - 0.0 1 0.00
Millburn CCSD 24 11 31.4 24 68.6 35 0.02
Minooka CCSD 201 116 85.3 20 14.7 136 0.07
Minooka CHSD 111 15 75.0 5 25.0 20 0.01
Mokena SD 159 15 35.7 27 64.3 42 0.02
Moline USD 40 545 72.3 209 27.7 754 0.36
Momence CUSD 1 59 100.0 - 0.0 59 0.03
Monmouth-Roseville CUSD 238 150 84.3 28 15.7 178 0.09
Monroe SD 70 - 0.0 2 100.0 2 0.00
Monticello CUSD 25 - 0.0 9 100.0 9 0.00
Morris CHSD 101 7 77.8 2 22.2 9 0.00
Morris SD 54 63 90.0 7 10.0 70 0.03
Morrison CUSD 6 2 66.7 1 33.3 3 0.00
Morton College District 527 34 97.1 1 2.9 35 0.02
Morton CUSD 709 8 36.4 14 63.6 22 0.01
Morton Grove SD 70 26 19.4 108 80.6 134 0.06
Mosaic Early Childhood Ctr Inc 6 35.3 11 64.7 17 0.01
Mount Prospect SD 57 27 30.0 63 70.0 90 0.04
Mount Vernon SD 80 5 83.3 1 16.7 6 0.00
Mt Pulaski CUSD 23 - 0.0 2 100.0 2 0.00
Mt Vernon Twp HSD 201 2 100.0 - 0.0 2 0.00
Mt Zion CUSD 3 - 0.0 1 100.0 1 0.00
Mundelein Cons HSD 120 86 93.5 6 6.5 92 0.04
Mundelein ESD 75 432 92.5 35 7.5 467 0.23
Murphysboro CUSD 186 34 97.1 1 2.9 35 0.02
N Pekin & Marquette Hght SD 102 - 0.0 5 100.0 5 0.00
Naperville CUSD 203 393 47.7 431 52.3 824 0.40
Nashville CHSD 99 1 50.0 1 50.0 2 0.00
DISTRICT/ENTITY NAME
LANGUAGETotal
SpanishNon-English Other Than
Spanish

Appendix A
Bilingual Education Programs and English Language Learners in Illinois SY 2012 Statistical Report
33
Appendix A Number and Percentage of ELL Students, by Language and District: SY 2012 (Continued)
No. Col Pct No. Col Pct No. Row Pct
New Athens CUSD 60 1 50.0 1 50.0 2 0.00
New Berlin CUSD 16 - 0.0 2 100.0 2 0.00
New Lenox SD 122 10 52.6 9 47.4 19 0.01
New Trier Twp HSD 203 5 17.9 23 82.1 28 0.01
Newark CCSD 66 1 100.0 - 0.0 1 0.00
Niles ESD 71 7 13.2 46 86.8 53 0.03
Niles Twp CHSD 219 18 5.8 292 94.2 310 0.15
Nippersink SD 2 25 78.1 7 21.9 32 0.02
Nokomis CUSD 22 1 100.0 - 0.0 1 0.00
Norridge SD 80 13 12.6 90 87.4 103 0.05
North Boone CUSD 200 142 97.9 3 2.1 145 0.07
North Chicago SD 187 906 96.3 35 3.7 941 0.45
North Palos SD 117 126 18.8 546 81.3 672 0.32
North Shore SD 112 731 94.6 42 5.4 773 0.37
Northbrook ESD 27 4 7.0 53 93.0 57 0.03
Northbrook SD 28 4 5.6 67 94.4 71 0.03
Northbrook/Glenview SD 30 2 3.6 54 96.4 56 0.03
Northfield Twp HSD 225 43 36.4 75 63.6 118 0.06
NW Suburban Spec Educ Org 9 52.9 8 47.1 17 0.01
O Fallon CCSD 90 1 20.0 4 80.0 5 0.00
O Fallon Twp HSD 203 2 33.3 4 66.7 6 0.00
Oak Grove SD 68 8 40.0 12 60.0 20 0.01
Oak Lawn CHSD 229 18 25.0 54 75.0 72 0.03
Oak Lawn-Hometown SD 123 168 55.1 137 44.9 305 0.15
Oak Park - River Forest SD 200 4 30.8 9 69.2 13 0.01
Oak Park & River Forest Day Nurs 2 100.0 - 0.0 2 0.00
Oak Park ESD 97 43 41.3 61 58.7 104 0.05
Oglesby ESD 125 12 100.0 - 0.0 12 0.01
Ohio CCSD 17 2 100.0 - 0.0 2 0.00
Olympia CUSD 16 - 0.0 4 100.0 4 0.00
Open Door Preschool 7 100.0 - 0.0 7 0.00
Oregon CUSD 220 21 70.0 9 30.0 30 0.01
Orion CUSD 223 - 0.0 1 100.0 1 0.00
Orland SD 135 74 33.3 148 66.7 222 0.11
Oswego CUSD 308 532 77.9 151 22.1 683 0.33
Ottawa ESD 141 58 95.1 3 4.9 61 0.03
Ottawa Twp HSD 140 21 87.5 3 12.5 24 0.01
Palatine CCSD 15 2,055 76.3 637 23.7 2,692 1.30
Palos CCSD 118 5 4.2 114 95.8 119 0.06
Palos Heights SD 128 12 22.2 42 77.8 54 0.03
Panhandle CUSD 2 2 100.0 - 0.0 2 0.00
Paris-Union SD 95 - 0.0 2 100.0 2 0.00
Park Forest SD 163 24 92.3 2 7.7 26 0.01
Park Ridge CCSD 64 28 18.4 124 81.6 152 0.07
Paxton-Buckley-Loda CUD 10 37 75.5 12 24.5 49 0.02
Pearl City CUSD 200 9 100.0 - 0.0 9 0.00
Pekin PSD 108 4 50.0 4 50.0 8 0.00
Pennoyer SD 79 5 13.2 33 86.8 38 0.02
DISTRICT/ENTITY NAME
LANGUAGETotal
SpanishNon-English Other Than
Spanish

Appendix A
Bilingual Education Programs and English Language Learners in Illinois SY 2012 Statistical Report
34
Appendix A Number and Percentage of ELL Students, by Language and District: SY 2012 (Continued)
Appendix A
No. Col Pct No. Col Pct No. Row Pct
Peoria Heights CUSD 325 1 100.0 - 0.0 1 0.00
Peoria SD 150 557 82.5 118 17.5 675 0.33
Peotone CUSD 207U 2 100.0 - 0.0 2 0.00
Peru ESD 124 45 70.3 19 29.7 64 0.03
Pikeland CUSD 10 1 33.3 2 66.7 3 0.00
Plainfield SD 202 1,491 70.6 622 29.4 2,113 1.02
Plano CUSD 88 431 93.3 31 6.7 462 0.22
Pleasant Hill SD 69 2 100.0 - 0.0 2 0.00
Pleasantdale SD 107 4 10.0 36 90.0 40 0.02
Polo CUSD 222 1 100.0 - 0.0 1 0.00
Pontiac CCSD 429 - 0.0 1 100.0 1 0.00
Pontiac-W Holliday SD 105 1 100.0 - 0.0 1 0.00
Posen-Robbins ESD 143-5 441 98.9 5 1.1 446 0.22
Prairie Central CUSD 8 1 100.0 - 0.0 1 0.00
Prairie Crossing Charter School - 0.0 1 100.0 1 0.00
Prairie Grove CSD 46 19 79.2 5 20.8 24 0.01
Prairie Hill CCSD 133 2 50.0 2 50.0 4 0.00
Prairie State College Dist 515 1 100.0 - 0.0 1 0.00
Prairie-Hills ESD 144 70 75.3 23 24.7 93 0.04
Prairieview-Ogden CCSD 197 - 0.0 1 100.0 1 0.00
Princeville CUSD 326 22 91.7 2 8.3 24 0.01
Prospect Heights SD 23 148 50.0 148 50.0 296 0.14
Proviso Twp HSD 209 727 98.2 13 1.8 740 0.36
Putnam County CUSD 535 12 80.0 3 20.0 15 0.01
Queen Bee SD 16 476 66.9 236 33.1 712 0.34
Quincy SD 172 4 23.5 13 76.5 17 0.01
R O W V A CUSD 208 1 100.0 - 0.0 1 0.00
Rankin CSD 98 3 100.0 - 0.0 3 0.00
Rantoul City SD 137 222 97.8 5 2.2 227 0.11
Rantoul Township HSD 193 7 100.0 - 0.0 7 0.00
Reavis Twp HSD 220 47 36.4 82 63.6 129 0.06
Red Bud CUSD 132 1 100.0 - 0.0 1 0.00
Rhodes SD 84-5 181 90.0 20 10.0 201 0.10
Rich Twp HSD 227 4 33.3 8 66.7 12 0.01
Richland GSD 88A 121 79.6 31 20.4 152 0.07
Richmond-Burton CHSD 157 1 100.0 - 0.0 1 0.00
Ridgeland SD 122 119 19.3 497 80.7 616 0.30
Ridgeview CUSD 19 1 100.0 - 0.0 1 0.00
Ridgewood CHSD 234 1 2.5 39 97.5 40 0.02
Riley CCSD 18 14 93.3 1 6.7 15 0.01
River Forest SD 90 12 42.9 16 57.1 28 0.01
River Grove SD 85-5 37 32.2 78 67.8 115 0.06
River Ridge CUSD 210 - 0.0 3 100.0 3 0.00
River Trails SD 26 164 66.9 81 33.1 245 0.12
Riverbend Headstart / Family Svcs 4 80.0 1 20.0 5 0.00
Riverside SD 96 55 64.7 30 35.3 85 0.04
Riverside-Brookfield Twp SD 208 53 89.8 6 10.2 59 0.03
Riverton CUSD 14 2 100.0 - 0.0 2 0.00
DISTRICT/ENTITY NAME
LANGUAGETotal
Spanish Non-English Other Than Spanish

Appendix A
Bilingual Education Programs and English Language Learners in Illinois SY 2012 Statistical Report
35
Number and Percentage of ELL Students, by Language and District: SY 2012 (Continued)
No. Col Pct No. Col Pct No. Row Pct
Rochelle CCSD 231 402 95.5 19 4.5 421 0.20
Rochelle Twp HSD 212 35 100.0 - 0.0 35 0.02
Rochester CUSD 3A - 0.0 20 100.0 20 0.01
Rock Falls ESD 13 45 91.8 4 8.2 49 0.02
Rock Falls Twp HSD 301 3 75.0 1 25.0 4 0.00
Rock Island SD 41 168 26.2 474 73.8 642 0.31
Rockdale SD 84 27 100.0 - 0.0 27 0.01
Rockford SD 205 2,773 78.1 777 21.9 3,550 1.71
Rockton SD 140 13 54.2 11 45.8 24 0.01
Rondout SD 72 10 62.5 6 37.5 16 0.01
Roselle SD 12 25 36.2 44 63.8 69 0.03
Rosemont ESD 78 22 61.1 14 38.9 36 0.02
Rossville-Alvin CUSD 7 - 0.0 1 100.0 1 0.00
Round Lake CUSD 116 1,929 98.3 33 1.7 1,962 0.95
Roxana CUSD 1 5 83.3 1 16.7 6 0.00
Safari Childcare Inc 10 43.5 13 56.5 23 0.01
Salt Creek SD 48 16 51.6 15 48.4 31 0.01
Sandbox Learning Center - 0.0 5 100.0 5 0.00
Sandridge SD 172 37 100.0 - 0.0 37 0.02
Sandwich CUSD 430 66 91.7 6 8.3 72 0.03
Saratoga CCSD 60C 31 91.2 3 8.8 34 0.02
Schaumburg CCSD 54 1,487 49.6 1,508 50.4 2,995 1.44
Schiller Park SD 81 224 49.3 230 50.7 454 0.22
Schuyler-Industry CUSD 5 6 21.4 22 78.6 28 0.01
SD 45 DuPage County 511 78.7 138 21.3 649 0.31
SD U-46 9,186 90.7 941 9.3 10,127 4.88
Seneca CCSD 170 2 100.0 - 0.0 2 0.00
Seneca Twp HSD 160 1 100.0 - 0.0 1 0.00
Serena CUSD 2 1 100.0 - 0.0 1 0.00
Sherrard CUSD 200 3 100.0 - 0.0 3 0.00
Shiloh Village SD 85 1 100.0 - 0.0 1 0.00
Signal Hill SD 181 1 50.0 1 50.0 2 0.00
Silvis SD 34 29 78.4 8 21.6 37 0.02
Skokie SD 68 55 19.0 235 81.0 290 0.14
Skokie SD 69 88 21.6 320 78.4 408 0.20
Skokie SD 73-5 30 16.8 149 83.2 179 0.09
Smithton CCSD 130 - 0.0 1 100.0 1 0.00
Somonauk CUSD 432 1 100.0 - 0.0 1 0.00
South Central CUD 401 - 0.0 1 100.0 1 0.00
South Holland SD 150 3 60.0 2 40.0 5 0.00
South Holland SD 151 208 95.9 9 4.1 217 0.10
Southeastern IL College 533 1 100.0 - 0.0 1 0.00
Southwestern CUSD 9 2 40.0 3 60.0 5 0.00
Sparta CUSD 140 - 0.0 1 100.0 1 0.00
Spring Valley CCSD 99 69 98.6 1 1.4 70 0.03
Springfield SD 186 33 25.6 96 74.4 129 0.06
St Anne CCSD 256 2 100.0 - 0.0 2 0.00
St Anne CHSD 302 1 100.0 - 0.0 1 0.00
DISTRICT/ENTITY NAME
LANGUAGETotal
SpanishNon-English Other Than
Spanish

Appendix A
Bilingual Education Programs and English Language Learners in Illinois SY 2012 Statistical Report
36
Appendix A Number and Percentage of ELL Students, by Language and District: SY 2012 (Continued)
No. Col Pct No. Col Pct No. Row Pct
St Charles CUSD 303 401 79.4 104 20.6 505 0.24
St George CCSD 258 16 59.3 11 40.7 27 0.01
Stark County CUSD 100 2 20.0 8 80.0 10 0.00
Steger SD 194 109 92.4 9 7.6 118 0.06
Sterling CUSD 5 187 96.9 6 3.1 193 0.09
Stockton CUSD 206 1 100.0 - 0.0 1 0.00
Streator ESD 44 147 97.4 4 2.6 151 0.07
Streator Twp HSD 40 45 97.8 1 2.2 46 0.02
Summit Hill SD 161 32 33.3 64 66.7 96 0.05
Summit School 15 93.8 1 6.3 16 0.01
Summit SD 104 653 92.1 56 7.9 709 0.34
Sunnybrook SD 171 55 79.7 14 20.3 69 0.03
Sunset Ridge SD 29 7 24.1 22 75.9 29 0.01
Sycamore CUSD 427 112 87.5 16 12.5 128 0.06
Taft SD 90 11 73.3 4 26.7 15 0.01
Teutopolis CUSD 50 2 100.0 - 0.0 2 0.00
Thomasboro CCSD 130 4 100.0 - 0.0 4 0.00
Thornton Fractional Twp HSD 215 54 93.1 4 6.9 58 0.03
Thornton SD 154 8 88.9 1 11.1 9 0.00
Thornton Twp HSD 205 89 88.1 12 11.9 101 0.05
Tolono CUSD 7 - 0.0 6 100.0 6 0.00
Township HSD 211 328 62.4 198 37.6 526 0.25
Township HSD 214 484 76.7 147 23.3 631 0.30
Tremont CUSD 702 2 28.6 5 71.4 7 0.00
Tri City CUSD 1 - 0.0 2 100.0 2 0.00
Tri Point CUSD 6-J 3 100.0 - 0.0 3 0.00
Tri Valley CUSD 3 2 100.0 - 0.0 2 0.00
Triad CUSD 2 6 40.0 9 60.0 15 0.01
Trico CUSD 176 4 100.0 - 0.0 4 0.00
Triopia CUSD 27 4 100.0 - 0.0 4 0.00
Troy CCSD 30C 229 81.2 53 18.8 282 0.14
Tuscola CUSD 301 4 100.0 - 0.0 4 0.00
Twp HSD 113 56 88.9 7 11.1 63 0.03
Union Ridge SD 86 43 23.2 142 76.8 185 0.09
Union SD 81 3 100.0 - 0.0 3 0.00
United CUSD 304 1 10.0 9 90.0 10 0.00
United Twp HSD 30 11 35.5 20 64.5 31 0.01
Unity Point CCSD 140 28 30.8 63 69.2 91 0.04
Urbana SD 116 264 58.5 187 41.5 451 0.22
Valley View CUSD 365U 1,964 85.1 343 14.9 2,307 1.11
Vandalia CUSD 203 - 0.0 1 100.0 1 0.00
Vienna HSD 133 1 100.0 - 0.0 1 0.00
Vienna SD 55 7 87.5 1 12.5 8 0.00
Villa Grove CUSD 302 3 100.0 - 0.0 3 0.00
W Harvey-Dixmoor PSD 147 188 100.0 - 0.0 188 0.09
Wabash CUSD 348 - 0.0 2 100.0 2 0.00
DISTRICT/ENTITY NAME
LANGUAGETotal
Spanish Non-English Other Than Spanish

Appendix A
Bilingual Education Programs and English Language Learners in Illinois SY 2012 Statistical Report
37
Appendix A Number and Percentage of ELL Students, by Language and District: SY 2012 (Continued)
No. Col Pct No. Col Pct No. Row Pct
Wallace CCSD 195 1 100.0 - 0.0 1 0.00
Warren Twp HSD 121 68 67.3 33 32.7 101 0.05
Warrensburg-Latham CUSD 11 3 75.0 1 25.0 4 0.00
Washington SD 52 2 100.0 - 0.0 2 0.00
Wauconda CUSD 118 422 90.0 47 10.0 469 0.23
Waukegan CUSD 60 5,032 98.1 98 1.9 5,130 2.47
Wesclin CUSD 3 17 85.0 3 15.0 20 0.01
West Chicago ESD 33 2,535 97.4 69 2.6 2,604 1.26
West Northfield SD 31 45 26.2 127 73.8 172 0.08
West Washington Co CUD 10 1 100.0 - 0.0 1 0.00
Westchester SD 92-5 123 77.8 35 22.2 158 0.08
Western CUSD 12 3 75.0 1 25.0 4 0.00
Wethersfield CUSD 230 1 100.0 - 0.0 1 0.00
Wheeling CCSD 21 2,116 79.7 540 20.3 2,656 1.28
Whiteside SD 115 - 0.0 1 100.0 1 0.00
Will County SD 92 14 34.1 27 65.9 41 0.02
Williamsville CUSD 15 1 25.0 3 75.0 4 0.00
Willow Grove SD 46 3 75.0 1 25.0 4 0.00
Willow Springs SD 108 3 37.5 5 62.5 8 0.00
Wilmette SD 39 14 15.4 77 84.6 91 0.04
Wilmington CUSD 209U 5 83.3 1 16.7 6 0.00
Winfield SD 34 15 57.7 11 42.3 26 0.01
Winnebago CUSD 323 43 79.6 11 20.4 54 0.03
Winnetka SD 36 8 32.0 17 68.0 25 0.01
Wolf Branch SD 113 - 0.0 3 100.0 3 0.00
Wood Dale SD 7 222 64.5 122 35.5 344 0.17
Woodland CCSD 50 664 78.0 187 22.0 851 0.41
Woodland CUSD 5 - 0.0 6 100.0 6 0.00
Woodridge SD 68 460 72.1 178 27.9 638 0.31
Woodstock CUSD 200 865 96.2 34 3.8 899 0.43
Worth SD 127 46 24.5 142 75.5 188 0.09
Yorkville CUSD 115 153 86.0 25 14.0 178 0.09
YWCA of Lake County 4 100.0 - 0.0 4 0.00
Zeigler-Royalton CUSD 188 - 0.0 1 100.0 1 0.00
Zion ESD 6 574 98.3 10 1.7 584 0.28
Zion-Benton Twp HSD 126 54 94.7 3 5.3 57 0.03
TOTAL 167,331 80.7 40,086 19.3 207,417 100.00
DISTRICT/ENTITY NAME
LANGUAGETotal
Spanish Non-English Other Than Spanish

Appendix B
Bilingual Education Programs and English Language Learners in Illinois SY 2012 Statistical Report
38
Appendix B
ELL PROGRAM DEFINITIONS
CONTENT AREA TUTORING - Content area tutoring is individual or small group tutoring to ELLs during the school day. Tutoring may be in such content areas as English language arts, math, science, and social studies. Tutoring is generally provided by teachers other than ESL or bilingual teachers (although teachers with ESL or bilingual approvals may provide such assistance), or may be provided by a paraprofessional under the direction of a teacher. CONTENT BASED ESL - English is taught in and through the content areas of math, science, English language arts, and social studies. Teachers must be bilingual and/or ESL certified/approved/endorsed depending on the grade levels served.
DEVELOPMENTAL BILINGUAL EDUCATION - Education is in the child's native language for an extended duration, accompanied by education in English. The program develops fluency and literacy in the native language and in English. The program emphasizes the development of full bilingualism in the early grades. The goal is to develop literacy in the child's native language first, and transfer these skills to the second language.
HERITAGE LANGUAGE - Heritage Language (HLA) programs use the non-English language background (heritage language) of the student as the primary language of instruction to renew/reclaim that language (e.g., Native American languages). The program also provides instruction in and through English.
INCLUSIONARY SUPPORT - In-class or Inclusion Instruction - In this approach, ELL students are together with their native-English speaking peers in the same classroom, but an ESL or bilingual education specialist is available in the classroom to support the ELL students. For example, the ESL or bilingual education specialist may provide guidance to the ELL students as they are working on a group project or individual assignment.
NEWCOMER CENTER - Recent immigrants with gaps in their education receive instruction in ESL, acculturation, and academic subjects in a short-term program.
PULL OUT INDIVIDUAL SUPPORT – This involves pulling out students from regular classrooms for individual or small-group tutoring sessions. The tutoring sessions may focus on promoting basic English communication skills or focus on English for academic purposes.
PULL OUT ESL - The student is pulled out of the general education classroom for special instruction in ESL, content-based ESL, or in a content area instruction in the native language. In Illinois, pull out may only be done by an appropriately certified teacher. SELF-CONTAINED - ELLs receive instruction in a self-contained classroom for more or less than 50 percent of the day and may be integrated into the general education classes for art, music, and physical education. SHELTERED ENGLISH INSTRUCTION - Sheltered English instruction programs represent an approach to make grade level academic content (for example, science and math) more understandable for English Language Learners (ELLs) while promoting their English language development. Such programs serve students from different language backgrounds (generally low incidence languages) together in classes where teachers use English as the medium for providing content based instruction, adapting the English to the proficiency level of the students. Various strategies, techniques, and materials including the use of plain English, structured overviews, clarification, repetition, visual aids, and gestures are used to help the students understand the grade level core content areas. Although the acquisition of English language proficiency is a goal of sheltered English programs, instruction focuses on content rather than language.

Appendix B
Bilingual Education Programs and English Language Learners in Illinois SY 2012 Statistical Report
39
Appendix B
ELL PROGRAM DEFINITIONS (Continued) STRUCTURED ENGLISH IMMERSION - Structured English Immersion are programs in which ESL teachers or bilingual instructional aides provide linguistic and academic support to ELLs. Typically employed in elementary grades, this program attempts to provide students bilingual teachers in a self-contained classroom. Nevertheless, the language of the classroom is English. The advantage for the students is that a teacher can rely on the students’ native language for explaining and elaborating on key skills and concepts. While an effective approach where there are sufficient numbers of ELL students to comprise a class, structured immersion is not usually implemented with very small (i.e., 1-20) numbers of students, or where students come from many language backgrounds. TRANSITIONAL BILINGUAL EDUCATION - In Illinois, Transitional Bilingual Education (TBE) programs are mandated if there are 20 or more students of the same language in the same attendance center. The instruction, which includes instruction in the core subjects in the native language, English as a Second Language (ESL), and the culture of the native country and the United States, is in the students’ primary language and in English, and is gradually transferred into English only. The program may be conducted in a self-contained classroom all or part of the day. If there are 19 or fewer students of the same language at the same attendance center, a Transitional Program of Instruction (TPI) must be provided. Teachers should have appropriate certification for the grades served and bilingual and/or ESL approvals/endorsements or transitional bilingual certificates. The goal of transitional bilingual education is to help transition a student into an English-only classroom as quickly as possible. A bilingual teacher instructs children in subjects such as math, science, and social studies in their native language, so that once the transition is made to an English-only classroom, the student has the knowledge necessary to compete with his peers in all other subject areas.
Full-time program: 1) Each full-time TBE program shall consist of at least the following components (Section 14C-2 of
the School Code): A) Instruction in subjects which are either required by law (see 23 Ill. Adm. Code 1) or by the
student’s school district, to be given in the student’s home language and in English; core subjects such as math, science, and social studies must be offered in the student’s home language;
B) Instruction in the language arts in the student’s home language and in English as a second language; and
C) Instruction in the history and culture of the country, territory, or geographic area which is the native land of the students or of their parents and in the history and culture of the United States.
Part-time program: Students may be placed into a part-time program, or students previously placed in a full-time program may be placed in a part-time program, if an assessment of the student’s English language skills has been performed in accordance with the provisions of either Section 228.15(e) or Section 228.25(c) of this Part and the assessment results indicate that the student has sufficient proficiency in English to benefit from a part-time program. A part-time program shall consist of components of a full-time program that are selected for a particular student based upon an assessment of the student’s educational needs. Each student’s part-time program shall provide daily instruction in English and in the student’s native language as determined by the student’s needs.

Appendix B
Bilingual Education Programs and English Language Learners in Illinois SY 2012 Statistical Report
40
Appendix B
ELL PROGRAM DEFINITIONS (Continued) TWO WAY IMMERSION/DUAL LANGUAGE - This program groups language minority students from a single language background in the same classroom with language majority (native English speaking) students. Ideally, there is a 50/50 balance between the two groups of students who study together in both languages. Both groups of students develop literacy and proficiency in both languages. Dual language programs may be taught by one teacher who has the appropriate certification to teach the grade level and who also has certification, endorsement, or approval in the second language, or may be taught by two teachers, one of whom has a bilingual approval/endorsement.

Appendix C
Bilingual Education Programs and English Language Learners in Illinois SY 2012 Statistical Report
41
Appendix C
Performance Definitions for the WIDA Levels of English Language Proficiency