bihar school assessment may 2014 main findings ...img.asercentre.org/docs/publications/bihar...
TRANSCRIPT
Bihar School
Assessment
May 2014
Main Findings Main Findings
&
Implications for
Action
Short presentation
Gaya

What were the objectives of the exercise?
Bihar Government invited ASER Centre/Pratham to conduct a school-based assessment of
student achievement in May 2014. This was done in collaboration with SCERT & UNICEF.
The objectives of the exercise were to generate:
� Data for student performance for children in Std 2, 4 and 6. (Other assessments had
been done earlier in the year by other agencies for Std 3, 5 and 7 in 2013-14.) been done earlier in the year by other agencies for Std 3, 5 and 7 in 2013-14.)
� Cluster level report cards that could guide CRCCs to improve teaching-learning in their
schools.
� Build capacity for doing assessments and make links to go from assessments to action.
The trainings at state and district level included classroom sessions and field practice.
Each district team graded all the student papers after data collection in the field. This
was done so that the district teams gained first hand exposure to children’s assessment.

Who, what, where
All schools in the cluster
~ 2 clusters were
randomly sampled in
each district
Total = 79 clusters
All 38 districts were
included in the study State level training for 4 days
for Master Trainers who would
lead the work in each district
Second week of May
5 Master Trainers per
district:
3 from ASER/Pratham
2 from DIET/district
200 Master trainers led
the entire exercise in the
field.
District level training for 4 days
for surveyors
Third week of May
State and district level training
Two surveyors went to
each school for 3-5 days in
the first half of the day.
Second half of the day for
grading papers.
Last week of May
All schools in the cluster
were covered – primary
and upper primary
Total = 1047 schools
All children in Std 2, 4
and 6 were surveyed in
each school in the
sampled cluster
Total = ~ 63,000 children
In each district 60
surveyors: either DIET
students or CRCCs
2 surveyors assigned to
each school in the
sampled cluster
~ 2500 trainers &
surveyors
State and district level training
had one day of field pilot in
nearby schools
14 working days
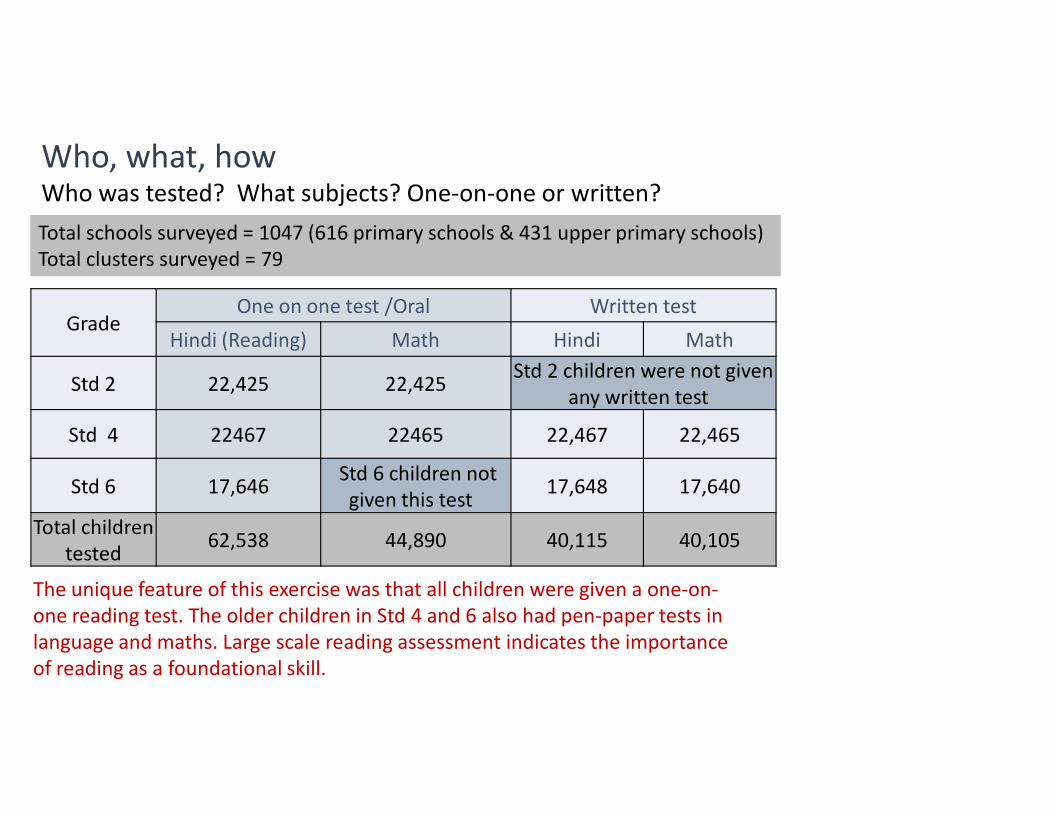
GradeOne on one test /Oral Written test
Hindi (Reading) Math Hindi Math
Std 2 22,425 22,425Std 2 children were not given
any written test
Who, what, how Who was tested? What subjects? One-on-one or written?
Total schools surveyed = 1047 (616 primary schools & 431 upper primary schools)
Total clusters surveyed = 79
any written test
Std 4 22467 22465 22,467 22,465
Std 6 17,646Std 6 children not
given this test 17,648 17,640
Total children
tested 62,538 44,890 40,115 40,105
The unique feature of this exercise was that all children were given a one-on-
one reading test. The older children in Std 4 and 6 also had pen-paper tests in
language and maths. Large scale reading assessment indicates the importance
of reading as a foundational skill.

35000
40000
45000
80
90
100
Total student enrollment & Percentage of enrolled children
attending on Day 1 and Day 2: May 2014
Enrollment
Attendance in schools in the last week of May 2014
This exercise was carried
out in the last week of May
2014.
This was the last week
before summer vacations
0
5000
10000
15000
20000
25000
30000
35000
0
10
20
30
40
50
60
70
Std 1 Std 2 Std 3 Std 4 Std 5 Std 6 Std 7 Std 8
Percent present on Day 1 Percent present on Day 2 Total Enrollment
AttendanceTeachers Appointed 5751
Percent present day 1 87.8
Percent present day 1 84.5
before summer vacations
began and also there was
very bad weather during
this time.
60
70
80
90
100
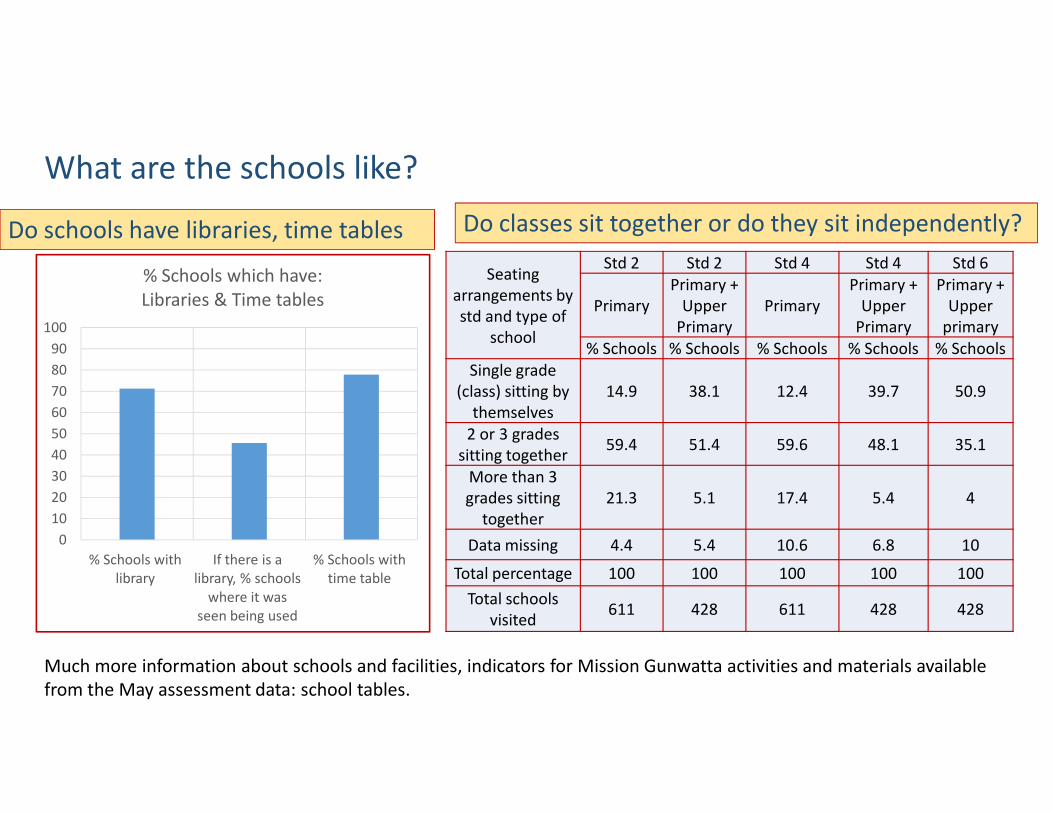
% Schools which have:
Libraries & Time tables
Seating
arrangements by
std and type of
school
Std 2 Std 2 Std 4 Std 4 Std 6
Primary
Primary +
Upper
Primary
Primary
Primary +
Upper
Primary
Primary +
Upper
primary
% Schools % Schools % Schools % Schools % Schools
Single grade
(class) sitting by
themselves
14.9 38.1 12.4 39.7 50.9
What are the schools like?
Do classes sit together or do they sit independently? Do schools have libraries, time tables
0
10
20
30
40
50
60
% Schools with
library
If there is a
library, % schools
where it was
seen being used
% Schools with
time table
themselves
2 or 3 grades
sitting together 59.4 51.4 59.6 48.1 35.1
More than 3
grades sitting
together
21.3 5.1 17.4 5.4 4
Data missing 4.4 5.4 10.6 6.8 10
Total percentage 100 100 100 100 100
Total schools
visited 611 428 611 428 428
Much more information about schools and facilities, indicators for Mission Gunwatta activities and materials available
from the May assessment data: school tables.
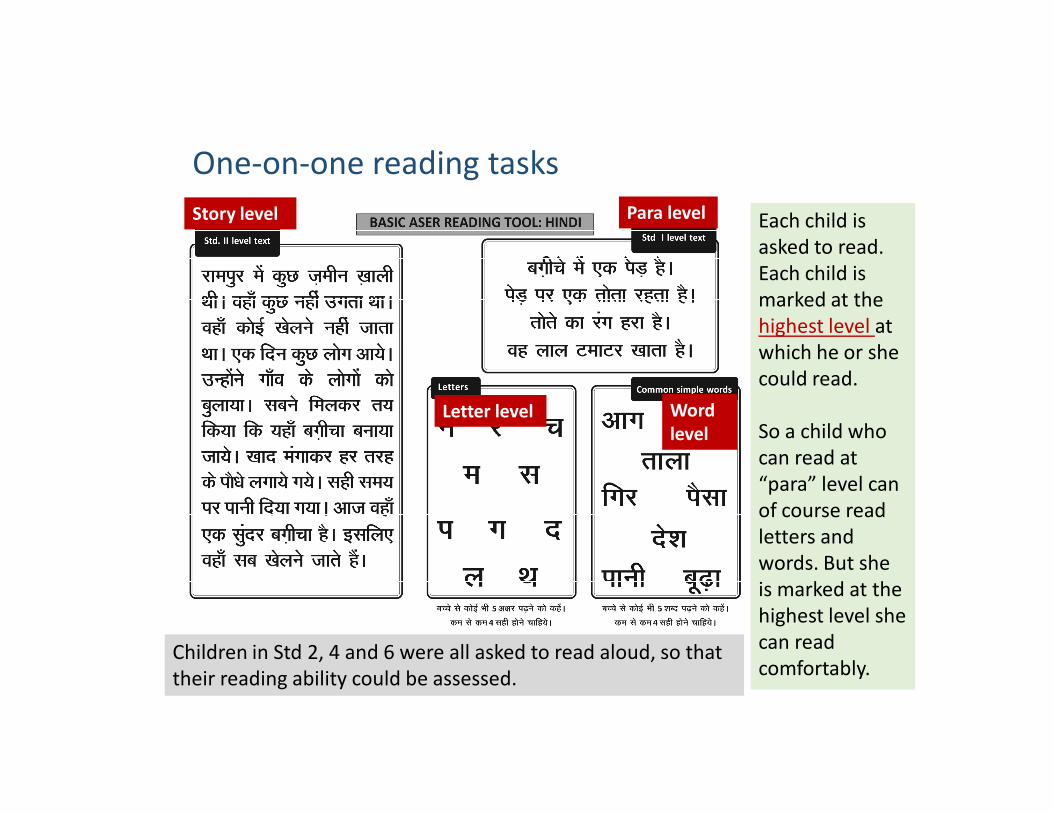
One-on-one reading tasks
Each child is
asked to read.
Each child is
marked at the
highest level at
which he or she
could read.
Para level Story level
Letter level Word So a child who
can read at
“para” level can
of course read
letters and
words. But she
is marked at the
highest level she
can read
comfortably. Children in Std 2, 4 and 6 were all asked to read aloud, so that
their reading ability could be assessed.
Letter level Word
level

70
80
90
100
% Children who can read at "story" level
(Std 2 level)
ASER 2013 & May 2014
Different estimates of children’s reading levels by
grade and over time Sources of data/methods of data
collection are different:
� ASER Sept-Oct 2013 is a
household survey (here only the
govt school children figures are
reported)
� May 2014 is a school based
assessment (but attendance
is below 60%)
More older children can read. But
pace/skill of basic reading needs
to be accelerated.
0
10
20
30
40
50
60
70
Std 2 Std 4 Std 6
ASER - Sept/Oct 2013 May_2014 Next class_ASER Sept/Oct 2013
is below 60%)
� Keeping the differences in the
method of data collection in
mind, May figures are higher
than the Sept figures for basic
reading.
� “Next class” ASER 2013 is an
“extrapolation” to see what
the trends over time may look
like.
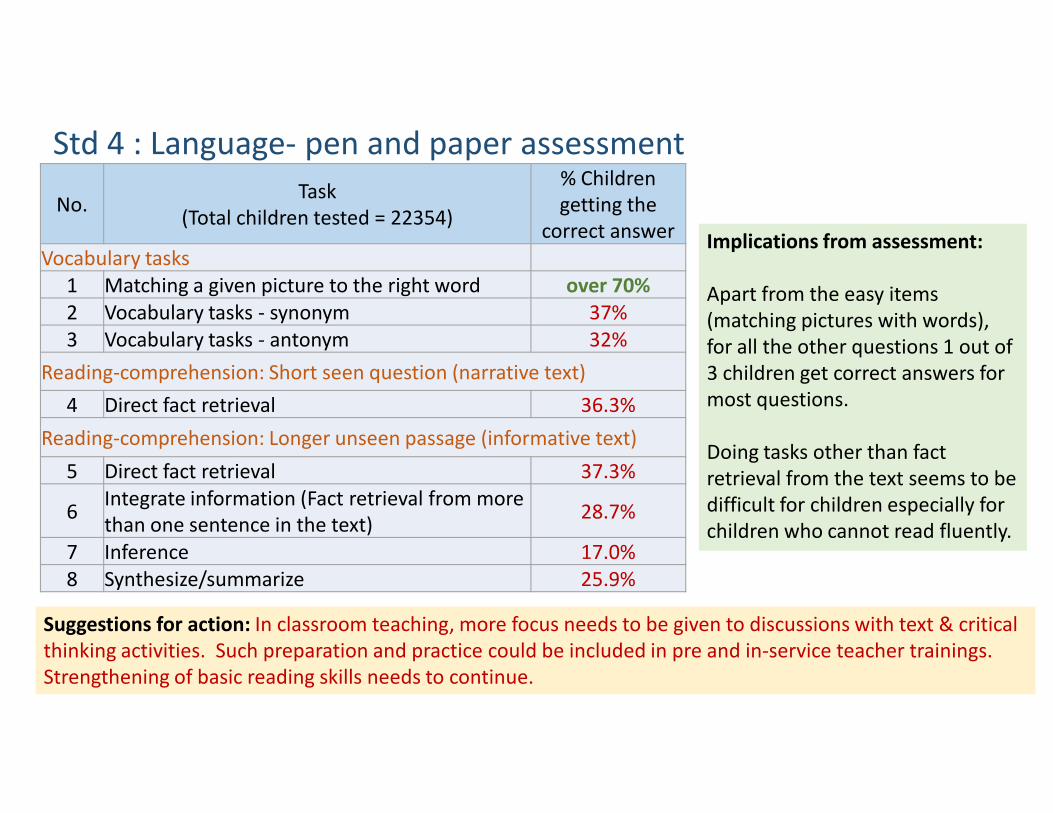
No. Task
(Total children tested = 22354)
% Children
getting the
correct answer
Vocabulary tasks
1 Matching a given picture to the right word over 70%
2 Vocabulary tasks - synonym 37%
3 Vocabulary tasks - antonym 32%
Reading-comprehension: Short seen question (narrative text)
4 Direct fact retrieval 36.3%
Std 4 : Language- pen and paper assessment
Implications from assessment:
Apart from the easy items
(matching pictures with words),
for all the other questions 1 out of
3 children get correct answers for
most questions. 4 Direct fact retrieval 36.3%
Reading-comprehension: Longer unseen passage (informative text)
5 Direct fact retrieval 37.3%
6Integrate information (Fact retrieval from more
than one sentence in the text)28.7%
7 Inference 17.0%
8 Synthesize/summarize 25.9%
most questions.
Doing tasks other than fact
retrieval from the text seems to be
difficult for children especially for
children who cannot read fluently.
Suggestions for action: In classroom teaching, more focus needs to be given to discussions with text & critical
thinking activities. Such preparation and practice could be included in pre and in-service teacher trainings.
Strengthening of basic reading skills needs to continue.
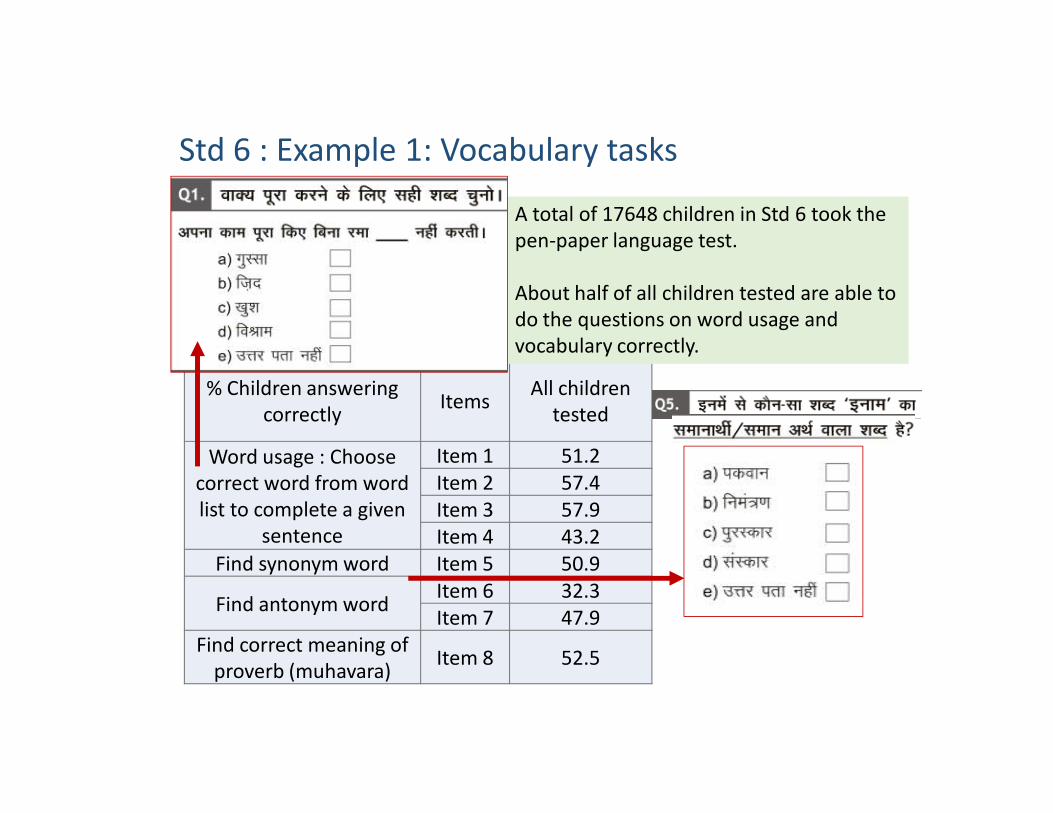
Std 6 : Example 1: Vocabulary tasks
% Children answering
correctly Items
All children
tested
A total of 17648 children in Std 6 took the
pen-paper language test.
About half of all children tested are able to
do the questions on word usage and
vocabulary correctly.
correctly Items
tested
Word usage : Choose
correct word from word
list to complete a given
sentence
Item 1 51.2
Item 2 57.4
Item 3 57.9
Item 4 43.2
Find synonym word Item 5 50.9
Find antonym word Item 6 32.3
Item 7 47.9
Find correct meaning of
proverb (muhavara) Item 8 52.5

708090
100
Reading-comprehension :
"Seen" short passage
Std 6: % Children answering
correctly
Std 6 : Links between reading & comprehension
Among comprehension items,
children find it easier to do the fact
retrieval tasks than the questions
which need interpretation,
application or reflection.
Fluent readers do much better than
others in comprehension tasks.
~ 80% children in Std 6
are able to at least
read sentences (i.e
para or story level)
010203040506070
Direct fact
retrieval
Indirect
fact
retrieval
Interpret Reflect
(open
ended
question)
Story level Para level
In our classroom teaching, much
more focus needs to be put on
deeper discussion of texts and on
higher order critical thinking skills
so that children learn how to
interpret, infer, summarize and
reflect. These abilities will
strengthen if there is more in depth
discussions in the classroom based
on texts. .
In Std 6, 61.6% are reading at Std 2 level or higher. 18% can read at para level (Std 1 level).
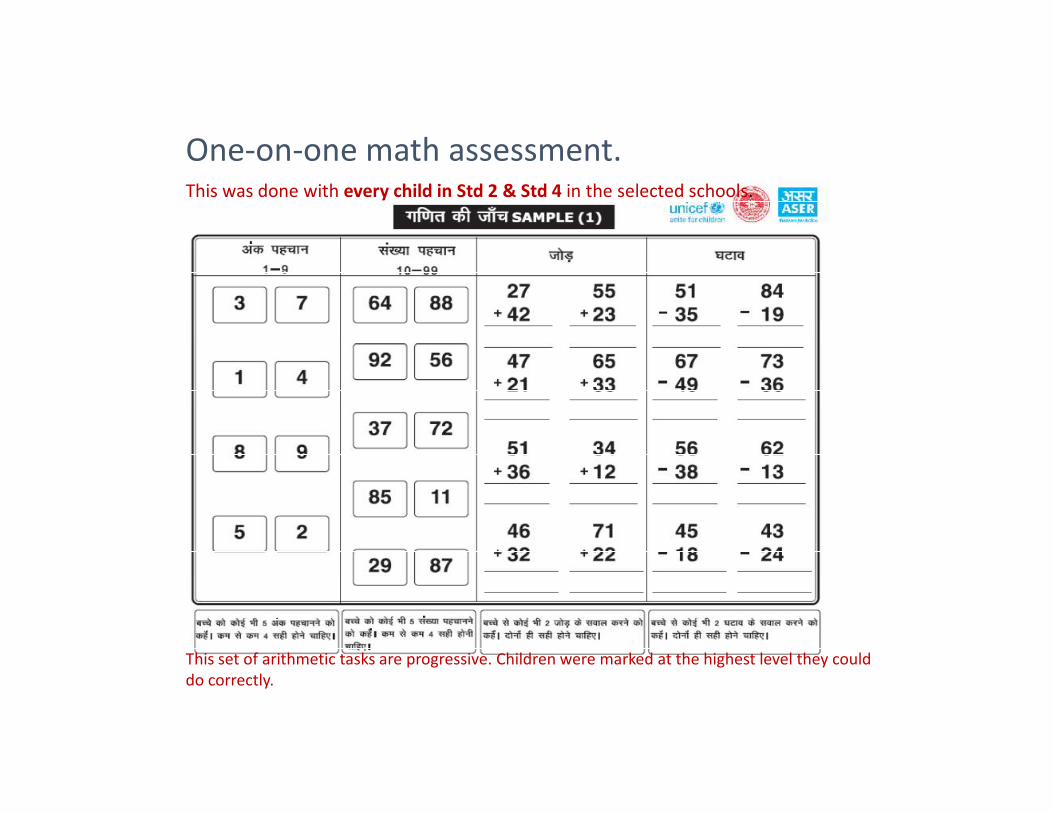
One-on-one math assessment.This was done with every child in Std 2 & Std 4 in the selected schools.
This set of arithmetic tasks are progressive. Children were marked at the highest level they could
do correctly.
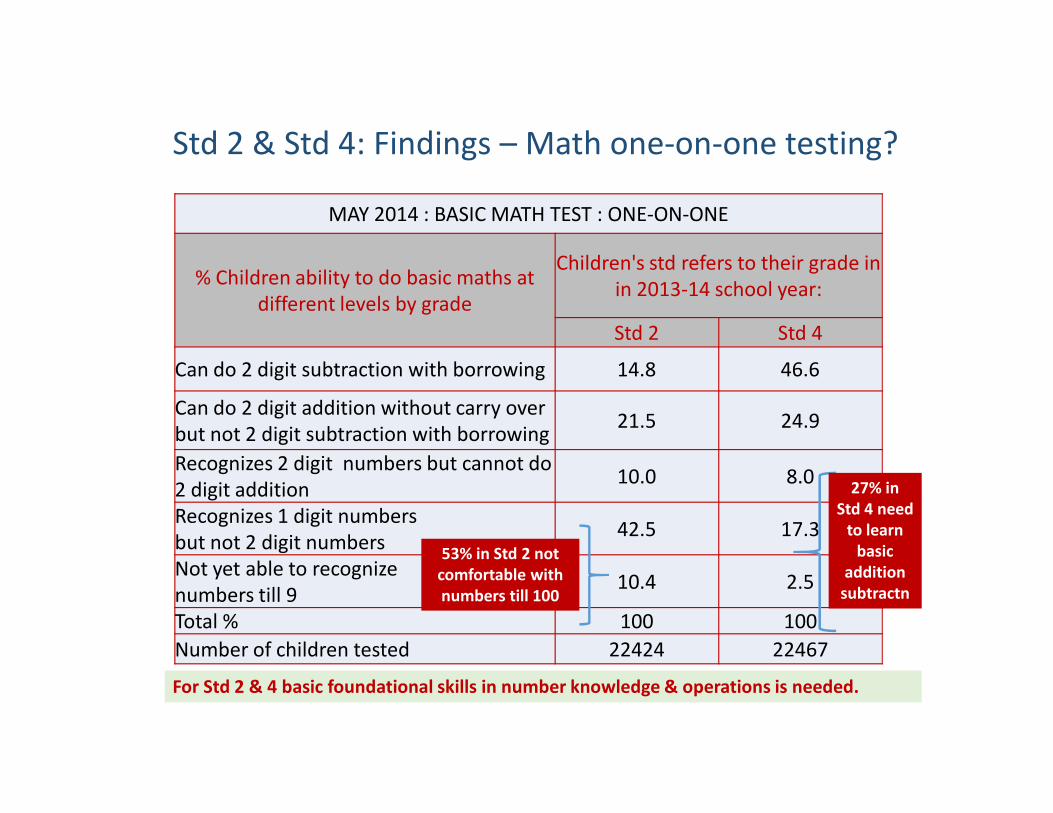
Std 2 & Std 4: Findings – Math one-on-one testing?
MAY 2014 : BASIC MATH TEST : ONE-ON-ONE
% Children ability to do basic maths at
different levels by grade
Children's std refers to their grade in
in 2013-14 school year:
Std 2 Std 4
Can do 2 digit subtraction with borrowing 14.8 46.6
Can do 2 digit addition without carry over 21.5 24.9
Can do 2 digit addition without carry over
but not 2 digit subtraction with borrowing 21.5 24.9
Recognizes 2 digit numbers but cannot do
2 digit addition10.0 8.0
Recognizes 1 digit numbers
but not 2 digit numbers42.5 17.3
Not yet able to recognize
numbers till 9 10.4 2.5
Total % 100 100
Number of children tested 22424 22467
53% in Std 2 not
comfortable with
numbers till 100
27% in
Std 4 need
to learn
basic
addition
subtractn
For Std 2 & 4 basic foundational skills in number knowledge & operations is needed.
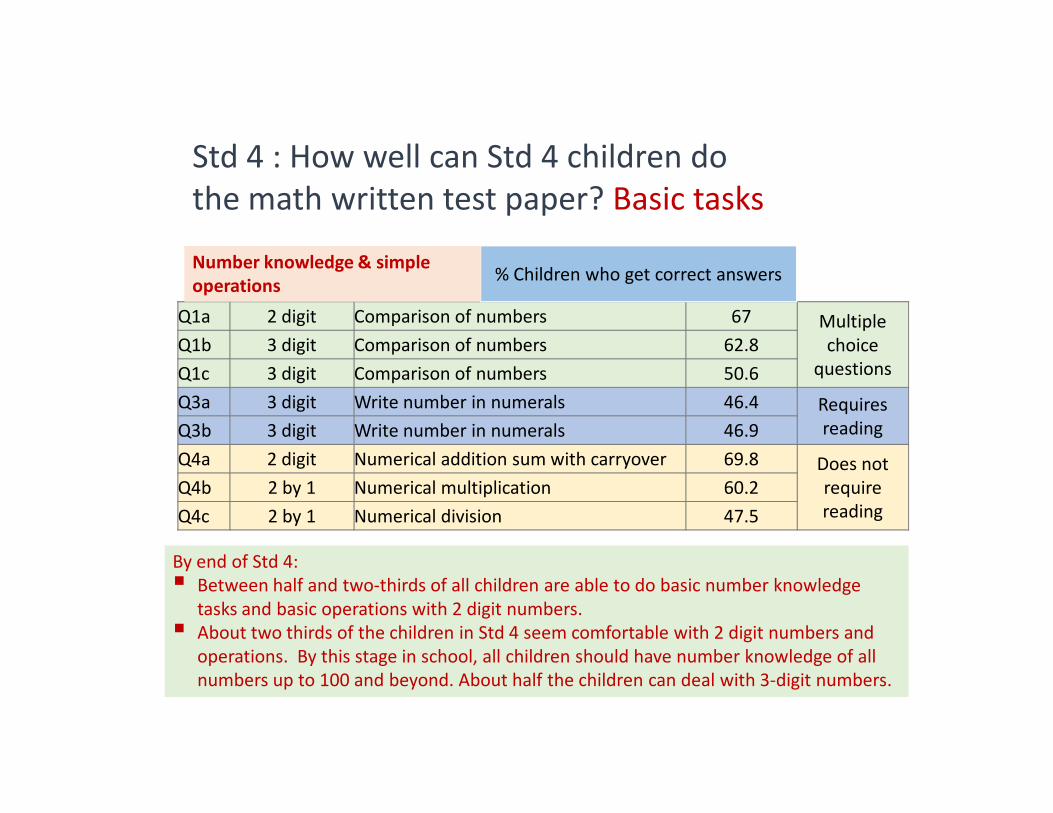
Std 4 : How well can Std 4 children do
the math written test paper? Basic tasks
Q1a 2 digit Comparison of numbers 67 Multiple
choice
questions
Q1b 3 digit Comparison of numbers 62.8
Q1c 3 digit Comparison of numbers 50.6
Q3a 3 digit Write number in numerals 46.4 Requires
% Children who get correct answers Number knowledge & simple
operations
Q3a 3 digit Write number in numerals 46.4 Requires
reading Q3b 3 digit Write number in numerals 46.9
Q4a 2 digit Numerical addition sum with carryover 69.8 Does not
require
reading
Q4b 2 by 1 Numerical multiplication 60.2
Q4c 2 by 1 Numerical division 47.5
By end of Std 4:
� Between half and two-thirds of all children are able to do basic number knowledge
tasks and basic operations with 2 digit numbers.
� About two thirds of the children in Std 4 seem comfortable with 2 digit numbers and
operations. By this stage in school, all children should have number knowledge of all
numbers up to 100 and beyond. About half the children can deal with 3-digit numbers.

Std 4: How well can Std 4 children do the
math written test paper? Word problems
Q7 2 digit Word problem subtraction (borrow) 49.1
Q8 2 by 2 Word problem multiplication 30.1
Q9 2 by 1 Word problem division 31.1
All children
68.8 50.8
46.2 28.6
47.7 30.4
Story Para% Children getting correct answers
Of children
who are
reading at
story & para
level what %
can do these
problems?
� To do these type of word problems correctly, a child should know how to read,
understand what operation is to be done and then be able do the operation correctly.
� Even among children who can read, we can see that a large proportion do not know
what is to be done to solve the word problems.
� Comparison between questions reveals that for the same operation, more children can
correctly do the numerical problem rather than the word problem.
Word problem multiplication (2 digit by 2)
Word problem division (3 digit by 1)
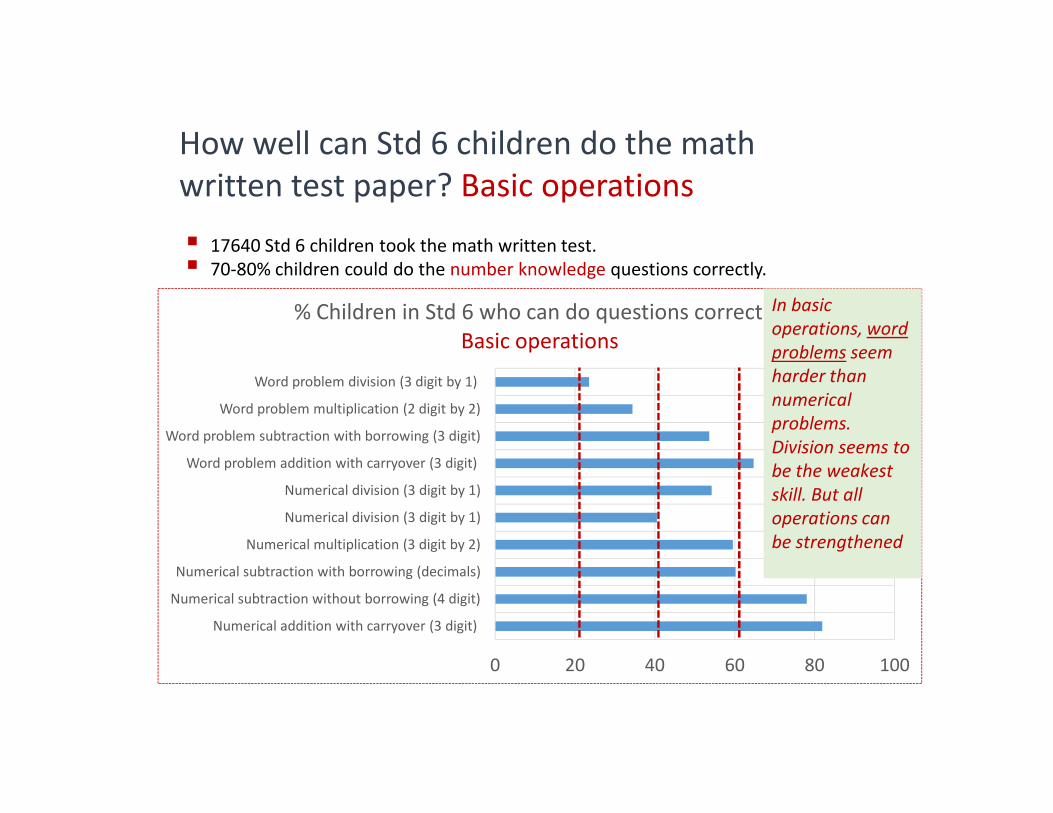
% Children in Std 6 who can do questions correctly:
Basic operations
In basic
operations, word
problems seem
harder than
numerical
How well can Std 6 children do the math
written test paper? Basic operations
� 17640 Std 6 children took the math written test.
� 70-80% children could do the number knowledge questions correctly.
0 20 40 60 80 100
Numerical addition with carryover (3 digit)
Numerical subtraction without borrowing (4 digit)
Numerical subtraction with borrowing (decimals)
Numerical multiplication (3 digit by 2)
Numerical division (3 digit by 1)
Numerical division (3 digit by 1)
Word problem addition with carryover (3 digit)
Word problem subtraction with borrowing (3 digit)
Word problem multiplication (2 digit by 2)numerical
problems.
Division seems to
be the weakest
skill. But all
operations can
be strengthened
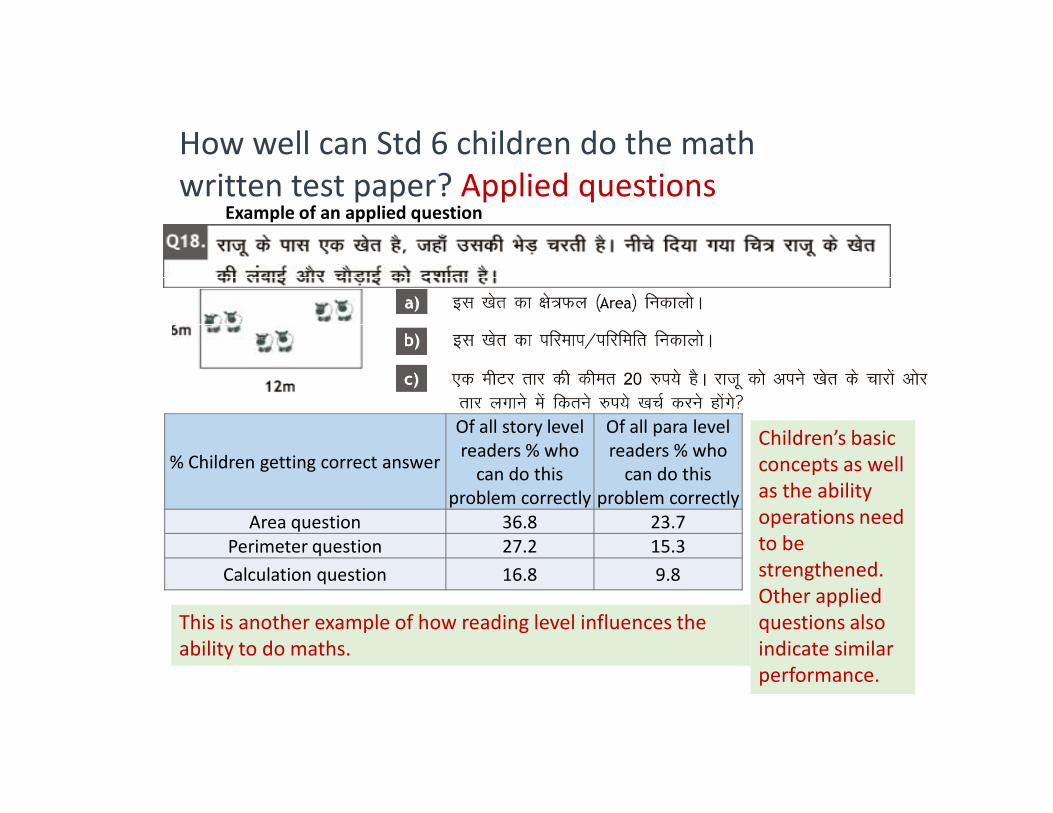
How well can Std 6 children do the math
written test paper? Applied questions Example of an applied question
% Children getting correct answer
Of all story level
readers % who
can do this
problem correctly
Of all para level
readers % who
can do this
problem correctly
Area question 36.8 23.7
Perimeter question 27.2 15.3
Calculation question 16.8 9.8
Children’s basic
concepts as well
as the ability
operations need
to be
strengthened.
Other applied
questions also
indicate similar
performance.
This is another example of how reading level influences the
ability to do maths.

SUGGESTIONS FOR ACTION TO IMPROVE
LEARNING
A. Strong focus on basic skills needs to continue –
basic reading and arithmetic skills (number
knowledge and operations).
Std 1-2 : Ensure foundational skills
Std 3-5 : Continue “catch up” remedial strategy
Std 6-8 : Need to think about learning support for
those who lack basic skills.
CLUSTER LEVEL STRATEGIES
Cluster report cards can be a useful mechanism
for strengthening schools in the cluster and
focussing the work of the CRCCs in improving
learning.
Such assessments show the variation between
schools in the same cluster.
Need to have strategy in which the “good” those who lack basic skills.
B. Increased classroom interaction between teachers
and children - discussions and on applying what they
know to situations e.g comprehension of texts, word
problems, writing and expression.
These practices need to be explicitly integrated into
trainings, “practice” sessions and better schools in
the cluster as demonstration models.
Need to have strategy in which the “good”
schools can help the “weaker” schools in the
same cluster.
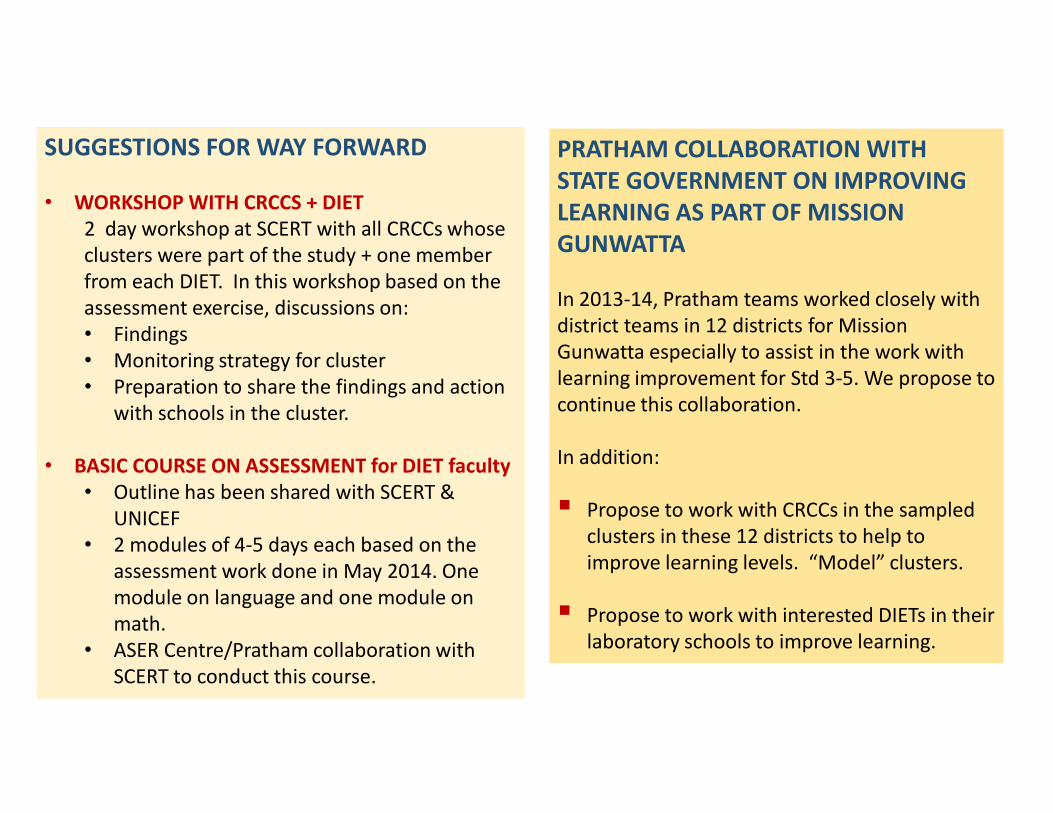
SUGGESTIONS FOR WAY FORWARD
• WORKSHOP WITH CRCCS + DIET
2 day workshop at SCERT with all CRCCs whose
clusters were part of the study + one member
from each DIET. In this workshop based on the
assessment exercise, discussions on:
• Findings
• Monitoring strategy for cluster
• Preparation to share the findings and action
with schools in the cluster.
PRATHAM COLLABORATION WITH
STATE GOVERNMENT ON IMPROVING
LEARNING AS PART OF MISSION
GUNWATTA
In 2013-14, Pratham teams worked closely with
district teams in 12 districts for Mission
Gunwatta especially to assist in the work with
learning improvement for Std 3-5. We propose to
continue this collaboration. with schools in the cluster.
• BASIC COURSE ON ASSESSMENT for DIET faculty
• Outline has been shared with SCERT &
UNICEF
• 2 modules of 4-5 days each based on the
assessment work done in May 2014. One
module on language and one module on
math.
• ASER Centre/Pratham collaboration with
SCERT to conduct this course.
continue this collaboration.
In addition:
� Propose to work with CRCCs in the sampled
clusters in these 12 districts to help to
improve learning levels. “Model” clusters.
� Propose to work with interested DIETs in their
laboratory schools to improve learning.