big data in pictures - hkust
TRANSCRIPT

Big Data in Pictures: Data Visualization
Huamin Qu
Hong Kong University of Science and Technology

What is data visualization?
• “Data visualization is the creation and study of the visual representation of data” - wiki
• Input: data Output: visual form Goal: insight

Why visualization?

Anscombe’s Quartet: Four datasets

Anscombe’s Quartet: Statistics

Anscombe’s Quartet: Visualizations

Bible

GapMinder

GapMinder

Data Visualization
• Vis is hot & cool • Vis is young • What is vis research? • What are we doing at HKUST?

WSJ


Obama’s big data plan
• A $2 million award for a research training group in big data that will support training for undergraduate and graduate students and postdoctoral fellows using novel statistical, graphical, and visualization techniques to study complex data.

Tableau


Data Visualization
• Vis is hot & cool • Vis is young • What is vis research? • What are we doing at HKUST?

Subfields
• Scientific Visualization (SciVis) – Spatial data
• Information Visualization (InfoVis)– Abstract data
• Visual Analytics (VAST) – Analytical reasoning

VAST (Visual Analytics Science and Technology)
InfoVis (Information Visualization)
SciVis (Scientific Visualization)
VIS Conferences


VIS - Infographics
• Infographics is static • Visualization is interactive

StoryLine

StoryLine


VIS - HCI
• Visualization deals with data • HCI deals with everything involving human &
computer interaction

VIS - Data Mining
• Data mining focuses more on automatic algorithms
• Visualization keeps human in the loop and focuses more on interactive analysis

VA and Data Mining
• Data Analysis – let computers do what computers are good at Data mining – let humans do what they're good at Visual analytics

Data mining
Visual Analytics
Human Computer Interaction Computer Graphics
Daniel A. Keim’s perspective on visual analytics


Data Visualization
• Vis is hot & cool • Vis is young • What is vis research? • What are we doing at HKUST?

What is vis research?
• Techniques/algorithms • Applications • Systems • Evaluations • Theory/models

Visualization Process
• Visualization Pipeline
Engineering part Visual design part

Technique Papers
Novel techniques or algorithms

Application/Design Study Papers
Applying visualization and visual analytics techniques in an application area.

System Papers
A blend of algorithms, technical requirements, user requirements, and design that solves a major problem.

Evaluation Papers
Animations Traces

Theory/Model papers New interpretations of the foundational theory
of visualization and visual analytics.
How Information Visualization Novices Construct Visualizations Grammel et al. IEEE TVCG 2010

A Typical Visual Analytics Problem
• IEEE VAST Challenge 2009
An employee is leaking important information to the outside world; hypotheses about his identity and network need to be made or confirmed. There are three datasets:
– Badge and computer network traffic – Social network (with a very small geospatial component) – Video

VAST Challenge 2013


Role of Visualization in Big Data Analytics
Scalability

Challenges for Visualization Research
Scalability

Better Scalability
- Better visualization - More people

Better Visualization
• Better overview & summarization • Better data reduction • Better visual encoding • Better user interaction • ….

Top Ten Interaction Challenges
in Extreme-Scale Visual Analytics P.C. Wong, H.W. Shen and C. Chen 2012
1. In Situ Interactive Analysis 2. User-Driven Data Reduction 3. Scalability and Multi-level Hierarchy 4. Representation of Evidence and Uncertainty 5. Heterogeneous Data Fusion

Top Ten Interaction Challenges in Extreme-Scale Visual Analytics
6. Data Summarization and Triage for Interactive Query 7. Analytics of Temporally Evolving Features 8. The Human Bottleneck 9. Design and Engineering Development 10. The Renaissance of Conventional Wisdom

How to Get More People?
• Lower the bar for visualizations • Bring visualizations to masses

Lower the Bar for Visualizations
• Google Visualization API • IBM’s RAVE and Many Eyes • D3.js
• Taobao’s datav.org

D3.js

IBM Many Eyes

Taobao

百度 Echarts


Data Visualization
• Vis is hot & cool • Vis is young • What is vis research? • What are we doing at HKUST?

Visualization@HKUST

Medical Data Visualization
TVCG’07
TVCG’08 (Vis’08)
TVCG’09 1 (Vis’09)
TVCG’09 2 (Vis’09)
TVCG 2011

High Dimensional and Relational Data
TVCG’08 (InfoVis’08)
CGF’08 (EuroVis’08)
CGF’09 (EuroVis’09)
TVCG’09 (InfoVis’09) TVCG’11
InfoVis’11

Text Data
Dynamic Tag Clouds
IEEE CG&A’ 11
OpinionSeer
TVCG’10 (InfoVis’10)
FacetAtlas
TVCG’10 (InfoVis’10)
TextFlow TVCG’11 (InfoVis’11)
TextWheel ACM TIST’12

Urban Informatics
Air pollution analysis TVCG’07 (Vis’07)
Route Zooming TVCG’09 (Vis’09)
Trajectory Analysis VAST’11
Mobile Phone Data

Three Projects
• Twitter Data Visualization • Trajectory Data Visualization • Coursera Data Visualization

Social Flow

Whisper When and where is a story dispersed?

How information is spread ?
Query earthquake on Twitter

Information diffusion: When, where and how the ideas are spread ?
The temporal trend, social-spatial extent and community response to a topic of interest.

Challenges
• How can we represent the dynamic information diffusion processes for diffusion pattern detection and comparison? – How can we deal with a huge amount of micro
blog data in real time? – How can we summarize the diffusion processes by
considering temporal, spatial, topic and community information?

Visualization design
• Color hues: sentiments • Color opacity: activeness of tweets / users • Size: importance (number of followers) • Shape: types (media / common users / retweeting activity)

Visualization design
• Diffusion series – When mouse over on an active tweet, its diffusion
series will be shown to illustrate ``when did who reweet whom”.


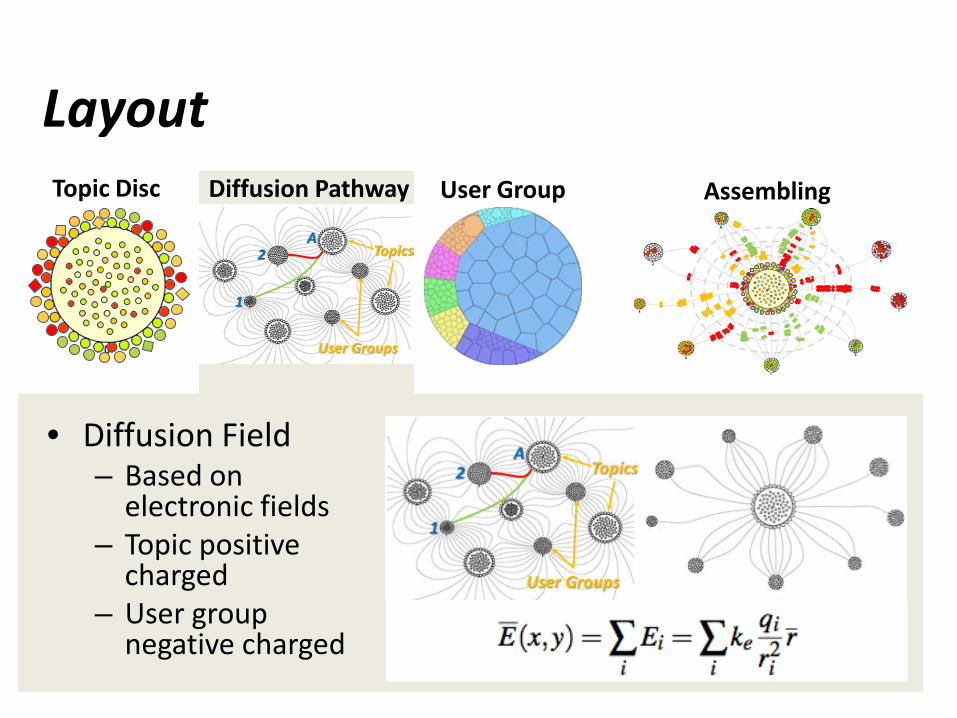
Layout Topic Disc Diffusion Pathway User Group Assembling

Layout Topic Disc Diffusion Pathway User Group Assembling
• Sunflower Packing
Layout Topic Disc Diffusion Pathway User Group Assembling
• Diffusion Field – Based on
electronic fields – Topic positive
charged – User group
negative charged

Layout Topic Disc Diffusion Pathway User Group Assembling
• Flux line layout

Layout Topic Disc Diffusion Pathway User Group Assembling
• Users are grouped either by geo-locations / their shared interests – Use voronoi icons to facilitate comparison – Use sunflower packing for efficient layout in case of online
monitoring • Layout by longitude or evenly separate circle space

Layout Topic Disc Diffusion Pathway User Group Assembling
• Visual clutter reduction – Reorder the user groups in match with the center
active tweets to reduce crossings – Rotate the topic disc to minimize the line lengths

Video

Stories (1) : tracing diffusion events
Japan Earthquake

Temporal diffusion pattern (Medias)

Interview with Domain Experts
• Three experts: – political scientist, design expert, communication phD
• Interview methodology: – warm up; semi-structure interview with 7 questions;
free discussions
• Results • Discussions

A Complete VA System
• Design goals • Underlying techniques (data mining;
visualization, interaction, etc.) • Case studies • User study (questionnaire-based; task-based) • Expert Interview

Visual Analytics of Trajectory Data
• Fix data errors • Reconstruct continuous trajectories • Route diversity analysis
Data Uncertainty Data Error

Navigation System
• Microsoft T-drive [Yuan et al., 2010]
R1 R2
R3
a
bR4
99

• Time – Outer circle
• Number of trajectories – The height of the bars
• Duration – Length of the arc
• Speed – Color
100
Encoding Scheme
H. Liu et al. IEEE VAST 2011

User Interactions
• Brushing by locations • Brushing by time span
101

Traffic Monitoring
102

Route Suggestion
103

Route Suggestion
104

Embed Temporal Displays onto the Roads

Interchange patterns

Analysis of Clickstreams in the Coursera

Analysis on clickstream pattern-stacked graphs
Week 1-1 Week 1-2 Week 1-3 Week 1-4
628
Fig.1

Analysis on clickstream pattern-stacked graphs
Week 1-1 Week 1-2 Week 1-3 Week 1-4

Analysis on clickstream pattern - animation
Fig.2

Analysis on clickstream pattern - animation
Fig.4
112

Analysis on user behavior
114

• Current Classification
• Comparisons between different types of users “seek” action – most frequent and meaningful seek arc comparisons
Users who watched only one video – “random” users 28.1% Users who watched all videos – “persistent” users 9.8% Users who watched more than one video and only those from the
first seven videos – “impersistent” users 44.5% Other types of users – “others” 17.6%
User classification
115

Seek arc visual encoding scheme
Fig.10
116

Comparison of seek behavior on the first course video for different groups of users (500 users for each group)
Fig.11
117

Comparison among videos from different weeks for the user group who have watched all the 17 videos(persistent users)
Fig.12
118

*Specific Parts in Videos Corresponding to Histogram peaks Some patterns from peaks: 1) “Skip the opening”
119

*Specific Parts in Videos Corresponding to Histogram peaks Some patterns from peaks: 1) “Skip the opening”
120

*Specific Parts in Videos Corresponding to Histogram peaks Some patterns from peaks: 2) “New term & Sensitive topic”
121

*Specific Parts in Videos Corresponding to Histogram peaks Some patterns from peaks: 2) “New term & Sensitive topic”
122

*Specific Parts in Videos Corresponding to Histogram peaks Some patterns from peaks: 3) “Findings vs. Conclusions”
123

*Specific Parts in Videos Corresponding to Histogram peaks Some patterns from peaks: 3) “Findings vs. Conclusions”
124

Conclusions
• A primer on data visualization • Examples to showcase HKUST vis projects • Data visualization is hot, cool, and young


Q&A