big data in logistics - dhl.com · big data in logistics a dhl perspective on how to move beyond...
TRANSCRIPT
BIG DATA IN LOGISTICS
A DHL perspective on how to move beyond the hype
December 2013
Powered by Solutions & Innovation: Trend Research

PUBLISHERDHL Customer Solutions & Innovation Represented by Martin Wegner Vice President Solutions & Innovation 53844 Troisdorf, Germany
PROJECT DIRECTOR Dr. Markus Kückelhaus Solutions & Innovation, DHL
PROJECT MANAGEMENT AND EDITORIAL OFFICE Katrin ZeilerSolutions & Innovation, DHL
IN COOPERATION WITH:
AUTHORS Martin Jeske, Moritz Grüner, Frank Weiß

1
Big Data and logistics are made for each other, and today the logistics industry is positioning itself to put this wealth of information to better use.
The potential for Big Data in the logistics industry has already been highlighted in the acclaimed ‘DHL Logistics Trend Radar’. This overarching study is a dynamic, living document designed to help organizations derive new strategies and develop more powerful projects and innovations.
To sharpen the focus, the trend report you are reading now asks the key Big Data questions:
• How can we move from a deep well of data to deep exploitation?
• How can we use information to improve operational efficiency and customer experience, and create useful new business models?
Big Data is a relatively untapped asset that companies can exploit once they adopt a shift of mindset and apply the right drilling techniques.
It also goes way beyond the buzz words to offer real-world use cases, revealing what’s happening now, and what’s likely to happen in the future. This trend report starts with an introduction to the concept and meaning of Big Data, provides examples drawn from many different industries, and then presents logistics use cases.
Big Data has much to offer the world of logistics. Sophisticated data analytics can consolidate this traditionally fragmented sector, and these new capabilities put logistics providers in pole position as “search engines in the physical world”.
It has been jointly developed with T-Systems and the experts from Detecon Consulting. The research team has combined world-class experience from both the logistics domain and the information management domain.
We hope that ‘Big Data in Logistics’ provides you with some powerful new perspectives and ideas. Thank you for choosing to join us on this Big Data journey; together we can all benefit from a new model of cooperation and collaboration in the logistics industry.
Yours sincerely,
Martin Wegner Dr. Markus Kückelhaus
Preface
PREFACE

22
Preface .............................................................................. 1
1 Understanding Big Data ................................................... 3
2 Big Data Best Practice Across Industries .......................... 6 2.1 Operational Efficiency ......................................................... 7 2.2 Customer Experience .......................................................... 10 2.3 New Business Models .......................................................... 13
3 Big Data in Logistics ......................................................... 15 3.1 Logistics as a Data-driven Business ................................... 15 3.2 Use Cases – Operational Efficiency ................................... 18 3.3 Use Cases – Customer Experience ..................................... 22 3.4 Use Cases – New Business Models .................................... 25 3.5 Success Factors for Implementing Big Data Analytics .... 27
Outlook ..................................................................................... 29
Table of Contents
3Understanding Big Data
The sustained success of Internet powerhouses such as Amazon, Google, Facebook, and eBay provides evidence of a fourth production factor in today’s hyper-connected world. Besides resources, labor, and capital, there’s no doubt that information has become an essential element of competitive differentiation.
Companies in every sector are making efforts to trade gut-feeling for accurate data-driven insight to achieve effective business decision making. No matter the issue to be decided – anticipated sales volumes, customer product preferences, optimized work schedules – it is data that now has the power to help businesses succeed. Like a quest for oil, with Big Data it takes educated drilling to reveal a well of valuable information.
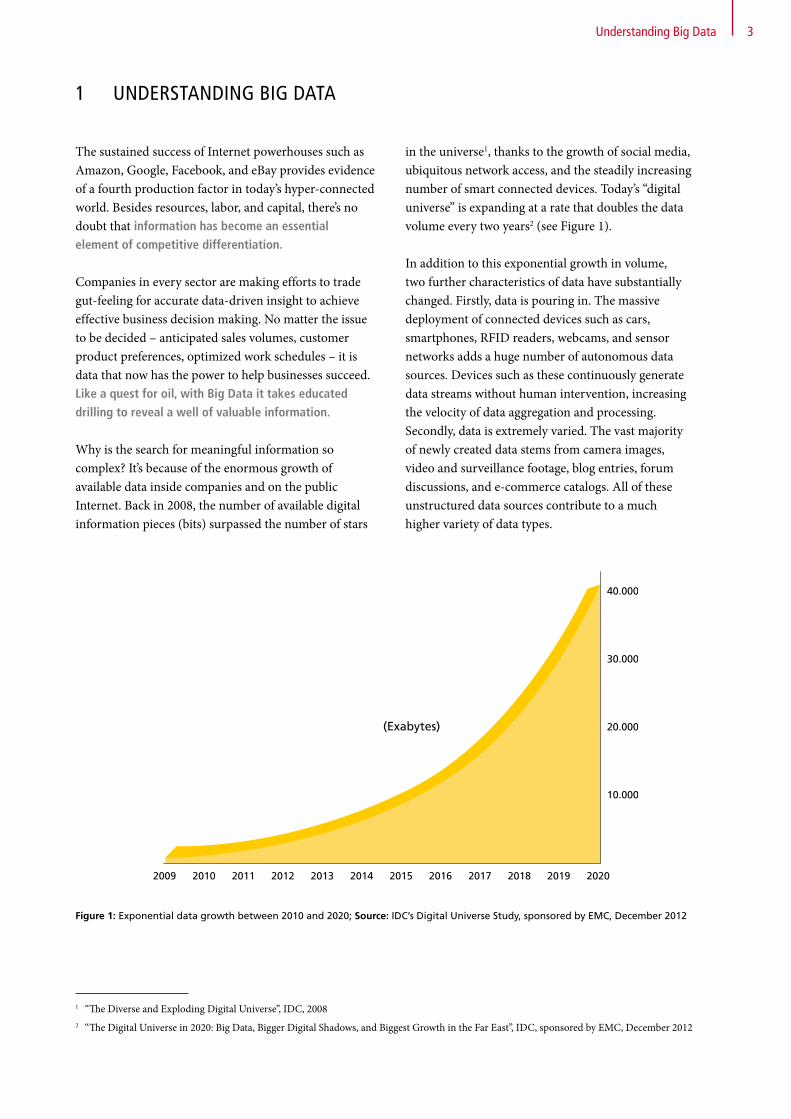
Why is the search for meaningful information so complex? It’s because of the enormous growth of available data inside companies and on the public Internet. Back in 2008, the number of available digital information pieces (bits) surpassed the number of stars
in the universe1, thanks to the growth of social media, ubiquitous network access, and the steadily increasing number of smart connected devices. Today’s “digital universe” is expanding at a rate that doubles the data volume every two years2 (see Figure 1).
In addition to this exponential growth in volume, two further characteristics of data have substantially changed. Firstly, data is pouring in. The massive deployment of connected devices such as cars, smartphones, RFID readers, webcams, and sensor networks adds a huge number of autonomous data sources. Devices such as these continuously generate data streams without human intervention, increasing the velocity of data aggregation and processing. Secondly, data is extremely varied. The vast majority of newly created data stems from camera images, video and surveillance footage, blog entries, forum discussions, and e-commerce catalogs. All of these unstructured data sources contribute to a much higher variety of data types.
1 UNDERSTANDING BIG DATA
2009 2010 2011 2012 2013 2014 2015 2016 2017 2018 2019 2020
10.000
20.000
30.000
40.000
(Exabytes)
Figure 1: Exponential data growth between 2010 and 2020; Source: IDC’s Digital Universe Study, sponsored by EMC, December 2012
1 “The Diverse and Exploding Digital Universe”, IDC, 20082 “The Digital Universe in 2020: Big Data, Bigger Digital Shadows, and Biggest Growth in the Far East”, IDC, sponsored by EMC, December 2012
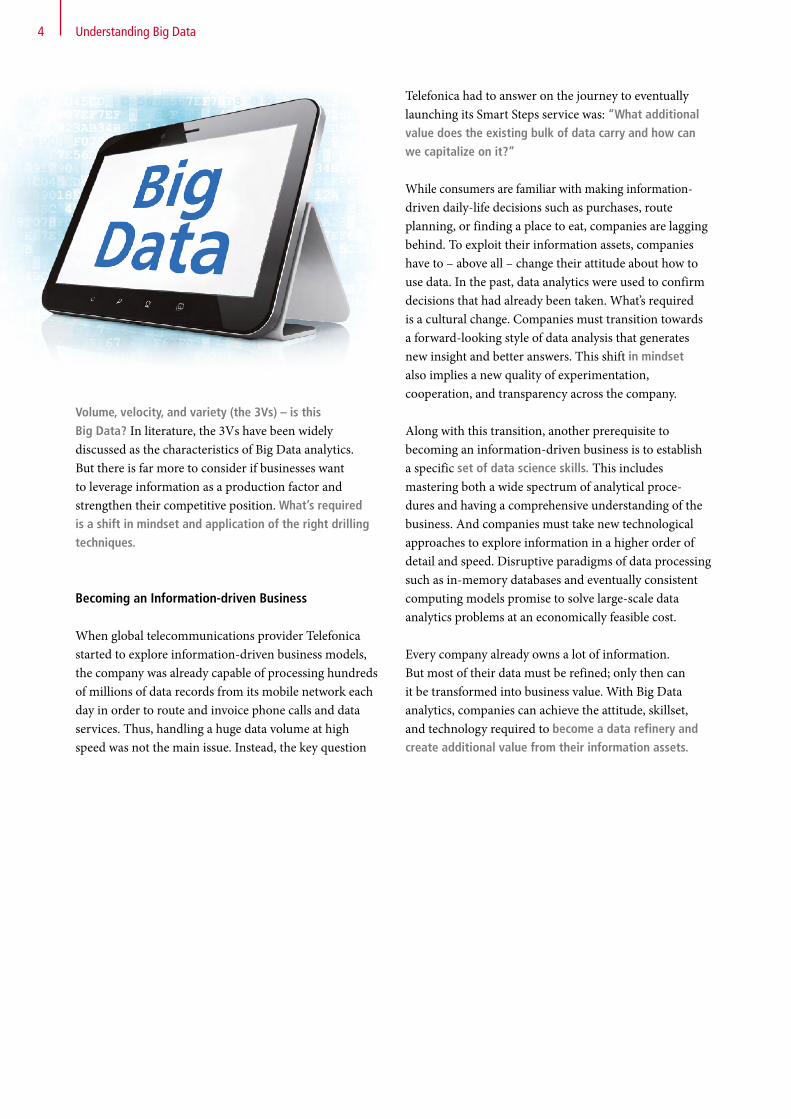
4
Volume, velocity, and variety (the 3Vs) – is this Big Data? In literature, the 3Vs have been widely discussed as the characteristics of Big Data analytics. But there is far more to consider if businesses want to leverage information as a production factor and strengthen their competitive position. What’s required is a shift in mindset and application of the right drilling techniques.
Becoming an Information-driven Business
When global telecommunications provider Telefonica started to explore information-driven business models, the company was already capable of processing hundreds of millions of data records from its mobile network each day in order to route and invoice phone calls and data services. Thus, handling a huge data volume at high speed was not the main issue. Instead, the key question
Telefonica had to answer on the journey to eventually launching its Smart Steps service was: “What additional value does the existing bulk of data carry and how can we capitalize on it?”
While consumers are familiar with making information- driven daily-life decisions such as purchases, route planning, or finding a place to eat, companies are lagging behind. To exploit their information assets, companies have to – above all – change their attitude about how to use data. In the past, data analytics were used to confirm decisions that had already been taken. What’s required is a cultural change. Companies must transition towards a forward-looking style of data analysis that generates new insight and better answers. This shift in mindset also implies a new quality of experimentation, cooperation, and transparency across the company.
Along with this transition, another prerequisite to becoming an information-driven business is to establish a specific set of data science skills. This includes mastering both a wide spectrum of analytical proce- dures and having a comprehensive understanding of the business. And companies must take new technological approaches to explore information in a higher order of detail and speed. Disruptive paradigms of data processing such as in-memory databases and eventually consistent computing models promise to solve large-scale data analytics problems at an economically feasible cost.
Every company already owns a lot of information. But most of their data must be refined; only then can it be transformed into business value. With Big Data analytics, companies can achieve the attitude, skillset, and technology required to become a data refinery and create additional value from their information assets.
Understanding Big Data
5
Logistics and Big Data are a Perfect Match
The logistics sector is ideally placed to benefit from the technological and methodological advancements of Big Data. A strong hint that data mastery has always been key to the discipline is that, in its ancient Greek roots, logistics means “practical arithmetic”.3 Today logistics providers manage a massive flow of goods and at the same time create vast data sets. For millions of shipments every day, origin and destination, size, weight, content, and location are all tracked across global delivery networks. But does this data tracking fully exploit value? Probably not.
Most likely there is huge untapped potential for improving operational efficiency and customer experience, and creating useful new business models. Consider, for example, the benefits of integrating supply
chain data streams from multiple logistics providers; this could eliminate current market fragmentation, enabling powerful new collaboration and services.
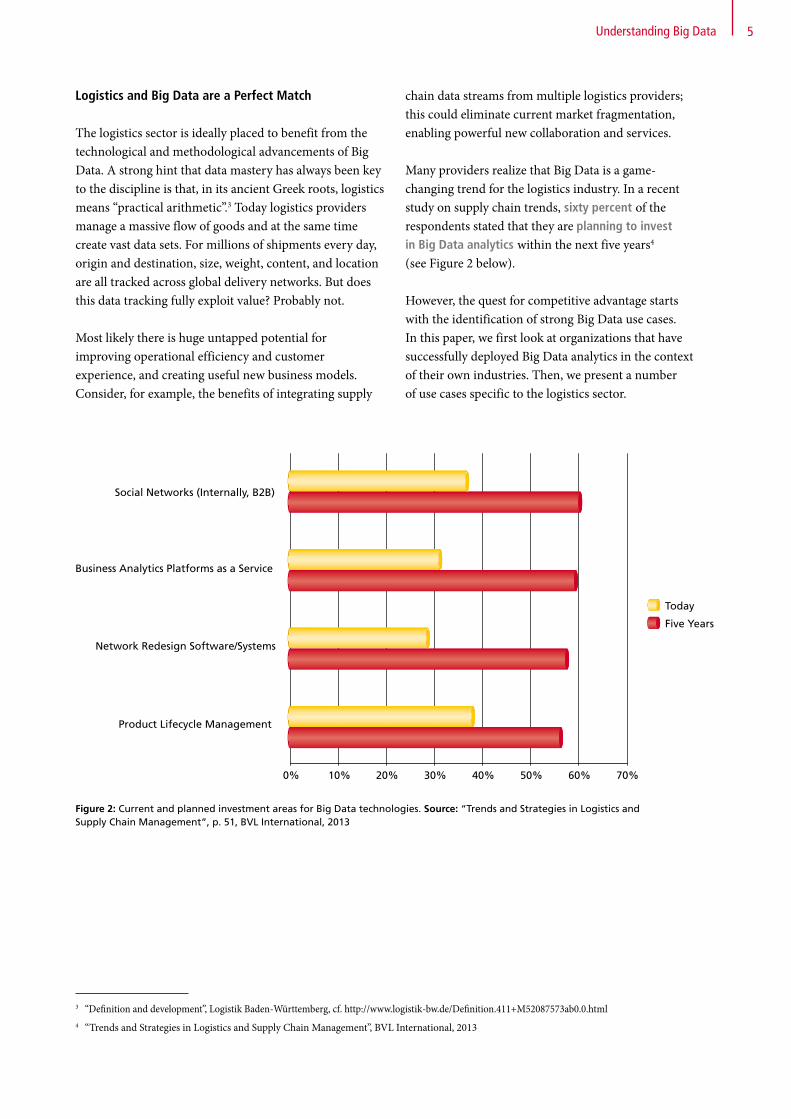
Many providers realize that Big Data is a game- changing trend for the logistics industry. In a recent study on supply chain trends, sixty percent of the respondents stated that they are planning to invest in Big Data analytics within the next five years4 (see Figure 2 below).
However, the quest for competitive advantage starts with the identification of strong Big Data use cases. In this paper, we first look at organizations that have successfully deployed Big Data analytics in the context of their own industries. Then, we present a number of use cases specific to the logistics sector.
Social Networks (Internally, B2B)
Today
Five Years
0% 10% 20% 30% 40% 50% 60% 70%
Business Analytics Platforms as a Service
Network Redesign Software/Systems
Product Lifecycle Management
Figure 2: Current and planned investment areas for Big Data technologies. Source: “Trends and Strategies in Logistics and Supply Chain Management”, p. 51, BVL International, 2013
3 “Definition and development”, Logistik Baden-Württemberg, cf. http://www.logistik-bw.de/Definition.411+M52087573ab0.0.html4 “Trends and Strategies in Logistics and Supply Chain Management”, BVL International, 2013
Understanding Big Data
6
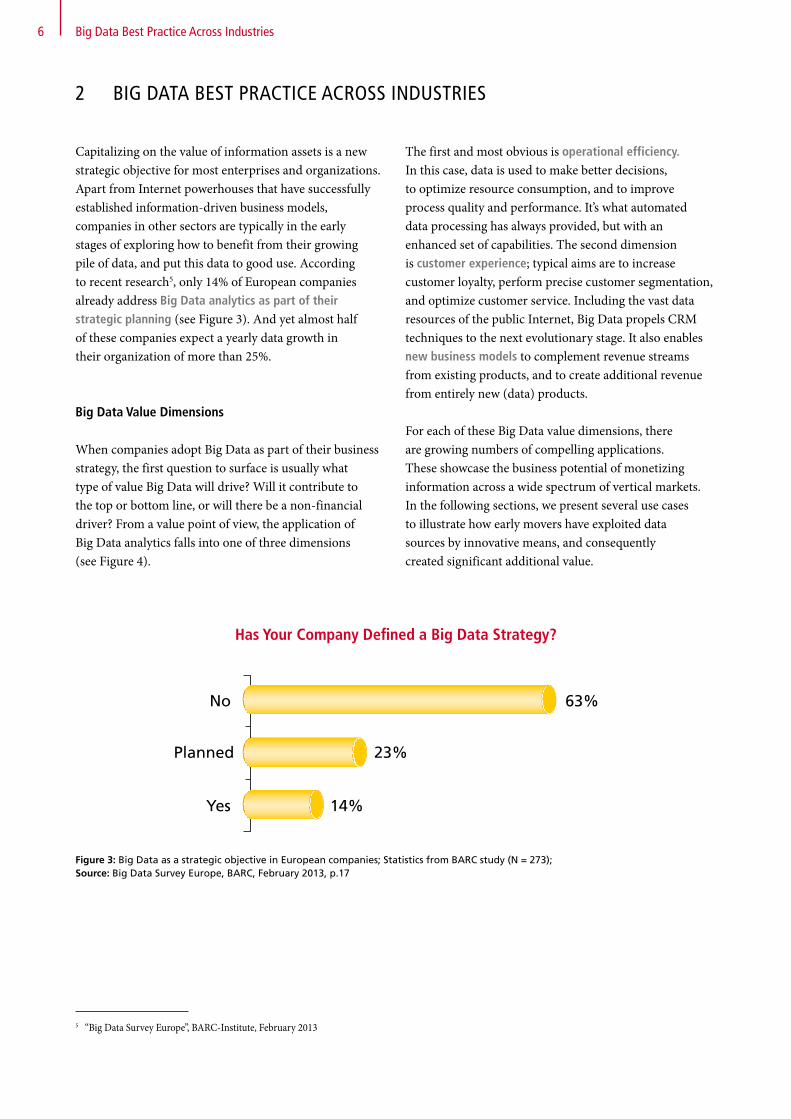
Capitalizing on the value of information assets is a new strategic objective for most enterprises and organizations. Apart from Internet powerhouses that have successfully established information-driven business models, companies in other sectors are typically in the early stages of exploring how to benefit from their growing pile of data, and put this data to good use. According to recent research5, only 14% of European companies already address Big Data analytics as part of their strategic planning (see Figure 3). And yet almost half of these companies expect a yearly data growth in their organization of more than 25%.
Big Data Value Dimensions
When companies adopt Big Data as part of their business strategy, the first question to surface is usually what type of value Big Data will drive? Will it contribute to the top or bottom line, or will there be a non-financial driver? From a value point of view, the application of Big Data analytics falls into one of three dimensions (see Figure 4).
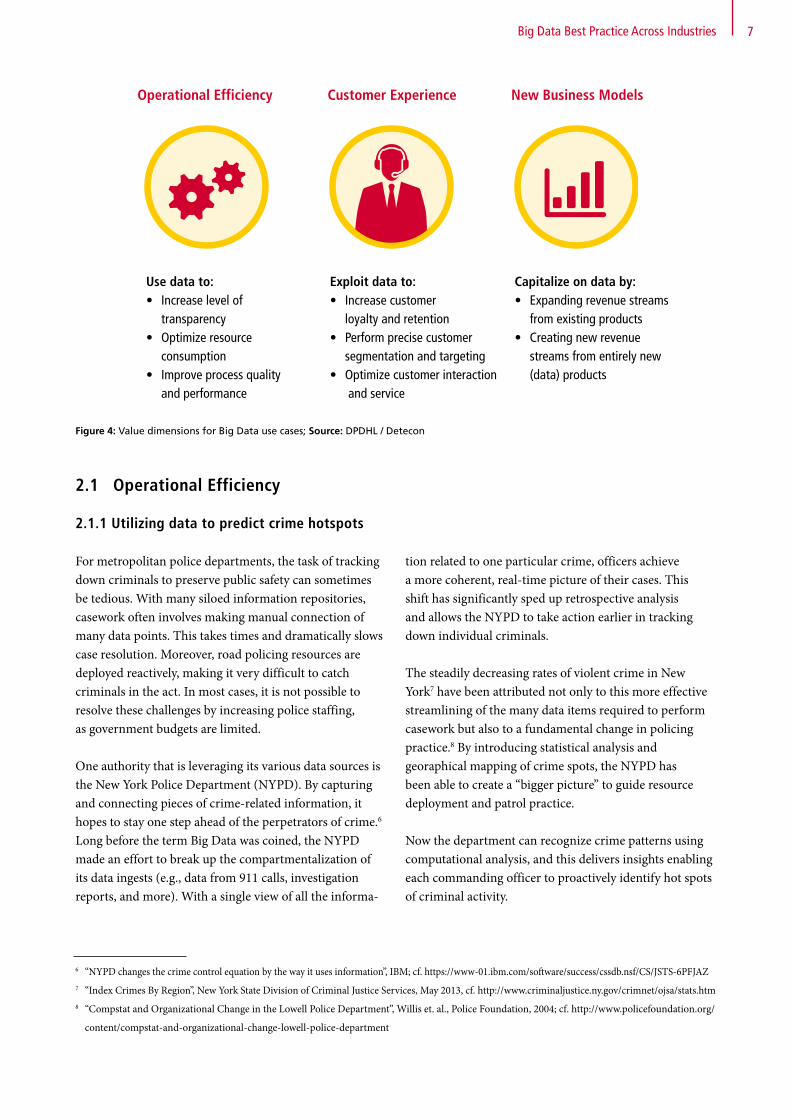
The first and most obvious is operational efficiency. In this case, data is used to make better decisions, to optimize resource consumption, and to improve process quality and performance. It’s what automated data processing has always provided, but with an enhanced set of capabilities. The second dimension is customer experience; typical aims are to increase customer loyalty, perform precise customer segmentation, and optimize customer service. Including the vast data resources of the public Internet, Big Data propels CRM techniques to the next evolutionary stage. It also enables new business models to complement revenue streams from existing products, and to create additional revenue from entirely new (data) products.
For each of these Big Data value dimensions, there are growing numbers of compelling applications. These showcase the business potential of monetizing information across a wide spectrum of vertical markets. In the following sections, we present several use cases to illustrate how early movers have exploited data sources by innovative means, and consequently created significant additional value.
2 BIG DATA BEST PRACTICE ACROSS INDUSTRIES
5 “Big Data Survey Europe”, BARC-Institute, February 2013
Big Data Best Practice Across Industries
Figure 3: Big Data as a strategic objective in European companies; Statistics from BARC study (N = 273); Source: Big Data Survey Europe, BARC, February 2013, p.17
No
Has Your Company De�ned a Big Data Strategy?
Planned
Yes
23%
63%
14%
Has Your Company Defined a Big Data Strategy?
7Big Data Best Practice Across Industries
Usage of data in order to:
Increase Level of TransparencyOptimize ResourceConsumption Improve Process Qualityand Performance
Increase customersloyalty and retentionPerforming precisecustomer segmentationand targetingOptimize customerinteraction and service
Expanding revenuestreams from existingproductsCreating new revenuestreams from entirelynew (data) products
Exploit data for: Capitalize on data by:
New Business Models
Customer Experience
OperationalEf�ciency
Use data to: • Increase level of
transparency• Optimize resource
consumption • Improve process quality
and performance
Exploit data to: • Increase customer
loyalty and retention• Perform precise customer
segmentation and targeting • Optimize customer interaction
and service
Capitalize on data by: • Expanding revenue streams
from existing products • Creating new revenue
streams from entirely new (data) products
New Business ModelsCustomer ExperienceOperational Efficiency
Figure 4: Value dimensions for Big Data use cases; Source: DPDHL / Detecon
2.1 Operational Efficiency
For metropolitan police departments, the task of tracking down criminals to preserve public safety can sometimes be tedious. With many siloed information repositories, casework often involves making manual connection of many data points. This takes times and dramatically slows case resolution. Moreover, road policing resources are deployed reactively, making it very difficult to catch criminals in the act. In most cases, it is not possible to resolve these challenges by increasing police staffing, as government budgets are limited.
One authority that is leveraging its various data sources is the New York Police Department (NYPD). By capturing and connecting pieces of crime-related information, it hopes to stay one step ahead of the perpetrators of crime.6 Long before the term Big Data was coined, the NYPD made an effort to break up the compartmentalization of its data ingests (e.g., data from 911 calls, investigation reports, and more). With a single view of all the informa-
tion related to one particular crime, officers achieve a more coherent, real-time picture of their cases. This shift has significantly sped up retrospective analysis and allows the NYPD to take action earlier in tracking down individual criminals.
The steadily decreasing rates of violent crime in New York7 have been attributed not only to this more effective streamlining of the many data items required to perform casework but also to a fundamental change in policing practice.8 By introducing statistical analysis and georaphical mapping of crime spots, the NYPD has been able to create a “bigger picture” to guide resource deployment and patrol practice.
Now the department can recognize crime patterns using computational analysis, and this delivers insights enabling each commanding officer to proactively identify hot spots of criminal activity.
6 “NYPD changes the crime control equation by the way it uses information”, IBM; cf. https://www-01.ibm.com/software/success/cssdb.nsf/CS/JSTS-6PFJAZ7 “Index Crimes By Region”, New York State Division of Criminal Justice Services, May 2013, cf. http://www.criminaljustice.ny.gov/crimnet/ojsa/stats.htm8 “Compstat and Organizational Change in the Lowell Police Department”, Willis et. al., Police Foundation, 2004; cf. http://www.policefoundation.org/
content/compstat-and-organizational-change-lowell-police-department
2.1.1 Utilizing data to predict crime hotspots
8
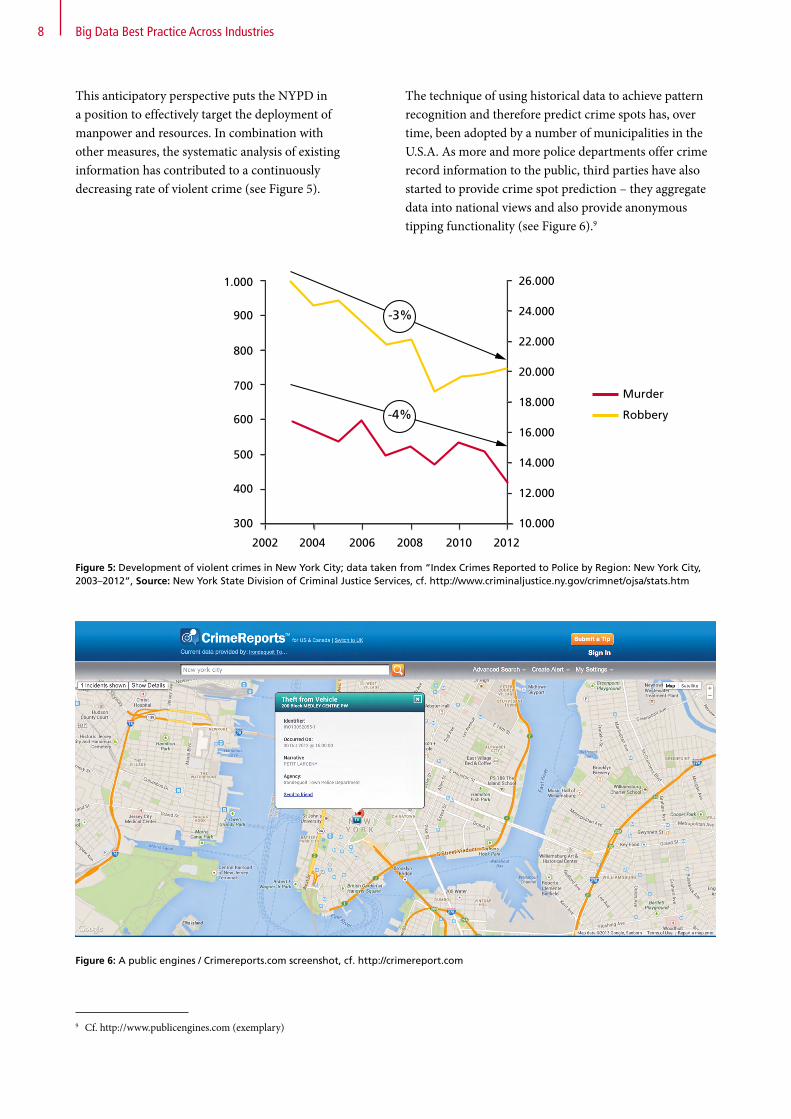
This anticipatory perspective puts the NYPD in a position to effectively target the deployment of manpower and resources. In combination with other measures, the systematic analysis of existing information has contributed to a continuously decreasing rate of violent crime (see Figure 5).
The technique of using historical data to achieve pattern recognition and therefore predict crime spots has, over time, been adopted by a number of municipalities in the U.S.A. As more and more police departments offer crime record information to the public, third parties have also started to provide crime spot prediction – they aggregate data into national views and also provide anonymous tipping functionality (see Figure 6).9
Big Data Best Practice Across Industries
9 Cf. http://www.publicengines.com (exemplary)
-3%
-4%
26.0001.000
900
800
700
600
500
400
300
2002 2004 2006 2008 2010 2012
Murder
Robbery
24.000
22.000
20.000
18.000
16.000
14.000
12.000
10.000
Figure 5: Development of violent crimes in New York City; data taken from “Index Crimes Reported to Police by Region: New York City, 2003–2012”, Source: New York State Division of Criminal Justice Services, cf. http://www.criminaljustice.ny.gov/crimnet/ojsa/stats.htm
Figure 6: A public engines / Crimereports.com screenshot, cf. http://crimereport.com

9Big Data Best Practice Across Industries
2.1.2 Optimal shift planning in retail stores
For retail store managers, planning shifts to meet customer demand is a sensitive task. Overstaffing the store creates unnecessary expense and lowers site profitability. Running the store with a low staff level negatively impacts customer and employee satisfaction. Both are bad for business.
At DM drugstores, the shift planning task was historically performed by the store manager based on simple extra- polations and personal experience. For regular business days, this process was good enough. But with an increasing number of exceptions, it became unsatisfactory. Over- head or shortfall of personnel limited store performance. So DM determined to effectively assist store managers in their personnel forward planning by finding ways to reliably forecast demand at each particular point of sale.10
The approach was to implement a long-term prediction of daily store revenues, taking into account a wide range of individual and local parameters. Input data to a new algorithm included historical revenue data, opening hours, and the arrival times of new goods from the distribution centers. On top of this, other data was ingested to achieve the highest level of precision. This data included local circumstances such as market days, holidays in neighboring locations, road diversions, and – in future – weather forecast data (as weather conditions significantlyimpact consumer behavior). DM evaluated different
10 “Business Intelligence Guide 2012/2013”, isreport, isi Medien München, or cf. http://www.blue-yonder.com/en/dm-drogerie-markt-en.html
predictive algorithms, and the selected solution now provides such accurate projections that it has proved to be a powerful support for shift planning.
Based on the high-resolution prediction of daily sales for each individual store, employees can now enter their personal preferences into the shift schedule four to eight weeks in advance. Once approved, their shifts are unlikely to change; they can rely on the long-term plan, and a last-minute change is an exceptional event. This shows how applying predictive analytics at DM is increasing in-store operational efficiency and, at the same time, is contributing to a better work-life balance for store personnel.
10 Big Data Best Practice Across Industries
To gain insight into customer satisfaction and future demand, companies use a number of different business models. The conventional approach is to undertake market research on the customer base, but this creates a generalized view without focus on individual consumer needs and behaviors.
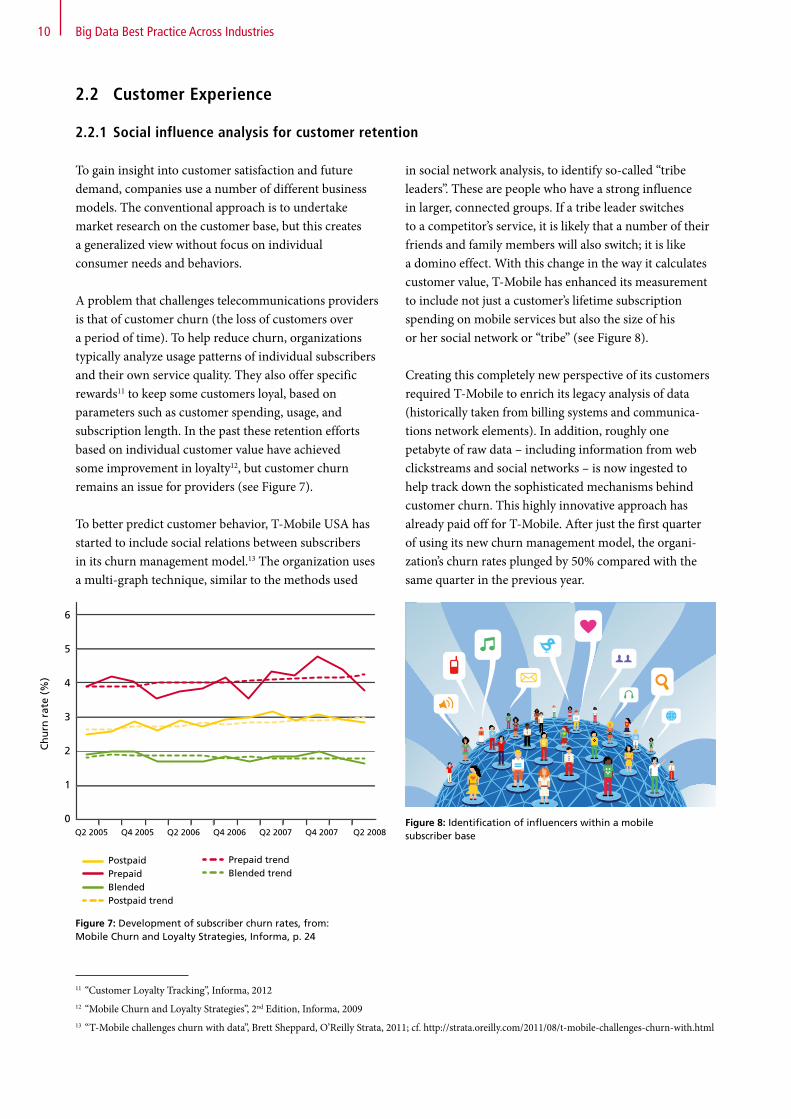
A problem that challenges telecommunications providers is that of customer churn (the loss of customers over a period of time). To help reduce churn, organizations typically analyze usage patterns of individual subscribers and their own service quality. They also offer specific rewards11 to keep some customers loyal, based on parameters such as customer spending, usage, and subscription length. In the past these retention efforts based on individual customer value have achieved some improvement in loyalty12, but customer churn remains an issue for providers (see Figure 7).
To better predict customer behavior, T-Mobile USA has started to include social relations between subscribers in its churn management model.13 The organization uses a multi-graph technique, similar to the methods used
in social network analysis, to identify so-called “tribe leaders”. These are people who have a strong influence in larger, connected groups. If a tribe leader switches to a competitor’s service, it is likely that a number of their friends and family members will also switch; it is like a domino effect. With this change in the way it calculates customer value, T-Mobile has enhanced its measurement to include not just a customer’s lifetime subscription spending on mobile services but also the size of his or her social network or “tribe” (see Figure 8).
Creating this completely new perspective of its customers required T-Mobile to enrich its legacy analysis of data (historically taken from billing systems and communica- tions network elements). In addition, roughly one petabyte of raw data – including information from web clickstreams and social networks – is now ingested to help track down the sophisticated mechanisms behind customer churn. This highly innovative approach has already paid off for T-Mobile. After just the first quarter of using its new churn management model, the organi- zation’s churn rates plunged by 50% compared with the same quarter in the previous year.
2.2 Customer Experience
2.2.1 Social influence analysis for customer retention
11 “Customer Loyalty Tracking”, Informa, 2012 12 “Mobile Churn and Loyalty Strategies”, 2nd Edition, Informa, 200913 “T-Mobile challenges churn with data”, Brett Sheppard, O’Reilly Strata, 2011; cf. http://strata.oreilly.com/2011/08/t-mobile-challenges-churn-with.html
Q2 2005
Ch
urn
rat
e (%
)
PostpaidPrepaidBlendedPostpaid trendPrepaid trendBlended trend
0
1
2
3
4
5
6
Q4 2005 Q2 2006 Q4 2006 Q2 2007 Q4 2007 Q2 2008
Figure 7: Development of subscriber churn rates, from: Mobile Churn and Loyalty Strategies, Informa, p. 24
Q2 2005
Ch
urn
rat
e (%
)
PostpaidPrepaidBlendedPostpaid trendPrepaid trendBlended trend
0
1
2
3
4
5
6
Q4 2005 Q2 2006 Q4 2006 Q2 2007 Q4 2007 Q2 2008
Figure 8: Identification of influencers within a mobile subscriber base
Q2 2005
Ch
urn
rat
e (%
)
PostpaidPrepaidBlendedPostpaid trendPrepaid trendBlended trend
0
1
2
3
4
5
6
Q4 2005 Q2 2006 Q4 2006 Q2 2007 Q4 2007 Q2 2008
11Big Data Best Practice Across Industries
2.2.2 Avoiding “out of stock” conditions for customer satisfaction
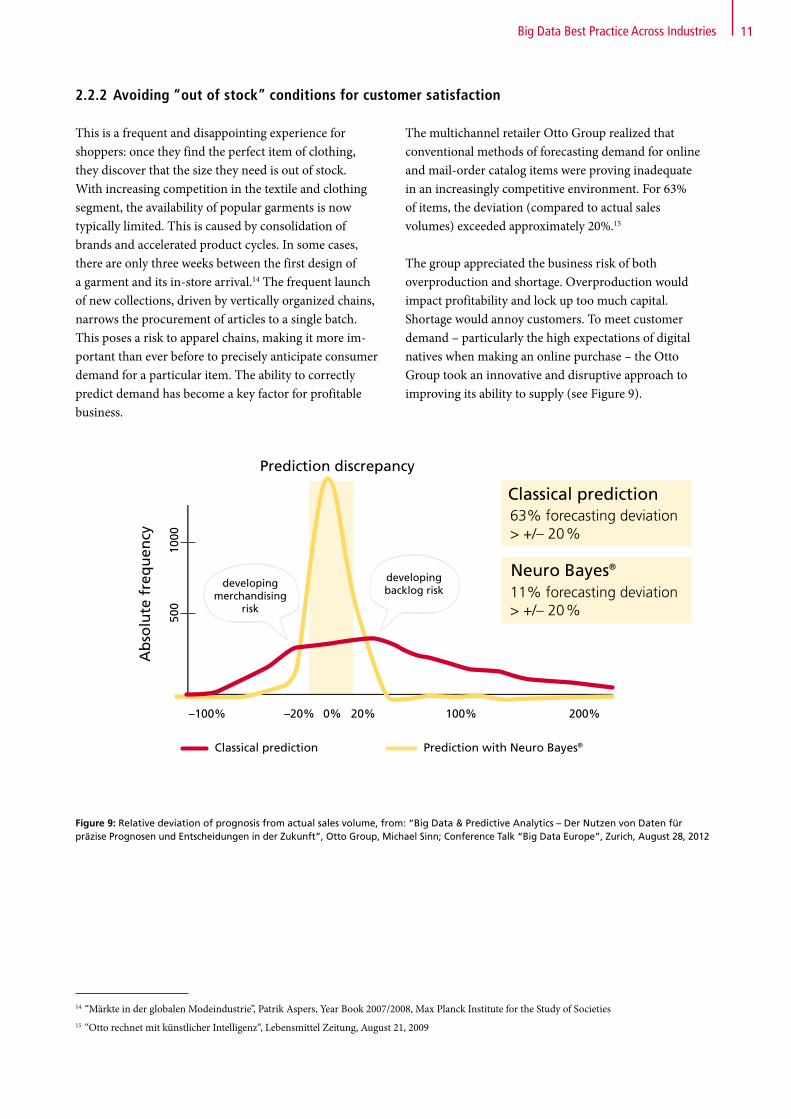
This is a frequent and disappointing experience for shoppers: once they find the perfect item of clothing, they discover that the size they need is out of stock. With increasing competition in the textile and clothing segment, the availability of popular garments is now typically limited. This is caused by consolidation of brands and accelerated product cycles. In some cases, there are only three weeks between the first design of a garment and its in-store arrival.14 The frequent launch of new collections, driven by vertically organized chains, narrows the procurement of articles to a single batch. This poses a risk to apparel chains, making it more im-portant than ever before to precisely anticipate consumer demand for a particular item. The ability to correctly predict demand has become a key factor for profitable business.
14 “Märkte in der globalen Modeindustrie”, Patrik Aspers, Year Book 2007/2008, Max Planck Institute for the Study of Societies 15 “Otto rechnet mit künstlicher Intelligenz“, Lebensmittel Zeitung, August 21, 2009
The multichannel retailer Otto Group realized that conventional methods of forecasting demand for online and mail-order catalog items were proving inadequate in an increasingly competitive environment. For 63% of items, the deviation (compared to actual sales volumes) exceeded approximately 20%.15
The group appreciated the business risk of both overproduction and shortage. Overproduction would impact profitability and lock up too much capital. Shortage would annoy customers. To meet customer demand – particularly the high expectations of digital natives when making an online purchase – the Otto Group took an innovative and disruptive approach to improving its ability to supply (see Figure 9).
Figure 9: Relative deviation of prognosis from actual sales volume, from: “Big Data & Predictive Analytics – Der Nutzen von Daten für präzise Prognosen und Entscheidungen in der Zukunft”, Otto Group, Michael Sinn; Conference Talk “Big Data Europe”, Zurich, August 28, 2012
–100% –20% 20% 100% 200%0%
Classical prediction Prediction with Neuro Bayes®
developingmerchandising
risk
Ab
solu
te f
req
uen
cy
developingbacklog risk
63% forecasting deviation> +/– 20%
11% forecasting deviation> +/– 20%
Classical prediction
Neuro Bayes®
500
1000
Prediction discrepancy
12 Big Data Best Practice Across Industries
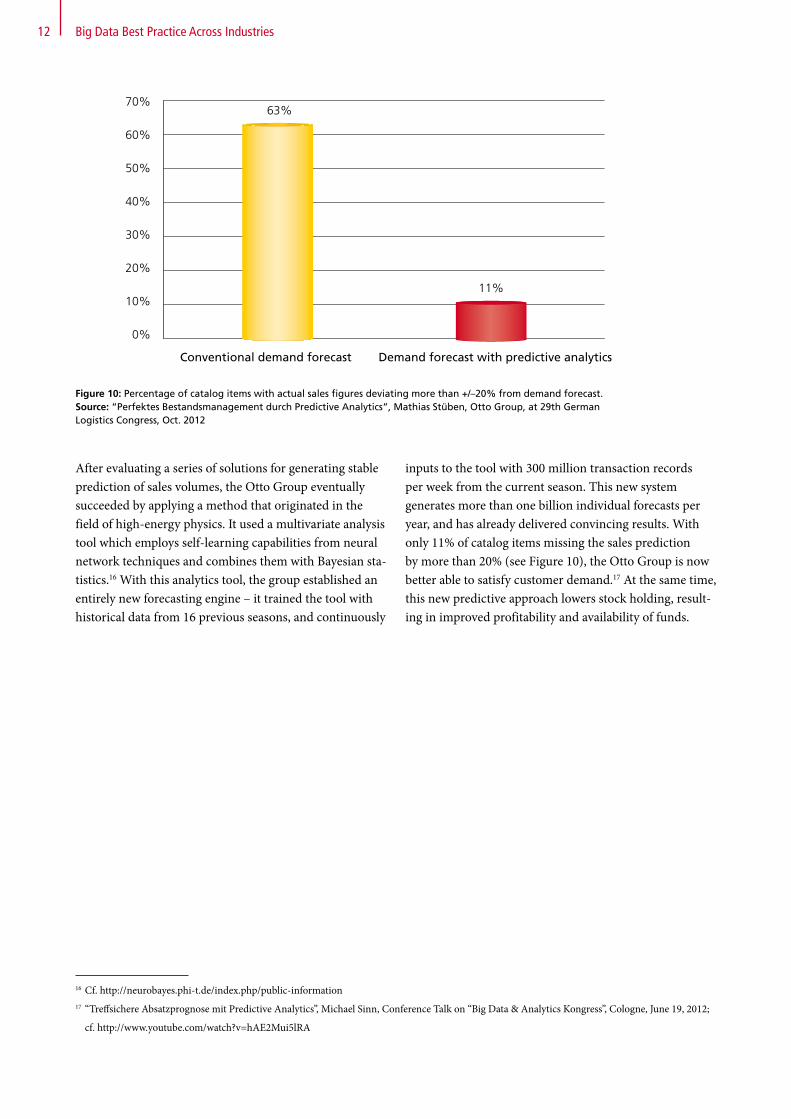
After evaluating a series of solutions for generating stable prediction of sales volumes, the Otto Group eventually succeeded by applying a method that originated in the field of high-energy physics. It used a multivariate analysis tool which employs self-learning capabilities from neural network techniques and combines them with Bayesian sta-tistics.16 With this analytics tool, the group established an entirely new forecasting engine – it trained the tool with historical data from 16 previous seasons, and continuously
inputs to the tool with 300 million transaction records per week from the current season. This new system generates more than one billion individual forecasts per year, and has already delivered convincing results. With only 11% of catalog items missing the sales prediction by more than 20% (see Figure 10), the Otto Group is now better able to satisfy customer demand.17 At the same time, this new predictive approach lowers stock holding, result- ing in improved profitability and availability of funds.
Conventional demand forecast Demand forecast with predictive analytics
0%
10%
20%
30%
40%
50%
60%
70%63%
11%
Figure 10: Percentage of catalog items with actual sales figures deviating more than +/–20% from demand forecast. Source: “Perfektes Bestandsmanagement durch Predictive Analytics”, Mathias Stüben, Otto Group, at 29th German Logistics Congress, Oct. 2012
16 Cf. http://neurobayes.phi-t.de/index.php/public-information 17 “Treffsichere Absatzprognose mit Predictive Analytics”, Michael Sinn, Conference Talk on “Big Data & Analytics Kongress”, Cologne, June 19, 2012;
cf. http://www.youtube.com/watch?v=hAE2Mui5lRA
13Big Data Best Practice Across Industries
2.3 New Business Models
2.3.1 Crowd analytics deliver retail and advertising insights
To provide effective mobile voice and data services, network operators must continuously capture a set of data on every subscriber. Apart from recording the usage of mobile services (for accounting and billing purposes), operators must also record each subscriber’s location so it can direct calls and data streams to the cell tower to which the subscriber’s handset is connected. This is how every subscriber creates a digital trail as they move around the provider network. And in most countries it is just a small group of network operators that have captured most of the population as customers – their combined digital trails of the subscriber base provide a comprehensive reflection of society or, more precisely, of how society moves.
In the past, organizations could only make internal use of location and usage data from mobile networks. This is because of privacy laws that limit the exploitation of individual subscriber information. But once subscriber identity has been split from the movement data, substantial business value remains in this anonymous crowd data, as Telefonica has discovered.
In urban areas, the density of digital trails is sufficiently high to correlate the collective behavior of the subscriber crowd with characteristics of a particular location or area.
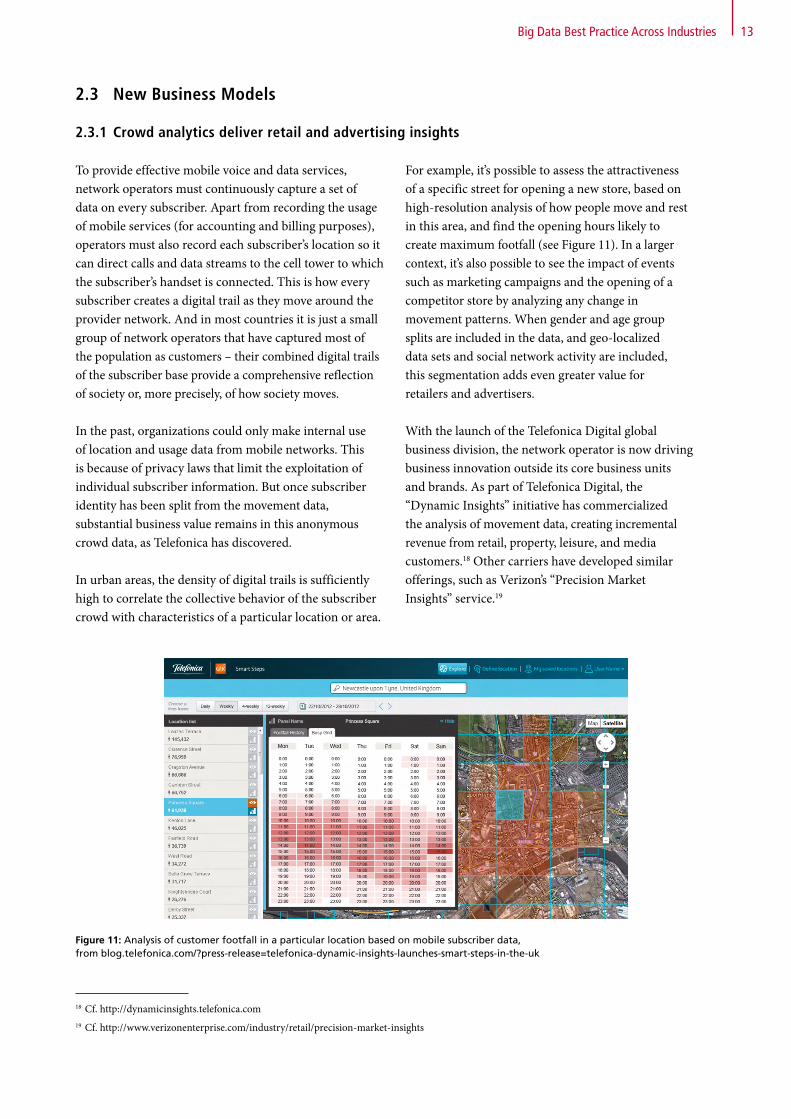
For example, it’s possible to assess the attractiveness of a specific street for opening a new store, based on high-resolution analysis of how people move and rest in this area, and find the opening hours likely to create maximum footfall (see Figure 11). In a larger context, it’s also possible to see the impact of events such as marketing campaigns and the opening of a competitor store by analyzing any change in movement patterns. When gender and age group splits are included in the data, and geo-localized data sets and social network activity are included, this segmentation adds even greater value for retailers and advertisers.
With the launch of the Telefonica Digital global business division, the network operator is now driving business innovation outside its core business units and brands. As part of Telefonica Digital, the “Dynamic Insights” initiative has commercialized the analysis of movement data, creating incremental revenue from retail, property, leisure, and media customers.18 Other carriers have developed similar offerings, such as Verizon’s “Precision Market Insights” service.19
Figure 11: Analysis of customer footfall in a particular location based on mobile subscriber data, from blog.telefonica.com/?press-release=telefonica-dynamic-insights-launches-smart-steps-in-the-uk
18 Cf. http://dynamicinsights.telefonica.com19 Cf. http://www.verizonenterprise.com/industry/retail/precision-market-insights
14 Big Data Best Practice Across Industries
2.3.2 Creating new insurance products from geo-localized data
Climate sensitivity is a characteristic of the agriculture industry, as local temperatures, sunshine hours, and precipitation levels directly impact crop yield. With the increasing occurrence of extreme weather conditions due to global warming, climate variation has become a substantial risk for farmers.20 To mitigate the impact of crop shortfalls, farmers take out insurance policies to cover their potential financial losses. Insurance companies in turn are challenged with increasingly unpredictable local weather extremes. On the one hand, the conventional risk models based on historical data are no longer suitable to anticipate future insured loss.21 On the other hand, claims have to be controlled more accurately as damages may vary across an affected region. For farmers, the combination of these two aspects results in higher insurance rates and slower payout of damage claims.
In the United States, most private insurance companies viewed crop production as too risky to insure without
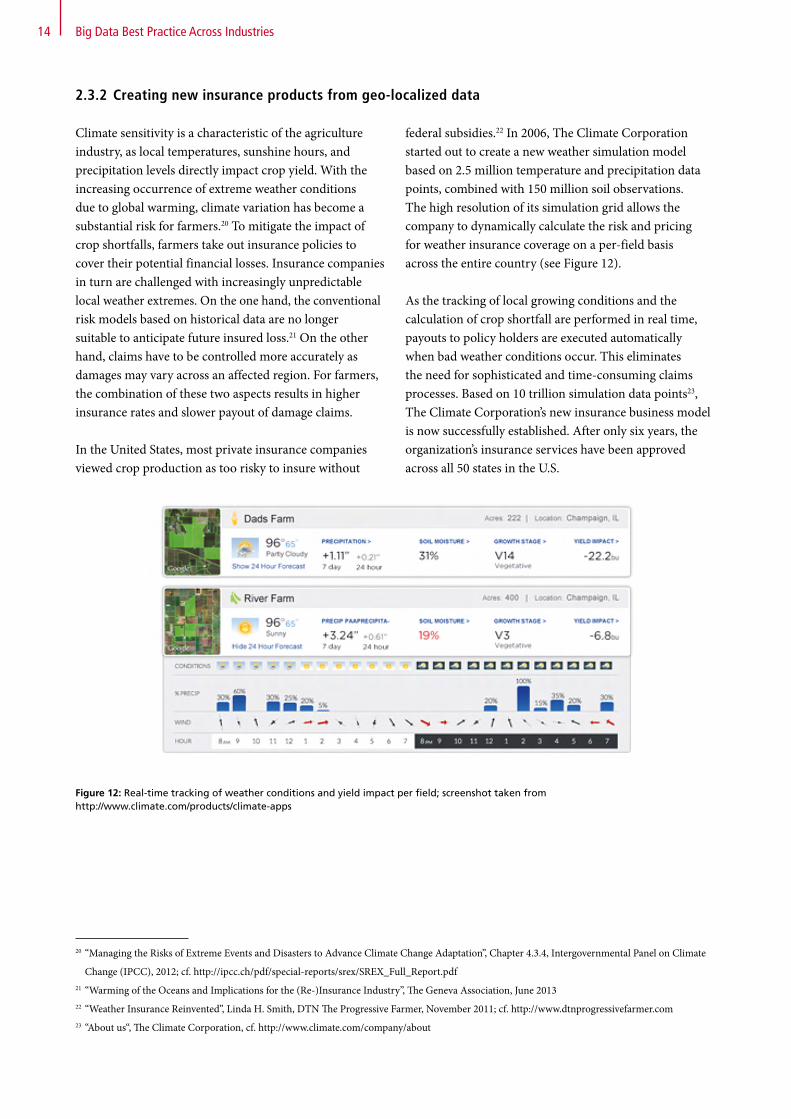
federal subsidies.22 In 2006, The Climate Corporation started out to create a new weather simulation model based on 2.5 million temperature and precipitation data points, combined with 150 million soil observations. The high resolution of its simulation grid allows the company to dynamically calculate the risk and pricing for weather insurance coverage on a per-field basis across the entire country (see Figure 12).
As the tracking of local growing conditions and the calculation of crop shortfall are performed in real time, payouts to policy holders are executed automatically when bad weather conditions occur. This eliminates the need for sophisticated and time-consuming claims processes. Based on 10 trillion simulation data points23, The Climate Corporation’s new insurance business model is now successfully established. After only six years, the organization’s insurance services have been approved across all 50 states in the U.S.
20 “Managing the Risks of Extreme Events and Disasters to Advance Climate Change Adaptation”, Chapter 4.3.4, Intergovernmental Panel on Climate
Change (IPCC), 2012; cf. http://ipcc.ch/pdf/special-reports/srex/SREX_Full_Report.pdf21 “Warming of the Oceans and Implications for the (Re-)Insurance Industry”, The Geneva Association, June 201322 “Weather Insurance Reinvented”, Linda H. Smith, DTN The Progressive Farmer, November 2011; cf. http://www.dtnprogressivefarmer.com23 “About us“, The Climate Corporation, cf. http://www.climate.com/company/about
Figure 12: Real-time tracking of weather conditions and yield impact per field; screenshot taken from http://www.climate.com/products/climate-apps
15Big Data in Logistics
Companies are learning to turn large-scale quantities of data into competitive advantage. Their precise forecasting of market demand, radical customization of services, and entirely new business models demonstrate exploitation of their previously untapped data.
As today’s best practices touch many vertical markets, it is reasonable to predict that Big Data will also become a disruptive trend in the logistics industry. However, the application of Big Data analytics is not immediately obvious in this sector. The particularities of the logistics business must be thoroughly examined first in order to discover valuable use cases.
3 BIG DATA IN LOGISTICS
3.1 Logistics as a Data-driven Business
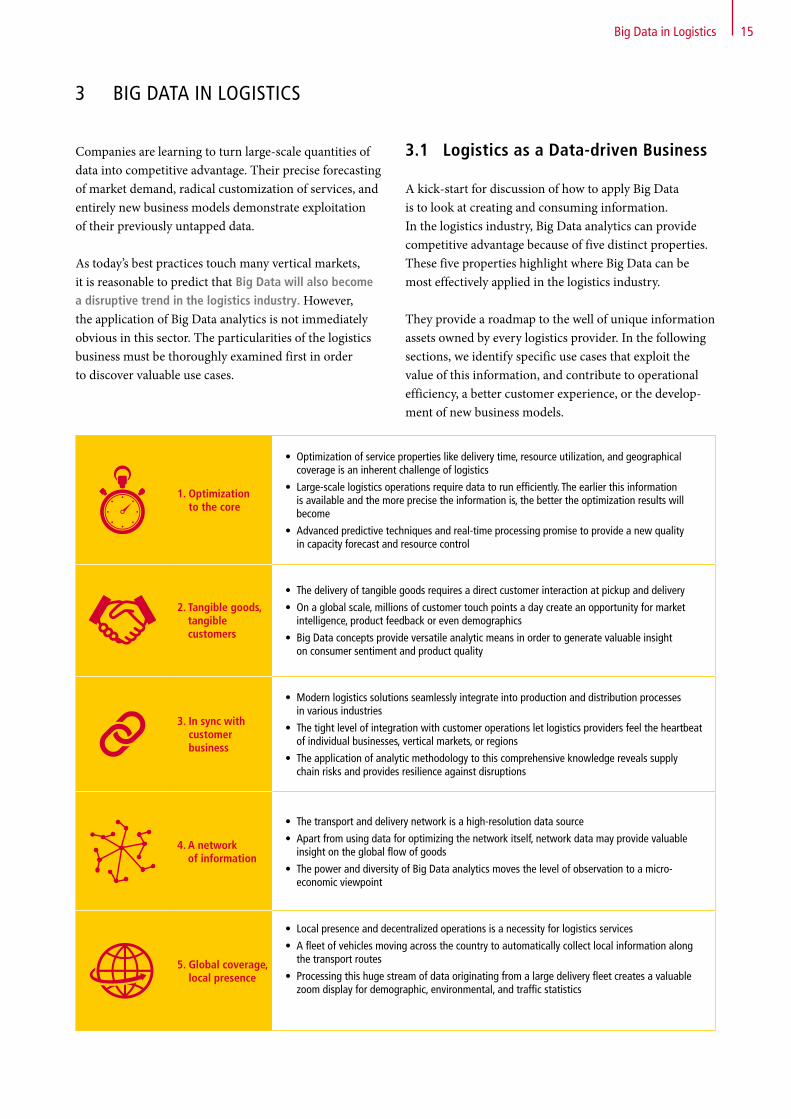
A kick-start for discussion of how to apply Big Data is to look at creating and consuming information. In the logistics industry, Big Data analytics can provide competitive advantage because of five distinct properties. These five properties highlight where Big Data can be most effectively applied in the logistics industry.
They provide a roadmap to the well of unique information assets owned by every logistics provider. In the following sections, we identify specific use cases that exploit the value of this information, and contribute to operational efficiency, a better customer experience, or the develop-ment of new business models.
1. Optimization to the core
• Optimization of service properties like delivery time, resource utilization, and geographical coverage is an inherent challenge of logistics
• Large-scale logistics operations require data to run efficiently. The earlier this information is available and the more precise the information is, the better the optimization results will become
• Advanced predictive techniques and real-time processing promise to provide a new quality in capacity forecast and resource control
2. Tangible goods, tangible customers
• The delivery of tangible goods requires a direct customer interaction at pickup and delivery
• On a global scale, millions of customer touch points a day create an opportunity for market intelligence, product feedback or even demographics
• Big Data concepts provide versatile analytic means in order to generate valuable insight on consumer sentiment and product quality
3. In sync with customer business
• Modern logistics solutions seamlessly integrate into production and distribution processes in various industries
• The tight level of integration with customer operations let logistics providers feel the heartbeat of individual businesses, vertical markets, or regions
• The application of analytic methodology to this comprehensive knowledge reveals supply chain risks and provides resilience against disruptions
4. A network of information
• The transport and delivery network is a high-resolution data source
• Apart from using data for optimizing the network itself, network data may provide valuable insight on the global flow of goods
• The power and diversity of Big Data analytics moves the level of observation to a micro- economic viewpoint
5. Global coverage, local presence
• Local presence and decentralized operations is a necessity for logistics services
• A fleet of vehicles moving across the country to automatically collect local information along the transport routes
• Processing this huge stream of data originating from a large delivery fleet creates a valuable zoom display for demographic, environmental, and traffic statistics
1716
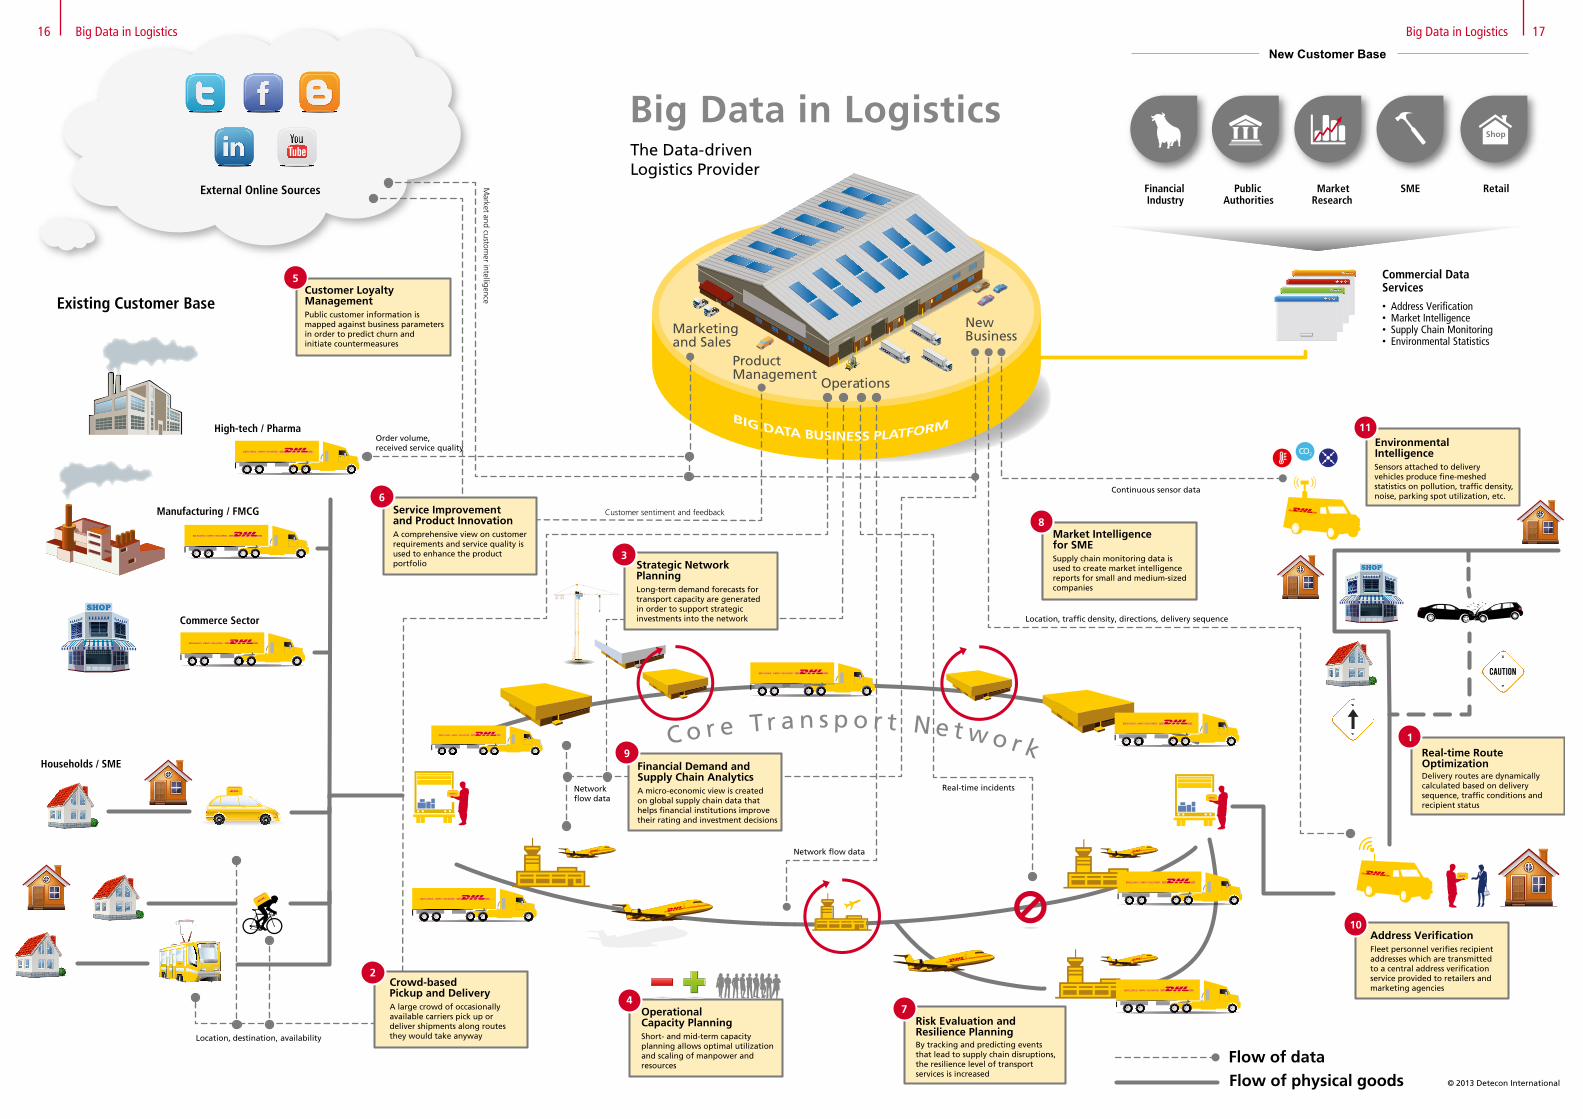
The Data-driven Logistics Provider
NewBusiness
Operations
Product Management
Marketingand Sales
10
1
Environmental Intelligence
Real-time Route Optimization
Address Veri�cation
11
4
External Online Sources FinancialIndustry
PublicAuthorities
Market Research
SME Retail
New Customer Base
Existing Customer Base
7
8
High-tech / Pharma
Commerce Sector
Households / SME
Manufacturing / FMCG
Commercial DataServices
• Address Veri�cation• Market Intelligence• Supply Chain Monitoring• Environmental Statistics
Continuous sensor data
Location, traf�c density, directions, delivery sequence
Real-time incidents
Customer sentiment and feedback
6
Order volume, received service quality
Market and custom
er intelligence
3
2
Location, destination, availability
Network �ow data
Network �ow data
Big Data in Logistics
© 2013 Detecon International
Sensors attached to delivery vehicles produce �ne-meshed statistics on pollution, traf�c density, noise, parking spot utilization, etc.
Delivery routes are dynamically calculated based on delivery sequence, traf�c conditions and recipient status
Fleet personnel veri�es recipient addresses which are transmitted to a central address veri�cation service provided to retailers and marketing agencies
Risk Evaluation and Resilience PlanningBy tracking and predicting eventsthat lead to supply chain disruptions,the resilience level of transport services is increased
Operational Capacity PlanningShort- and mid-term capacity planning allows optimal utilization and scaling of manpower and resources
9Financial Demand and Supply Chain AnalyticsA micro-economic view is created on global supply chain data that helps �nancial institutions improve their rating and investment decisions
Strategic Network PlanningLong-term demand forecasts for transport capacity are generatedin order to support strategic investments into the network
Service Improvement and Product InnovationA comprehensive view on customer requirements and service quality is used to enhance the product portfolio
Market Intelligence for SMESupply chain monitoring data is used to create market intelligence reports for small and medium-sized companies
Crowd-based Pickup and DeliveryA large crowd of occasionally available carriers pick up or deliver shipments along routes they would take anyway
5Customer Loyalty ManagementPublic customer information is mapped against business parameters in order to predict churn and initiate countermeasures
CO 2
Shop
C o r e Tr a n s p o r t N e t w o r k
Flow of dataFlow of physical goods
Big Data in LogisticsBig Data in Logistics
18
3.2 Use Cases – Operational Efficiency
A straightforward way to apply Big Data analytics in a business environment is to increase the level of efficiency in operations. This is simply what IT has always been doing – accelerating business processes – but Big Data analytics effectively opens the throttle.
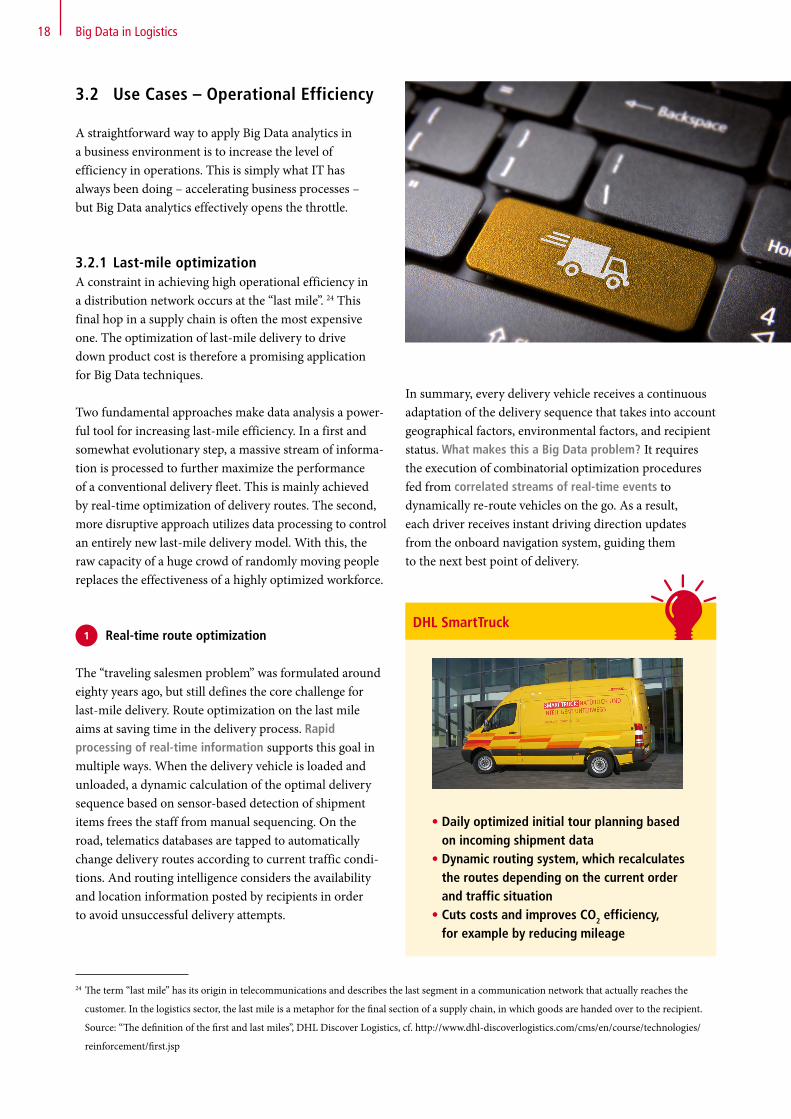
3.2.1 Last-mile optimizationA constraint in achieving high operational efficiency in a distribution network occurs at the “last mile”. 24 This final hop in a supply chain is often the most expensive one. The optimization of last-mile delivery to drive down product cost is therefore a promising application for Big Data techniques.
Two fundamental approaches make data analysis a power- ful tool for increasing last-mile efficiency. In a first and somewhat evolutionary step, a massive stream of informa- tion is processed to further maximize the performance of a conventional delivery fleet. This is mainly achieved by real-time optimization of delivery routes. The second, more disruptive approach utilizes data processing to control an entirely new last-mile delivery model. With this, the raw capacity of a huge crowd of randomly moving people replaces the effectiveness of a highly optimized workforce.
Real-time route optimization
The “traveling salesmen problem” was formulated around eighty years ago, but still defines the core challenge for last-mile delivery. Route optimization on the last mile aims at saving time in the delivery process. Rapid processing of real-time information supports this goal in multiple ways. When the delivery vehicle is loaded and unloaded, a dynamic calculation of the optimal delivery sequence based on sensor-based detection of shipment items frees the staff from manual sequencing. On the road, telematics databases are tapped to automatically change delivery routes according to current traffic condi- tions. And routing intelligence considers the availability and location information posted by recipients in order to avoid unsuccessful delivery attempts.
In summary, every delivery vehicle receives a continuous adaptation of the delivery sequence that takes into account geographical factors, environmental factors, and recipient status. What makes this a Big Data problem? It requires the execution of combinatorial optimization procedures fed from correlated streams of real-time events to dynamically re-route vehicles on the go. As a result, each driver receives instant driving direction updates from the onboard navigation system, guiding them to the next best point of delivery.
24 The term “last mile” has its origin in telecommunications and describes the last segment in a communication network that actually reaches the
customer. In the logistics sector, the last mile is a metaphor for the final section of a supply chain, in which goods are handed over to the recipient.
Source: “The definition of the first and last miles”, DHL Discover Logistics, cf. http://www.dhl-discoverlogistics.com/cms/en/course/technologies/
reinforcement/first.jsp
Big Data in Logistics
1DHL SmartTruck
• Daily optimized initial tour planning based on incoming shipment data
• Dynamic routing system, which recalculates the routes depending on the current order and traffic situation
• Cuts costs and improves CO2 efficiency, for example by reducing mileage
19Big Data in Logistics
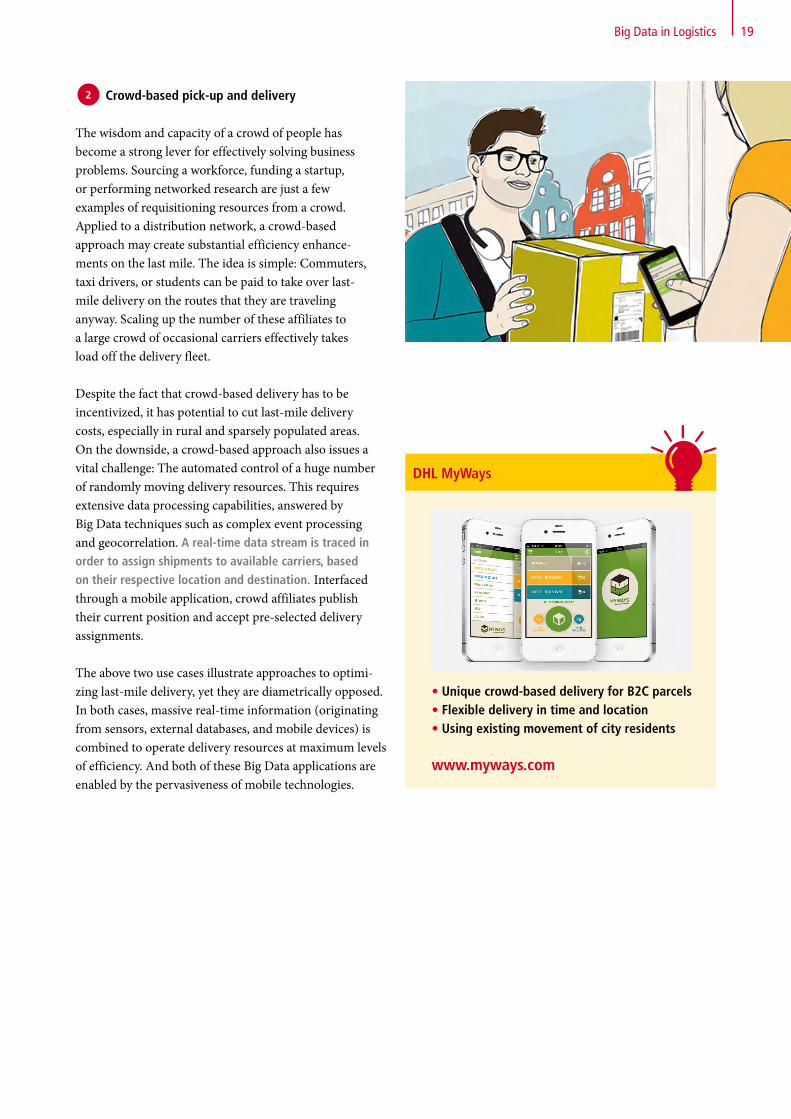
2 Crowd-based pick-up and delivery
The wisdom and capacity of a crowd of people has become a strong lever for effectively solving business problems. Sourcing a workforce, funding a startup, or performing networked research are just a few examples of requisitioning resources from a crowd. Applied to a distribution network, a crowd-based approach may create substantial efficiency enhance- ments on the last mile. The idea is simple: Commuters, taxi drivers, or students can be paid to take over last- mile delivery on the routes that they are traveling anyway. Scaling up the number of these affiliates to a large crowd of occasional carriers effectively takes load off the delivery fleet.
Despite the fact that crowd-based delivery has to be incentivized, it has potential to cut last-mile delivery costs, especially in rural and sparsely populated areas.On the downside, a crowd-based approach also issues a vital challenge: The automated control of a huge number of randomly moving delivery resources. This requires extensive data processing capabilities, answered by Big Data techniques such as complex event processing and geocorrelation. A real-time data stream is traced in order to assign shipments to available carriers, based on their respective location and destination. Interfaced through a mobile application, crowd affiliates publish their current position and accept pre-selected delivery assignments.
The above two use cases illustrate approaches to optimi-zing last-mile delivery, yet they are diametrically opposed. In both cases, massive real-time information (originating from sensors, external databases, and mobile devices) is combined to operate delivery resources at maximum levels of efficiency. And both of these Big Data applications are enabled by the pervasiveness of mobile technologies.
DHL MyWays
• Unique crowd-based delivery for B2C parcels• Flexible delivery in time and location• Using existing movement of city residents
www.myways.com

20
3.2.2 Predictive network and capacity planning
Optimal utilization of resources is a key competitive advantage for logistics providers. Excess capacities lower profitability (which is critical for low-margin forwarding services), while capacity shortages impact service quality and put customer satisfaction at risk. Logistics providers must therefore perform thorough resource planning, both at strategic and operational levels. Strategic-level planning considers the long-term configuration of the distribution network, and operational-level planning scales capacities up or down on a daily or monthly basis. For both perspectives, Big Data techniques improve the reliability of planning and the level of detail achieved, enabling logistics providers to perfectly match demand and available resources.
Strategic network planning
At a strategic level, the topology and capacity of the distribution network are adapted according to anticipated future demand. The results from this stage of planning usually drive investments with long requisition and amortization cycles such as investments in warehouses, distribution centers, and custom-built vehicles. More precise capacity demand forecasts therefore increase efficiency and lower the risks of investing in storage and fleet capacity. Big Data techniques support network planning and optimization by analyzing comprehensive historical capacity and utilization data of transit points and transportation routes. In addition, these techniques consider seasonal factors and emerging freight flow trends by learning algorithms that are fed with extensive
Big Data in Logistics
3 statistical series. External economic information (such as industry-specific and regional growth forecasts) is included for more accurate prediction of specific transportation capacity demand.
In summary, to substantially increase predictive value, a much higher volume and variety of information is exploited by advanced regression and scenario modeling techniques. The result is a new quality of planning with expanded forecast periods – this effectively reduces the risk of long-term infrastructure investments and contracted external capacities. It can also expose any impending over-capacity and provide this as automated feedback to accelerate sales volume. This is achieved by dynamic pricing mechanisms, or by transfer of overhead capacities to spot-market trading.
21Big Data in Logistics
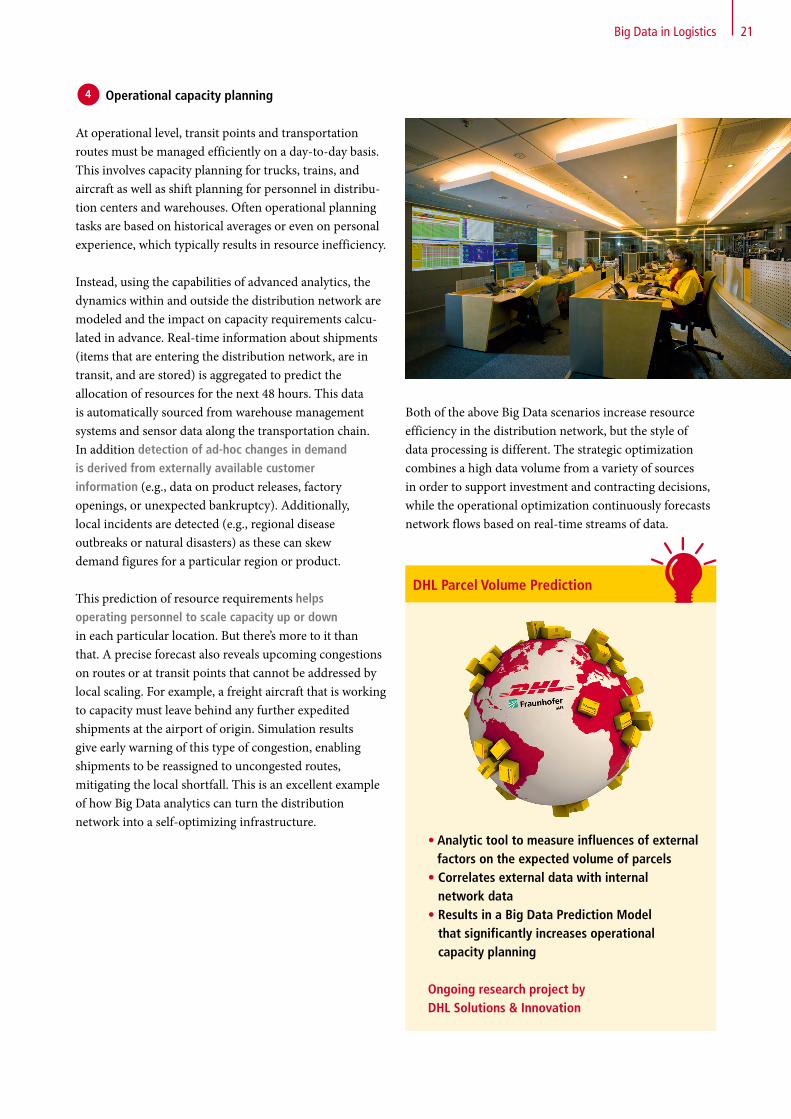
4 Operational capacity planning
At operational level, transit points and transportation routes must be managed efficiently on a day-to-day basis. This involves capacity planning for trucks, trains, and aircraft as well as shift planning for personnel in distribu-tion centers and warehouses. Often operational planning tasks are based on historical averages or even on personal experience, which typically results in resource inefficiency. Instead, using the capabilities of advanced analytics, the dynamics within and outside the distribution network are modeled and the impact on capacity requirements calcu-lated in advance. Real-time information about shipments (items that are entering the distribution network, are in transit, and are stored) is aggregated to predict the allocation of resources for the next 48 hours. This data is automatically sourced from warehouse management systems and sensor data along the transportation chain. In addition detection of ad-hoc changes in demand is derived from externally available customer information (e.g., data on product releases, factory openings, or unexpected bankruptcy). Additionally, local incidents are detected (e.g., regional disease outbreaks or natural disasters) as these can skew demand figures for a particular region or product.
This prediction of resource requirements helps operating personnel to scale capacity up or down in each particular location. But there’s more to it than that. A precise forecast also reveals upcoming congestions on routes or at transit points that cannot be addressed by local scaling. For example, a freight aircraft that is working to capacity must leave behind any further expedited shipments at the airport of origin. Simulation results give early warning of this type of congestion, enabling shipments to be reassigned to uncongested routes, mitigating the local shortfall. This is an excellent example of how Big Data analytics can turn the distribution network into a self-optimizing infrastructure.
Both of the above Big Data scenarios increase resource efficiency in the distribution network, but the style of data processing is different. The strategic optimization combines a high data volume from a variety of sources in order to support investment and contracting decisions, while the operational optimization continuously forecasts network flows based on real-time streams of data.
DHL Parcel Volume Prediction
• Analytic tool to measure influences of external factors on the expected volume of parcels
• Correlates external data with internal network data
• Results in a Big Data Prediction Model that significantly increases operational capacity planning
Ongoing research project by DHL Solutions & Innovation
22 Big Data in Logistics
3.3 Use Cases – Customer Experience
The aspect of Big Data analytics that currently attracts the most attention is acquisition of customer insight. For every business, it is vitally important to learn about customer demand and satisfaction. But as organizations experience increased business success, the individual customer can blur into a large and anonymous customer base. Big Data analytics help to win back individual customer insight and to create targeted customer value.
3.3.1 Customer value management
Clearly, data from the distribution network carries signi-ficant value for the analysis and management of customer relations. With the application of Big Data techniques, and enriched by public Internet mining, this data can be used to minimize customer attrition and understand customer demand.
Customer loyalty management
For most business models, the cost of winning a new customer is far higher than the cost of retaining an exist-ing customer. But it is increasingly difficult to trace and analyze individual customer satisfaction because there are more and more indirect customer touch points (e.g., portals, apps, and indirect sales channels). Because of this, many businesses are failing to establish effective customer retention programs.
Smart use of data enables the identification of valuable customers who are on the point of leaving to join the competition. Big Data analytics allow a comprehensive assessment of customer satisfaction by merging multiple extensive data sources.
For logistics providers, this materializes in a combined evaluation of records from customer touch points, opera- tional data on logistics service quality, and external data. How do these pieces fit together? Imagine the scenario of a logistics provider noticing a customer who lowers shipment volumes despite concurrently publishing steady sales records through newswire. The provider then checks delivery records, and realizes that this customer recently experienced delayed shipments. Looking at the bigger picture, this information suggests an urgent need for customer retention activity.
To achieve this insight not just with one customer but across the entire customer base, the logistics provider must tap multiple data sources and use Big Data analytics. Customer touch points include responses to sales and marketing activities, customer service inquiries, and complaint management details. This digital customer trail is correlated with data from the distribution network comprising statistical series on shipping volume and received service quality levels. In addition, the Internet provides useful customer insight: Publicly available infor-mation from news agencies, annual reports, stock trackers, or even sentiments from social media sites enrich the logistics provider’s internal perspective of each customer.
From this comprehensive information pool, the logistics provider can extract the attrition potential of every single customer by applying techniques such as semantic text analytics, natural-language processing, and pattern recognition. On automatically generated triggers, the provider then initiates proactive counter-measures and customer loyalty programs.
Although business relationships in logistics usually relate to the sender side, loyalty management must also target the recipient side. Recipients are even more affected by poor service quality, and their feedback influences sender selection for future shipments. A good example of this is Internet or catalog shopping: Recurring customer complaints result in the vendor considering a switch of logistics provider. But to include recipients into loyalty management requires yet more data to be processed, especially in B2C markets.
Big Data analytics are essential, helping to produce an integrated view of customer interactions and operational performance, and ensure sender and recipient satisfaction.
5
23Big Data in Logistics
Continuous service improvement and product innovation
Logistics providers collect customer feedback as this provides valuable insight into service quality and customer expectations and demands. This feedback is a major source of information for continuous improvement in service quality. It is also important input for the ideation of new service innovations.
To get solid results from customer feedback evaluation, it is necessary to aggregate information from as many touch points as possible. In the past, the single source of data has been ingests from CRM systems and customer surveys. But today, Big Data solutions provide access to gargantuan volumes of useful data stored on public Internet sites. In social networks and on discussion forums, people openly and anonymously share their service experiences. But extracting by hand relevant customer feedback from the natural-language content created by billions of Internet users is like looking for that proverbial needle in a haystack.
Sophisticated Big Data techniques such as text mining and semantic analytics allow the automated retrieval of customer sentiment from huge text and audio repositories. In addition, this unsolicited feedback on quality and demand can be broken down by region and time. This enables identification of correlation with one-time incidents and tracking the effect of any initiated action.
In summary, meticulous review of the entire public Internet brings unbiased customer feedback to the logistics provider. This empowers product and operational managers to design services capable of meeting customer demand.
6
3.3.2 Suppy chain risk management
The uninterrupted direct supply of materials is essential to businesses operating global production chains. Lost, delayed, or damaged goods have an immediate negative impact on revenue streams. Whereas logistics providers are prepared to control their own operational risk in supply chain services, an increasing number of disruptions result from major events such as civil unrest, natural disasters, or sudden economic developments.25 To anticipate supply chain disruptions and mitigate the effect of unforeseen incidents, global enterprises seek to deploy business continuity management (BCM) measures.26
This demand for improved business continuity creates an opportunity for logistics providers to expand their customer value in outsourced supply chain operations. Rapid analysis of various information streams can be used to forecast events with a potentially significant or disastrous impact on customer business. In response to arising critical conditions, counter-measures can be initiated early to tackle arising business risks.
25 “Are you ready for anything?”, DHL Supply Chain Matters, 2011, cf. http://www.dhlsupplychainmatters.dhl.com/efficiency/article/24/are-you-ready-
for-anything26 “Making the right risk decisions to strengthen operations performance”, PriceWaterhouseCoopers and MIT Forum for Supply Chain Innovation, 2013

24 Big Data in Logistics
Risk evaluation and resilience planning
Contract logistics providers know their customers’ supply chains in great detail. To cater for the customer need for predictive risk assessment, two things must be linked and continuously checked against each other: A model describing all elements of the supply chain topology, and monitoring of the forces that affect the performance of this supply chain. Data on local developments in politics, economy, nature, health, and more must be drawn from a plethora of sources (e.g., social media, blogs, weather forecasts, news sites, stock trackers, and many other publically available sites), and then aggregated and analyzed. Most of this information stream is unstructured and continuously updated, so Big Data analytics power the retrieval of input that is meaningful in the detection of supply chain risks.
Both semantic analytics and complex event processing techniques are required to detect patterns in this stream of interrelated information pieces.27 The customer is notified when a pattern points to a critical condition arising for one of the supply chain elements (e.g., a torna-do warning in the region where a transshipment point is located). This notification includes a report on the proba-bility and impact of this risk, and provides suitable coun-ter-measures to mitigate potential disruption. Equipped with this information, the customer can re-plan transport routes or ramp up supplies from other geographies.
Robust supply chains that are able to cope with unforeseen events are a vital business capability in today’s rapidly changing world. In addition to a resilient and flexible supply chain infrastructure, businesses need highly accurate risk detection to keep running when disaster strikes. With Big Data tools and techniques, logistics providers can secure customer operations by performing predictive analytics on a global scale.
7
27 “The Power of Events: An Introduction to Complex Event Processing in Distributed Enterprise Systems”, David C. Luckham, Addison-Wesley Long-
man, 2001
Coming Soon – A New Supply Chain Risk Management Solution by DHL
• A unique consultancy and software solution that improves the resilience of your entire supply chain
• Designed to reduce emergency costs, maintain service levels, protect sales, and enable fast post-disruption recovery
• Protects your brand and market share, informs your inventory decisions, and creates competitive advantage
25Big Data in Logistics
3.4 Use Cases – New Business Models
The logistics sector has long been a macroeconomic indicator, and the global transportation of goods often acts as a benchmark for future economic development. The type of goods and shipped volumes indicate regional demand and supply levels. The predictive value of logistics data for the global economy is constituted by existing financial indices measuring the macroeconomic impact of the logistics sector. Examples are the Baltic Dry Index28, a price index for raw materials shipped, and the Dow Jones Transportation Average29, showing the economic stability of the 20 largest U.S. logistics providers.
By applying the power of Big Data analytics, logistics providers have a unique opportunity to extract detailed microeconomic insights from the flow of goods through their distribution networks. They can exploit the huge digital asset that is piled up from the millions of daily shipments by capturing demand and supply figures in various geographical and industry segments.
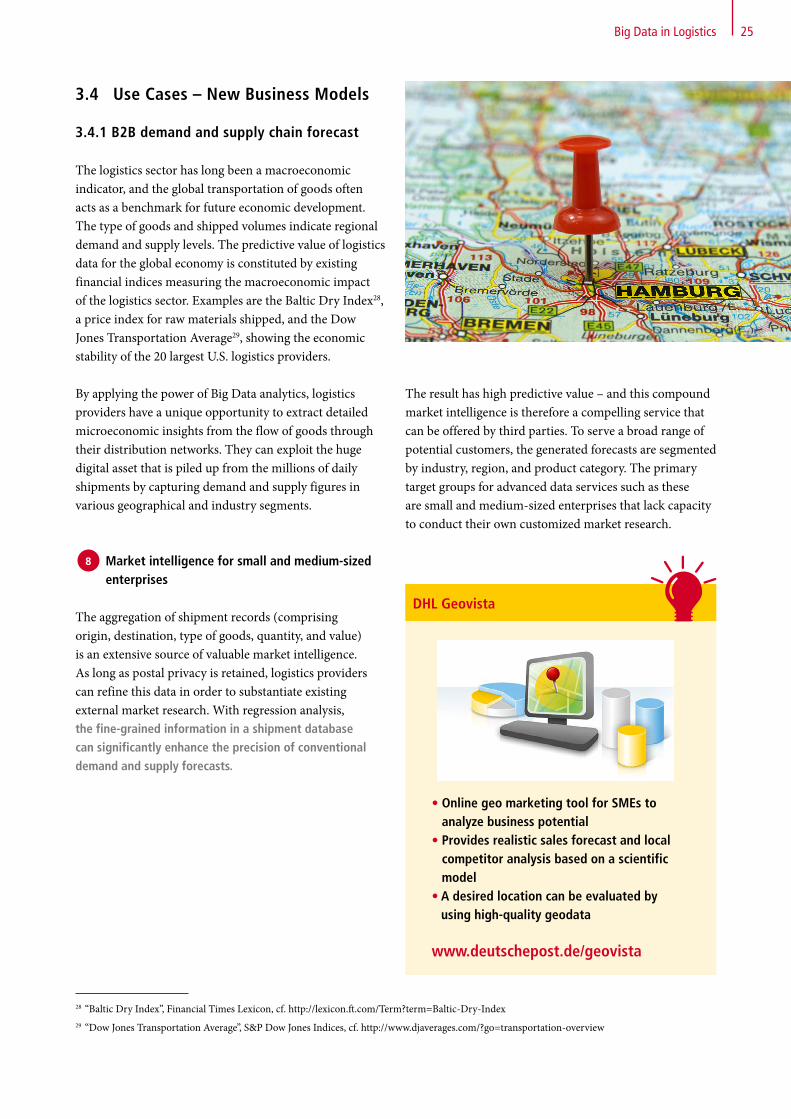
Market intelligence for small and medium-sized enterprises
The aggregation of shipment records (comprising origin, destination, type of goods, quantity, and value) is an extensive source of valuable market intelligence. As long as postal privacy is retained, logistics providers can refine this data in order to substantiate existing external market research. With regression analysis, the fine-grained information in a shipment database can significantly enhance the precision of conventional demand and supply forecasts.
3.4.1 B2B demand and supply chain forecast
28 “Baltic Dry Index”, Financial Times Lexicon, cf. http://lexicon.ft.com/Term?term=Baltic-Dry-Index29 “Dow Jones Transportation Average”, S&P Dow Jones Indices, cf. http://www.djaverages.com/?go=transportation-overview
8
The result has high predictive value – and this compound market intelligence is therefore a compelling service that can be offered by third parties. To serve a broad range of potential customers, the generated forecasts are segmented by industry, region, and product category. The primary target groups for advanced data services such as these are small and medium-sized enterprises that lack capacity to conduct their own customized market research.
DHL Geovista
• Online geo marketing tool for SMEs to analyze business potential
• Provides realistic sales forecast and local competitor analysis based on a scientific model
• A desired location can be evaluated by using high-quality geodata
www.deutschepost.de/geovista
26 Big Data in Logistics
Financial demand and supply chain analytics
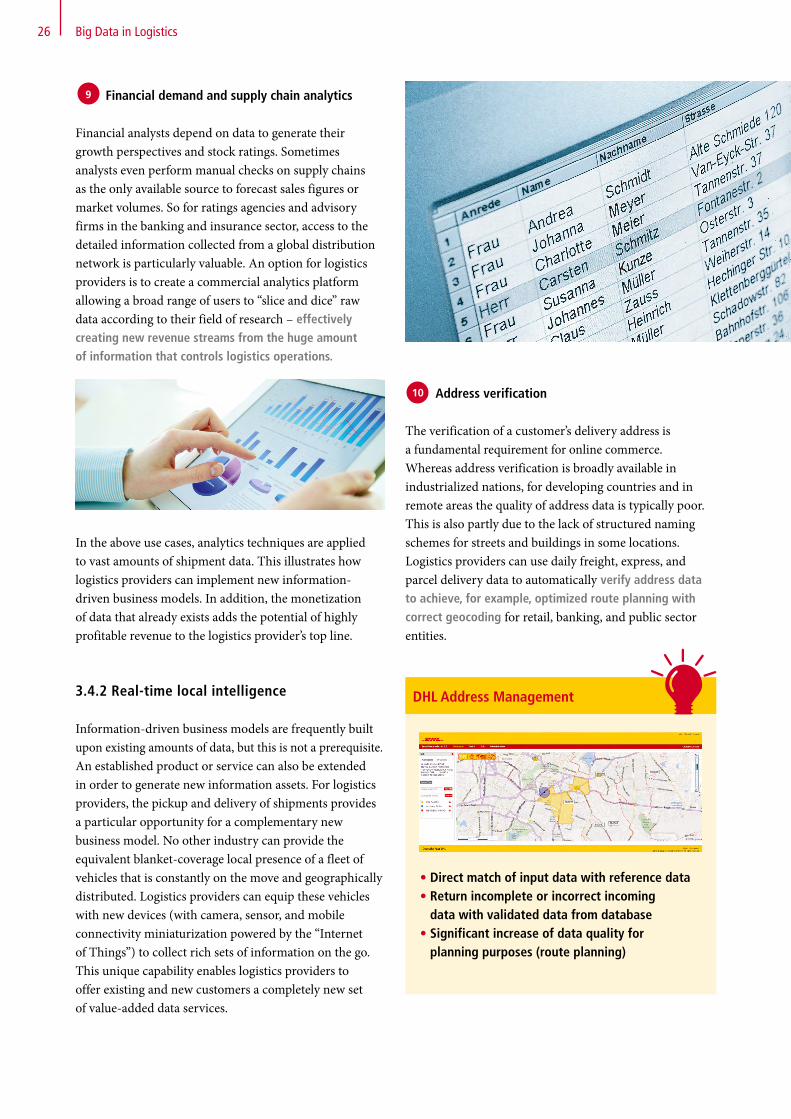
Financial analysts depend on data to generate their growth perspectives and stock ratings. Sometimes analysts even perform manual checks on supply chains as the only available source to forecast sales figures or market volumes. So for ratings agencies and advisory firms in the banking and insurance sector, access to the detailed information collected from a global distribution network is particularly valuable. An option for logistics providers is to create a commercial analytics platform allowing a broad range of users to “slice and dice” raw data according to their field of research – effectively creating new revenue streams from the huge amount of information that controls logistics operations.
In the above use cases, analytics techniques are applied to vast amounts of shipment data. This illustrates how logistics providers can implement new information- driven business models. In addition, the monetization of data that already exists adds the potential of highly profitable revenue to the logistics provider’s top line.
3.4.2 Real-time local intelligence
Information-driven business models are frequently built upon existing amounts of data, but this is not a prerequisite. An established product or service can also be extended in order to generate new information assets. For logistics providers, the pickup and delivery of shipments provides a particular opportunity for a complementary new business model. No other industry can provide the equivalent blanket-coverage local presence of a fleet of vehicles that is constantly on the move and geographically distributed. Logistics providers can equip these vehicles with new devices (with camera, sensor, and mobile connectivity miniaturization powered by the “Internet of Things”) to collect rich sets of information on the go. This unique capability enables logistics providers to offer existing and new customers a completely new set of value-added data services.
9
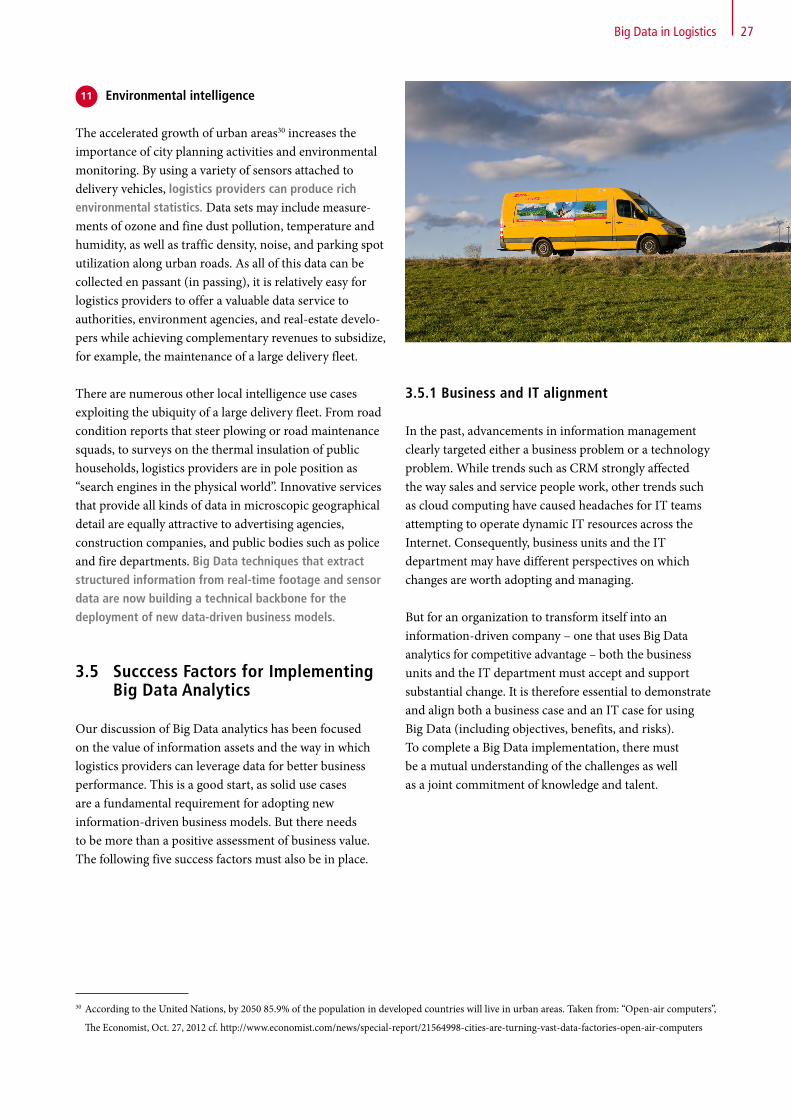
Address verification
The verification of a customer’s delivery address is a fundamental requirement for online commerce. Whereas address verification is broadly available in industrialized nations, for developing countries and in remote areas the quality of address data is typically poor. This is also partly due to the lack of structured naming schemes for streets and buildings in some locations. Logistics providers can use daily freight, express, and parcel delivery data to automatically verify address data to achieve, for example, optimized route planning with correct geocoding for retail, banking, and public sector entities.
10
DHL Address Management
• Direct match of input data with reference data• Return incomplete or incorrect incoming
data with validated data from database• Significant increase of data quality for
planning purposes (route planning)
27Big Data in Logistics
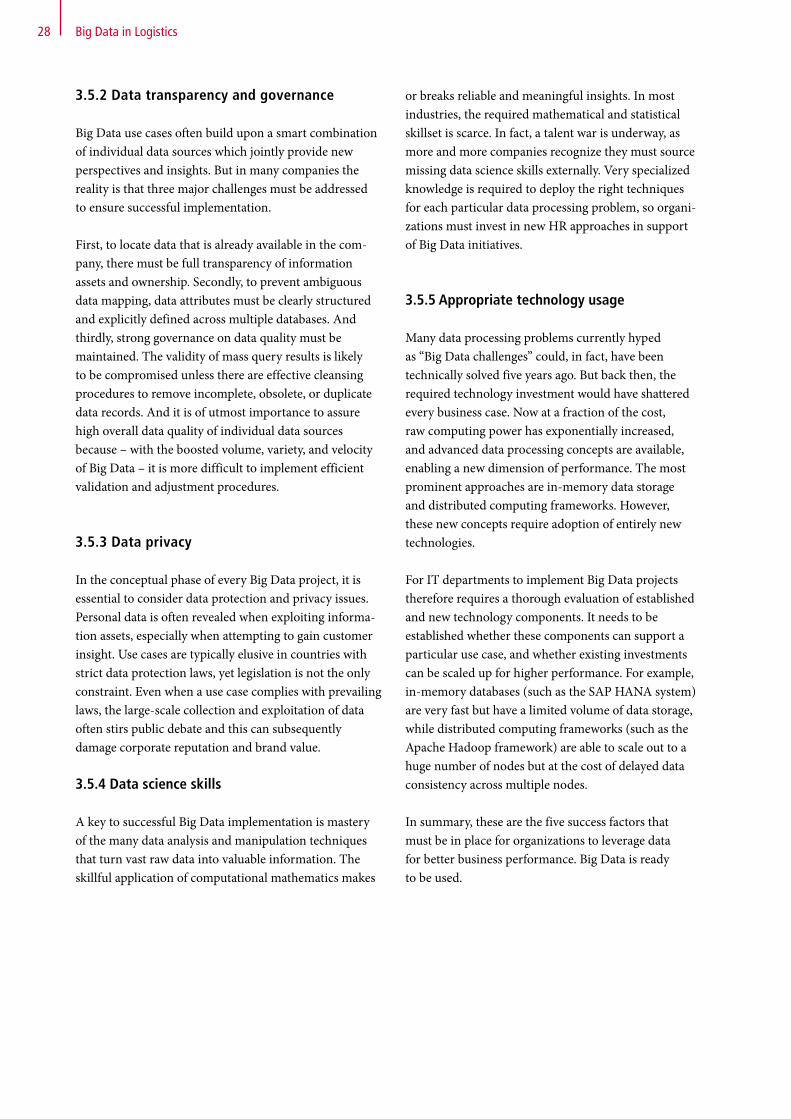
Environmental intelligence
The accelerated growth of urban areas30 increases the importance of city planning activities and environmental monitoring. By using a variety of sensors attached to delivery vehicles, logistics providers can produce rich environmental statistics. Data sets may include measure- ments of ozone and fine dust pollution, temperature and humidity, as well as traffic density, noise, and parking spot utilization along urban roads. As all of this data can be collected en passant (in passing), it is relatively easy for logistics providers to offer a valuable data service to authorities, environment agencies, and real-estate develo-pers while achieving complementary revenues to subsidize, for example, the maintenance of a large delivery fleet.
There are numerous other local intelligence use cases exploiting the ubiquity of a large delivery fleet. From road condition reports that steer plowing or road maintenance squads, to surveys on the thermal insulation of public households, logistics providers are in pole position as “search engines in the physical world”. Innovative services that provide all kinds of data in microscopic geographical detail are equally attractive to advertising agencies, construction companies, and public bodies such as police and fire departments. Big Data techniques that extract structured information from real-time footage and sensor data are now building a technical backbone for the deployment of new data-driven business models.
11
3.5 Succcess Factors for Implementing Big Data Analytics
Our discussion of Big Data analytics has been focused on the value of information assets and the way in which logistics providers can leverage data for better business performance. This is a good start, as solid use cases are a fundamental requirement for adopting new information-driven business models. But there needs to be more than a positive assessment of business value. The following five success factors must also be in place.
3.5.1 Business and IT alignment
In the past, advancements in information management clearly targeted either a business problem or a technology problem. While trends such as CRM strongly affected the way sales and service people work, other trends such as cloud computing have caused headaches for IT teams attempting to operate dynamic IT resources across the Internet. Consequently, business units and the IT department may have different perspectives on which changes are worth adopting and managing.
But for an organization to transform itself into an information-driven company – one that uses Big Data analytics for competitive advantage – both the business units and the IT department must accept and support substantial change. It is therefore essential to demonstrate and align both a business case and an IT case for using Big Data (including objectives, benefits, and risks). To complete a Big Data implementation, there must be a mutual understanding of the challenges as well as a joint commitment of knowledge and talent.
30 According to the United Nations, by 2050 85.9% of the population in developed countries will live in urban areas. Taken from: “Open-air computers”,
The Economist, Oct. 27, 2012 cf. http://www.economist.com/news/special-report/21564998-cities-are-turning-vast-data-factories-open-air-computers
28
3.5.2 Data transparency and governance
Big Data use cases often build upon a smart combination of individual data sources which jointly provide new perspectives and insights. But in many companies the reality is that three major challenges must be addressed to ensure successful implementation.
First, to locate data that is already available in the com- pany, there must be full transparency of information assets and ownership. Secondly, to prevent ambiguous data mapping, data attributes must be clearly structured and explicitly defined across multiple databases. And thirdly, strong governance on data quality must be maintained. The validity of mass query results is likely to be compromised unless there are effective cleansing procedures to remove incomplete, obsolete, or duplicate data records. And it is of utmost importance to assure high overall data quality of individual data sources because – with the boosted volume, variety, and velocity of Big Data – it is more difficult to implement efficient validation and adjustment procedures.
3.5.3 Data privacy
In the conceptual phase of every Big Data project, it is essential to consider data protection and privacy issues. Personal data is often revealed when exploiting informa-tion assets, especially when attempting to gain customer insight. Use cases are typically elusive in countries with strict data protection laws, yet legislation is not the only constraint. Even when a use case complies with prevailing laws, the large-scale collection and exploitation of data often stirs public debate and this can subsequently damage corporate reputation and brand value.
3.5.4 Data science skills
A key to successful Big Data implementation is mastery of the many data analysis and manipulation techniques that turn vast raw data into valuable information. The skillful application of computational mathematics makes
or breaks reliable and meaningful insights. In most industries, the required mathematical and statistical skillset is scarce. In fact, a talent war is underway, as more and more companies recognize they must source missing data science skills externally. Very specialized knowledge is required to deploy the right techniques for each particular data processing problem, so organi- zations must invest in new HR approaches in support of Big Data initiatives.
3.5.5 Appropriate technology usage
Many data processing problems currently hyped as “Big Data challenges” could, in fact, have been technically solved five years ago. But back then, the required technology investment would have shattered every business case. Now at a fraction of the cost, raw computing power has exponentially increased, and advanced data processing concepts are available, enabling a new dimension of performance. The most prominent approaches are in-memory data storage and distributed computing frameworks. However, these new concepts require adoption of entirely new technologies.
For IT departments to implement Big Data projects therefore requires a thorough evaluation of established and new technology components. It needs to be established whether these components can support a particular use case, and whether existing investments can be scaled up for higher performance. For example, in-memory databases (such as the SAP HANA system) are very fast but have a limited volume of data storage, while distributed computing frameworks (such as the Apache Hadoop framework) are able to scale out to a huge number of nodes but at the cost of delayed data consistency across multiple nodes.
In summary, these are the five success factors that must be in place for organizations to leverage data for better business performance. Big Data is ready to be used.
Big Data in Logistics

29
Looking ahead, there are admittedly numerous obstacles to overcome (data quality, privacy, and technical feasib- ility, to name just a few) before Big Data has pervasive influence in the logistics industry. But in the long run, these obstacles are of secondary importance because, first and foremost, Big Data is driven by entrepreneurial spirit.
Several organizations have led the way for us – Google, Amazon, Facebook, and eBay, for example, have already succeeded in turning extensive information into business. Now we are beginning to see first movers in the logistics sector. These are the entrepreneurial logistics providers that refuse to be left behind; the opportunity-oriented organizations prepared to exploit data assets in pursuit of the applications described in this trend report.
But apart from the leading logistics providers that imple-ment specific Big Data opportunities, how will the entire logistics sector transform into a data-driven industry?
What evolution can we anticipate in a world where virtually every single shipped item is connected to the Internet? We may not know all of the answers right now. But this trend report has shown there is plenty of head-room for valuable Big Data innovation. Joining resources, labor, and capital, it is clear that information has become the fourth production factor and essential to competitive differentiation.
It is time to tap the potential of Big Data to improve operational efficiency and customer experience, and create useful new business models. It is time for a shift of mindset, a clear strategy and application of the right drilling techniques.
Over the next decade, as data assumes its rightful place as a key driver in the logistics sector, every activity within DHL is bound to get smarter, faster, and more efficient.
OUTLOOK
Outlook

FOR MORE INFORMATION About ‘Big Data in Logistics’, contact:
Dr. Markus KückelhausDHL Customer Solutions & InnovationJunkersring 5753844 Troisdorf, GermanyPhone: +49 2241 1203 230Mobile: +49 152 5797 0580
e-mail: [email protected]
Katrin ZeilerDHL Customer Solutions & InnovationJunkersring 5753844 Troisdorf, GermanyPhone: +49 2241 1203 235Mobile: +49 173 239 0335 e-mail: [email protected]
RECOMMENDED READING
LOGISTICS TREND RADAR
www.dhl.com/trendradar KEY LOGISTICS TRENDS IN LIFE SCIENCES 2020+
www.dhl.com/lifesciences2020