big data for social good example...
TRANSCRIPT

Big Data for Social Good Example Demo
1
Big Data for Social Good Example Demo
Demo Summary This demo will take you through the logistics and process involved in running Analytics for Hadoop
Service (BigInsights) on IBM Bluemix, loading external data, exploring and visualizing data within
BigSheets, performing data transformations in BigSheets, joining at least two datasets together, creating
Big SQL tables from BigSheets, running SQL against these tables, and optionally connecting to these
tables with an external reporting tool. An advanced section is also provided for those looking to run
data science processing by using Big R within the BigInsights platform.
Big Data Use Case
IBM recently published this challenge in late 2014 at http://ibmhadoop.challengepost.com/ This challenge is augmented with additional tutorials found at https://developer.ibm.com/hadoop/docs/tutorials/analytics-hadoop-bluemix/ that provide instruction on how to use the environment. This demo is meant to show a working solution.
Demo Details Table
Demo Name: BD4SG_Example_Demo
Estimated Setup time: xxx minutes (plus VM download time)
Supported Environments: Bluemix.net
Average Delivery Time: 24 minutes (BigSheets and Big SQL), 34 minutes (with Big R added)
Demo Skill Level: Beginner
Products and Versions: BigInsights v3.0.0.1
Refinement Level: Bronze
Field Creator: Michael Nobles
Demo Team Owner: Michael Nobles
Document Revision History Table
Date Version Changed by Description of Changes
Jan 26, 2015 1.5 M. Nobles Initial public version

Big Data for Social Good Example Demo
2
Contents Big Data for Social Good Example Demo ...................................................................................................... 1
Demo Summary ........................................................................................................................................ 1
Big Data Use Case.................................................................................................................................. 1
Demo Details Table ............................................................................................................................... 1
Document Revision History Table ......................................................................................................... 1
Demo Overview ........................................................................................................................................ 4
Document Notation .................................................................................................................................. 4
Cloud Setup Instructions (Bluemix.net) ........................................................................................................ 4
Bluemix.net / Analytics for Hadoop Service ............................................................................................. 4
Data Movement Options .............................................................................................................................. 7
Data Download options ............................................................................................................................ 7
Data Upload options ................................................................................................................................. 8
From your local machine .................................................................................................................... 11
From another website supporting REST ............................................................................................. 14
BigSheets Data Processing .......................................................................................................................... 19
BigSheets Workbooks ............................................................................................................................. 20
BigSheets Charting .................................................................................................................................. 28
BigSheets Data Transformation Example................................................................................................ 29
Using BigSheets to Combine Data Files .................................................................................................. 34
Big SQL Tables ............................................................................................................................................. 38
Create a Table from BigSheets ................................................................................................................ 39
Query the Table from the BigInsights Web Console ............................................................................... 40
Advanced Analytics using Big R ................................................................................................................... 41
Deploying the Ad hoc R Script Application ............................................................................................. 41
Running the Ad hoc R Script Application on the example data .............................................................. 46
Optional Client Environments ..................................................................................................................... 51
Windows Environment Downloads ........................................................................................................ 51
Install and Setup Eclipse on Windows .................................................................................................... 52
Query the same Tables from Eclipse on Windows ................................................................................. 58
Setup Tableau on Windows .................................................................................................................... 61

Big Data for Social Good Example Demo
3
Query the same Tables from Tableau ..................................................................................................... 62
Non-Windows Environment Downloads ................................................................................................ 64
Install Java and Eclipse on a Non-Windows Environment ...................................................................... 65
Install the BigInsights Eclipse plug-in ...................................................................................................... 66
Connect Eclipse to your Analytics for Hadoop Service ........................................................................... 70

Big Data for Social Good Example Demo
4
Demo Overview This demo assumes that you have already created your Bluemix.net ID and have already logged in
successfully. To be complete, we will start there. Optionally, you may wish to use a local reporting tool
to create your final reporting solution. We will also cover this in one of the sections of this demo. If you
do not wish to use a local reporting tool, this is fine as well since BigSheets reporting will also be
included. Additionally, you may wish to run more advanced algorithms using R. The easiest way to do
this with data in your Bluemix cluster is to download and run the BigInsights Quick Start virtual machine
and use this virtual machine (VM) as a client to your Bluemix cluster in the cloud.
Document Notation Please note that whenever you see text within “< >” brackets, these are placeholders for you to replace
the bracketed content with your particular details. For example, you would replace <password> with
your actual password and not include the < > brackets in your text.
Cloud Setup Instructions (Bluemix.net) This portion of the document contains the necessary setup or environment-download instructions.
There are three environments we will utilize in this demo; namely...
1. Bluemix.net / Analytics for Hadoop Service
2. Windows
3. All other platforms
The Analytics for Hadoop Service is required. The Windows and Linux environments are optional but
might be required depending on your desire to include certain software in your solution.
Bluemix.net / Analytics for Hadoop Service It is assumed that you have followed the instructions at http://ibmhadoop.challengepost.com/ by
clicking on the “Register for this challenge” button and have setup your Bluemix.net account.
___ Step 1: Navigate in your browser to http://bluemix.net and login.
___ Step 2: Once logged in, you should see your email in the upper-left corner. You should also see your
default DASHBOARD view. If you are not on DASHBOARD, please click there now.

Big Data for Social Good Example Demo
5
___ Step 3: Scroll down to the Services section and click the “ADD A SERVICE” button.
___ Step 4: An easier way to find the Service you need is to check the “Big Data” option on the left.
___ Step 5: Now, click on the following icon to add the Analytics for Hadoop Service.

Big Data for Social Good Example Demo
6
___ Step 6: You should now see this service added to your Dashboard.
___ Step 7: Click on this service icon to see the details of the service.
___ Step 8: Make sure you are able to see your login credentials for your Analytics for Hadoop Service
cluster in the lower right-hand corner of the details page.
___ Step 9: Make note of these credentials since will need them if you elect to connect your Windows or
Linux environments to your cloud instance.
Big Data for Social Good Example Demo
7
___ Step 10: You will need to click the “Activate” button just to the left of your “Connect and Manage
Files” area in your Bluemix service. When asked for your “passcode”, this will match the passcode
emailed to you when you fill out and submit the form at
http://ibmhadoop.challengepost.com/details/ibmbluemix towards the bottom of the page.
Data Movement Options In this section, we will return to your web browser in order to explore different options to download
data to your local machine. We will also cover options for uploading data from your local machine as
well as options for landing data directly into your cluster from other data services and locations without
having to land the data on your local machine.
Please note: IBM does not endorse, suggest, or require any of the following data source examples to be
used in your solution. These are only examples. Please feel free to use other example data as
appropriate for your efforts during the challenge.
Data Download options Organizations may choose to share data in various formats. Some files may be compressed and
therefore use a compression technique that is not “splittable” by Hadoop. (See http://www-
01.ibm.com/support/knowledgecenter/SSPT3X_3.0.0/com.ibm.swg.im.infosphere.biginsights.admin.doc
/doc/c0059641.html?lang=en for more information on splittable compression.) For this reason, you
may wish to download the data to your local machine first, uncompress the data, and then upload the
uncompressed version of the data to your Analytics for Hadoop cluster. (This will make it easier to see
your data in the preview pane but this is not required. Also, your performance will likely improve for
large files if you do not use gzip compression.) The following example is one such example of the steps
to follow when you wish to use data compressed with a .gz (gzip) file extension (as gz is not a splittable
compression format).
Please note: If you desire to use .gz files, these are supported by BigInsights. However, Hadoop will
need to uncompress the entire file before it can begin processing the file. This is a Hadoop limitation.
___ Step 11: After performing a search on Google for “free weather data”, we decided to go to
http://www.ncdc.noaa.gov/data-access/quick-links#ghcn and click on the FTP access link.
___ Step 12: We then proceeded to the “by_year” folder and noticed all files were .csv.gz. We clicked
on the 2014.csv.gz and the 2013.csv.gz files to download them to a local machine.
___ Step 13: Next, we expanded the .gz files into 2014.csv and 2013.csv respectively.
Big Data for Social Good Example Demo
8
___ Step 14: At this point, we have two local files that are both less than 2 GB in size each. As you
continue, you will see different options for uploading these files (as well as others).
___ Step 15: To make more complete use of these weather files, you may also find it useful to
understand the name of the weather station within the data. For this, noaa.gov contains some other
files you might wish to download.
___ Step 16: Optionally go to ftp://ftp.ncdc.noaa.gov/pub/data/ghcn/daily and download the ghcnd-
stations.txt file.
___ Step 17: Since we will be using data from NYC in the demo, we will use station USW00014732 as this
is the station id for the New York Laguardia weather station.
Data Upload options In this section, we will explore two different ways to upload data from your local machine to your
BigInsights for Analytics Service.
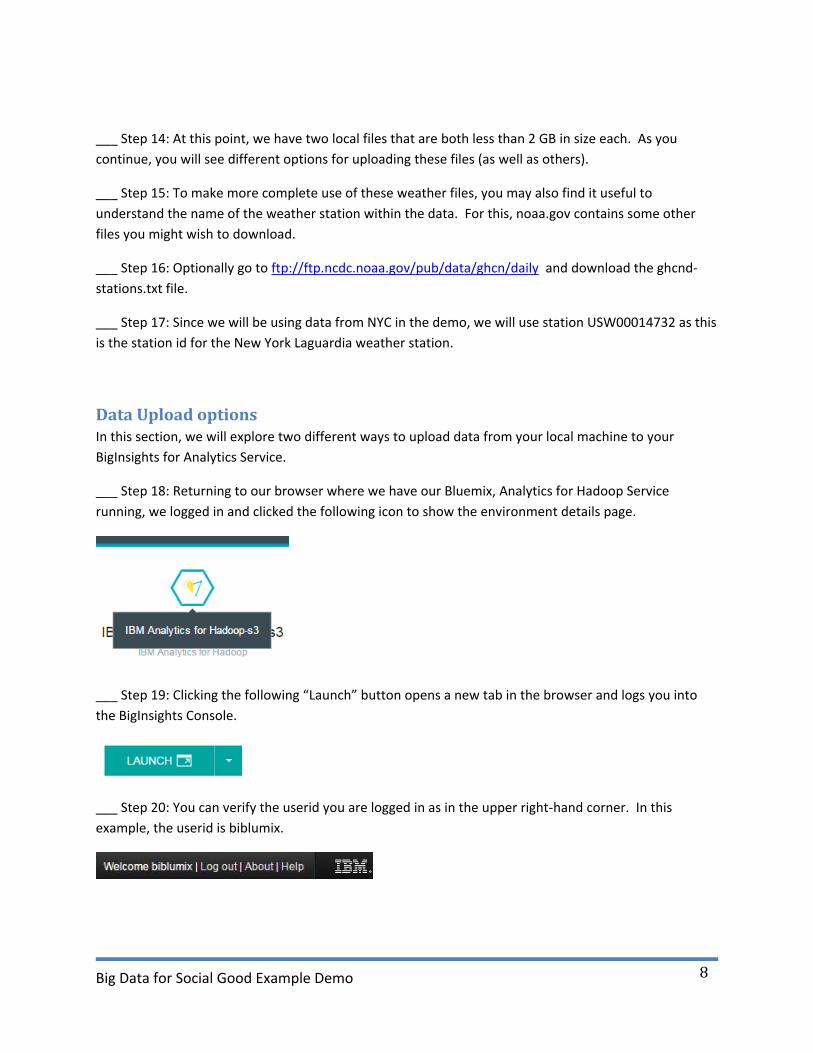
___ Step 18: Returning to our browser where we have our Bluemix, Analytics for Hadoop Service
running, we logged in and clicked the following icon to show the environment details page.
___ Step 19: Clicking the following “Launch” button opens a new tab in the browser and logs you into
the BigInsights Console.
___ Step 20: You can verify the userid you are logged in as in the upper right-hand corner. In this
example, the userid is biblumix.

Big Data for Social Good Example Demo
9
___ Step 21: Next, we want to create a folder structure to store our two, new weather csv files. So, you
need to access the Files “tab” at this time by clicking on Files.
___ Step 22: Click on the triangle icons to expand the “user” folder and then click on the “biblumix”
folder so that it is the selected folder for the next step.
___ Step 23: Next, we would like to create a directory structure under the biblumix folder to contain our
weather data. So, click on the “folder” icon that will prompt you for the name of your new folder.
Big Data for Social Good Example Demo
10
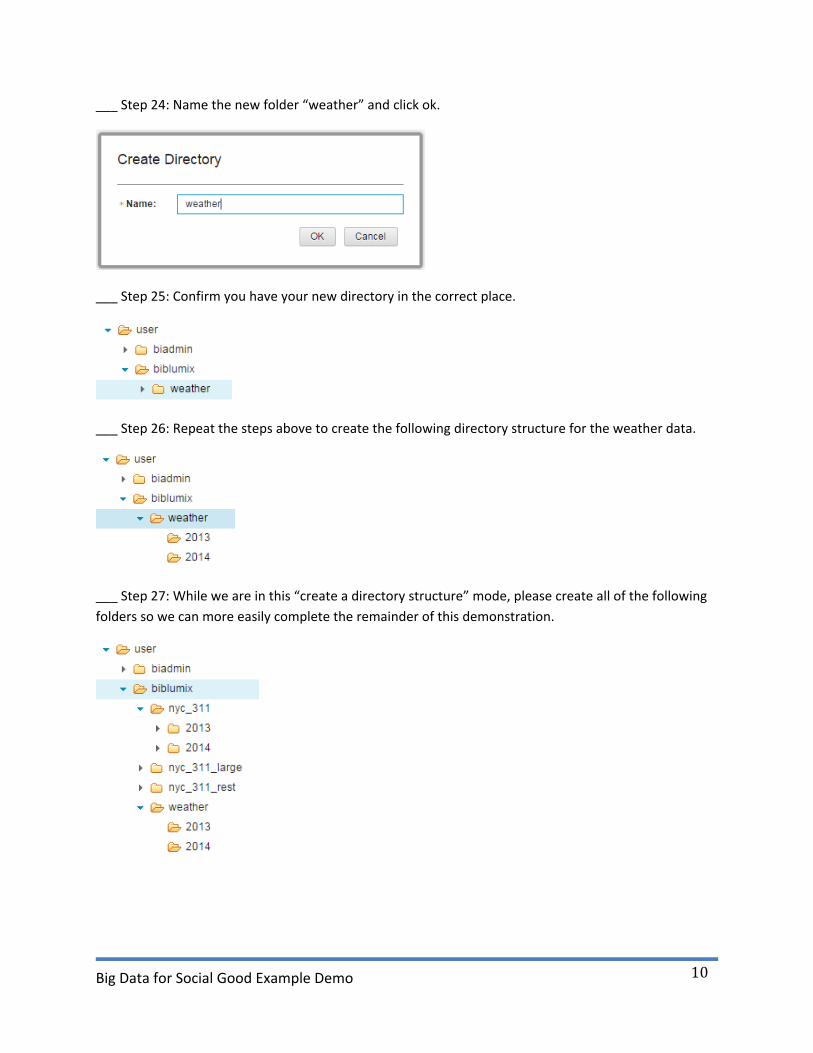
___ Step 24: Name the new folder “weather” and click ok.
___ Step 25: Confirm you have your new directory in the correct place.
___ Step 26: Repeat the steps above to create the following directory structure for the weather data.
___ Step 27: While we are in this “create a directory structure” mode, please create all of the following
folders so we can more easily complete the remainder of this demonstration.

Big Data for Social Good Example Demo
11
From your local machine
In this section, we will now use different techniques to upload data from your local machine.
Smaller than 2 GB
For files smaller than 2 GB (like our two data files containing weather data), we will use the Files tab
again and use the Upload File icon. For files larger than 2 GB, please skip to the next section.
___ Step 28: Select the folder you would like to upload a file to from within the Files tab.
___ Step 29: Click the folder icon for uploading files.
___ Step 30: Select the file location and file on your local machine to upload and click OK.
___ Step 31: The upload may take a while depending on the speed of your upload connection. If you are
using Chrome for your browser, you can track the progress in the lower, left-hand corner of the
browser. If you navigate away from this page, your upload will stop. Please open another tab or
window to continue working with your BigInsights environment until this upload completes.
Big Data for Social Good Example Demo
12
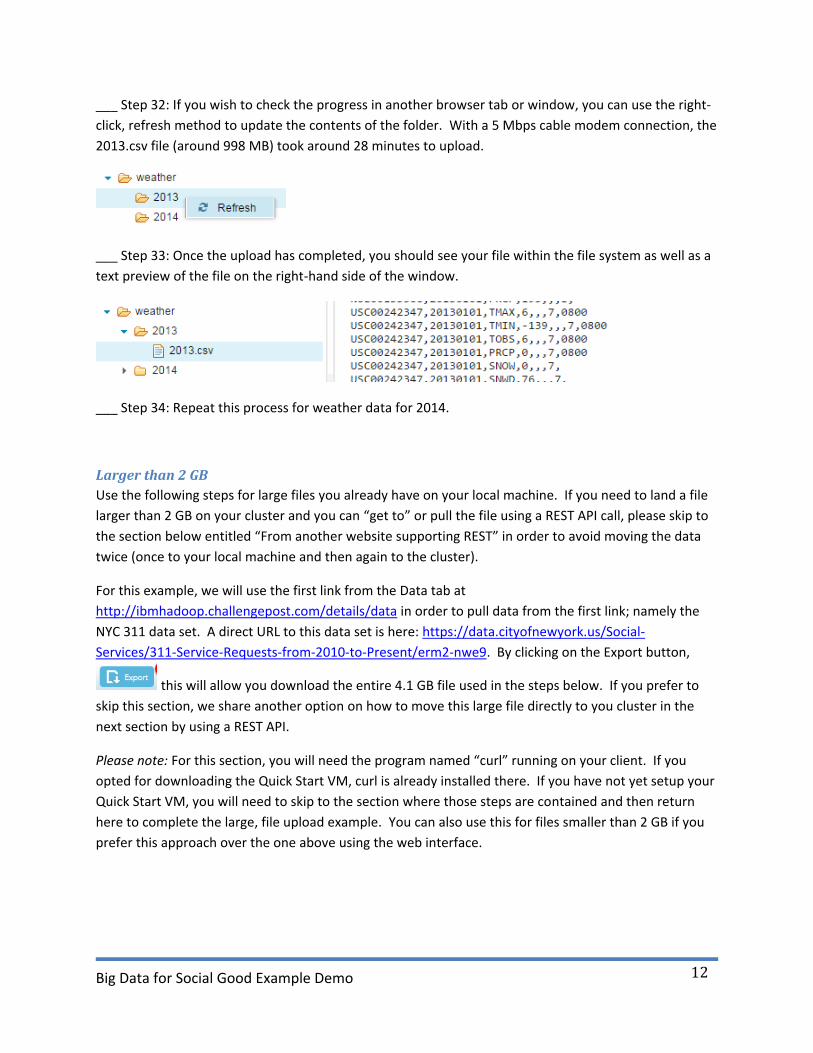
___ Step 32: If you wish to check the progress in another browser tab or window, you can use the right-
click, refresh method to update the contents of the folder. With a 5 Mbps cable modem connection, the
2013.csv file (around 998 MB) took around 28 minutes to upload.
___ Step 33: Once the upload has completed, you should see your file within the file system as well as a
text preview of the file on the right-hand side of the window.
___ Step 34: Repeat this process for weather data for 2014.
Larger than 2 GB
Use the following steps for large files you already have on your local machine. If you need to land a file
larger than 2 GB on your cluster and you can “get to” or pull the file using a REST API call, please skip to
the section below entitled “From another website supporting REST” in order to avoid moving the data
twice (once to your local machine and then again to the cluster).
For this example, we will use the first link from the Data tab at
http://ibmhadoop.challengepost.com/details/data in order to pull data from the first link; namely the
NYC 311 data set. A direct URL to this data set is here: https://data.cityofnewyork.us/Social-
Services/311-Service-Requests-from-2010-to-Present/erm2-nwe9. By clicking on the Export button,
this will allow you download the entire 4.1 GB file used in the steps below. If you prefer to
skip this section, we share another option on how to move this large file directly to you cluster in the
next section by using a REST API.
Please note: For this section, you will need the program named “curl” running on your client. If you
opted for downloading the Quick Start VM, curl is already installed there. If you have not yet setup your
Quick Start VM, you will need to skip to the section where those steps are contained and then return
here to complete the large, file upload example. You can also use this for files smaller than 2 GB if you
prefer this approach over the one above using the web interface.
Big Data for Social Good Example Demo
13
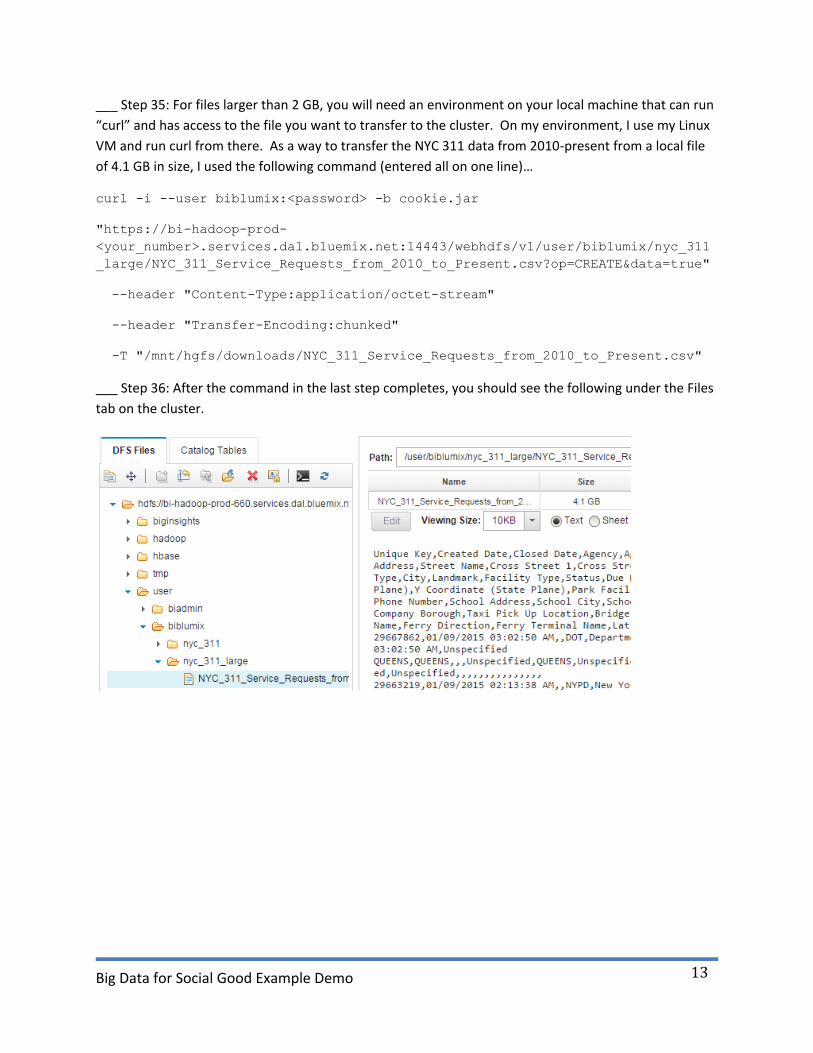
___ Step 35: For files larger than 2 GB, you will need an environment on your local machine that can run
“curl” and has access to the file you want to transfer to the cluster. On my environment, I use my Linux
VM and run curl from there. As a way to transfer the NYC 311 data from 2010-present from a local file
of 4.1 GB in size, I used the following command (entered all on one line)…
curl -i --user biblumix:<password> -b cookie.jar
"https://bi-hadoop-prod-
<your_number>.services.dal.bluemix.net:14443/webhdfs/v1/user/biblumix/nyc_311
_large/NYC_311_Service_Requests_from_2010_to_Present.csv?op=CREATE&data=true"
--header "Content-Type:application/octet-stream"
--header "Transfer-Encoding:chunked"
-T "/mnt/hgfs/downloads/NYC_311_Service_Requests_from_2010_to_Present.csv"
___ Step 36: After the command in the last step completes, you should see the following under the Files
tab on the cluster.

Big Data for Social Good Example Demo
14
___ Step 37: To learn more about the APIs provided by BigInsights, you can return to the Analytics for
Hadoop Service details page and click the “HttpFS REST APIs link found in the lower-right-hand corner.
From another website supporting REST
BigInsights includes a set of “applications” under the Applications tab in the BigInsights web console.
One of the applications is named “Web REST Import” and will allow you to use a REST call to a data
source URL in order to pull a copy directly into your BigInsights environment. This section will walk you
through the steps required to pull the NYC 311 data set as well as subsets of the data if this is desired.
___ Step 38: Using your web browser, click on the Applications tab.
___ Step 39: The first time you enter this area, you are shown the “Run” listing of applications and it is
expected to be empty.
Big Data for Social Good Example Demo
15
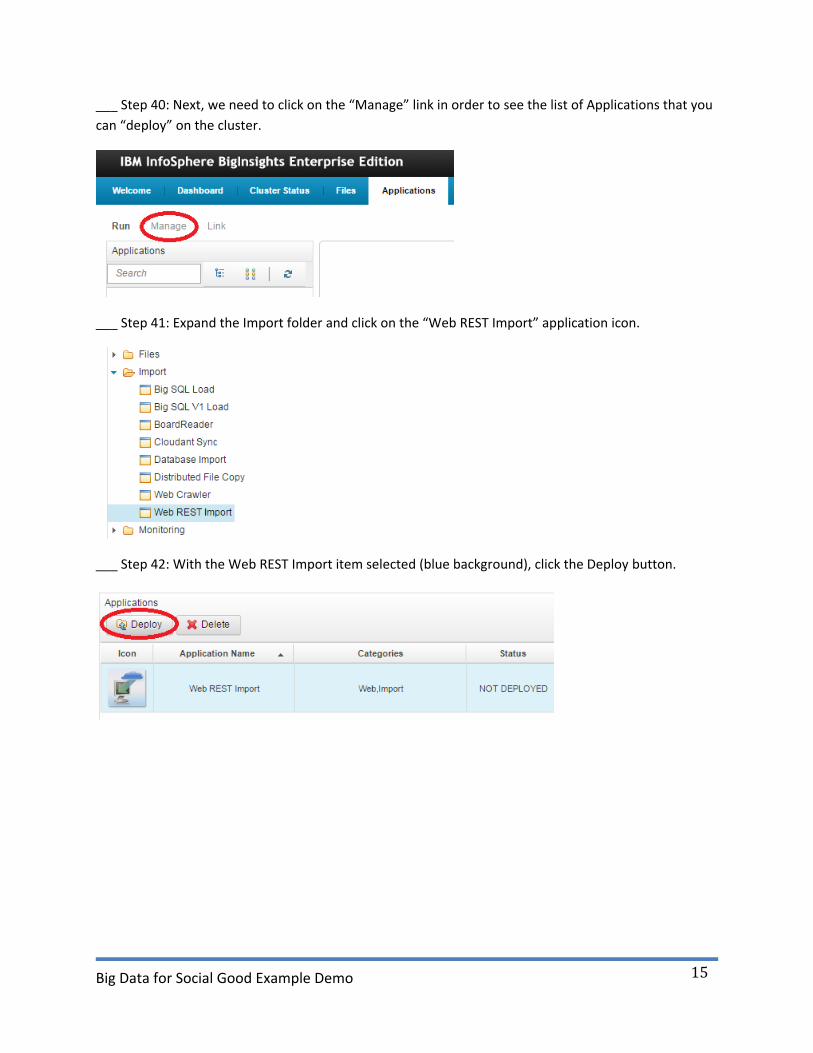
___ Step 40: Next, we need to click on the “Manage” link in order to see the list of Applications that you
can “deploy” on the cluster.
___ Step 41: Expand the Import folder and click on the “Web REST Import” application icon.
___ Step 42: With the Web REST Import item selected (blue background), click the Deploy button.

Big Data for Social Good Example Demo
16
___ Step 43: Accept the defaults and just click the Deploy button.
___ Step 44: Return to the “Run” area in order to see your newly deployed application.

Big Data for Social Good Example Demo
17
___ Step 45: Click on the icon to be asked for parameters to run the application.
___ Step 46: On the right-hand side, there are two required fields. In order to obtain the URL for the
data to pull from, navigate in another browser window to the NYC 311 data area. Click on the Export
button/link, then right-click and “Copy Link Location” from the CSV link as shown here.

Big Data for Social Good Example Demo
18
___ Step 47: Return to your Web REST Import application area and perform a paste into the URL entry
area. You can then use the browse button to select the output folder for the data. You can then
optionally provide an Execution name. When your screen matches below, click the Run button to run
the job required to pull the data to your cluster.
___ Step 48: You will see the status of the job in the lower portion of the window.
___ Step 49: Once the job completes, you should be able to click on the Output icon to be taken to
where the data landed in your cluster. You can also see this process copied the 4.1 GB in about 47
minutes (which was far faster than pulling it local and using the curl command to transfer it yet again).

Big Data for Social Good Example Demo
19
___ Step 50: If you would like to pull a subset of the data, you can use the Filter option on the NYC data
website to filter by a date range and then you would need to pull the results to your local machine since
the right-click, copy link location will only return the full set of data. As an example, we did two
additional pulls of data; one for 2013 and another for 2014 only. We placed them into the directory
structure we created earlier of nyc_311/2013 and nyc_311/2014 respectively by using the curl approach
mentioned previously.
___ Step 51: This approach of using the Web REST Import application should work for any http or https
call that can be made to pull raw data.
BigSheets Data Processing Up until now, we have been loading data into the BigInsights environment. At this point, you would
traditionally go off and write some Java, or Pig, or some other language to begin to read and process the
data. The output of this processing would then need to be moved into a format that another
visualization tool could use as input so you could more easily “see” the data. With BigInsights, IBM
provides BigSheets which uses a built-in, web-based spreadsheet metaphor to allow you to “see” the
data without having to be a programmer.
In this example, we will look at how to view the data in BigSheets. We will create some visualizations.
And then, we will transform the data in one data set to match the format in the other; specifically we
want to look at a correlation between weather and 311 report entries. Since both have a date field, we
need to make sure the date format matches before we perform a join across the two data sets. Finally,
we will show how to create tables from our BigSheets spreadsheets and then perform a join using SQL
(in the next main section).

Big Data for Social Good Example Demo
20
___ Step 52: Just to make sure we are starting from the same set of data, all of the steps above have
provided the following files. We will use most of these files for the steps remaining in this document.
BigSheets Workbooks In BigSheets, we call a spreadsheet a workbook. We also call a “tab” at the bottom a sheet. In general,
you create a new workbook when you need to start some new processing on the data. However, you
can add as many tabs as needed to a single workbook. Just keep in mind two things; 1) only one tab will
be saved as the final result of the workbook, and 2) in order to “run” a workbook, all tabs must be run.
So, you will want to potentially restrict the number of tabs in a workbook to keep it from taking too long
to run. So, let’s get started.
___ Step 53: If we return to the Files tab, we can select the 2014.csv under the weather folder. Click on
this file to preview the text version of the contents of the file.

Big Data for Social Good Example Demo
21
___ Step 54: Now, to layer a BigSheets workbook view on top of this file, click on the weather/2014
folder (not the file)…
___ Step 55: Then, click the radio button next to Sheet on the right side. (The first time you do this
might take a few seconds longer than subsequent times due to “starting up” BigSheets on the server.)
___ Step 56: Next, we will want to pick the correct “reader” for the contents of the file. Since this file
looks to be in csv (comma-separated values) format, we need to click on the pencil icon to change the
reader.

Big Data for Social Good Example Demo
22
___ Step 57: Select CSV and uncheck the headers checkbox since this data does not contain a header
row (which is the row of data that would contain the names of the columns at the top of the file). Then,
click the green check-mark button.
___ Step 58: We now need to save these selections and the view of this file as a “Master Workbook”.
Click the “Save as Master Workbook button and then provide the name “weather_2014”. Click the save
button.
___ Step 59: Once the workbook is saved, you are moved from the Files tab to the BigSheets tab and
shown a full-screen view of the data. To make it easier to under the data, let’s build a new workbook
based on this workbook so we can change the column heading names. Click the “Build new workbook”
button.
Big Data for Social Good Example Demo
23
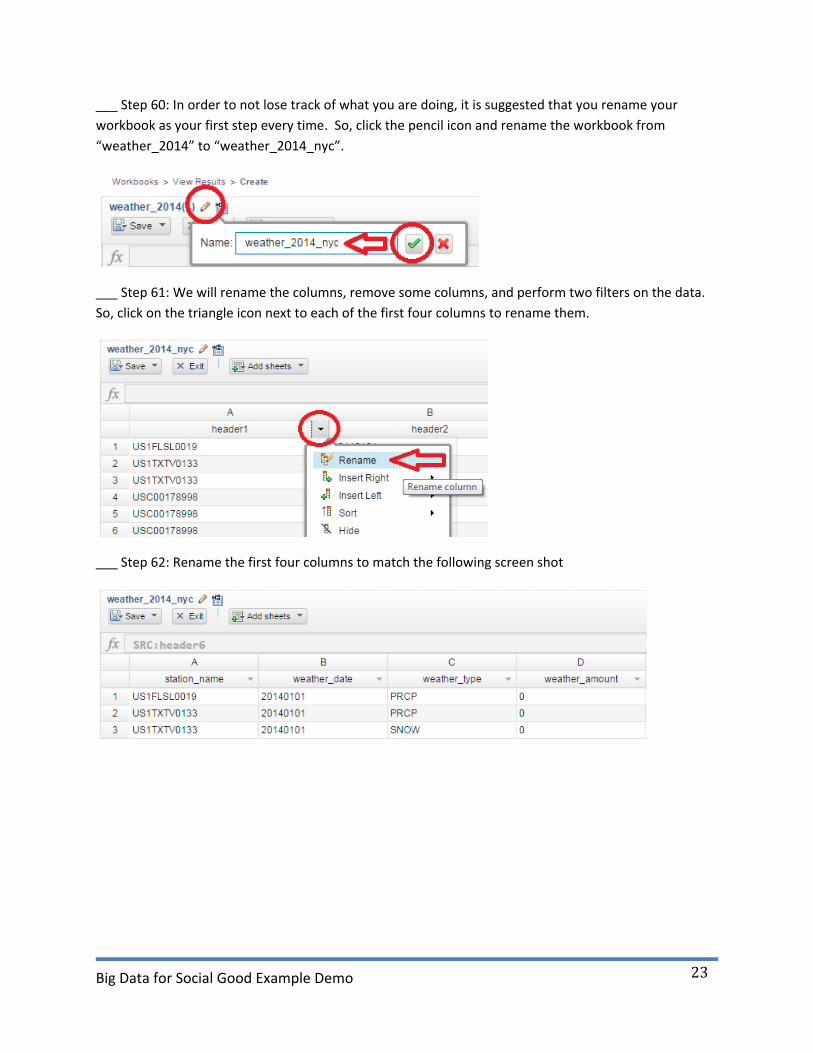
___ Step 60: In order to not lose track of what you are doing, it is suggested that you rename your
workbook as your first step every time. So, click the pencil icon and rename the workbook from
“weather_2014” to “weather_2014_nyc”.
___ Step 61: We will rename the columns, remove some columns, and perform two filters on the data.
So, click on the triangle icon next to each of the first four columns to rename them.
___ Step 62: Rename the first four columns to match the following screen shot
Big Data for Social Good Example Demo
24
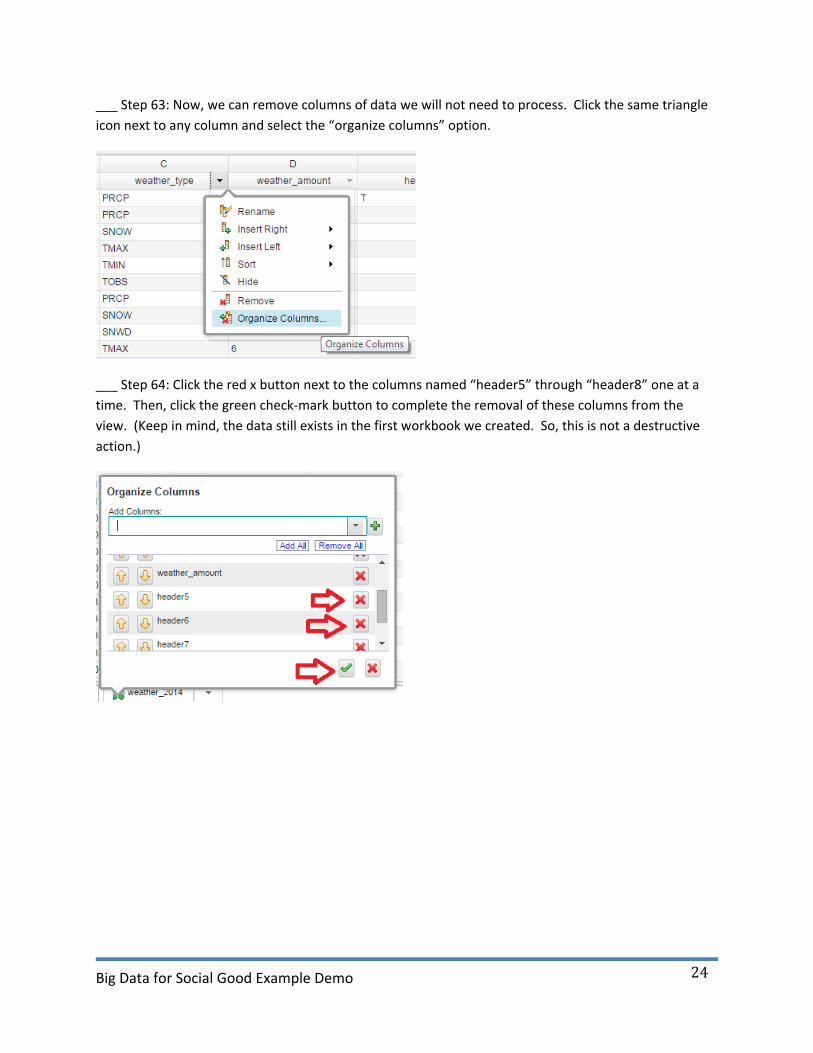
___ Step 63: Now, we can remove columns of data we will not need to process. Click the same triangle
icon next to any column and select the “organize columns” option.
___ Step 64: Click the red x button next to the columns named “header5” through “header8” one at a
time. Then, click the green check-mark button to complete the removal of these columns from the
view. (Keep in mind, the data still exists in the first workbook we created. So, this is not a destructive
action.)
Big Data for Social Good Example Demo
25
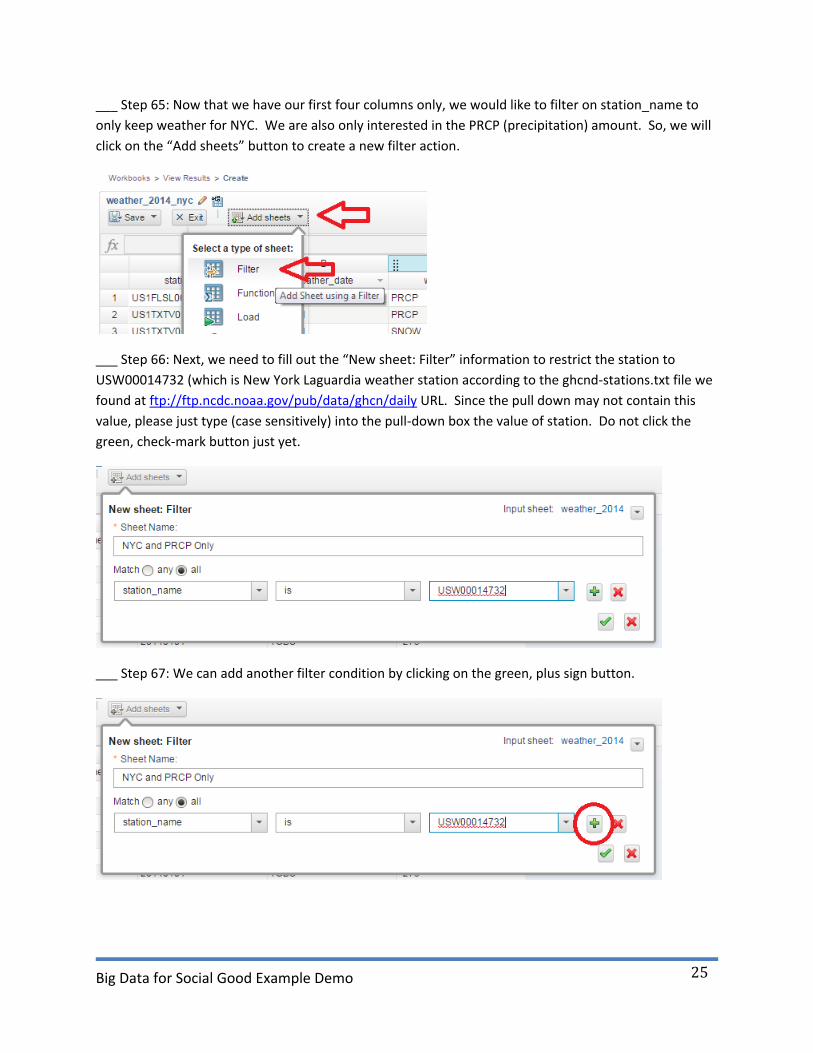
___ Step 65: Now that we have our first four columns only, we would like to filter on station_name to
only keep weather for NYC. We are also only interested in the PRCP (precipitation) amount. So, we will
click on the “Add sheets” button to create a new filter action.
___ Step 66: Next, we need to fill out the “New sheet: Filter” information to restrict the station to
USW00014732 (which is New York Laguardia weather station according to the ghcnd-stations.txt file we
found at ftp://ftp.ncdc.noaa.gov/pub/data/ghcn/daily URL. Since the pull down may not contain this
value, please just type (case sensitively) into the pull-down box the value of station. Do not click the
green, check-mark button just yet.
___ Step 67: We can add another filter condition by clicking on the green, plus sign button.
Big Data for Social Good Example Demo
26
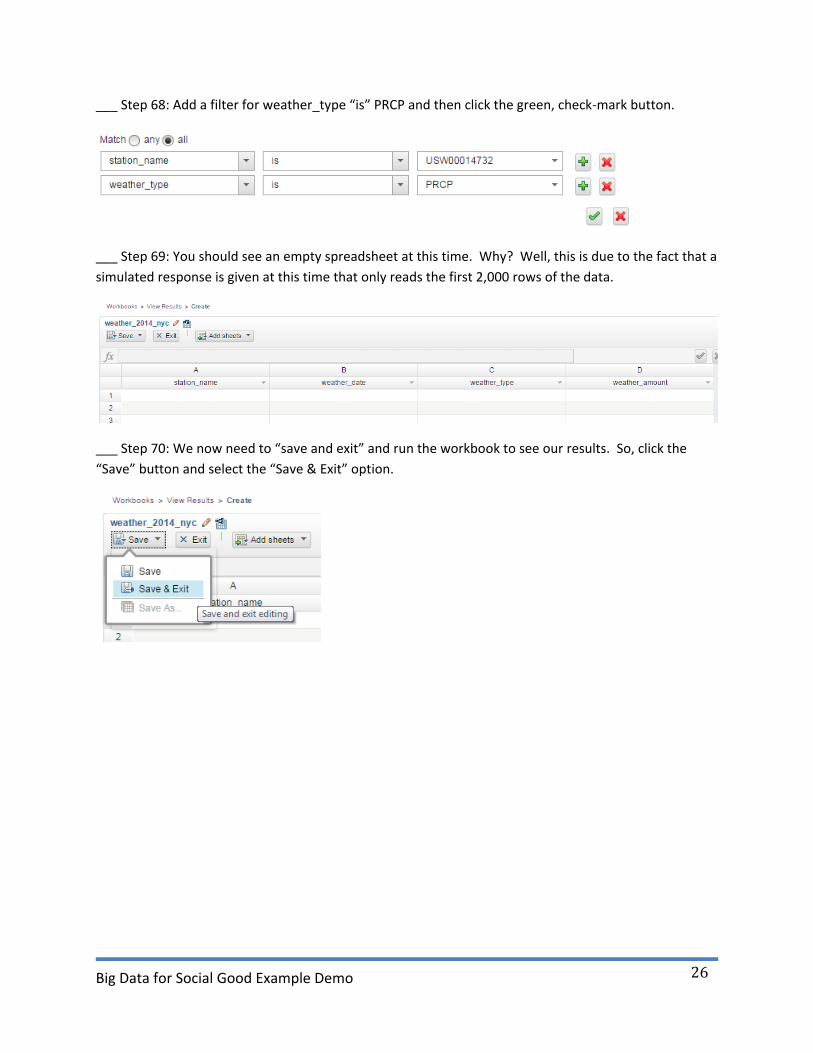
___ Step 68: Add a filter for weather_type “is” PRCP and then click the green, check-mark button.
___ Step 69: You should see an empty spreadsheet at this time. Why? Well, this is due to the fact that a
simulated response is given at this time that only reads the first 2,000 rows of the data.
___ Step 70: We now need to “save and exit” and run the workbook to see our results. So, click the
“Save” button and select the “Save & Exit” option.

Big Data for Social Good Example Demo
27
___ Step 71: You can keep the same name and optionally add a description if you like. Click the Save
button.
___ Step 72: Now, click the run button to filter the 2014 weather data for NYC precipitation.
___ Step 73: You do not have to wait for this job to finish, but you obviously can if you want to. To track
the progress of your job, you can click on the “Application Status” tab and watch the job run. Click on
the job to refresh the details shown at the bottom of the screen.
___ Step 74: Now, return to your “weather_2014_nyc” workbook and you should see the results of one
line of precipitation per day for a total of 365 rows of data (per the indicator in the bottom-right-hand
corner).
Big Data for Social Good Example Demo
28
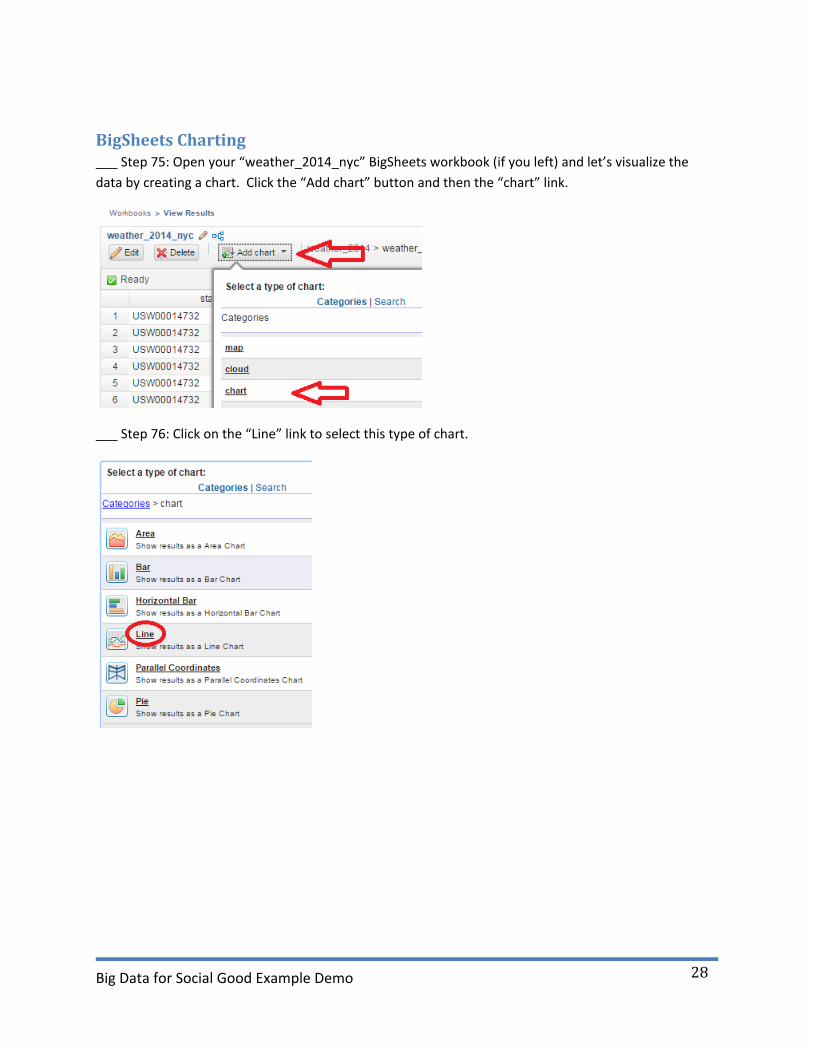
BigSheets Charting ___ Step 75: Open your “weather_2014_nyc” BigSheets workbook (if you left) and let’s visualize the
data by creating a chart. Click the “Add chart” button and then the “chart” link.
___ Step 76: Click on the “Line” link to select this type of chart.

Big Data for Social Good Example Demo
29
___ Step 77: Enter the following information and make the following selections. Then, click the green,
check-mark button.
___ Step 78: Click the Run button to create the chart.
___ Step 79: Again, you do not need to wait for this job to finish. You can carry on a come back later to
see the results.
BigSheets Data Transformation Example So, at this point I was curious if there was any correlation between the amount of rain and the number
of 311 complaints recorded per day. To look at 311 data and the weather data together, we need to
create a BigSheets workbook based on our 311 data from 2014. We then need to change the date
format in the 311 data to match the data we just looked at from the weather dataset. So, in this
section, we will do the same type of process as we did above and then use a function to transform the
date format. We will then perform a group-by function on the new date format to come up with one
row per day for the 311 data.

Big Data for Social Good Example Demo
30
___ Step 80: Return to the Files tab and select the nyc_311/2014 folder to create your BigSheets
Workbook view on top of this folder (not the file).
___ Step 81: Click the Sheet radio button.
___ Step 82: Click the pencil icon to select the CSV reader. This time, the data has a column header row.
So, leave this checked and click the green, check-mark button.
___ Step 83: Now, save your New Master Workbook and name it “nyc_311_2014”.
___ Step 84: We now want to “build new workbook” to look at events by date. So, click “Build new
workbook” and rename your new workbook “nyc_311_2014_by_day”.
___ Step 85: To reduce the amount of data we will work with on this next pass, click the triangle next to
any column and select Organize columns. Remove all columns except Created_Date and Agency.

Big Data for Social Good Example Demo
31
___ Step 86: Now, we would like to add a new column between Created_Date and Agency. So, click the
triangle again, mouse-over the Insert Right, and then click on the “New Column” option.
___ Step 87: Give your new column the name of event_date and click the green check-mark button.
___ Step 88: Your cursor should have moved to the fx (or function) area. We are now going to type the
following function into this box to generate a new string based on the concatenation of three substrings
from the Created_Date column. In BigSheets, we reference other columns by adding a hash sign to the
column name. We also need to use all capital letters when using a function call. Type the following into
the fx field… CONCAT(MID(#Created_Date,7,4),MID(#Created_Date,1,2),MID(#Created_Date,4,2)) and
hit enter (or click the green check-mark button to the right of the fx entry field)…

Big Data for Social Good Example Demo
32
___ Step 89: You can now see a date format that matches what we need to match the data to our
weather data. MID is a function that extracts a substring and CONCAT concatenates the substrings
together. Now, we need to perform a “group by” operation on the event_date column. So, click “Add
sheets” again and select the Group type.
___ Step 90: You can provide a Sheet Name if you like (as this will make the tabs easier to understand).
You will need to select the event_date column to group by and then you must click the green, plus sign
button.
___ Step 91: Make sure your screen looks like this. Then, click the “Calculate” tab. Do not click the
green check-mark button just yet. We need to add up the number of events on each day.

Big Data for Social Good Example Demo
33
___ Step 92: After clicking the Calculate tab, type “total_events” into the field area and then click the
green check mark button.
___ Step 93: Select COUNT and Agency… then click the green check-mark button.
___ Step 94: You should see the following (again, since the simulation only runs in memory against the
first 2,000 rows of the file).
___ Step 95: Save & Exit and then Run this workbook.
___ Step 96: You can now create another line chart if you would like to visualize our new data once the
workbook has been run to completion.

Big Data for Social Good Example Demo
34
Using BigSheets to Combine Data Files At this point, I would really like to have a single dataset that shows me the 311 data and the weather
data on one chart. We can do this within BigSheets if you would like. This section will show you how to
combine these two datasets based on day as well as how to create a chart showing both values (of rain
amount and 311 total events).
___ Step 97: Starting from nyc_311_2014_by_day, click “Build new workbook” and give your new
workbook a new name, something like “nyc_2014_311_and_rain”.
___ Step 98: Now, click “Add sheets” and click the Load icon.
___ Step 99: Give your new sheet a name; like Weather. Click the “weather_2014_nyc” link to load a
pointer to that workbook into this new workbook as a separate tab.
___ Step 100: After being shown the columns in your weather workbook, you will need to click the
green check-mark button again.

Big Data for Social Good Example Demo
35
___ Step 101: You should now have two tabs in your workbook.
___ Step 102: Since the weather_date column is of type integer and the 311 date column we created is
of type “text”, we need a new column that is of type “text” in our weather data. So, click the triangle,
add a new column called weather_date_text and enter the function TEXT(#weather_date) and hit enter.
___ Step 103: To simplify our next steps, we should use the triangle again and hide the station_name,
weather_date, and weather_type columns. Click triangle next to each of these column names and
select “Remove”.
Big Data for Social Good Example Demo
36
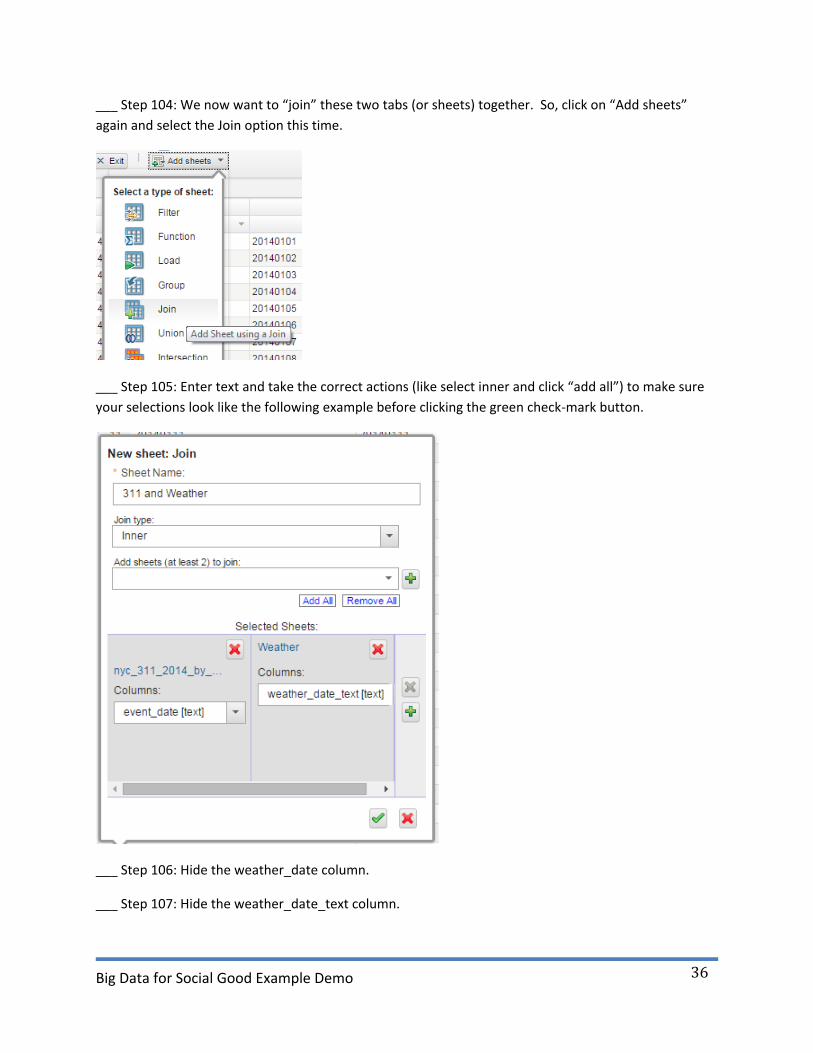
___ Step 104: We now want to “join” these two tabs (or sheets) together. So, click on “Add sheets”
again and select the Join option this time.
___ Step 105: Enter text and take the correct actions (like select inner and click “add all”) to make sure
your selections look like the following example before clicking the green check-mark button.
___ Step 106: Hide the weather_date column.
___ Step 107: Hide the weather_date_text column.

Big Data for Social Good Example Demo
37
___ Step 108: Your columns should now look like the following…
___ Step 109: Save & Exit and Run this workbook.
___ Step 110: You can now create the following line chart to see both values on one chart.

Big Data for Social Good Example Demo
38
___ Step 111: Based on a portion of this chart, it seems like 311 events go up when there is more rain.
So, maybe the city of New York could do some additional investigations into the data to see if there is a
particular type of event that is reported more often on days with rain. Learning these details might help
NYC to take different actions on rainy days to reduce complaints and improve life for citizens of NYC.
Big SQL Tables As many people move towards a Big Data environment, they would like to potentially have access to the
data in an SQL environment. BigInsights provides Big SQL for this purpose. This section will show you
how to create a Big SQL table from an existing BigSheets workbook. After you have a Big SQL table, you
can treat this much like an RDBMS table and connect reporting tools to Big SQL to generate reports.
In our BigSheets example above, we used two workbooks to perform a join. If we wanted to do this
using SQL, we could create a table from each of these workbooks; namely weather_2014_nyc and
nyc_311_2014_by_day.

Big Data for Social Good Example Demo
39
Create a Table from BigSheets ___ Step 112: Open the workbook named weather_2014_nyc.
___ Step 113: Click the Create Table button.
___ Step 114: Provide a name for your schema (like an RDBMS database name).
___ Step 115: Click the “confirm” button to create the table. Once you see the “Create Table” button
change to “Delete Table” button, your table is ready to be used.
___ Step 116: To see the new table within BigInsights, go to the Files tab, click the Catalog Tables tab,
and expand the schema name you used. Clicking on the table name will show you the contents of the
table in a BigSheets-looking view on the right.
___ Step 117: Perform the same steps to create the table from your nyc_311_2014_by_day workbook.

Big Data for Social Good Example Demo
40
___ Step 118: Confirm both tables exist before you continue.
Query the Table from the BigInsights Web Console These table now exist and can be queried using SQL. BigInsights provides ODBC, JDBC, and a web
browser option for querying the data in these tables. We will cover the web-based option next and then
the ODBC option in the Windows section and the JDBC option in the Linux sections later in this
document.
___ Step 119: Go to the Welcome tab.
___ Step 120: On the right-hand side, find and click the “Run Big SQL queries icon.
___ Step 121: A new tab should open in your browser that should give you access to run SQL against the
tables you see in the Catalog Tables tab under the Files tab. So, we can run the “join” using SQL on our
example table by running the following query. (The use statement here should match your schema
name you provided as part of the create table button under BigSheets previously.)
use biblumix;
select event_date, total_events, weather_amount from
nyc_311_2014_by_day, weather_2014_nyc where event_date =
weather_date ORDER BY event_date;

Big Data for Social Good Example Demo
41
___ Step 122: A portion of the results are shown in the browser.
___ Step 123: If you would like to perform other SQL queries, please feel free to do so.
Advanced Analytics using Big R BigInsights provides built-in applications under the Applications tab. One of those applications is called
Deploying the Ad hoc R Script Application ___ Step 124: Navigate to the Applications Tab and click on the Manage link.

Big Data for Social Good Example Demo
42
___ Step 125: Expand the folder named “R” and click to highlight the “Ad hoc R Script” application.
___ Step 126: On the right-hand side, click the Deploy button in order to deploy the application.

Big Data for Social Good Example Demo
43
___ Step 127: Take the defaults and click Deploy to complete the deployment process.

Big Data for Social Good Example Demo
44
___ Step 128: Click the Run link to return to the list of runnable applications. Then, click the icon on the
left to show the items needed on the right-hand side to be able to run the application.
___ Step 129: On the right-hand side, you can provide a name for your run as well as the contents of the
R script you wish to run. Here is the script we used as a test (once we filled out our details for cluster
number and password).
library(bigr)
bigr.connect(host="bi-hadoop-prod-
<your_number>.services.dal.bluemix.net",port=7052,user="biblumix"
,password="<your_password>")
is.bigr.connected()

Big Data for Social Good Example Demo
45
___ Step 130: Click on the Run button to run the job.
___ Step 131: Once the job completes, you will see a status and a way to navigate to you your output
folder by clicking the output icon.
___ Step 132: After clicking on the output icon, expanding the /tmp folder and then clicking to set focus
on the file shown, you can see the output from your R script application.
___ Step 133: The next section will show you how to run something more complex with the data have
already loaded.
Big Data for Social Good Example Demo
46
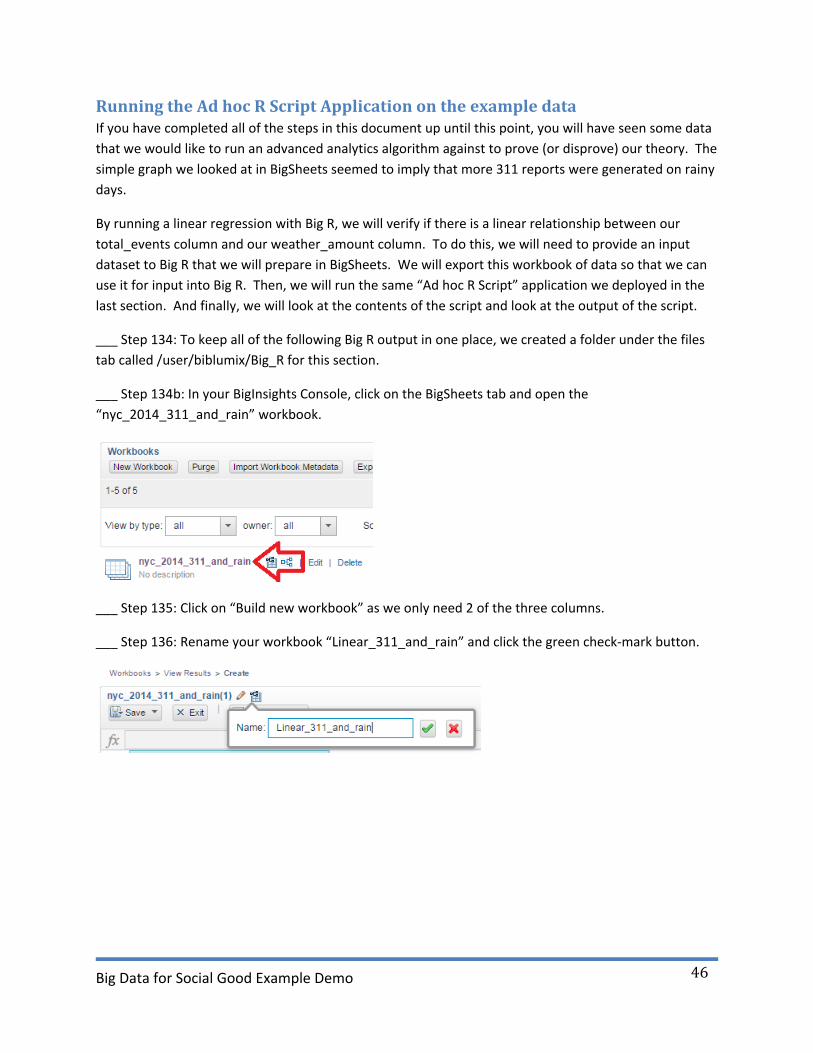
Running the Ad hoc R Script Application on the example data If you have completed all of the steps in this document up until this point, you will have seen some data
that we would like to run an advanced analytics algorithm against to prove (or disprove) our theory. The
simple graph we looked at in BigSheets seemed to imply that more 311 reports were generated on rainy
days.
By running a linear regression with Big R, we will verify if there is a linear relationship between our
total_events column and our weather_amount column. To do this, we will need to provide an input
dataset to Big R that we will prepare in BigSheets. We will export this workbook of data so that we can
use it for input into Big R. Then, we will run the same “Ad hoc R Script” application we deployed in the
last section. And finally, we will look at the contents of the script and look at the output of the script.
___ Step 134: To keep all of the following Big R output in one place, we created a folder under the files
tab called /user/biblumix/Big_R for this section.
___ Step 134b: In your BigInsights Console, click on the BigSheets tab and open the
“nyc_2014_311_and_rain” workbook.
___ Step 135: Click on “Build new workbook” as we only need 2 of the three columns.
___ Step 136: Rename your workbook “Linear_311_and_rain” and click the green check-mark button.

Big Data for Social Good Example Demo
47
___ Step 137: Remove the first column named event_date so that you only have two columns; namely
total_events and weather_amount remaining.
___ Step 138: Save & Exit this workbook. Optionally add a description and click Save again.
___ Step 139: Run this workbook.
___ Step 140: Once the workbook shows “ready”, we now need to export the data from this workbook
into a csv file. Click Export and select CSV and file. (Please make sure you wait for the run to complete
before you click the Export data button.)
Big Data for Social Good Example Demo
48
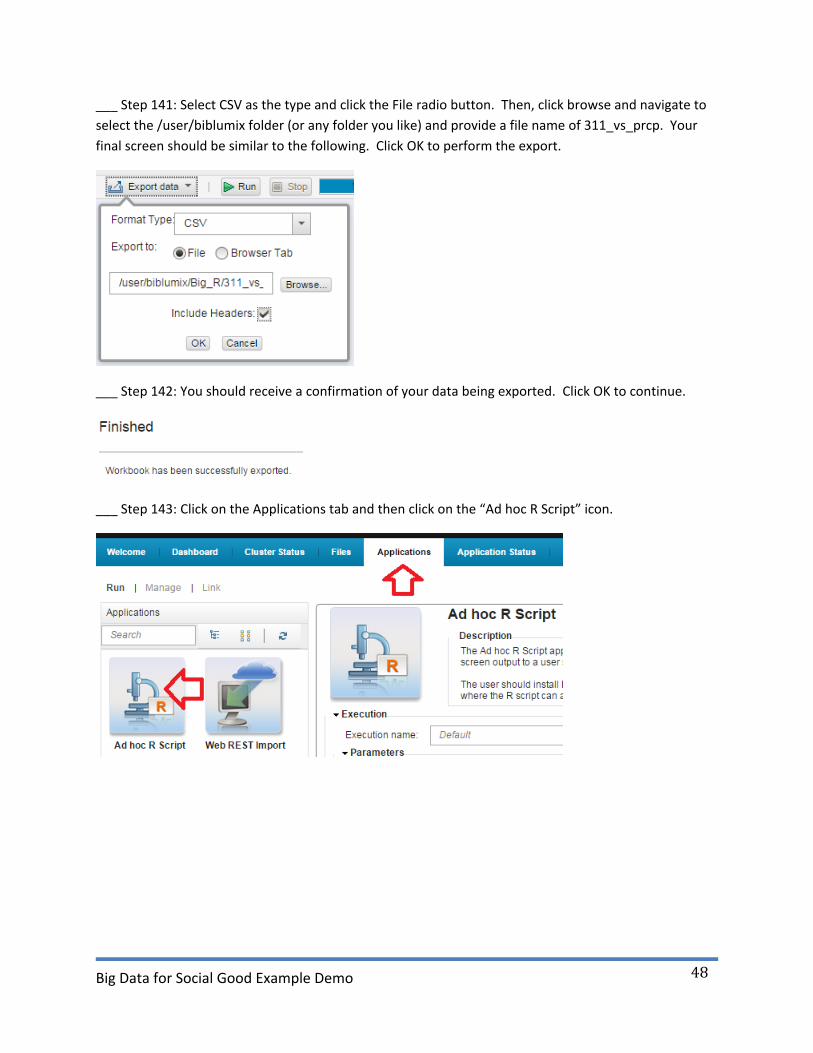
___ Step 141: Select CSV as the type and click the File radio button. Then, click browse and navigate to
select the /user/biblumix folder (or any folder you like) and provide a file name of 311_vs_prcp. Your
final screen should be similar to the following. Click OK to perform the export.
___ Step 142: You should receive a confirmation of your data being exported. Click OK to continue.
___ Step 143: Click on the Applications tab and then click on the “Ad hoc R Script” icon.
Big Data for Social Good Example Demo
49
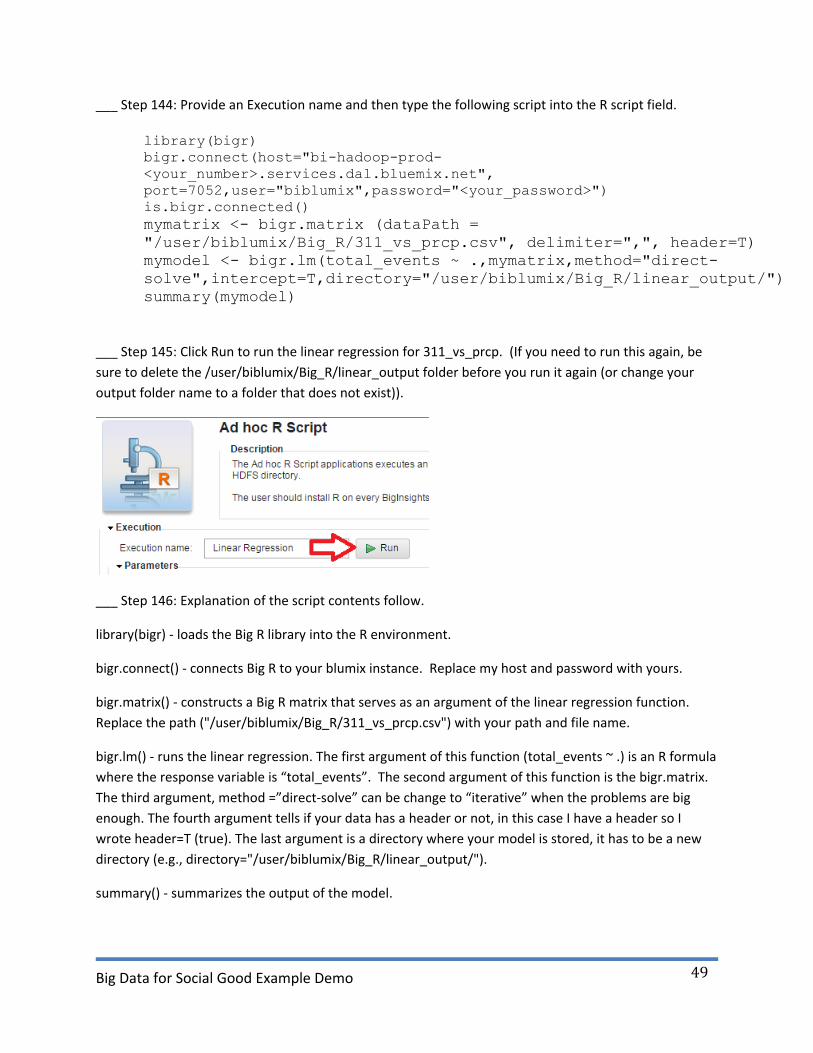
___ Step 144: Provide an Execution name and then type the following script into the R script field.
library(bigr)
bigr.connect(host="bi-hadoop-prod-
<your_number>.services.dal.bluemix.net",
port=7052,user="biblumix",password="<your_password>")
is.bigr.connected()
mymatrix <- bigr.matrix (dataPath =
"/user/biblumix/Big_R/311_vs_prcp.csv", delimiter=",", header=T)
mymodel <- bigr.lm(total_events ~ .,mymatrix,method="direct-
solve",intercept=T,directory="/user/biblumix/Big_R/linear_output/")
summary(mymodel)
___ Step 145: Click Run to run the linear regression for 311_vs_prcp. (If you need to run this again, be
sure to delete the /user/biblumix/Big_R/linear_output folder before you run it again (or change your
output folder name to a folder that does not exist)).
___ Step 146: Explanation of the script contents follow.
library(bigr) - loads the Big R library into the R environment.
bigr.connect() - connects Big R to your blumix instance. Replace my host and password with yours.
bigr.matrix() - constructs a Big R matrix that serves as an argument of the linear regression function.
Replace the path ("/user/biblumix/Big_R/311_vs_prcp.csv") with your path and file name.
bigr.lm() - runs the linear regression. The first argument of this function (total_events ~ .) is an R formula
where the response variable is “total_events”. The second argument of this function is the bigr.matrix.
The third argument, method =”direct-solve” can be change to “iterative” when the problems are big
enough. The fourth argument tells if your data has a header or not, in this case I have a header so I
wrote header=T (true). The last argument is a directory where your model is stored, it has to be a new
directory (e.g., directory="/user/biblumix/Big_R/linear_output/").
summary() - summarizes the output of the model.

Big Data for Social Good Example Demo
50
___ Step 147: If you navigate to the /tmp folder, you should see a new file with the output of your
application run that looks similar to the following.
___ Step 148: Under the Files tab, navigate to the output folder. In our example, we went to
/user/biblumix/Big_R/linear_output and then we clicked on the stats.csv file to look at the results.
___ Step 149: In the previous step, the screen shot shows the R2 values. We were hopeful these would
be in the 0.8 range or higher. Since these R2 values are so low, there is no linear relationship between
311 events and rain in NYC.
___ Step 150: Feel free to explore other methods like bigr.glm (generalized linear models), bigr.svm
(support vector machine), bigr.naive.bayes (naive Bayes classifier), bigr.logistic.regression (logistic
regression) and bigr.kmeans (K-means clustering).
___ Step 151: For additional information, the Big R tutorials can be found at the following.
https://developer.ibm.com/hadoop/docs/biginsights-value-add/big-r/bigr-tutorial/
…and the following link as well…
http://www-
01.ibm.com/support/knowledgecenter/SSPT3X_2.1.2/com.ibm.swg.im.infosphere.biginsights.analyze.d
oc/doc/t_analyze_data_bigr.html
Big Data for Social Good Example Demo
51
Optional Client Environments Just as a reminder, you are not required to use a Windows, Mac, Linux or any other client environment
as part of the challenge. Should you desire to use one, you might find this section of the document
useful for downloading, installing, and running certain programs to perform analytics on the data in your
Analytics for Hadoop Service on Bluemix.net.
Windows Environment Downloads This section is completely optional. However, there might be some downloads that can take some time
if you choose to run software on Windows to connect to your Analytics for Hadoop Service on Bluemix.
So, please at least review the steps below to see if you have any interest in starting downloads for future
steps that require a Windows environment.
___ Step 152: If you would like to install Eclipse for Windows in order to have a client to run SQL from or
do other interactions with your cluster in the cloud, please follow the directions found here:
http://www-
01.ibm.com/support/knowledgecenter/SSPT3X_3.0.0/com.ibm.swg.im.infosphere.biginsights.install.doc
/doc/c0059438.html
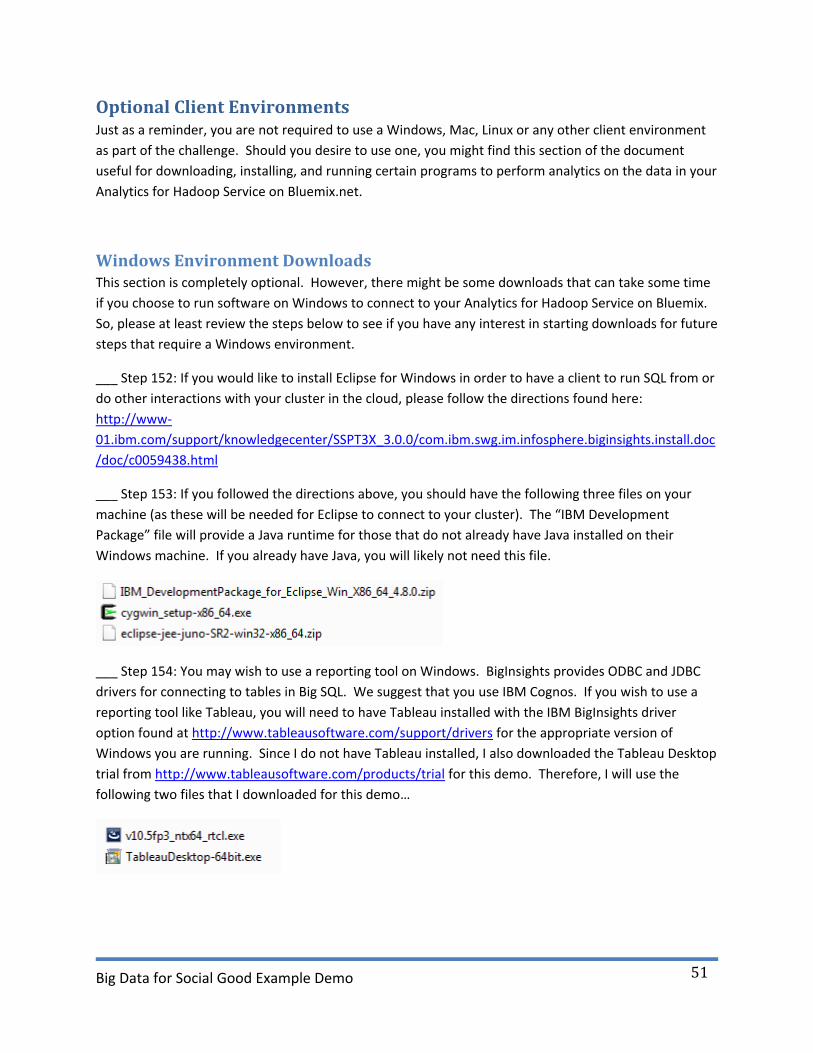
___ Step 153: If you followed the directions above, you should have the following three files on your
machine (as these will be needed for Eclipse to connect to your cluster). The “IBM Development
Package” file will provide a Java runtime for those that do not already have Java installed on their
Windows machine. If you already have Java, you will likely not need this file.
___ Step 154: You may wish to use a reporting tool on Windows. BigInsights provides ODBC and JDBC
drivers for connecting to tables in Big SQL. We suggest that you use IBM Cognos. If you wish to use a
reporting tool like Tableau, you will need to have Tableau installed with the IBM BigInsights driver
option found at http://www.tableausoftware.com/support/drivers for the appropriate version of
Windows you are running. Since I do not have Tableau installed, I also downloaded the Tableau Desktop
trial from http://www.tableausoftware.com/products/trial for this demo. Therefore, I will use the
following two files that I downloaded for this demo…
Big Data for Social Good Example Demo
52
Install and Setup Eclipse on Windows In a previous section, we mentioned the files you would likely need to get Eclipse running on Windows.
We will now use these files in the following steps to install and setup Eclipse.
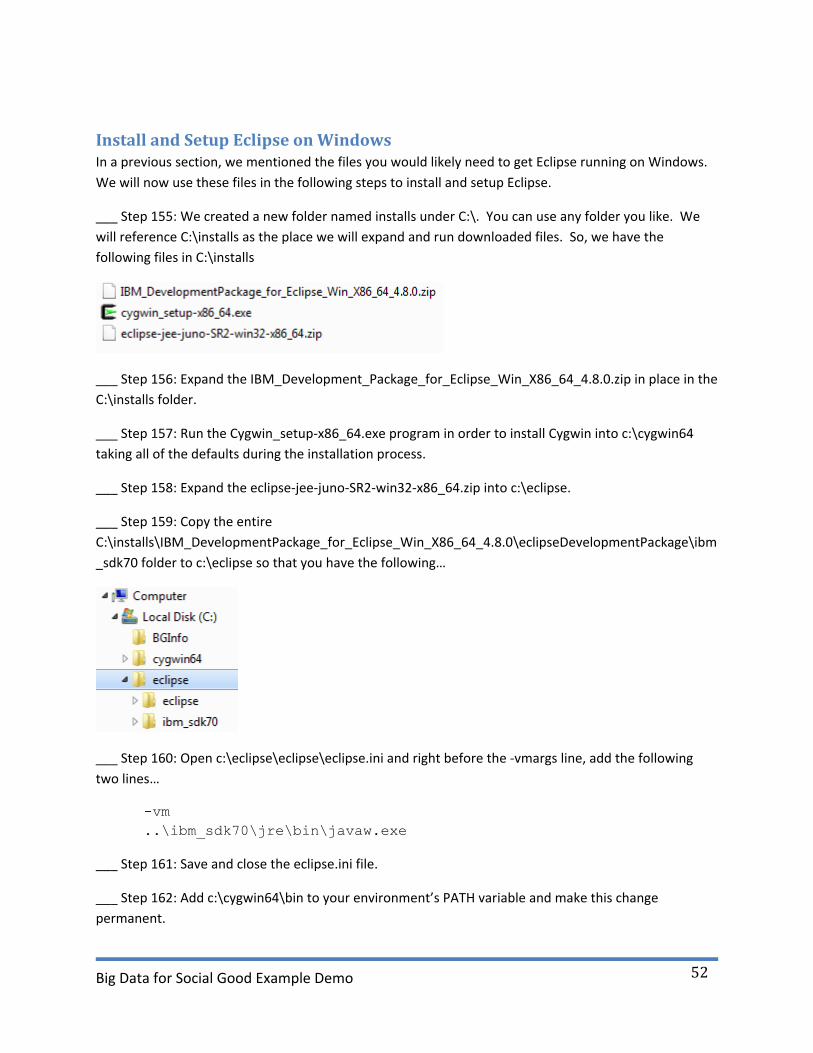
___ Step 155: We created a new folder named installs under C:\. You can use any folder you like. We
will reference C:\installs as the place we will expand and run downloaded files. So, we have the
following files in C:\installs
___ Step 156: Expand the IBM_Development_Package_for_Eclipse_Win_X86_64_4.8.0.zip in place in the
C:\installs folder.
___ Step 157: Run the Cygwin_setup-x86_64.exe program in order to install Cygwin into c:\cygwin64
taking all of the defaults during the installation process.
___ Step 158: Expand the eclipse-jee-juno-SR2-win32-x86_64.zip into c:\eclipse.
___ Step 159: Copy the entire
C:\installs\IBM_DevelopmentPackage_for_Eclipse_Win_X86_64_4.8.0\eclipseDevelopmentPackage\ibm
_sdk70 folder to c:\eclipse so that you have the following…
___ Step 160: Open c:\eclipse\eclipse\eclipse.ini and right before the -vmargs line, add the following
two lines…
-vm
..\ibm_sdk70\jre\bin\javaw.exe
___ Step 161: Save and close the eclipse.ini file.
___ Step 162: Add c:\cygwin64\bin to your environment’s PATH variable and make this change
permanent.
Big Data for Social Good Example Demo
53
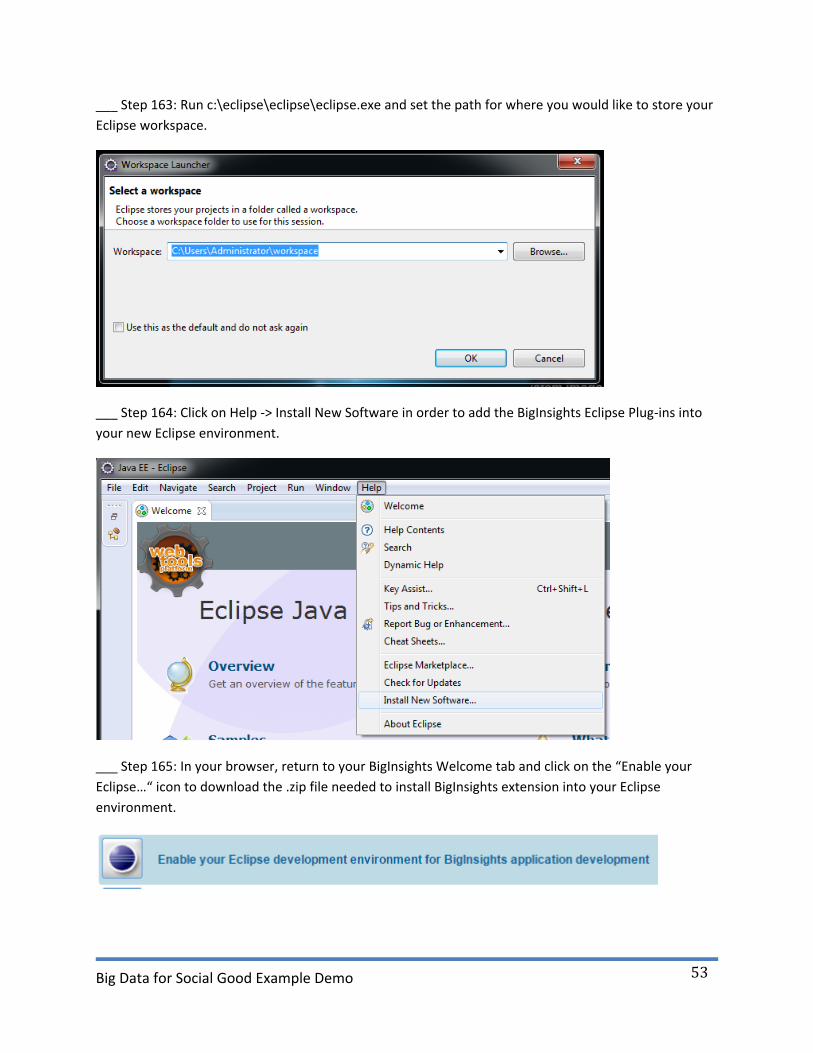
___ Step 163: Run c:\eclipse\eclipse\eclipse.exe and set the path for where you would like to store your
Eclipse workspace.
___ Step 164: Click on Help -> Install New Software in order to add the BigInsights Eclipse Plug-ins into
your new Eclipse environment.
___ Step 165: In your browser, return to your BigInsights Welcome tab and click on the “Enable your
Eclipse…“ icon to download the .zip file needed to install BigInsights extension into your Eclipse
environment.

Big Data for Social Good Example Demo
54
___ Step 166: Expand the .zip file into a folder (as you will need to point to this folder instead of the .zip
file in the next step).
___ Step 167: In your Eclipse “Install” window, click the Add button and then click the Local button to
locate the folder from the .zip file you just downloaded and expanded.
___ Step 168: It might be easier to type the folder location into the field as shown below. Click the OK
button.

Big Data for Social Good Example Demo
55
___ Step 169: Provide a “Name:” to Eclipse for this folder. Then click OK.
___ Step 170: You can click the triangles to expand both options. If you are using iLog, you can select
that option. Since this is not required for the demo, we only installed the first option. Click Next.
___ Step 171: Click the Next button again.
___ Step 172: To continue, you will need accept the license agreement and click Finish. Depending on
the speed of your machine, this may take a few minutes to complete.
___ Step 173: You will likely receive a warning about the software you are installing. Click OK to
continue the install.
Big Data for Social Good Example Demo
56
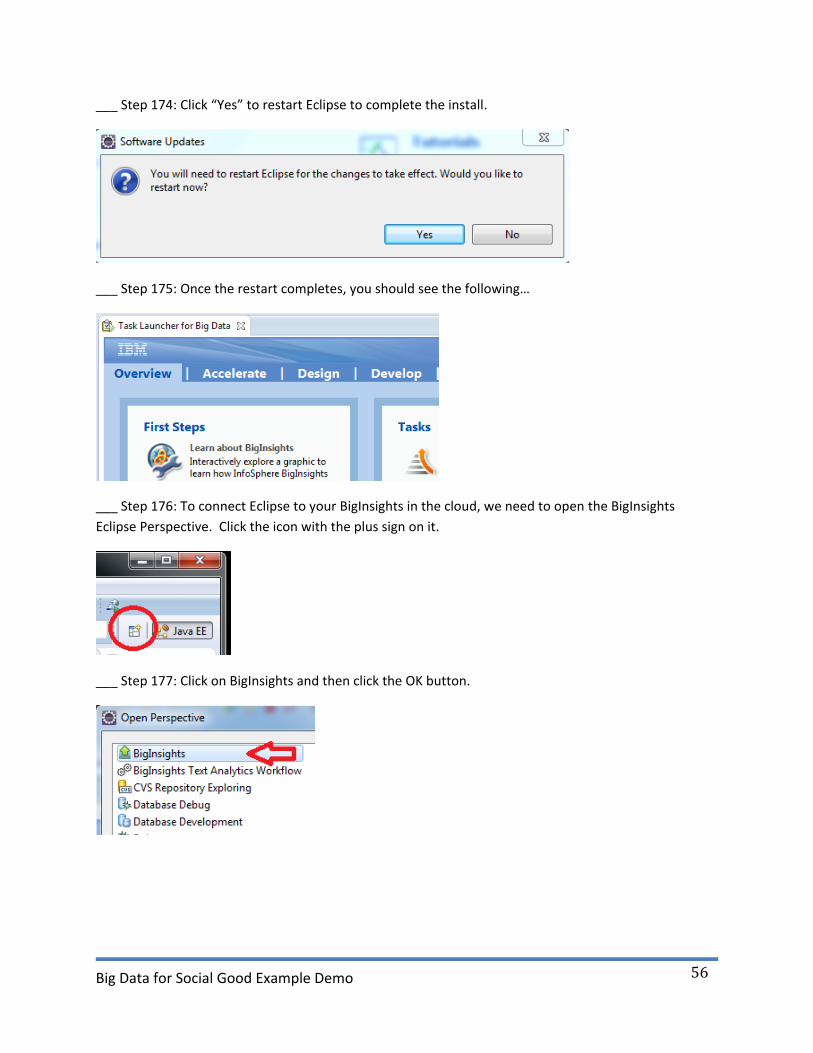
___ Step 174: Click “Yes” to restart Eclipse to complete the install.
___ Step 175: Once the restart completes, you should see the following…
___ Step 176: To connect Eclipse to your BigInsights in the cloud, we need to open the BigInsights
Eclipse Perspective. Click the icon with the plus sign on it.
___ Step 177: Click on BigInsights and then click the OK button.

Big Data for Social Good Example Demo
57
___ Step 178: Your arrangement of tabs within Eclipse should change. In the lower-left-hand corner,
right-click on BigInsights Servers and select “New” in order to create a new connection.
___ Step 179: Copy and paste your BigInsights Console URL, hit the tab key twice, type in your id
(biblumix) and type or paste in your password. Clicking on the “Test connection” button should report
success.
___ Step 180: Click OK to close the success window. Optionally click the “Save password” checkbox.
Then click Finish to save your connection settings.
___ Step 181: Now, we will create a project and an SQL file to show you how to run SQL from Eclipse on
Windows. First, create a new BigInsights project.

Big Data for Social Good Example Demo
58
___ Step 182: Provide a name for your project, like “Example SQL” and click Finish.
Query the same Tables from Eclipse on Windows Using the project you created in the previous step, you will now create an SQL file to run SQL on Big SQL
from Eclipse.

Big Data for Social Good Example Demo
59
___ Step 183: Since the right-click option in Eclipse is context dependent, you will need to left-click on
the “Example SQL” project folder and then right-click to select New -> SQL Script.
___ Step 184: When the “New SQL File” window pops up, provide a file name and click the Finish button.

Big Data for Social Good Example Demo
60
___ Step 185: Select the “Big SQL” connection option that connects to your cluster on Bluemix. Then
click Finish.
___ Step 186: You should now have an empty SQL file in front of you where you can click the triangle on
the left of the empty file to see the connection details. You can then copy/paste or type the SQL you
would like to run. (Please ignore any syntax warnings. This should be fixed in a future release.) To run
your SQL, you can click on the green run circle in the upper right. (You can also highlight the SQL you
wish to run and hit the F5 key.)
___ Step 187: In the bottom section of Eclipse under your SQL file, you should see the results of your
query. (You can double-click on any tab to maximize your view of that tab. Simply double-click on the
tab again to return it to its previous size and location.)
___ Step 188: Feel free to try other SQL queries in this window or a new file as you see fit.
Big Data for Social Good Example Demo
61
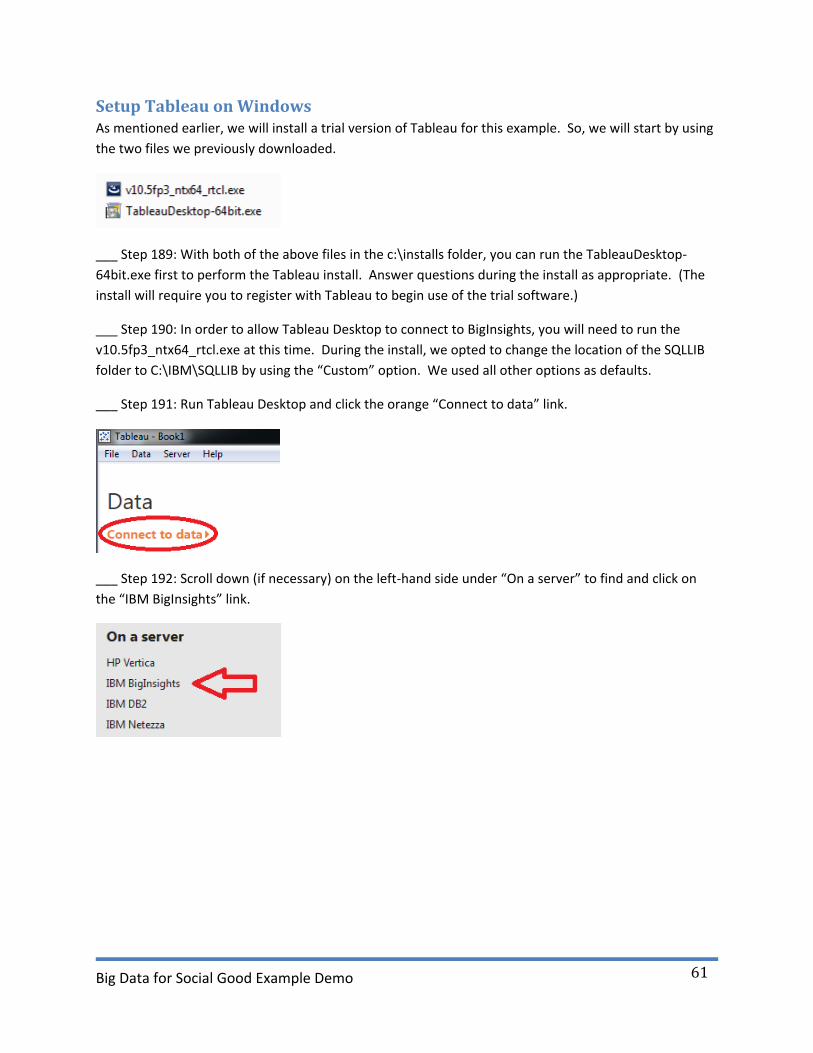
Setup Tableau on Windows As mentioned earlier, we will install a trial version of Tableau for this example. So, we will start by using
the two files we previously downloaded.
___ Step 189: With both of the above files in the c:\installs folder, you can run the TableauDesktop-
64bit.exe first to perform the Tableau install. Answer questions during the install as appropriate. (The
install will require you to register with Tableau to begin use of the trial software.)
___ Step 190: In order to allow Tableau Desktop to connect to BigInsights, you will need to run the
v10.5fp3_ntx64_rtcl.exe at this time. During the install, we opted to change the location of the SQLLIB
folder to C:\IBM\SQLLIB by using the “Custom” option. We used all other options as defaults.
___ Step 191: Run Tableau Desktop and click the orange “Connect to data” link.
___ Step 192: Scroll down (if necessary) on the left-hand side under “On a server” to find and click on
the “IBM BigInsights” link.

Big Data for Social Good Example Demo
62
___ Step 193: Provide your server URL as bi-hadoop-prod-<your_number>.services.dal.bluemix.net,
Database as BIGSQL, your username and password. Click Connect to continue.
Query the same Tables from Tableau ___ Step 194: Once connected, you can see all of your Big SQL schemas on the server. Click the Schema
pulldown and select your schema. We will select the BIBLUMIX Schema in order to interact with the two
tables we created earlier and will perform the same join in a visual manner using Tableau Desktop.
Big Data for Social Good Example Demo
63
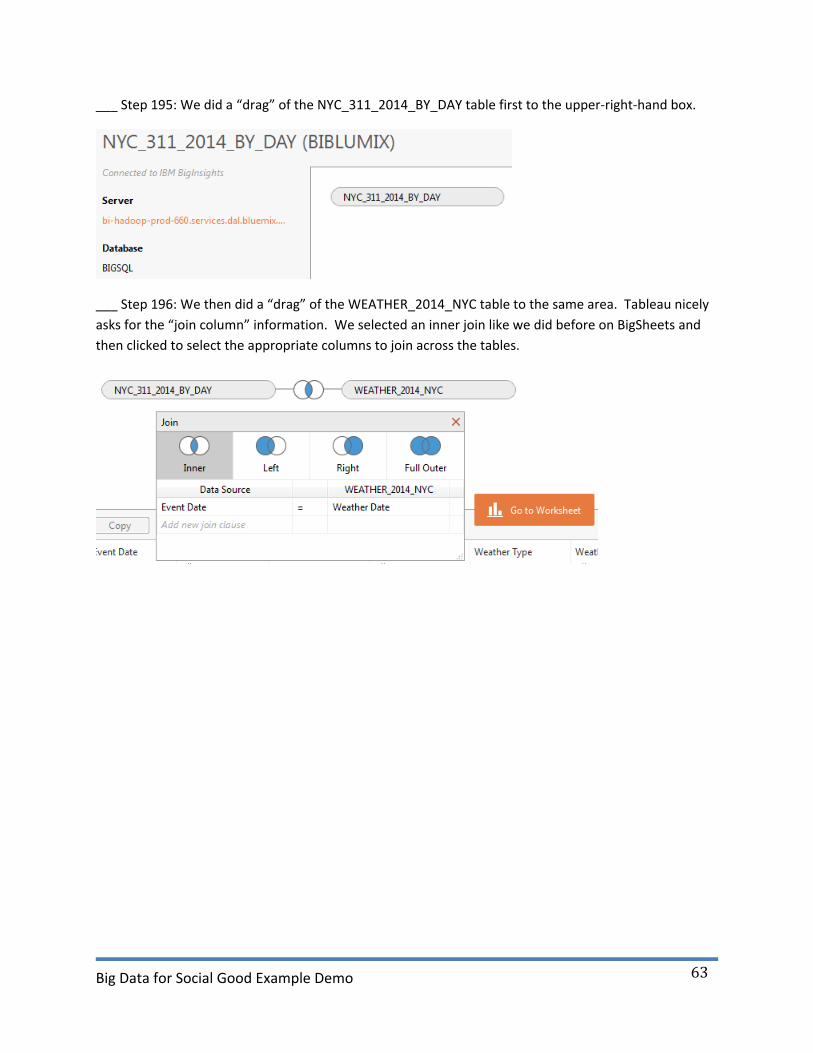
___ Step 195: We did a “drag” of the NYC_311_2014_BY_DAY table first to the upper-right-hand box.
___ Step 196: We then did a “drag” of the WEATHER_2014_NYC table to the same area. Tableau nicely
asks for the “join column” information. We selected an inner join like we did before on BigSheets and
then clicked to select the appropriate columns to join across the tables.

Big Data for Social Good Example Demo
64
___ Step 197: Next, we clicked on the “Go to Worksheet” button to open a dynamic, drag-and-drop area
in order to create the following report. To produce this report, we placed the measure named “Total
Events” on columns, the measure “Weather Amount” on columns as well, and then dimension “Event
Date” on rows. We then clicked on the dual, bar chart type to produce the following…
___ Step 198: Using the approach above, you are able to scroll left-to-right to see all 365 days of the
data and not just the 200 we viewed within the line chart in BigSheets.
Non-Windows Environment Downloads As with the Windows section above, this section is also completely optional. However, if you find that
your solution requires advanced analytics, like R, you will potentially want to consider the suggested
approach in this section. R can be run within BigInsights using IBM’s Big R package.
___ Step 199: For downloading Java, follow http://www.java.com/en/download/manual.jsp and click on
the link for your operating system.

Big Data for Social Good Example Demo
65
___ Step 200: For downloading Eclipse, follow https://eclipse.org/downloads/packages/release/juno/sr2
and click on the link for your operating system.
Install Java and Eclipse on a Non-Windows Environment This section will cover installation of Java and Eclipse in a non-Windows environment. For this example,
we used Red Hat Enterprise Linux v6.5.
___ Step 201: Ensure the following files are on the machine you wish to use.
___ Step 202: As root, we ran the rpm -I jre… to install Java. We ran java -version to check the install.
___ Step 203: As root, we uncompressed the .gz and then the .tar with the following commands.
___ Step 204: Navigate to the expanded eclipse folder and run the eclipse executable.
___ Step 205: Select the workspace location you desire and click OK.

Big Data for Social Good Example Demo
66
Install the BigInsights Eclipse plug-in In this section, you will pull a .zip file from your cluster and install the plug-in into your Eclipse
environment.
___ Step 206: Open a browser and login to your Analytics for Hadoop Service.
___ Step 207: On the Welcome tab, click the icon named “Enable your Eclipse…” to download the plug-
in.
___ Step 208: Save the .zip file to a location on your local machine.
Big Data for Social Good Example Demo
67
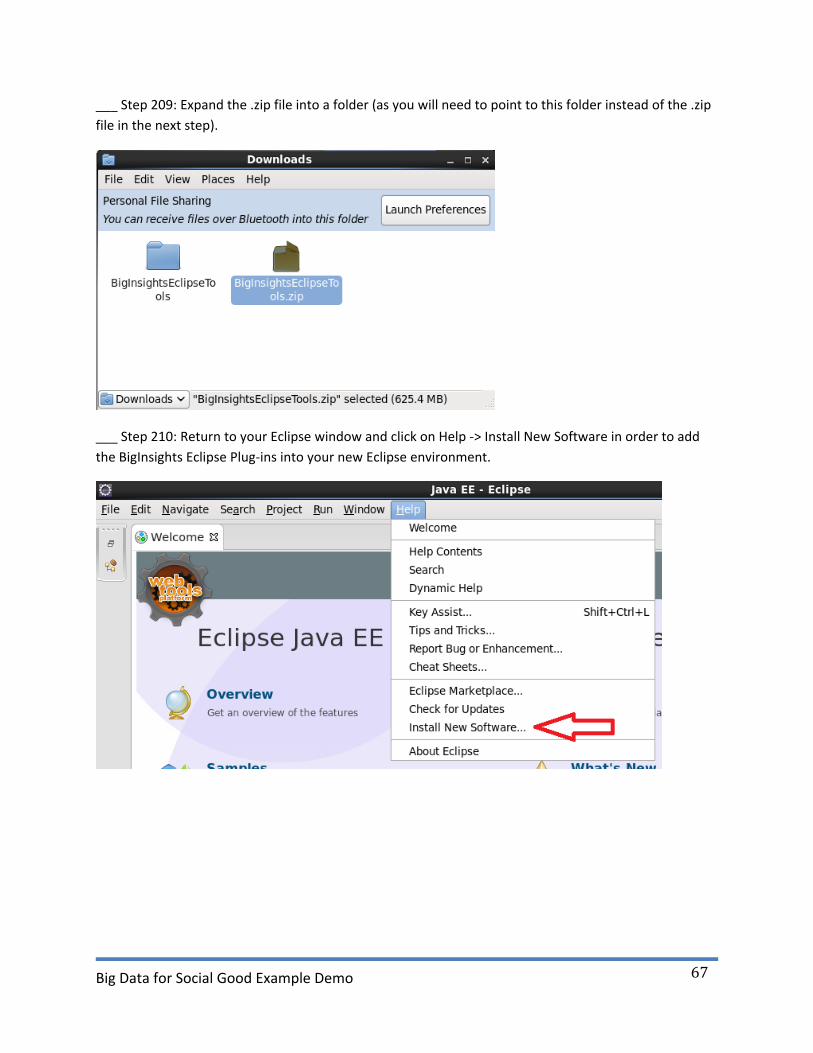
___ Step 209: Expand the .zip file into a folder (as you will need to point to this folder instead of the .zip
file in the next step).
___ Step 210: Return to your Eclipse window and click on Help -> Install New Software in order to add
the BigInsights Eclipse Plug-ins into your new Eclipse environment.

Big Data for Social Good Example Demo
68
___ Step 211: In your Eclipse “Install” window, click the Add button and then click the Local button to
locate the folder from the .zip file you just downloaded and expanded.
___ Step 212: Provide the location of your expanded zip file to Eclipse here and then click OK.

Big Data for Social Good Example Demo
69
___ Step 213: Provide a Name for this folder to Eclipse to track its location. Click OK.
___ Step 214: You can click the triangles to expand both options. If you are using iLog, you can select
that option. Since this is not required for the demo, we only installed the first option. Click Next.
___ Step 215: Click the Next button again.
___ Step 216: To continue, you will need accept the license agreement and click Finish. Depending on
the speed of your machine, this may take a few minutes to complete.
___ Step 217: You will likely receive a warning about the software you are installing. Click OK to
continue the install.
Big Data for Social Good Example Demo
70
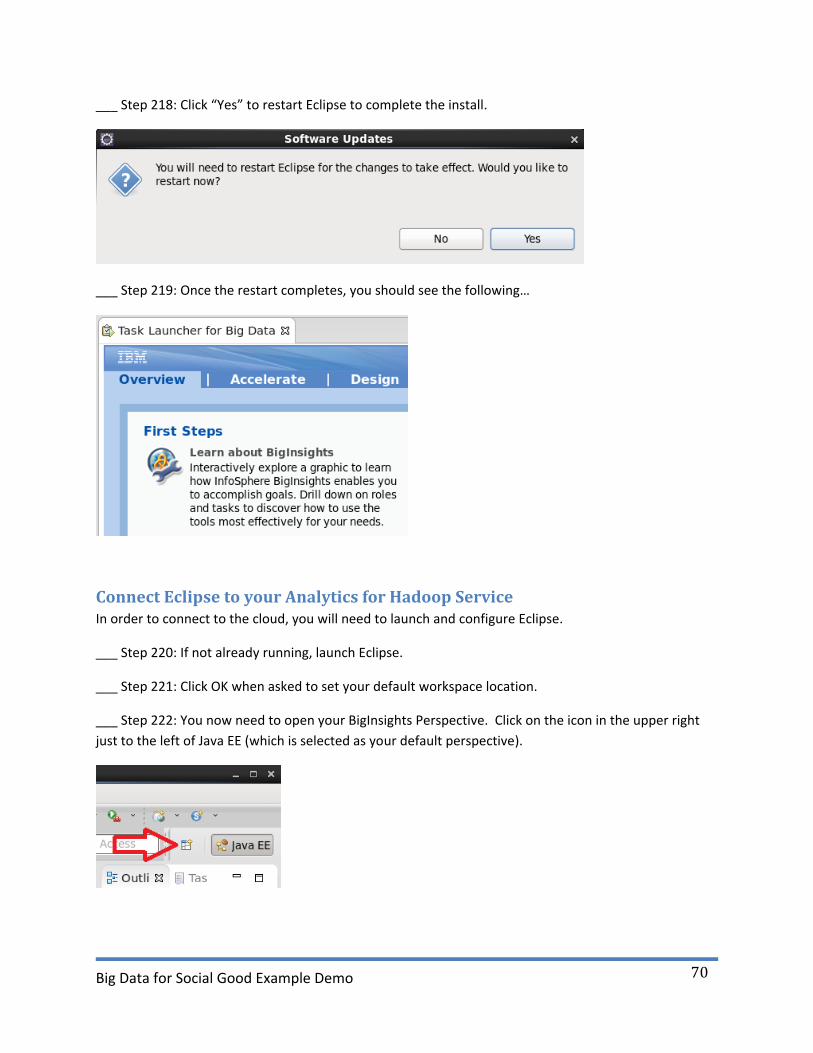
___ Step 218: Click “Yes” to restart Eclipse to complete the install.
___ Step 219: Once the restart completes, you should see the following…
Connect Eclipse to your Analytics for Hadoop Service In order to connect to the cloud, you will need to launch and configure Eclipse.
___ Step 220: If not already running, launch Eclipse.
___ Step 221: Click OK when asked to set your default workspace location.
___ Step 222: You now need to open your BigInsights Perspective. Click on the icon in the upper right
just to the left of Java EE (which is selected as your default perspective).

Big Data for Social Good Example Demo
71
___ Step 223: Select BigInsights and click OK.
___ Step 224: To add a BigInsights Server connection, right click on “BigInsights Servers” in the lower-
left-hand corner and select “New”. Fill in your credential, click the “Test connection” button, click OK,
optionally click the “save password” checkbox, and then click Finish.
___ Step 225: We will now run some SQL from Eclipse on our machine to the cluster on Bluemix. We
will need a project, a new SQL file, and some SQL. First, go to the File -> New menu and select
“BigInsights Project”.

Big Data for Social Good Example Demo
72
___ Step 226: Name your project “Example SQL VM” and click Finish.
___ Step 227: Since right-click menus are context dependent, click to highlight the “Example SQL VM”
folder and then right-click and select New -> SQL Script.

Big Data for Social Good Example Demo
73
___ Step 228: Name your file something like “simple_SQL_VM.sql” and click Finish to create the file.
___ Step 229: Select the connection that matches the connection information we created earlier to your
Bluemix cluster and click Finish.
Big Data for Social Good Example Demo
74
___ Step 230: You should now have an empty SQL file with connection information at the top. You can
click the triangle to expand the connection information section. You can also type in simple SQL like the
following. (This assumes you have loaded data and created tables as outlined in the BigSheets and Big
SQL tables sections above.)
use biblumix;
select event_date, total_events, weather_amount from
nyc_311_2014_by_day, weather_2014_nyc where event_date =
weather_date ORDER BY event_date;
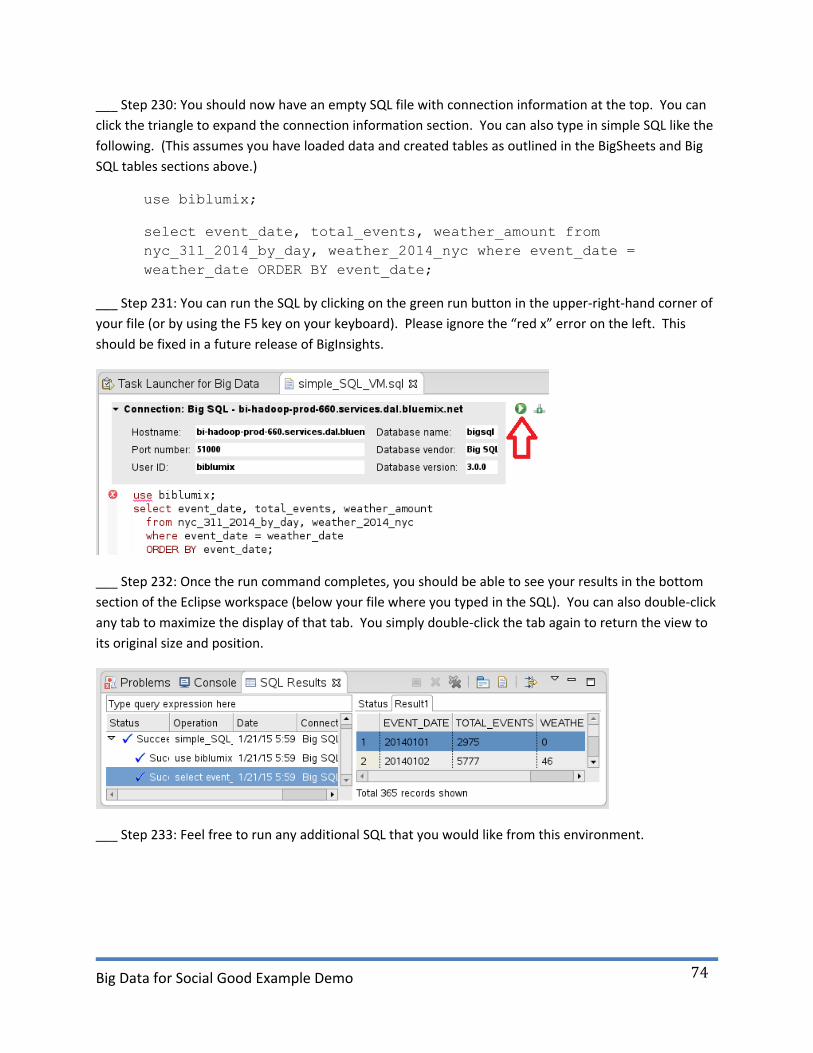
___ Step 231: You can run the SQL by clicking on the green run button in the upper-right-hand corner of
your file (or by using the F5 key on your keyboard). Please ignore the “red x” error on the left. This
should be fixed in a future release of BigInsights.
___ Step 232: Once the run command completes, you should be able to see your results in the bottom
section of the Eclipse workspace (below your file where you typed in the SQL). You can also double-click
any tab to maximize the display of that tab. You simply double-click the tab again to return the view to
its original size and position.
___ Step 233: Feel free to run any additional SQL that you would like from this environment.