big data analyticsdocshare04.docshare.tips/files/24804/248041979.pdf · business and uncover the...
TRANSCRIPT

Managementkompass
Big Data Analytics
:Trends
First Mover Advantage
:Think Tank
Anti Financial
Crime Management
:Practice
OTTO, PAYD, dm drogerie

:Contents
Preface
Executive summary
3
“Leading edge knowledge” 4
Trends
First Mover Advantage
6
Think Tank
On the data treadmill
8
Hype or disruption? 11 Anti Financial Crime Management 16
Tools
Getting started with Big Data
13
Cross-check
14
Practice
_ OTTO: Automated decisions
18
_ A revolution in vehicle insurance 20 _ dm-drogerie: Staff planning 22
Viewpoint
Clarifying legal issues
23
References
24
Glossary
26
Publication data
Disclaimer: All information in this booklet has been carefully researched. The
editor, publisher and distributor accept no liability for the accuracy and
completeness of the content or for any interim changes.
© March 2014
Steria Mummert Consulting GmbH
Hans-Henny-Jahnn-Weg 29, 22085 Hamburg
F.A.Z.-Institut für Management-, Markt- und Medieninformationen GmbH, Frankenallee 68–72, 60327 Frankfurt am Main (also the publisher; general manager: Volker Sach)
All rights reserved, including photographic reproduction and storage in
electronic media.
Editor-in-chief and main author (unless specified otherwise): Eric Czotscher Design and typesetting: Christine Lambert Proofreading: Anna-Luise Knetsch
Printing and processing:
Boschen Offsetdruck GmbH
Alpenroder Straße 14, 65936 Frankfurt am Main
www.boschendruck.de
Printed using eco inks on environmentally-friendly paper.
This booklet has been produced with no adverse impact on the climate. The associated CO2 emissions have been offset through climate protection projects.
ISBN: 978-3-89981-387-6

:Preface
//// For most companies Big Data means having to
deal with spiralling mountains of data. However, Big
Data Analytics methods and tools create value
through their ability to analyse data of different kinds,
to aggregate it and connect it in order to recognise
patterns - whether in customers’ behaviour or risk
factors. Best practices show us that we can attain a
new level of data analysis with Big Data that puts its
current business intelligence application in the shade.
The revelations about the National Security Agency
(NSA) in the US show that there are also risks
involved in doing this. Companies wishing to fully
exploit their data potential should ensure they have
good data governance right from the start. Informing
clients about the advantages of new tools, such as
those used for product design or security, is part of
this governance.
<< Huge opportunities arise as a result
of the intelligent handling of very
large amounts of data. Thus, targeted
customer groups experience a
paradigm change: using Big Data,
companies like ours can make the
right offer to clients at the right time
through the right channels -
independent of the environment or
the hitherto commonly-used online
targeting methods.
Bernhard Brugger, CEO Central
Europe, PAYBACK GmbH
>>
Using Best Practice, the Big Data Analytics
“management compass” reveals the possibilities that
are opened up by new data analysis methods.
However, these are still early days for the subject,
and company decision-makers need to throw their
own ideas into the mix. In principle, every sector and
business segment can use Big Data. You are limited
only by your own imagination.
Big Data Analytics does not necessarily lead to new
insight or new business models, but the current
applications show that, at the very least, the efficiency
and effectiveness of existing processes can be
improved. In an era of non-differentiated products and
services, data-based business processes can make
all the difference. In order to keep costs under control,
a structured approach to Big Data Analytics is
recommended.
<< Big Data has been integrated into
the logistics sector for a long time.
A good example of this is our
“Resilience 360” solution, in which
the analysis of aggregated data
helps to improve supply chains and
protect them against disruption.
This ensures smooth operations
and improves customer
satisfaction.
Dr. Markus Kückelhaus, Head of Trend
research, DHL Customer Solutions &
Innovation
>>
The benchmarks of value-orientated company
management form seven central management
disciplines. Each article in this document contains a
management compass with the relevant disciplines
highlighted. The “cross-check” on page 14 provides a
general overview.
Big Data Analytics provides new insights into your
business, some of which may be counter-intuitive. In
this sense, Big Data can really open our eyes. As
Goethe said, “you only see what you know”. We hope
you find this booklet interesting. II
Steria Mummert Consulting
F.A.Z.-Institut
1 Costs Management
2 Transformation Management
3 Process Management
4 Innovation Management
5 Customer Management
6 Cooperation Management
7 Risk Management
3

:Executive summary
4
“Leading edge knowledge”
Company decision-makers can use Big Data Analytics to learn more about their
business and uncover the hidden success factors. This knowledge enables
better decisions and leads to better company results. However, the pressure to
act on Big Data is currently coming more from data centres than it is from the
strategic side of business: in IT, new technological solutions to manage the
growing data flow are urgently required.
1 : Management recommendation
Hype or revolution: you should use the new methods
and technologies for the analysis of large volumes of
diverse - and polystructured - data. As best practices
from different sectors shows, Big Data has the
potential for both new business models and new
competitors. As a disruptive technology, Big Data
may unbalance existing markets. Therefore, it is
worth taking a closer look.
Big Data delivers specific information with commercial
relevance. Thus banks, for example, can plan which
customers they should contact, when and about what
financial product. If specific information is brought
together, more precise statements about the
creditworthiness of people or companies can be
made. Attempted insurance fraud can be discovered
using specific data patterns, etc.
The Big Data “data scientists” have a different
approach than traditional analysts. Instead of gaining
a causal understanding of relationships and then
testing them against reality, these data scientists
allow the data to speak for itself, while they apply
intelligent algorithms to process large volumes of the
most varied data. New knowledge arises through
creativity and experimentation, and through testing
hypotheses or by chance.
Big Data goes beyond Business Intelligence (BI). It
requires new technologies, as well as new forms of
analysis and presentation, of which many IT
departments have had no experience. Compared to
BI, Big Data has greater tool flexibility. Companies
can assemble their toolbox individually and integrate
existing BI applications into it. Much of this is still in
development.
2
2 : Management recommendation
Big Data supports the control of fast-growing data
volumes. It helps with in-depth analysis of these data
volumes and in the rapid production of
recommendations for your business. Without suitable
analysis tools, this would be like looking for a needle
in a haystack.
In Big Data applications, the processing of datasets is
spread among computer clusters. This also enables
the efficient analysis of large volumes of data. One
consequence of this is that data specialists do not
have to take any statistical samples for their analyses,
but can work with the entire data stock. This makes
prognoses more reliable.
3 : Management recommendation
Use additional data sources to gain a deeper
understanding of your business. As well as analysing
structured data from your operational systems, Big
Data enables you to consider unstructured data like
text, speech, photos and videos from internal and
external sources. For example, an analysis of social
media comments can teach you more about your
customers’ needs.

Executive Summary // Big Data Analytics // Managementkompass
5
The bulk of existing data is unstructured. A content-
based classification through textual analysis
transforms unstructured data into a structured form.
This is how quantitative and qualitative analyses
become possible. For instance, companies already
use unstructured social media data in order to gain
advance warning of market trends and reputational
risks.
4 : Management recommendation
Test the possibilities of Big Data for real-time data
analysis. This is especially important if you offer
digital and mobile services, for which you must react
quickly to customer wishes to gain a competitive
advantage. Big Data Analytics can also be integrated
into business processes in order to make decisions
automatically.
Processes supported by Big Data can provide
customers with timely offers that are suitable for their
situations, based on the location data of their mobile
devices or their digital surfing patterns. Credit card
fraud attempts and the like can be automatically
stopped.
5 : Management recommendation
Data is often so vitally important for service providers
that the transformation into a data-based company
can produce a decisive competitive advantage.
This applies not only to customer and price
management but also to operations such as HR,
Finance or Risk Control. How does your business
model work? Could you optimise, or possibly
automate, your business decisions based on data?
In using Big Data, you should adopt a structured
approach and take into account possible data risks
(see checklist on page 13). Support from top
management is just as important in this as close
cooperation between IT and other departments. You
should ensure solid data governance right from the
start. This includes transparency of the data stock,
data sources and data variety. Only this will allow you
to manage, validate and analyse the data effectively.
Data from external sources contains risks: it may
come from hacked websites and contain sensitive
personal data, false links or viruses, etc. In particular,
social media data contains a lot of “noise” that must
be filtered out.
Managers often make decisions based on gut instinct.
They do consider the available information but this is
usually incomplete and not always up-to-date, so their
intuition must fill the gap. Thanks to Big Data, these
gaps in information could in the future become much
smaller. However, management experience and
intelligence will remain important for strategic
decisions. II
The make-up of Big Data: The three Vs
Volume
Data volume
Since IT-supported business processes continuously produce data, more and more
companies and institutions are holding gigantic, petabyte-sized data mountains.
Alongside internal data, a variety of external data sources, devices and machines are
producing a constant data stream.
Variety
Data variety
Data comes from many sources and is of various kinds. In broad terms, it can be
classified as unstructured, semi-structured and structured. The technological
evaluation of such polystructured data through textual analysis or image recognition
has improved massively.
Velocity
Data speed
Data-supported processes require data collection, integration and analysis to be
carried out increasingly quickly - often in real time - in order to reach relevant
conclusions or induce business actions. Furthermore, data structures, sources and
interfaces are changing very quickly.

6
:Trends
First Mover Advantage
Big Data is trendy and, by virtue of the data espionage and National Security
Agency (NSA) scandal, has even made headline news in the global media. In
practice, however, companies are not fully using the new possibilities presented
by Big Data. Users often limit themselves to the trusted field of Business
Intelligence (BI), but with more data being processed, it becomes commercially
interesting when Big Data brings up new offers and business models.
Eric Czotscher
is Head of
Research/Market research
and editor-in-chief of the
F.A.Z. Institute for
Management, Market and
Media Information.
//// Even when companies talk a lot about Big Data,
only a few of them move forward with innovative
applications – it’s an opportunity for pioneers. With
the new kind of data analysis, companies can learn
more about their customers’ needs and create offers
with added value. Changes in the market can be
identified earlier and companies can then react
quicker to them. But this does not cover the entire
field of application. Based on Big Data Analytics,
intelligent products and services can be developed
which notice changes in the environment and
customer needs and adapt to them. In this case, data
from mobile devices, sensors, social media news,
photos, videos, etc. are used as input.
There is already a host of IT tools for Big Data but
most companies do not know how to use them.
According to a recent study by Saugatuck
Technology, 71% of IT and business decision-makers
regard Big Data Analytics as competitively relevant.
However, 59% lack the resources to use it. Only half
of them have introduced Big Data Analytics into their
businesses. In order to discover the gold in the data
mountain, not only IT skills but also mathematical
knowledge and creativity are required. “Data
scientists”, who hunt out hidden trends using
intelligent algorithms, are much sought-after. They
supply new knowledge and create competitive
advantage for companies. As Chris Anderson, editor
of technology magazine “Wired”, puts it: “The new
availability of huge amounts of data, along with the
statistical tools to crunch these numbers, offers a
whole new way of understanding the world.”
: Pioneers as idea providers
There are some great examples of Big Data users
across diverse sectors. Automotive giant BMW links
production data, vehicle data, maintenance and
customer data to improve quality management.
Telecoms firm China Mobile analyses connection data
in order to slow customer churn and improve service
quality. Retailer dm drogerie uses Big Data in staff
planning (see page 22), while JP Morgan Chase and
many other banks use it in fraud prevention (page
16).
Financial services providers are trailblazers - they
possess extensive data and IT expertise. A survey of
100 top decision-makers carried out for the
“Branchenkompass 2013 Versicherungen” by Steria
Mummert Consulting and F.A.Z.-Institut confirms this.
According to the survey, 24% of insurers in Germany
want to invest in Big Data in the short term and 38%
in the mid to long term. By 2016, every third company
intends to have Big Data solutions in place for sales
management. One of the planned applications is
usage-based vehicle insurance premiums (see page
20).
There is also demand from government and the
public sector. According to the “Branchenkompass
2013 Public Services”, the relevance of reporting will
intensify appreciably in the near future. 69% of those
questioned expect more reporting by 2015. The
growing volume of data means that new analytical
tools will be required in order to improve
administrative control and efficiency. II
Trends // Big Data Analytics // Managementkompass
7
Customers open to intelligent offers
A 2014 survey found that German consumers tend to be
sceptical about passing on data to companies.
Nevertheless, 50% are in principle prepared to disclose
private preferences and activities so that companies can
make them bespoke offers. In addition, about 50% of
social media users accept, at least partially, companies
using information from social media in order to get to
know potential customers better and make appropriate
offers to them. However, 46% of citizens assume that
companies do not implement customers’ suggestions on
product improvements. This gives companies something
to act on. These are the results of Steria Mummert
Consulting’s study, “Potenzialanalyse Big Data”. In
Germany in January 2014, 1000 adults took part in the
survey as part of an online panel. The data is
representative of the German population.
The aim of the survey was to discover customer interest
in offers produced or optimised using Big Data.
Applications were drawn from four fields (see the table
on page 12): efficient processes, mass customisation,
market analysis and intelligent, self-regulating products.
The survey respondents provided information on their
knowledge of the current offers, the expected benefit
and their personal willingness to buy. They were also
asked for their thoughts on data protection. Among the
offers sampled were digitally supported processes that
do not (yet) use Big Data tools. Companies are
increasingly using them as data sources for Big Data
analyses.
These products also include solutions for intelligent
electricity use (smart meters) and for the intelligent
home (smart home). About 60% of respondents knew
about these products. At least 29% of them already use
smart meters and 22% use home products. For smart
meters, 33% of respondents said that they did not use
these products on data protection grounds; for smart
homes, 37% gave the same answer. The rest, on their
own admission, are simply not interested. Typically,
people who do not yet know about these products are
more receptive to using them: 74% can imagine
installing a smart meter and 65% a smart home device.
This suggests that in future the producers of smart
meters and smart home devices should explain their
services better and highlight their data protection
measures.
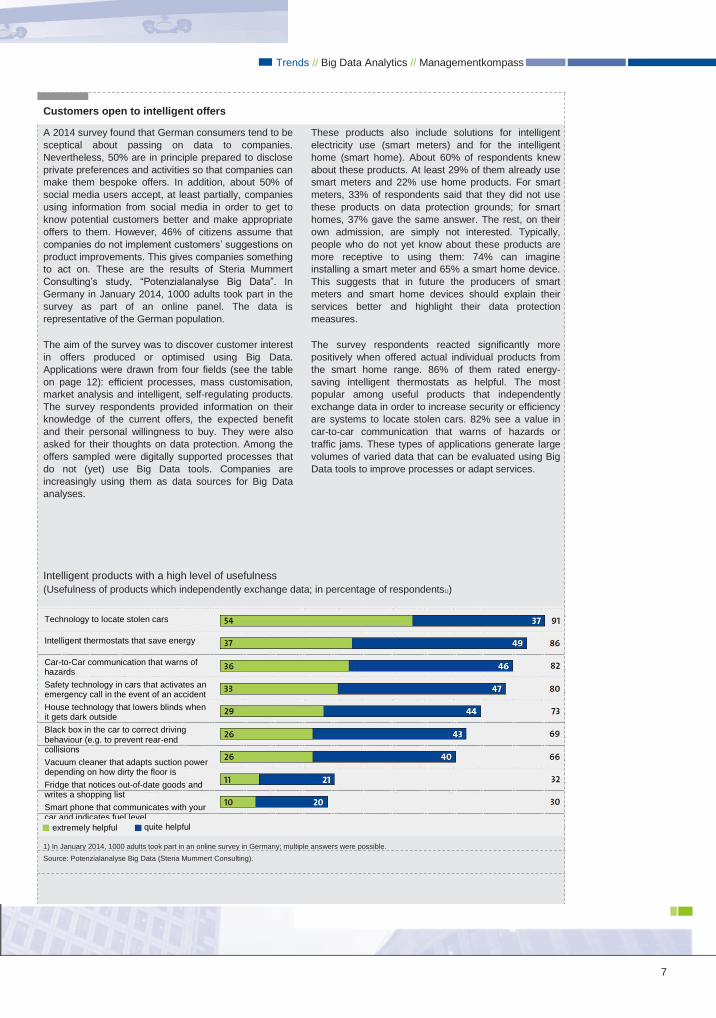
The survey respondents reacted significantly more
positively when offered actual individual products from
the smart home range. 86% of them rated energy-
saving intelligent thermostats as helpful. The most
popular among useful products that independently
exchange data in order to increase security or efficiency
are systems to locate stolen cars. 82% see a value in
car-to-car communication that warns of hazards or
traffic jams. These types of applications generate large
volumes of varied data that can be evaluated using Big
Data tools to improve processes or adapt services.
Intelligent products with a high level of usefulness
(Usefulness of products which independently exchange data; in percentage of respondents1))
1) In January 2014, 1000 adults took part in an online survey in Germany; multiple answers were possible.
Source: Potenzialanalyse Big Data (Steria Mummert Consulting).
Technology to locate stolen cars
Intelligent thermostats that save energy
Car-to-Car communication that warns of hazards
Safety technology in cars that activates an emergency call in the event of an accident
House technology that lowers blinds when it gets dark outside
Black box in the car to correct driving behaviour (e.g. to prevent rear-end collisions
Vacuum cleaner that adapts suction power depending on how dirty the floor is
Fridge that notices out-of-date goods and writes a shopping list
Smart phone that communicates with your car and indicates fuel level
extremely helpful quite helpful

8
: Think Tank
On the data treadmill
The volumes of data handled worldwide are growing in leaps and bounds. The
new Big Data technologies and methods offer the capability to analyse this data
advantageously. As such, current data warehouses must be enlarged to be
able to use innovative behaviour prediction tools. However, in view of the
constant increase in investment required for IT, companies should analyse the
economic benefit closely.
Prof. Dr. Peter Chamoni holds the Chair in Business IT, esp. Business Intelligence, at the Mercator School of Management, University of Duisburg-Essen.
Jens Kaufmann
is on the staff of the
Department of Business IT,
esp. Business Intelligence,
at the Mercator School of
Management, University of
Duisburg-Essen.
//// If “more” is really better, then Big Data is justifiably
one of the most current and most widely discussed
topics in data processing and analysis. Recent years
and decades have seen IT departments continually
trying to gain control over an ever-increasing
mountain of data. It felt as if requests for more
storage space were being made more frequently than
holiday requests. Suddenly, however, everything has
changed. Big Data is more than just “more”.
The glossary of this management compass (see page
26) neatly encapsulates the current understanding of
the concept: Big Data means “methods and
technologies for the highly scalable capture, storage
and analysis of polystructured data.” This definition
has its origins in the “3Vs” model that Doug Laney
developed back in 2001 (see page 5 and graphic on
this page). At its core, Big Data links large volumes of
data, varied data structures and a high speed of data
production and processing.
: Barely believable volumes of data Regardless of which research you look at, the fact
remains that the raw volume of data is growing
constantly and will continue to do so. People are
talking about zettabytes and yottabytes of new data
being produced each year - volumes so large that
extraordinary comparisons are being used to visualise
them. Whether it is really helpful to know that all the
data produced in 2012 in printed form would create a
stack of paper 600 times bigger than the distance
from Earth to the Sun is dubious - nonetheless, it is a
striking fact.
If all this data is put together with Facebook and
Twitter accounts, with moods and purchasing
opportunities announced almost in real time using
photos and videos, it inevitably attracts the attention
both of commercial and technical decision-makers.
They all agree that something must be done with this
data.
: Cost savings still in the foreground
Interestingly, the most commonly listed expectations
of Big Data are savings in IT department costs (57%)
and business processes (61%), according to a study
by the market research company IDC.
The three Vs of Big Data
Volume
Source: Modelled on TDWI (2011): Big Data Analytics,
TDWI Best Practices Report.
Tera-, Peta-, Exabytes mass transaction data days, months, years
on time in real time streaming
structured semi-structured unstructured
all at the same time
Big Data
Velocity Variety

Think Tank // Big Data Analytics // Managementkompass
9
At the same time, the extensive study,
“biMA®2012/13” by Steria Mummert Consulting (see
page 11), shows that no “killer application” has yet
been identified by users. That means a special use
with a unique selling point is yet to be found. Until
now, the objectives of BI have simply been mapped
onto Big Data. The biMA® study shows that, in
general, users want a better, deeper understanding of
their own companies and the market. This
demonstrates that Big Data is still the new kid on the
block in data analysis terms.
: Data warehouses in flux
It is easier to see the impacts of Big Data on existing
system architectures for data analysis. For several
years, the data warehouse has been established as
the preeminent concept for company-wide, integrated
data storage to support decision-making. The aim of
this was to create a single, homogeneous,
redundancy-free environment into which all the
source systems could deliver data in an allowed and
regular fashion. Analysis and reporting was carried
out on this basis and divergences between plans and
actuality can be established precisely and with
certainty. Exception reports were sent out on time.
Specialised analysts had a body of material that they
could dissect and interpret down to the last comma.
Quite apart from the fact that the specified aims were
seldom perfectly attained in reality, this approach is
barely conceivable today. This is due to the variety of
the data, the ongoing supply of new data and the
incorporation of unconverted data formats (websites,
unverified geodata, scanned forms, photos, videos).
The current data warehouse options must be
extended to include data handling mechanisms that
can also process unstructured data. Hadoop - not
least due to its use by Google and Facebook - is
playing a leading role as a framework for this process.
: New methods of analysis
Since the homogenisation of raw data is no longer
really possible, the focus has shifted to more
comprehensive methods of analysis. Text mining and
natural speech analyses are more frequently than
ever required to extract information from the data.
The linkage of data with one of the best-developed
human abilities, the recognition of patterns in visually
processed data, is also being promoted. People can
interpret the aggregated presentation of many
individual items of information in the form of graphics
more quickly, easily and simply than an automated,
pre-interpreted analysis presented in table form; this
is the case regardless of whether customer churn,
traffic flows or credit card fraud is being analysed.
: Profitable Predictions
Most sectors could benefit from Big Data - the only
issue is at what point. Now it appears that one of the
most exciting and biggest challenges for many
companies is within reach: the ability to look into the
future. Using the catchphrase “Predictive Analytics”,
today’s algorithms can, for instance, not only check
several tens of thousands of fraud cases or loans that
have been carefully prepared and fed into the
database, but also include individual characteristics in
the check in order to make predictions about possible
fraudsters.
In relation specifically to Germany, wherever the strict
data protection laws try to prevent citizen
transparency, there is a wide scope of application for
Predictive Analytics. Thus telecommunications
providers can predict their customers’ general
willingness to change providers on the basis of
millions of items of connection data and entries in
social media; they can then very quickly identify
changes in user behaviour in order to make early
contact with potential leavers. For example, according
to Bitkom (the German association for information
technology, telecommunication and new media),
Telecom Italia is permanently evaluating a pool of 500
million items of connection data for this purpose.
: Recognising
patterns
Graphic
representations of
complicated
situations make
analysis easier
: Data protection
In spite of strict
regulations, Big Data
analyses are possible

Managementkompass // Big Data Analytics // Think Tank
10
Busin
ess/S
pecia
list d
ep
art
me
nt
(da
ta v
olu
me t
o
be a
naly
se
d) pote
ntial o
ptim
um
poin
ts
for
an
aly
sis
/investm
ent
: Many sectors are benefiting
In the health sector, the capture of non-standardised
responses on internet forums is allowing long-term
feedback on the effectiveness of medicines. For
example the Israeli firm Treato is learning from
thousands of sources what the side effects of
medicinal products are - on a global basis.
Specialist departments’ demand constantly rising
Analysis
demand not met
: Credit cards
Big Data is quicker
than the fraudsters
The finance sector is also benefiting from the
possibilities of real-time analysis and the availability of
billions of items of stored transaction data. Credit card
fraud depends on fraudsters’ speed and their skilful,
unobtrusive approach. Using Big Data methods,
institutions can compensate for their current, slower
processing speeds and increase the number of
transactions verified. This can reduce the estimated
annual 10 billion euros in losses caused globally by
credit card fraud. This is not just a matter of
optimising processes but actually a case of reducing
costs.
The question remains of whether all this is the brave
new world of large volumes of data or whether the
technology has reached a point where so much more
data can be processed that no-one notices when a
few million photos, videos and blog entries are stored
that have nothing to do with, for instance, the core
task of analysing transactions in the finance sector.
: Race between the desire for data and IT provision
If a specialist department requires better technology
to be able to analyse more data and the IT
department provides this technology, the speed and
quality of data analysis is improved. Next, the
specialist department will accelerate its demands -
regardless of whether increased data actually
provides an advantage in analysis. If the IT
department follows suit, the game begins all over
again. Analysis options and investments are
continually increasing and an optimal combination is
hard to recognise. Depending on your
Analysis
demand
comfortably met
IT (technology for analysis)
Source: Prof. Dr. Peter Chamoni.
point of view, this either is a vicious circle or it
demonstrates the positive feedback of technology and
information - the classic chicken and egg situation.
: Everyday Big Data - coming soon?
You can think what you like about Big Data - you may
be fascinated or irritated, optimistic or sceptical,
investment-happy or cautious - it will become
ubiquitous. So in five years’ time it is unlikely that Big
Data will still grace every third front page. The same
applies and has applied to smartphones, tablets and
the internet. These technologies have become
commonplace in such a short time that they no longer
require great press attention.
However, it is worth reminding ourselves that
technology is not a fast sell: the hype around video-
telephony and Second Life has taught us that. As the
German comedian Karl Valentin wisely put it: “Where
everybody thinks the same, not much gets thought.”
So do we need Big Data, as far as we understand it to
be? A clear answer: perhaps. Certainly, there is a lot
of potential in the ideas and technologies involved.
We need to enter into a critical debate about it. II
: Think Tank
11
Hype or disruption?
The term “Big Data” is on everyone’s lips. The prospect of one’s business being
able to garner valuable gems of information from a host of varied data makes
Big Data attractive. However, behind the concept, is there really something
completely new, something that is different from current approaches to data
analysis and which opens up new possibilities? Or is this just more marketing
hype?
//// Big Data consists of more than simply
exponentially growing data volumes to be processed
and analysed. Alongside the volumes, there are
challenges in terms of complexity and speed of
operations, integration and analysis of data with a
highly varied structure and origin. In this respect, the
characteristic qualities of Big Data are often called the
3Vs: Volume, Variety and Velocity (see table on page
5 and graphic on page 8).
Accordingly, Big Data consists of methods and
technologies for the highly scalable integration,
storage and analysis of polystructured data. Thus it is
not solely a matter of technical issues. Scalability
refers to data volumes as well as to data currency
and the capacity/efficiency of complex analyses. Big
Data architecture includes all levels of integration,
from storage to data analysis. The term
“polystructured data” refers to the different types of
data: from structured to semi-structured to
unstructured.
The integration, storage and analysis of data in order
to gain a better commercial understanding is hardly
new. For many years, under the heading of Business
Intelligence (BI), businesses have been bringing
together optional data from various IT systems -
usually operational ones - and producing reports and
analyses based on that data. In this sense, Big Data
is not in competition with classical BI but
complements or extends it.
: Data - the oil of the 21st Century
The importance of data is currently being re-
assessed. It is becoming an important production
factor for companies, perhaps even the most
important one. Data changes and improves business
processes and models and companies can improve
their quality, efficiency and effectiveness using better
information. All the signs are pointing towards the
“information-driven company”.
At present, most companies are still in the orientation
phase. Discussions on Big Data centre on the
technology, while the commercial benefits are often
ignored. However, for the overwhelming majority of
companies in Europe, the productive Big Data era has
not yet begun. Only 23% of them rate the topic as
relevant or very relevant to them. Many companies
are still waiting for convincing examples before
engaging with the relevance of Big Data. These
are the results of the study, “Business Intelligence
Maturity Audit (biMA®2012/13)”, carried out by
Steria Mummert Consulting with participants from
20 European countries.
: Four fields of application
The variety of possible applications demonstrates the
broad spectrum of Big Data: from internal analyses
(processes, results of planning/predictions) to
external analyses of the current market (products,
competitors, customers, suppliers). Combining the
two dimensions of issues for analysis and business
model, we can differentiate four classes of Big Data
applications in a matrix.
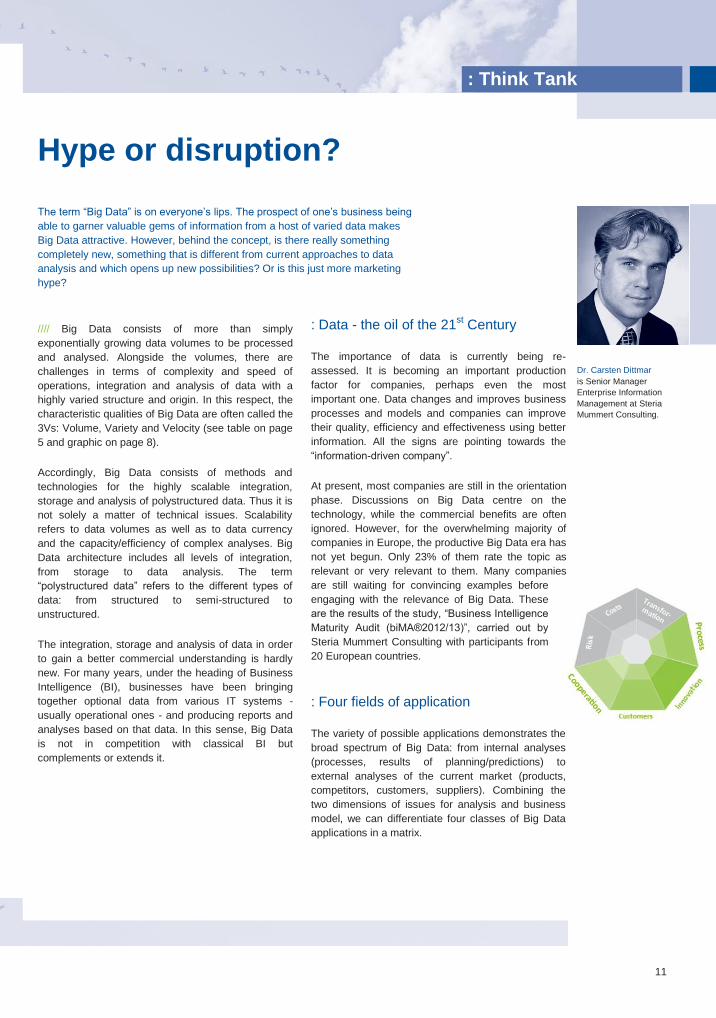
Dr. Carsten Dittmar
is Senior Manager
Enterprise Information
Management at Steria
Mummert Consulting.

Managementkompass // Big Data Analytics // Think Tank
12
Com
pa
ny
1
2
4
Issue
s fo
r analy
sis
Mark
et
Business model type
existing business model
new business model
3
: Process optimisation
More
exact
predictions for
sales or wear
and tear
The first category contains applications promising
more efficient processes and better management.
The existing business model is unchanged but
internal company procedures are optimised. Thus, in
retail, more precise predictions can be made taking
into account various factors, about when, in what
quantity and which product must be sold and re-
ordered (Forward Demand). Regardless of the sector,
analysis of sensor data can predict the wear and tear
on machines in order to plan timely maintenance
(Predictive Maintenance).
The second category is formed by applications for
mass customisation. If systems take into account all
the relevant information on individual customers
during the processing of a request, customised
services can be created for them. This improves
internal company processes for customer
communication (e.g. recommendation for location-
based services). Mass customisation allows the
process of product production to be customised so
much that new business models may arise, e.g. use-
based insurance products (see page 20).
The third category consists of Big Data applications
that, in the opinion of many different market
participants, are derived from an aggregated overall
estimate. One example of this is the analysis of brand
or product perception on the internet (Sentiment
Analysis). The business model is unchanged by this.
Finally, in the fourth category we find applications that
enable intelligent new products - in concert with new
business models. Hitherto isolated data sources,
which can also be generated and managed by
different market players, are included in this category.
Thus alliances are formed between previously
separate sectors such as telecommunications, the
automotive industry and services. Current examples
of this are intelligent thermostats, self-regulating
houses and driverless vehicles. In the future, more
and more products and machines will be equipped
with Big Data intelligence in order to process and
react to sensor data.
The ability to react quickly and flexibly to new market
situations will in the future be more vital than ever for
commercial success. Successful companies will be
those that know how to extract the gold from their
data mountains. II
New possibilities created by Big Data – four fields of application
3 Market analysis
1 More
efficient processes
and management
4 Intelligent
products
2 Mass
Customisat
ion
More efficient processes and management: Greater predictive security e.g. for sales, energy use, wear and tear; logistics management by GPS.
Mass Customisation: Analysis of customer behaviour (360 degree vision) for more customised customer communications or tailored services (e.g. Next Best Offer, campaign management, use-based billing) and Fraud Management.
Market analysis: Identifying opinion-shapers and trends in companies and products (e.g. advertising impact, brand perception, sentiment analysis).
Intelligent products: Machines or devices that regulate themselves using sensor analysis (e.g.: driverless cars, self-regulating houses).
Source: Steria Mummert Consulting.

13
: Tools
Getting started with Big Data
Investments in Big Data should have a concrete objective. Initially, decision-
makers must clarify departmental requirements and obtain the available data
sources. Sometimes what is in the foreground only allows for a hunch about the
data’s hidden potential. Because of this, Big Data projects are also like
experiments where different hypotheses are tested. The following checklist will
help you to adopt a structured approach.
Setting targets
■ Why does the department concerned want to introduce the data analysis? Which challenges can it overcome with
Big Data that cannot be managed by using existing Business Intelligence solutions (see page 5, the 3Vs of Big
Data)? What Best Practices from other companies could provide ideas for introducing Big Data?
■ Which commercial expectations are associated with a Big Data solution? Will additional revenue be generated or
costs saved? Will risks be reduced? Will product quality or service levels be improved? Precise quantitative or
qualitative targets will enable a subsequent actual vs target comparison (e.g. Cross-/Up-Selling volumes, customer
churn rate, error ratio) and the calculation of the RoI.
Data situation
■ Which data sources are available for the desired analyses? What additional data can be used? Examples: internal
data produced by existing business processes but not used; external data from suppliers and customers; external
data from private and public data providers.
■ Is data from social media (posts, text, photos, videos) used to obtain meaningful results? Marketing and
distribution can benefit from insights into (potential) customers’ tastes and purchasing behaviour, as can product
development and reputation management.
■ What granularity and quality does the available data have? Are there possibilities for improvement here?
■ How is data protection and data security guaranteed in the evaluation of the intended data sources (e.g.
anonymisation)? Are all legal and internal requirements met?
IT infrastructure
■ Data systems should be as simple, robust and error-tolerant as possible and allow for expansion to new functions.
Ad hoc requests should also be possible. When real-time processing is necessary, the latency period must be low.
Systems often used for Big Data are Hadoop (parallel data processing shared across computer clusters using
MapReduce) or in-memory computing.
■ Can an existing BI platform be used as a basis for the first Big Data project? Can new analytical tools be linked
to it? The advantage of this is a uniform solution for BI and Big Data.
■ Are there cost-efficient solutions to close gaps? Which resources can be used in the Public Cloud (e.g. storage
capacity, processor capacities, data analysis tools)?
IT alignment
■ How can the cooperation between the IT and other departments be optimised in order to increase the company’s
agility? The company management should expressly support the Big Data project, since the results may make it
necessary to change the processes and the business model.
■ Complex results should be represented graphically, so that they are easier to grasp and practically useful.
Implementation
■ How is the timely use of new information in the business guaranteed? Which processes must be adapted? Is it
possible to automate processes in connection with Big Data?

14
: Cross-check
Big Data supports managers on many levels: it
increases knowledge of markets, customers and
processes, thereby enabling companies to increase
revenues, reduce risks and costs and promote
innovations. One prerequisite is that your company
must be prepared to change into a data-oriented one.
COST MANAGEMENT
Big Data can not only generate higher revenues but also reduce costs. Examples of this are reductions in insurance claims rates and the streamlining of processes. As soon as a Big Data solution is implemented, costs can be reduced or varied - thus services can be withdrawn from a Public Cloud either by using external storage or computer centres external to the data analysis software. Many applications are open-source software and the infrastructure can be built partly from commodity hardware.
RISK MANAGEMENT
Financial service providers, in particular, but also online shops and other companies are benefiting from new applications for identifying fraud and risk analysis. To prevent fraud, thanks to Big Data, suspicious transactions can be analysed more comprehensively and risk management can be improved through more complex calculations with additional data. However, using external data also involves compliance risks. In order to control these risks, companies should put their faith in transparent
data management.
COOPERATION MANAGEMENT
Big Data does not just provide added value for your own business. Cooperation partners and customers can also benefit from the results of the analysis. For instance, DHL offers a predictive tool for companies that estimates future sales in a particular region. Other data, including data on goods delivered, geodata and company code numbers, is also fed into this process. Conversely, companies should test which external data from suppliers, customers and service providers could be useful for their own analysis.
CUSTOMER MANAGEMENT
Thanks to Big Data, companies can speak to more targeted customer segments and produce better-tailored offers. They can react quicker to market changes and adapt products and services accordingly. The impact of campaigns on turnover and profit can be calculated more accurately and measures can be corrected quicker. In price management, additional data sources and real-time analyses enable more accurate calculation and a better appreciation of
customers’ price expectations.

Cross-check// Big Data Analytics // Managementkompass
Sources: Steria Mummert Consulting; F.A.Z.-Institut.
15
TRANSFORMATION MANAGEMENT
Big Data enables a deep understanding of the business and can trigger transformation processes in an open learning culture. To exploit the potential of Big Data, companies must also acquire expertise. This involves further training of the IT team and other departments and possibly the introduction of “data scientists” - creative statisticians, who use algorithms to identify hidden patterns in the flood of data. IT alignment is critical to the success of Big Data. Principles for data handling (Data Governance) are also important.
PROCESS MANAGEMENT
Data analysis in real time enables automated decision processes. As soon as new signals are identified in transaction data, or even in unstructured data such as sensor readings, text, photos or videos, the business processes adapt to stop any errors in payments or production or in order to adapt an online shop’s products to current customer behaviour. Big Data can also become a source of revenue through new, data-driven value creation processes (see cooperation management).
INNOVATION MANAGEMENT
Among other sources, social media analyses can be drawn upon, as well as analyses of sensor data from products that are already in use, to improve quality and develop new products and services. An example of this is the automotive industry; another is the health sector where Big Data can improve treatments, while clinical trials, medical reports, patient blogs on social media and current telemedical readings on patients
can be correlated and investigated.

16
: Think Tank
Anti Financial Crime Management
Banks have always been both victims and tools of financial crime. Because of
this there are regulatory requirements, for instance to prevent money
laundering, and sanctions monitoring. There are also requirements to protect
customers and banks against fraud. Since the earliest amendment to the
MaRisk (minimum requirements for risk management), integrated risk
management has been part of a bank’s basic specifications.
Dr. Jens-Werner Hinrichs
is Principal Consultant Risk,
Finance & Compliance at
Steria Mummert Consulting.
Benjamin Rische
is Risk Consultant, Finance & Compliance at Steria Mummert Consulting.
Costs Transformation Process Innovation Customers Cooperation Risk
Customers
//// Complex fraud methods require mature detection
and prevention procedures. A current example of this
is the recent attacks against the mTAN procedure in
online banking: not only does the attacker try to obtain
a customer’s personal access to the banking portal
but the customer’s smartphone is also infected with
malware which forwards the authorisation text to the
fraudster. In addition, the trace of the fraudulent
payment is removed from accounts by “finance
agents”. In order to detect this kind of refined
malicious transaction and differentiate it from
legitimate behaviour, the context of the transaction
must be examined. In addition, factual, geographical
and personal features of transactions, accounts and
customers over long periods of time and complex
networks of relationships must be analysed. For
banks, this means examining millions of customers
with a variety of accounts and billions of transactions
every year - a job for Big Data.
Analysis requires a variety of policies, including an
investigation of networks of relationships. This
extends the duration of the analyses and too many
suspicious features are produced that have to be
manually cleaned. The number of genuine hits rises
but the error alarm ratio also worsens initially. To
counteract this, tighter rules are required with a more
complex conditional structure or contra-indicators that
recognise legitimate behaviour. Summing up, the
duration times extend under extreme circumstances
and the interval between criminal action and detection
increases.
This restricts opportunities for damage limitation.
Although more powerful hardware can speed up the
process, this does not solve the problem at its root. In
the medium term, the introduction of modern Big Data
Analytics methods is essential. Only they can balance
out the trade-off between quality/currency and costs.
: Days become minutes
Steria Mummert Consulting has produced a “Proof of
Concept” using SAP HANA Fraud Management (see
infobox). The reduction of the run time from several
days to just minutes gives Fraud Management new
possibilities, based on conventional rules. The gap
between criminal action, detection, investigation and
criminal charge narrows from several weeks to under
two days. There is potential for further efficiency and
quality to be developed through additional rules and
methods.
Substantial time savings
Source: Steria Mummert Consulting.
10 million customers
110 million transactions
>100 hours
Standard system
In-memory system
<12 minutes
12 Minutes

Think Tank // Big Data Analytics // Managementkompass
Proof of Concept with SAP HANA
Together with SAP, in 2013 Steria Mummert
Consulting carried out a “Proof of Concept” based on
the SAP HANA in-memory database. In the HANA
solution a conventional anti-money-laundering policy
was implemented consisting of 150 rules. The current
solution for a month’s processing of 10 million
customers and 110 million transactions requires up to
100 hours in total - the HANA application completed it
in four minutes. Both systems used identical
parameterisations and data, as well as a comparable
hardware configuration. Instead of weekend
processing and long wait times, SAP enabled
calculations to be done in one day or in real time. At
present, policies are being expanded to address
additional fraud risks such as mTAN attacks. The next
step is to optimise the policies used in order to lower
the false positive rate and increase the hit quality. In
the future, the SAP HANA compliance application will
be developed as an integrated compliance solution for
anti-money-laundering, financial sanctions and fraud.
Source: Steria Mummert Consulting.
Pote
ntial be
nefit
Tim
e
savin
gs
Qualit
y
impro
ve
ment
Dam
ag
e
pre
ven
tion
17
A clear benefit at every step
3
Paradigm change
2
Adaptation of model
1 Technology
transformation
Source: Steria Mummert Consulting.
Time
This potential may be obvious to IT experts but for the
department concerned the investment is a big step,
especially if the expected benefit is not precisely
quantifiable in advance. This hurdle can be overcome
through a step-by-step introduction of the system, if
the advantages and costs are transparent for each
step.
1. Step: Technology transformation to make time
savings. The existing conventional infrastructure is
replaced by the new technology. The existing check
logic is correspondingly reproduced 1:1. This has the
advantage that existing processes do not have to be
changed or only have to be changed a little.
Investments and friction remain low, while user
acceptance is high. The result of the transformation is
a dramatic time saving in mass data processing.
Instead of processing being spread over days and
weekends, a full processing run can be achieved
every day. The time between criminal action taking
place and charges being brought is significantly
reduced.
2. Step: Improved quality through advanced check
logic. The conventional rule-set is expanded and
tightened, contra-indicators are introduced. This does
not require any special expertise, simply the skills a
company already has at its disposal. The number of
verified hits increases and the number of false
positives falls. Quality optimisation ensures improved
efficiency and saves costs.
3. Paradigm change through improved
transparency and dynamic loss prevention. New
analytical methods and check methods are introduced
as a complement or as a substitute, e.g. customer
segmentation based on transaction behaviour.
Detection is supplemented with independent pattern
identification mechanisms. Predictive Analytics
methods allow suspicious items to be collected and
fraud to be predicted. Risky transactions can be
subjected to a second checking and authorisation
process before being carried out. This prevents
losses. Expertise is essential, if only at this late point,
but it can also be built into the first two steps.
This staged procedure allows potential benefits of Big
Data technologies to be accessed gradually, thus
streamlining investment and process changes.
Big Data technologies allow detection, investigation
and prevention, as well as case management and
reporting on different subject areas to be integrated
into one application. Under the heading “Financial
Crime” there is now a single solution for
comprehensive MaRisk compliance. II

: Practice
18
OTTO: Automated decisions
The multi-channel company OTTO has mastered the transition to online trading
through the continual adaptation of its business processes. The business’s
current focal point is the online shop www.otto.de, which offers over 2 million
items and represents over 80% of the company’s total annual turnover of more
than 2 billion euros. OTTO controls its decision-making processes throughout
the entire product lifecycle using innovative predictive analytics software.
Michael Sinn
is Director of
Category Support at
OTTO.
//// For some years the competitive environment in the
German mail-order industry has been characterised
by market conditions that are changing at an
increasing rate. The dominant role of online trade and
the simultaneous diminishing importance of classic
catalogue-based business have created new
demands. An increasingly extensive range of
products requires, in the background, intensive
management of each article in order to ensure
commercial success. One of the greatest challenges
in this area is how to make early sales predictions for
each article. After all, in a commercial company, the
profitable purchase of goods is the deciding factor for
success.
Demand planning is based on large volumes of data
and influenced by a host of factors. Conventional
statistical processes for sales predictions no longer
meet these new requirements. For that reason,
several years ago OTTO decided to work with Blue
Yonder, a provider of predictive analytics software.
This application allowed the company to put its huge
volumes of data to good use. Thus OTTO became a
Big Data “first mover” in the field of commerce. Since
then, article sales prediction using predictive analytics
has become securely embedded in the operational
business processes.
Technology-driven product lifecycle overview
Trend identification 1 ■ Early identification
■ New information sources
■ Which product will customers
want in the future?
Sales optimisation 4 ■ Flexible pricing
■ Recommendation engine
■ Returns management
■ Efficient stock control
CLOSED
LOOP
Planning 2 ■ Creation of product range
■ Design of product range
■ Volume estimates
■ Commercial control over internal
management
Prediction 3 ■ Sourcing
■ Sale/return prediction
■ Publication management
Source: OTTO.

Practice// Big Data Analytics // Managementkompass
19
Every day, for each article, an updated prediction by
colour and size is produced based on 200 different
variables (e.g. brand, price, online positioning, stock
situation, season). Every year, over 5 billion individual
predictions are produced. From a commercial
viewpoint, this has been a success: the quality of
prediction has improved compared to conventional
procedures by up to 40% per article and the
remaining stock at the end of the season has dropped
by 20%.
: Cycle-oriented optimisation
Building on the success of the article sales
predictions, we are now identifying throughout the
product chain areas that can benefit from the
introduction of the new technologies. This is how the
idea of the “technology-driven product lifecycle” arose
- an integrated system to manage the product
lifecycle. The management tools put us in a position
to make faster and simpler commercially meaningful
decisions about an article. For this purpose, the
product lifecycle is split into four phases that, taken as
a whole, create a closed loop: trend identification,
planning, prediction and sales optimisation.
Some of the tools are already wholly integrated into
operational business processes. Lifecycle
management is being continually refined to take
account of the changes in the fast-moving market.
There are two cornerstones of this process.
: Finding the optimal price
The requirements for intelligent price management
are incomparably higher in online business than in the
era of the mail-order catalogue. Customers expect a
suitable price and, particularly for branded goods,
price transparency is almost 100%. The optimal price
for a product depends on countless factors which may
vary daily. At every point in the product lifecycle, there
is an optimal price for a product: the challenge is to
set it.
Finding the “ideal price” can now be done
successfully using Big Data. In a six-month pilot
project in the field of men’s fashion, we tested how
pricing can be automated in order to increase sales
and profits. Using our predictive analytics software,
we were in a position to optimise sales, turnover and
profits simultaneously. Based on the results, the
system is being gradually introduced for the entire
range. We expect further notable improvement in
company profits as a result.
: Lowering the rate of returns
Goods returned by customers in online trade have
become a factor critical to success. On the one hand,
returns involve high logistics costs, reprocessing
costs and, in unfortunate cases, write-offs for goods
that can no longer be stored or distributed. On the
other hand, returns are a basic component of the
business model. One advantage of mail-order trade is
that the purchaser can try items out at home at their
leisure, then decide and finally, if necessary, send
some of the goods back. With this in mind, OTTO has
started a project to identify the reasons and drivers
behind returns, to quantify them and hence establish
measures to lower their rate.
In an expert workshop, working hypotheses were
formulated that were tested during the project using
the predictive software. As part of a comprehensive
data model, the development of selection ordering (a
customer orders an article in several sizes or
colours), the connection between delivery times and
returns or the influence of promotional description of
an article were investigated. Based on the results, we
took a number of measures that have led to a clear
fall in the returns rate. In total, through these findings,
around 2 million returns have been avoided. II
: Returns factor Competitive advantage versus costs
: Lowering the returns rate Result of Big Data analysis

: Practice
20
PAYD supports four pillars of mobility
Safety – eCall (emergency), bCall (breakdown);
also management of driving times and work times
Security – geotracking and geofencing
Performance – diagnoses and predictive
analyses
Logistics – fleet management, track & trace, cost
analyses and reporting
Source: Steria Mummert Consulting.
A revolution in vehicle insurance
The car as a data source has caught the attention of everyone involved in the
automotive value creation chain. Insurers are expecting telematics to produce
insight into mass customised products. “Pay as you drive” (PAYD) has created
a new business model. This use-based pricing model enables appropriate risk
classification. The innovation: risk can be verified at all times and from day to
day - something current premium models do not provide.
Janina Röttger
is Senior Insurance
Manager at Steria
Mummert Consulting.
Andreas Behrens-Ziegler
is Senior Insurance
Consultant at Steria
Mummert Consulting.
Dr. Carsten Dittmar
is Senior Manager for
Enterprise Information
Management at Steria
Mummert Consulting.
//// Telematics data can be compared to vehicle
information in Formula 1 where engineers use it to
optimise the performance of cars. Vehicle insurers
can now also work with telematics data, thanks to Big
Data Analytics. Using geotracking data and individual
driving behaviour they can obtain information on
position, journey times, routes and even the
acceleration and braking behaviour of the insured
vehicle. From this they can calculate a risk score. It is
a step towards fairer premiums and a new set of
tariffs.
However, it is just the first step. Further information
from the vehicle’s environment or its inner workings
will also be useful, whether used to analyse the
vehicle’s condition or the driving situation. In this way,
product development and marketing can better
respond to individual customer requirements.
: New, usage-based services
Fear of the “transparent customer” is still holding back
the development of Pay-as-you-Drive (PAYD)
premiums although they offer clear added value, and
thereby market potential, for customers and the after-
sales market. In addition, there is the prospect of
fairer prices and numerous possible product
innovations, together with better claim rates for
insurers.
Individual liability and comprehensive insurance are
only a part of the many possible applications for the
car industry. Thus, using telematics, customers can
be informed about new products in a targeted way.
Data from vehicles provides evidence about current
service and guarantee requirements, as well as wear
and tear and defects. Accidents could be more simply
explained and the data collected could help prevent
theft and fraud.
Using telematics, manufacturers can offer guarantees
and garage management ideas that are tailored to
individual customers. Preventative service measures
and similar offers would improve vehicle use. This
would be attractive for commercial customers, leasing
providers and company car fleet managers.
Moreover, damage prevention models could be
extrapolated from the data. Labour law issues could
also be clarified more easily and, for instance,
compliance with due diligence obligations for
professional drivers could be checked.
: The right strategy is crucial
Competition for customers is increasing. The question
now is: which companies in the vehicle value creation
chain are using Big Data and focusing their entire
service on mobility (see four pillars, below) and
thereby gaining direct customer contact?

Practice// Big Data Analytics // Managementkompass
A market example - discount from a black box
What if someone regularly drives faster than they
are allowed, or always breaks the rules of the road?
A black box attached to a vehicle’s on-board
electronics can record all these things. At regular
intervals it sends data on the vehicle’s location,
speed and acceleration to a computer centre.
Due to data protection, the insurer does not know
the identity of the driver, only the customer
identification number. The data is stored in a similar
way to mobile phone data. Once a month, the data
is aggregated and sent via encrypted transmission
and a score is calculated. It is essentially an
assessment of good driving. If the driving behaviour
is perfect, the customer receives 100 points.
Deductions are made not only for illegal driving,
such as speeding, but also for driving behaviour
that insurance statisticians say create a higher risk
of accidents.
The German Sparkassenversicherung is the first
insurer in Germany to offer this model on a
voluntary basis. Since 1 January 2014, it has been
offering a policy which gives a 5% discount on the
premium if a car owner allows a black box to be
installed in their car. This can prove that the owner
is a careful driver.
There is a lot of interest in this. In a recent survey
51% of respondents said that they would be
interested in installing a black box if it saved them
money. In the short time since its introduction, the
insurance company appears to have concluded
hundreds of contracts. In its first phase, participant
numbers are restricted to 1,000. However, an
extension is planned. Source: F.A.S., 12.01.2014.
21
Telematics strategies for insurers
1) On-board unit.
2) Business Process Management.
Source: Steria Mummert Consulting
They can cooperate or compete with other mobility
providers. They just have to safeguard their original
business area against new competitors.
The technology is now enabling the broad introduction
of PAYD both in the new and used car segment. The
question then arises of how the market will change if
PAYD is introduced not only in small market
segments but in a company’s entire stock, e.g. by a
car manufacturer.
Fixed installations of on-board units (OBUs or “black
boxes”) and corresponding smartphone applications
for telematics could significantly change the
calculation bases for insurance portfolios.
Society’s attitudes towards usage-based services
should change in the short to medium term, since
there is both political and commercial interest in the
application of telematics. For the insurance sector,
this will depend on how the EU regulates customer
access in the motor industry. Will there be free
access? Will automobile manufacturers also control
insurance services at the point of sale?
Customers can expect more attractive and flexible
pricing models. The technology, as well as the
corresponding added value services and the
increasing transparency, should make it easier for
customers to trust telematics even where data
protection risks cannot be completely removed.
An increase in competition from new market
participants like Google or as yet unknown insurance
partners is, in view of the changing business model,
not out of the question. II
: Fear of data
abuse
Greater trust
through
transparency
Segment 1
New cars
Segment 2
Used cars
Mobile technology or fixed installation
Without
retrofitting of OBU1)
With
retrofitting of OBU1)
Customer group, business area
New contracts
for vehicles
Stock
actions
Customer strategy re. insurance and telematics Technology I Technology II
Stock management systems, Big Data tools, etc.
Connection and management of external IT
Services I+II Product and business model
Application Management, Testing, Infrastructure management,
BPO2)
Services
Product design, cost effectiveness, customer relevance
: Practice
22
dm-drogerie: Staff planning
In the financial year 2012/13, dm-drogerie markt had a turnover throughout
Europe of 7.69 billion euros. Over 34,000 people work in the company’s markets
in Germany, in distribution centres and in its headquarters in Karlsruhe. Every
day, using predictive analytics, dm produces reliable predictions of the daily
turnover in its individual markets - it can then plan its staffing requirements
efficiently.
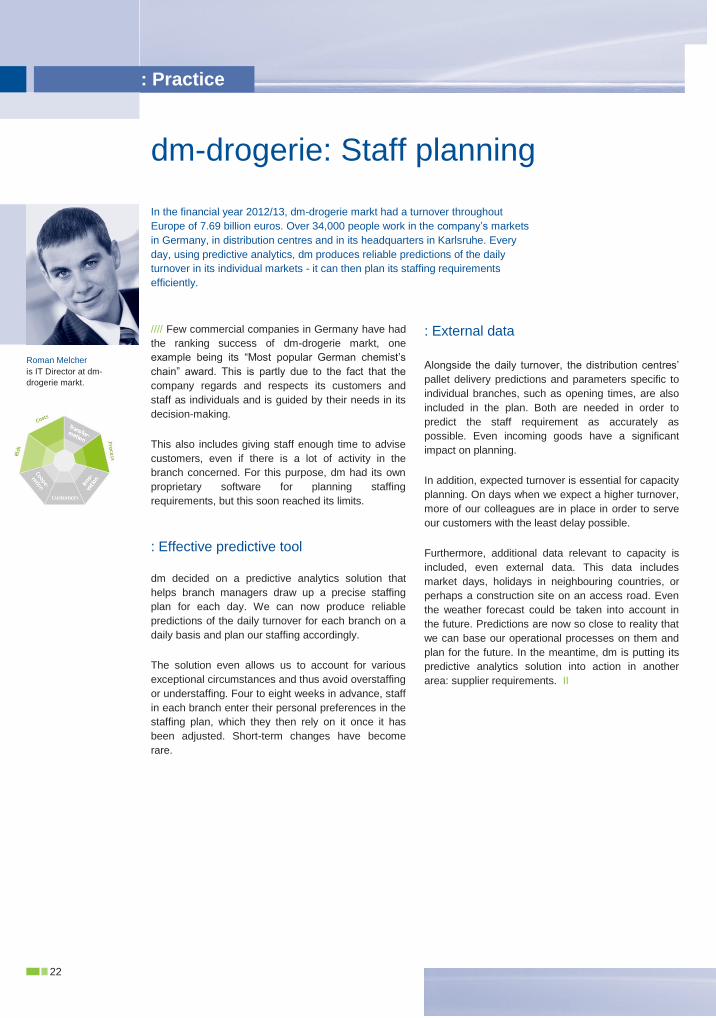
Roman Melcher
is IT Director at dm-
drogerie markt.
//// Few commercial companies in Germany have had
the ranking success of dm-drogerie markt, one
example being its “Most popular German chemist’s
chain” award. This is partly due to the fact that the
company regards and respects its customers and
staff as individuals and is guided by their needs in its
decision-making.
This also includes giving staff enough time to advise
customers, even if there is a lot of activity in the
branch concerned. For this purpose, dm had its own
proprietary software for planning staffing
requirements, but this soon reached its limits.
: Effective predictive tool
dm decided on a predictive analytics solution that
helps branch managers draw up a precise staffing
plan for each day. We can now produce reliable
predictions of the daily turnover for each branch on a
daily basis and plan our staffing accordingly.
The solution even allows us to account for various
exceptional circumstances and thus avoid overstaffing
or understaffing. Four to eight weeks in advance, staff
in each branch enter their personal preferences in the
staffing plan, which they then rely on it once it has
been adjusted. Short-term changes have become
rare.
: External data
Alongside the daily turnover, the distribution centres’
pallet delivery predictions and parameters specific to
individual branches, such as opening times, are also
included in the plan. Both are needed in order to
predict the staff requirement as accurately as
possible. Even incoming goods have a significant
impact on planning.
In addition, expected turnover is essential for capacity
planning. On days when we expect a higher turnover,
more of our colleagues are in place in order to serve
our customers with the least delay possible.
Furthermore, additional data relevant to capacity is
included, even external data. This data includes
market days, holidays in neighbouring countries, or
perhaps a construction site on an access road. Even
the weather forecast could be taken into account in
the future. Predictions are now so close to reality that
we can base our operational processes on them and
plan for the future. In the meantime, dm is putting its
predictive analytics solution into action in another
area: supplier requirements. II

: Viewpoint
Clarifying legal issues
Through Big Data technologies, data is becoming an important business asset.
However, legal issues are also involved in eliciting and using data. To whom
does the data belong, particularly if it comes from different sources? How can
data transactions be designed with legal security? What does data protection
require, if personal references occur through the linkage of (initially) anonymous
data sets from different sources?
//// When companies talk about “their” data and
its commercial value, they often overlook the
fact that there is no ownership of data under
civil law. Even copyright law protects only a
portion of data, for example data sets with
creative content such as music data and text
data. It does not cover geodata, climate data,
sensor data or measurement data. Apart from
trade secrecy and goodwill, this excludes the
proprietary attribution of data - all the more so if
the data comes from different sources.
For example, in the automotive industry, entire
value creation chains are built on the extraction
and exploitation of vehicle movement data. In
this respect, automobile manufacturers,
maintenance services, telematics operators,
insurers, authorities, vehicle owners and drivers
all have different interests, even contrary ones.
To whom does the data belong? Who may use
it or transfer it to others and who must ask
whom for permission to do so? Creative
contractual solutions are required. They are
only partially helpful if the object of the contract
cannot clearly be assigned legally. The problem
is the same for insolvency: what must the
administrator release or how can he use data
with legal security? This question may seem
trivial with regard to individual data sets but is a
central, public legal issue for large volumes of
data.
: Data use and data protection
Database producers have the exclusive right to
the database created by them for 15 years
in order to cover their investment in the
structured system and access to the data (§87a
UrhG, German copyright law). They may transfer
database rights, licence its use or exclude others
from using it. Everything points to an increase in
database licence contracts. However, what about
unstructured data? Can it be used by anyone, or
can contracts ensure legal security? We need to
start by developing contractual best practice and
risk hedging.
In many Big Data cases, there are no personal
references so data protection is not applicable.
Nevertheless, a data protection analysis is
essential and often more relevant than we might
think. On the one hand, this is due to the broad
concept of data with personal references (which
includes IP addresses, among other things). On
the other hand, the linkage of anonymous data
sources may possibly lead to profiles and
personal references. The complexity grows
where data sources are subject to different
national data protection regulations. Those who
have the opportunity to use Big Data must also
bear compliance in mind and carefully address
data origins.
: Open Data and Innovation
Under the recently established Directive on
Public Sector Information (PSI Directive), state
bodies in the EU must provide on-going access
to their data sources. As of 2015, major data
sources will be accessible at low cost and will be
available for Big Data applications. II
Dr. Alexander Duisberg
is Partner and Joint Head
of the International IT
Sector Group at Bird &
Bird LLP.
den
23

: references
24
Links and specialist literature
//www.bitkom.de/big-data
The BITKOM Big Data working group has produced free manuals, “Management von Big-Data-Projekten” and
“Big Data im Praxiseinsatz”. In addition, BITKOM organises a “Big Data Summit” every year.
//www.tdwi.eu
Platform for exchanging views on Business Intelligence (BI) and Data Warehousing.
//medium.com/what-i-learned-building/1b8e3214f96
Big Data checklist by Dimitry Korolev.
//www.kaggle.com
Open competition platform for problem solving using Big Data algorithms.
//www.steria.com/de/bi/bidm-einblicke/europaeische-bima-studie-201213
“Business Intelligence Maturity Audit (biMA®2012/13)” study by Steria Mummert Consulting.
//www.journalofbigdata.com
Open Access journal, “Journal of Big Data” with scientific articles.
Technology and Business
Judith Hurwitz: Big Data for Dummies. Wiley-VCH 2013 (English).
An easily understandable, practice-orientated introduction to Big Data as a management tool. Using the didactic
approach of starting from scratch, readers quickly learn how to implement Big Data in their own business. The
book even enables people who are not IT experts to prepare their first Big Data project. The author explains the
technical requirements and presents the main Big Data Analytics tools. She also shows how these tools can be
linked to existing database structures and Business Intelligence applications.
Pavlo Baron: Big Data for IT decision-makers. Using huge volumes of data and modern technologies to generate
profits. Hanser 2013.
Baron addresses IT experts who have little experience of Big Data. In his view, companies can now no longer
bypass Big Data. The future lies in new, data-based and thereby customer-orientated business models. He
recommends focusing all processes now on obtaining and processing information relevant to business.
However, there is no single Big Data architecture that fits all. Big Data is a growing “ecosystem” containing a
wealth of technologies and components from which every company has to construct appropriate tools.
Ramon Wartala: Hadoop - permissible, distributed and scalable Big Data applications. Open Source
Press 2012.
A book for Big Data practitioners who want to work with Hadoop. Alongside the installation, configuration and
introduction of Hadoop, the author uses practical examples to show how to implement MapReduce-based
applications step by step using Hadoop. He gives tips on error searches and on optimising MapReduce jobs. He
rounds off the book with a chapter on the many applications of Hadoop and a chapter on introducing the
practice in German-speaking countries.
25
References// Big Data Analytics // Management compass
Eric Redmond and Jim R. Wilson: Seven weeks, seven databases - a guide to modern databases and the
NoSQL movement. O’Reilly 2012.
A book for IT developers looking for the right database for their Big Data problem. The authors present seven
open source databases from different fields of application: Redis, Neo4j, CouchDB, MongoDB, HBase, Riak and
PostgreSQL. Readers can test what they learn immediately on their own computers with the help of downloads;
they can also learn how to create platforms from several databases.
Consequences for the economy, society and research
Viktor Mayer-Schönberger and Kenneth Cukier: Big Data - A Revolution That Will Transform How We Live,
Work, and Think. Redline 2013.
Data analysis instead of gut feeling: the authors see Big Data as a new form of creating knowledge. No longer
will the analysis of causal relationships be the goal of researchers but tracking useful correlations using
algorithms. Benefits may apply, for example, in successful marketing, customer retention, innovation or risk
management. The authors show what possibilities Big Data opens up but warn against the loss of the private
sphere.
Heinrich Geiselberger and Tobias Moorstedt (Editors): Big Data - the new promise of omniscience. Suhrkamp
edition unseld 2013.
Exciting articles by IT experts, sociologists and humanities experts on the future of Big Data. Among the authors
are Chris Anderson, Kate Crawford and Cameron Marlow. The reader gains an overview of data mining,
algorithms, textual analysis and predictive analytics. In the light of the NSA affair, critical voices also make their
case. There is an interesting discussion between Michael Hagner and Dirk Helbing on the data-driven “new kind
of science”, which aims to identify correlations rather than develop theories. The extensive glossary is
recommended for Big Data novices.
Rudi Klausnitzer: The end of chance. How Big Data is making us and our lives predictable. Ecowin 2013.
The future belongs to those who know it. Klausnitzer demonstrates the power of predictive analytics and shows
us its social and economic consequences. In almost all areas, according to the author, decisions based on data
analyses are more successful than decisions based on experts. He uses many examples in an informal style to
show the hidden opportunities in Big Data, either in the health or retail sector.
Lateral thinkers
Nate Silver: The Signal and the Noise: Why Most Predictions Fail – but Some Don’t. Heyne 2013.
The statistician Nate Silver shows why predictions by experts often fail and how prediction can be improved
through a more open, self-critical method. He warns against overrating Big Data. The flood of data may disguise
our view of causal relationships. Correlations alone are not enough to make good predictions.
Daniel C. Dennett: Intuition Pumps. Allen Lane 2013 (English).
The cognitive scientist and philosopher Daniel Dennett uses selected “tools for thinking” to show how people
think, decide and act. His “intuition pumps” critically examine received wisdom about human behaviour. The
book is a useful companion for data scientists wanting to generate new knowledge from Big Data.

: Glossary
26
Algorithm
Step-by-step solution to a problem through the
application of precisely defined calculation rules.
Big Data
Methods and technologies for the highly scalable
capture, storage and analysis of polystructured data.
Large volumes of data of highly varied structure and
origin, obtained partly in real time, can be used by Big
Data technologies for complex analyses. Big Data
Analytics includes data mining methods for the
analysis of this data.
Data mining
Systematic use of statistical/mathematical methods in
order to identify causal patterns in data sets.
Data scientist
New profession connected with Big Data. Compared
to conventional data analysts, data scientists have
more mathematical and technological knowledge, as
well as business knowledge and special creativity.
They are tasked with using data mining and intelligent
algorithms to track down business-relevant
information in the data. Data artists visualise this
information by depicting these complicated
relationships graphically.
Data warehouse
Historic, operative data from various data silos is
placed in databases for analysis in order to analyse
the data (data mining) and prepare to make
management decisions. In hybrid models, the data
warehouse sets the context for Big Data analyses.
Geofencing
Linking of geoinformation systems and localisation of
objects in order to act, if a specific object leaves or
enters a pre-defined area.
Hadoop
Open source data system by the Apache Software
Foundation, based on MapReduce. Large analysis
tasks are split into small jobs for distributed computer
clusters to solve in parallel.
MapReduce
Algorithm that shares the processing of large datasets
among several computers working in parallel. Initially,
the jobs are shared among various computer clusters
(“map”), next, the individual results produce an overall
result (“result”). In doing so, different data sources
and formats are used.
MaRisk
Circular 10/2012 (BA) with minimum requirements for
risk management as specified by German regulatory
authority BaFin for risk management by credit
institutions and financial services institutions in
Germany.
mTan
German security standard.
Next Best Offer
Products and services that have a high probability of
interesting customers in their next purchase,
especially in e-commerce.
Not only sQL (NosQL)
Type of database that uses a non-relational approach.
In contrast to SQL databases, NoSQL databases do
not need any specified table schemas.
Predictive Analytics
A type of data mining that introduces statistical
calculations, elements of play theory and operations
research methods in order to make predictions about
future behaviour.
Public Cloud
Offer by a free-to-access provider that makes its
services accessible to anyone via the internet.
Public Sector Information Directive (PSI
Directive)
Directive 2003/98/EC of the European Parliament on
the re-use of public sector information. The
information re-use law, in force since 19 December
2006, implements the PSI Directive in Germany.
Unstructured data
Data with non-formalised content. The data is in
digital form but cannot be processed without further
input from databases and analytical tools. It must first
be modelled and translated into structured data.
Examples: text, video, photos, e-mails, agreements,
guidelines, satellite imagery.

: Current studies
Managementkompass Demographiemanagement
Demographic change is draining the available labour force.
Companies therefore need to orient their staff planning over the
long term. Topics: strategic staff planning, talent management, life-
phase-orientated staff policies, Generation Z. With articles by
Fraport, the City of Munich and Deutsche Bank.
Managementkompass Customer Centricity
Customer focus means more than excellent services. In the
internet, mobile and social media era, the design of customer
relations has reached a new dimension with a host of possibilities
and requirements. With articles by the Generali insurance group,
SCHUFA and Fidor Bank.
Branchenkompass 2013 Versicherungen
Recent survey of 100 top decision-makers in 100 of the largest
insurance firms and brokers on sector trends, as well as growth
strategies and investment goals up to 2016. Core topics:
marketing and customer management, new regulations and M&A.
Also in our range of studies:
_ Managementkompass: incl. sourcing strategies, channel management, earnings protection in the
financial crisis, sustainable value creation, corporate governance, cost-efficient regulation
_ Branchenkompass: incl. public services, telecommunications, credit institutions
_ Kundenkompass: incl. patient requirements, social media in the health sector
_ Themenkompass: incl. health at work
In preparation:
Managementkompass Mobility, Branchenkompass 2014 Energieversorger
Apply to:
F.A.Z.-Institut für Management-, Markt- und Medieninformationen GmbH
P.O. Box 20 01 63, 60605 Frankfurt am Main, Tel.: 0 69 / 75 91 - 21 29, Fax: 0 69 / 75 91 - 19 66
E-Mail: [email protected], Internet: www.branchendienste.de

Contact:
Steria Mummert Consulting GmbH Corporate Communications Birgit Eckmüller Hans-Henny-Jahnn-Weg 29 22085 Hamburg Phone: 0 40 / 2 27 03 - 52 19 Fax: 0 40 / 2 27 03 - 12 19 E-Mail: [email protected]
F.A.Z.-Institut für Management-, Markt- und Medieninformationen GmbH
Eric Czotscher P.O. Box 20 01 63 60605 Frankfurt am Main
Phone: 0 69 / 75 91 - 32 75 Fax: 0 69 / 75 91 - 19 66 E-Mail: [email protected]
ISBN: 978-3-89981-387-6