big data and big cities - the national bureau of ... data and big cities: the promises and...
TRANSCRIPT
NBER WORKING PAPER SERIES
BIG DATA AND BIG CITIES:THE PROMISES AND LIMITATIONS OF IMPROVED MEASURES OF URBAN LIFE
Edward L. GlaeserScott Duke Kominers
Michael LucaNikhil Naik
Working Paper 21778http://www.nber.org/papers/w21778
NATIONAL BUREAU OF ECONOMIC RESEARCH1050 Massachusetts Avenue
Cambridge, MA 02138December 2015
We would like to acknowledge helpful comments from Andy Caplin, William Kominers, and MitchellWeiss. E.L.G. acknowledges support from the Taubman Center for State and Local Government; S.D.K.acknowledges support from the National Science Foundation (grants CCF-1216095 and SES-1459912),the Harvard Milton Fund, the Wu Fund for Big Data Analysis, and the Human Capital and EconomicOpportunity Working Group (HCEO) sponsored by the Institute for New Economic Thinking (INET);and N.N. acknowledges support from The MIT Media Lab consortia. Comments are welcome andmay be sent to [email protected], [email protected], [email protected], and [email protected] views expressed herein are those of the authors and do not necessarily reflect the views of theNational Bureau of Economic Research.
At least one co-author has disclosed a financial relationship of potential relevance for this research.Further information is available online at http://www.nber.org/papers/w21778.ack
NBER working papers are circulated for discussion and comment purposes. They have not been peer-reviewed or been subject to the review by the NBER Board of Directors that accompanies officialNBER publications.
© 2015 by Edward L. Glaeser, Scott Duke Kominers, Michael Luca, and Nikhil Naik. All rights reserved.Short sections of text, not to exceed two paragraphs, may be quoted without explicit permission providedthat full credit, including © notice, is given to the source.

Big Data and Big Cities: The Promises and Limitations of Improved Measures of Urban LifeEdward L. Glaeser, Scott Duke Kominers, Michael Luca, and Nikhil NaikNBER Working Paper No. 21778December 2015JEL No. C18,C55,C80,C83,R10,R11,R23
ABSTRACT
New, “big” data sources allow measurement of city characteristics and outcome variables higher frequenciesand finer geographic scales than ever before. However, big data will not solve large urban social sciencequestions on its own. Big data has the most value for the study of cities when it allows measurementof the previously opaque, or when it can be coupled with exogenous shocks to people or place. Wedescribe a number of new urban data sources and illustrate how they can be used to improve the studyand function of cities. We first show how Google Street View images can be used to predict incomein New York City, suggesting that similar image data can be used to map wealth and poverty in previouslyunmeasured areas of the developing world. We then discuss how survey techniques can be improvedto better measure willingness to pay for urban amenities. Finally, we explain how Internet data is beingused to improve the quality of city services.
Edward L. GlaeserDepartment of Economics315A Littauer CenterHarvard UniversityCambridge, MA 02138and [email protected]
Scott Duke KominersSociety of FellowsHarvard UniversitySoldiers FieldBoston, MA 02163 [email protected]
Michael LucaHarvard UniversitySoldiers Field RoadBoston, MA [email protected]
Nikhil NaikMassachusetts Institute of Technology75 Amherst Street, E14-374CCambridge MA [email protected]

1 Introduction
Historically, most research on urban areas has relied on coarse aggregate statistics and smaller-scale surveys.
Over the past decade, however, digitization of records, expansion of sensor networks, and the computeriza-
tion of society has produced a wealth of city data at high temporal frequencies and low levels of spatial and
temporal aggregation.
The “big data” revolution will fundamentally change urban science. Big data turns a cross-section of space
into living data, offering a broader and finer picture of urban life than has ever been available before. More-
over, in combination with predictive algorithms, big data may allow us to extrapolate outcome variables to
previously unmeasured parts of the population. Nevertheless, classical issues of causal inference remain—
big data rarely solves identification problems on its own.
For answering classical questions of social science—such as understanding the impact and mechanisms of
urban growth, and valuing urban amenities and policies—big data becomes powerful once it is combined
with exogenous sources of variation. In urban contexts, the two key exogenous variation sources are “shocks
to places” and “shocks to people”; the former consist of high-frequency events that affect geographic re-
gions (e.g., the opening of a million dollar plant; see Greenstone et al. (2010)), while the latter consist of
high-frequency events that affect geographic regions within cities (e.g., the Moving to Opportunity (MTO)
experiment; see Katz et al. (2001) and Chetty et al. (2015)).
Big data is also improving city management. By making their operations more data-driven, cities can fine-
tune regulations, improve the allocation of scarce resources, and forecast future needs. Crucially, for many
urban data interventions, simply being able to predict outcomes or characteristics is valuable on its own—
many practical problems in cities do not directly require causal inference. Moreover, many data-driven
interventions are scalable; hence, expansion of data collection and digitization efforts across cities attracts
entrepreneurship and innovation.
In Section 2 of this paper, we discuss four questions at the heart of urban social science:
• How does urban development influence the economy?
• How does the physical city interact with social outcomes?
• How much do people value urban amenities?
• How can public policy improve the quality of physical space?
For each question, we highlight how new data sources may improve research by providing improved mea-
surements, and/or new outcome variables of interest. All policy analysis is limited in the scope of outcomes
that can be considered; by providing a broad, finely measured snapshot of urban life, big data can enable
assessment of policy impacts across new outcome dimensions. And big data is often available at high fre-
1

quencies, enabling researchers to measure policies’ effects in real time.
We caution throughout, however, that finer measurement can sometimes make inference worse—not better—
because the selection problems become more severe at the block- or building-level. The strongest case for
using big data to assess economic outcomes in cities is when fine geography can be matched with longi-
tudinal data and random events that are tied to a particular locale; in those settings, big data can enable
researchers to examine whether there is a treatment effect on people who are close to the random event, no
matter where they move.
In Section 3, we show how big data sources can facilitate measurement when government economic statistics
are lacking. We use a computer-based visual recognition technique to form a prediction model linking
income with Google Street View imagery across New York City block groups. We then show that this
prediction model has a .77 R2 when used to predict income out-of-sample in New York City and a .71 R2
when used to predict income out-of-sample in Boston. Our illustration here suggests that image corpora
may provide a key to mapping wealth and poverty in previously unmeasured areas of the developing world.
This approach could be used to extrapolate GPS-coded income surveys to much larger populations through
image analysis. It should also be possible to provide new insight into the extent of segregation. By tracking
changing images over time, computer vision can provide new ways to evaluate the effects of policies as well.
More generally, combining big data sources like imagery with predictive methods can be used to “fill in the
blanks” in a variety of smaller-sample data sources useful for urban economics.1
Section 4 turns to urban surveys and contingent valuation. Typically, contingent valuation has been used
for environmental amenities—a context in which it has been disparaged by economists because of non-
familiarity and non-instrumental preference problems (Hausman (2012)). We believe that housing price
hedonics are the best tool for examining how homeowners value local amenities. Nevertheless, there are
many urban amenities that bring benefits for people who do not live nearby2; for such amenities, survey
techniques may be the only way to estimate valuations. We propose two means of improving accuracy of
contingent valuation surveys in the urban domain: making choices comparable and and compatible with
personal experience. Researchers should not ask subjects to compare an urban park to tax receipts; rather,
they should compare one urban park with another equally appealing use of public funds, such as early
childhood education slots or increased sidewalk greenspace. Additionally, surveys should be structured in
ways that do not ask subjects to make judgments that are completely foreign to their real-world experiences.
Few people have ever had to decide whether to spend ten million dollars on an urban park. However, people
choose where they walk on a daily basis. Thus, rather than asking people about monetary valuations for1For example, if researchers have image time-series, then it will be possible to examine whether a new road increases economic
prosperity in the region (for a related example, see Naik et al. (2015)). Image data will never on their own enable us to see whethera treatment impacts people or just place—since images do not indicate whether the occupants of particular areas have changed—butimagery provides rich outcome variables at lower levels of aggregation than were previously available.
2For example, Central Park presumably benefits even those New Yorkers who do not live on Fifth Avenue or Central Park West,both by providing leisure space and by improving air quality.
2

parks, it may be preferable to gauge demand by asking whether people would walk a block to have the
chance of walking through the park instead of a more standard streetscape.
Finally, Section 5 looks at the connection between big data and government service provision. There are
many areas in which public services improve with information, including ensuring sanitary conditions in
restaurants and hotels, targeting repairs of potholes, identifying struggling students, or deciding sentences
for convicted criminals; in many of these contexts, machine learning can be used to make urban resource
allocation more efficient. Complaints on Tripadvisor or Yelp, for example, can be used to guide public
inspections via predictive algorithms. Big data thus provides a means of improving city services—often
without explicitly requiring causal inference.3 Generalizing from the preceding examples, we provide a
taxonomy of new data sources that can be used to improve both the measurement of urban quality of life
and the allocation of scarce resources.
2 Urban Questions and Big Data
In this section, we review four key questions of urban science, and discuss how big data can be used to help
answer each. None of the questions we discuss here are new—we focus on how big data helps us approach
classical questions in new ways. Throughout, we will differentiate between cases where big data just means
better measurement and cases where big data offers the possibility of better identification as well.
First, we examine the core question of urban economics: how urbanization and the physical city impact
productivity. Then, we consider broader questions of urban social science—how the physical city impacts
to non-economic outcomes like quality of life, social connections, and leisure activities. Next, we turn to
the closely related question of how people value changes in the city. Finally, we turn to practice, examining
how new data can improve the quality of urban services.
How does urban development influence the economy?
The literatures in urban and regional economics have focused first and foremost on identifying the determi-
nants of local productivity. Perhaps the most central question is whether there are agglomeration economies
(e.g., Ciccone and Hall (1996)): Do increases in density increase productivity? Perhaps most policy-relevant
is the impact of infrastructure (see, e.g., Gramlich (1994)): Do infrastructure investments deliver large eco-
nomic returns? A third urban economics literature (see, e.g., Rauch (1993); Moretti (2004)) examines
human capital spillovers: Does having educated neighbors make you more productive?
3Our computer vision analysis in Section 3 shows that machine learning methods can be used to extrapolate dependent variablesfor use in economic analysis. The case of city resource allocation provides a second instance in which applying machine learningalgorithms to big data from cities can be directly useful—even without new sources of variation.
3

In the case of productivity outcomes, big data typically means administrative income data available at fine
geographic frequencies (and sometimes disaggregated temporal frequencies as well). Administrative Inter-
nal Revenue Service (IRS) data, for example, provides address-level information on income. Longitudinal
Business Database data provides address-level data on firm productivity and revenues. Other sources, such
as credit card companies, can provide urban business sales data that is disaggregated across both time and
space.
Even very fine data, however, does little on its own. Big data is most valuable when it improves causal
inference, typically through combination with exogenous shocks.4
Typically, the underlying cross-sectional relationships are clear. A one log point increase in density at the
metropolitan area (or zip code) level is associated with about a .06 log point increase in productivity or
wages (Glaeser and Gottlieb (2008)). The human capital spillover relationships are even stronger. The hard
question is whether these cross-sectional relationships reflect causality or unobserved heterogeneity across
people and/or across places.5
From a historical perspective, unobserved place-based heterogeneity is likely to be quite significant. Nine-
teenth century New York grew great because its harbor and water-borne access into the American continent
provided huge productive advantages not only to traders, but also to manufacturers who benefited from
lower transportation costs. The coal mines outside of Pittsburgh provided productive advantages to the steel
factories of Andrew Carnegie, and those productive advantages induced the migration that made Pittsburgh
a great metropolis.
We now typically think of place-based productivity advantages as having been eroded by declining trans-
portation costs. Indeed, Combes et al. (2010) are sufficiently confident about the irrelevance of historically
important geologic features that they use them as instruments for population density, which can only be
a valid procedure if geographic features are truly irrelevant to productivity today. The urban transition
from manufacturing goods (which may rely on local inputs) to services (which typically do not) makes the
Combes et al. (2010) assumption distinctly plausible, and suggest that unobserved place-based heterogeneity
in productivity may not significantly bias agglomeration and human capital spillover estimates.6
That said, sorting on the basis of human capital remains as important as ever. Berry and Glaeser (2005)
document that cities with higher skills as of 1940 or 1970 increased their skill levels more dramatically
in subsequent decades. Sorting on observables into cities is relatively mild in the U.S. (Glaeser and Mare
(2001)), but this is not true in Europe (Combes et al. (2008)). The problem of unobserved sorting among4These shocks can be shocks-to-people, such as the Moving to Opportunity Experiment (MTO) (see Katz et al. (2001) and
Chetty et al. (2015)) that moved poorer people to richer neighborhoods, or shocks-to-place, such as the opening of a new subwaystop.
5Unobserved heterogeneity across people across people reflects the sorting of people into places based on ability levels. Unob-served heterogeneity across places reflects the tendency of people to move into areas that have exogenously higher productivity.
6However, local productivity advantages stemming from public policies may remain, as discussed by Holmes (1998).
4
people is likely to be particularly severe when estimating human capital spillovers—in that case, the in-
dependent variable is the extent of sorting on observable skills, and it seems implausible that sorting on
unobservable skills would follow the same pattern.
Identification of agglomeration or human capital externalities typically comes in two ways: shocks to peo-
ple or shocks to places. The “shocks to people” approach involves looking at a sample of people who
change locations for exogenous reasons. The “shocks to places” approach involves examining the impact of
exogenous changes to a particular locale.
What will big data do to the estimation of agglomeration economies and human capital spillovers? Better
measures of income and output will make it possible to examine things at much finer levels of spatial and
temporal aggregation. Finer geographic details makes it much easier to imagine estimating the impacts of
fine-grained physical geography. When agglomeration work is done at a high level of aggregation, as in
Ciccone and Hall (1996), the role of street level physical space is almost imperceptible, but when agglom-
eration is studied in more detail, as in Arzaghi and Henderson (2008), the streetscape’s role becomes more
obvious.
In a sense, the geographic detail offered by big data reduces measurement error but makes sorting even
more problematic. The county level employment density of 1,000 workers per square kilometer—which is
higher than 95% of U.S. zip codes—tells us next to nothing about the actual density and physical structure
of the work environment. If the workers are spread evenly, then there are about four workers per acre, which
would suggest relatively low density suburban work environments. Conversely, if the workers are crammed
together in a dense urban core, then they could be in skyscrapers.
County-level data is an extremely imprecise measure of the density experienced by the average worker, but
finer detail can also be misleading because of sorting. We can look at geographic detail at a finer level even
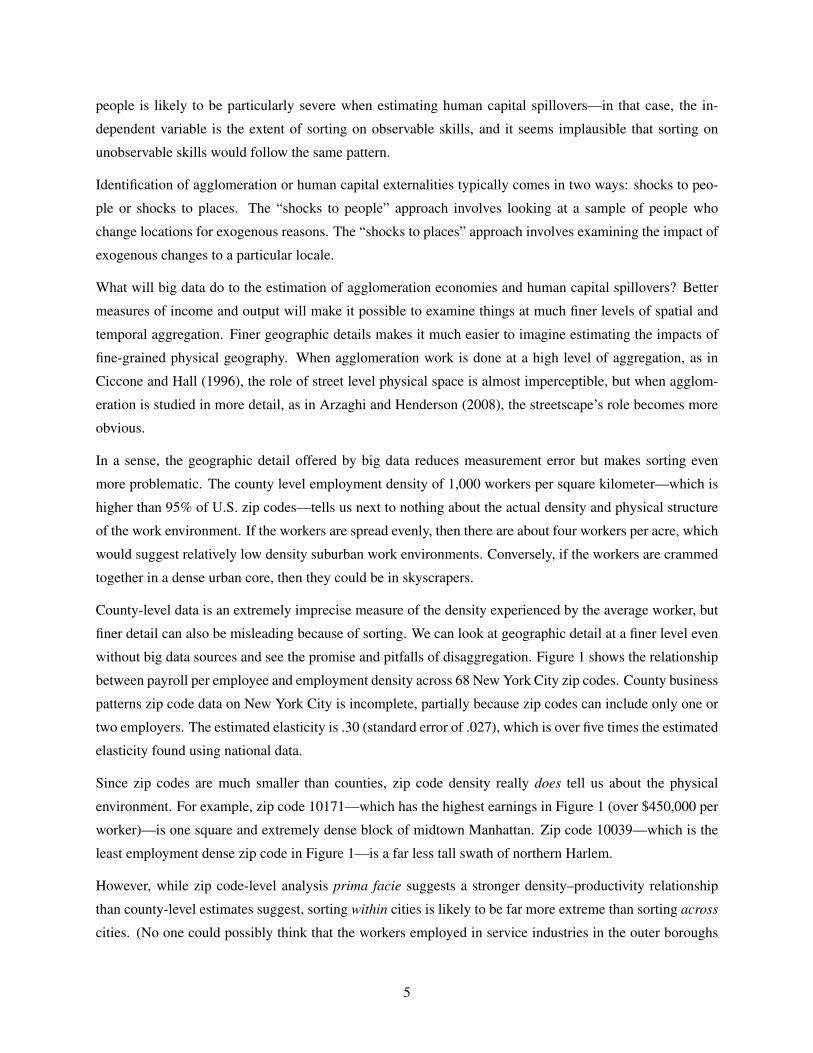
without big data sources and see the promise and pitfalls of disaggregation. Figure 1 shows the relationship
between payroll per employee and employment density across 68 New York City zip codes. County business
patterns zip code data on New York City is incomplete, partially because zip codes can include only one or
two employers. The estimated elasticity is .30 (standard error of .027), which is over five times the estimated
elasticity found using national data.
Since zip codes are much smaller than counties, zip code density really does tell us about the physical
environment. For example, zip code 10171—which has the highest earnings in Figure 1 (over $450,000 per
worker)—is one square and extremely dense block of midtown Manhattan. Zip code 10039—which is the
least employment dense zip code in Figure 1—is a far less tall swath of northern Harlem.
However, while zip code-level analysis prima facie suggests a stronger density–productivity relationship
than county-level estimates suggest, sorting within cities is likely to be far more extreme than sorting across
cities. (No one could possibly think that the workers employed in service industries in the outer boroughs
5

Figure 1: Per Capita Payroll and Density Across New York City Zip CodesData on employment and annual payroll is from County Business Patterns (2013). Data on land areas is from the2010 Census.
6

of New York are likely to have the same qualifications as workers on Park Avenue!) Moreover, spatial
equilibrium models following Rosen (1979) and Roback (1982) accept spatial differences in wages that are
offset by spatial differences in amenities and housing costs. Workers in Manhattan all face the same menu
of housing costs and amenities. Firms may be more productive in some areas than others, but the logic
of equilibrium models suggests that locational advantages in productivity within a city should be paid for
through higher real estate costs, not higher wages. While we cannot know with certainty, we suspect that
using finer and finer data in this case may make identification problems worse, rather than better, because
increased sorting across space biases the results much more than improved measurement unbiases them.
Fine geographic and temporal detail becomes more valuable when it is merged with “shocks to places,” i.e.,
plausibly exogenous variation varying over both time and space.7 New infrastructure, such as highways
(Baum-Snow (2007)), provide one possible source of exogenous variation. Spatially delineated public poli-
cies, such as empowerment zones (Busso and Kline (2008)), provide another. If a highway or public policy
is unexpected, and if there exist plausible control groups, then high-resolution data can enable researchers
to plausibly estimate causal impacts by comparing areas that are close to the new infrastructure to areas that
are far away. Infrastructure’s impact is likely to decay continuously, but some public policies create sharp
spatial breaks (as in Black (1999)). Spatial breaks make for an ideal experiment, because it is possible to
compare workers literally across the street from each other. When using infrastructure changes for identifi-
cation, fine data becomes extremely important: the analysis requires data fine enough to compare businesses
that truly close to the change with similar businesses that are further away.8,9
An alternative tool is the “shocks to people” approach that examines the changes in an individual’s pro-
ductivity when that individual is relocated from one environment to another. Again, here big data offers
opportunities—but only when it is paired with a plausible source of random variation.
Perhaps, the most famous example of a “shocks to people” experiment is the MTO (again, see Katz et al.
(2001) and Chetty et al. (2015)). In this experiment, poorer households were randomly allocated vouchers
that enabled and incentivized them to move to lower poverty areas. While some of the earlier analyses of
MTO found minimal effects, Chetty et al. (2015) found that children who were moved early enough through
MTO experienced clear improvements in earnings. Big data from the IRS was critical to the Chetty et al.
(2015) study, because access to IRS records meant that all of the study’s participants could be followed years7If there is exogenous variation that differs only across space (e.g., natural aspects of geography), then sorting remains unabated.8The value of temporal granularity is more debatable. If a change really will have immediate impacts, such as those created by
an electricity outage, then big data’s precision seems valuable. In the more standard case, where the time of response to shocksis uncertain, then ultra-high frequency data is likely to be less valuable. In all cases, it is better if the original inhabitants of theshocked geographic area can be followed, rather than just the current residents, since there will inevitably be some sorting ex post.
9The preceding examples show cases in which big data might improve existing estimates where there are shocks to places,but the shocks do not specifically estimate the impact of agglomeration economies or human capital spillovers unless furtherassumptions are added to the model. For example: A structural model can be written where agglomeration economies are createdby a distance weighted measure of nearby economic activity. If distance is measured by time and cost of travel, then a shockto transport infrastructure represents a shock to agglomeration. The new infrastructure then presents exogenous variation in theamount of nearby activity and it can be used to estimate the size of agglomeration economies.
7

after the experiment took place.
Because of unobservable sorting, estimates of agglomeration economies or human capital spillovers require
experiments—big data alone is not enough. That said, big data can supplement and improve estimates from
existing studies, as illustrated by the work of Chetty et al. (2015). Big data may also make it possible to
estimate treatment effects of smaller-scale interventions that would be missed with classical data sources.10
There are small, natural shocks to cities every day. Big data may make it easier to use those shocks to better
understand urban productivity.
How does the physical city interact with social outcomes?
While economists are particularly focused on productivity, urbanists more generally are at least as interested
in social outcomes. Newman (1972) hypothesized that urban design could influence the level of crime by
creating “defensible space.” Architects have long argued that good buildings bring happiness, and that
physical space helps shape social relations. Few people would doubt that transportation infrastructure has at
least some impact on travel times and potentially on public health (Currie and Walker (2011)).
Much of urban economics has been relatively detached from many physical aspects of the city, such as
architecture and streetscapes. The large literature on agglomeration economics typically relates per capita
productivity or wages with some measure of economic density, such as the number of employees in the
metropolitan area. The literature on housing price hedonics typically does control for measured features of
housing units (e.g., numbers of bathrooms and square footage), but hedonic estimates rarely measure the
appearance of the outside neighborhood or even the quality of the interior space.
The lack of connection between urban social science and the physical city is in part driven by a lack of data
on the physical attributes of urban space. New big data tools make it increasingly possible both to measure
the physical city and to measure outcomes that may be influenced by urban space.
Big data provides new opportunities to measure city characteristics at fine scales: At this point, the physical
geography of most American cities is online and accessible to social scientists. As we describe Section 3,
street-level imagery data from Google Street View can be used to measure the physical city. City maps tell
us transport modes and street grids. Mapping platforms and applications provide high-frequency measures
of traffic.
Big data is also providing us with a far wider range of potential outcome variables to study. Social network
maps can be derived from Facebook and LinkedIn. In principle, the GPS components of smartphones enable
urban mobility to be tracked on a truly fine geographic scale. In many cases, privacy concerns limit the full10For example, credit card sales data available store-by-store,would make it easier to estimate the business impact of pedestrian-
izing a street or opening a new bus stop.
8

use of the data—but new privacy technologies may make it possible to use fine data for research without
significant loss of individual privacy (see, e.g., Dwork and Roth (2013)).
We also have a large amount of information on health, crime, and education outcomes. Researchers have
used medical records for years, but new electronic medical record systems lead to data that is more detailed,
robust, and machine-readable (see, e.g., Kho et al. (forthcoming)). Partnering with police forces allows
access to daily reported crime data (Braga and Bond (2008)). Since the pioneering work of John Kain in the
1990s, researchers have been using administrative test records to assess educational interventions (Glaeser
et al. (2004)).
How can newly available data help us better assess the social impact of the physical city? For an illustration,
we consider the question of why mortality is now lower in many big cities such as New York. One potential
explanation is lower car use, which may mean both more exercise and less risk of motor vehicle deaths.
In principle, GPS data can get us better measures of just how much walking and driving is being done by
urbanites of all ages. While we have some measures of driving from the National Personal Transportation
Survey, these data are based on small samples. GPS datasets can become huge and enable researchers to
measure the mobility behavior of wider range of people; in principle, mobility data can also be linked with
medical records to look for cross-sectional correlations.
Unfortunately, the preceding exercise again highlights that big data on its own establishes only correlation—
not causality. Even if the data show that urbanites walk more and that people who walk more are healthier,
we cannot interpret this as meaning that walking causes health generally or the healthy of urbanites in
particular. We would need some alternative source of variation.
In order to estimate the treatment effect of walking, we would need some unanticipated shock that increases
the returns to walking relative to driving. Pedestrianization of nearby roads, for example (which has been
the policy of many European cities) could be such a shock. Increases in parking costs for public spaces
might provide another option.
A second major social science question is the link between community cohesion and public safety. Samp-
son, Sampson et al. (1997) pioneered this question by using images of community connection that they
hand-collected. In principle, crowdsourced community images could provide a far cheaper source of mea-
surement; these measures can be readily linked with neighborhood-specific crime data. But even with
perfect data on community connection and perfect data on crime, the correlation does not prove a causal
link. Again, there needs to be some sort of a shock to connection to establish causality.11
11In this case, perhaps the closing or opening of a church or community center might provide exogenous variation. A physicalreconfiguration of the neighborhood provides another possible route to causal inference.
9

How much do people value urban amenities?
When policy-makers decide on urban investments, from infrastructure to public safety, they are implicitly
or explicitly considering social costs and benefits. One of the roles of urban social science is to provide
estimates of the value that consumers place on urban amenities. Big data and new survey measures provide
tools for better measuring the value that consumers place on urban attributes.
There are two large strands of literature on assessing the benefits of urban amenities. Hedonic housing
price models compare the prices for housing units that vary in amenities, such as safety or good views;
the difference in price provides an estimate of consumers’ willingness to pay for the amenity. Contingent
valuation, by contrast, uses surveys—essentially asking people about their willingness to pay.
Hedonic price models make the most sense for valuing amenitues that are spatially delineated. If crime is
localized to a neighborhood, then a hedonic model can (under ideal circumstances) infer a willingness to
pay for lack of crime. Hedonic estimates will not be able to determine the benefit that urbanites receive from
a large urban park if they do not live near that park. While we accept most of the shortcomings to contingent
valuation stressed by the literature (see, e.g., Hausman (2012)), we believe that there is no alternative for
evaluating spatially diffused benefits. Section 4 suggests approaches for improving the survey techniques for
contingent valuation in cities. Here, we discuss the interplay between big data and housing price hedonics.
There are two classic problems that trouble housing price hedonics: heterogeneous valuations and omitted
locational variables. The heterogeneous valuation problem is that consumers value amenities differently,
and a hedonic price at best only estimates the willingness to pay for the marginal consumer (see, e.g.,
Epple (1987)). Meanwhile, the omitted locational variables problem is that every house and neighborhood
is associated with a vast vector of attributes—and many of these attributes are unmeasured. The estimated
value of measured attributes will be biased if those attributes are correlated with unobserved variation.
Black (1999) provides a particularly clean example of an approach that seems to solve most of the omitted
variables problem, but cannot do much about the heterogeneous valuation problem. Massachusetts’ towns
are separated into attendance districts, which represent discrete geographic boundaries that determine where
children go to lower and middle school. Black (1999) compares houses that are literally across the street
from one another, but that are in different attendance districts. Since everything else about government is
identical, the neighborhood is the same and the housing attributes are also quite similar, it seems quite plau-
sible that Black (1999) estimates a willingness to pay for lower and middle schools with better test scores.
Notably, however, Black (1999) can do nothing to tell us how his estimates differ from the willingnesses to
pay of parents who were not on the margin between the two attendance districts.
Clean hedonic estimates can also be obtained from New York City condominium data, which Glaeser et al.
(2005b) use to estimate the value of a city view. In this case, the regressions include building-fixed effects
and compare identical apartments on different floors. The roughly 20% premium to being in a high floor
10

seems like a reasonable estimate of the willingness to pay for a view, although it is possible that this estimate
is compromised slightly by the presence of ritzier neighbors on higher floors.
How can big data improve housing price hedonics? The first contribution is the proliferation of dense
data sets with information on home sales by address. Such data sets have always been available. Black
(1999), for example, used information from Banker and Tradesman on home sales in Massachusetts. But
since house sales are public information, data sets on sale prices are becoming more common and less
expensive. Eventually, they may make research that relies on self-reported housing values from the Census
or American Housing Survey obsolete. Unfortunately, sales data may include only a very limited set of
housing characteristics, and sales data rarely contain detailed information about the physical nature of the
housing stock. One approach is to look at repeat sales and assume that the physical characteristics of a house
have remained constant over time—but this assumption is often hard to accept.12 Alternatively, sales data
must be combined with alternative sources of information about housing characteristics—a natural big data
frontier.13
As many physical amenities are interior, big data aggregators are going to have to work harder to get esti-
mates of interior space. One natural source for interior information is the floor plans and images connected
to addresses by web sites like Zillow and Craigslist. If interior images can be downloaded at scale, then they
can be linked to sales prices, just as external images can (see Section 3). While even high-resolution images
may not allow us to control for unit quality perfectly, they certainly include far more information about unit
characteristics than current hedonic analyses do.
Beyond the physical landscape, big data provides novel information on the test scores of local schools or
the quality of local restaurants. Yelp, for example, provides block-by-block data on the popularity of local
services. While service quality will not be exogenous, it can be part of a hedonic system that measures
willingness to pay. Social patterns are also more observable from Twitter locales as well, and this lets
researchers estimate which areas are popular on, say, weekend nights.
We must note, however, that while big data can provide stunningly precise pictures of life within a particular
neighborhood, it can never fully satisfy the omitted variables problem. When neighborhood attributes are
endogenous, controlling for them becomes problematic—and researchers would need even more sources of
exogenous variation.
Big data means better price data and a far larger vector of potential explanatory variables. It does not mean
that there are clear sources of exogenous variation in local attributes. Moreover, housing price dynamics are
murky. It may take minutes or months for a shock to percolate into housing values. Consequently, high-
frequency price or rent data is unlikely to provide clean identification of the impact of shocks. Big data will12For example, Autor et al. (2014) look at the changes in prices after rent control, but they explicitly accept that these changes
will include the effects of unmeasured quality upgrading.13Gregoir et al. (2012) provide a nice example of a particularly large data set on rents and housing data, but their data is unusual.
At present, observing the physical characteristics of a house typically means relying on a traditional government survey.
11

enable us to run hedonic price regressions with more explanatory variables, but it will not on its own enable
us to run better-identified regressions.
How can public policy improve the quality of physical space?
Beyond its value for academic analysis, big data provides opportunities to improve the quality of public
services. In this context, causality sometimes remains important—but at other times, simply being able to
predict outcomes is valuable on its own.
Perhaps the most natural use of big data in city governance is for management. The New York City Police,
for example, Department credits the highly local measurement of crime as being a major part of making New
York safe. Knowing exact locations of each crime enabled police to target resources and find criminals. Data
made it easier to hold precinct chiefs accountable.
The data-driven approach to policing works for other public services, as well. The Street Bump mobile app,
for example, streams data about potholes from people’s cars to Boston’s street repairers; the data comes
from jolts to the citizens’ smart phones.14 Similarly, big data makes it easier to have systems for citizen
complaints that enable the citizens and public monitors to monitor progress. For example, Massachusetts’s
Commonwealth Connect app, built off of Boston’s Citizens Connect app, enables individuals “to report
[urban] issues to the appropriate local municipality, even when the user doesn’t know which department or
municipality should respond”.15
As we discuss in Section 5, big data also makes it easier to target city services like restaurant inspections.
If Yelp complaints about the sanitary conditions in a restaurant are particularly high, then this provides
information that can help to target inspectors—a limited resource. Likewise Yelp’s rating of particular city
offices provides an alternative source of information that may be useful to urban management.
Yet the opportunities that are created by big data can, in principle, collide against the government institutions
(or strong public sector unions) that make it difficult to change work rules or institute data-based incentives.
Thus, perhaps the best opportunities for using big data in city management arise in settings where the in-
terests of public workers are not threatened by the data. Technologies that make it easier for teachers to
target their teaching are much easier to implement than technologies that make it easier to evaluate teach-
ers. Labor-saving big data tools, such as automated appraisal methods, are easier to contemplate when the
workers are outside contractors, rather than unionized city officials.14See http://www.streetbump.org/.15See http://www.cityofboston.gov/doit/apps/commonwealthconnect.asp, and also Weiss (2015).
12

3 Measuring the Streetscape
While many of the core urban questions require exogenous variation, there are cases in which measurement
itself can be of great value. In this case, big data can bring advances even without natural or planned
experiments. In this section, we detail how applying computer vision algorithms to Google Street View data
(or other image corpora) can be used (1) to measure the physical characteristics of a neighborhood and (2)
to estimate neighborhood income.
In the past decade, Google Street View has extensively photographed the built environment in more than 100
countries. Almost all American cities have been documented in high-definition; the resulting images can be
classified using computer vision algorithms. The basic approach is to have some form of training data, which
includes Global Positioning System (GPS)-coded attributes of interest (such as housing prices, income, or
ratings of urban upkeep). The computer vision algorithm then learns to predict the target attribute from
high-dimensional moments of the arrangements of pixels in the imagery. Since training on high-dimensional
features can easily result in over-fitting, the predictive model is tested on a second sample. If the model’s fit
on the test sample seems good, then the model can be used to generate estimates of the focal attribute for
settings in which the underlying attribute data is not available.
Naik et al. (2014) provide one example of how Street View can be used to measure the physical attributes
of a neighborhood. They begin with crowdsourced ratings of perceived safety for 4,109 images (see also
Salesses et al. (2013)). Human perceptions of safety are then taken as the focal attribute, and computer vision
algorithms are used to scale the safety assessment to a sample of 1,000,000 images across 21 cities. Using the
Naik et al. (2014) measurements, we have now examined patterns of change in predicted perceived safety,
and documented that areas that are denser or better educated saw the largest improvements in perceived
safety at the neighborhood level (Naik et al. (2015)).
In this section, we consider two distinct but related questions. First: Can Street View imagery data be used
to predict income? Second: Can Street View data improve the quality and fit of hedonic regressions? The
first question is most relevant in the developing countries, where often we have large image corpora, but
no reliable large-sample income data. The second question is likely to be more relevant in the developed
world, where we have price data but typically have not used visual images of the streetscape as explanatory
variables. Predicting prices with streetscape imagery may also have public policy value as a tool in property
value appraisal in places (both developed and developing) where governments rely on property taxes.
If images are available for an entire city, then we can use a computer vision model trained on a small sample
of income data to produce a citywide map of wealth and poverty, as well as measures of income segregation.
If we have images at different point in time, we can then test how individual interventions changed the
distribution of wealth.
13

4 4.2 4.4 4.6 4.8 5
4
4.2
4.4
4.6
4.8
5
Performance on the Training Sample
Predicted Log Median Income
True
LogMed
ianIncome
4 4.2 4.4 4.6 4.8 5
4
4.2
4.4
4.6
4.8
5
Performance on the Testing Sample
Predicted Log Median Income
True
LogMed
ianIncome
Predicting House Price
4.2 4.4 4.6 4.8 54
4.5
5
5.5
6
6.5
Predicted Log Median Income
True
LogHou
sePrice
(a) (b) (c)
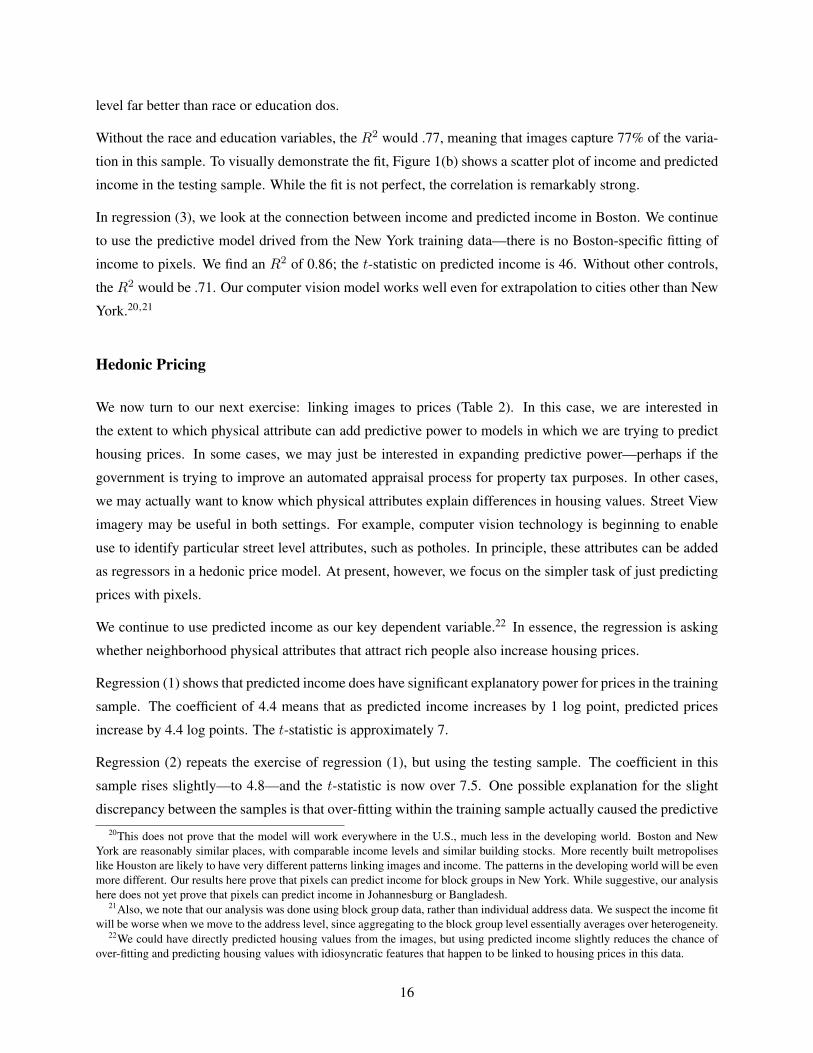
Figure 2: Predicting Income and Housing Price from Street View ImagesMedian income for New York City is obtained from the 2006–2010 American Community Survey.
Predicting Income and Housing Prices with Pixels
As a proof of concept, here we demonstrate that we can predict the median income of residents in New York
City from Street View images using a computer vision model. We also show that the computer vision model
trained to predict median incomes from images from New York City is able to predict the median income of
images from Boston with almost the same accuracy as in New York. Finally, we link predicted income with
housing prices to show the potential use of this technology in hedonic housing price regressions.
We queried the Google Street View Image API to obtain cutouts from 3600 panorama images captured by
the Street View vehicles between 2007 and 2014. The cutouts were obtained by specifying locations (using
latitude, longitude values) and camera viewpoints (using the heading and pitch of the camera relative to the
Street View vehicle). We randomly selected latitudes and longitudes from a uniform grid overlaid on city
boundaries.16 We set the heading to 900 and pitch to 100 for all images. For this study, we set the sampling
factor to 40 images per square mile and obtained 12,200 images from New York City and 3,608 images from
Boston.
We linked our image data to median family income data at the census block group level using the American
Community Survey (ACS) data, which aggregates the samples collected between 2006 and 2010. The
images from New York City cover 2,439 block groups at a resolution of 10 images per block group, while
the images from Boston cover 459 block groups at a resolution of 15 images per block group. There are a
few census block groups with reported incomes clipped at $1,000,000. We clipped the incomes at $118,550,
which is two standard deviations above the mean of median incomes across the block groups. Finally, we
coverted the reported incomes to logarithmic scale.
To predict median income from Street View images, we followed Naik et al. (2014), who predict the per-
ception of safety from Street View images. We began with a modified version of the Geometric Layout
algorithm (Hoiem et al. (2008)) to assign pixel-wise semantic labels. We assigned pixels to four geometric16We obtained this grid by selecting centroids of an unstructured simplex mesh computed over a polygon describing city bound-
aries (Persson and Strang (2004)).
14

classes: “Ground,” “Buildings,” “Trees,” and “Sky.” Next, we extracted three image features from the pixels
that belong to the four geometric classes separately. We extracted 512 dimensional Texton maps (Malik
et al. (2001)) from each geometric class.17 Next, we extracted the GIST feature descriptors, which represent
the spatial layout properties of a scene (Oliva and Torralba (2001)), for each of the geometric classes. After
that, we extracted color information from images with joint histograms in CIE L ·a ·b color space.18 Finally,
we merged our three feature sets—textons, GIST, and color histograms—to obtain a 7,480-dimensional
representation of each image.
After feature extraction, we used v-Support Vector Regression (v-SVR) (Scholkopf et al. (2000)) to predict
income from Street View images. Given a set of training images with feature vectors x and income y, v-
SVR with a linear kernel generates a weight vector w and a bias term b under a set of constraints. The two
variables (w and b) are used to predict the income for a new image with feature vector x′ by evaluating
y′ = w · x′ + b.
For training, we used the libsvm (Chang and Lin (2002)) implementation of v-SVR.19
We randomly selected images from half of the block groups from New York City to use as the training set.
We then trained a v-SVR model, and used this model to predict the income of images from the “test set”
comprised of block groups excluded from the training set. We averaged the predicted incomes of images
from these census block groups to obtain an estimate for their median incomes. The results from this exercise
are shown in Figure 2(a) and Table 1.
The first column in Table 1 shows the correlation between the predicted income measure and the actual
income measure for the training sample. For comparison purposes, we have also included percent white and
the share of the adult population that is college-educated. Across our 1220 observations, the R2 is 0.85,
indicating that the fit is quite good. Notably, almost all of the fit is coming from the visually predicted
income measure, which has a t-statistic of 70. By contrast, the t-statistic for college share is under 5.
Without, the race and education variables the R2 would be 0.77. Without the predicted income measure, the
R2 for education and race would be 0.25.
But the results on the training sample are relatively uninformative. In principle, the image data is suffi-
ciently rich that we could massively over-fit the data—essentially we would be using a vector of explanatory
variables with 1220 elements (or more) to explain a data set with 1220 observations. The real test of the
technology lies in regression (2) of Table 1, in which we examine the link between predicted income and
reported income in the test sample. Somewhat remarkably, the results are virtually unchanged. The R2 of
the regression is .81. The t-statistic on predicted income is 62. Images can predict income at the block group17Texton maps encode the textures of objects such as walls, foliage, and streets.18The 3D histograms had 4, 14, and 14 bins for L, a, and b channels, respectively.19We set the slack variable (C) to 0.01.
15
level far better than race or education dos.
Without the race and education variables, the R2 would .77, meaning that images capture 77% of the varia-
tion in this sample. To visually demonstrate the fit, Figure 1(b) shows a scatter plot of income and predicted
income in the testing sample. While the fit is not perfect, the correlation is remarkably strong.
In regression (3), we look at the connection between income and predicted income in Boston. We continue
to use the predictive model drived from the New York training data—there is no Boston-specific fitting of
income to pixels. We find an R2 of 0.86; the t-statistic on predicted income is 46. Without other controls,
the R2 would be .71. Our computer vision model works well even for extrapolation to cities other than New
York.20,21
Hedonic Pricing
We now turn to our next exercise: linking images to prices (Table 2). In this case, we are interested in
the extent to which physical attribute can add predictive power to models in which we are trying to predict
housing prices. In some cases, we may just be interested in expanding predictive power—perhaps if the
government is trying to improve an automated appraisal process for property tax purposes. In other cases,
we may actually want to know which physical attributes explain differences in housing values. Street View
imagery may be useful in both settings. For example, computer vision technology is beginning to enable
use to identify particular street level attributes, such as potholes. In principle, these attributes can be added
as regressors in a hedonic price model. At present, however, we focus on the simpler task of just predicting
prices with pixels.
We continue to use predicted income as our key dependent variable.22 In essence, the regression is asking
whether neighborhood physical attributes that attract rich people also increase housing prices.
Regression (1) shows that predicted income does have significant explanatory power for prices in the training
sample. The coefficient of 4.4 means that as predicted income increases by 1 log point, predicted prices
increase by 4.4 log points. The t-statistic is approximately 7.
Regression (2) repeats the exercise of regression (1), but using the testing sample. The coefficient in this
sample rises slightly—to 4.8—and the t-statistic is now over 7.5. One possible explanation for the slight
discrepancy between the samples is that over-fitting within the training sample actually caused the predictive20This does not prove that the model will work everywhere in the U.S., much less in the developing world. Boston and New
York are reasonably similar places, with comparable income levels and similar building stocks. More recently built metropoliseslike Houston are likely to have very different patterns linking images and income. The patterns in the developing world will be evenmore different. Our results here prove that pixels can predict income for block groups in New York. While suggestive, our analysishere does not yet prove that pixels can predict income in Johannesburg or Bangladesh.
21Also, we note that our analysis was done using block group data, rather than individual address data. We suspect the income fitwill be worse when we move to the address level, since aggregating to the block group level essentially averages over heterogeneity.
22We could have directly predicted housing values from the images, but using predicted income slightly reduces the chance ofover-fitting and predicting housing values with idiosyncratic features that happen to be linked to housing prices in this data.
16

(1) (2) (3)VARIABLES True Log True Log True Log
Income Income IncomeNew York New York Boston(training) (testing) (testing)
Predicted Income 1.328*** 1.357*** 1.639***(0.019) (0.022) (0.036)
Share White 0.003 0.001 0.033**(0.006) (0.007) (0.015)
Share College-Educated 0.046*** 0.076*** 0.126(0.011) (0.013) (0.016)
Observations 1,220 1,219 459R-squared 0.849 0.820 0.858
Table 1: Regressions of Income on Predicted Income and Socioeconomic VariablesRegressions (1) and (2) control for borough fixed effects. Socioeconomic variables are obtained from the 2006–2010American Community Survey. Standard errors are in parentheses. Regressions are estimated with a constant that isnot reported. ∗ ∗ ∗ = p < 0.01, ∗∗ = p < 0.05, ∗ = p < 0.1
(1) (2) (3) (4) (5)VARIABLES True Log True Log True Log True Log True Log
House Price House Price House Price House Price House PriceNew York New York New York Boston Boston(training) (testing) (training) (testing) (testing)
Income Residual 3.982*** 3.601***(0.821) (0.911)
Predicted Income 4.372*** 4.833*** 3.412*** 7.722*** 5.420***(0.631) (0.643) (0.701) (0.709) (0.909)
Share White 0.778*** 0.492** 0.486** 0.204 0.085(0.187) (0.196) (0.194) (0.303) (0.300)
Share College-Educated 1.128*** 0.459 0.156 -0.983*** -1.028***(0.369) (0.386) (0.387) (0.334) (0.329)
Observations 1,220 1,219 1,219 459 459R-squared 0.218 0.225 0.240 0.223 0.249
Table 2: Predicting Housing Price with Income and Socioeconomic VariablesRegressions (1)–(3) control for borough fixed effects. Socioeconomic variables are obtained from the 2006–2010American Community Survey. Standard errors are in parentheses. Regressions are estimated with a constant that isnot reported. ∗ ∗ ∗ = p < 0.01, ∗∗ = p < 0.05, ∗ = p < 0.1
17

model to hit idiosyncratic income features of the training sample; when applied elsewhere, the model does a
slightly better job of picking up generic features of neighborhood attractiveness, which in turn do a better job
of predicting prices. Figure 2(c) shows the relationship visually; while the fit is far from the overwhelming
correlation shown in Figure 2(b), it remains significant.
Regression (3) shows the results controlling for the residual between the actual income and the predicted
income in the testing sample. Since income is a strong predictor of housing price, and predicted income is
not exactly equal to the actual income, the coefficient for the residual is fairly large—in fact, it is larger than
the coefficient for the predicted income.
Regression (4) shows the results for Boston when we do not control for actual income. As in the case of
New York, predicted income has significant explanatory power for housing price. In fact, the coefficient for
predicted income is 7.7, which is much higher than the coefficient for predicted income in New York. We
also note that the coefficient for the share of college-educated adults (somewhat peculiarly) is negative and
significant.
Regression (5) shows Boston results controlling for the residual between the actual income and the predicted
income. As we found in regression (3), the coefficient for the residual is fairly large (3.6), although smaller
than the coefficient for predicted income (5.4).
Thus, we see that Google Street View can predict income in New York and Boston, and predicted income
helps us predict housing prices in our sample. This does not mean that we can predict income well in the
developing world, but it does provide some hope that Google Street View and similar predicts will enable
us to better understand patterns of wealth and poverty worldwide.
4 Survey Methods
In this section, we turn to the role that survey methods can play in evaluating public investments in urban
space. The basic policy problem is to evaluate the benefits of an investment (such as a park or a new subway
line) or a regulation (such as a height restriction). We assume that the amenity has significant “passive use”
or “existence” value (Krutilla, 1967) or that there are social and political prohibitions against charging for
use, as there are in most urban public spaces.
Environmental economists, starting with Ciriacy-Wantrup (1963) and Davis (1963), were motivated by sim-
ilar conditions to use “contingent valuation” methods to evaluate environmental amenities, such as access
to the Maine woods. Contingent Valuation techniques essentially ask respondents about willingness to pay
for environmental amenities. The problem of assessing how much Chicagoans value an extra park or New
Yorkers value an extra historic preservation district is intrinsically similar to the problem of assessing how
much Americans value species preservation or clean beaches. If contingent valuation works in one setting,
18

then it should work in both.
However, it is far from clear that contingent valuation works in the environmental domain. Diamond and
Hausman (1994) and Hausman (2012) have written compellingly on the empirical shortcomings of contin-
gent valuation surveys. Respondents often provide extremely high valuations for environmental amenities
that seem disconnected with the size of the environmental benefit. Desvousges et al. (1993) found that the
willingness to pay to protect 2,000 birds is essentially identical to the willingness to pay to protect 200,000
birds. Kahneman and Knetsch (1992) documented an “embedding effect,” whereby the willingness to pay
for a good “depends on whether it is evaluated on it own or as part of a more inclusive category.”
Pro-contingent valuation economists have fought back by providing models in which contingent valuation
surveys are incentive compatible, assuming that preferences are classically instrumental and rationality is
robust (Carson and Groves (2007)). As long as there is some probability that a given survey will determine
policy, then a well-posed question that pits costs against benefits should induce a fully rational respondent to
accurately reveal preferences because there is some chance that this respondent’s views will determine pol-
icy. But given the empirical problems associated with contingent valuation, it is tempting to see contingent
valuation as another setting in which the predictions of hyper-rationality fail.
There are two problems with contingent valuation of environmental amenities that are potentially less per-
nicious in urban settings: non-familiarity and non-instrumental preferences. The non-familiarity problem
occurs when surveys ask questions about topics that are quite far from the daily experience of most re-
spondents. Asking most Americans about oil drilling in Alaska, for example, requires them to speculate
about a topic that is extremely far from their daily life; for such a topic, given that most agents have neither
the tools nor the incentives to investigate fully, why should we expect sensible answers? Even more im-
portantly, 39% of Americans identify themselves as environmentalists (Pew Research Center (2014)). The
identity framework of Akerlof and Kranton (2000) suggests that anyone whose self-image is tied to environ-
mentalism could easily have a non-instrumental reason for giving aggressively pro-environment responses
to a surveyor: such responses “prove” environmentalism, either to the individual him or herself, or to the
surveyor.23
In this section, we first make the case that contingent valuation has a place in urban policymaking if it can be
done with any accuracy. We then discuss responses to the problems of non-familiarity and non-instrumental
responses. Finally, we illustrate how contingent valuation might be applied in three settings: evaluating
a new park in Chicago’s Northerly Island, establishing a preservation district in Bedford, Brooklyn, and
imposing height limitations on buildings that abut Boston’s Rose Kennedy Greenway.23This argument is akin to the “warm glow” that is warned against in the NOAA Report on Contingent Valuation (Arrow et al.
(1993)).
19

Why contingent valuation in the city?
Given the problems that Hausman (2012) and others find with contingent valuation, it is tempting to abandon
such survey methods altogether. But in cities, decisions often need to be made about policies that cannot
be evaluated using non-survey techniques. Moreover, unlike in environmental or other purely public good
domains, in cities the alternative to contingent valuation surveys is not careful, technocratic evaluation, but
the messy decision-making of urban interest group politics.
The economist’s first battle in urban policy is to push for any form of cost-benefit analysis—and that battle
is usually lost. Contingent Valuation analysis seems significant because it has the potential to make cost-
benefit analysis more palatable in settings where existence value is thought to be considerable. The case
for cost-benefit analysis in historic preservation, for example, seems much stronger if there is at least some
mechanism for capturing the extent to which pedestrians appreciate the experience of older urban spaces.
There are settings in which hedonic values capture some or all of the social value from an amenity. The
price premium paid near Central Park provides one means of assessing the value of the park. Yet the high
prices on Fifth Avenue may both over- and under-estimate the true value of that vast urban green space.
Environmental amenities attract the rich, and the Fifth Avenue price premium may overstate the true value
of the park because it also captures the perceived value of living next to the super wealthy. If a park premium
is assessed in a model with city-level fixed effects, then the econometrician cannot determine whether the
rise of values near the amenity represents a pure increase in values or just a transfer in value form places
far from the amenity to places near the amenity. Alternatively, the proximity premium may understate the
true value of the amenity because even residents who live far away from the park may derive a lot of value
from it.
Hedonic price estimates have a role in urban policy-making, but they are also—like contingent valuation—
an imperfect technique. For assessing the usefulness of contingent valuation in cities, we should not ask
whether the survey results look like the coherent preferences described in graduate microeconomics, but
whether they provide information that is, in some way, useful for policy assessment.
In most cities, the typical decision-making process is a mixture of interest group lobbying, local legislatures,
and executive authority—with little formal cost-benefit analysis of any sort. This process produces zoning,
most urban parks, historic preservation and subsidies to lure large employers. Elected officials are the
only safeguard of general well-being against interested parties. It is hard to see the downside of bringing
some contingent valuation polling into their decision-making, as long as the flaws of the method are well
understood.
A preference elicitation alternative to contingent valuation is the use of direct referenda. Direct democracy
has both fans (Matsusaka (2005)) and detractors (Schrag (2004)), and we do not mean to take a stand on the
use of referenda, in general. Yet we note that referenda seem to suffer from many of the problems associ-
20

ated with contingent valuation surveys. Experts on referenda also that question wording can be extremely
important in referenda, just as in contingent valuation surveys (LeDuc (2003)). Referenda may be slightly
more incentive compatible than contingent valuation surveys, but this difference is vanishingly small in a
probabilistic sense, because the odds of being the pivotal voter in a referendum are extremely close to 0.24
The Problems of Contingent Valuation – and Two Proposed Solutions
An Illustrative Example
The potential upside of using contingent valuations in the case of urban policymaking is illustrated by the
case of Lexington, Kentucky, which debated subsidizing a new hundred-million dollar stadium for the Uni-
versity of Kentucky Bobcats, a wildly successful college basketball team (Johnson and Whitehead (2000)).
Sports teams surely generate plenty of non-use value, so it may make sense to consider subsidies to sporting
teams—but in this case, the stadium was not necessary to keep the team in the town, and it was not obvious
that the stadium would help the team win. Johnson and Whitehead (2000) used contingent valuation meth-
ods and found that local citizens valued the new stadium at less than $5 per year—seemingly quite relevant,
given that decisionmakers were considering a vast subsidy.
The Kentucky example seems largely free of the problems of non-instrumentality and non-familiarity that
bedevil many environmental contingent valuation surveys:
• Respondents were familiar with the Kentucky basketball team and were largely familiar with fancy
stadiums. Americans watch a lot of sports, and even those who do not patronize sky boxes themselves
have surely seen them on television. Respondents were able to draw two surely correct conclusions
about the situation: A more expensive arena would not actually improve the play of their beloved
basketball team. Moreover, since the Bobcats were a college team, not a professional team, there was
no chance that the team would change its location if it did not get the stadium. As a result, even the
most ardent Bobcats fan knew that the proposed hundred-million dollar investment would not impact
the likelihood of a having the Bobcats in town.
• Meanwhile, there were many local respondents whose identities were somewhat linked to being Bob-
cats fans. Yet rooting for the Bobcats was not associated with supporting more luxurious seats for
wealthy Bobcats patrons. Consequently, one could be a perfectly loyal Bobcat fan without being will-
ing to support the new arena; so, there was no non-instrumental value in stating a large willingness-
to-pay.
In the sequel, we discuss the generality of the non-instrumentality and non-familiarity problems, and illus-
trate several potential ways of addressing both problems in urban contexts.24Caplan (2011) reminds us of the many examples in which voters are misinformed and appear downright irrational—which may
be unsurprising given the unfamiliarity of most political issues and the limited incentives that voters have to gather information.
21

Issue 1 – Non-Consequential Motives in Survey Response
Carson and Groves (2007) take the view that economists have little to say about non-consequential motives
in survey response because such responses are far away from conventional economics. We respectfully
disagree and certainly, there is plenty of scope for economists to test hypotheses about non-consequential
preferences.
For simplicity, consider a 1-0 survey question about taking some environmental action that comes with a
cost, such as paying $1,000 per person to protect a species of owl. Assume that the net benefit to the survey
respondent of the action is bi, and the probability that the survey (or vote) will be pivoted is πi. As long as
πi > 0, and there are no other preferences bearing on the response, then the individual will give the true
answer.
Yet assume that the individual has some non-consequential benefit vi from saying “yes” to the question, and
that vi is independent of πi. The response will be yes if and only if vi+πibi > 0; in that case, as πi becomes
small, survey responses will entirely reflect vi rather than bi. If, as Carson and Groves (2007) suggest, we
have nothing to say about vi, then we can indeed do no better than take the survey as a measure of bi—but
we do know things about non-consequential motives, self-deception and the economics of identity.
If all environmentalists receive a positive payoff from giving a pro-environment answer, then if πi is small,
people who identify as environmentalists will say “yes” to any pro-environment question, regardless of cost.
According to this view, the number of birds saved in Desvousges et al. (1993) do not impact the survey
responses because the survey respondents are primarily answering for non-instrumental reasons, to show
their fidelity to their environmentalist identities. Any non-instrumental force can lead to responses that
are independent of benefit magnitude; this provides a natural explanation of the embeddedness results of
Kahneman and Knetsch (1992).
Issue 2 – Non-Familiarity with the Survey Topic
In the framework of the preceding section, non-familiarity might just mean that respondents assess bi with
abundant error. In principle, non-familiarity could just lead to noisy results. But non-familiarity could also
lead to worse forms of bias. For example, if respondents recognize the limits of their knowledge about
benefits, this could lead them to place even more weight on non-instrumental motives when answering. Or
respondents may rely heavily upon cues embedded in the survey itself.25 In this light, the extreme sensitivity
of survey results to framing is not evidence of irrationality, but rather a natural response to ignorance about
the topic. Respondents are sensitive to framing because their basic knowledge is limited.25A question’s wording presumably gives some sense of that question’s importance, as does the attitude of the surveyor.
22

Potential Solutions
Surveys should be able to reduce the non-instrumental forces in responses by offering alternatives that occur
within the same domain, and thus are hopefully comparable on non-instrumental grounds. Meanwhile, non-
familiarity can be minimized by posing options that are relatively easy to understand. Sometimes, however,
the two objectives are in conflict.
For example, consider an attempt to use contingent valuation to assess willingness-to-pay to clean up
petroleum around a coastline. An identity-comparable alternative might be “spending money to expand
research on renewable energy”; the survey can work towards environmental neutrality by highlighting the
environmental benefits of both courses of action.26 Yet both options suffer from non-familiarity. Perhaps
with enough pictures and discussion, the “clean coastline” can be turned into something comprehensible.
But it is hard to see how ordinary Americans will ever have much of a sense of what two billion dollars
in renewable energy research will accomplish—especially since experts would have trouble agreeing about
such an investment. Thus, it seems reasonable to consider alternatives that run more risk of non-instrumental
responses but that have the virtue of greater familiarity and comprehensibility. For example, spending on
cleaning up the coastline could be compared with expanding early education for the poor.27
Non-familiarity may be less of an issue in cities since most urban investment questions are readily compre-
hensible to ordinary people. But contingent valuation for some urban amenities may suffer from the same
identity or other non-instrumental issues as environmental surveys.28 Moreover, there are other identities
that can also matter within an urban setting. There is a preservationist movement that supports the protection
of older buildings, and there are urbanist identities that would be associated with more walking and public
transportation and less driving; questions that trigger these particular identities seem likely to yield biased
results.
As in the case of broader non-use surveys, contingent valuation methods for urban amenities should attempt
to minimize the role that non-instrumental forces will play in driving answers, by matching the alterna-
tives along identity dimensions. Moreover, they should also work to ensure as much familiarity as possible.
We now consider three detailed urban examples and discuss an approach to contingent valuation that in-
corporates concerns about non-instrumental responses: Northerly Island in Chicago, the proposed Bedford
Historic District in New York City, and proposals to build up along the Rose Kennedy Greenway in Boston.26The NOAA Report (Arrow et al. (1993)) recommended that survey respondents be reminded of alternative uses of funds,
including environmental uses, and warned of a warm glow phenomenon, when respondents feel good about giving a particularanswer. Yet reminding someone that money saved can be spent on something else—which might be environmental in nature—isnot at all equivalent to giving a true environmental alternative. The environmentalist identity would surely still push towards theenvironmental answer in the former case, but not in the latter.
27While this approach might not be as biased as weighing environmental benefits against taxes, it does introduce a second identityissue—it could well end up measuring the power of the environmentalist identity against a more general pro-poor progressiveidentity.
28Indeed, support for an urban park can be seen as being just as much of an environmentalist action as cleaning up a coastline.
23
Northerly Island
Northerly Island is a current project in Chicago to repurpose the former Meigs Field airport into a park with
natural habitats. Northerly Island is man-made, so it is not a return to nature. Still, the project can be seen
as environmentalism both because it brings green space into the city and because it will offer a protected
habitat for some wild creatures.To our knowledge, neither the decision to eliminate Meigs Field nor the
decision to repurpose the space for a park have been subjected to cost-benefits analysis.29
We consider solely the question of valuing the Northerly Island park—not the decision to eliminate the
airfield. The natural alternative to the park would be leasing the land to a private developer who would
develop the space in some means concordant with city ordinances and regulations.
A first approach to valuing Northerly Island would be to conduct a contingent valuation survey in which
Northerly Island is compared to a variety of cash outcomes. Not having the park would mean lower taxes.
But since a considerable fraction of the park’s costs is to be paid by the Federal government, the actual
tax implications are likely to be quite modest; this comparison would almost surely lead to a strong non-
consequentialist bias in favor of the park. Evaluating spending reductions—especially when complex tax
policies and Federal budgets are involved—can also have non-familiarity problems.
A more nuanced approach is to conduct a survey comparing Northerly Island to the alternative of a private
lease, with different revenue levels to be paid to the government and allocated to an alternative worthy
cause, such as a trust for increasing pre-school availability for disadvantaged children in Chicago.30 This
approach will provide us with two competing warm glow effects: respondents’ environmentalist identities
will compete against their progressive identities. While the two options may both have familiarity, they
will also test the relative size and power of different identity groups within Chicago, which may make
interpretation more difficult.
A third approach is to give the alternative of a private lease, with different revenue levels to be paid to a trust
that will also benefit the local environment. In this case, a trust for investing in Chicago’s park system (and
particularly, animal life) seems natural. One option might be to increase spending on the publicly funded
Lincoln Park Zoo. In this case, likes are truly being compared with likes, and environmentalist identity
should not shape the results. The large challenge is to make the Zoo alternative comprehensible and familiar
to respondents. Some work would need to be put in to ensure that the alternative park spending delivers
outcomes that make sense. The Zoo offers the option of giving a clear number of animals that could be
brought to the city. It may however offer a slightly different non-instrumental payoff.
While the identity logic we have discussed suggests that the third option is least problematic on its own,29See http://friendsofmeigs.org/resources/2012-07-06_Friends_of_Meigs_Field_Comments_
for_USACE_plan_for_CGX.pdf.30Chicago currently has tuition-based pre-school, so that the program could essentially eliminate the pre-school tuition for a fixed
number of students—and that should be readily comprehensible by most survey respondents.
24

perhaps the best approach is to use all three surveys and compare the responses. The degree of variation in
responses indicates the extent to which identity is important for the question at issue. If identity does turn
out to be strongly relevant, the third approach might be taken as providing the best single answer—but the
heterogeneity in responses provides us with a sense of how much we can trust the answers.
Shadows on the Rose Kennedy Greenway
For almost fifty years, Boston had an elevated central artery that carried cars and trucks through the city.
A massive eighteen-billion dollar infrastructure project, the “Big Dig,” essentially sunk the highway and
turned what had once been under the elevated highway into an urban park: the Rose Kennedy Greenway.
That space has now become prime urban land, which is cherished both by pedestrians and by developers.
The conflict between foot traffic and skyward construction has become a public policy battle, where public
officials, especially the late Mayor Menino, have repeatedly opposed projects that would cast a shadow on
the Greenway. Are strict height limitations justified in this prime downtown location? The benefits of tall
buildings are relatively straightforward.31 There are costs that could presumably be quantified from added
congestion and extra burdens on public services. Yet the cost that has received the most attention in this case
is the lost amenity of light on the Greenway.
Loss of light has been a critical justification for zoning codes since the huge mass of the Equitable Building
helped justify New York City’s 1916 Zoning Ordinance. Yet there has been almost no work quantifying the
welfare losses from lost light. When it comes to building residents, hedonics can help quantify the value
destroyed from lost views. Space within buildings is sufficiently homogenous so that the prices at the top
and bottom of buildings provides a reasonable estimate of the market value of clear sight lines (Glaeser et al.
(2005a)).
Yet Mayor Menino was clearly worried about the costs that shadows impose on pedestrians, and we have
close to no evidence on the values that pedestrians place on light amenities.
One contingent valuation approach in this setting would be to ask Bostonians to show Bostonians two images
of the Greenway—one with the status quo and a second with a space of new buildings—and to ask them
which they prefer, and how much they would be willing to pay per year to have their preferred streetscapes.
This approach is likely to suffer from both non-instrumental answers and non-familiarity. Among those
people who oppose development, images with shorter buildings would conform with identities as preservers
of the status quo. Non-familiarity may be less extreme than in the case coastline cleanup—but still, few
people have ever literally had the power to determine a streetscape. A decision involving trading height for
cash is not one that respondents will have made in the past.31The most obvious benefit is just the difference between the price of added space and the cost of building upwards. There could
be ancillary benefits from agglomeration benefits and increased property tax revenues.
25

A second alternative is to focus on the act of walking along the street. Respondents can be asked whether
they would rather walk along one streetscape or another. Then instead of asking whether they would pay for
their preferred streetscape with cash, they can be asked whether they would be willing to walk some extra
distance (one block, two blocks) so that they can amble along their preferred streetscape. This phrasing
would not entirely eliminate non-instrumental voting. Supporters of a “shorter city” would presumably
still understand the significance of the question and they may well want to assert their affection for the
shorter building by giving a particularly high willingness to pay. However, the phrasing would still move
the question completely into the realm of the familiar. Every urban resident has thought about their preferred
routes and has occasionally weighed a shorter route against a more pleasant one. The one remaining step
would be to turn the time willingness-to-pay into a cash willingness-to-pay.
A third alternative would be to quantify willingness-to-pay in terms of comparable urban amenities, such
as open spaces and parks. The city could, in principle, use the value generated by building up around the
Greenway to either upgrade or build new public spaces within the city. The respondents could be asked
about their willingness to trade taller buildings off against new small urban parks. These parks could be
made familiar by showing pictures of existing parking lots which could presumably be bought and turned
into parks. Images of the potential park could then be offered. The respondent would then be trading likes
against likes and there would be less of a non-instrumental reason to show high values for restricting building
height along the Greenway.
The Bedford Historic District
The New York City Landmarks Commission is currently considering creating a historic district in Bedford,
which is part of the Bedford-Stuyvesant neighborhood in Brooklyn. If the area’s eight hundred buildings
become part of a historic district, then the Landmarks Preservation Commission must approve any changes
to the exteriors of buildings. While New York, like many other cities, has aggressively landmarked buildings
for fifty years, neither the costs nor the benefits of this policy are particularly clear.
The primary costs are borne by property owners who lose freedom to change their structures. There are
presumably also benefits that accrue to property owners, if having historic neighbors yields positive exter-
nalities. There may also be general equilibrium price effects coming from the reduction in housing supply
in the city, which hurt prospective residents. These consequences are difficult to assess, but economics can
in principle estimate these benefits.
Standard economic analysis, however, has few or no tools for assessing the benefits enjoyed by ordinary
pedestrians who walk through historical districts, or the benefits enjoyed by urbanites who just like having
historic districts exist. Again, this would seem to be an area in which contingent valuation offers the only
means of estimating willingness to pay. Moreover, since preservation decisions are frequent, it would be
26

impossible to consider having regular city-wide referenda on each and every historic district.
The broad model we propose is similar to those discussed above. Again, we would suggest an array of survey
instruments. The first just asks about willingness to pay for the preservation of the area using the best avail-
able contingent valuation techniques. Again, we believe that this approach provides a useful benchmark,
but faces both non-familiarity and non-instrumental survey response issues. The instrument we suggest is to
use a time metric to assess pedestrian values. The streets of the Bedford Historic District can be compared
with streets that have mixtures of old and new buildings.32 Respondents can be asked about willingness to
walk to get their preferred streetscape at different times of the day or week; this time the comparison is fa-
miliar, although it does risk non-instrumental answers. The third instrument we suggest would compare the
Bedford Historic District renovation with other investments in the city’s physical past.33 Respondents could
be asked about their tradeoffs between creating the Historic District in Bedford and specific investments in
the city’s past that come at different price tags. The alternative investment’s costs would not be quantified,
but they could be illustrated with artist’s renderings and descriptions. This comparison would perhaps be
unfamiliar, but it would be unlikely to suffer from non-instrumental responses. Finally, the Beford Historic
district can be compared against scholarships for poor and middle-income New Yorkers.34
5 Quantification and City Policy
Beyond its value for urban science, improvements in the quantification of cities can dramatically change the
way that cities operate and evaluate policies.
New big data sources with bearing on city policy are becoming abundant: governments are digitizing and
sharing records, and private firms are collecting high-frequency measurements of local businesses, traffic,
and other urban features. Some urban policy questions rely on concrete understanding of a causal effect—
and while big data can inform these questions, the associated analyses are subject to all of the identification
caveats we discussed in Section 2. Other policies, however, can be informed directly through data, often in
combination with predictive algorithms.
In this section, we develop a taxonomy of the new types of urban data now available to researchers and
policymakers. We then discuss how the new data can impact policy.32Ideally, an area that was considered for a historic district but did not receive the designation and subsequent was altered would
provide alternative streetscapes.33New York has an abundance of abandoned and decaying landmarks, such as Staten Island’s Abraham Manee House
or the Old Bronx Borough Courthouse (http://ny.curbed.com/archives/2015/05/28/whats_next_for_new_york_citys_many_abandoned_landmarks.php).
34Once again, this metric is imperfect as it suffers from both non-familiarity and non-instrumental forces, but it seems like animportant alternative to try. At the least, it can show the power of different civic identities to shape contingent valuation responses.
27

A Taxonomy of Data Sources
Digital Exhaust
One valuable but underutilized source of data is digital exhaust, the trail of data left online through every-
one’s day-to-day use of the Internet. Across a variety of domains, digital exhaust can help to measure the
physical city. Review platforms such as Yelp and TripAdvisor provide direct measures of the quality of ser-
vices and establishments throughout cities worldwide. Social media platforms such as Twitter and Facebook
can inform us about the pulse of neighborhoods, or about the structure of social networks. LinkedIn can
shed new light on labor markets and search costs.35 Search queries from platforms such as Google and Bing
contain insight about the needs and preferences of a physical city. Zillow provides new insight into housing
markets, as does data from sharing platforms such as Airbnb.
Digital exhaust data can be applied to city management directly: Yelp reviews, for example, provide detailed,
high-frequency data on restaurants that can be used to assess hygiene (see the extended example discussed
below, as well as Kang et al. (2013) and Glaeser et al. (forthcoming)). Google searches can be used to
help predict flu outbreaks (see, e.g., Polgreen et al. (2008); Carneiro and Mylonakis (2009); Ginsberg et al.
(2009)).
Open Government Records
Thirty years ago, cities kept most of their records on paper. Now, a growing digitization movement seeks
to convert data that was historically on paper to electronic, machine-readable records. Digitized records are
often made available online. For example, criminal records have been publicly available for several decades
in many states, yet were very difficult for policymakers and researchers—much less the public—to access.
Over time, criminal records have slowly become digitized and readily available; this has made research
easier, but also has also influenced incentives for recidivism and criminal behavior more generally (Finlay
(2009); Luca (forthcoming)).
An “open data” movement seeks to increase transparency by making cities’ internal data publicly available.
Many large cities (e.g., Boston, Chicago, and San Francisco) have created open, freely accessible “data
portals” that researchers and citizens can use to access digitized records; many of these data portals are
updated in real-time. The availability of open data encourages entrepreneurs to look for ways in which city
data can be used to enhance welfare, and creates possibilities for new partnerships between city officials and
researchers.35For an overview of these and other user-generated content platforms, see Luca (2015).
28

Corporate Data
Private data from companies represents a third, less developed, approach to measuring the physical city. In
addition to the digital data mentioned above, one can imagine using gym memberships to understand health
behavior, College Board data to gain additional insight into student performance, and credit card transactions
to quantify changes in spending over time.
How can new data empower the city?
At a basic level, cities specialize in three activities that are deeply reliant on—or can be greatly improved
through—data and analysis.
1. Cities evaluate and enact policies and regulations.
2. Cities operate public services.
3. Cities forecast future activity for the sake of planning and policymaking.
Here, we briefly sketch how big data will influence each of these activities.
Policy Evaluation
At a basic level, policy evaluations help to understand the intended and unintended consequences of policies.
Yet, most empirical analyses look at very narrow outcomes. We might examine , for example, at the impact
of hotel tax rates on the prices of hotels. We would prefer to measure the broader impact of taxes, but
historically, other factors such as the impact of taxes on “quality” would be very difficult to measure. Now,
we can in principle combine tax changes with TripAdvisor ratings, Priceline prices, and Airbnb listings to
obtain a much broader view of the intended and unintended consequences of tax policy on the physical city.
In addition to broadening the outcomes under consideration, new data can lead to higher-frequency estimates
of changes. Suppose, for example that we want to evaluate the impact of unemployment benefits on job
searches. Traditional analyses might look at length of unemployment and average income after one year.
But LinkedIn and similar sites could in principle give us measures of day-by-day job search behavior.
Operating Public Services
While research has traditionally focused on policy evaluations, there is a growing acknowledgment of the
practical importance of prediction problems. Cities, for example, are responsible for allocating scarce re-
sources. Cities choose which domestic violence cases to follow up on, and which labor market complaints
to investigate; in both of these settings underlying choice problem here is not a program or evaluation, but
29

rather a prediction problem. The city must predict which domestic violence offenders are likely to reoffend,
and which labor market complaint is most likely to unearth a serious issue. Using data to improve these pre-
dictions about the physical city creates value—and new data sources are central to this task (see Kleinberg
et al. (2015)).
Forecasting
Urban planners and policymakers forecast future economic activity through time-series analyses on leading
indicators of activity. New data sources—especially coupled with machine learning—have the potential
to revolutionize forecasting. Zillow, TripAdvisor, and LinkedIn, for example, respectively provide mea-
surements that can be used in estimating future housing prices, tourism, and unemployment. Data from
app-based payment systems can provide insight into upcoming retail spending and consumption patterns.
Closing Example: Data-Driven Hygiene Inspections
We close this section with an applied example showing how data and predictive tools can directly inform
city resource allocation.
In nearly every developed country, health inspectors examine restaurants to identify unsafe restaurant prac-
tices (such as storing food at unsafe temperatures), which can lead to foodborne illness. These inspectors are
typically allocated according to the perceived health risk posed by a restaurant or cuisine. A sushi restaurant
may be inspected more often than a burger joint because sushi is more likely to lead to food sickness. Other
than that, health inspector allocation is effectively random.
But inspections do not have to be random. Suppose instead that you were to base the likelihood of inspection
on evidence from Yelp reviews. Perhaps you would start with a search on Yelp for terms like “sick” or
“dirty”; you would probably find a few culprits. But a predictive algorithm trained through machine learning
can do much more than that. The algorithm would “learn” from the history of reviews and history of
inspection outcomes, and then predict the likelihood of finding violations based on more recent reviews.
Inspectors could then be reallocated to restaurants that are most likely to have violations.
Kang et al. (2013) and Glaeser et al. (forthcoming) explored the feasibility of doing exactly that, using
natural language processing to predict hygiene violations using reviews on Yelp. To see how powerful
even a simple adjustment can be, consider Figure 3, which shows the correlation between Yelp ratings and
hygiene scores. Even before applying machine-learning techniques, it is clear that Yelp scores can help to
identify hygiene scores. In a competition run with the city of Boston to develop a predictive algorithm for
Boston, Glaeser et al (forthcoming) demonstrated that using Yelp reviews to guide inspections would allow
30

Figure 3: Correlation between Yelp Ratings and Hygiene Inspection ScoresReview data consists of reviews on Yelp.com for restaurants in San Francisco, CA from September, 2010 throughSeptember, 2013. Hygiene scores consist are from the San Francisco Department of Public Health, for the sametimeframe.
31

reducing inspections by 40% without reducing the number of health risks identified.36
6 Conclusion
This paper has reviewed ways in which big data and new measurement can improve urban research and
policymaking.
There are research areas in which measurement is itself the barrier, and those areas are readily improved
through big data aggregation and analysis. For example, in Section 3, we discussed the use of Google
Street View to measure income. We showed that images do well at predicting income in New York City. If
images are also effective for predicting income in the developing world (based, for example, on small-scale
surveys), then they can enable us to map out the income and to measure whether exogenous shocks shape
income, at least as reflected in the streetscape.
Urban social scientists should also continue pushing for more targeted data gathering. Section 4 discussed
contingent valuation surveys, which, while typically used in environmental contexts, have value for urban
policy-making as well. The key here is to use insights from psychology to lead respondents to report
valuations that make sense. For example, pure money-metric questions, such as “How much is central park
worth for you?” seem likely to produce near-valueless answers. A better approach is to make comparisons
within-domain, for example, comparing investments in parks to investments in road quality. Also, surveyors
should strive to ask questions that deal with tradeoffs people routinely make in their daily lives (e.g., “Are
you willing to walk a block or two to travel down a street with shorter buildings?”).
Big data is particularly valuable when it can improve policymaking directly. Section 5 discussed the ways
in which Yelp (and other crowdsourced rating tools) can augment city services such as inspections. More
generally, big data offers the ability to use the broader civil society to augment the functions of government,
essentially by lowering the costs of contributing to government services. Electronic “apps” and similar
provide tools that citizens can use to give feedback to governments quickly and inexpensively.
In general, big data can meaningfully help big cities and improve research on cities—but only if it is used
with thoughtful care. Big data will do far more for urban research if it is paired with exogenous sources of
variation. Big data will do far more for policymaking and implementation if it is paired with openness to
new methods. As in most areas, new technology works best if it is accompanied by human capital.36Urban economists can also use prediction algorithms to improve their analyses. For example, Jin and Leslie (2003) look at the
impact of mandatory disclosure of hygiene grades on restaurant cleanliness; they show that independent and chain restaurants havesystematically different hygiene grades. Because each restaurant is inspected only a few times per year, any analysis of the Jin andLeslie (2003) type needs to wait for new inspections to be performed. One could instead run the Jin and Leslie (2003) analysisusing the predicted hygiene as a dependent variable, as determined by Yelp reviews.
32

References
Akerlof, G. A. and R. E. Kranton (2000). Economics and identity. Quarterly Journal of Economics 115(3),
715–753.
Arrow, K., R. Solow, P. R. Portney, E. E. Leamer, R. Radner, and H. Schuman (1993). Report of the NOAA
panel on contingent valuation.
Arzaghi, M. and J. V. Henderson (2008). Networking off Madison Avenue. Review of Economic Stud-
ies 75(4), 1011–1038.
Autor, D. H., C. J. Palmer, and P. A. Pathak (2014). Housing market spillovers: Evidence from the end of
rent control in Cambridge, Massachusetts. Journal of Political Economy 122(3), 661–717.
Baum-Snow, N. (2007). Did highways cause suburbanization? Quarterly Journal of Economics 122(2),
775–805.
Berry, C. R. and E. L. Glaeser (2005). The divergence of human capital levels across cities. Papers in
Regional Science 84(3), 407–444.
Black, S. E. (1999). Do better schools matter? Parental valuation of elementary education. Quarterly
Journal of Economics 114(2), 577–599.
Braga, A. A. and B. J. Bond (2008). Policing crime and disorder hot spots: A randomized controlled trial.
Criminology 46(3), 577–607.
Busso, M. and P. Kline (2008). Do local economic development programs work? Evidence from the Federal
Empowerment Zone Program. Cowles Foundation Discussion Paper No. 1638.
Caplan, B. (2011). The Myth of the Rational Voter: Why Democracies Choose Bad Policies. Princeton
University Press.
Carneiro, H. A. and E. Mylonakis (2009). Google trends: A web-based tool for real-time surveillance of
disease outbreaks. Clinical infectious diseases 49(10), 1557–1564.
Carson, R. T. and T. Groves (2007). Incentive and informational properties of preference questions. Envi-
ronmental and Resource Economics 37(1), 181–210.
Chang, C.-C. and C.-J. Lin (2002). Training v-support vector regression: Theory and algorithms. Neural
Computation 14(8), 1959–1977.
Chetty, R., N. Hendren, and L. F. Katz (2015). The effects of exposure to better neighborhoods on children:
New evidence from the Moving to Opportunity experiment. NBER Working Paper No. 21156.
Ciccone, A. and R. E. Hall (1996). Productivity and the density of economic activity. American Economic
Review 86(1), 54–70.
33

Ciriacy-Wantrup, S. V. (1963). Resource Conservation: Economics and Policies. Univ of California Press.
Combes, P.-P., G. Duranton, and L. Gobillon (2008). Spatial wage disparities: Sorting matters! Journal of
Urban Economics 63(2), 723–742.
Combes, P.-P., G. Duranton, L. Gobillon, and S. Roux (2010). Estimating agglomeration effects with history,
geology, and worker effects. In E. L. Glaeser (Ed.), Agglomeration Economics, pp. 15–65. University of
Chicago Press.
Currie, J. and R. Walker (2011). Traffic congestion and infant health: Evidence from E-ZPass. American
Economic Journal: Applied Economics 3(1), 65–90.
Davis, R. K. (1963). Recreation planning as an economic problem. Natural Resources Journal 3(3), 239–
249.
Desvousges, W. H., F. R. Johnson, R. W. Dunford, K. J. Boyle, S. P. Hudson, and K. N. Wilson (1993).
Measuring natural resource damages with contingent valuation: Tests of validity and reliability. In J. A.
Hausman (Ed.), Contingent Valuation: A Critical Assessment, Contributions to Economic Analysis, pp.
91–164. North Holland Press.
Diamond, P. A. and J. A. Hausman (1994). Contingent valuation: Is some number better than no number?
The Journal of Economic Perspectives 8(4), 45–64.
Dwork, C. and A. Roth (2013). The algorithmic foundations of differential privacy. Theoretical Computer
Science 9(3-4), 211–407.
Epple, D. (1987). Hedonic prices and implicit markets: Estimating demand and supply functions for differ-
entiated products. Journal of Political Economy 95(1), 59–80.
Finlay, K. (2009). Effect of employer access to criminal history data on the labor market outcomes of ex-
offenders and non-offenders. In D. H. Autor (Ed.), Studies of Labor Market Intermediation, pp. 89–125.
University of Chicago Press.
Ginsberg, J., M. H. Mohebbi, R. S. Patel, L. Brammer, M. S. Smolinski, and L. Brilliant (2009). Detecting
influenza epidemics using search engine query data. Nature 457(7232), 1012–1014.
Glaeser, E. and D. Mare (2001). Cities and skills. Journal of Labor Economics 19(2), 316–342.
Glaeser, E. L. and J. D. Gottlieb (2008). The economics of place-making policies. Brookings Papers on
Economic Activity 39(1), 155–239.
Glaeser, E. L., J. Gyourko, and R. E. Saks (2005a). Why have housing prices gone up? American Economic
Review 95(2), 329–333.
34

Glaeser, E. L., J. Gyourko, and R. E. Saks (2005b). Why is Manhattan so expensive? Regulation and the
rise in housing prices. Journal of Law and Economics 48(2), 331–369.
Glaeser, E. L., E. A. Hanushek, and J. M. Quigley (2004). Opportunities, race, and urban location: The
influence of John Kain. Journal of Urban Economics 56(1), 70–79.
Glaeser, E. L., A. Hillis, S. D. Kominers, and M. Luca (forthcoming). Crowdsourcing city government:
Using tournaments to improve inspection accuracy. American Economic Review Papers & Proceedings.
Gramlich, E. M. (1994). Infrastructure investment: A review essay. Journal of Economic Literature 32,
1176–1196.
Greenstone, M., R. Hornbeck, and E. Moretti (2010). Identifying agglomeration spillovers: Evidence from
winners and losers of large plant openings. Journal of Political Economy 118(3), 536–598.
Gregoir, S., M. Hutin, T.-P. Maury, and G. Prandi (2012). Measuring local individual housing returns from
a large transaction database. Annals of Economics and Statistics (107/108), 93–131.
Hausman, J. A. (2012). Contingent valuation: From dubious to hopeless. Journal of Economic Perspec-
tives 26(4), 43–56.
Hoiem, D., A. A. Efros, and M. Hebert (2008). Putting objects in perspective. International Journal of
Computer Vision 80(1), 3–15.
Holmes, T. J. (1998). The effect of state policies on the location of manufacturing: Evidence from state
borders. Journal of Political Economy 106(4), 667–705.
Jin, G. Z. and P. Leslie (2003). The effect of information on product quality: Evidence from restaurant
hygiene grade cards. Quarterly Journal of Economics 118(2), 409–451.
Johnson, B. K. and J. C. Whitehead (2000). Value of public goods from sports stadiums: The CVM ap-
proach. Contemporary Economic Policy 18(1), 48–58.
Kahneman, D. and J. L. Knetsch (1992). Valuing public goods: The purchase of moral satisfaction. Journal
of Environmental Economics and Management 22(1), 57–70.
Kang, J. S., P. Kuznetsova, M. Luca, and Y. Choi (2013). Where not to eat? Improving public policy
by predicting hygiene inspections using online reviews. In Proceedings of the Conference on Empirical
Methods in Natural Language Processing, pp. 1443–1448. Citeseer.
Katz, L. F., J. R. Kling, and J. B. Liebman (2001). Moving to Opportunity in Boston: Early results of a
randomized mobility experiment. Quarterly Journal of Economics 116, 607–651.
Kho, A. N., J. P. Cashy, K. L. Jackson, A. R. Pah, S. Goel, J. Boehnke, J. E. Humphries, S. D. Kominers,
B. N. Hota, S. A. Sims, B. A. Malin, D. D. French, T. L. Walunas, D. O. Meltzer, E. O. Kaleba, R. C.
35

Jones, and W. L. Galanter (forthcoming). Design and implementation of a privacy preserving electronic
health record linkage tool in Chicago. Journal of the American Medical Informatics Association.
Kleinberg, J., J. Ludwig, S. Mullainathan, and Z. Obermeyer (2015). Prediction policy problems. American
Economic Review 105(5), 491–495.
LeDuc, L. (2003). The Politics of Direct Democracy: Referendums in Global Perspective. Broadview Press.
Luca, M. (forthcoming). User-generated content and social media. In S. Anderson, J. Waldfogel, and
D. Stromberg (Eds.), Handbook of Media Economics. Elsevier.
Malik, J., S. Belongie, T. Leung, and J. Shi (2001). Contour and texture analysis for image segmentation.
International Journal of Computer Vision 43(1), 7–27.
Matsusaka, J. G. (2005). Direct democracy works. Journal of Economic Perspectives 19(2), 185–206.
Moretti, E. (2004). Human capital externalities in cities. In G. Duranton, J. V. Henderson, and W. C. Strange
(Eds.), Handbook of Regional and Urban Economics, Volume 4, pp. 2243–2291. Elsevier.
Naik, N., S. D. Kominers, R. Raskar, E. L. Glaeser, and C. A. Hidalgo (2015). Do people shape cities, or do
cities shape people? The co-evolution of physical, social, and economic change in five major US cities.
NBER Working Paper No. 21620.
Naik, N., J. Philipoom, R. Raskar, and C. A. Hidalgo (2014). Streetscore – predicting the perceived safety
of one million streetscapes. In IEEE Computer Vision and Pattern Recognition.
Newman, O. (1972). Defensible Space. Macmillan New York.
Oliva, A. and A. Torralba (2001). Modeling the shape of the scene: A holistic representation of the spatial
envelope. International Journal of Computer Vision 42(3), 145–175.
Persson, P.-O. and G. Strang (2004). A simple mesh generator in MATLAB. SIAM review 46(2), 329–345.
Pew Research Center (2014). Millenials in adulthood: Detached from institutions, networked
with friends. http://www.pewsocialtrends.org/files/2014/03/2014-03-07_
generations-report-version-for-web.pdf.
Polgreen, P. M., Y. Chen, D. M. Pennock, F. D. Nelson, and R. A. Weinstein (2008). Using internet searches
for influenza surveillance. Clinical Infectious Diseases 47(11), 1443–1448.
Rauch, J. E. (1993). Productivity gains from geographic concentration of human capital: Evidence from the
cities. Journal of Urban Economics 34(3), 380–400.
Roback, J. (1982). Wages, rents, and the quality of life. Journal of Political Economy 90(6), 1257–1278.
Rosen, S. (1979). Wage-based indexes of urban quality of life. In P. Miezkowski and M. R. Straszheim
(Eds.), Current Issues in Urban Economics, Volume 3. Johns Hopkins University Pres.
36

Salesses, P., K. Schechtner, and C. A. Hidalgo (2013). The collaborative image of the city: Mapping the
inequality of urban perception. PloS one 8(7), e68400.
Sampson, R. J., S. W. Raudenbush, and F. Earls (1997). Neighborhoods and violent crime: A multilevel
study of collective efficacy. Science 277(5328), 918–924.
Scholkopf, B., A. J. Smola, R. C. Williamson, and P. L. Bartlett (2000). New support vector algorithms.
Neural Computation 12(5), 1207–1245.
Schrag, P. (2004). Paradise Lost: California’s Experience, America’s Future. University of California Press.
Weiss, M. (2015). More citizens connect. Harvard Business School Case 315-075.
37