big data analytics module 2 – data visualizations with power view and power map saptak sen,...
TRANSCRIPT

Big Data AnalyticsModule 2 – Data Visualizations with Power View and Power Map
Saptak Sen, MicrosoftBill Ramos, Advaiya
• Excel Power View Add-in
• Power Map Excel Add-in
• Demos
Agenda
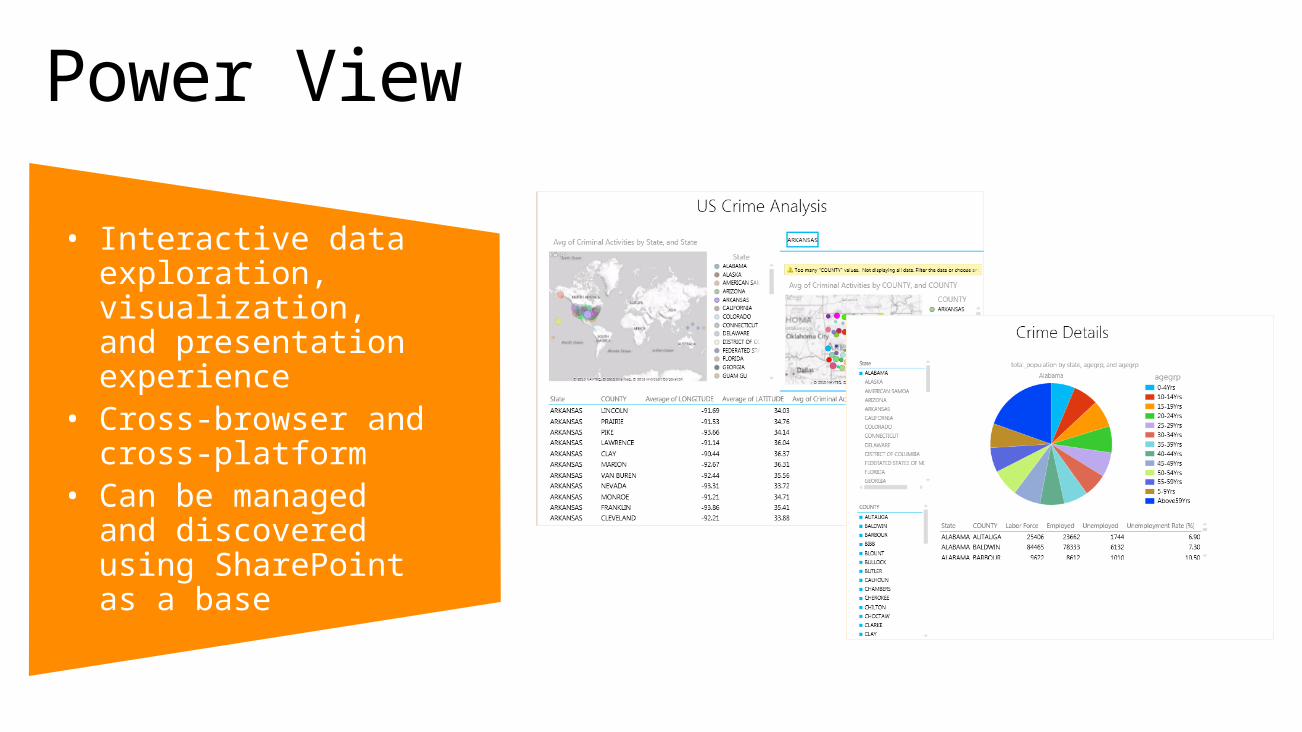
Power View
• Interactive data exploration, visualization, and presentation experience
• Cross-browser and cross-platform
• Can be managed and discovered using SharePoint as a base
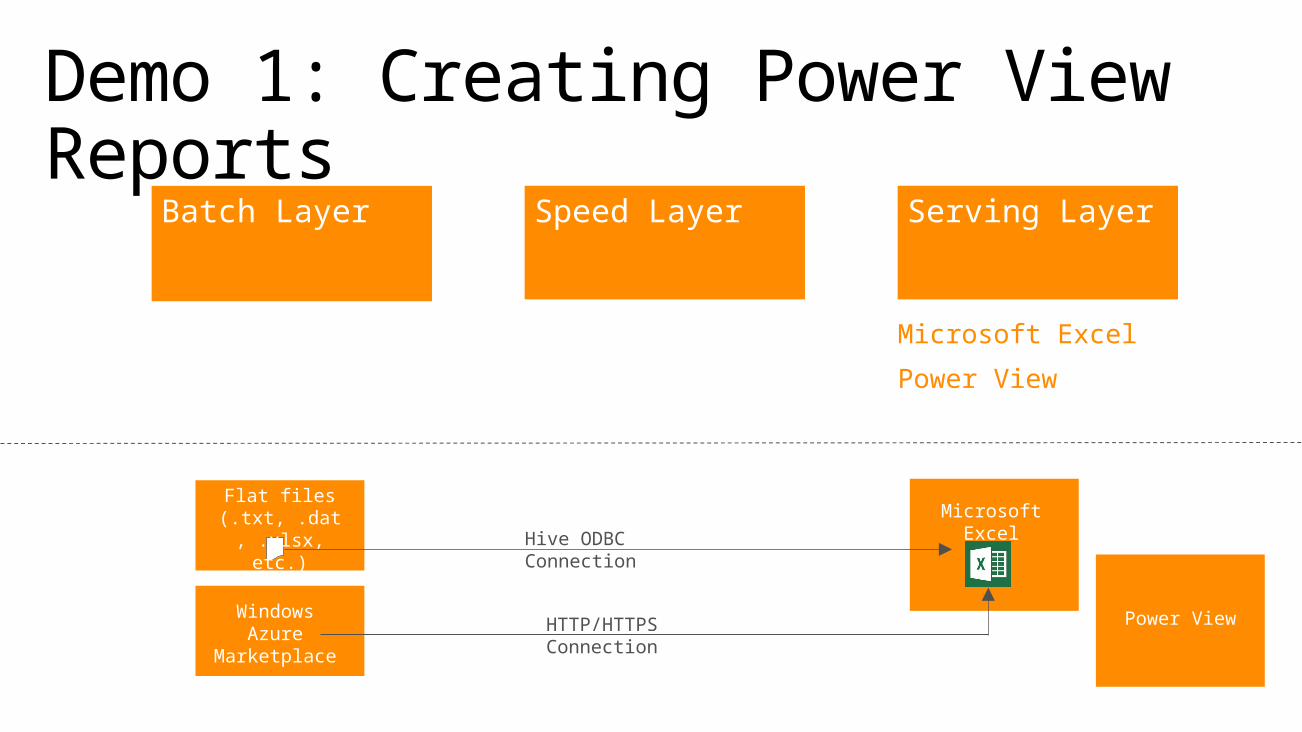
Demo 1: Creating Power View Reports
Serving LayerSpeed LayerBatch Layer
Microsoft Excel
Power View
Flat files (.txt, .dat, .xl
sx, etc.)
Windows Azure
Marketplace
Microsoft Excel
HTTP/HTTPS Connection
Hive ODBC Connection
Power View
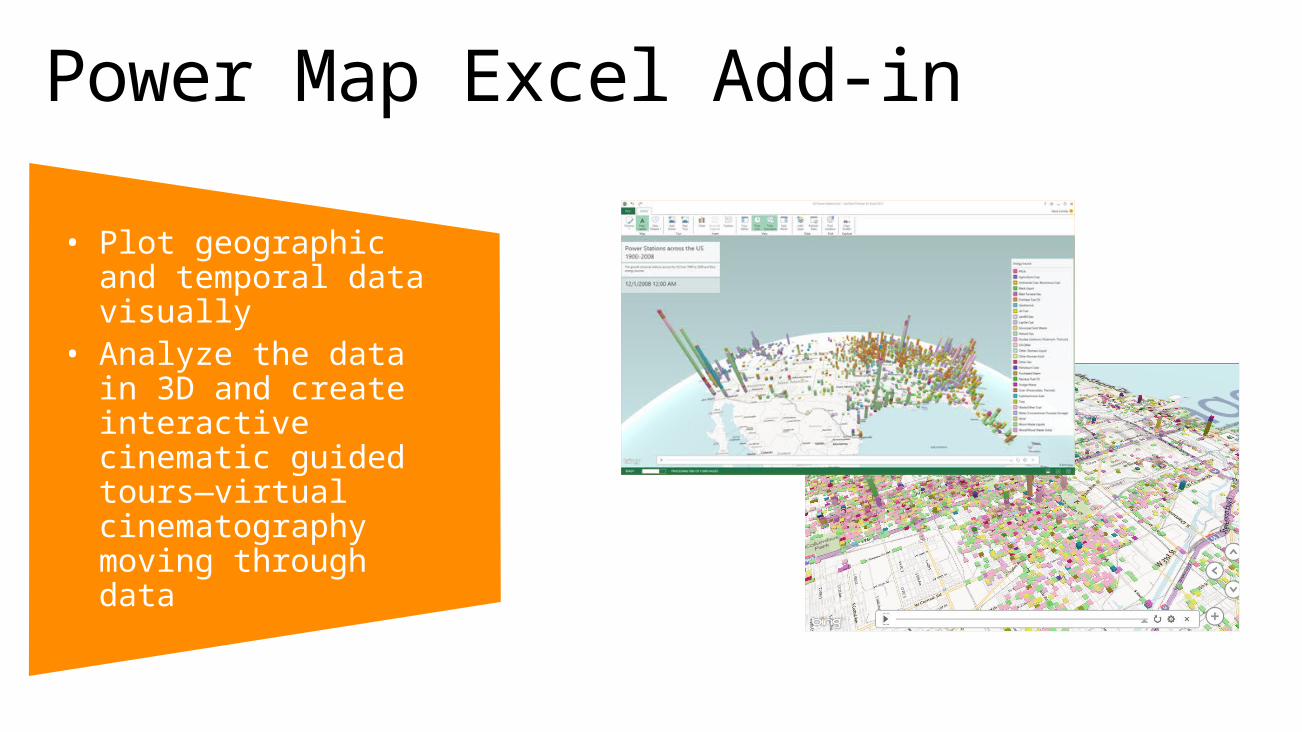
Power Map Excel Add-in
• Plot geographic and temporal data visually
• Analyze the data in 3D and create interactive cinematic guided tours—virtual cinematography moving through data
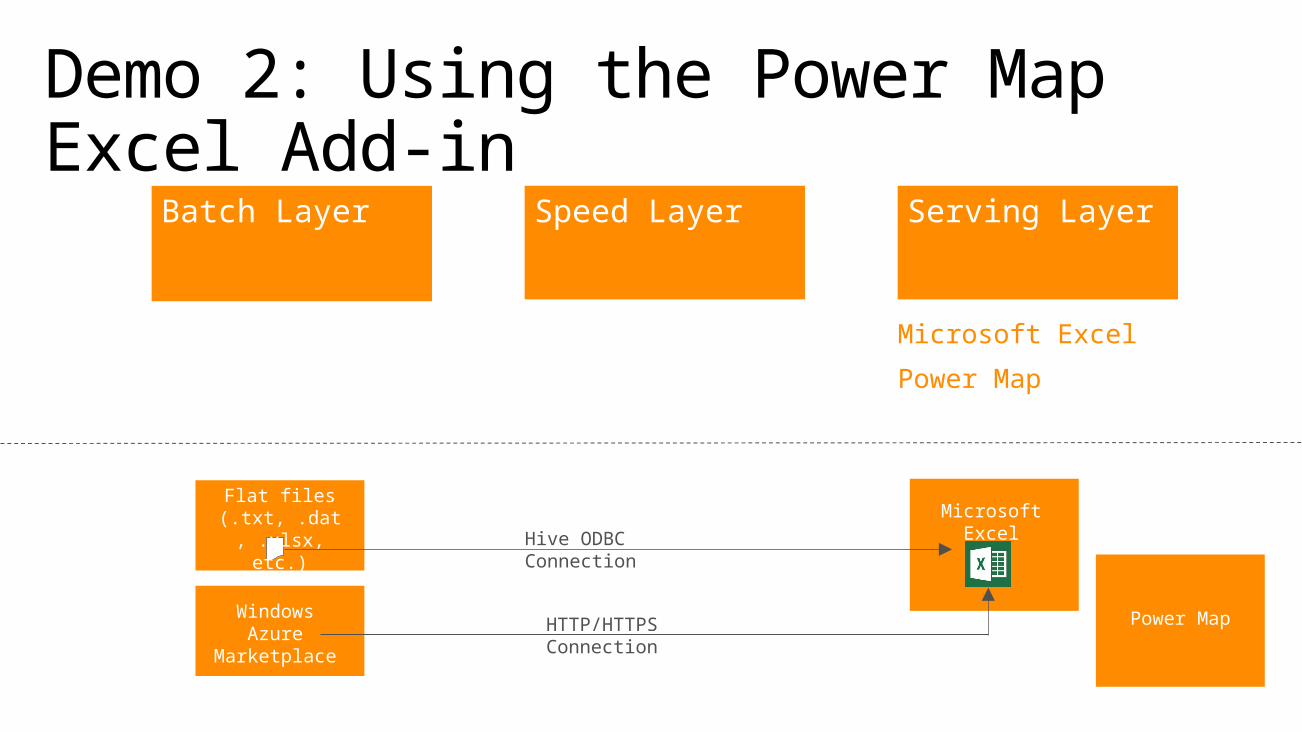
Demo 2: Using the Power Map Excel Add-in
Serving LayerSpeed LayerBatch Layer
Microsoft Excel
Power Map
Flat files (.txt, .dat, .xl
sx, etc.)
Windows Azure
Marketplace
Microsoft Excel
HTTP/HTTPS Connection
Hive ODBC Connection
Power Map
Learn more
• Experience Power View – New for SQL Server 2012http://www.microsoft.com/en-in/bi/Products/PowerView.aspx
• Power Queryhttp://blogs.msdn.com/b/dataexplorer/

Questions?