big data & analytics (conceptual and practical introduction)
TRANSCRIPT
1
IntroductionWhat is data?
DataI is a set of values of qualitative or quantitative variables.
I is any sequence of one or more symbols given meaning byspecific act(s) of interpretation. [In Computing].
Data � InformationI Data requires interpretation to become information.
Yaman Hajja | Big Data & Analytics
1
IntroductionWhat is data?
DataI is a set of values of qualitative or quantitative variables.I is any sequence of one or more symbols given meaning by
specific act(s) of interpretation. [In Computing].
Data � InformationI Data requires interpretation to become information.
Yaman Hajja | Big Data & Analytics

2
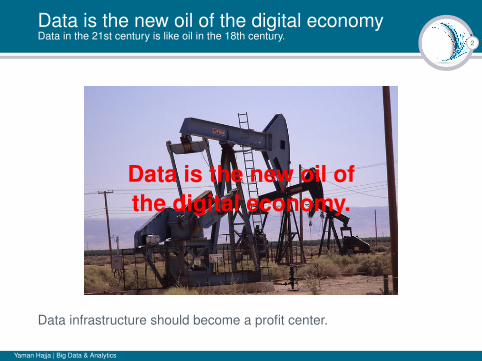
Data is the new oil of the digital economyData in the 21st century is like oil in the 18th century.
Data is the new oil ofthe digital economy.
Data infrastructure should become a profit center.
Yaman Hajja | Big Data & Analytics
2
Data is the new oil of the digital economyData in the 21st century is like oil in the 18th century.
Data is the new oil ofthe digital economy.
Data infrastructure should become a profit center.
Yaman Hajja | Big Data & Analytics
3
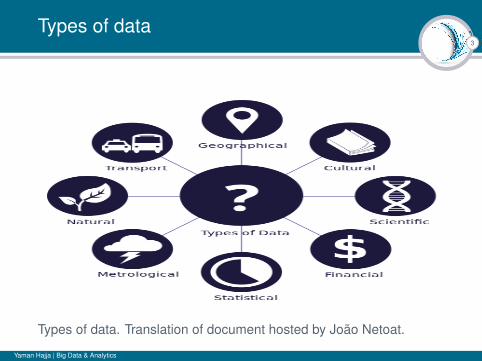
Types of data
Types of data. Translation of document hosted by João Netoat.
Yaman Hajja | Big Data & Analytics
4
Open Data
Open DataI is the idea that some data should be freely available to everyone
to use and republish as they wish, without restrictions fromcopyright, patents or other mechanisms of control.
I Example:Linked Datasets as of August 2014. Tungsten Tide.
Yaman Hajja | Big Data & Analytics

4
Open Data
Open DataI is the idea that some data should be freely available to everyone
to use and republish as they wish, without restrictions fromcopyright, patents or other mechanisms of control.
I Example:Linked Datasets as of August 2014. Tungsten Tide.
Yaman Hajja | Big Data & Analytics
5
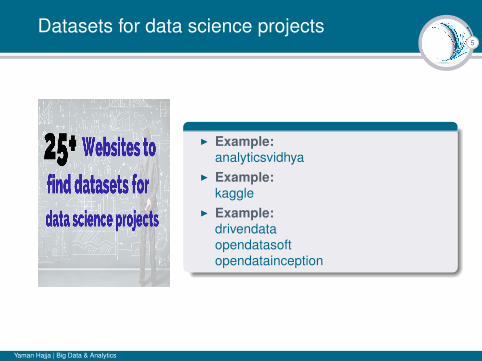
Datasets for data science projects
I Example:analyticsvidhya
I Example:kaggle
I Example:drivendataopendatasoftopendatainception
Yaman Hajja | Big Data & Analytics
6
What is data analysis?
I Data analysis: also known as data analytics, is a process ofinspecting, cleansing, transforming, and modeling data with thegoal of discovering useful information, suggesting conclusions,and supporting decision-making.Data analysis has multiple facets and approaches,encompassing diverse techniques under a variety of names, indifferent business, science, and social science domains.
Yaman Hajja | Big Data & Analytics

7
What is data analysis?Statistical data
Statistical data?I Statistical analysis:
is a component of data analytics. In the context of businessintelligence (BI), statistical analysis involves collecting andscrutinizing every data sample in a set of items from whichsamples can be drawn.
I A sample,in statistics, is a representative selection drawn from a totalpopulation.
Yaman Hajja | Big Data & Analytics

8
Data analysis process
Yaman Hajja | Big Data & Analytics

9
Data � Information � Intelligence
Yaman Hajja | Big Data & Analytics

10
Understanding Big Data
Yaman Hajja | Big Data & Analytics
11
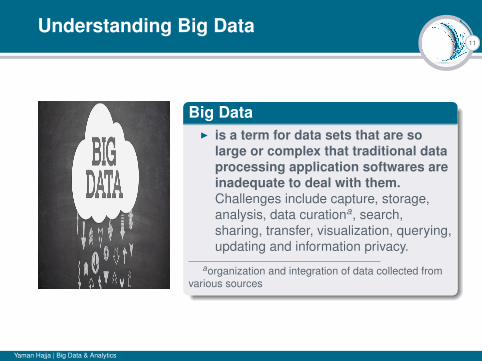
Understanding Big Data
Big DataI is a term for data sets that are so
large or complex that traditional dataprocessing application softwares areinadequate to deal with them.Challenges include capture, storage,analysis, data curationa, search,sharing, transfer, visualization, querying,updating and information privacy.
aorganization and integration of data collected fromvarious sources
Yaman Hajja | Big Data & Analytics
12
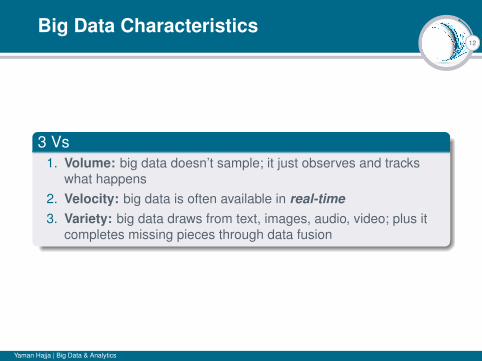
Big Data Characteristics
3 Vs1. Volume: big data doesn’t sample; it just observes and tracks
what happens2. Velocity: big data is often available in real-time3. Variety: big data draws from text, images, audio, video; plus it
completes missing pieces through data fusion
Yaman Hajja | Big Data & Analytics

13
Who can deal with Big Data?
Yaman Hajja | Big Data & Analytics

14
Who can deal with Big Data?
Yaman Hajja | Big Data & Analytics
15
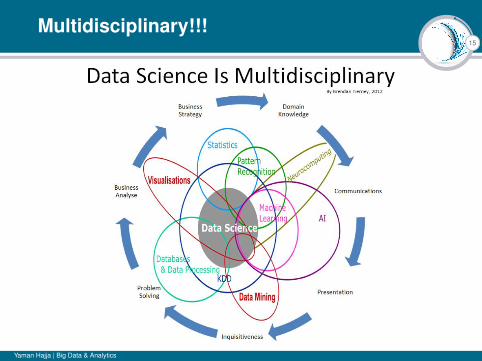
Multidisciplinary!!!
Yaman Hajja | Big Data & Analytics
16
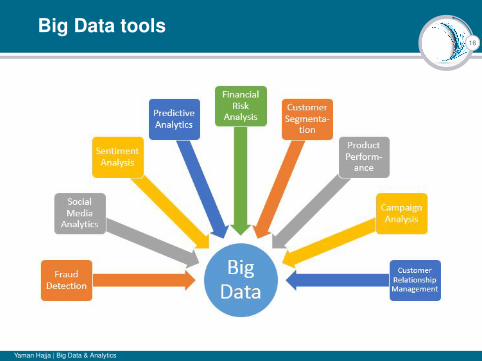
Big Data tools
Yaman Hajja | Big Data & Analytics

17
Big Data tools
Yaman Hajja | Big Data & Analytics

18
some Big Data facts
I Big Data and Business Analytics Revenues Forecast to Reach$150.8 Billion This Year, Led by Banking and ManufacturingInvestments, According to from International Data Corporation(IDC), an increase of 12.4% over 2016.
I Twenty-five years ago, data was growing at a rate of 100GB aday. Now, data grows at a rate of almost 50,000GB a second.
I The world today is awash in data. In 2015, mankind produced asmuch information as was created in all previous years of humancivilization. Every time we send a message, make a call, orcomplete a transaction, we leave digital traces.
Yaman Hajja | Big Data & Analytics

19
Data scientists vs data analysts
Yaman Hajja | Big Data & Analytics

20
Data Visualization
I Data visualization is a general term that describes any effort tohelp people understand the significance of data by placing it in avisual context. Patterns, trends and correlations that might goundetected in text-based data can be exposed and recognizedeasier with data visualization software.
Yaman Hajja | Big Data & Analytics

21
Example: Data Visualized
Charter value
NPLs
Exchange rate
M1
15
15.5
16
16.5
17
17.5
18
Cha
rter v
alue
%
2
4
6
8
10
12
14
16
18
20
2220
02m
120
02m
720
03m
120
03m
720
04m
120
04m
720
05m
120
05m
720
06m
120
06m
720
07m
120
07m
720
08m
120
08m
720
09m
120
09m
720
10m
120
10m
720
11m
120
11m
720
12m
120
12m
720
13m
120
13m
720
14m
120
14m
720
15m
120
15m
7
Time (2002 M1 - 2015 M8)
NPLs % Money supply M1 % pa
Exchange rate Charter value %
NPls of Malaysia banking system over M1, exchange rate, and charter value (2002 M1 - 2015 M8)
Yaman Hajja | Big Data & Analytics

22
Example#2: Data Visualized
Capital
GDP
NPLs
-12-10
-8-6-4-202468
10121416
1998
m1
1998
m7
1999
m1
1999
m7
2000
m1
2000
m7
2001
m1
2001
m7
2002
m1
2002
m7
2003
m1
2003
m7
2004
m1
2004
m7
2005
m1
2005
m7
2006
m1
2006
m7
2007
m1
2007
m7
2008
m1
2008
m7
2009
m1
2009
m7
2010
m1
2010
m7
2011
m1
2011
m7
2012
m1
2012
m7
2013
m1
2013
m7
2014
m1
2014
m7
2015
m1
NPLs % GDP growth % Capital ratio %
NPLs of Malaysia banking system over business cycle (GDP) (1998 M1 - 2015 M3) with capital ratio
Yaman Hajja | Big Data & Analytics
23
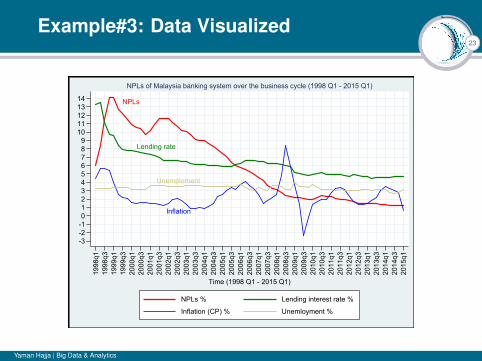
Example#3: Data Visualized
NPLs
Lending rate
Unemploment
Inflation
-3-2-10123456789
1011121314
1998
q119
98q3
1999
q119
99q3
2000
q120
00q3
2001
q120
01q3
2002
q120
02q3
2003
q120
03q3
2004
q120
04q3
2005
q120
05q3
2006
q120
06q3
2007
q120
07q3
2008
q120
08q3
2009
q120
09q3
2010
q120
10q3
2011
q120
11q3
2012
q120
12q3
2013
q120
13q3
2014
q120
14q3
2015
q1
Time (1998 Q1 - 2015 Q1)
NPLs % Lending interest rate %
Inflation (CP) % Unemloyment %
NPLs of Malaysia banking system over the business cycle (1998 Q1 - 2015 Q1)
Yaman Hajja | Big Data & Analytics

24
Visualization Types
Yaman Hajja | Big Data & Analytics

25
Social Network Analysis
I Social network analysis (SNA) is the process of investigatingsocial structures through the use of network and graphtheories.It characterizes networked structures in terms of nodes(individual actors, people, or things within the network) and theties, edges, or links (relationships or interactions) that connectthem. Examples of social structures commonly visualizedthrough social network analysis include social media networks.
Yaman Hajja | Big Data & Analytics

26
Example of Social Network AnalysisData visualization of Facebook relationships
Yaman Hajja | Big Data & Analytics
27
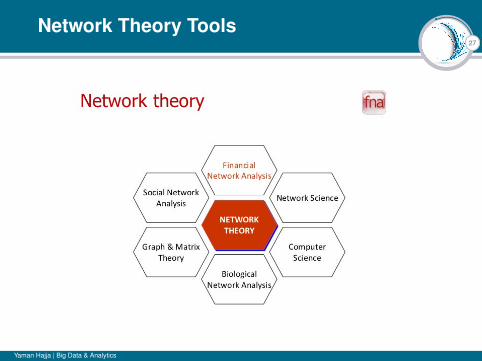
Network Theory Tools
Yaman Hajja | Big Data & Analytics
28
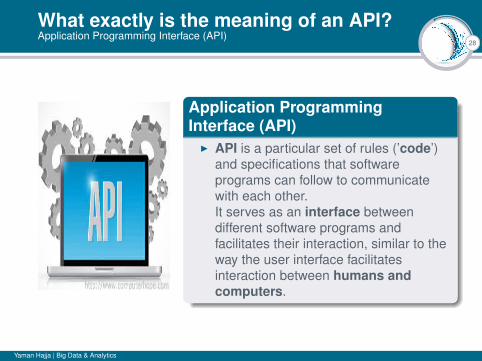
What exactly is the meaning of an API?Application Programming Interface (API)
Application ProgrammingInterface (API)
I API is a particular set of rules (’code’)and specifications that softwareprograms can follow to communicatewith each other.It serves as an interface betweendifferent software programs andfacilitates their interaction, similar to theway the user interface facilitatesinteraction between humans andcomputers.
Yaman Hajja | Big Data & Analytics

29
What exactly is the meaning of an API?Application Programming Interface (API)
API is a set of subroutine definitions, protocols, and tools for buildingapplication software.It is a set of clearly defined methods of communication betweenvarious software components. A good API makes it easier to developa computer program by providing all the building blocks, which arethen put together by the programmer.An API may be for a web-based system, operating system, databasesystem, computer hardware or software library. An API specificationcan take many forms, but often includes specifications for routines,data structures, object classes, variables or remote calls.Microsoft Windows API, the C++ Standard Template Library and JavaAPIs are examples of different forms of APIs.
Yaman Hajja | Big Data & Analytics
30
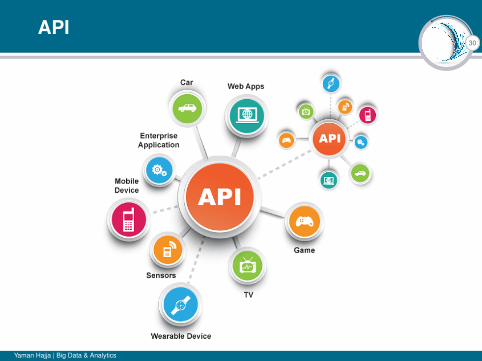
API
Yaman Hajja | Big Data & Analytics
31
Example of web APIShiny Weather Data
I A web API is an application programming interface (API) foreither a web server or a web browser.
I Shiny Weather Data is a web service making different sources ofEuropean gridded climate data available in hourly time seriesformats used by common building performance modeling tools.This web service has been around for a while and has a steadilygrowing user group of professional building modelers as well asstudents and researchers.
I satellite-based time series of solar irradiation for the actualweather conditions as well as for clear-sky conditions
I Portfolio Visualizer
Yaman Hajja | Big Data & Analytics
32
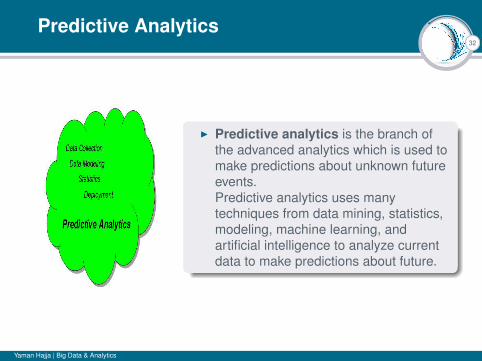
Predictive Analytics
I Predictive analytics is the branch ofthe advanced analytics which is used tomake predictions about unknown futureevents.Predictive analytics uses manytechniques from data mining, statistics,modeling, machine learning, andartificial intelligence to analyze currentdata to make predictions about future.
Yaman Hajja | Big Data & Analytics

33
Predictive Analytics
Yaman Hajja | Big Data & Analytics

34
Probability and Statistics
I Probability is the measure of the likelihood that an event willoccur. Probability is quantified as a number between 0 and 1(where 0 indicates impossibility and 1 indicates certainty). Thehigher the probability of an event, the more certain that the eventwill occur.A simple example is the tossing of a coin. Since the coin isunbiased, the two outcomes ("head" and "tail") are both equallyprobable; the probability of "head" equals the probability of"tail". Since no other outcomes are possible, the probability is1/2 (or 50%), of either "head" or "tail".
Yaman Hajja | Big Data & Analytics
35
Probability Theory
I Probability Theory is the branch of mathematics concernedwith probability, the analysis of random phenomena.The central objects of probability theory are random variables,stochastic processes, and events: mathematical abstractions ofnon-deterministic events or measured quantities that may eitherbe single occurrences or evolve over time in an apparentlyrandom fashion.
I Example
Yaman Hajja | Big Data & Analytics

36
Statistics
I Statistics as "a branch of mathematics dealing with thecollection, analysis, interpretation, and presentation of masses ofnumerical data". Merriam-Webster dictionary.
I In applying statistics to, e.g., a scientific, industrial, or socialproblem, it is conventional to begin with a statistical population ora statistical model process to be studied.
I Populations can be diverse topics such as "all people living in acountry" or "every atom composing a crystal".Statistics deals with all aspects of data including the planning ofdata collection in terms of the design of surveys andexperiments.
Yaman Hajja | Big Data & Analytics

37
Normal Distribution
I Normal (or Gaussian) distribution is a very common continuousprobability distribution. Normal distributions are important instatistics and are often used in the natural and social sciences torepresent real-valued random variables whose distributions arenot known.
I LINK (Normal Distribution).
Yaman Hajja | Big Data & Analytics

38
Normal DistributionProbability density function
Figure: The red curve is the standard normal distribution
Yaman Hajja | Big Data & Analytics
39
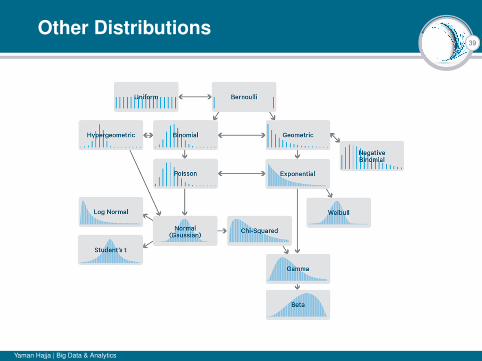
Other Distributions
Yaman Hajja | Big Data & Analytics
40
p-value
The P value, or calculated probability, is the probability of finding theobserved, or more extreme, results when the null hypothesis (H0) of astudy question is true – the definition of ’extreme’ depends on howthe hypothesis is being tested.- LINK.- Seeing Theory website.
Yaman Hajja | Big Data & Analytics

41
what is Regression Analysis?
I Regression analysis is a form of predictive modelling techniquewhich investigates the relationship between a dependent (target)and independent variable (s) (predictor).This technique is used for forecasting, time series modelling andfinding the causal effect relationship between the variables. Forexample, relationship between rash driving and number of roadaccidents by a driver is best studied through regression.
I Regression analysis is an important tool for modelling andanalyzing data.
I There are multiple benefits of using regression analysis.They are as follows:*** It indicates the significant relationships between dependentvariable and independent variable.*** It indicates the strength of impact of multiple independentvariables on a dependent variable.
Yaman Hajja | Big Data & Analytics

42
Linear Regression
I It is one of the most widely knownmodeling technique. Linearregression is usually among thefirst few topics which people pickwhile learning predictivemodeling.
I Linear Regression establishes arelationship between dependentvariable (Y) and one or moreindependent variables (X) usinga best fit straight line (alsoknown as regression line).
Yaman Hajja | Big Data & Analytics
43
Linear Regression. Cont.
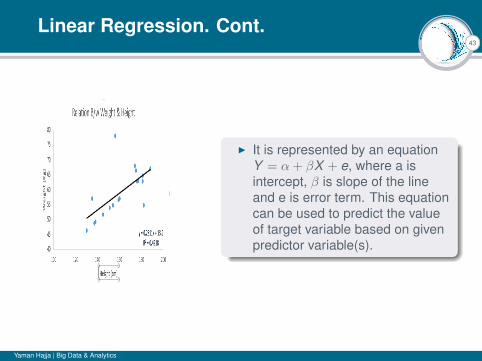
I It is represented by an equationY = α+ βX + e, where a isintercept, β is slope of the lineand e is error term. This equationcan be used to predict the valueof target variable based on givenpredictor variable(s).
Yaman Hajja | Big Data & Analytics

44
Data Modeling then Forecasting (Simulationof the model) Example.
0
1
2
3
-1
-.5
0
.5
-.5
0
.5
1
-1
-.5
0
.5
1
-1
-.5
0
.5
-.05
0
.05
.1
0
.1
.2
.3
-.1
-.05
0
.05
-.15-.1
-.050
.05
-.020
.02
.04
.06
-2
-1
0
1
-3
-2
-1
0
1
-1
0
1
2
-5
0
5
10
-2
-1
0
1
-.1
-.05
0
.05
-.1
-.05
0
.05
-.05
0
.05
.1
-.1
0
.1
.2
.3
-.1
-.05
0
.05
-.2
-.1
0
.1
0.1.2.3.4
-.2
-.1
0
.1
-.2
0
.2
.4
0
.1
.2
.3
0 5 10 15 20 25 30 0 5 10 15 20 25 30 0 5 10 15 20 25 30 0 5 10 15 20 25 30 0 5 10 15 20 25 30
M1 : M1
LENR : M1
CA^2 : M1
CA : M1
NPLs : M1
M1 : LENR
LENR : LENR
CA^2 : LENR
CA : LENR
NPLs : LENR
M1 : CA^2
LENR : CA^2
CA^2 : CA^2
CA : CA^2
NPLs : CA^2
M1 : CA
LENR : CA
CA^2 : CA
CA : CA
NPLs : CA
M1 : NPLs
LENR : NPLs
CA^2 : NPLs
CA : NPLs
NPLs : NPLs
95% CI Orthogonalized IRF
Step (1-month)
impulse : response. Generated by Monte-Carlo with 1000 reps. Based on VAR model.
Impulse-Response Functions
Yaman Hajja | Big Data & Analytics

45
Back to R ProgrammingHow to fetch stock data?
Example: How to fetch stock data?I Financial time series forecasting – an easy approachI Yahoo Finance
Yaman Hajja | Big Data & Analytics

46
Back to R ProgrammingR - Linear Regression
ExampleLinear Regression in R.
Yaman Hajja | Big Data & Analytics
47
Back to R ProgrammingR - Linear Regression
ExampleAdvanced R
Yaman Hajja | Big Data & Analytics

48
Artificial intelligence (AI)
DefinitionI AI is intelligence exhibited by machines. In computer science,
the field of AI research defines itself as the study of "intelligentagents": any device that perceives its environment and takesactions that maximize its chance of success at some goal.The term "artificial intelligence" is applied when a machinemimics "cognitive" functions that humans associate with otherhuman minds, such as "learning" and "problem solving" (knownas Machine Learning).
I In August 2001, robots beat humans in a simulated financialtrading competition.
Yaman Hajja | Big Data & Analytics

49
Artificial intelligence (AI)List of programming languages for artificial intelligence
DefinitionI Python is widely used for Artificial Intelligence. They have a lot of
different AIs with corresponding packages: General AI, MachineLearning, Natural Language Processing and Neural Networks.Companies like Narrative Science use Python to create anartificial intelligence for Narrative Language Processing.
I MATLAB.I C++.
Yaman Hajja | Big Data & Analytics

50
Machine learning
DefinitionI Machine learning is the subfield of computer science that gives
computers the ability to learn without being explicitlyprogrammed. Evolved from the study of pattern recognitionand computational learning theory in artificial intelligence,machine learning explores the study and construction ofalgorithms that can learn from and make predictions ondata—such algorithms overcome following strictly static programinstructions by making data driven predictions or decisions,through building a model from sample inputs.
I Machine learning is employed in a range of computing taskswhere designing and programming explicit algorithms with goodperformance is difficult or infeasible; example applicationsinclude spam filtering, optical character recognition (OCR),search engines and computer vision.
Yaman Hajja | Big Data & Analytics

51
Machine learning
Definition +
I Machine learning is a branch in computer science that studiesthe design of algorithms that can learn. Typical machine learningtasks are concept learning, function learning or “predictivemodeling”, clustering and finding predictive patterns.These tasks are learned through available data that wereobserved through experiences or instructions, for example.Machine learning hopes that including the experience into itstasks will eventually improve the learning. The ultimate goal is toimprove the learning in such a way that it becomes automatic, sothat humans like ourselves don’t need to interfere any more.
Yaman Hajja | Big Data & Analytics

52
Machine learning
Figure: The machine learning process starts with raw data and ends up witha model derived from that data.
Yaman Hajja | Big Data & Analytics

53
Common Machine Learning Algorithms
I Naïve Bayes Classifier AlgorithmI K Means Clustering AlgorithmI Support Vector Machine AlgorithmI Apriori AlgorithmI Linear RegressionI Logistic RegressionI Artificial Neural NetworksI Random ForestsI Decision TreesI Nearest Neighbours (k -nearest neighbours "KNN" )
Yaman Hajja | Big Data & Analytics
54
The Role of [R] in machine learning
I Much of the work done by a data scientist involves statistics. Forexample, machine learning algorithms commonly apply somekind of statistical technique to prepared data.
I But doing this kind of work can sometimes require programming.What programming language is best for statistical computing?
I The answer is clear: It’s the open-source language called R.Created in New Zealand more than 20 years ago, R hasbecome the lingua franca for writing code in this area. Infact, it’s hard to find a data scientist who doesn’t know R.
I Example: Machine Learning in R using (k -nearest neighbours)algorithm.
Yaman Hajja | Big Data & Analytics

55
Machine learning
Yaman Hajja | Big Data & Analytics
56
Data mining
DefinitionI Data mining is the computational process of discovering
patterns in large data sets involving methods at the intersectionof artificial intelligence, machine learning, statistics, anddatabase systems.
I It is an interdisciplinary subfield of computer science
Yaman Hajja | Big Data & Analytics

57
Data mining
Definition 2I Data in digital form are available everywhere. It can be used to
predict the future. Usually the statistical approach is used. Datamining is an extension of traditional data analysis and statisticalapproaches in that it incorporates analytical techniques drawnfrom a range of disciplines.
I Data mining covers the entire process of data analysis,including data cleaning and preparation and visualization of theresults, and how to produce predictions in real-time so thatspecific goals are met.
I Source
Yaman Hajja | Big Data & Analytics
58
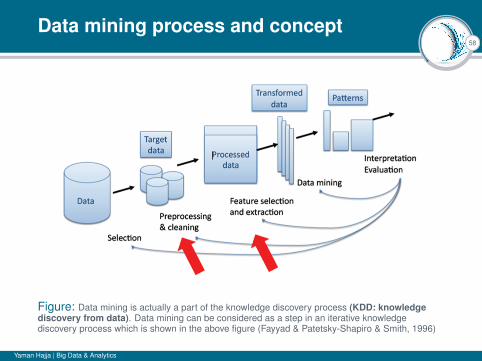
Data mining process and concept
Figure: Data mining is actually a part of the knowledge discovery process (KDD: knowledgediscovery from data). Data mining can be considered as a step in an iterative knowledgediscovery process which is shown in the above figure (Fayyad & Patetsky-Shapiro & Smith, 1996)
Yaman Hajja | Big Data & Analytics

59
Data mining in "Risk Management"
I Data mining creates models through data analysis andprediction to help solve problems involving both project feasibilityand risk management.
I Data mining has been used to analyze a database containinginformation on a person’s history, achievements, and expertise.
I The goal was to develop a profile of the maturity of a certainproject involving the resource capacity, especially human capital.
Yaman Hajja | Big Data & Analytics

60
Data mining tools
Yaman Hajja | Big Data & Analytics

61
Data mining Cont.
Why Data Mining?I It helps to discover reasons for success and failure.I It helps to understand your customers, products etc.I It improves your organization by mining large sized databases.
SQL Data Mining AlgorithmsI Set of clusters illustrating how to relate the cases in dataset.I Decision Tree forecasts about the outcome and its after-effects.I Set of Rules explain how to group the products in a transaction.
Yaman Hajja | Big Data & Analytics
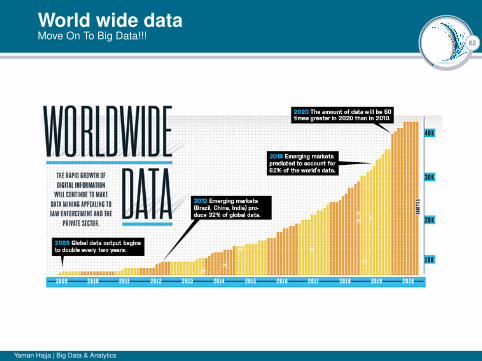
62
World wide dataMove On To Big Data!!!
Yaman Hajja | Big Data & Analytics

Thank you!