biennial report dredging years 2004/2005 · dredging years 2004/2005 ... (east waterway recency)...
TRANSCRIPT
DREDGED MATERIAL MANAGEMENT PROGRAM
Puget Sound Dredged Disposal Analysis Grays Harbor/Willapa Bay Evaluation Procedures
Lower Columbia River Evaluation Framework (Washington)
BIENNIAL REPORT Dredging Years 2004/2005
PREPARED BY THE DMMP AGENCIES
DREDGED MATERIAL MANAGEMENT PROGRAM
Puget Sound Dredged Disposal Analysis Grays Harbor/Willapa Bay Evaluation Procedures
Lower Columbia River Evaluation Framework (Washington)
BIENNIAL REPORT Dredging Years 2004/2005 PRIMARY AUTHORS David Kendall, Corps of Engineers Lauran Cole Warner, Corps of Engineers Gwyn Puckett, Corps of Engineers GEOGRAPHIC INFORMATION SYSTEM PRODUCTION David Fox, Corps of Engineers
ii
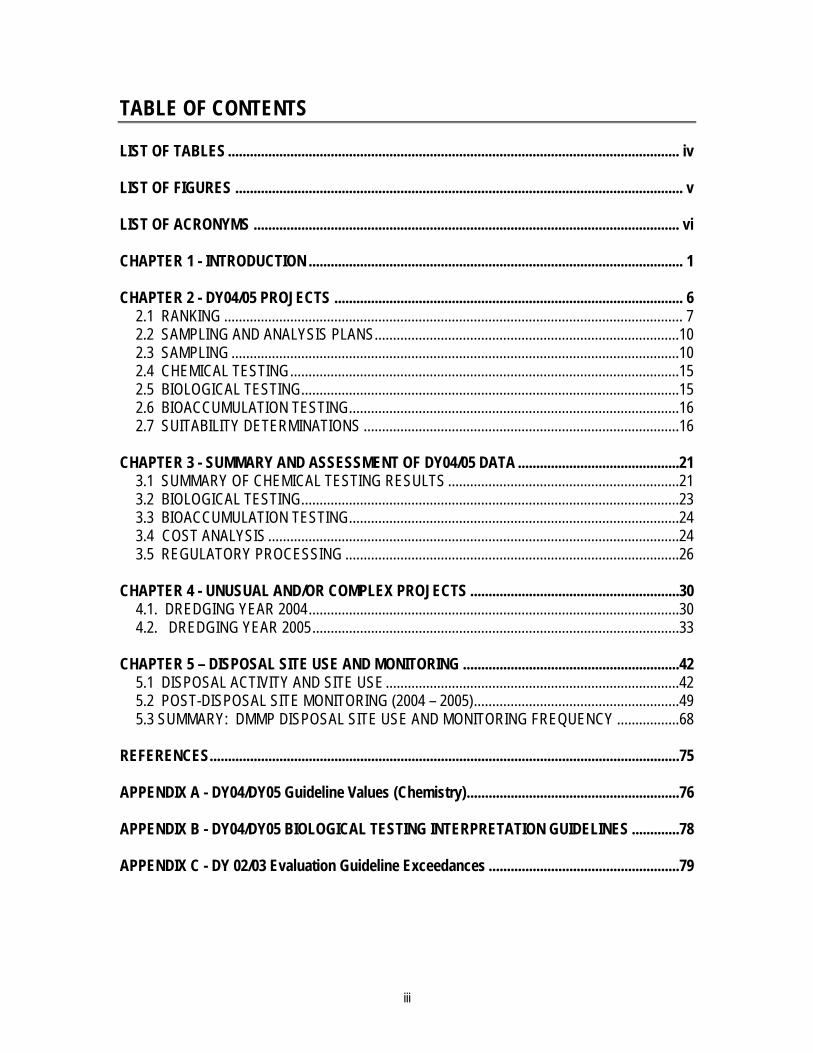
TABLE OF CONTENTS LIST OF TABLES........................................................................................................................... iv LIST OF FIGURES .......................................................................................................................... v LIST OF ACRONYMS .................................................................................................................... vi CHAPTER 1 - INTRODUCTION ...................................................................................................... 1 CHAPTER 2 - DY04/05 PROJECTS ............................................................................................... 6
2.1 RANKING ............................................................................................................................. 7 2.2 SAMPLING AND ANALYSIS PLANS...................................................................................10 2.3 SAMPLING ..........................................................................................................................10 2.4 CHEMICAL TESTING..........................................................................................................15 2.5 BIOLOGICAL TESTING.......................................................................................................15 2.6 BIOACCUMULATION TESTING..........................................................................................16 2.7 SUITABILITY DETERMINATIONS ......................................................................................16
CHAPTER 3 - SUMMARY AND ASSESSMENT OF DY04/05 DATA ............................................21
3.1 SUMMARY OF CHEMICAL TESTING RESULTS ...............................................................21 3.2 BIOLOGICAL TESTING.......................................................................................................23 3.3 BIOACCUMULATION TESTING..........................................................................................24 3.4 COST ANALYSIS ................................................................................................................24 3.5 REGULATORY PROCESSING ...........................................................................................26
CHAPTER 4 - UNUSUAL AND/OR COMPLEX PROJECTS .........................................................30
4.1. DREDGING YEAR 2004.....................................................................................................30 4.2. DREDGING YEAR 2005....................................................................................................33
CHAPTER 5 – DISPOSAL SITE USE AND MONITORING ...........................................................42
5.1 DISPOSAL ACTIVITY AND SITE USE................................................................................42 5.2 POST-DISPOSAL SITE MONITORING (2004 – 2005)........................................................49 5.3 SUMMARY: DMMP DISPOSAL SITE USE AND MONITORING FREQUENCY .................68
REFERENCES................................................................................................................................75 APPENDIX A - DY04/DY05 Guideline Values (Chemistry)..........................................................76 APPENDIX B - DY04/DY05 BIOLOGICAL TESTING INTERPRETATION GUIDELINES .............78 APPENDIX C - DY 02/03 Evaluation Guideline Exceedances ....................................................79
iii
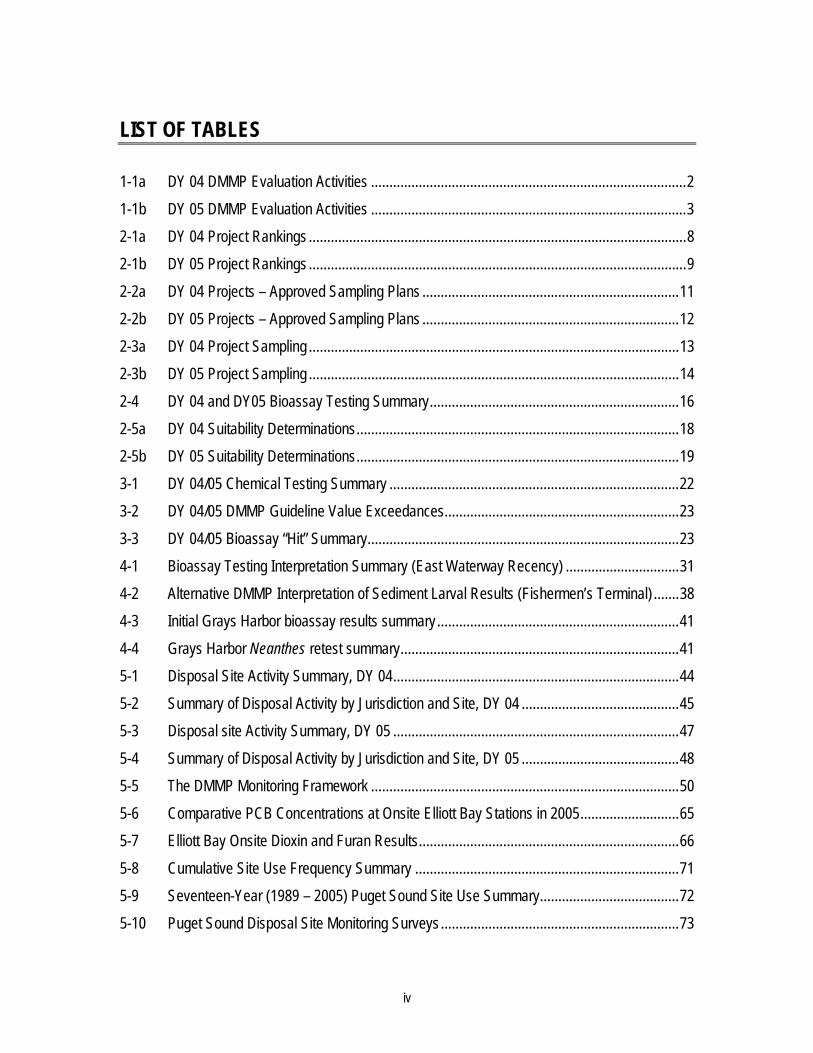
LIST OF TABLES 1-1a DY 04 DMMP Evaluation Activities ......................................................................................2 1-1b DY 05 DMMP Evaluation Activities ......................................................................................3 2-1a DY 04 Project Rankings .......................................................................................................8 2-1b DY 05 Project Rankings .......................................................................................................9 2-2a DY 04 Projects – Approved Sampling Plans ......................................................................11 2-2b DY 05 Projects – Approved Sampling Plans ......................................................................12 2-3a DY 04 Project Sampling .....................................................................................................13 2-3b DY 05 Project Sampling .....................................................................................................14 2-4 DY 04 and DY05 Bioassay Testing Summary....................................................................16 2-5a DY 04 Suitability Determinations........................................................................................18 2-5b DY 05 Suitability Determinations........................................................................................19 3-1 DY 04/05 Chemical Testing Summary ...............................................................................22 3-2 DY 04/05 DMMP Guideline Value Exceedances................................................................23 3-3 DY 04/05 Bioassay “Hit” Summary.....................................................................................23 4-1 Bioassay Testing Interpretation Summary (East Waterway Recency) ...............................31 4-2 Alternative DMMP Interpretation of Sediment Larval Results (Fishermen’s Terminal) .......38 4-3 Initial Grays Harbor bioassay results summary..................................................................41 4-4 Grays Harbor Neanthes retest summary............................................................................41 5-1 Disposal Site Activity Summary, DY 04..............................................................................44 5-2 Summary of Disposal Activity by Jurisdiction and Site, DY 04 ...........................................45 5-3 Disposal site Activity Summary, DY 05 ..............................................................................47 5-4 Summary of Disposal Activity by Jurisdiction and Site, DY 05 ...........................................48 5-5 The DMMP Monitoring Framework ....................................................................................50 5-6 Comparative PCB Concentrations at Onsite Elliott Bay Stations in 2005...........................65 5-7 Elliott Bay Onsite Dioxin and Furan Results.......................................................................66 5-8 Cumulative Site Use Frequency Summary ........................................................................71 5-9 Seventeen-Year (1989 – 2005) Puget Sound Site Use Summary......................................72 5-10 Puget Sound Disposal Site Monitoring Surveys .................................................................73
iv
LIST OF FIGURES 1-1a DY 2004/ Puget Sound Project Locations ............................................................................4 1-1b DY 2005 Puget Sound Project Locations .............................................................................5 1-1c DY 2004/2005 Coastal Project Locations.............................................................................6 3-1 Project Size versus Unit Testing Cost ................................................................................25 3-2 Chemistry Unit Cost ...........................................................................................................25 3-3 Bioassay Suite Unit Cost Analysis .....................................................................................26 3-4 DMMP Processing Time (means for DY 04/05 Projects in days) .......................................29 5-1a DY 2004 Disposal Volumes for Puget Sound.....................................................................43 5-1b DY 2004 Disposal Volumes for Grays Harbor ....................................................................43 5-2a DY 2005 Disposal Volumes for Puget Sound.....................................................................46 5-2b DY 2005 Disposal Volumes for Grays Harbor ....................................................................46 5-3 Disposal History at the Commencement Bay Disposal Site ..............................................51 5-4 Distribution and Thickness (cm) at the Commencement Bay site in 2004 .........................53 5-5 Commencement Bay 2004 Monitoring Sediment Sampling Stations .................................54 5-6 Distribution and Thickness (cm) at the Commencement Bay site in 2005 .........................56 5-7 Sediment Chemistry Stations (Phenol) at the Commencement Bay site in 2005 ...............57 5-8 Phenol Concentration History at the Commencement Bay Site .........................................58 5-9 Distribution and Thickness (cm) at the Ketron Island site in 2005......................................62 5-10 Schematic of organism-sediment relationship over time for a physical disturbance and
distance for a pollution gradient .........................................................................................63 5-11 Ketron Island 2005 Monitoring Sediment Sampling Stations..............................................64 5-12 Elliott Bay 2005 Special Study Sediment Sampling Stations..............................................67 5-13 DMMP cumulative disposal volumes in Puget Sound, DY 1989 – 2005 ............................69 5-14 Cumulative disposal volumes in Grays Harbor, DY 1996 – 2005.......................................70
v
LIST OF ACRONYMS AET Apparent Effects Threshold BT Bioaccumulation Trigger COC Chemical of Concern CWA Clean Water Act CY Cubic Yard DAIS Dredged Analysis Information System DL Detection Limit DMMO Dredged Material Management Office DMMU Dredged Material Management Unit DNR Washington Department of Natural Resources DY Dredging Year EPA Environmental Protection Agency EPTA Evaluation Procedures Technical Appendix FC Full Characterization GIS Geographic Information System HPA Hydraulic Project Approval HPAH High-molecular-weight PAH LPAH Low-molecular-weight PAH ML Maximum Level MPR Management Plan Report NMFS National Marine Fisheries Service NOAA National Oceanic and Atmospheric Administration O&M Operations and Maintenance PAH Polynuclear Aromatic Hydrocarbon PC Partial Characterization PCBs Polychlorinated Biphenyls PPB Parts per Billion PPM Parts per Million PSDDA Puget Sound Dredged Disposal Analysis PSEP Puget Sound Estuary Program PSNS Puget Sound Naval Shipyard QA/QC Quality Assurance/Quality Control SAP Sampling and Analysis Plan SDM Suitability Determination SMARM Sediment Management Annual Review Meeting SMS Sediment Management Standards SL Screening Level TOC Total Organic Carbon USACE US Army Corps of Engineers UCOWD Unconfined Open Water Disposal WDFW Washington Department of Fish and Wildlife
vi
CHAPTER 1 - INTRODUCTION The Dredged Material Management Program (DMMP) represents an interagency approach to the management of dredged material in the State of Washington. Three separate, but closely related, dredged material programs exist under the DMMP: the Puget Sound Dredged Disposal Analysis (PSDDA), Grays Harbor and Willapa Bay, and the Lower Columbia River programs. The four cooperating agencies (“agencies”) are: U.S. Army Corps of Engineers, Seattle District (Corps); U.S. Environmental Protection Agency, Region 10 (EPA); Washington Department of Ecology (Ecology); and Washington Department of Natural Resources (DNR). This chapter summarizes Dredged Material Management Program (DMMP) activities for Dredging Years 2004 and 2005. The DMMP applies dredging evaluation guidelines to federal and permitted projects in Washington State, including Lake Washington, Puget Sound, Grays Harbor and Willapa Bay, and the Lower Columbia River. A dredging year includes all projects evaluated between June 16 of a given year and June 15 of the following year (DY04 = June 16, 2003 - June 15, 2004; DY05 = June 16, 2004 - June 15, 2005). Tables related to project-specific ranking, sampling, testing, and suitability determinations are presented in Chapter 2. Chapter 3 presents an overall assessment of sampling and testing activities and data, and details unusual circumstances or the application of best professional judgment by the agencies. Chapter 4 summarizes details of complex or unusual projects where Best-Professional-Judgment (BPJ) was exercised by the DMMP agencies. During DY04/05 there were 39 projects that completed the DMMP process (Tables 1-1a and 1-1b). Most projects were full characterizations (FC) of a project area intended to assess suitability of the proposed dredged material for open water disposal. The typical completion action by the DMMP is a suitability determination memorandum (SDM) that summarizes the results of the FC and provides an official determination on suitability for open water disposal. Other DMMP actions include volume revisions (when the project volume changes subsequent to characterization), frequency or recency extension determinations, and beneficial use sediment quality determinations. Of the projects listed in Tables 1-1a and 1-1b, 15 had DMMP actions completed by June 15, 2004 and are considered DY04 projects. 24 projects had DMMP actions completed by June 15, 2005 and are considered DY05 projects. Puget Sound locations for DY04 projects are depicted in Figure 1-1a and DY05 are plotted in Figure 1-1b. Projects located in Grays Harbor and Willapa Bay during DY04/05 are shown in Figure 1-1c. Any project that has resulted in an SDM or other completion action after June 15, 2005 is considered a DY 2006 project and is not considered in this report.
Table 1a. DY04 DMMP Evaluation Activities. These include all projects that concluded with an action by the DMMP between 6/15/03-6/14/04.
PROJECT DMMP Action
Disposal Jurisdiction
Project Volume (cy)
Ranking Determination
DY
SAP Review
DY
Suitability Determination
DY Port of Seattle East Waterway Recency Characterization RC PSDDA 12,030 H DY03 DY04 (6/03)
Port of Seattle Subsurface Suitable T-18 & East Waterway (Stage II) RE PSDDA 175,260 H NA DY04 (RE: 8/05)
Glacier Northwest, Duwamish RE PSDDA NA H NA DY04 (RE: 2/05) Lehigh Northwest Inc. (Cadman site) FC PSDDA 9,000 H DY04 DY04 (4/04)
USACE- Duwamish O&M (Stations 254-257+35) AR PSDDA NA H → LM NA DY04 (9/03)
USACE- Duwamish O&M Turning Basin FC PSDDA 66,000 LM DY04 DY04 (9/03)
Port of Skagit County La Conner Marina AR PSDDA NA M → L NA DY04 (7/03)
Anchor Cove Marina, Anacortes FC PSDDA 22,440 M DY04 DY04 (5/04) USACE Lower Snohomish River Settling Basin & Navigation Channel O&M
FC PSDDA 271,210 LM DY04 DY04 (1/04)
Port of Bellingham Padden Creek RE PSDDA 6,800 → 400 H NA DY04 (RE: 6/05)
Puget Sound Naval Shipyard RE/BU PSDDA 24,254 H NA DY04 (RE: 10/04) Port of Edmonds, Marina AR PSDDA NA H → M NA DY04 (2/04) Port of Tacoma Blair Waterway Bridge Reach Widening FC PSDDA 265,000 M DY04 DY04 (2/04)
Basin and Channel Property Owners Association, Hood Canal FC/BU PSDDA 1,200 LM DY04 DY04 (3/04)
Nahcotta Boat Basin O&M FC GH/WB 145,000 M DY04 DY04 (2/04) DMMP Actions FC = Full Characterization RE = Recency Extension AR = Area Rerank RC = Recency Characterization VR = Volume Revision BU = Beneficial Use PDM = Post Dredge Monitoring (surface sediment quality) Disposal Jurisdictions GH/WB = Grays Harbor/Willapa Bay PSDDA = Puget Sound Dredged Disposal Analysis PSDDA/SMS = PSDDA/Sediment Management Standards CR = Columbia River NA = not applicable
Biennial Report DY 2004/2005 2 April 1, 2006
Table 1-1b. DY05 DMMP Evaluation Activities. These include all projects that concluded with an action by the DMMP between 6/15/04-6/14/05.
PROJECT DMMP Action
Disposal Jurisdiction
Project Volume
(cy)
Ranking Determination
DY
SAP Review
DY
Suitability Determination
DY USACE / Port of Olympia, Olympia Harbor O&M RE PSDDA 624,000 LM NA DY05 (5/05)
Day Island Yacht Club, Tacoma Narrows FC PSDDA 23,000 M DY05 DY05 (4/05) Port of Tacoma Blair Bridge Reach Widening BU BU PSDDA 265,000 M NA DY05 (8/04)
Port of Tacoma Blair Inner Reach Cutback & Turning Basin Expansion FC PSDDA 2,600,000 LM / L DY04 DY05 (11/04)
Port of Tacoma Blair Waterway SW Corner Cutback FC PSDDA 105,000 M DY05 DY05 (12/04)
Manke Lumber Company Supplemental FC PSDDA 23,000 H DY05 DY05 (12/04) Manke Lumber Company, Supplemental Addendum & Volume Revision FC/VR PSDDA 31,500 H DY05 DY05 (1/05)
Port of Silverdale Waterfront Park Boat Ramp & Marina, Dyes Inlet FC PSDDA 3,950 M DY05 DY05 (5/05)
Brightwater Marine Outfall Alignment Corridor FC PSDDA 5,300 M DY04 DY05 (11/04)
Lakeside Industries Sand & Gravel Spill PDM PSDDA/SMS NA H DY04 DY05 (1/05) Port of Seattle Fishermen’s Terminal FC PSDDA 47,793 H DY05 DY05 (4/05) Seattle Parks Department – South Lake Union Project PDM PSDDA/SMS NA H NA DY05 (5/05)
Port of Seattle Terminal 46 FC PSDDA 27,000 H DY04 DY05 (6/04) Port of Seattle T-103 Barge Berth PDM PSDDA/SMS NA H NA DY05 (4/05) Port of Everett Marina 14th Street Dredging FC PSDDA 4,000 M DY05 DY05 (3/05)
USACE Upper Snohomish River Settling Basin & Upstream Navigation Chan. FC/BU PSDDA 200,000 LM DY04 DY05 (7/04)
Bridgehaven Community Club Marina Entrance Channel, Hood Canal BU PSDDA 7,000 LM NA DY05 (2/05)
USACE Keystone Ferry Terminal (Lake Crockett) O&M BU PSDDA 40,000 L NA DY05 (5/05)
Curtis Wharf, Anacortes RE PSDDA 45,000 M NA DY05 (RE: 3/05) Port of Bellingham Harris Avenue Shipyard MTCA Cleanup FC PSDDA 15,432 H DY04 DY05 (7/04)
Tidewater Cove FC CR 246,000 M DY05 DY05 USACE Grays Harbor O&M FC GHWB 1,860,000 L DY04 DY05 (3/05) Dakota Creek, Anacortes FC PSDDA 12,000 M DY05 DY06 (9/05)1
USACE Quillayute Boat Basin O&M FC GH/WB 28,500 M DY05 DY05 (3/05)
1 The supplemental sampling and testing for dioxin was conducted in DY05, but due to project delays the suitability determination was not concluded until DY06.
Biennial Report DY 2004/2005 3 April 1, 2006

Figure 1-0-1a. Location of dredging projects in Puget Sound during DY04.
Biennial Report DY 2004/2005 4 April 1, 2006
Figure 1-1b. Location of dredging projects in Puget Sound during DY05.
Biennial Report DY 2004/2005 5 April 1, 2006
Figure 1-1c. Location of dredging projects in Grays Harbor, Willapa Bay and Coastal Washington during DY04/05.
Biennial Report DY 2004/2005 6 April 1, 2006
CHAPTER 2 - DY04/05 PROJECTS 2.1 RANKING Each jurisdiction under the DMMP has specific guidance that explains requirements for evaluating dredged material for open-water disposal. Sampling and analysis requirements under the PSDDA program are fully explained in the 1988 Phase I Evaluation Procedures Technical Appendix (EPTA) and the DMMP Users Manual. Sampling and analysis requirements in Grays Harbor and Willapa Bay are also explained in the DMMP Users Manual. Sampling and analysis requirements for projects occurring within the Columbia River are found in the November 1998 Dredged Material Evaluation Framework – Lower Columbia River Management Area.2 The DMMP Users Manual and the Dredged Material Evaluation Framework can be accessed via the Internet from the Corp’s Dredged Material Management Office home page, at http://www.nws.usace.army.mil (click on “Civil Works” and then click on “Dredge Material Management”). The Dredged Material Evaluation Framework is being revised as part of the Regional Sediment Evaluation Team efforts. A review draft of a revised regional sediment evaluation framework was released for public comment in September 2005. Under the jurisdictional specific guidelines summarized above, the initial appraisal of a proposed dredging project requires a careful examination of all existing sediment quality data within the dredging area. An initial area ranking is based on a “reason to believe” that chemicals of concern may or may not be present in the project area. The agencies have established ranks for general areas within each jurisdiction (e.g., Elliott Bay/PSDDA) and activities (e.g., marinas) based on historical data or awareness of active sources of contamination. In the absence of project-specific data, representatives of the agencies apply an initial ranking based on guidance contained in the jurisdictional specific documents (DMMP Users Manual, Chapter 4). All three jurisdictional areas allow for a reconsideration of the initial ranking if the historical data at the site are adequate, or if the applicant conducts a partial characterization (PC) as described within each Users Manual to survey sediments in the project area for specific chemicals of concern. If the PC chemistry data support a lower ranking, sampling and analysis requirements may be reduced during the full characterization (FC), commensurate with the revised ranking requirements. Chemicals of concern may also be eliminated for analysis during the FC, based on the PC data. Tables 2-1a and 2-1b contain the initial and full characterization rankings of all DY04/05 projects. The “initial rank” was taken from the respective jurisdictional guidance rankings that were in effect at the time of project initiation. The “full characterization” rank was the rank actually used in the full characterization of project sediments. Two of the fourteen DY04 full characterizations (La Conner Marina and USACE Duwamish O&M Stations 254-257+35) and none of the twenty-two DY05 FCs had rankings adjusted based on presentation of additional data. In the both cases, the ranking was adjusted downward. It should be noted that the DMMP does not track projects that have had downranking requests denied based on insufficient “reason to believe” or inadequate data supporting the request.
2 Henceforth referred to as the Dredged Material Evaluation Framework
Biennial Report DY 2004/2005 7 April 1, 2006
Table 2-1a. DY04 Project Rankings.
PROJECT Disposal Jurisdiction Location Water body Initial
Rank Final Rank
Port of Seattle East Waterway Recency Guideline PSDDA Seattle Duwamish
Waterway H H
Port of Skagit County, La Conner Marina PSDDA Skagit
County Puget Sound M L
Port of Bellingham, Padden Creek PSDDA Bellingham Bellingham Bay H H USACE Duwamish O&M (Stations 254-257+35) PSDDA Seattle Duwamish
Waterway H LM
Port of Seattle Subsurface Suitable T-18 & East Waterway (Stage II) PSDDA Seattle Duwamish
Waterway H H
Puget Sound Naval Shipyard PSDDA Sinclair Inlet H H Port of Edmonds, Marina PSDDA Edmonds Puget Sound H M Port of Tacoma Blair Waterway Bridge Reach Widening PSDDA Tacoma Commencement
Bay M M
Nahcotta Boat Basin O&M GH/WB Willapa Bay M M Basin and Channel Property Owners Association, BU PSDDA Tahoka Hood Canal LM LM
Lehigh Northwest Inc. PSDDA H H Glacier Northwest PSDDA Seattle Duwamish River H H Anchor Cove Marina PSDDA Anacortes Puget Sound M M USACE Lower Snohomish River PSDDA Everett Snohomish river LM LM
L = Low LM = Low/Moderate M = Moderate H = High
Biennial Report DY 2004/2005 8 April 1, 2006
Table 2-1b. DY05 Project Rankings.
PROJECT Disposal Jurisdiction Location Water body Initial
Rank Final Rank
Port of Seattle Terminal 46 PSDDA Seattle Duwamish River H H Port of Bellingham Harris Avenue Shipyard MTCA Cleanup PSDDA Bellingham Bellingham Bay H H
Port of Tacoma Blair Bridge Reach Widening BU PSDDA Tacoma Commencement
Bay M M
Port of Tacoma Blair Inner Reach Cutback & Turning Basin Expansion PSDDA Tacoma Commencement
Bay LM/L LM/L
Brightwater Marine Outfall Alignment Corridor PSDDA Edmonds Point Wells,
Puget Sound M M
Curtis Wharf PSDDA Anacortes M M
USACE Upper Snohomish River PSDDA Everett Snohomish River LM LM
Bridgehaven Community Club Marina Entrance Channel PSDDA Tahuya Hood Canal LM LM
Manke Lumber Company PSDDA Tacoma Hylebos Waterway, CB H H
Port of Everett Marina 14th Street Dredging PSDDA Everett Snohomish
River M M
Lakeside Industries PSDDA Lake Washington Ship Canal Salmon Bay H H
USACE Quillayute Boat Basin GH/WB La Push, WA NW Washington Coast M M
Day Island Yacht Club PSDDA Tacoma Narrows Day Island Waterway M M
Port of Seattle Fishermen’s Terminal PSDDA Lake Washington Ship Canal Salmon Bay H H
Port of Seattle – Terminal 103 PSDDA Seattle Duwamish Waterway H H
USACE Keystone Ferry Terminal PSDDA Whidbey Island Admiralty Bay L L Port of Silverdale Waterfront Park Boat Ramp/Marina PSDDA Kitsap County Dyes Inlet M M
Seattle Parks Department – south Lake Union Project PSDDA Seattle Lake Union H H
USACE / Port of Olympia , Olympia Harbor O&M PSDDA Olympia Lower Budd Inlet LM LM
USACE Grays Harbor O&M GH/WB Grays Harbor Grays Harbor Chehalis River L L
Tidewater Cove CR Columbia River Columbia River M M Dakota Creek PSDDA Anacortes Dakota Creek M M
Biennial Report DY 2004/2005 9 April 1, 2006
2.2 SAMPLING AND ANALYSIS PLANS Approved sampling and analysis plans (SAPs) are required before applicants collect sediment samples for either a PC or FC. The applicant or dredging consultant receives guidance in SAP development3 based on the ranking that has been assigned to the proposed project. A conceptual dredging plan and representative sampling plan are established in close coordination with the Corps of Engineers Dredged Material Management Office (DMMO). Protocols for station positioning, decontamination, field sampling, sample compositing, chemical analysis, biological testing, QA/QC and data submittal are all included in the sampling and analysis plan. Once completed, DMMO coordinates review and approval of the plan with the DMMP agencies. Tables 2-2a and 2-2b contain data related to sampling plans approved for DY04/05 projects. Application of jurisdictionally specific sampling and analysis requirements resulted in the number of field samples and dredged material management units (DMMUs) formulated for each of the projects. Descriptions of those projects for which no testing was required, or for which best professional judgment was applied, are discussed in the project descriptions in Chapter 4. 2.3 SAMPLING Tables 2-3a and 2-3b contain data related to sampling efforts during DY04/05. Two general requirements existing within all three jurisdictions are to sample to the depth of dredging (including overdepth)4, and to provide positioning data to a minimum precision of one-tenth of a second, latitude and longitude. A variety of positioning techniques were used to provide the required precision. Great emphasis is placed on positioning in order to provide high-quality data. Precise positioning is important to provide repeatability in sampling and to provide data that can be utilized in a geographical information system (GIS). For the majority of the projects listed in the tables, the maximum sediment depths correspond to both the actual length of the deepest boring as well as to the maximum depth of the dredging prism, including overdepth. In high-ranked areas there is an additional requirement to provide an archived sample from the one-foot of sediment beyond the dredging prism (“Z” sample). This additional depth is not reflected in the table.
3 Templates for large project and small project sampling and analysis plan development are contained on the Seattle District Dredged Material Management Office homepage at the following address: http://www.nws.usace.army.mil/. 4 This requirement is less stringent in Grays Harbor/Willapa Bay in areas with high shoaling rates, which have been previously characterized to the limits of the dredging prism, and for areas generally meeting either Section 404 or Section 103 exclusionary criteria. In these cases sampling of the surface layer with a vanVeen grab is generally allowed.
Biennial Report DY 2004/2005 10 April 1, 2006
Table 2-2a. DY04 Projects - Approved Sampling Plans. Includes information from any SAP submitted that resulted in a DMMP action in DY04. SAPs were not necessarily reviewed in DY04.
PROJECT Rank Total
Volume (cy)
Surface Volume
(cy)
Number
of Surface Samples
Number of Surface
DMMUs
Subsurface Volume
(cy)
Number of Sub-surface
Samples
Number of Sub-surface
DMMUs
USACE Lower Snohomish R. Settling Basin & Navigation O&M
LM 271,210 271,210 36 9 05 03 03
Port of Seattle East Waterway Recency Characterization
H 12,030 12,030 15 3 0 0 0
Lehigh Northwest Inc. (Cadman Site) H 9,000 6,000 4 2 3,000 3 1
USACE Duwamish Turning Basin O&M LM 66,000 66,000 5 5 03 03 03
Anchor Cove Marina, Anacortes M 22,440 22,440 6 2 0 0 0
Port of Tacoma Blair Waterway Bridge Reach Widening
M 265,000 9,900 4 2 255,100 28 8
Basin and Channel Property Owners Association, BU
LM 1,200 1,200 4 1 0 0 0
Nahcotta Boat Basin M 145,000 145,000 17 4 0 0 0
5 The material within the Settling Basin and Navigation Channel is considered relatively homogeneous based on past testing and dredging frequency history, and therefore, no distinction between surface and subsurface samples/DMMUs was made for testing purposes.
Biennial Report DY 2004/2005 11 April 1, 2006
Table 2-2b. DY05 Projects - Approved Sampling Plans. Includes information from any SAP submitted that resulted in a DMMP action in DY05. SAPs were not necessarily reviewed in DY05.
PROJECT Rank
Total Volume
(cy)
Surface Volume
(cy)
Number of
Surface Samples
Number of
Surface DMMUs
Sub- Surface Volume
(cy)
Number of Sub- surface
Samples
Number of Sub- surface DMMUs
Day Island Yacht Club M 23,000 23,000 6 2 0 0 0 Port of Tacoma Blair Inner Reach Cutback & Turning Basin Expansion
LM/L 2,600,000 126,500 14 5 248,3186 36 12
Port of Tacoma Blair Waterway SW Corner Cutback M 105,000 11,900 2 1 13,6007 2 2
Manke Lumber Company, Supplemental Characterization H 31,500 23,000 10 10 0 0 0
Port of Silverdale M 3,950 3,950 6 1 0 0 0 Brightwater Marine Outfall Alignment Corridor M 5,300 5,300 3 3 0 0 0
Port of Seattle Fishermen’s Terminal H 47,793 32,709 24 12 0 0 0
Port of Seattle Terminal 46 H 27,000 27,000 12 6 0 0 0
Port of Everett Marina 14th Street M 4,000 4,000 3 1 0 0 0
USACE Upper Snohomish River Settling Basin & Navigation Channel
LM 200,000 200,000 21 12 0 0 0
Port of Bellingham Harris Avenue Shipyard MTCA Cleanup H 15,432 15,432 12 6 0 0 0
USACE Quillayute Boat Basin O&M M 28,500 28,500 9 2 0 0 0
Lakeside Industries Post Dredged Sediment Surface Quality H NA NA 1 1 0 0 0
USACE Grays Harbor O&M L 1,860,000 683,0008 75 11 0 0 0
Tidewater Cove M 12,000 12,000 3 2 0 0 0
Dakota Creek M 273,000 273,000 4 4 273,000 0 0
6 The remaining 2,225,182 cy of subsurface material was below the native contact sediment layer and was excluded from testing. 7 The remaining 77,500 cy of subsurface material was below the native contact sediment layer and was excluded from testing 8 As per the Grays Harbor/Willapa Bay Testing Manual 1/3 of the Federal O&M project will be tested every 2 years.
Biennial Report DY 2004/2005 12 April 1, 2006
TABLE 2-3a. DY04 Project Sampling. Grain sizes given are averages from all samples for a given project.
GRAIN SIZE PERCENTAGES
PROJECT GRAVEL > 2 mm
SAND .063 - 2mm
SILT .004 - .063 mm
CLAY < .004 mm
SAMPLING EQUIPMENT
MAX. SAMPLE DEPTH
(FT)
MEAN SAMPLE DEPTH
(FT)
USACE Lower Snohomish R. Settling Basin & Navigation O&M
0.1 - 1.1 48.3 - 81.3 12.7 - 41.8 5 - 9 Vibracore 11.9 7.1
Port of Seattle East Waterway Recency Characterization 0 - 0.1 25.3 – 33.7 47.1 – 55.2 11.1 – 26.9 Vibracore
5.9
5.6
Lehigh Northwest Inc. (Cadman Site) 25.7 -45.1 29.8 – 38.1 16.5 – 26.1 4.5 – 10.1 Impact Corer 7.1 4.6
USACE Duwamish Turning Basin O&M 0.2 – 3.4 52.7 – 90.5 4.6 – 34.7 1.8 – 10.9 Vibracore 13 7.8
Anchor Cove Marina, Anacortes 0.6 – 12.4 41.2 – 48.9 25.2 – 39.2 13.5 – 18.9 Gravity Corer 8.2 5.1
Port of Tacoma Blair Waterway Bridge Reach Widening
0.7 – 50.2 45.6 – 92.6 2.7 – 9.5 0.8 – 3.1 Hollow-stem Auger Drilling
Rig ~32 ~4
Basin and Channel Property Owners Association, BU 5.5 93.3 0.8 0.4 Grab sampler 10 cm 10 cm
Nahcotta Boat Basin 0.3 – 4.4 3.2 – 19.0 47.7 – 58.7 30.9 – 36.1 Gravity Corer 4 4
Biennial Report DY 2004/2005 13 April 1, 2006
TABLE 2-3b. DY05 Project Sampling. Grain sizes given are averages from all samples for a given project.
GRAIN SIZE PERCENTAGES
PROJECT GRAVEL
> 2 mm SAND
.063 - 2mm SILT
.004 - .063mm CLAY
< .004 mm
SAMPLING EQUIPMENT
MAX. SAMPLE DEPTH
(FT)
MEAN SAMPLE DEPTH
(FT)
Day Island Yacht Club 21.9 – 22.1 58.2 – 58.7 13.3 – 13.6 5.7 – 6.5 Vibracore 10.5 5.6 Port of Tacoma Blair Inner-Reach Cutback & Turning Basin Expansion
0 – 30.9 5.9 – 90.9 6.7 – 70.9 1.4 – 28.0 Upland Drill Rig 18 ~4
Manke Lumber Company Supplemental Characteriz. 10.0 – 18.7 37.2 – 44.4 23.0 – 34.2 13.7 – 15.7 Vibracore 7.9 5.4
Port of Silverdale 0.3 – 4.7 86.6 – 93.1 3.4 – 5.4 3.2 – 3.3 4” diameter Clam gun hand core
2.5 2.1
Brightwater Marine Outfall Alignment Corridor 0.3 – 0.8 95.0 – 98.2 0.7 – 1.3 2.7 – 3.0 van Veen
Grab 10” 10”
Port of Seattle Fishermen’s Terminal 0.7 – 9.1 6.5 – 59.3 22.3 -57.8 16.2 – 40.1 Vibracore 7.1 1.7
Port of Seattle Terminal 46 0.01 – 32.2 44.5 – 77.8 8.1 – 33.1 5.9 – 13.7 Vibracore Diver Cores 9 4.1
Port of Everett Marina 14th Street 2.4 39.2 47.7 10.6 Push Corer 4 3.7
USACE Upper Snohomish River Settling Basin & Navigation Channel
0.5 – 8.49 71.3 – 97.1 0.4 – 21.7 0.6 – 6.2 Vibracore 11.5 5.9
Port of Bellingham Harris Avenue Shipyard MTCA Cleanup
7.8 – 56.7 31.0 – 70.5 2.8 – 10.4 3.4 – 11.1 Vibracore 4 3.2
USACE Quillayute Boat Basin O&M 0.05 – 0.46 44.6 – 56.0 36.9 – 47.9 5.6 – 6.6 Vibracore 6.5 4.9
Lakeside Industries Post dredge sediment surface characterization
38.0 55.2 6.2 0.6 Van Veen Grab 10 cm 10 cm
USACE Grays Harbor O&M 0 -49.5 209 – 95.5 1.1 – 70.7 0.7 – 14.4 Van Veen Grab 10 cm 10 cm
Tidewater Cove 0.29 – 7.88 8.5 – 94.0 0.02 -59.5 0.01 – 32.9 Vibracore 13.2 11.3 Dakota Creek 0 – 14.1 27.5 -79.6 14.5 – 35 4.4 – 31.9 Vibracore 3 2.5
Biennial Report DY 2004/2005 14 April 1, 2006
2.4 CHEMICAL TESTING Chemical testing was conducted for 7 full characterizations in DY04 and 13 projects in DY05. In DY04 one project characterization was limited to analysis for grain size only. In DY05 one project was limited to grain size analysis; another project was subject to dioxin testing to supplement the full characterization that was conducted earlier; and a third project required post-construction dredging characterization of the newly exposed surface to verify compliance with Washington State Department of Ecology’s antidegradation policy. During DY04, the DMMP agencies revaluated recency extension request from 5 applicants, subsequently granting extensions to four while requiring confirmation testing on one project. During DY05, two projects requested and were granted recency extensions. The DMMP agencies reevaluated 2 projects in DY04 and four projects in DY05 for Beneficial Uses considerations. During DY05, three projects were evaluated by the DMMP for post-construction dredging compliance with the Washington State anti-degradation policy. One of these post-construction characterizations completed testing (Lakeside Industries), and two are currently undergoing testing that is not yet complete. In general, the QA/QC for projects undergoing chemical testing was acceptable by the DMMP agencies for regulatory decision-making. A complete listing of DMMP sediment guideline value exceedances for DY04/05 is included in Appendix C. 2.5 BIOLOGICAL TESTING A total of five projects required acute bioassay testing (Table 2-4) during the biennium. Two of these projects underwent biological testing in DY04. Three projects underwent biological testing in DY05. Of the DY04 projects one elected to do tiered testing, while the second conducted concurrent testing, performing biological tests on only those DMMUs that had exceedances of SLs. All three DY05 projects utilized concurrent testing DMMP regulatory use of the saline Microtox® test has been suspended since DY94 for regulatory decision-making. This suspension remains in force pending commitment of agency resources to effectively evaluate the continued use of this test, or a suitable replacement test, within each dredging/disposal jurisdiction.
Biennial Report DY 2004/2005 15 April 1, 2006
Table 2-4. DY04 and DY05 Bioassay Testing Summary. Summary of bioassay tests performed for DY04/05 projects.
Number of DMMUs undergoing biological analyses
Bioassay tests conducted
PROJECT DY
tiered testing
concurrent
testing
Number of DMMUs failing
bioassays Amphipod Sediment
Larval Neanthes
20-day Growth
Control sediment location
Reference sediment location
Port of Seattle East Waterway 04 3 3 Ee Mg Na Yaquina
Bay, OR Carr Inlet
Lehigh NW Inc. (Cadman Site) 04 3 1 Ee Mg Na Yaquina
Bay, OR Carr Inlet
Manke Lumber Company – Sup. 05 10 4 Ee Mg Na Yaquina
Bay, OR Carr Inlet
Port of Seattle Fishermen’s
Terminal 05 7 2 Ee Mg Na Yaquina
Bay, OR Lake
Washington9
USACE Grays Harbor O&M 05 2 Ee Cg Na Yaquina
Bay, OR Grays Harbor GHS7
Cg = Crassostrea gigas Ee = Eohaustorius estuarius Mg = Mytilus galloprovincialis Na = Neanthes arenaceodentata 2.6 BIOACCUMULATION TESTING No bioaccumulation testing was conducted during DY04 or DY05. The Port of Seattle Terminal 46 project had 3 bioaccumulation trigger exceedances, but due to timing constraints they opted to not undergo the required bioaccumulation testing. Therefore, these three DMMUs were determined by DMMP to be unsuitable for unconfined open water disposal based on BPJ. 2.7 SUITABILITY DETERMINATIONS A suitability determination outlines the evaluation procedures used in the characterization of project sediments, summarizes chemical and biological testing data and associated QA/QC issues, and documents the interpretation of testing results. The suitability determination is a technical consensus memorandum, drafted by the Corps’ DMMO and signed by DMMP representatives from the Corps of Engineers, Environmental Protection Agency, Department of Ecology and Department of Natural Resources. The suitability determination documents the suitability of proposed dredged sediments for open-water disposal at either one of the eight PSDDA sites, or two estuarine and one ocean sites in both Grays Harbor and Willapa Bay, or at appropriate in water sites in the Columbia River. It does not, however, constitute final project approval by the agencies.
9 The reference sediment failed to meet performance requirements for the bivalve sediment larval test, and the DMMP used BPJ to render a determination on suitability/unsuitability for UCOWD.
Biennial Report DY 2004/2005 16 April 1, 2006
Biennial Report DY 2004/2005
17 April 1, 2006
Comprehensive agency comments on the overall project are provided through the regulatory public notice and review process. Tables 2-5a and 2-5b contain information taken from the suitability determinations or other completion actions for each of the projects that completed their DMMP review during DY02 and DY03, respectively. For the projects receiving suitability determinations in DY04, only 1.8 percent of the total volume tested was found unsuitable for unconfined-open-water disposal under relevant DMMP evaluation guidelines. For DY05, only 0.5% of the total volume was found unsuitable for unconfined open-water disposal. The amount of unsuitable material varied considerably by project and location, with considerable portions of unsuitable material coming from the high-use areas in both Seattle and Tacoma.
Table 2-5a. DY04 Suitability Determinations
PROJECT Rank
Total Volume
(cy)
No. of chemical analyses
No. of bioassay analyses
No. of bioaccum analyses
No. of DMMUs Failing
Volume Failing
(cy) DMMUs Passing
Volume Passing
(cy)
Proposed DMMP
Disposal Site
USACE Lower Snohomish River LM 271,210 9 0 0 0 0 9 271,210 Port Gardner
Port of Seattle East Waterway H 12,030 3 3 0 3 12,030 0 0 Upland Confined
Lehigh NW Inc. (Cadman Site) H 9,000 3 1 0 1 3,000 2 6,000 Elliott Bay
USACE Duwamish Turning Basin O&M LM 66,000 5 0 0 0 0 5 66,000 Elliott Bay, PSR
Capping Anchor Cove Marina M 22,440 2 0 0 0 0 2 22,440 Rosario Strait Port of Tacoma, Blair Waterway Bridge Reach Widening
M 265,000 10 0 0 0 0 10 265,000 Commencement Bay
Basin and Channel Properties Assoc., BU LM 1,200 110 0 0 0 0 1 1,200 NA (Beach
Nourishment)
Nahcotta Boat Basin M 145,000 4 0 0 0 0 4 145,000 Goose Point, Willapa Bay
Totals: 791,880 37 4 0 4 15,030 33 776,850
10 Sediment Analysis limited to grain size with no chemical analyses conducted
Biennial Report DY 2004/2005 18 April 1, 2006
Table 2-5b. DY05 Suitability Determinations
PROJECT Rank
Total Volume
(cy)
No. of chemical analyses
No. of bioassay analyses
No. of bioaccum analyses
No. of DMMUs Failing
Volume Failing
(cy) DMMUs Passing
Volume Passing
(cy)
Proposed DMMP
Disposal Site
Day Island Yacht Club M 23,000 2 0 0 0 0 2 23,000 Commencement Bay Port of Tacoma, Blair Inner Reach Cutback LM/L 2,600,000 17 0 0 0 0 17 2,600,000 Commencement Bay
Port of Tacoma, Blair SW Corner Cutback M 105,000 2 0 0 0 0 2 105,000 Commencement Bay
Manke Lumber Company, Supplemental H 31,50011 10 10 0 4 6,200 6 20,400 Commencement Bay
Port of Silverdale M 3,950 1 0 0 0 0 1 3,950 Elliott Bay Brightwater Marine Outfall Corridor M 5,300 3 0 0 0 0 3 5,300 Elliott Bay, Port
Gardner Port of Seattle Fishermen’s Terminal H 47,79312 12 7 0 2 8,559 6 24,150 Elliott Bay
Port of Seattle Terminal 46 H 27,000 6 0 0 313 13,692 3 11,300 Elliott BayPort of Everett Marina 14th Street M 4,000 1 0 0 0 0 1 4,000 Port Gardner
USACE Upper Snohomish River O&M LM 200,000 12 0 0 0 0 12 200,000 Port Gardner, BU
Port of Bellingham Harris Ave. Shipyard H 15,432 6 0 0 0 0 6 15,432 Bellingham Bay, BU
USACE Quillayute Boat Basin O&M M 28,500 2 0 0 0 0 2 28,500 Upland
11 The net difference between the initial volume and the cumulative total volume (suitable + unsuitable) = 4,900 cy and reflects the differences in the pre-characterization/post-characterization survey estimates regarding total volume. 12 Volume reduced to 32,709 cy after testing initiated, after applicant withdrew the 15,084 cy within Area 2 of project area (4 DMMUs) from further DMMP consideration. 13 Bioaccumulation Triggers exceeded, and multiple SL exceedances. Applicant elected not to perform required biological testing, including bioaccumulation testing, and DMMUs determined to be unsuitable using BPJ.
Biennial Report DY 2004/2005 19 April 1, 2006
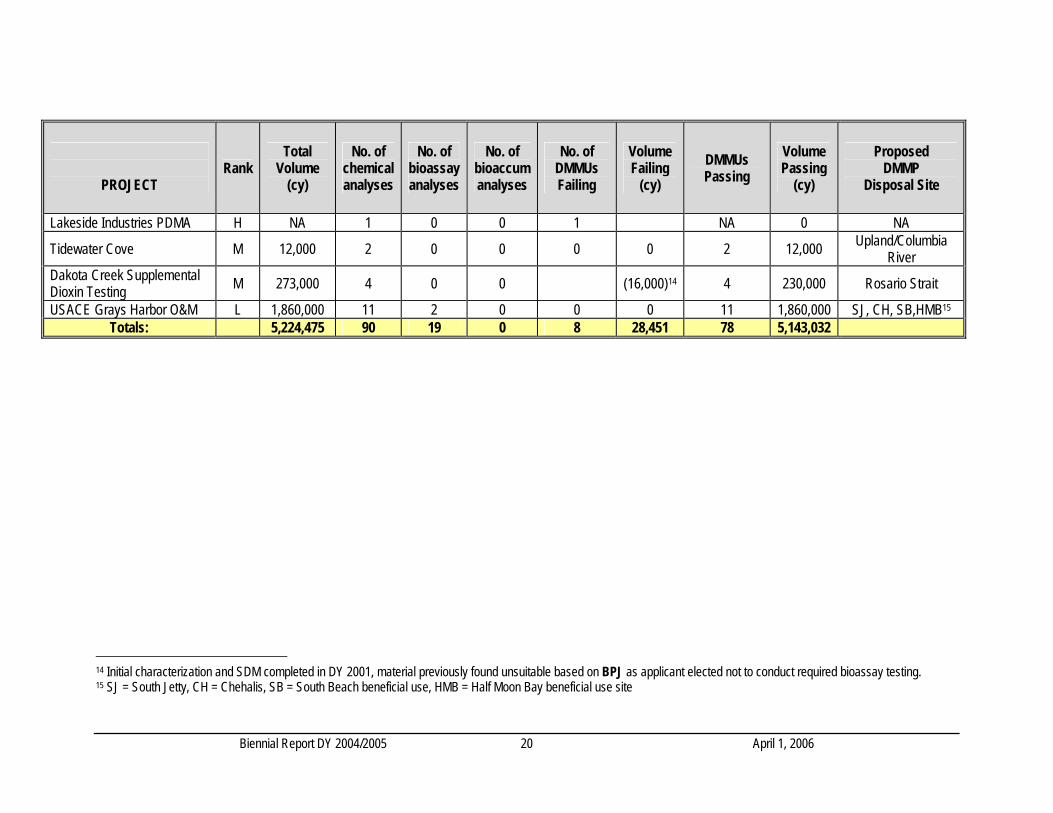
Biennial Report DY 2004/2005 20 April 1, 2006
PROJECT Rank
Total Volume
(cy)
No. of chemical analyses
No. of bioassay analyses
No. of bioaccum analyses
No. of DMMUs Failing
Volume Failing
(cy) DMMUs Passing
Volume Passing
(cy)
Proposed DMMP
Disposal Site
Lakeside Industries PDMA H NA 1 0 0 1 NA 0 NA
Tidewater Cove M 12,000 2 0 0 0 0 2 12,000 Upland/Columbia River
Dakota Creek Supplemental Dioxin Testing M 273,000 4 0 0 (16,000)14 4 230,000 Rosario Strait
USACE Grays Harbor O&M L 1,860,000 11 2 0 0 0 11 1,860,000 SJ, CH, SB,HMB15
Totals: 5,224,475 90 19 0 8 28,451 78 5,143,032
14 Initial characterization and SDM completed in DY 2001, material previously found unsuitable based on BPJ as applicant elected not to conduct required bioassay testing. 15 SJ = South Jetty, CH = Chehalis, SB = South Beach beneficial use, HMB = Half Moon Bay beneficial use site
CHAPTER 3 - SUMMARY AND ASSESSMENT OF DY04/05 DATA 3.1 SUMMARY OF CHEMICAL TESTING RESULTS Table 3-1 and Appendix C summarize the chemical testing results from DY 2004 and DY 2005. A total of 22 of the 58 DMMP COCs had screening levels exceeded for at least one project. These included both detected exceedances (22 COCs) and detection limit exceedances (2 COCs). Five COCs had detected concentrations above the BT; none were undetected above the BT. Two chemicals were detected above the ML, whereas none were undetected above the ML. Table 3-2 highlights those chemicals that had detected concentrations exceeding SL, BT and ML most often. Also included are those chemicals for which the detection limit exceeded the SL, BT, or ML. From Table 3-2 it can be seen that the chemicals most often detected above SL and BT included lead, mercury, TBT, Fluoranthene, and total PCBs. Only mercury, TBT, fluoranthene, pyrene, and PCBs were quantitated above BT in one or more projects. The chemicals for which detection limits were exceed where Total DDT and Dieldrin. Detection limit exceedances were generally inconsequential, because other detected SL exceedances generally triggered biological testing. There were no instances where detection limit exceedances of SLs triggered biological testing without co-occurring exceedances of at list one other detected chemical over SL (Appendix C). Concurrent biological testing was conducted for four projects including Port of Seattle East Waterway, Manke Lumber Company – Supplemental, Port of Seattle Fishermen’s Terminal and Grays Harbor O&M. During the two-year period covered by this report six projects were evaluated for beneficial uses disposal alternatives. A portion of the federal maintenance dredged material (315,000 cy) from the Upper Snohomish River was evaluated as suitable and used as capping material to remediate contaminated sediments at the Pacific Sound Resources CERCLA site in Elliott Bay. As part of the maintenance dredge of the USACE Keystone Ferry Terminal Lake Crockett Navigation Channel approximately 40,000 cy of dredged material from the project area was evaluated for beach renourishment, necessary to replenish sand normally deposited by littoral drift. A third project, the Bridgehaven Community Club Marina, was evaluated for beneficial use of approximately 2000 cy of dredged material to renourish the adjacent beach in Hood Canal. A fourth project proposed to provide material from a maintenance dredge in Basin and Channel Property Owners Association for beneficial use. 1200 cy of dredged sand and gravel from an existing access channel south of the confluence of Rendsland Creek and Hood Canal near Tahuya was evaluated for nourishment of an adjacent upper intertidal area. In the fifth project, the Port of Tacoma Blair Bridge Reach Widening, approximately 265,000 cy were evaluated for beneficial use. The sixth project, the Puget Sound Naval Shipyard, 24,254 cy were deemed suitable for use as capping material at the Pit-CAD site.
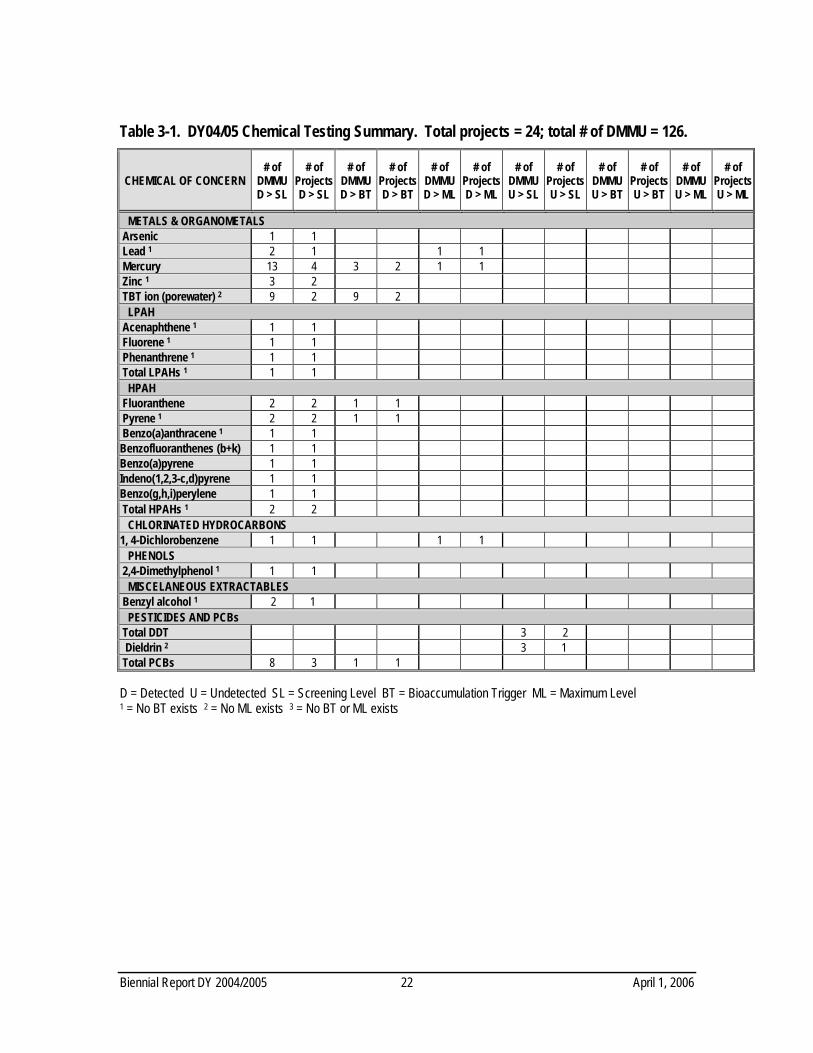
Table 3-1. DY04/05 Chemical Testing Summary. Total projects = 24; total # of DMMU = 126.
CHEMICAL OF CONCERN # of
DMMU D > SL
# of Projects D > SL
# of DMMU D > BT
# of Projects D > BT
# of DMMU D > ML
# of Projects D > ML
# of DMMU U > SL
# of Projects U > SL
# of DMMU U > BT
# of Projects U > BT
# of DMMU U > ML
# of ProjectsU > ML
METALS & ORGANOMETALS Arsenic 1 1 Lead 1 2 1 1 1 Mercury 13 4 3 2 1 1 Zinc 1 3 2 TBT ion (porewater) 2 9 2 9 2 LPAH Acenaphthene 1 1 1 Fluorene 1 1 1 Phenanthrene 1 1 1 Total LPAHs 1 1 1 HPAH Fluoranthene 2 2 1 1 Pyrene 1 2 2 1 1 Benzo(a)anthracene 1 1 1 Benzofluoranthenes (b+k) 1 1 Benzo(a)pyrene 1 1 Indeno(1,2,3-c,d)pyrene 1 1 Benzo(g,h,i)perylene 1 1 Total HPAHs 1 2 2 CHLORINATED HYDROCARBONS 1, 4-Dichlorobenzene 1 1 1 1 PHENOLS 2,4-Dimethylphenol 1 1 1 MISCELANEOUS EXTRACTABLES Benzyl alcohol 1 2 1 PESTICIDES AND PCBs Total DDT 3 2 Dieldrin 2 3 1 Total PCBs 8 3 1 1 D = Detected U = Undetected SL = Screening Level BT = Bioaccumulation Trigger ML = Maximum Level 1 = No BT exists 2 = No ML exists 3 = No BT or ML exists
Biennial Report DY 2004/2005 22 April 1, 2006
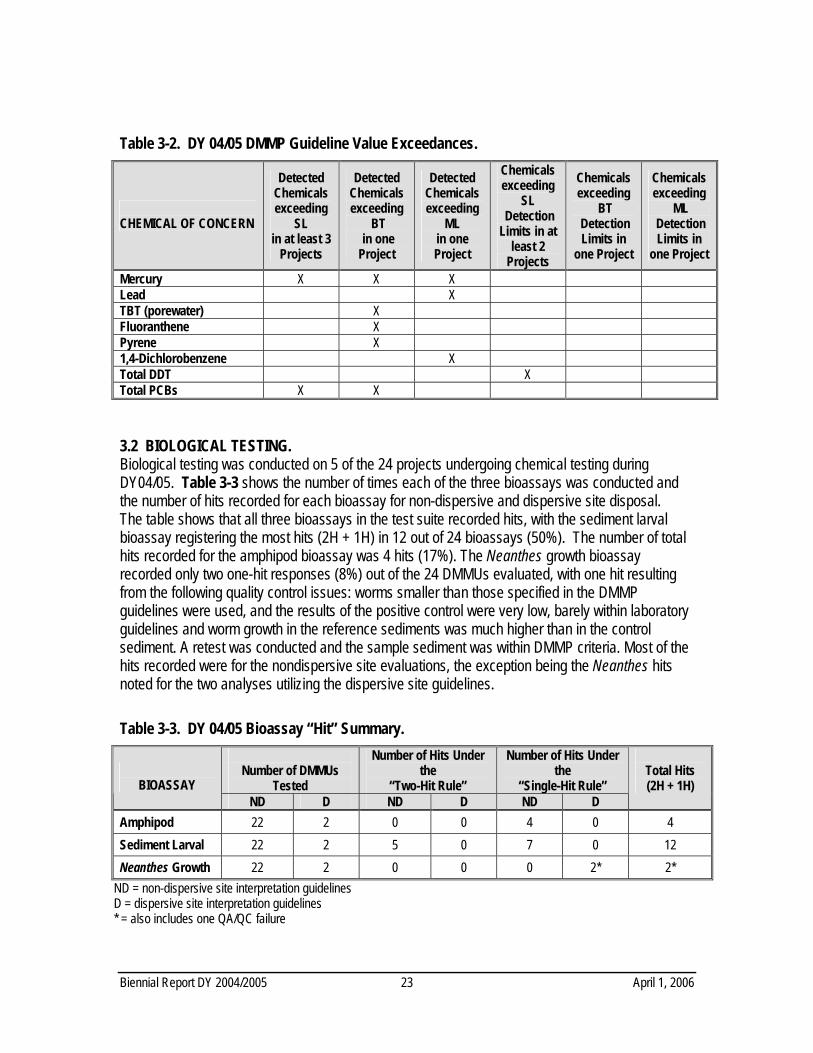
Table 3-2. DY 04/05 DMMP Guideline Value Exceedances.
CHEMICAL OF CONCERN
Detected Chemicals exceeding
SL in at least 3
Projects
Detected Chemicals exceeding
BT in one Project
Detected Chemicals exceeding
ML in one Project
Chemicals exceeding
SL Detection Limits in at
least 2 Projects
Chemicals exceeding
BT Detection Limits in
one Project
Chemicals exceeding
ML Detection Limits in
one Project
Mercury X X X Lead X TBT (porewater) X Fluoranthene X Pyrene X 1,4-Dichlorobenzene X Total DDT X Total PCBs X X
3.2 BIOLOGICAL TESTING. Biological testing was conducted on 5 of the 24 projects undergoing chemical testing during DY04/05. Table 3-3 shows the number of times each of the three bioassays was conducted and the number of hits recorded for each bioassay for non-dispersive and dispersive site disposal. The table shows that all three bioassays in the test suite recorded hits, with the sediment larval bioassay registering the most hits (2H + 1H) in 12 out of 24 bioassays (50%). The number of total hits recorded for the amphipod bioassay was 4 hits (17%). The Neanthes growth bioassay recorded only two one-hit responses (8%) out of the 24 DMMUs evaluated, with one hit resulting from the following quality control issues: worms smaller than those specified in the DMMP guidelines were used, and the results of the positive control were very low, barely within laboratory guidelines and worm growth in the reference sediments was much higher than in the control sediment. A retest was conducted and the sample sediment was within DMMP criteria. Most of the hits recorded were for the nondispersive site evaluations, the exception being the Neanthes hits noted for the two analyses utilizing the dispersive site guidelines. Table 3-3. DY 04/05 Bioassay “Hit” Summary.
Number of DMMUs
Tested
Number of Hits Under the
“Two-Hit Rule”
Number of Hits Under the
“Single-Hit Rule”
BIOASSAY ND D ND D ND D
Total Hits (2H + 1H)
Amphipod 22 2 0 0 4 0 4 Sediment Larval 22 2 5 0 7 0 12 Neanthes Growth 22 2 0 0 0 2* 2*
ND = non-dispersive site interpretation guidelines D = dispersive site interpretation guidelines * = also includes one QA/QC failure
Biennial Report DY 2004/2005 23 April 1, 2006
3.3 BIOACCUMULATION TESTING No bioaccumulation testing was conducted during the 2004 and 2005 dredging years covered by this report. 3.4 COST ANALYSIS Total Costs. Total sampling and testing costs are generally related to the size of the project
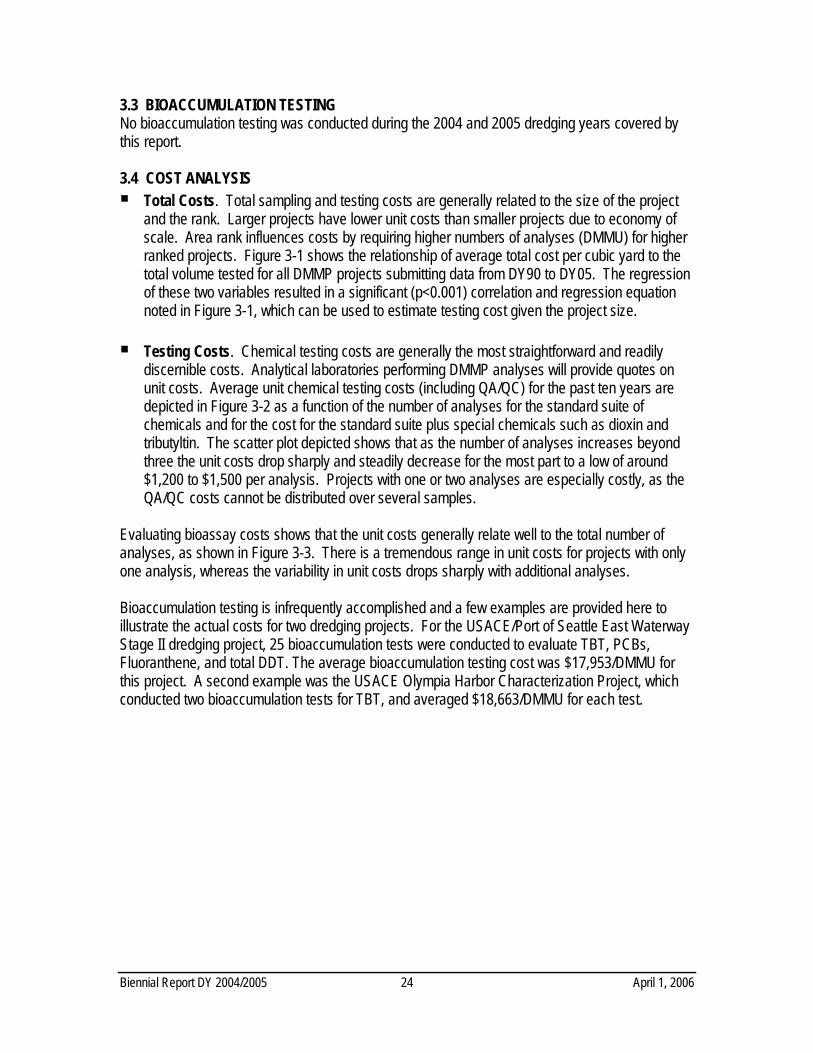
and the rank. Larger projects have lower unit costs than smaller projects due to economy of scale. Area rank influences costs by requiring higher numbers of analyses (DMMU) for higher ranked projects. Figure 3-1 shows the relationship of average total cost per cubic yard to the total volume tested for all DMMP projects submitting data from DY90 to DY05. The regression of these two variables resulted in a significant (p<0.001) correlation and regression equation noted in Figure 3-1, which can be used to estimate testing cost given the project size.
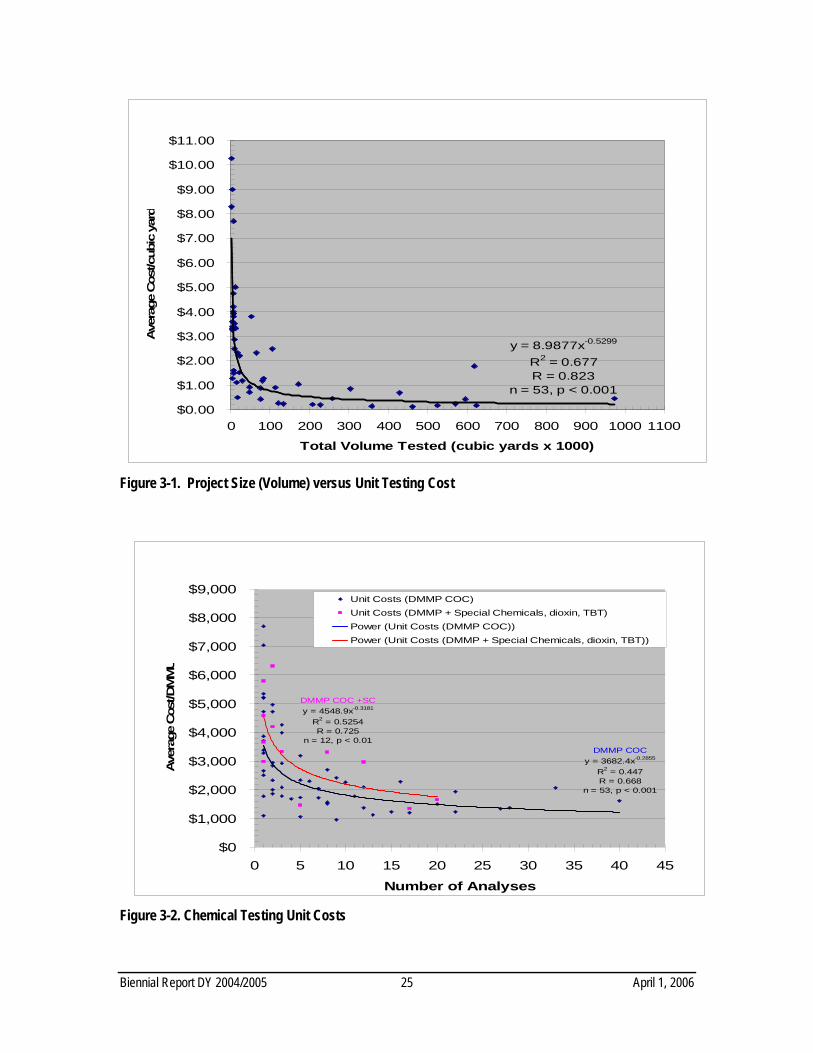
Testing Costs. Chemical testing costs are generally the most straightforward and readily
discernible costs. Analytical laboratories performing DMMP analyses will provide quotes on unit costs. Average unit chemical testing costs (including QA/QC) for the past ten years are depicted in Figure 3-2 as a function of the number of analyses for the standard suite of chemicals and for the cost for the standard suite plus special chemicals such as dioxin and tributyltin. The scatter plot depicted shows that as the number of analyses increases beyond three the unit costs drop sharply and steadily decrease for the most part to a low of around $1,200 to $1,500 per analysis. Projects with one or two analyses are especially costly, as the QA/QC costs cannot be distributed over several samples.
Evaluating bioassay costs shows that the unit costs generally relate well to the total number of analyses, as shown in Figure 3-3. There is a tremendous range in unit costs for projects with only one analysis, whereas the variability in unit costs drops sharply with additional analyses. Bioaccumulation testing is infrequently accomplished and a few examples are provided here to illustrate the actual costs for two dredging projects. For the USACE/Port of Seattle East Waterway Stage II dredging project, 25 bioaccumulation tests were conducted to evaluate TBT, PCBs, Fluoranthene, and total DDT. The average bioaccumulation testing cost was $17,953/DMMU for this project. A second example was the USACE Olympia Harbor Characterization Project, which conducted two bioaccumulation tests for TBT, and averaged $18,663/DMMU for each test.
Biennial Report DY 2004/2005 24 April 1, 2006
y = 8.9877x-0.5299
R2 = 0.677R = 0.823
n = 53, p < 0.001
$0.00
$1.00
$2.00
$3.00
$4.00
$5.00
$6.00
$7.00
$8.00
$9.00
$10.00
$11.00
0 100 200 300 400 500 600 700 800 900 1000 1100
Total Volume Tested (cubic yards x 1000)
Ave
rage
Cos
t/cub
ic y
ard
Figure 3-1. Project Size (Volume) versus Unit Testing Cost
DMMP COCy = 3682.4x-0.2855
R2 = 0.447R = 0.668
n = 53, p < 0.001
DMMP COC +SCy = 4548.9x-0.3181
R2 = 0.5254R = 0.725
n = 12, p < 0.01
$0
$1,000
$2,000
$3,000
$4,000
$5,000
$6,000
$7,000
$8,000
$9,000
0 5 10 15 20 25 30 35 40 45
Number of Analyses
Ave
rage
Cos
t/DM
MU
Unit Costs (DMMP COC)Unit Costs (DMMP + Special Chemicals, dioxin, TBT)Power (Unit Costs (DMMP COC))Power (Unit Costs (DMMP + Special Chemicals, dioxin, TBT))
Figure 3-2. Chemical Testing Unit Costs
Biennial Report DY 2004/2005 25 April 1, 2006
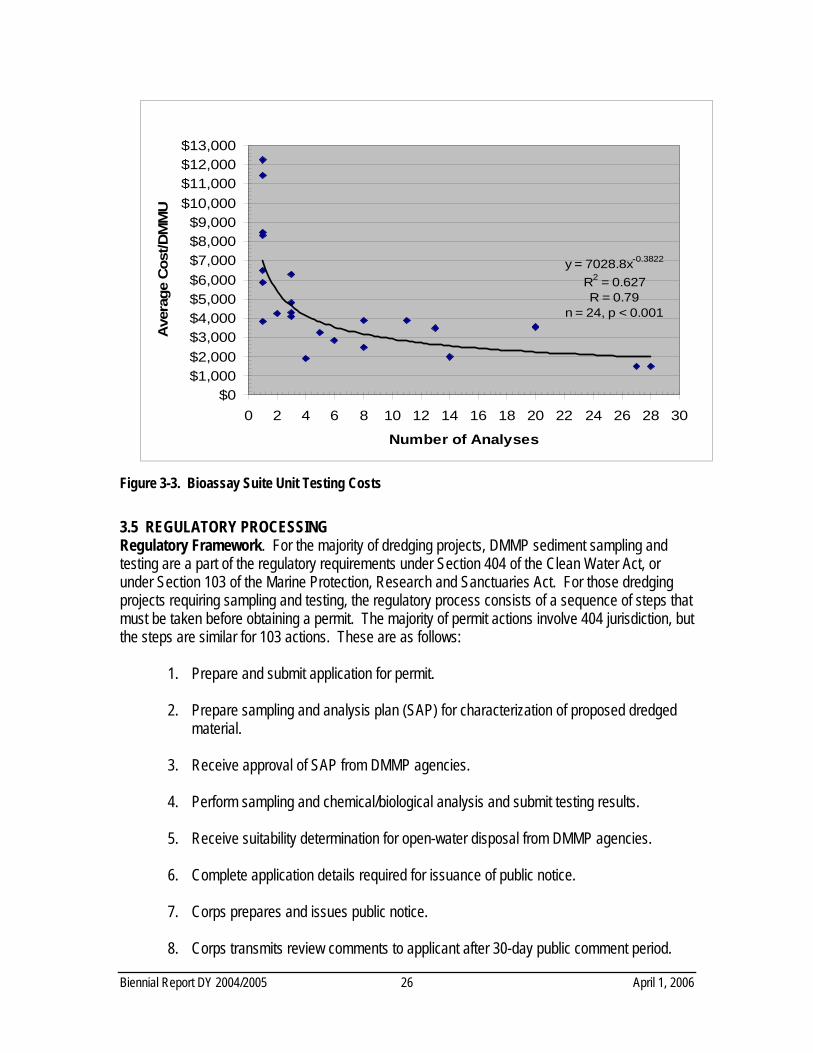
y = 7028.8x-0.3822
R2 = 0.627R = 0.79
n = 24, p < 0.001
$0$1,000$2,000$3,000$4,000$5,000$6,000$7,000$8,000$9,000
$10,000$11,000$12,000$13,000
0 2 4 6 8 10 12 14 16 18 20 22 24 26 28 30
Number of Analyses
Ave
rage
Cos
t/DM
MU
Figure 3-3. Bioassay Suite Unit Testing Costs
3.5 REGULATORY PROCESSING Regulatory Framework. For the majority of dredging projects, DMMP sediment sampling and testing are a part of the regulatory requirements under Section 404 of the Clean Water Act, or under Section 103 of the Marine Protection, Research and Sanctuaries Act. For those dredging projects requiring sampling and testing, the regulatory process consists of a sequence of steps that must be taken before obtaining a permit. The majority of permit actions involve 404 jurisdiction, but the steps are similar for 103 actions. These are as follows:
1. Prepare and submit application for permit.
2. Prepare sampling and analysis plan (SAP) for characterization of proposed dredged material.
3. Receive approval of SAP from DMMP agencies.
4. Perform sampling and chemical/biological analysis and submit testing results.
5. Receive suitability determination for open-water disposal from DMMP agencies.
6. Complete application details required for issuance of public notice.
7. Corps prepares and issues public notice.
8. Corps transmits review comments to applicant after 30-day public comment period.
Biennial Report DY 2004/2005 26 April 1, 2006
9. Applicant provides Corps with responses to public comments.
10. Corps completes public interest review, 404(b)1 evaluation, NEPA documentation and
issues permit decision. The average time requirements for steps 3 through 5 are included in Figure 3-4, which was constructed using data from processing activities occurring in DY04/05 Permit Preparation and Submittal. An application (JARPA, or Joint Aquatic Resources Permit Application) for a Corps of Engineers Section 10/404 permit for dredging and dredged material disposal is usually submitted before any DMMP processing takes place. An application number and Regulatory Branch Project Manager are assigned when an application is submitted and the Dredged Material Management Office begins review of information relevant to the proposed dredging. Permit preparation is part of the regulatory process, but completely within the control of the permit applicant, so is not included in the analysis of processing time.
1. Sampling and Analysis Plan Development. A sediment sampling and analysis plan must be developed and submitted to the DMMP agencies for review prior to commencement of field sampling. The time required for SAP development is highly variable and almost completely within control of the dredging applicant. In many cases a permit application is submitted at the same time as a draft SAP, while in other cases a permit application is submitted long before development of a SAP begins.
2. Sampling and Analysis Plan Approval. Once a sediment SAP has been submitted, the
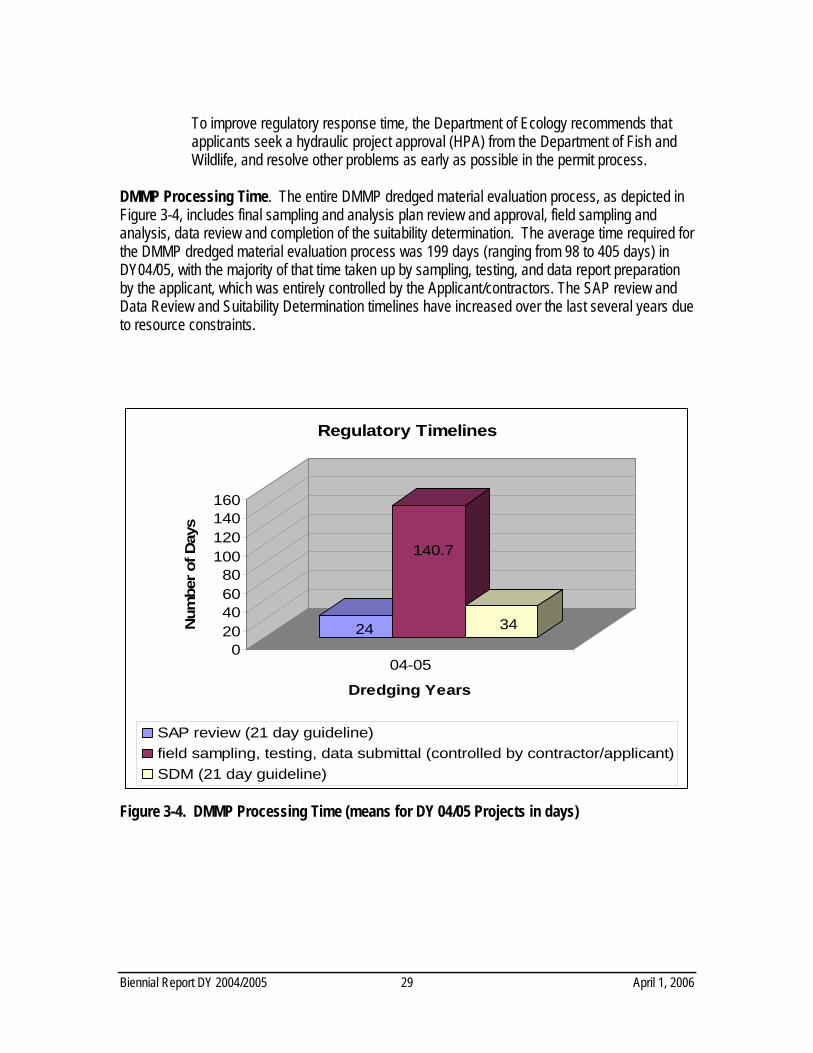
DMMO coordinates review with the other DMMP agencies: EPA, DNR and Ecology. An approval letter, which includes DMMP agency comments and recommends modifications to the SAP, is then sent to the applicant. Once the applicant, via telephone, letter or e-mail, has accepted these comments and modifications sampling and analysis may proceed. It is the goal of the DMMO to complete the review of SAPs within three weeks. During DY 04/05 the average time from the submittal of the final SAP for a project to SAP approval was 24 days, which exceeded the target review time by 3 days, due to staff resource constraints.
3. Sampling and Analysis. During this phase, field sampling and chemical/ biological
analysis are completed following the protocols established in the approved SAP. Data are compiled and submitted in a hard copy report. A Corps contractor enters these data into the Dredged Analysis Information System. Sampling, testing and reporting consume a substantial portion of the DMMP Process time budget, averaging 138 days during DY 04/05. This is one of the project phases with the highest degrees of variability, with sampling and analysis taking anywhere from 53 to 383 days during this 2 year time period. Factors influencing the time required for this phase include weather, sampling difficulties, laboratory capacity and turn-around, QA problems arising during chemical and biological testing, and report compilation time. Those projects that included bioassays had longer turn-around times.
Biennial Report DY 2004/2005 27 April 1, 2006
4. Data Review. Once a full set of chemical/biological testing data is submitted along with the sampling report, the DMMO conducts a data review with the other DMMP agencies. The result of this review is the signing, by DMMP agency representatives, of a Memorandum for Record documenting the determination reached on the suitability/unsuitability of each of the dredged material management units defined in the approved SAP. The goal of the DMMO is to complete this review within three weeks of data submittal, though several projects during this biennium required a much longer review time that skewed the average up to over two months. In DY04/05, the average time required was 34 days. In many cases, this review was much shorter; time needed during this biennium ranged from 1 day to 140 days, with most projects in the middle of that range. The longest reviews usually involve complications such as a change in dredge volume or especially large or complex data sets. The average target of 21 days was exceeded by 13 days due in part to resource constraints and staff turnover.
5. Complete Permit Application. Once the suitability determination has been signed, the
DMMO submits a copy to the Corps Regulatory Branch project manager who then prepares to issue a public notice. However, if project details have not been fully developed by this time, or if project plans are modified subsequent to the suitability determination, new drawings or other information may be required of the applicant prior to the preparation of the public notice. In other cases, the applicant may not have yet obtained a shoreline development permit and a decision may be made to wait to go out to public notice until the local shoreline jurisdiction has issued a permit.
6. Prepare and Issue Public Notice. By regulation, the Regulatory Branch must issue a
public notice within fifteen days of the completion of the permit application.
7. Public Comment Period and Transmittal of Review Comments. A DMMP project typically undergoes a 30-day public comment period. Comments received during this period are collated by the Corps Regulatory project manager and are transmitted to the applicant for response.
8. Applicant Responds to Review Comments. The permit applicant is responsible for
providing written responses to public review comments to the Corps before the Regulatory Branch project manager can complete a public interest review.
9. Corps Completes Public Interest Review and Makes Permit Decision. The public
interest review, including a Section 404(b)(1) alternatives analysis and NEPA evaluation, is completed and documented after the permit applicant provides responses to review comments. The Corps project manager prepares a permit decision upon completion of the public interest review.
This stage of the process may be very time consuming. Dredging and DMMP processing are often only part of complex projects. Other elements may be involved, such as wetland fills, eelgrass bed impacts or Endangered Species Act issues. The addition of several species to the list of threatened and endangered species in Western Washington has led to a substantial backlog in permit review and approval.
Biennial Report DY 2004/2005 28 April 1, 2006
To improve regulatory response time, the Department of Ecology recommends that applicants seek a hydraulic project approval (HPA) from the Department of Fish and Wildlife, and resolve other problems as early as possible in the permit process.
DMMP Processing Time. The entire DMMP dredged material evaluation process, as depicted in Figure 3-4, includes final sampling and analysis plan review and approval, field sampling and analysis, data review and completion of the suitability determination. The average time required for the DMMP dredged material evaluation process was 199 days (ranging from 98 to 405 days) in DY04/05, with the majority of that time taken up by sampling, testing, and data report preparation by the applicant, which was entirely controlled by the Applicant/contractors. The SAP review and Data Review and Suitability Determination timelines have increased over the last several years due to resource constraints.
24
140.7
34
020406080
100120140160
Num
ber o
f Day
s
04-05
Dredging Years
Regulatory Timelines
SAP review (21 day guideline)field sampling, testing, data submittal (controlled by contractor/applicant)SDM (21 day guideline)
Figure 3-4. DMMP Processing Time (means for DY 04/05 Projects in days)
Biennial Report DY 2004/2005 29 April 1, 2006
CHAPTER 4 - UNUSUAL AND/OR COMPLEX PROJECTS The following discussion includes unusual or complex projects requiring explanation beyond the summaries provided in Chapters 1 and 2 for ranking, sampling plan development, chemical testing, biological testing, or those for which the DMMP agencies used Best-Professional-Judgment (BPJ). 4.1. DREDGING YEAR 2004 4.1.1. Port of Seattle East Waterway Recency Characterization Materials testing in East Waterway discussed here was ranked high for initial testing and recency evaluation. The materials discussed here were initially found suitable during the East Waterway, Terminal 18 sampling effort conducted during March 1996 (March 17, 1997 Suitability Determination). The results of the retesting of three DMMUs are discussed here. Chemical analysis of the three DMMUs indicated that mercury was quantitated over the SL in 2 of 3 DMMUs analyzed, whereas PCBs were quantitated over the SL in all 3 DMMUs, and over the BT in one DMMU. Dieldrin exceeded the screening level, but was undetected in all three DMMUs, and DDT was undetected over the screening level in two of three DMMUs. All three DMMUs tested underwent concurrent bioassay toxicity testing and the results of these analyses are summarized below. Standard bioassay testing was conducted on the three DMMUs within the 56 day biological holding time. Appendix B summarizes the solid phase bioassay Quality Control (QC) performance guidelines and also summarizes the solid phase bioassay interpretative guidelines for nondispersive sites, which were used to evaluate the bioassay data presented below. Table 4-1 summarizes the batch specific bioassay toxicity testing outcomes for the 3 DMMUs tested. Three reference samples were collected from Carr Inlet to block for grain size effects, but only one was utilized in the bioassay interpretation (e.g., CR-23). In general, all negative control and reference sediments met the DMMP performance limits for each of the three bioassay tests to assess toxicity. These bioassay results are discussed below for each of the bioassay tests.
1. Amphipod Bioassay (Eohaustorius estuarius). All three DMMUs showed single-hit responses for the amphipod bioassay. Interstitial total ammonia concentrations measured at the initiation of the test on day 0 were greater than 30 mg/l for two of the three DMMU tested (e.g., COMP-9 = 40 mg/l; COMP-11 = 50 mg/l). However, the applicant did not run an Ammonia LC50 to validate the sensitivity of Eohaustorius to Ammonia concentrations observed in the sediments, as required by the DMMP. Although it is likely that ammonia may have contributed to some of the toxicity observed, the significance of this observation remains unsubstantiated without direct toxicity information.
2. Bivalve Larval Bioassay (Mytilus galloprovincialis). The results of the larval bivalve test showed that two of the three DMMUs tested showed relatively low normalized combined percent mortality and abnormality (NCMA), but DMMU COMP-11 demonstrated a single-hit response relative to the reference sediment.
3. Neanthes 20-day Growth Bioassay (Neanthes arenaceodentata). The results of the Neanthes growth bioassay (Table 4-1) showed generally low mortality in tested sediments,
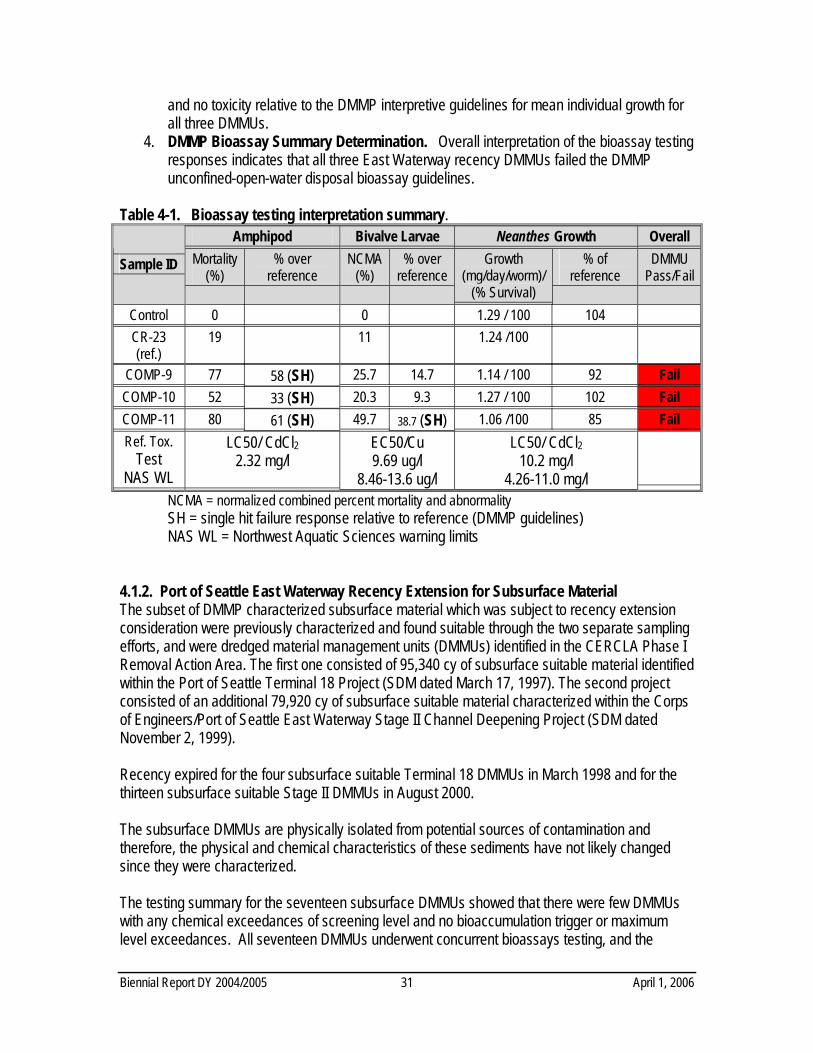
and no toxicity relative to the DMMP interpretive guidelines for mean individual growth for all three DMMUs.
4. DMMP Bioassay Summary Determination. Overall interpretation of the bioassay testing responses indicates that all three East Waterway recency DMMUs failed the DMMP unconfined-open-water disposal bioassay guidelines.
Table 4-1. Bioassay testing interpretation summary.
Amphipod Bivalve Larvae Neanthes Growth Overall
Sample ID Mortality (%)
% over reference
NCMA (%)
% over reference
Growth (mg/day/worm)/
(% Survival)
% of reference
DMMU Pass/Fail
Control 0 0 1.29 / 100 104 CR-23 (ref.)
19
11
1.24 /100
COMP-9 77 58 (SH) 25.7 14.7 1.14 / 100 92 Fail COMP-10 52 33 (SH) 20.3 9.3 1.27 / 100 102 Fail COMP-11 80 61 (SH) 49.7 38.7 (SH) 1.06 /100 85 Fail Ref. Tox.
Test NAS WL
LC50/ CdCl22.32 mg/l
EC50/Cu 9.69 ug/l
8.46-13.6 ug/l
LC50/ CdCl210.2 mg/l
4.26-11.0 mg/l
NCMA = normalized combined percent mortality and abnormality SH = single hit failure response relative to reference (DMMP guidelines) NAS WL = Northwest Aquatic Sciences warning limits 4.1.2. Port of Seattle East Waterway Recency Extension for Subsurface Material The subset of DMMP characterized subsurface material which was subject to recency extension consideration were previously characterized and found suitable through the two separate sampling efforts, and were dredged material management units (DMMUs) identified in the CERCLA Phase I Removal Action Area. The first one consisted of 95,340 cy of subsurface suitable material identified within the Port of Seattle Terminal 18 Project (SDM dated March 17, 1997). The second project consisted of an additional 79,920 cy of subsurface suitable material characterized within the Corps of Engineers/Port of Seattle East Waterway Stage II Channel Deepening Project (SDM dated November 2, 1999). Recency expired for the four subsurface suitable Terminal 18 DMMUs in March 1998 and for the thirteen subsurface suitable Stage II DMMUs in August 2000. The subsurface DMMUs are physically isolated from potential sources of contamination and therefore, the physical and chemical characteristics of these sediments have not likely changed since they were characterized. The testing summary for the seventeen subsurface DMMUs showed that there were few DMMUs with any chemical exceedances of screening level and no bioaccumulation trigger or maximum level exceedances. All seventeen DMMUs underwent concurrent bioassays testing, and the
Biennial Report DY 2004/2005 31 April 1, 2006
results confirmed that all DMMUs passed the nondispersive disposal site testing guidelines. All DMMUs were found suitable for unconfined-open-water disposal at the Elliott Bay disposal site. Based on the discussion above the DMMP agencies concluded, based on BPJ, that extending the recency expiration date for these data to August 2005 was warranted based on the facts presented. 4.1.3. Puget Sound Naval Shipyard Turning Basin Material Recency Extension and Beneficial Uses Determination The following summary provided a recency extension determination by the Dredged Material Management Program (DMMP) Agencies' (U.S. Army Corps of Engineers, Department of Ecology, Department of Natural Resources, and the Environmental Protection Agency) on 24,254 cubic yards of dredged material from the Turning Basin for use as capping material on impacted State Owned Aquatic Lands (SOAL) within OU-B at the CERCLA Pit-CAD site in Sinclair Inlet. This recency extension determination augments the final 21 March 2000 SDM and August 2001 Supplemental SDM, which previously evaluated the suitability of 160,120 cy of the turning basin material for beneficial use capping material around the Pit-CAD site, as an alternative to disposal at the Elliott Bay disposal site. This evaluation focuses on eleven DMMUs within the previously characterized Turning Basin footprint. This material was characterized during 1999, and all eleven DMMUs were found to be suitable for unconfined open-water disposal, and these data were re-evaluated in 2001 relative to the SMS guidelines for potential beneficial use placement alternatives at the Pit-CAD site. The 2001 data re-evaluation noted that the 40 DMMUs were suitable as capping material at the Pit-CAD site. The recency date expired for the eleven remaining DMMUs on October 2001. A review of the 1999 chemical testing results for the eleven remaining DMMUs identified for potential beneficial reuse as capping material are briefly summarized as follows: Ten of eleven DMMUs had no chemical SL exceedances, whereas the remaining DMMU (S4) had detected exceedances of the mercury SL and SMS SQS, and CSL, and was quantitated at 0.733 ppm-dry weight . No other chemical exceedances were noted for this DMMU. All eleven DMMUs were subject to bioassay testing and those results are summarized below. A summary of the 1999 DMMP bioassay testing conducted on the eleven DMMUs are briefly discussed below. In summary, the DMMP agencies using weight of evidence and BPJ concluded that the amphipod testing results indicated that two DMMUs had two-hit responses from Eohaustorius estuarius, whereas the remaining 9 DMMUs had no-hit responses from the amphipod, Ampelisca abdita bioassay. Seven DMMUs exhibited bivalve larval bioassay two-hit responses, whereas four DMMUs had no-hit responses. All eleven DMMUs exhibited no-hit responses for the Neanthes 20-day growth bioassay. In conclusion, all eleven DMMUs passed the nondispersive disposal site interpretation guidelines for bioassays. Interpretation of the bioassay testing results relative to SMS guidelines results in the following outcomes. All eleven DMMUs were below the Neanthes SQS guidelines, and nine out of eleven were below the Amphipod (Ampelisca abdita) SQS guidelines, whereas two DMMUs, exceeded the SQS interpretation guidelines (Eohaustorius estuarius), but did not exceed the CSL interpretation guidelines. Eight of eleven DMMUs were below the bivalve larval SQS guidelines,
Biennial Report DY 2004/2005 32 April 1, 2006
whereas the remaining three DMMUs exceeded the bivalve larval bioassay SQS guidelines, but did not exceed the CSL guidelines. None of the DMMUs had more than one SQS hit, and there were a sum total of five DMMUs with SQS bioassay exceedances. There have been no documented “changed” conditions such as accidental spills or new discharges in the vicinity of the Turning Basins. The surface material characterized within the Turning basin composited material from the sediment surface down to four feet in depth relative to the mudline. Portions of ten of eleven DMMUs discussed herein have been dredged and therefore partially removed leaving predominantly the underlying 2 feet of material, except one DMMU. Therefore, the sediment quality of the fraction remaining is not really known, but is considered suitable by the DMMP in consideration of the generally low chemical-of-concern concentrations in the sediments, and based on best-professional-judgment. There is no reason-to-believe that the suitability of the sediments previously evaluated has changed since the previous characterization. The DMMP agencies accepted all the data discussed herein as sufficient using BPJ to extend the recency determination date from October 2001 to October 2004. Based on the SMS evaluation of the previous testing results and the CSL exceedance of Hg in one DMMU coupled with the SQS bioassay exceedance, the DMMP agencies do not recommend the use of the 2,455 cy of material from this DMMU for proposed remediation on SOAL. The remaining 21,799 cubic yards of potential dredged material within the remaining 10 DMMUs were deemed suitable by the DMMP agencies within this area based on BPJ. 4.2. DREDGING YEAR 2005 4.2.1. Port of Seattle Terminal 46 The project was ranked high for testing purposes. The sampling design called for collecting subsamples from within six DMMUs representing a potential dredging prism of 27,000 cy within the proposed dredging area. An additional DMMU located between Stations 7+00 and 24+00 consisting primarily of riprap with very little sediment representing approximately 4,900 cy of riprap material was excluded from the characterization effort with the concurrence of the DMMP agencies. Sampling within the six DMMUs commenced on March 22, 2004, and six Vibracore samples (two within each DMMU) were collected successfully within three DMMUs (DMMU-1, DMMU-2 and DMMU-3). However, repeated attempts to collect the required core samples at DMMUs 5 and 6 were unsuccessful due to the rocky substrate, which extended over both DMMUs. The decision was made to use divers to collect samples at these locations and at under-pier DMMU-4 on March 25. At DMMU 6 divers reported only a few inches of material overlying the riprap and rocky substrate. They were forced to modify their proposed sampling approach and used a scoop to collect material at 4 locations within the two DMMUs, as deep as possible between the riprap, which amounted to about 2 inches of material on average at DMMUs 5 and 6. Due to presence of extensive riprap at DMMU 4, they were forced to resort to diver core samples of approximately 1 foot in depth at four locations within the DMMU. The composited samples were collected for both chemistry and potential biological testing. A tiered testing approach was initially proposed, and all samples for potential biological testing were archived at 4oC pending completion of the chemical analyses.
Biennial Report DY 2004/2005 33 April 1, 2006
Chemical analysis of the six DMMUs indicated that three of the DMMUs had no detected or undetected exceedances of chemicals of concern. For the remaining three DMMUs, one had mercury SL exceedances, and two had TBT SL exceedances, one had a 1,4-Dichlorobenzene SL exceedances, one had 2,4-Dimethylphenol, and two had Benzyl Alcohol exceedances. Bioaccumulation Triggers were exceeded for Mercury in one DMMU and in two DMMUs for TBT. The three remaining DMMUs therefore each required both bioassays and bioaccumulation testing to render a determination on suitability for unconfined-open-water disposal. The Port of Seattle determined that due to concerns about testing interfering with the tight construction schedule, they opted to not complete the biological testing. Therefore, DMMUs 3, 4, and 5, are considered unsuitable for unconfined open-water disposal based on BPJ without completing the required biological testing. The uncharacterized DMMU located between Stations 7+00 and 24+00 consisted predominately of riprap and is bounded on both sides by unsuitable material in DMMU-3, DMMU-4, and DMMU-5. Because of the concern for sediments bound to the riprap within the uncharacterized DMMU, the DMMP agencies are concerned about the potential suitability of this riprap for an upland beneficial use without some kind of washing to clean or remove the sediment bound to the riprap. The heavy concentration of riprap in unsuitable DMMU 5 also limits its utility for upland reuse, and all this material should be disposed of at an Ecology approved upland site. 4.2.2. Lakeside Industries – Post Dredge Surface Sediment Characterization The agencies are charged with determining the suitability of the post-dredge sediment surface quality after dredging approximately 142 cubic yards of spilled sand and gravel to restore water depths for barges docking at the pier. The sand/gravel spill material was not tested, but was considered by the DMMP to be clean material using BPJ. This material was dredged and subsequently disposed upland at an Ecology approved upland site. The DMMP agencies required a sediment quality assessment of the post-dredge sediment surface based on a “reason-to-believe” after Ecology’s SEDQUAL Sediment Quality Database showed a nearby station with 15 chemical CSL exceedances. The project was ranked high (Salmon Bay) for testing purposes, and the Corps permit special condition required a sediment quality assessment of the top 10 cm of surface sediment following dredging of the sand/gravel spill material. A van Veen grab was used to collect a representative composited sample of the surface material at a single location. Chemical analysis of the single sample indicated that from a DMMP perspective there were eleven detected screening level exceedances (Acenaphthene, Fluorene, Phenanthrene, 2-methylnapthalene, Total LPAH, Fluoranthene, Pyrene, Benzo(a)anthrancene, Chrysene, Total HPAH, Dibenzofuran), four detection limit exceedances (Hexachlorobenzene and N-Nitrosodiphenylamine, 1,2-Dichlorobenzene, 1,2,4-Trichlorobenzene), and a single bioaccumulation trigger exceedance (Fluoranthene) of DMMP Guidelines. From an SMS perspective there were seven SQS exceedances (Naphthalene, Total HPAH, Benzo(a)anthracene, Benzo(a)pyrene, Total Benzofluoranthenes, Chrysene, and Indeno(1,2,3-cd)pyrene) and seven detected CSL exceedances (Total LPAH, Acenaphthene, Fluorene, Phenanthrene, 2-Methylnaphthalene, Benzo (k) fluoranthene, Dibenzofuran), and four undetected CSL exceedances (Hexachlorobutadiene, Hexachlorobenzene, Butylbenzylphthalate, and 2,4-Dimethylphenol) within the sediment surface. TOC was quantitated at 0.7 %. No biological testing was performed on this
Biennial Report DY 2004/2005 34 April 1, 2006
sample, and therefore from a DMMP perspective, the new exposed sediment surface represents a degraded sediment quality compared to the predredging surface. From an SMS perspective the sediment quality exceeds the Washington Department of Ecology’s anti-degradation standard using BPJ. The results of the single composited surface sample representing the post-dredge sediment surface layer failed to meet acceptable state sediment quality guidelines as specified by the DMMP program (http://www.nws.usace.army.mil/publicmenu/DOCUMENTS/Antidegradation_Clarif.pdf), which is the Washington State anti-degradation policy. The results of this analysis have been sent to Ecology’s Toxics Cleanup Program for enforcement action. 4.2.3. Manke Lumber Company – Supplemental Characterization The area outlined in this DMMP evaluation was subject to an earlier DMMP characterization and suitability determination dated 10 October 2000, which indicated that 10 of 27 DMMUs evaluated were suitable for unconfined open-water disposal. Dredging of all surface suitable DMMUs from the 2000 SDM have been completed. Approximately 31,500 cy of material from 13 DMMUs remains to be addressed under the requirements of the MTCA Consent Decree, and were the focus of the DMMP characterization summarized below. Of the 11 remaining DMMUs, three underwent DMMP chemical characterizations, and 10 DMMUs underwent concurrent bioassay testing. The results of the chemical analyses of the three DMMUs indicated that only one chemical, mercury, exceeded the DMMP SL in 2 of the 3 DMMUs, both quantitated at 0.6 ppm (, and below the bioaccumulation trigger.) The DMMU with no chemical guideline exceedances was not subject to biological testing. The biological testing results are summarized below. The three Carr Inlet reference samples utilized for toxicity testing (wet sieving estimates for fines: 17%, 48%, and 80%) were run concurrently with the test sediment, and met the performance objective for both amphipod mortality (Eohaustorius estuaries) and Neanthes growth bioassays. However, in the bivalve larval bioassay (Mytilus galloprovincialis), all three reference sediments failed the PSEP protocol quality control performance standard for reference sediment. Examination of the water quality parameters associated with this test indicated that ammonia and sulfide did not appear to be responsible for the apparent reference sediment performance problems. After consultation, the DMMP agencies agreed to allow a retest using a screen tube inserted into the test beakers to keep the larvae off of the soft sediments. The first retest with the screen tubes used a mesh size of 37 millimicrons and the reference sediments again failed to meet the performance QA standard. In evaluating the reasons for the performance standard Bill Gardiner (MEC) felt the larvae were smaller than the screen mesh of 37 millimicrons and were passing through the screen. He indicated that the problems with the test could be remedied by rerunning the test with a screen tube mesh size of 25 millimicrons. The recommended DMMP holding time for conducting bioassays (56 days) was exceeded by 20 days for the second retest with the smaller mesh size. The holding time exceedance was acknowledged by the DMMO as a serious concern and issue, but David Kendall indicated that because the primary chemical constituent being evaluated was TVS and not likely to be affected by the extended holding time, the retest could
Biennial Report DY 2004/2005 35 April 1, 2006
proceed16. The retest results would be evaluated with BPJ. The results of the second retest with the smaller mesh size indicated that two of the three reference samples met the performance standard and that these results were deemed valid for decision making using BPJ.
1. Amphipod Bioassay (Eohaustorius estuarius). Amphipod bioassays were conducted during the initial testing on 10 DMMUs. The results indicate that for the amphipod bioassay, all ten DMMUs exhibited no-hit responses and passed the nondispersive disposal site guidelines.
2. Neanthes 20-day Growth Bioassay (Neanthes arenaceodentata). For the Neanthes
growth bioassay nine of the ten DMMUs passed the nondispersive open-water disposal guidelines, whereas one DMMU scored a 2-hit response using BPJ.
3. Bivalve Larval Bioassay (Mytilus galloprovincialis). The results of the PSEP protocol failing reference performance guidelines are discussed below. The results of the first test with the screen tubes indicated that they also failed the reference performance guidelines, and were subject to a retest. The results of the second test with the screen tubes using the smaller (25 millimicron) mesh size indicated that six of ten DMMUs passed the nondispersive disposal guidelines, whereas one scored a 2-hit response, whereas, three DMMUs scored 1-hit responses for this bioassay. Therefore, collectively DMMU AML-A9
16 A subsequent discussion ensued where the biological testing problems with the bivalve larval sediment bioassay were discussed by the DMMP staff with Dr. Jack Word (MEC) and Clay Patmont (Anchor Environmental). The suitability determination stated that the 20 day holding time exceedance was not a serious concern because TVS was likely the only major constituent being expressed in the sediments tested and the holding time exceedance was not likely to reduce the toxicity due to this parameter in the sediments.
This in reality may be just one potential explanation. Tom Gries (Ecology) indicated that there were also two other plausible alternative reasons why we might have had concerns about the holding time exceedance:
a. Allowing a longer holding time of 20 extra days could also result in more volatilization of toxic
wood-related toxicants, thereby reducing toxicity being expressed in the 2nd Retest. b. Unmeasured wood-related toxicants would have had more time to biodegrade to levels below
(unknown) toxicity thresholds, thereby reducing toxicity in the 2nd Retest. Gries indicated that had he been available during the discussion on whether a retest would be authorized with the holding time exceedance, he might not have been willing to go along with the second retest without resampling. He was not around when the decision was made and the retest was allowed to proceed.
We will never know from these analyses if either of the two alternative hypotheses described above might have been true. However, if the increased holding time that was allowed for this project had resulted in an inappropriate reduction in contaminant concentrations and toxicity - explaining the second retest results - then it is also clear that the toxicity observed in the first round was short-lived. This “worst case scenario” of short-lived toxicity was an important point that DMMP agency staff discussed prior to making the suitability determination for this dredged material. It helped the DMMP conclude that the material is not at all likely to cause exceedances of biological conditions allowed at non-dispersive disposal sites.
Biennial Report DY 2004/2005 36 April 1, 2006
had two bioassay responses scoring 2-hit responses (e.g., Neanthes and bivalve larval bioassay), resulting in a failure to pass the nondispersive disposal guidelines. The three 1-hit responses for DMMUs failed the nondispersive disposal guidelines.
4. DMMP Bioassay Determination. Overall, interpretation of the ten DMMUs characterized,
six DMMUs exhibited bioassay responses that were suitable for unconfined open-water disposal (UOWD) and 4 exhibited responses that were unsuitable for UCOWD.
4.2.4. Port of Seattle Fishermen’s Terminal The Fishermen’s Terminal is currently undergoing major reconstruction and upgrades, to increase fairway widths, more side-tie moorage and longer slips, and higher voltage/amperage services to better match the projected demand from the commercial fishing fleet. The project was ranked high (Salmon Bay) for testing purposes, and the two proposed dredging subareas (Area 1 and Area 2) were initially sampled for a DMMP and SMS evaluation. Area 2 was subsequently withdrawn from consideration due to budgetary constraints by the Port of Seattle. The applicant’s contractor provided additional information on bioassay testing concerns in freshwater sediments as a response to the DMMP SAP comment/approval letter. The DMMP agencies subsequently agreed to compare porewater TBT results from acclimated sediments to the SL and BT (0.15 ug/L) for determining the need for subsequent bioaccumulation testing requirements. Chemical analysis results for the tested twelve DMMUs indicated that there were seven detected exceedances of the DMMP SL guideline for mercury, two exceedances each of the SLs for lead and zinc and four detected exceedances of the SL for Total PCBs. In addition, there were seven exceedances of the porewater SL for TBT in the unacclimated samples but only two exceedances of the porewater SL for TBT in acclimated samples. Comparison to SMS standards indicated that there was one exceedance of the SQS (only) and six exceedances of the CSL for mercury, along with one exceedance each of the SQS and CSL for lead. There were also two exceedances of the SQS for zinc and one exceedance of the SQS for Total PCBs. Finally, there were nine exceedances of the recommended no effects level for porewater TBT (0.05 ug/L) in unacclimated samples, but only six exceedances of this value for acclimated samples.
The agencies agreed to allow the applicants to acclimate the test samples to the saline conditions required by toxicity test protocols until such time as any accumulated ammonia had declined to stable and acceptable levels, prior to biological testing. The acclimation showed that full acclimation occurred by day 31 with a dramatic decrease in ammonia concentrations. Biological testing commenced after acclimating for 31 days. Appendix B provides the bioassay interpretation/performance requirements for the three PSDDA bioassays. Table 4-2 provides an alternative DMMP interpretation of the larval data based on BPJ for the bivalve larval bioassay results, given reference performance problems, which are discussed in detail below. Biological testing was only performed on the Area 1 DMMUs with SL exceedances. Of the two Lake Washington freshwater reference sediments selected, FT-Ref-1 and FT-Ref-2, FT-Ref-1 was rejected because of low pH (less than 4).
Biennial Report DY 2004/2005 37 April 1, 2006
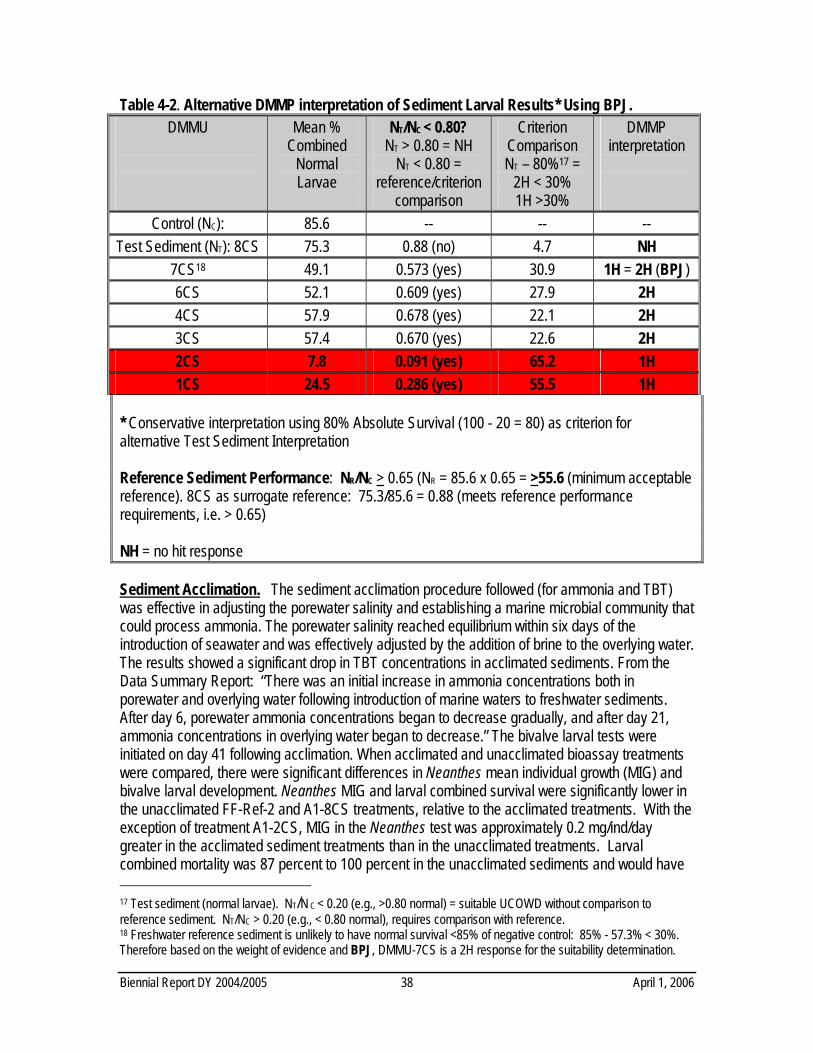
Table 4-2. Alternative DMMP interpretation of Sediment Larval Results* Using BPJ. DMMU
Mean % Combined
Normal Larvae
NT/NC < 0.80? NT > 0.80 = NH
NT < 0.80 = reference/criterion
comparison
Criterion Comparison NT – 80%17 =
2H < 30% 1H >30%
DMMP interpretation
Control (NC): 85.6 -- -- -- Test Sediment (NT): 8CS 75.3 0.88 (no) 4.7 NH
7CS18 49.1 0.573 (yes) 30.9 1H = 2H (BPJ) 6CS 52.1 0.609 (yes) 27.9 2H 4CS 57.9 0.678 (yes) 22.1 2H 3CS 57.4 0.670 (yes) 22.6 2H 2CS 7.8 0.091 (yes) 65.2 1H 1CS 24.5 0.286 (yes) 55.5 1H
* Conservative interpretation using 80% Absolute Survival (100 - 20 = 80) as criterion for alternative Test Sediment Interpretation Reference Sediment Performance: NR/NC > 0.65 (NR = 85.6 x 0.65 = >55.6 (minimum acceptable reference). 8CS as surrogate reference: 75.3/85.6 = 0.88 (meets reference performance requirements, i.e. > 0.65) NH = no hit response Sediment Acclimation. The sediment acclimation procedure followed (for ammonia and TBT) was effective in adjusting the porewater salinity and establishing a marine microbial community that could process ammonia. The porewater salinity reached equilibrium within six days of the introduction of seawater and was effectively adjusted by the addition of brine to the overlying water. The results showed a significant drop in TBT concentrations in acclimated sediments. From the Data Summary Report: “There was an initial increase in ammonia concentrations both in porewater and overlying water following introduction of marine waters to freshwater sediments. After day 6, porewater ammonia concentrations began to decrease gradually, and after day 21, ammonia concentrations in overlying water began to decrease.” The bivalve larval tests were initiated on day 41 following acclimation. When acclimated and unacclimated bioassay treatments were compared, there were significant differences in Neanthes mean individual growth (MIG) and bivalve larval development. Neanthes MIG and larval combined survival were significantly lower in the unacclimated FF-Ref-2 and A1-8CS treatments, relative to the acclimated treatments. With the exception of treatment A1-2CS, MIG in the Neanthes test was approximately 0.2 mg/ind/day greater in the acclimated sediment treatments than in the unacclimated treatments. Larval combined mortality was 87 percent to 100 percent in the unacclimated sediments and would have 17 Test sediment (normal larvae). NT/N C < 0.20 (e.g., >0.80 normal) = suitable UCOWD without comparison to reference sediment. NT/NC > 0.20 (e.g., < 0.80 normal), requires comparison with reference. 18 Freshwater reference sediment is unlikely to have normal survival <85% of negative control: 85% - 57.3% < 30%. Therefore based on the weight of evidence and BPJ, DMMU-7CS is a 2H response for the suitability determination.
Biennial Report DY 2004/2005 38 April 1, 2006
been evaluated as 1-hit failures for each of these treatments. However, amphipod survival was not significantly different for the three acclimated and unacclimated test sediment treatments from Fishermen’s Terminal. Water quality monitoring consisted of temperature, dissolved oxygen, salinity, and pH measurements daily in overlying water. Dissolved oxygen remained within acceptable limits throughout the test. The mean mortality in the control sediment for the amphipod toxicity test was 5 percent, meeting the PSEP 1995 test performance standard of less than or equal to 10 percent. The LC50 for the cadmium reference toxicant test was 6.8 mg Cd/L, which is within the control chart limits (2.76 to 7.6 mg/Cd/L), indicating that the test organisms sensitivity were similar to those previously tested at the MEC laboratory. Reference Sediment performance problems and bivalve larval interpretation. For the bivalve larval test, the mean percent normal survivorship in reference treatment FT-Ref-2 was 25.4 percent, indicating that this reference sediment did not meet the performance requirement as a suitable test sediment comparison. In the test sediment treatments, mean normal survival ranged from 76.2 percent in A1-8CS to 7.8 percent in A1-2CS. Searching for a way to evaluate the test sediment results, otherwise valid for decision making except for lack of a suitable reference sediment (given the poor performance of the FT-Ref-2 sediment), the applicant consulted with the laboratory practitioners and recommended using the A1-8CS test sediment as a surrogate reference sediment to evaluate the test sediment results. This test sediment met the minimum performance requirements for a reference sediment relative to control. The chemical testing results for A1-8CS indicated that this DMMU had lead concentrations slightly over the SL, quantitated at 482 mg/kg, but no other SL exceedances. TBT was present in unacclimated sediments, but dropped below the DMMP SL in the acclimated sediments. A marine reference sediment was not deemed to be the appropriate reference for comparison because the tested sediments were freshwater sediments. After much consideration, the DMMP agencies chose to reject this recommendation and use an alternative approach (described below and illustrated in Table 4-2). The agencies have never used this proposed interpretive approach - a within-site test sediment is simply not an appropriate point of comparison for test sediment toxicity results. The DMMP agencies first elected to use 80% absolute as a nominal rate of normal development for a freshwater reference sediment to interpret the bivalve larval results. The summary of this interpretation provided in Table 4-2 indicates that normal survivorship would be significantly lower in test sediments A1-1CS, A1-2CS, A1-3CS, A1-4CS, A1-6CS, and A1-7CS. There would be 1-hit responses for A1-1CS, and A1-2CS, and A1-7CS, with 2-hit responses for A1-3CS, A1-4CS and A1-6CS using a weight of evidence approach and BPJ. Two-hit responses were not corroborated by the other two bioassays, and therefore DMMUs A1-3CS, A1-4CS and A1-6CS would pass the non-dispersive site guidelines, whereas A1-1CS, A1-2CS and A1-7CS would fail the non-dispersive site guidelines using BPJ. However, after further discussion and based on what DMMP staff believed to be typical normal development for past marine reference samples, the agencies decided that it would be relatively unlikely for a freshwater reference sample to exhibit normal development > 85% of that observed in the negative control. With this assumption, if the nominal reference sample for this project was observed to have 85% normal survival relative to the negative control, then A1-7CS (57.4% relative to control) would fail only the two-hit interpretive
Biennial Report DY 2004/2005 39 April 1, 2006
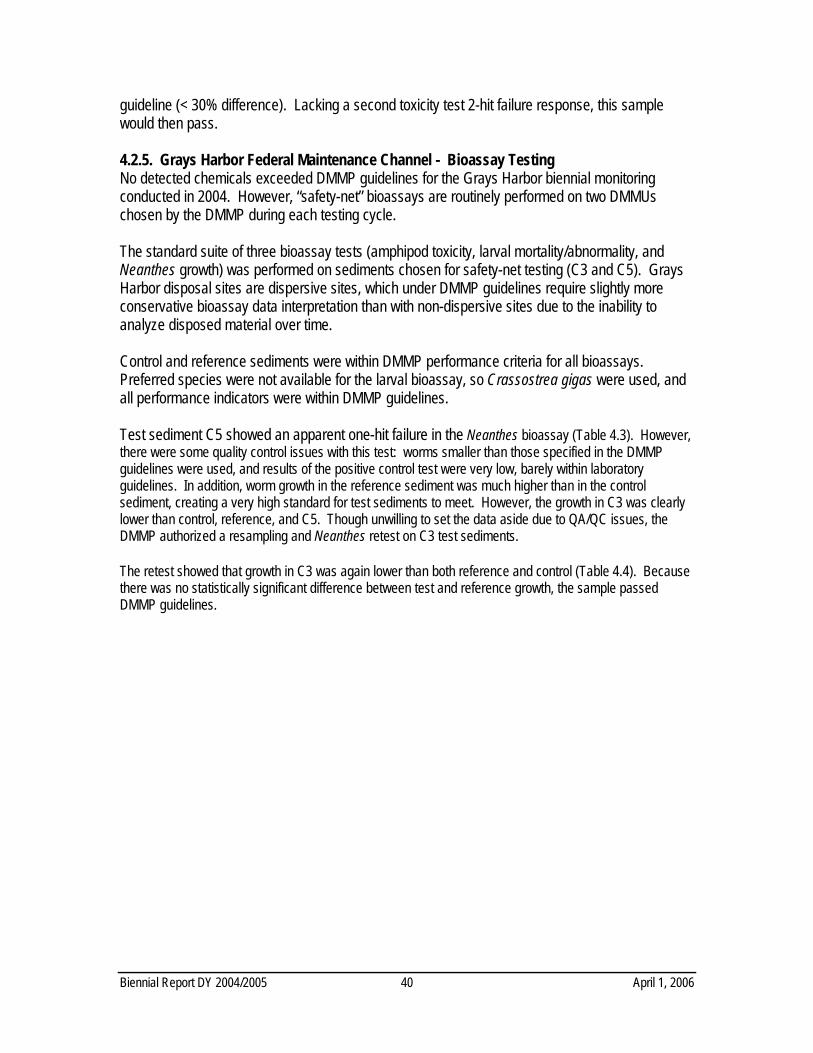
guideline (< 30% difference). Lacking a second toxicity test 2-hit failure response, this sample would then pass. 4.2.5. Grays Harbor Federal Maintenance Channel - Bioassay Testing No detected chemicals exceeded DMMP guidelines for the Grays Harbor biennial monitoring conducted in 2004. However, “safety-net” bioassays are routinely performed on two DMMUs chosen by the DMMP during each testing cycle. The standard suite of three bioassay tests (amphipod toxicity, larval mortality/abnormality, and Neanthes growth) was performed on sediments chosen for safety-net testing (C3 and C5). Grays Harbor disposal sites are dispersive sites, which under DMMP guidelines require slightly more conservative bioassay data interpretation than with non-dispersive sites due to the inability to analyze disposed material over time. Control and reference sediments were within DMMP performance criteria for all bioassays. Preferred species were not available for the larval bioassay, so Crassostrea gigas were used, and all performance indicators were within DMMP guidelines. Test sediment C5 showed an apparent one-hit failure in the Neanthes bioassay (Table 4.3). However, there were some quality control issues with this test: worms smaller than those specified in the DMMP guidelines were used, and results of the positive control test were very low, barely within laboratory guidelines. In addition, worm growth in the reference sediment was much higher than in the control sediment, creating a very high standard for test sediments to meet. However, the growth in C3 was clearly lower than control, reference, and C5. Though unwilling to set the data aside due to QA/QC issues, the DMMP authorized a resampling and Neanthes retest on C3 test sediments. The retest showed that growth in C3 was again lower than both reference and control (Table 4.4). Because there was no statistically significant difference between test and reference growth, the sample passed DMMP guidelines.
Biennial Report DY 2004/2005 40 April 1, 2006
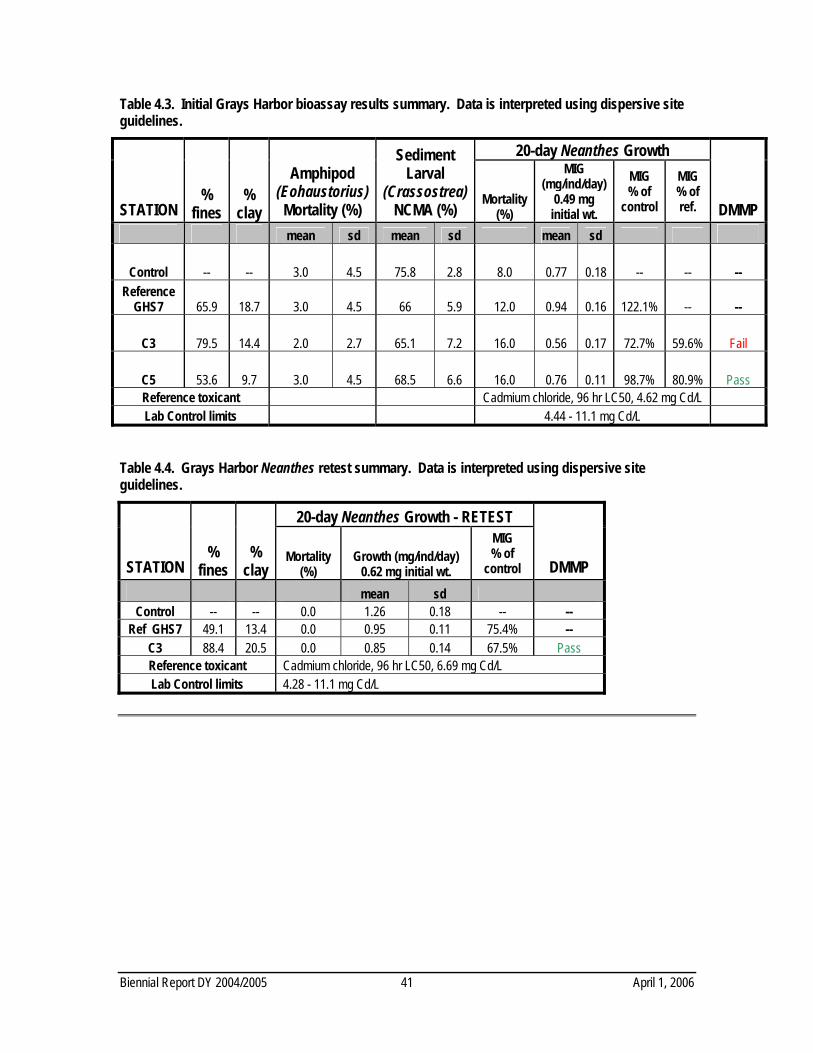
Table 4.3. Initial Grays Harbor bioassay results summary. Data is interpreted using dispersive site guidelines.
20-day Neanthes Growth
STATION %
fines %
clay
Amphipod (Eohaustorius) Mortality (%)
Sediment Larval
(Crassostrea) NCMA (%)
Mortality (%)
MIG (mg/ind/day)
0.49 mg initial wt.
MIG % of
control
MIG % of ref. DMMP
mean sd mean sd mean sd
Control -- -- 3.0 4.5 75.8 2.8 8.0 0.77 0.18 -- -- -- Reference
GHS7 65.9 18.7 3.0 4.5 66 5.9 12.0 0.94 0.16 122.1% -- --
C3 79.5 14.4 2.0 2.7 65.1 7.2 16.0 0.56 0.17 72.7% 59.6% Fail
C5 53.6 9.7 3.0 4.5 68.5 6.6 16.0 0.76 0.11 98.7% 80.9% Pass Reference toxicant Cadmium chloride, 96 hr LC50, 4.62 mg Cd/L Lab Control limits 4.44 - 11.1 mg Cd/L
Table 4.4. Grays Harbor Neanthes retest summary. Data is interpreted using dispersive site guidelines.
20-day Neanthes Growth - RETEST
STATION %
fines %
clay Mortality
(%) Growth (mg/ind/day)
0.62 mg initial wt.
MIG % of
control DMMP mean sd
Control -- -- 0.0 1.26 0.18 -- -- Ref GHS7 49.1 13.4 0.0 0.95 0.11 75.4% --
C3 88.4 20.5 0.0 0.85 0.14 67.5% Pass Reference toxicant Cadmium chloride, 96 hr LC50, 6.69 mg Cd/L Lab Control limits 4.28 - 11.1 mg Cd/L
Biennial Report DY 2004/2005 41 April 1, 2006
CHAPTER 5 – DISPOSAL SITE USE AND MONITORING 5.1 DISPOSAL ACTIVITY AND SITE USE The Washington State Department of Natural Resources (DNR) issues site-use authorizations to project proponents electing to dispose of suitable dredged material at PSDDA and Grays Harbor/Willapa Bay (GH/WB) designated disposal sites. These authorizations are issued for sediments that are 1) suitable for unconfined open-water disposal as determined by the Dredged Material Management Program (DMMP) evaluation process, and 2) associated with dredging projects which have received all required regulatory permits (e.g., CWA 401/404 permits). This section of the report describes the PSDDA and GH/WB disposal activity for Dredging Years 2004 and 2005. This information is discussed by dredging year and individual disposal site. Dredging Year 2004 (June 16, 2003 through June 15, 2004). In DY04, a total of 1,458,114 cubic yards (cy) of dredged material were deposited at four PSDDA sites, while the Corps of Engineers placed 75,770 cy at the Puget Sound Resources CERCLA capping site near Harbor Island, and 36,522 cy at a Fish Bench habitat enhancement project in Bellingham Bay. Of the four PSDDA sites utilized in DY04, Commencement Bay received the bulk of the material with 1,205,993 cy from six projects, whereas Rosario Strait was second with disposal of 230,747 cy from three projects. The Elliott Bay site received 15,602 cy from two projects, while the Anderson/Ketron Island site received 5,772 cy from a single project during DY04. In Grays Harbor a total of 2,188,419 cy were disposed at the two estuarine disposal sites and 29,019 cy was disposed at the Southwest ocean disposal site. An additional total of 551,828 cy of Grays Harbor sediments were was placed at two beneficial uses sites: Half Moon Bay received 289,652 cy of federal maintenance dredged material, while 262,176 cy was disposed at the South Beach beneficial use site. No disposal occurred in Willapa Bay during DY04. The Corps maintenance dredging project in Quillayute dredged and disposed 4,989 cy on the Tribal uplands. The volumes disposed at both Puget Sound and Grays Harbor sites in DY04 are graphically presented in Figures 5-1a and 5-1b, and are summarized in Tables 5-1 and 5-2. Dredging Year 2005 (June 16, 2004 through June 15, 2005). In DY05, a total of 1,059,234 cy of dredged material were deposited at four PSDDA sites. The bulk of the material was disposed of at the Commencement Bay site with 949,399 cy from four projects, principally from the Port of Tacoma’s Pierce County Terminal Project. The Elliott Bay site received 77,838 cy from four projects. The dispersive Rosario Strait site received 23,847 cy from one project, while the Anderson/Ketron Island site received 8,150 cy from a single project. In Grays Harbor 1,412,729 cy were disposed at the two estuarine disposal sites and no disposal took place at the Southwest ocean site. A total of 320,093 cy was placed at two beneficial uses sites, with 102,184 cy going to the Half Moon Bay site and 217,909 cy going to the Southwest Beach beneficial use site. No disposal took place at the Willapa Bay disposal sites. The volumes disposed at both Puget Sound and Grays Harbor sites are graphically presented in Figures 5-2a and 5-2b, and are summarized in Tables 5-3 and 5-4.
Biennial Report DY 2004/2005 42 April 1, 2006
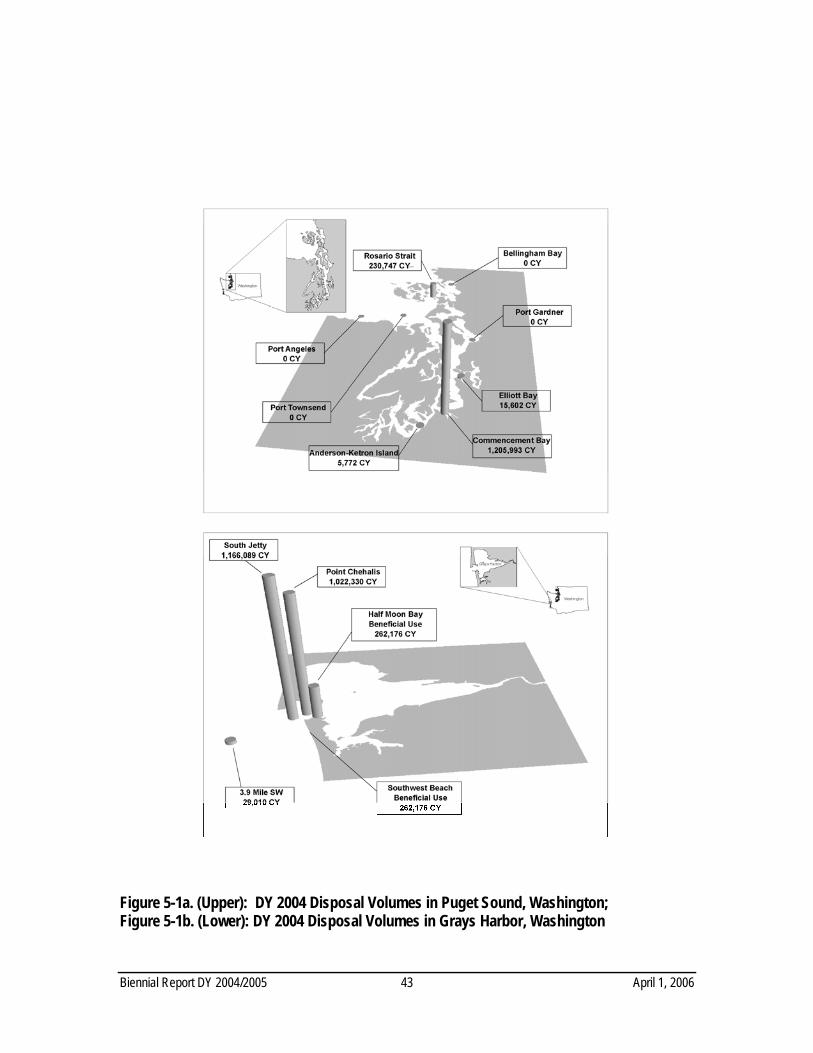
Biennial Report DY 2004/2005
43 April 1, 2006
Figure 5-1a. (Upper): DY 2004 Disposal Volumes in Puget Sound, Washington; Figure 5-1b. (Lower): DY 2004 Disposal Volumes in Grays Harbor, Washington
Table 5-1. Disposal Site Activity Summary, DY04 Disposal Site Jurisdiction Number of Projects Total Volume (cy)
Elliott Bay PSDDA 2 15,602 Puget Sound Resources – BU PSDDA 1 75,770
Commencement Bay PSDDA 6 1,205,993 Anderson/Ketron Island PSDDA 1 5,772
Rosario Strait PSDDA 2 230,747 Bellingham Bay Fish Bench -BU PSDDA 1 36,522
Point Chehalis Grays Harbor 1 1,022,330 South Jetty Grays Harbor 1 1,166,089
Half Moon Bay – BU Grays Harbor 1 289,652 Southwest Beach – BU Grays Harbor 2 262,176
Southwest Ocean Grays Harbor 1 29,019 Quillayute – Upland Grays Harbor/Willapa Bay 1 4,989
PSDDA sites Puget Sounds Resources-BU
Bellingham Bay Fish Bench -BU
10 1 1
1,458,114 75,770 36,522
Grays Harbor Estuarine sites Grays Harbor BU
Grays Harbor SW Ocean site Quillayute Upland
2 2 1 1
2,188,419 551,828 29,019 4,989
All Sites within Jurisdiction
Willapa Bay sites 0 0
Biennial Report DY 2004/2005 45 April 1, 2006
Table 5-2. Summary of Disposal Activity by Jurisdiction and Site, DY04
Site Proponent Dredging Contractor Disposal Volume (cy)
# Barge Loads Off Site Disposal Dates
EB Delta Marine General 3,939 3 No Jan 04EB Port of Seattle – T18 ACC 11,663 9 No Jan-Feb 04
PSR-BU USACE- Duwamish R O&M Hurlen 75,776 57 No Jan-Feb 04 CB Port of Tacoma – PCT Manson 819,253 306 No Nov 03 –Feb 04 CB Port of Tacoma - Sitcum Manson 56,153 33 No Jul – Nov 03 CB WA Dept of Transportation TNC 36,325 33 No Jul 03 – Mar-May 04 CB City of Tacoma Manson 128,371 88 No Oct-Dec 03 CB Manke Lumber Manke 19,944 11 No Jan-Feb 04A/K Olympia Yacht Club General 5,772 4 No Jan 04 RS Port of Bellingham/ Bell. Cold Storage Manson 4,962 2 No Jan 04 RS USACE Swinomish Channel O&M Manson 61,273 30 No Oct 03 RS USACE Squalicum Waterway O&M Manson 164,512 74 No Jan 04
BEL -BU USACE Squalicum Waterway O&M Manson 36,522 21 No Jan 04 PC USACE Grays Harbor O&M Dutra 603,689 324 No Aug 03 – Jan 04 SJ USACE Grays Harbor O&M Dutra 1,012,271 306 No Nov 03 – Feb 04 PC USACE Grays Harbor O&M Great Lakes 353,497 141 No May 04
SWB-BU USACE Grays Harbor O&M Corps, Essayons 262,176 48 No May 04 SW-O USACE Grays Harbor O&M Corps, Essayons 29,019 6 No May 04
HMB-BU USACE Grays Harbor O&M Corps, Yaquina 289,652 291 No May 04 SJ USACE Grays Harbor O&M Corps, Yaquina 153,818 155 No May 04 TU USACE Quillayute O&M Quigg 4,989 20 No Sep 03
Legend: EB = Elliott Bay Site; PG = Port Gardner Site; A/K = Anderson/Ketron Island; RS = Rosario Strait; PSR-BU = Puget Sound Resources beneficial use; SJ = South Jetty Site; SW-O = Southwest Ocean Site; PC = Point Chehalis Site; HMB-BU = Half Moon Bay-Beneficial Uses; SWB-BU = Southwest Beach-Beneficial Uses; BEL-BU = Bellingham Bay Beneficial uses fish bench: TU = Tribal Upland
Biennial Report DY 2004/2005
46 April 1, 2006
Figure 5-2a. (Upper): DY 2005 Disposal Volumes in Puget Sound, Washington Figure 5-2b. (Lower): DY 2005 Disposal Volumes in Grays Harbor, Washington
Table 5-3. Disposal Site Activity Summary, DY05 Disposal Site Jurisdiction Number of Projects Total Volume (cy)
Anderson/Ketron Island PSDDA 1 8,180 Commencement Bay PSDDA 4 949,399
Elliott Bay PSDDA 4 77,838 PSR-CAP PSDDA 1 297,186
Rosario Strait PSDDA 1 23,847 Point Chehalis Grays Harbor 3 671,819
South Jetty Grays Harbor 1 740,910 Southwest Beach-BU Grays Harbor 1 217,909
Half Moon Bay-BU Grays Harbor 1 102,184 PSDDA sites
Puget Sound Resources –CERCLA Cap 11 1
1,059,264 297,186
Grays Harbor Estuarine sites Grays Harbor Ocean site
Grays Harbor BU
3 0 2
1,412,729 0
320,093
All Sites within
Jurisdiction
Willapa Bay sites 0 0
Biennial Report DY 2004/2005 47 April 1, 2006
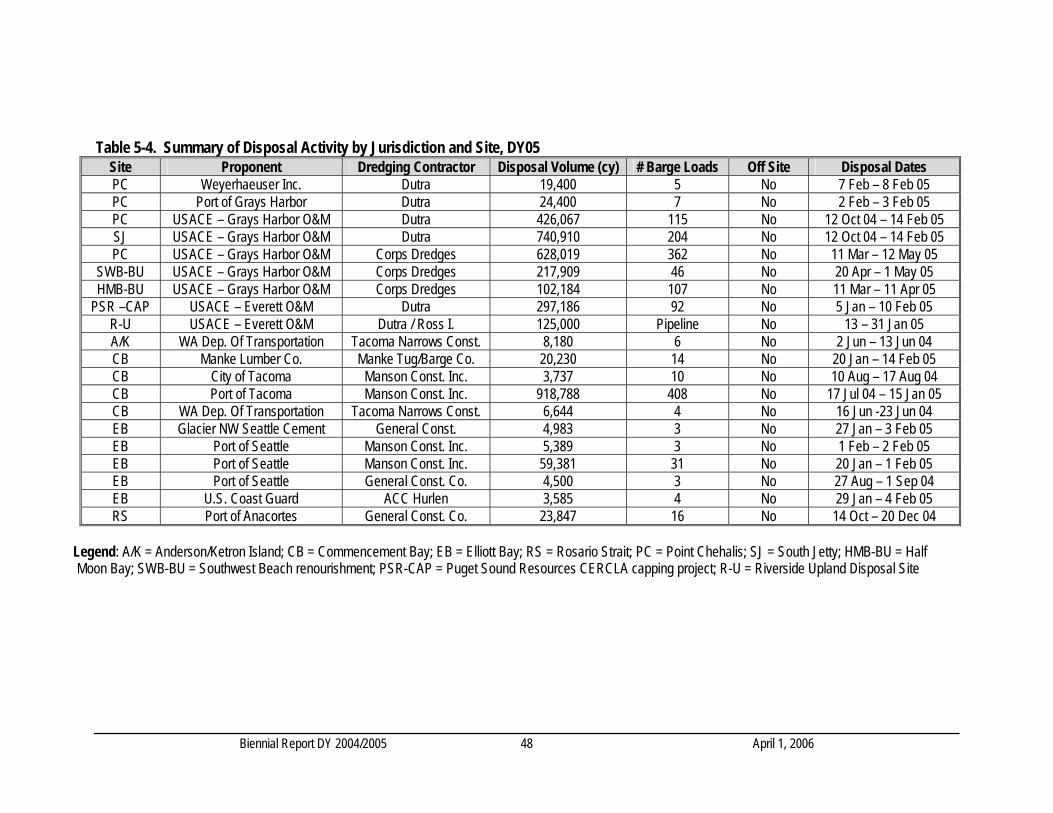
Biennial Report DY 2004/2005 48 April 1, 2006
Table 5-4. Summary of Disposal Activity by Jurisdiction and Site, DY05
Site Proponent Dredging Contractor Disposal Volume (cy) # Barge Loads Off Site Disposal Dates PC Weyerhaeuser Inc. Dutra 19,400 5 No 7 Feb – 8 Feb 05 PC Port of Grays Harbor Dutra 24,400 7 No 2 Feb – 3 Feb 05 PC USACE – Grays Harbor O&M Dutra 426,067 115 No 12 Oct 04 – 14 Feb 05 SJ USACE – Grays Harbor O&M Dutra 740,910 204 No 12 Oct 04 – 14 Feb 05 PC USACE – Grays Harbor O&M Corps Dredges 628,019 362 No 11 Mar – 12 May 05
SWB-BU USACE – Grays Harbor O&M Corps Dredges 217,909 46 No 20 Apr – 1 May 05 HMB-BU USACE – Grays Harbor O&M Corps Dredges 102,184 107 No 11 Mar – 11 Apr 05
PSR –CAP USACE – Everett O&M Dutra 297,186 92 No 5 Jan – 10 Feb 05 R-U USACE – Everett O&M Dutra / Ross I. 125,000 Pipeline No 13 – 31 Jan 05 A/K WA Dep. Of Transportation Tacoma Narrows Const. 8,180 6 No 2 Jun – 13 Jun 04 CB Manke Lumber Co. Manke Tug/Barge Co. 20,230 14 No 20 Jan – 14 Feb 05 CB City of Tacoma Manson Const. Inc. 3,737 10 No 10 Aug – 17 Aug 04 CB Port of Tacoma Manson Const. Inc. 918,788 408 No 17 Jul 04 – 15 Jan 05 CB WA Dep. Of Transportation Tacoma Narrows Const. 6,644 4 No 16 Jun -23 Jun 04 EB Glacier NW Seattle Cement General Const. 4,983 3 No 27 Jan – 3 Feb 05 EB Port of Seattle Manson Const. Inc. 5,389 3 No 1 Feb – 2 Feb 05 EB Port of Seattle Manson Const. Inc. 59,381 31 No 20 Jan – 1 Feb 05 EB Port of Seattle General Const. Co. 4,500 3 No 27 Aug – 1 Sep 04 EB U.S. Coast Guard ACC Hurlen 3,585 4 No 29 Jan – 4 Feb 05 RS Port of Anacortes General Const. Co. 23,847 16 No 14 Oct – 20 Dec 04
Legend: A/K = Anderson/Ketron Island; CB = Commencement Bay; EB = Elliott Bay; RS = Rosario Strait; PC = Point Chehalis; SJ = South Jetty; HMB-BU = Half Moon Bay; SWB-BU = Southwest Beach renourishment; PSR-CAP = Puget Sound Resources CERCLA capping project; R-U = Riverside Upland Disposal Site
5.2 POST-DISPOSAL SITE MONITORING (2004 – 2005) Environmental monitoring is the primary tool utilized in the management of DMMP non-dispersive disposal sites. The main objective of post-disposal site monitoring is to determine whether the disposal of dredged material has adversely affected the disposal site environment. Environmental monitoring includes physical, chemical and biological assessment of the sediments and biological resources in, and adjacent to, the disposal site being monitored. The DMMP monitoring program is designed to compare the post-disposal monitoring results to “baseline” values. Baseline values for key environmental parameters such as sediment chemistry, toxicity, and benthic community structure, were determined for each DMMP site and the associated benchmark stations prior to the first use of the sites to serve as an environmental baseline for later comparisons as a reference (PTI, 1988, 1989). The DMMP agencies now evaluate site chemistry changes over time using a time-trend analysis approach. The time-trend analysis technique was first used in 1996 to evaluate post-disposal monitoring data from Commencement Bay. Post-disposal site monitoring surveys described below collect data to answer three major questions. Full DMMP site monitoring was designed to collect data to answer the three questions and six testable hypotheses (Table 5-5). The DMMP monitoring plan is now designed to work in a tiered framework, with a partial monitoring event addressing questions 1 and 2 and testing the first four hypotheses. Question 3 is only addressed if either of the first two questions, or one or more of the four testable hypotheses is rejected.
The Seattle District Corps is responsible for physical monitoring at all eight disposal sites, while DNR is responsible for chemical and biological monitoring at the five Puget Sound non-dispersive disposal sites. This environmental monitoring is conducted at irregular intervals based on the documented pattern of disposal site-use occurring between monitoring surveys. This pattern encompasses several important factors, such as volume and characteristics (e.g., physical characteristics and sediment quality) of the material disposed at a given site, the nature and recency of previous site monitoring data, and site-specific environmental concerns. For the Central Puget Sound Sites, the DMMP agencies have established a soft trigger of 500,000 cubic yards to initiate monitoring at the site. After reviewing the During the 2004 dredging year (June 16, 2003 to June 15, 2004) a total of 1,205,993 cubic yards from projects was disposed at the Commencement Bay site, which constituted the largest volume of dredged material disposed at any of the Puget Sound disposal activity records at all the non-dispersive sites, the DMMP agencies determined, by consensus, which site(s), if any, will be monitored, and if so what kind of monitoring is called for to evaluate the site relative to site management objectives or concerns. Based upon this review, the DMMP agencies determined that a tiered-partial monitoring event was required at the Commencement Bay disposal site in 2004, and that a full monitoring event would be required at the Anderson/Ketron Island disposal site in 2005, that would serve as the new baseline because of low site use. Because of the frequency of monitoring at the Commencement Bay site, the DMMP agencies elected to limit monitoring to a Sediment Profile Imagery (SPI) survey, and also conduct a special study to evaluate Phenol concentrations at the site. The Phenol study was precipitated by a Phenol spike observed at the site in 2003. Elevated Phenol concentrations have also been observed at other DMMP Puget Sound sites, and have been noted to occur throughout Puget Sound. The DMMP agencies also determined that a limited special study would be conducted at the Elliott Bay disposal site in 2005, to evaluate sediment quality based on recent dredging and disposal from the CERCLA cleanup site in East Waterway.
Biennial Report DY 2004/2005 49 April 1, 2006
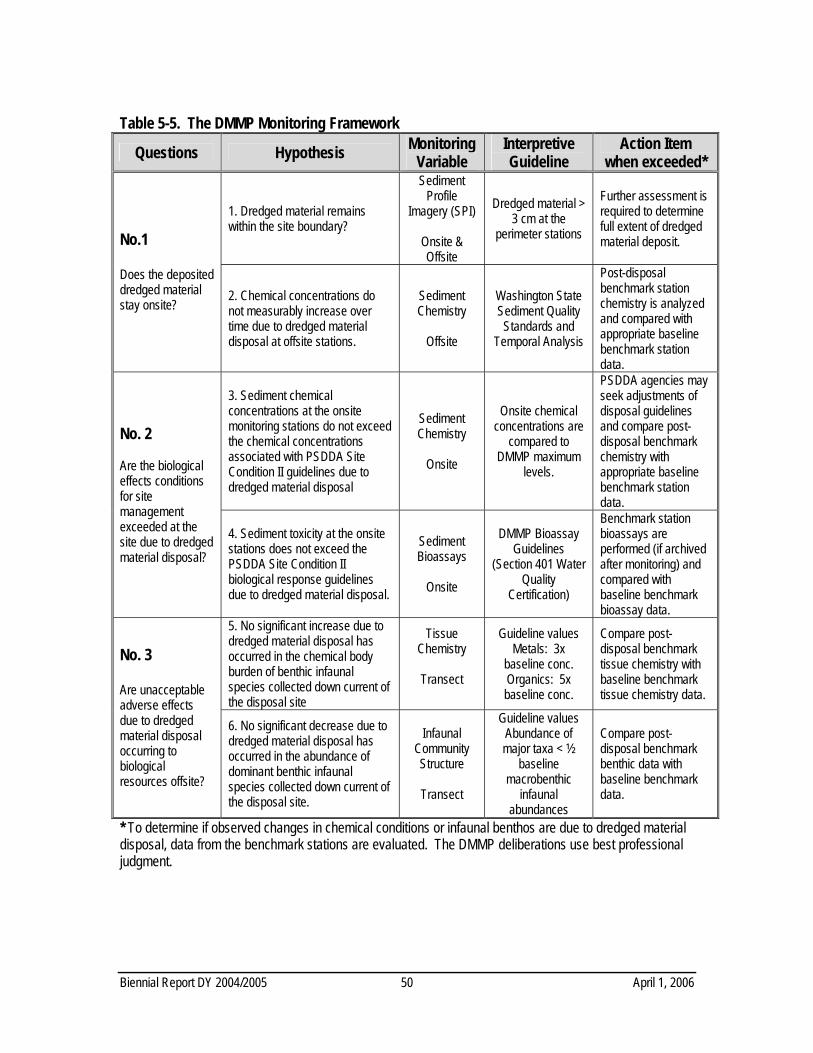
Table 5-5. The DMMP Monitoring Framework
Questions Hypothesis Monitoring Variable
Interpretive Guideline
Action Item when exceeded*
1. Dredged material remains within the site boundary?
Sediment Profile
Imagery (SPI)
Onsite & Offsite
Dredged material > 3 cm at the
perimeter stations
Further assessment is required to determine full extent of dredged material deposit. No.1
Does the deposited dredged material stay onsite?
2. Chemical concentrations do not measurably increase over time due to dredged material disposal at offsite stations.
Sediment Chemistry
Offsite
Washington State Sediment Quality Standards and
Temporal Analysis
Post-disposal benchmark station chemistry is analyzed and compared with appropriate baseline benchmark station data.
3. Sediment chemical concentrations at the onsite monitoring stations do not exceed the chemical concentrations associated with PSDDA Site Condition II guidelines due to dredged material disposal
Sediment Chemistry
Onsite
Onsite chemical concentrations are
compared to DMMP maximum
levels.
PSDDA agencies may seek adjustments of disposal guidelines and compare post-disposal benchmark chemistry with appropriate baseline benchmark station data.
No. 2 Are the biological effects conditions for site management exceeded at the site due to dredged material disposal?
4. Sediment toxicity at the onsite stations does not exceed the PSDDA Site Condition II biological response guidelines due to dredged material disposal.
Sediment Bioassays
Onsite
DMMP Bioassay Guidelines
(Section 401 Water Quality
Certification)
Benchmark station bioassays are performed (if archived after monitoring) and compared with baseline benchmark bioassay data.
5. No significant increase due to dredged material disposal has occurred in the chemical body burden of benthic infaunal species collected down current of the disposal site
Tissue Chemistry
Transect
Guideline values Metals: 3x
baseline conc. Organics: 5x baseline conc.
Compare post-disposal benchmark tissue chemistry with baseline benchmark tissue chemistry data.
No. 3 Are unacceptable adverse effects due to dredged material disposal occurring to biological resources offsite?
6. No significant decrease due to dredged material disposal has occurred in the abundance of dominant benthic infaunal species collected down current of the disposal site.
Infaunal Community Structure
Transect
Guideline values Abundance of major taxa < 1⁄2
baseline macrobenthic
infaunal abundances
Compare post-disposal benchmark benthic data with baseline benchmark data.
* To determine if observed changes in chemical conditions or infaunal benthos are due to dredged material disposal, data from the benchmark stations are evaluated. The DMMP deliberations use best professional judgment.
Biennial Report DY 2004/2005 50 April 1, 2006
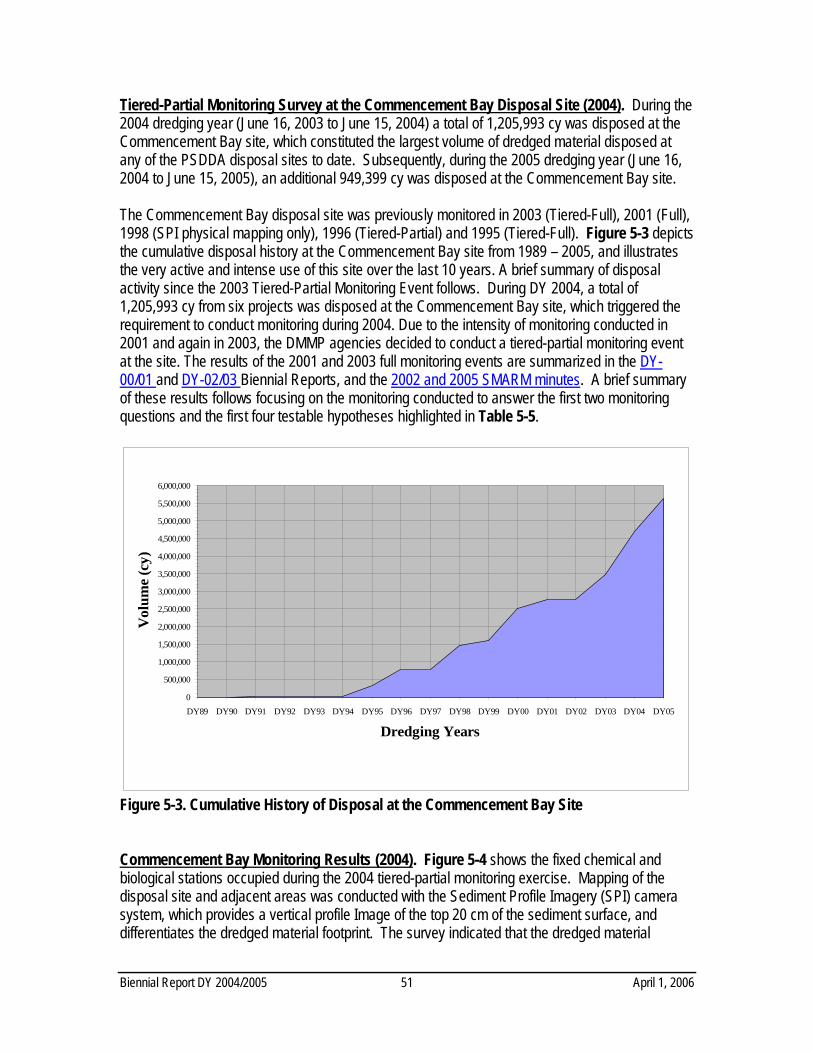
Tiered-Partial Monitoring Survey at the Commencement Bay Disposal Site (2004). During the 2004 dredging year (June 16, 2003 to June 15, 2004) a total of 1,205,993 cy was disposed at the Commencement Bay site, which constituted the largest volume of dredged material disposed at any of the PSDDA disposal sites to date. Subsequently, during the 2005 dredging year (June 16, 2004 to June 15, 2005), an additional 949,399 cy was disposed at the Commencement Bay site.
The Commencement Bay disposal site was previously monitored in 2003 (Tiered-Full), 2001 (Full), 1998 (SPI physical mapping only), 1996 (Tiered-Partial) and 1995 (Tiered-Full). Figure 5-3 depicts the cumulative disposal history at the Commencement Bay site from 1989 – 2005, and illustrates the very active and intense use of this site over the last 10 years. A brief summary of disposal activity since the 2003 Tiered-Partial Monitoring Event follows. During DY 2004, a total of 1,205,993 cy from six projects was disposed at the Commencement Bay site, which triggered the requirement to conduct monitoring during 2004. Due to the intensity of monitoring conducted in 2001 and again in 2003, the DMMP agencies decided to conduct a tiered-partial monitoring event at the site. The results of the 2001 and 2003 full monitoring events are summarized in the DY-00/01 and DY-02/03 Biennial Reports, and the 2002 and 2005 SMARM minutes. A brief summary of these results follows focusing on the monitoring conducted to answer the first two monitoring questions and the first four testable hypotheses highlighted in Table 5-5.
0
500,000
1,000,000
1,500,000
2,000,000
2,500,000
3,000,000
3,500,000
4,000,000
4,500,000
5,000,000
5,500,000
6,000,000
DY89 DY90 DY91 DY92 DY93 DY94 DY95 DY96 DY97 DY98 DY99 DY00 DY01 DY02 DY03 DY04 DY05
Dredging Years
Vol
ume
(cy)
Figure 5-3. Cumulative History of Disposal at the Commencement Bay Site Commencement Bay Monitoring Results (2004). Figure 5-4 shows the fixed chemical and biological stations occupied during the 2004 tiered-partial monitoring exercise. Mapping of the disposal site and adjacent areas was conducted with the Sediment Profile Imagery (SPI) camera system, which provides a vertical profile Image of the top 20 cm of the sediment surface, and differentiates the dredged material footprint. The survey indicated that the dredged material
Biennial Report DY 2004/2005 51 April 1, 2006
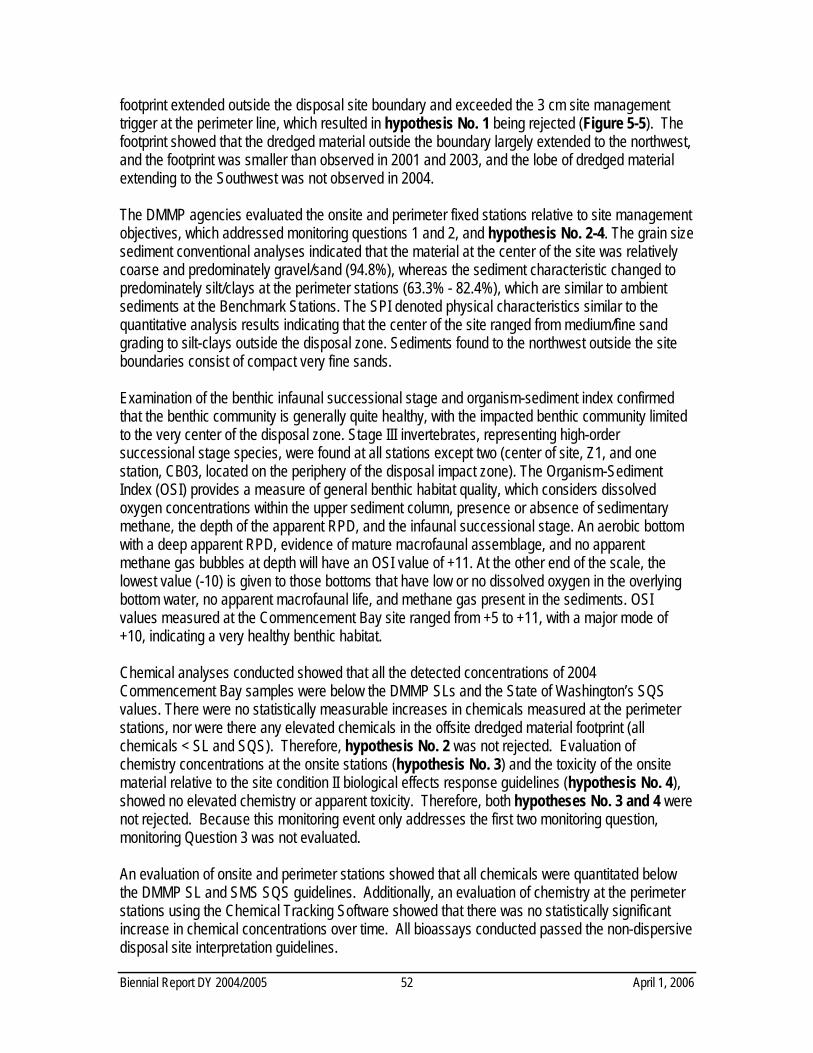
footprint extended outside the disposal site boundary and exceeded the 3 cm site management trigger at the perimeter line, which resulted in hypothesis No. 1 being rejected (Figure 5-5). The footprint showed that the dredged material outside the boundary largely extended to the northwest, and the footprint was smaller than observed in 2001 and 2003, and the lobe of dredged material extending to the Southwest was not observed in 2004. The DMMP agencies evaluated the onsite and perimeter fixed stations relative to site management objectives, which addressed monitoring questions 1 and 2, and hypothesis No. 2-4. The grain size sediment conventional analyses indicated that the material at the center of the site was relatively coarse and predominately gravel/sand (94.8%), whereas the sediment characteristic changed to predominately silt/clays at the perimeter stations (63.3% - 82.4%), which are similar to ambient sediments at the Benchmark Stations. The SPI denoted physical characteristics similar to the quantitative analysis results indicating that the center of the site ranged from medium/fine sand grading to silt-clays outside the disposal zone. Sediments found to the northwest outside the site boundaries consist of compact very fine sands. Examination of the benthic infaunal successional stage and organism-sediment index confirmed that the benthic community is generally quite healthy, with the impacted benthic community limited to the very center of the disposal zone. Stage III invertebrates, representing high-order successional stage species, were found at all stations except two (center of site, Z1, and one station, CB03, located on the periphery of the disposal impact zone). The Organism-Sediment Index (OSI) provides a measure of general benthic habitat quality, which considers dissolved oxygen concentrations within the upper sediment column, presence or absence of sedimentary methane, the depth of the apparent RPD, and the infaunal successional stage. An aerobic bottom with a deep apparent RPD, evidence of mature macrofaunal assemblage, and no apparent methane gas bubbles at depth will have an OSI value of +11. At the other end of the scale, the lowest value (-10) is given to those bottoms that have low or no dissolved oxygen in the overlying bottom water, no apparent macrofaunal life, and methane gas present in the sediments. OSI values measured at the Commencement Bay site ranged from +5 to +11, with a major mode of +10, indicating a very healthy benthic habitat. Chemical analyses conducted showed that all the detected concentrations of 2004 Commencement Bay samples were below the DMMP SLs and the State of Washington’s SQS values. There were no statistically measurable increases in chemicals measured at the perimeter stations, nor were there any elevated chemicals in the offsite dredged material footprint (all chemicals < SL and SQS). Therefore, hypothesis No. 2 was not rejected. Evaluation of chemistry concentrations at the onsite stations (hypothesis No. 3) and the toxicity of the onsite material relative to the site condition II biological effects response guidelines (hypothesis No. 4), showed no elevated chemistry or apparent toxicity. Therefore, both hypotheses No. 3 and 4 were not rejected. Because this monitoring event only addresses the first two monitoring question, monitoring Question 3 was not evaluated. An evaluation of onsite and perimeter stations showed that all chemicals were quantitated below the DMMP SL and SMS SQS guidelines. Additionally, an evaluation of chemistry at the perimeter stations using the Chemical Tracking Software showed that there was no statistically significant increase in chemical concentrations over time. All bioassays conducted passed the non-dispersive disposal site interpretation guidelines.
Biennial Report DY 2004/2005 52 April 1, 2006
2004 Partial Monitoring in October 22, 2004 Commencement Bay
16
Figure 5-4. Dredged material distribution at Commencement Bay measured during the 2004
SVPS survey (from SAIC, 2004).
2004 Partial Monitoring in October 22, 2004 Commencement Bay
9
Figure 5-5. Commencement Bay chemistry and bioassay sampling stations in 2004 (from SAIC, 2004).
Commencement Bay Monitoring Results (2005). The SPI survey mapped the dredged material footprint and showed that the footprint for the most part was distributed within the boundary of the disposal site with lobes extending outside the perimeter line to the northwest and southeast (Figure 5-6). The lobe extending to the northwest had a mean thickness of 2.01 cm, and only two of the eleven stations making up the lobe exceeded the 3 cm interpretive guideline for PSDDA monitoring. The distribution based on the DY05 disposal of 949,399 cy was similar to the pattern exhibited during 2004 (see Figure 5-5), except for the absence of the southeast lobe observed in 2004. Therefore, hypothesis No. 1 relating to Question 1 was rejected. The DMMP agencies had previously anticipated that the dredged material footprint would extend outside the perimeter line based on previous monitoring conducted in 2001, 2003, and 2004. All previous monitoring had consistently concluded, that that sediment chemistry results and toxicity testing results within the dredged material footprint verified that the sediment quality was consistent with the site management objectives, and was generally well bellow the SQS. Evaluation of the 2005 SPI results indicated that the benthic community, except largely within the Target Zone, was occupied by Stage I over Stage III, while the center of the site was principally dominated by a Stage I community. An analysis of the Organism-Sediment Index (OSI) indicated that the OSI exceeded 6 throughout the site, except within the Target Zone. Both of these indicators suggest that the benthic community has been able to recover from the large amount of clean dredged material disposed at the site. The DMMP agencies conducted a short-term temporal study to evaluate Phenol concentrations during two time intervals (June 23-24 and July 13-14, 2005) (Figure 5-7). Previous monitoring in 2003, had noted a pronounced spike in phenol concentrations at the site, and at perimeter stations (Figure 5-8). Predisposal baseline monitoring also indicated that Phenol concentrations were elevated at the disposal site center station, Z1. However, subsequent monitoring in 2004 showed that phenol levels had returned to previously observed concentrations. The DMMP agencies believed that the phenol concentration spikes may be a consequence of seasonal changes and natural sources (e.g., conifer needles, and/or conifer wood particles; or seston deposits from phytoplankton blooms) in the environment, and elevated phenol concentrations have been observed throughout Puget Sound (Long et al., 2003). The study attempted to evaluate short-term temporal variability of phenol concentrations in Commencement Bay. However, the results failed to show a temporal Phenol spike, and concentrations quantitated, were essentially the same, averaging around 15 mg/kg, ranging from 8 – 21.3 mg/kg, among the perimeter and benchmark stations. The phenol results failed to show a short term seasonal change, during this limited investigation. It is likely that there is a seasonal phenol pattern, but elucidating that pattern would probably require a much more robust study to discern. However, the overall conclusion from these data is that it is unlikely that the phenol spike observed in 2003 and during the 1988 predisposal baseline studies was attributable to dredged material disposal. Figure 5-8 summarizes the phenol history at Commencement Bay stations from previous monitoring results at the onsite (Z1, S1, S8), perimeter (P1, P3, P7, P11), and benchmark stations (B1, B2, B3).
Biennial Report DY 2004/2005 55 April 1, 2006
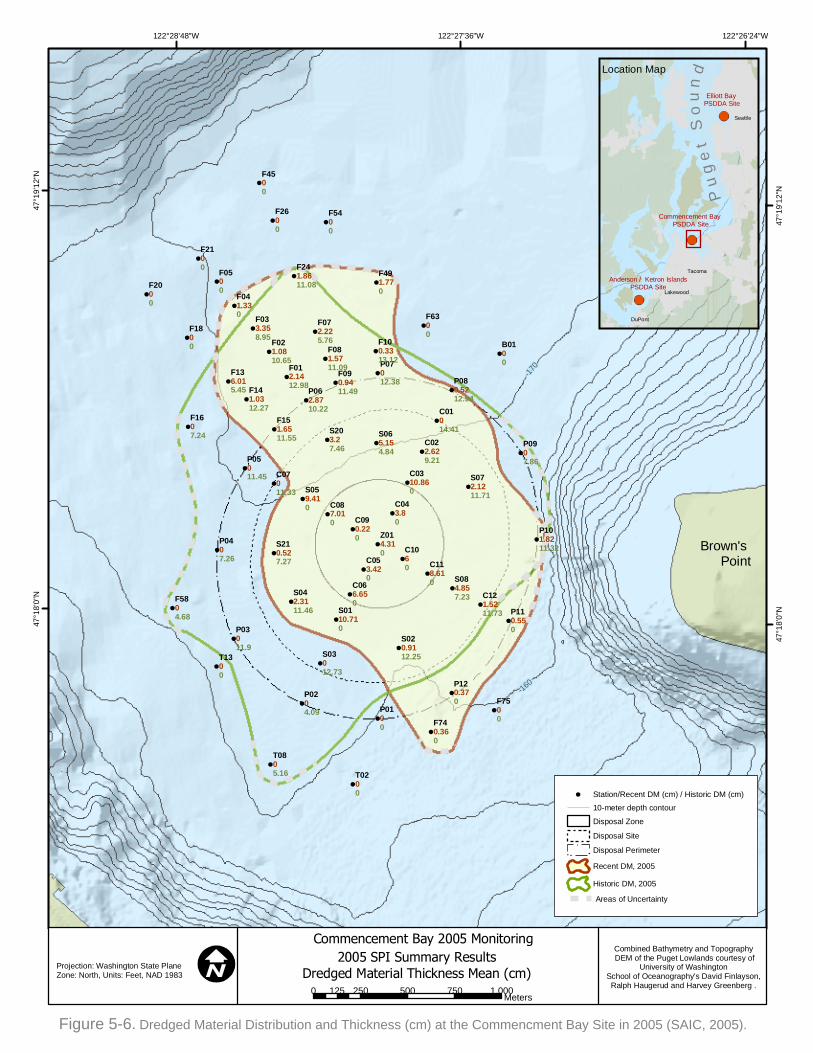
Brown's Point
-130-130
-140-140
-150-150
-160
-160
-170
-170
F7500
T1300
T0200
P0100
F6300
F5400
F4500
F2600
F2100
F2000
F1800
F0500
C1060
B0100
C043.80
F740.360
Z014.310
T0805.16
S059.410
P120.370
P110.550
P0907.86
P0407.26
P03011.9
P0204.09
F5804.68
F491.770
F1607.24
F041.330
C118.610
C090.220
C087.010
C066.650
S03012.73
P07012.38
P05011.45 C07
011.33
C0310.860
C01014.41S20
3.27.46
S210.527.27
S084.857.23
S065.154.84
F136.015.45
F072.225.76
F033.358.95
C022.629.21
S072.1211.71
S042.3111.46
S020.9112.25
P101.8211.32
P080.5212.94
P062.8710.22
F241.8611.08
F151.6511.55
F141.0312.27
F090.9411.49
F021.0810.65
C121.5211.73
C053.420
S0110.710
F100.3313.12
F081.5711.09F01
2.1412.98
122°28'48"W
122°28'48"W
122°27'36"W
122°27'36"W
122°26'24"W
122°26'24"W47
°18'
0"N
47°1
8'0"
N
47°1
9'12
"N
47°1
9'12
"N
Commencement Bay PSDDA Site
Elliott Bay PSDDA Site
Anderson / Ketron IslandsPSDDA Site
P u
g e
t S
o u
n d
Seattle
Tacoma
Lakewood
DuPont
Commencement Bay 2005 Monitoring2005 SPI Summary Results
Dredged Material Thickness Mean (cm) 0 250 500 750 1,000125
Meters
Projection: Washington State PlaneZone: North, Units: Feet, NAD 1983
Figure 5-6. Dredged Material Distribution and Thickness (cm) at the Commencment Bay Site in 2005 (SAIC, 2005).
Station/Recent DM (cm) / Historic DM (cm)
10-meter depth contour
Disposal Zone
Disposal Site
Disposal Perimeter
Recent DM, 2005
Historic DM, 2005
Areas of Uncertainty
Location Map
Combined Bathymetry and Topography DEM of the Puget Lowlands courtesy of
University of Washington School of Oceanography's David Finlayson, Ralph Haugerud and Harvey Greenberg .
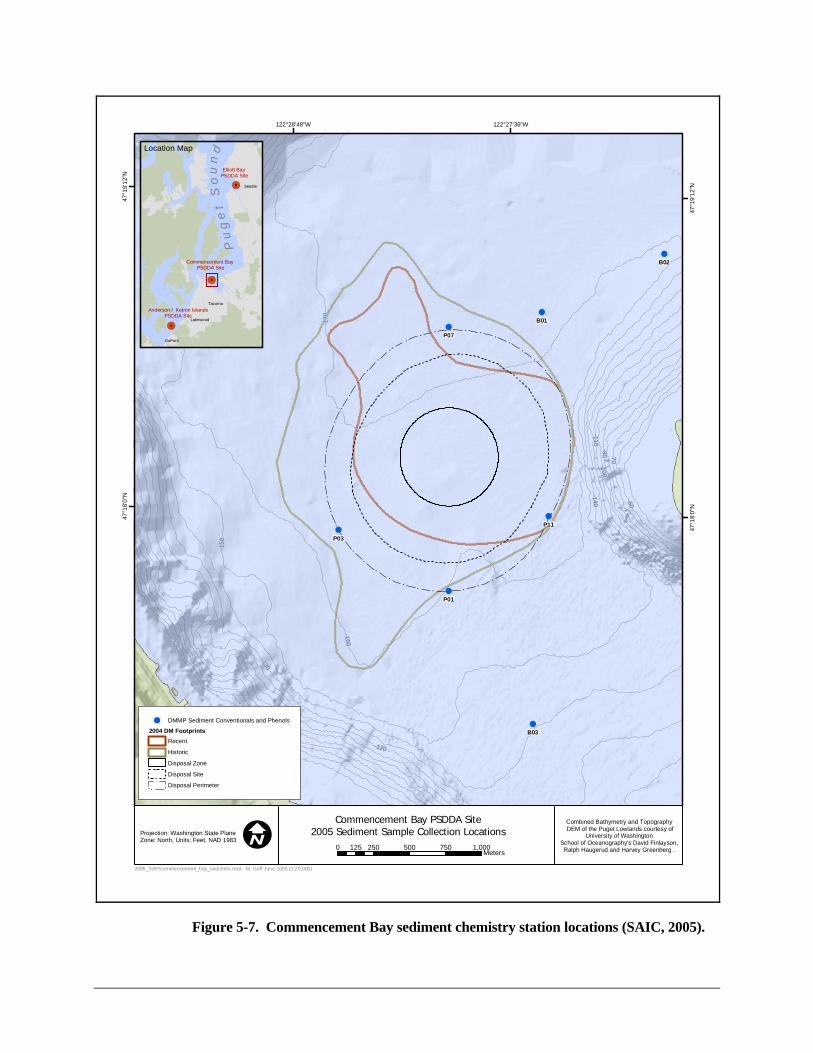
5
!
!
!
!
! !
!
!
!
!
!
!
!
!
!
!!
!
!
!
!
!
!
!
!
!
!
!
!
!
!!
!
!
!
!
!
!
!
!
!
!
!!
!
!
!
!
!
!
!
!
!
!
!
!
!
!
!
!
- 70
-50
-60
-90-100
-1 10
-120
-130
-140-1
50
-160
-170
P11
P07
P03
P01
B01
B03
B02
122°28'48"W
122°28'48"W
122°27'36"W
122°27'36"W47
°18'
0"N
47°1
8'0"
N
47°1
9'12
"N
47°1
9'12
"N
!
!
!!
!!
!.
!.
!.
Commencement Bay PSDDA Site
Elliott Bay PSDDA Site
Anderson / Ketron IslandsPSDDA Site
P u
g e
t S
o u
n d
Seattle
Tacoma
Lakewood
DuPont
Commencement Bay PSDDA Site2005 Sediment Sample Collection Locations
0 250 500 750 1,000125Meters
Projection: Washington State PlaneZone: North, Units: Feet, NAD 1983 I
2005_SAP/commencement_bay_sedchem.mxd M. Goff June 2005 (1:20,000)
! DMMP Sediment Conventionals and Phenols
2004 DM FootprintsRecent
Historic
Disposal Zone
Disposal Site
!
!
!
!
Disposal Perimeter
Location Map
Combined Bathymetry and Topography DEM of the Puget Lowlands courtesy of
University of Washington School of Oceanography's David Finlayson, Ralph Haugerud and Harvey Greenberg .
Figure 5-7. Commencement Bay sediment chemistry station locations (SAIC, 2005).
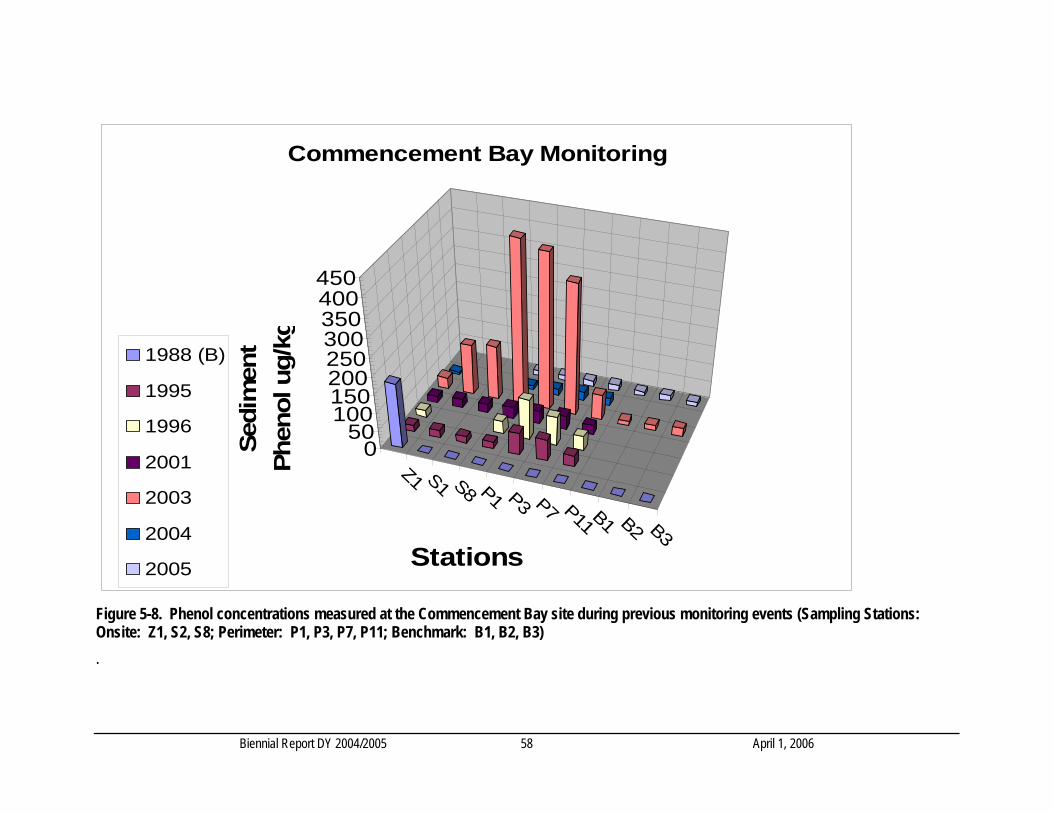
Biennial Report DY 2004/2005 58 April 1, 2006
Z1 S1 S8 P1 P3 P7 P11 B1 B2 B3
050
100150200250300350400450
Sedi
men
t Ph
enol
ug/
kg
Stations
Commencement Bay Monitoring
1988 (B)
1995
1996
2001
2003
2004
2005
Figure 5-8. Phenol concentrations measured at the Commencement Bay site during previous monitoring events (Sampling Stations: Onsite: Z1, S2, S8; Perimeter: P1, P3, P7, P11; Benchmark: B1, B2, B3) .
Full Monitoring at the Anderson/Ketron Island Disposal Site (2005). The Ketron Island site has only been used sparingly over the past 16 years, with a total of 32,826 cy disposed during this period. Environmental baseline studies were initially conducted in 1989, but no post-disposal monitoring has occurred at this site, due to low site use. A full monitoring exercise was conducted during June 2005, to update and re-evaluate the disposal site, and these results will be used to establish a new environmental baseline to compare future post-disposal monitoring results. Therefore, monitoring at the Anderson/Ketron Island site consisted of examining all three monitoring questions, and six testable hypotheses according to the DMMP site management framework (see Table 5-5). Anderson/Ketron Island Monitoring Results (2005). An SPI survey was conducted with images collected at 57 Stations in triplicate. The SPI survey map showed that the dredged material footprint was well within the disposal site boundary, and largely confined within the target zone (Figure 5-9). The survey indicated that much of the sediment within the disposal site boundary and target zone, consisted of unimpacted ambient sediments, slightly sandy silts and clays with reduced sediments at depth, with deep RPD depths and numerous feeding voids characteristic of a well established climax benthic community. Ambient sediments along the Perimeter of the Anderson/Ketron Island site were similar to onsite ambient sediments, with the exception of stations along the eastern and western perimeter, which showed a slight enrichment in fine sand. Evidence of dredged material was absent except at 2 onsite stations (Z1, S3) as depicted in Figure 5-9. An examination of the benthic characteristics from the images indicated that Stage III Climax species (Figure 5-10) and relatively high OSI19 (Organism Sediment Index) values were present at all stations (ranging from 5.7 – 10.3, with a major mode of 9) with no evidence of significant impact from historic dredged material disposal. Therefore, Hypothesis No. 1 relating to Question 1 was not rejected. Figure 5-11 shows the chemical and biological sampling stations occupied during the 2005 disposal site full monitoring exercise. Thirteen sediment stations were occupied and sampled for chemical testing (3 Onsite Stations, 4 Perimeter Stations, 3 Benchmark Stations, and 3 Transect Stations). The Onsite, Perimeter, and Benchmark Stations were analyzed for all DMMP chemicals of concern, including butyltins, and the List 1 and 2 Bioaccumulative Chemicals of Concern (BCOC). Transect Stations were analyzed for grain size and Total Organic Carbon (TOC). The Carr Inlet Reference Samples were analyzed for conventional sediment parameters. Transect and Benchmark Stations were sampled for either the sea cucumber, Molpadia intermedia, or the bivalve, Compsomyax subdiaphana. Tissue sampling indicated Molpadia was almost entirely absent from Transect and Benchmark Stations, and Compsomyax was collected at only one Transect Station (AKT01) and one Benchmark Station (AKB03) in sufficient densities for triplicate analyses at these two Stations. Tissue samples were analyzed for lipids, moisture content, and the BCOCs for List 1 and 2. The results of the sediment analyses indicated that the site-wide average for percent fines was 43.4%, ranging from a low of 15.6% at Benchmark Station B7 to a high of 70.5% at onsite Station
19 OSI is a numerical index from -10 to +11, which provides a measure of general benthic habitat quality based on dissolved oxygen conditions, depth of apparent RPD, infaunal successional stage, and presence or absence of sedimentary methane (Rhoads and Germano, 1982).
Biennial Report DY 2004/2005 59 April 1, 2006
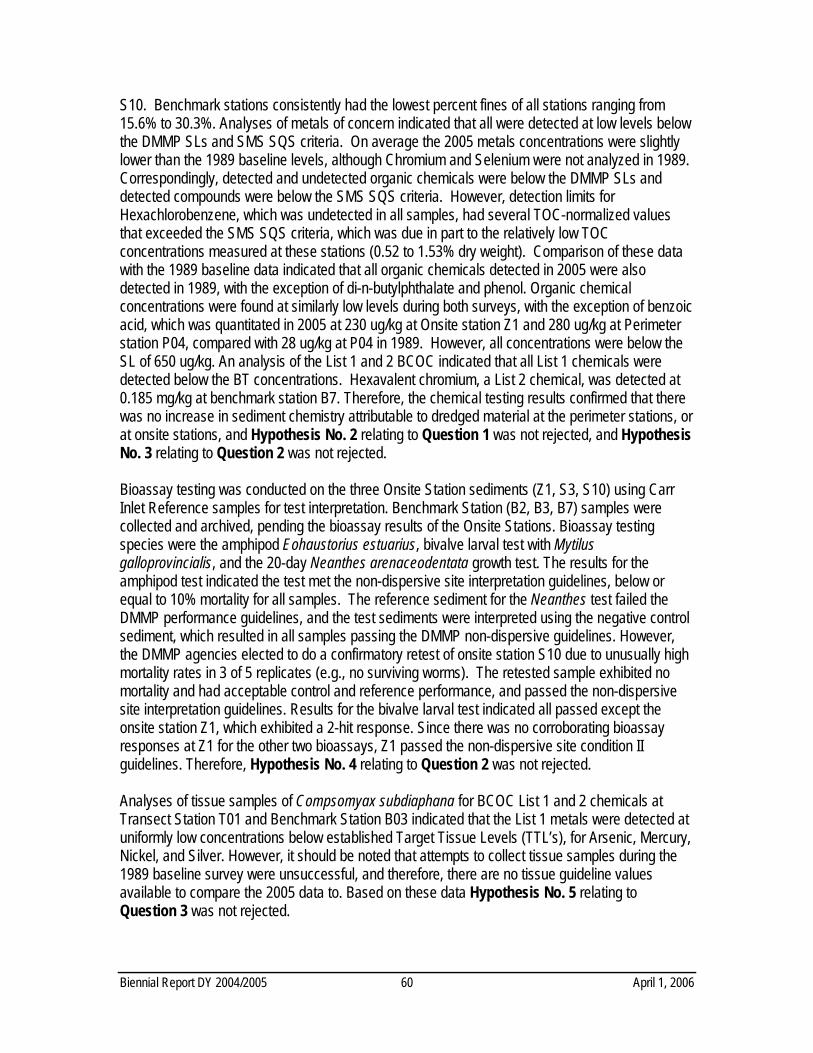
S10. Benchmark stations consistently had the lowest percent fines of all stations ranging from 15.6% to 30.3%. Analyses of metals of concern indicated that all were detected at low levels below the DMMP SLs and SMS SQS criteria. On average the 2005 metals concentrations were slightly lower than the 1989 baseline levels, although Chromium and Selenium were not analyzed in 1989. Correspondingly, detected and undetected organic chemicals were below the DMMP SLs and detected compounds were below the SMS SQS criteria. However, detection limits for Hexachlorobenzene, which was undetected in all samples, had several TOC-normalized values that exceeded the SMS SQS criteria, which was due in part to the relatively low TOC concentrations measured at these stations (0.52 to 1.53% dry weight). Comparison of these data with the 1989 baseline data indicated that all organic chemicals detected in 2005 were also detected in 1989, with the exception of di-n-butylphthalate and phenol. Organic chemical concentrations were found at similarly low levels during both surveys, with the exception of benzoic acid, which was quantitated in 2005 at 230 ug/kg at Onsite station Z1 and 280 ug/kg at Perimeter station P04, compared with 28 ug/kg at P04 in 1989. However, all concentrations were below the SL of 650 ug/kg. An analysis of the List 1 and 2 BCOC indicated that all List 1 chemicals were detected below the BT concentrations. Hexavalent chromium, a List 2 chemical, was detected at 0.185 mg/kg at benchmark station B7. Therefore, the chemical testing results confirmed that there was no increase in sediment chemistry attributable to dredged material at the perimeter stations, or at onsite stations, and Hypothesis No. 2 relating to Question 1 was not rejected, and Hypothesis No. 3 relating to Question 2 was not rejected. Bioassay testing was conducted on the three Onsite Station sediments (Z1, S3, S10) using Carr Inlet Reference samples for test interpretation. Benchmark Station (B2, B3, B7) samples were collected and archived, pending the bioassay results of the Onsite Stations. Bioassay testing species were the amphipod Eohaustorius estuarius, bivalve larval test with Mytilus galloprovincialis, and the 20-day Neanthes arenaceodentata growth test. The results for the amphipod test indicated the test met the non-dispersive site interpretation guidelines, below or equal to 10% mortality for all samples. The reference sediment for the Neanthes test failed the DMMP performance guidelines, and the test sediments were interpreted using the negative control sediment, which resulted in all samples passing the DMMP non-dispersive guidelines. However, the DMMP agencies elected to do a confirmatory retest of onsite station S10 due to unusually high mortality rates in 3 of 5 replicates (e.g., no surviving worms). The retested sample exhibited no mortality and had acceptable control and reference performance, and passed the non-dispersive site interpretation guidelines. Results for the bivalve larval test indicated all passed except the onsite station Z1, which exhibited a 2-hit response. Since there was no corroborating bioassay responses at Z1 for the other two bioassays, Z1 passed the non-dispersive site condition II guidelines. Therefore, Hypothesis No. 4 relating to Question 2 was not rejected. Analyses of tissue samples of Compsomyax subdiaphana for BCOC List 1 and 2 chemicals at Transect Station T01 and Benchmark Station B03 indicated that the List 1 metals were detected at uniformly low concentrations below established Target Tissue Levels (TTL’s), for Arsenic, Mercury, Nickel, and Silver. However, it should be noted that attempts to collect tissue samples during the 1989 baseline survey were unsuccessful, and therefore, there are no tissue guideline values available to compare the 2005 data to. Based on these data Hypothesis No. 5 relating to Question 3 was not rejected.
Biennial Report DY 2004/2005 60 April 1, 2006
Analysis of benthic samples at the three Transect stations (five replicates at each station) were processed, enumerated, and identified to the lowest taxonomic level possible. Benthic samples collected at each of the three Benchmark stations were archived. The 2005 results of abundance within each major taxonomic group were compared with the1989 baseline data. Unfortunately, the 1989 samples sorted species into major taxonomic groups, but did not identify benthic species down to the lowest taxonomic level possible. It also should be noted that the sampling protocol in place for processing benthic samples in 1989, utilized the entire core sample, whereas the protocol implemented in 1990 selectively focused on processing only the top 10 cm of the core sample. Therefore, comparing the 1989 data with the 2005 data has some limitations on its comparative utility. The comparisons show that total abundance and arthropod abundance was significantly lower at the 2005 Transect stations than observed in 1989. Correspondingly, the 2005 molluscan, annelida, and miscellaneous taxa abundances showed increased abundances relative to the 1989 baseline data. Overall abundances were depressed compared with the 1989 data, primarily attributable to the large numbers of arthropods. Based on the data at hand Hypothesis No. 6 relating to Question 6 was rejected. The DMMP agencies subsequently evaluated archived benchmark station samples to see if the lowered abundances observed at the Transect Stations were related to anarea wide depression in benthic abundances, and to arthropod decreases. These data confirmed that an area wide depression was likely responsible for the depression in arthropod abundances, and that the depressions in abundance were not attributable to dredged material disposal. During the spring/summer of 2006 the DMMP agencies analyzed archived sediment and tissue samplesfor Dibenzodioxins/furans. The results of those analyses will be summarized in the next biennial report.
Biennial Report DY 2004/2005 61 April 1, 2006
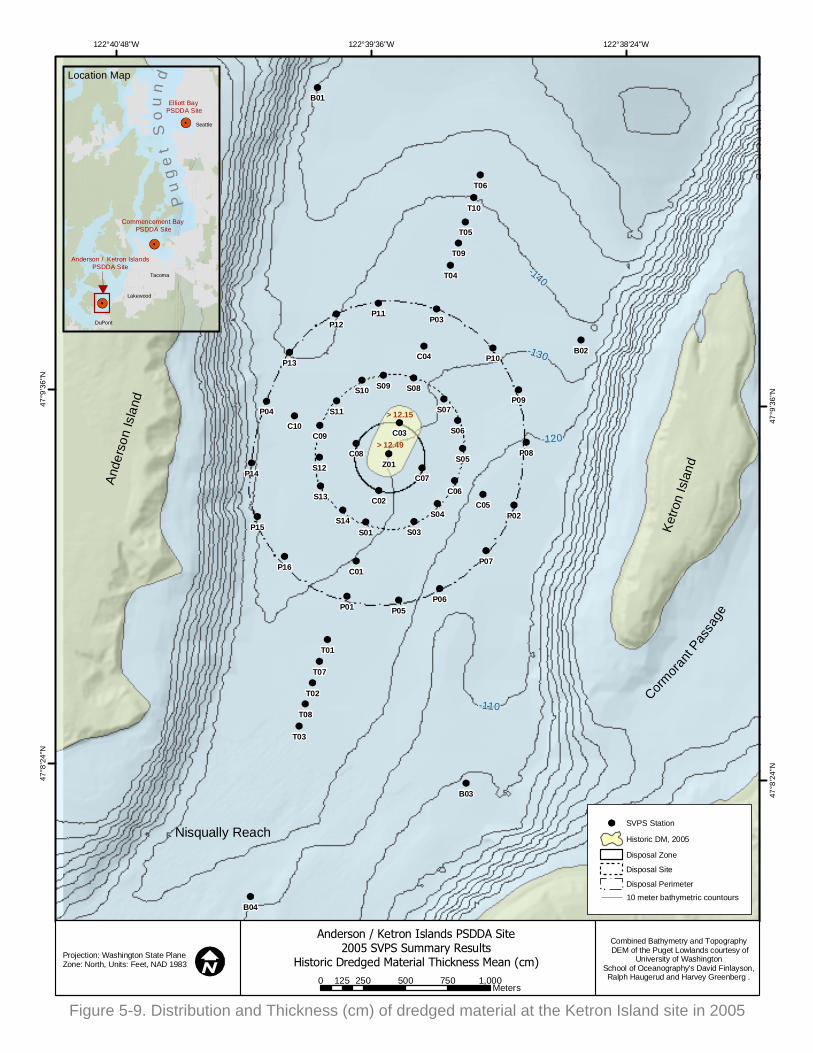
And
erso
n Is
land
Ket
ron
Isla
nd
Corm
oran
t Pas
sage
Nisqually Reach
-140-140
-130-130
-120-120
-110-110
> 12.49
> 12.15
Z01Z01
T10T10
T09T09
T08T08
T07T07
T06T06
T05T05
T04T04
T03T03
T02T02
T01T01
S14S14
S13S13
S12S12
S11S11
S10S10 S09S09 S08S08
S07S07
S06S06
S05S05
S04S04
S03S03S01S01
P16P16
P15P15
P14P14
P13P13
P12P12P11P11
P10P10
P09P09
P08P08
P07P07
P06P06P05P05
P04P04
P03P03
P02P02
P01P01
C10C10C09C09
C08C08
C07C07
C06C06
C05C05
C04C04
C03C03
C02C02
C01C01
B04B04
B03B03
B02B02
B01B01
122°40'48"W
122°40'48"W
122°39'36"W
122°39'36"W
122°38'24"W
122°38'24"W47
°8'2
4"N
47°8
'24
"N
47°9
'36
"N
47°9
'36
"N
Commencement Bay PSDDA Site
Elliott Bay PSDDA Site
Anderson / Ketron IslandsPSDDA Site
P u
g e
t S
o u
n d
Seattle
Tacoma
Lakewood
DuPont
Anderson / Ketron Islands PSDDA Site2005 SVPS Summary Results
Historic Dredged Material Thickness Mean (cm)0 250 500 750 1,000125
Meters
Projection: Washington State PlaneZone: North, Units: Feet, NAD 1983
Figure 5-9. Distribution and Thickness (cm) of dredged material at the Ketron Island site in 2005
SVPS Station
Historic DM, 2005
Disposal Zone
Disposal Site
Disposal Perimeter
10 meter bathymetric countours
Location Map
Combined Bathymetry and Topography DEM of the Puget Lowlands courtesy of
University of Washington School of Oceanography's David Finlayson, Ralph Haugerud and Harvey Greenberg .
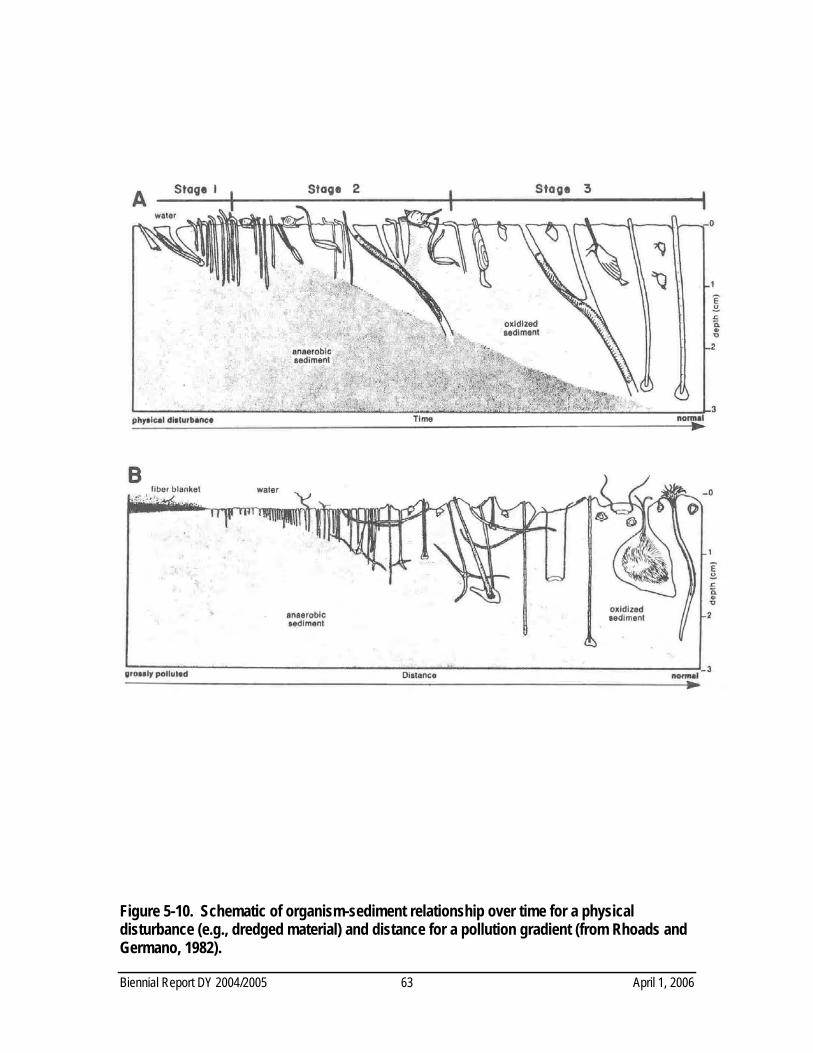
Figure 5-10. Schematic of organism-sediment relationship over time for a physical disturbance (e.g., dredged material) and distance for a pollution gradient (from Rhoads and Germano, 1982).
Biennial Report DY 2004/2005 63 April 1, 2006
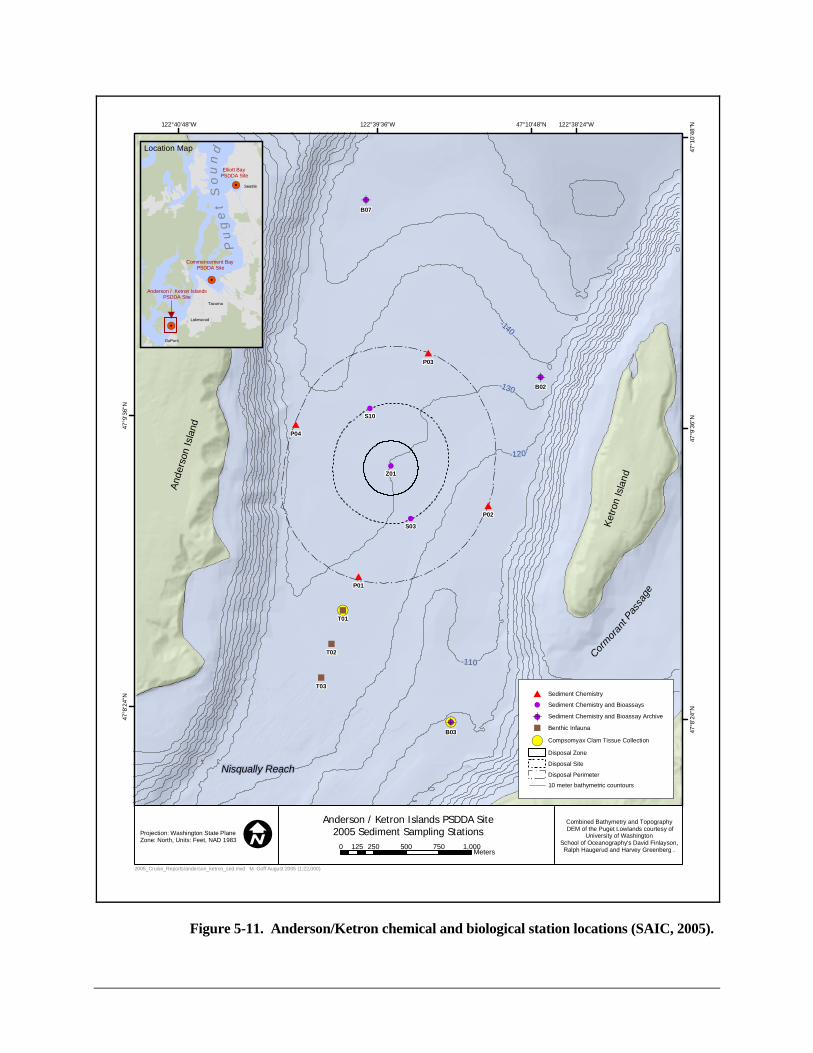
!
!
!
!
!
!
!!
!
!
!
!
!
!
!
!
!!
!!
!
!
!
!
!
!
!
!
!
!!
!
!
!
!
!
!
!
!
!!
!
!
!
!
!
!
!(
!(
"
"
"
!A
!A
!A
!
!
!
#
#
#
#
Ande
rson
Isla
nd
Ketro
n Is
land
Cormora
nt P
assa
ge
Nisqually Reach
-140
-130
-120
-110
T03
T02
T01
B07
B03
B02
S10
S03
Z01
P04
P03
P02
P01
122°40'48"W
122°40'48"W
122°39'36"W
122°39'36"W
122°38'24"W
122°38'24"W47
°8'2
4"N
47°8
'24"
N
47°9
'36"
N
47°9
'36"
N47
°10'
48"N47°10'48"N
!
!
!!
!!
!.
!.
!.
Commencement Bay PSDDA Site
Elliott Bay PSDDA Site
Anderson / Ketron IslandsPSDDA Site
P u
g e
t S
o u
n d
Seattle
Tacoma
Lakewood
DuPont
Anderson / Ketron Islands PSDDA Site2005 Sediment Sampling Stations
0 250 500 750 1,000125Meters
Projection: Washington State PlaneZone: North, Units: Feet, NAD 1983 I
2005_Cruise_Reports/anderson_ketron_sed.mxd M. Goff August 2005 (1:22,000)
# Sediment Chemistry
! Sediment Chemistry and Bioassays
!A Sediment Chemistry and Bioassay Archive
" Benthic Infauna
!( Compsomyax Clam Tissue Collection
Disposal Zone
Disposal Site
!
!
!
!
Disposal Perimeter
10 meter bathymetric countours
Location Map
Combined Bathymetry and Topography DEM of the Puget Lowlands courtesy of
University of Washington School of Oceanography's David Finlayson, Ralph Haugerud and Harvey Greenberg .
Figure 5-11. Anderson/Ketron chemical and biological station locations (SAIC, 2005).
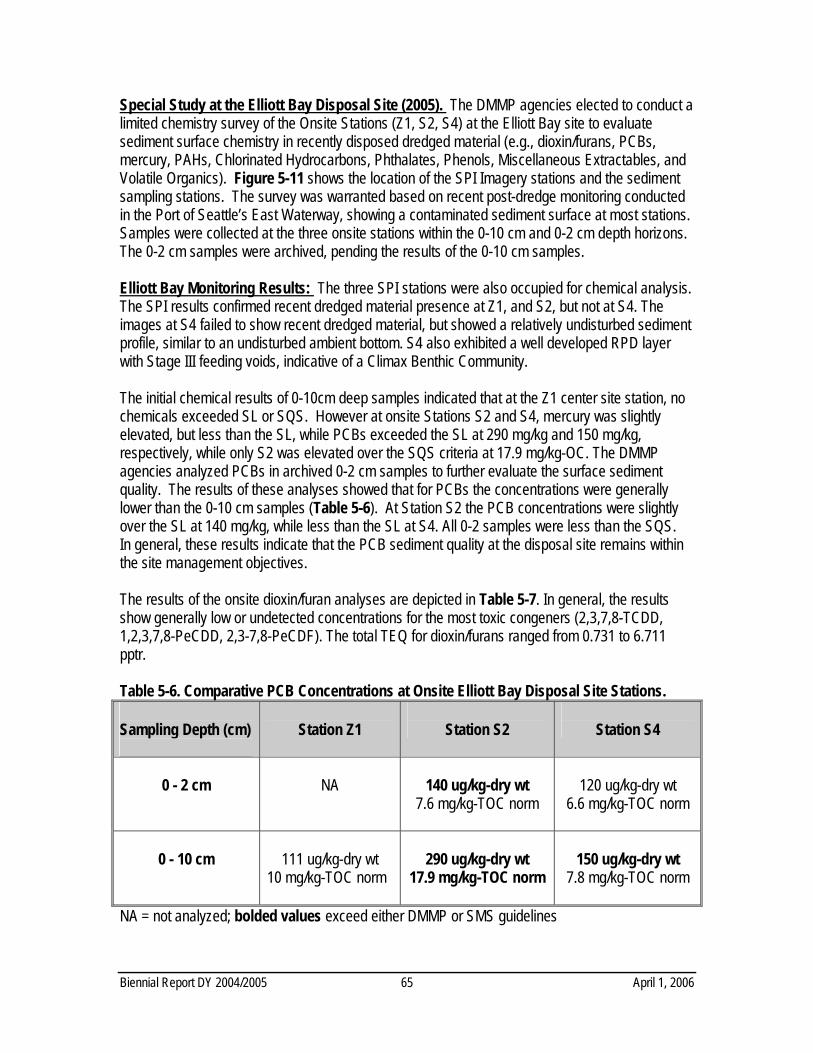
Biennial Report DY 2004/2005
65 April 1, 2006
Special Study at the Elliott Bay Disposal Site (2005). The DMMP agencies elected to conduct a limited chemistry survey of the Onsite Stations (Z1, S2, S4) at the Elliott Bay site to evaluate sediment surface chemistry in recently disposed dredged material (e.g., dioxin/furans, PCBs, mercury, PAHs, Chlorinated Hydrocarbons, Phthalates, Phenols, Miscellaneous Extractables, and Volatile Organics). Figure 5-11 shows the location of the SPI Imagery stations and the sediment sampling stations. The survey was warranted based on recent post-dredge monitoring conducted in the Port of Seattle’s East Waterway, showing a contaminated sediment surface at most stations. Samples were collected at the three onsite stations within the 0-10 cm and 0-2 cm depth horizons. The 0-2 cm samples were archived, pending the results of the 0-10 cm samples. Elliott Bay Monitoring Results: The three SPI stations were also occupied for chemical analysis. The SPI results confirmed recent dredged material presence at Z1, and S2, but not at S4. The images at S4 failed to show recent dredged material, but showed a relatively undisturbed sediment profile, similar to an undisturbed ambient bottom. S4 also exhibited a well developed RPD layer with Stage III feeding voids, indicative of a Climax Benthic Community. The initial chemical results of 0-10cm deep samples indicated that at the Z1 center site station, no chemicals exceeded SL or SQS. However at onsite Stations S2 and S4, mercury was slightly elevated, but less than the SL, while PCBs exceeded the SL at 290 mg/kg and 150 mg/kg, respectively, while only S2 was elevated over the SQS criteria at 17.9 mg/kg-OC. The DMMP agencies analyzed PCBs in archived 0-2 cm samples to further evaluate the surface sediment quality. The results of these analyses showed that for PCBs the concentrations were generally lower than the 0-10 cm samples (Table 5-6). At Station S2 the PCB concentrations were slightly over the SL at 140 mg/kg, while less than the SL at S4. All 0-2 samples were less than the SQS. In general, these results indicate that the PCB sediment quality at the disposal site remains within the site management objectives. The results of the onsite dioxin/furan analyses are depicted in Table 5-7. In general, the results show generally low or undetected concentrations for the most toxic congeners (2,3,7,8-TCDD, 1,2,3,7,8-PeCDD, 2,3-7,8-PeCDF). The total TEQ for dioxin/furans ranged from 0.731 to 6.711 pptr. Table 5-6. Comparative PCB Concentrations at Onsite Elliott Bay Disposal Site Stations. Sampling Depth (cm)
Station Z1
Station S2
Station S4
0 - 2 cm
NA
140 ug/kg-dry wt
7.6 mg/kg-TOC norm
120 ug/kg-dry wt
6.6 mg/kg-TOC norm
0 - 10 cm
111 ug/kg-dry wt
10 mg/kg-TOC norm
290 ug/kg-dry wt
17.9 mg/kg-TOC norm
150 ug/kg-dry wt
7.8 mg/kg-TOC norm
NA = not analyzed; bolded values exceed either DMMP or SMS guidelines
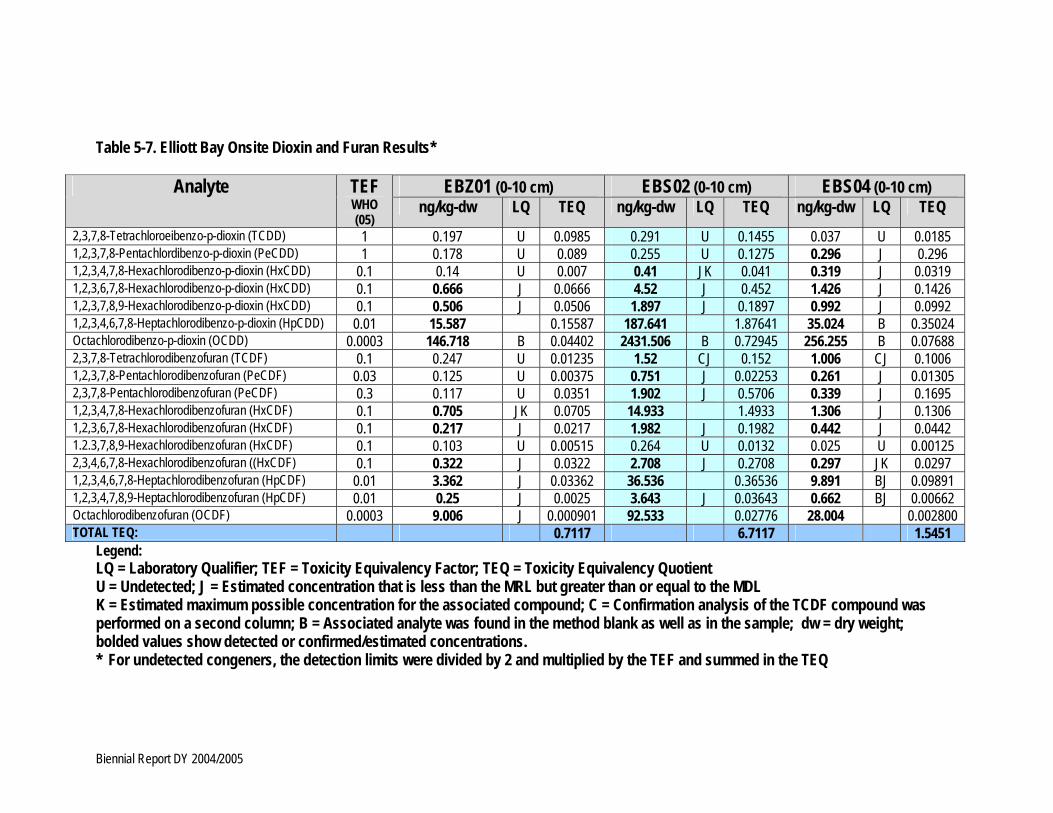
Table 5-7. Elliott Bay Onsite Dioxin and Furan Results*
EBZ01 (0-10 cm) EBS02 (0-10 cm) EBS04 (0-10 cm) Analyte TEF WHO (05)
ng/kg-dw LQ TEQ ng/kg-dw LQ TEQ ng/kg-dw LQ TEQ 2,3,7,8-Tetrachloroeibenzo-p-dioxin (TCDD) 1 0.197 U 0.0985 0.291 U 0.1455 0.037 U 0.01851,2,3,7,8-Pentachlordibenzo-p-dioxin (PeCDD) 1 0.178 U 0.089 0.255 U 0.1275 0.296 J 0.2961,2,3,4,7,8-Hexachlorodibenzo-p-dioxin (HxCDD) 0.1 0.14 U 0.007 0.41 JK 0.041 0.319 J 0.03191,2,3,6,7,8-Hexachlorodibenzo-p-dioxin (HxCDD) 0.1 0.666 J 0.0666 4.52 J 0.452 1.426 J 0.14261,2,3,7,8,9-Hexachlorodibenzo-p-dioxin (HxCDD) 0.1 0.506 J 0.0506 1.897 J 0.1897 0.992 J 0.09921,2,3,4,6,7,8-Heptachlorodibenzo-p-dioxin (HpCDD) 0.01 15.587 0.15587 187.641 1.87641 35.024 B 0.35024Octachlorodibenzo-p-dioxin (OCDD) 0.0003 146.718 B 0.04402 2431.506 B 0.72945 256.255 B 0.076882,3,7,8-Tetrachlorodibenzofuran (TCDF) 0.1 0.247 U 0.01235 1.52 CJ 0.152 1.006 CJ 0.10061,2,3,7,8-Pentachlorodibenzofuran (PeCDF) 0.03 0.125 U 0.00375 0.751 J 0.02253 0.261 J 0.013052,3,7,8-Pentachlorodibenzofuran (PeCDF) 0.3 0.117 U 0.0351 1.902 J 0.5706 0.339 J 0.16951,2,3,4,7,8-Hexachlorodibenzofuran (HxCDF) 0.1 0.705 JK 0.0705 14.933 1.4933 1.306 J 0.13061,2,3,6,7,8-Hexachlorodibenzofuran (HxCDF) 0.1 0.217 J 0.0217 1.982 J 0.1982 0.442 J 0.04421.2.3,7,8,9-Hexachlorodibenzofuran (HxCDF) 0.1 0.103 U 0.00515 0.264 U 0.0132 0.025 U 0.001252,3,4,6,7,8-Hexachlorodibenzofuran ((HxCDF) 0.1 0.322 J 0.0322 2.708 J 0.2708 0.297 JK 0.02971,2,3,4,6,7,8-Heptachlorodibenzofuran (HpCDF) 0.01 3.362 J 0.03362 36.536 0.36536 9.891 BJ 0.098911,2,3,4,7,8,9-Heptachlorodibenzofuran (HpCDF) 0.01 0.25 J 0.0025 3.643 J 0.03643 0.662 BJ 0.00662Octachlorodibenzofuran (OCDF) 0.0003 9.006 J 0.000901 92.533 0.02776 28.004 0.002800 TOTAL TEQ: 0.7117 6.7117 1.5451
Legend: LQ = Laboratory Qualifier; TEF = Toxicity Equivalency Factor; TEQ = Toxicity Equivalency Quotient U = Undetected; J = Estimated concentration that is less than the MRL but greater than or equal to the MDL K = Estimated maximum possible concentration for the associated compound; C = Confirmation analysis of the TCDF compound was performed on a second column; B = Associated analyte was found in the method blank as well as in the sample; dw = dry weight; bolded values show detected or confirmed/estimated concentrations. * For undetected congeners, the detection limits were divided by 2 and multiplied by the TEF and summed in the TEQ
Biennial Report DY 2004/2005
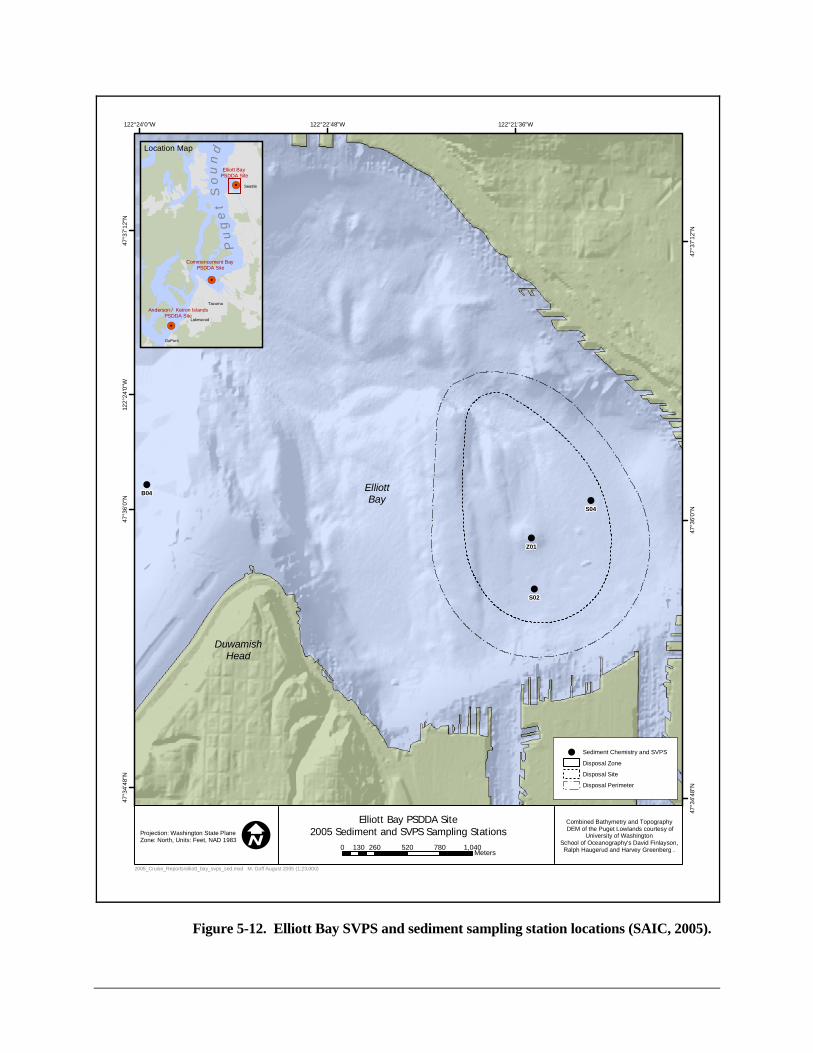
3
!!
!
!
!
!
!
!
!
!
!
!
!
!
!
!
!
!!
!
!
!
!
!
!
!
!
!
!
!!
!
!
!
!
!
!
!
!
!
!!
!!
!!
!!
!!
!
!
!
!
!
!
!
DuwamishHead
ElliottBay
Z01
S04
S02
B04
122°24'0"W
122°22'48"W
122°22'48"W
122°21'36"W
122°21'36"W47
°34'
48"N
47°3
4'48
"N
47°3
6'0"
N
47°3
6'0"
N
47°3
7'12
"N
47°3
7'12
"N
122°
24'0
"W
!
!
!!
!!
!.
!.
!.
Commencement Bay PSDDA Site
Elliott Bay PSDDA Site
Anderson / Ketron IslandsPSDDA Site
P u
g e
t S
o u
n d
Seattle
Tacoma
Lakewood
DuPont
Elliott Bay PSDDA Site2005 Sediment and SVPS Sampling Stations
0 260 520 780 1,040130Meters
Projection: Washington State PlaneZone: North, Units: Feet, NAD 1983 I
2005_Cruise_Reports/elliott_bay_svps_sed.mxd M. Goff August 2005 (1:23,000)
! Sediment Chemistry and SVPS
Disposal Zone
Disposal Site
!
!
!
!
Disposal Perimeter
Location Map
Combined Bathymetry and Topography DEM of the Puget Lowlands courtesy of
University of Washington School of Oceanography's David Finlayson, Ralph Haugerud and Harvey Greenberg .
Figure 5-12. Elliott Bay SVPS and sediment sampling station locations (SAIC, 2005).
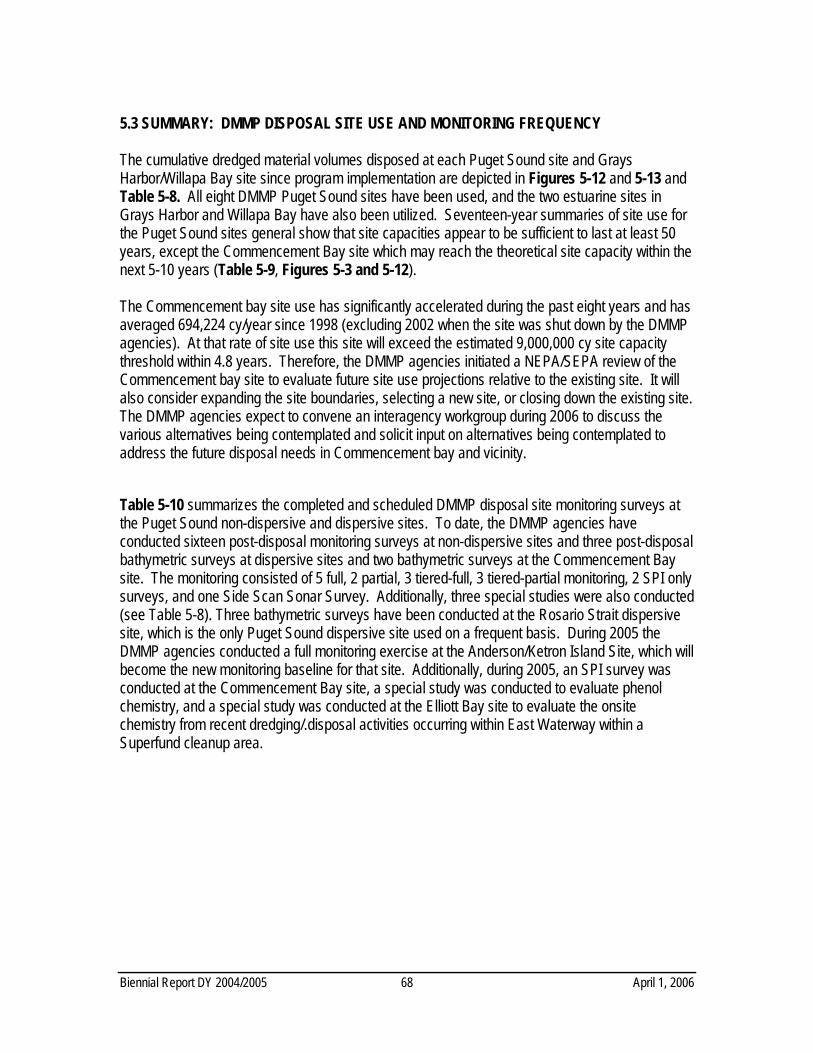
Biennial Report DY 2004/2005
68 April 1, 2006
5.3 SUMMARY: DMMP DISPOSAL SITE USE AND MONITORING FREQUENCY The cumulative dredged material volumes disposed at each Puget Sound site and Grays Harbor/Willapa Bay site since program implementation are depicted in Figures 5-12 and 5-13 and Table 5-8. All eight DMMP Puget Sound sites have been used, and the two estuarine sites in Grays Harbor and Willapa Bay have also been utilized. Seventeen-year summaries of site use for the Puget Sound sites general show that site capacities appear to be sufficient to last at least 50 years, except the Commencement Bay site which may reach the theoretical site capacity within the next 5-10 years (Table 5-9, Figures 5-3 and 5-12). The Commencement bay site use has significantly accelerated during the past eight years and has averaged 694,224 cy/year since 1998 (excluding 2002 when the site was shut down by the DMMP agencies). At that rate of site use this site will exceed the estimated 9,000,000 cy site capacity threshold within 4.8 years. Therefore, the DMMP agencies initiated a NEPA/SEPA review of the Commencement bay site to evaluate future site use projections relative to the existing site. It will also consider expanding the site boundaries, selecting a new site, or closing down the existing site. The DMMP agencies expect to convene an interagency workgroup during 2006 to discuss the various alternatives being contemplated and solicit input on alternatives being contemplated to address the future disposal needs in Commencement bay and vicinity. Table 5-10 summarizes the completed and scheduled DMMP disposal site monitoring surveys at the Puget Sound non-dispersive and dispersive sites. To date, the DMMP agencies have conducted sixteen post-disposal monitoring surveys at non-dispersive sites and three post-disposal bathymetric surveys at dispersive sites and two bathymetric surveys at the Commencement Bay site. The monitoring consisted of 5 full, 2 partial, 3 tiered-full, 3 tiered-partial monitoring, 2 SPI only surveys, and one Side Scan Sonar Survey. Additionally, three special studies were also conducted (see Table 5-8). Three bathymetric surveys have been conducted at the Rosario Strait dispersive site, which is the only Puget Sound dispersive site used on a frequent basis. During 2005 the DMMP agencies conducted a full monitoring exercise at the Anderson/Ketron Island Site, which will become the new monitoring baseline for that site. Additionally, during 2005, an SPI survey was conducted at the Commencement Bay site, a special study was conducted to evaluate phenol chemistry, and a special study was conducted at the Elliott Bay site to evaluate the onsite chemistry from recent dredging/.disposal activities occurring within East Waterway within a Superfund cleanup area.
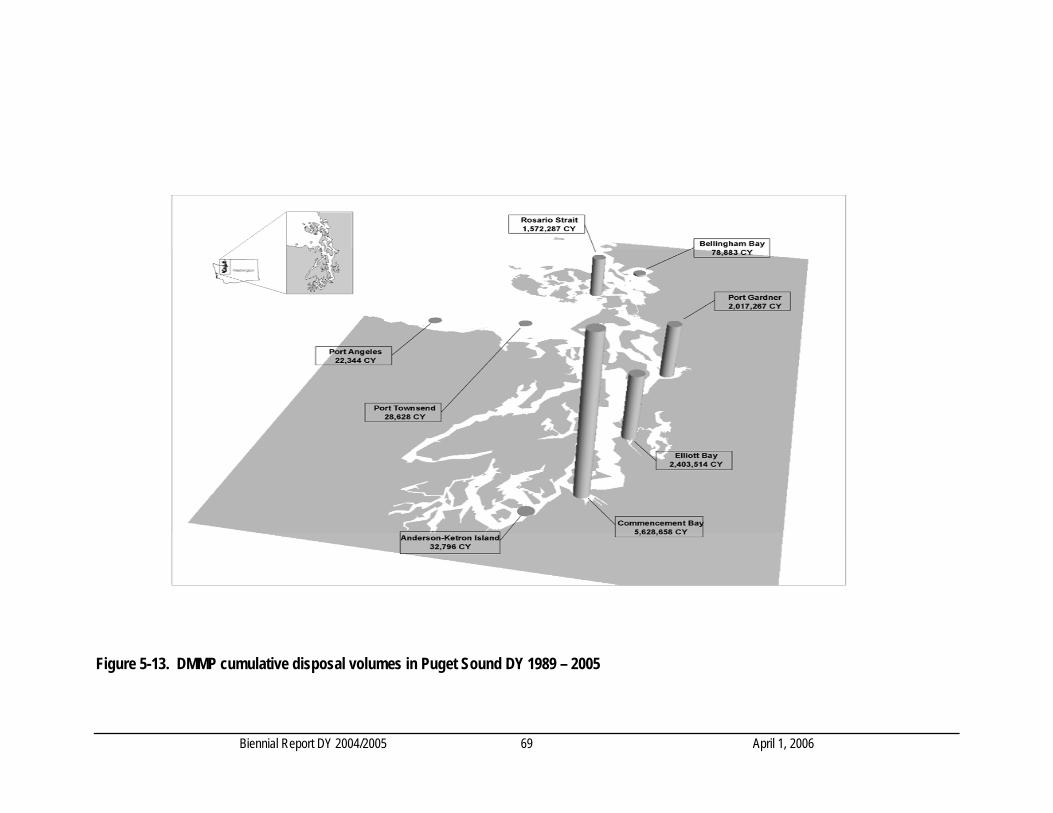
Figure 5-13. DMMP cumulative disposal volumes in Puget Sound DY 1989 – 2005
Biennial Report DY 2004/2005 69 April 1, 2006
Figure-14. Cumulative disposal volumes for Grays Harbor DY 1996 – 2005.
Biennial Report DY 2004/2005 70 April 1, 2006
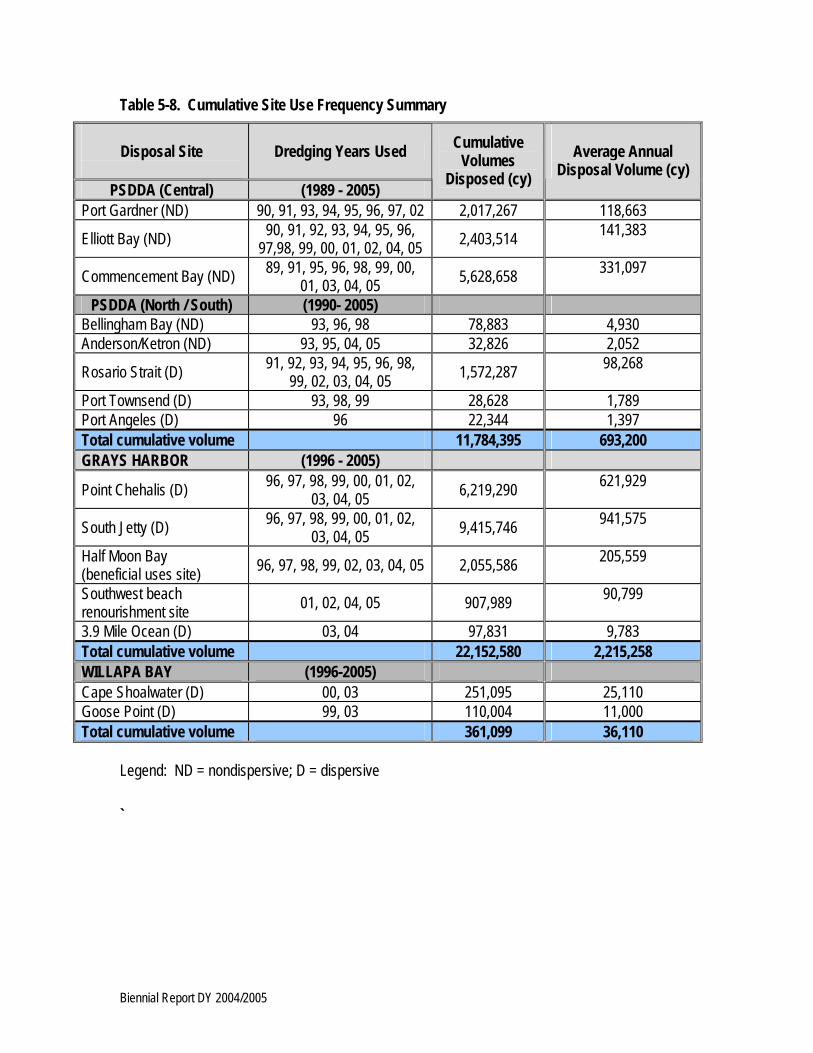
Table 5-8. Cumulative Site Use Frequency Summary
Disposal Site
Dredging Years Used
PSDDA (Central) (1989 - 2005)
Cumulative Volumes
Disposed (cy)
Average Annual
Disposal Volume (cy)
Port Gardner (ND) 90, 91, 93, 94, 95, 96, 97, 02 2,017,267 118,663
Elliott Bay (ND) 90, 91, 92, 93, 94, 95, 96, 97,98, 99, 00, 01, 02, 04, 05 2,403,514 141,383
Commencement Bay (ND) 89, 91, 95, 96, 98, 99, 00, 01, 03, 04, 05 5,628,658 331,097
PSDDA (North / South) (1990- 2005) Bellingham Bay (ND) 93, 96, 98 78,883 4,930 Anderson/Ketron (ND) 93, 95, 04, 05 32,826 2,052
Rosario Strait (D) 91, 92, 93, 94, 95, 96, 98, 99, 02, 03, 04, 05 1,572,287 98,268
Port Townsend (D) 93, 98, 99 28,628 1,789 Port Angeles (D) 96 22,344 1,397 Total cumulative volume 11,784,395 693,200 GRAYS HARBOR (1996 - 2005)
Point Chehalis (D) 96, 97, 98, 99, 00, 01, 02, 03, 04, 05 6,219,290 621,929
South Jetty (D) 96, 97, 98, 99, 00, 01, 02, 03, 04, 05 9,415,746 941,575
Half Moon Bay (beneficial uses site) 96, 97, 98, 99, 02, 03, 04, 05 2,055,586 205,559
Southwest beach renourishment site 01, 02, 04, 05 907,989 90,799
3.9 Mile Ocean (D) 03, 04 97,831 9,783 Total cumulative volume 22,152,580 2,215,258 WILLAPA BAY (1996-2005) Cape Shoalwater (D) 00, 03 251,095 25,110 Goose Point (D) 99, 03 110,004 11,000 Total cumulative volume 361,099 36,110
Legend: ND = nondispersive; D = dispersive `
Biennial Report DY 2004/2005
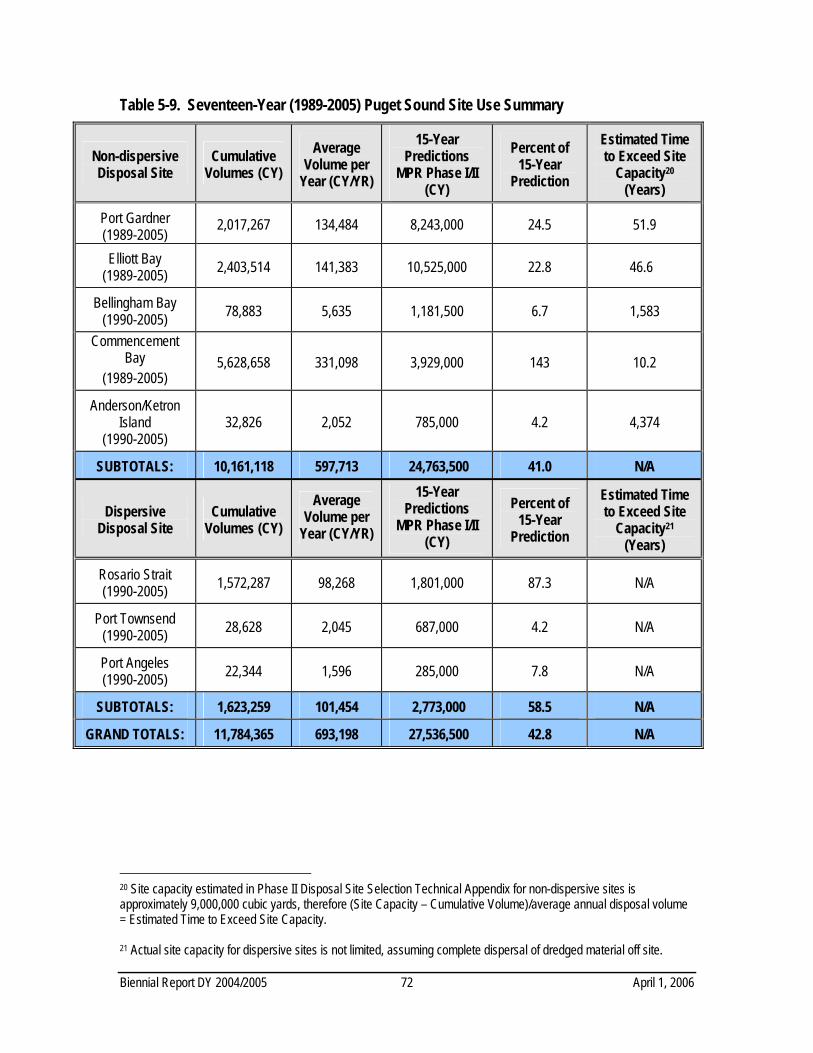
Table 5-9. Seventeen-Year (1989-2005) Puget Sound Site Use Summary
Non-dispersive Disposal Site
Cumulative Volumes (CY)
Average Volume per
Year (CY/YR)
15-Year Predictions
MPR Phase I/II (CY)
Percent of 15-Year
Prediction
Estimated Time to Exceed Site
Capacity20 (Years)
Port Gardner (1989-2005)
2,017,267 134,484 8,243,000 24.5 51.9
Elliott Bay (1989-2005) 2,403,514 141,383 10,525,000 22.8 46.6
Bellingham Bay (1990-2005) 78,883 5,635 1,181,500 6.7 1,583
Commencement Bay
(1989-2005) 5,628,658 331,098 3,929,000 143 10.2
Anderson/Ketron Island
(1990-2005) 32,826 2,052 785,000 4.2 4,374
SUBTOTALS: 10,161,118 597,713 24,763,500 41.0 N/A
Dispersive Disposal Site
Cumulative Volumes (CY)
Average Volume per
Year (CY/YR)
15-Year Predictions
MPR Phase I/II (CY)
Percent of 15-Year
Prediction
Estimated Time to Exceed Site
Capacity21 (Years)
Rosario Strait (1990-2005) 1,572,287 98,268 1,801,000 87.3 N/A
Port Townsend (1990-2005) 28,628 2,045 687,000 4.2 N/A
Port Angeles (1990-2005) 22,344 1,596 285,000 7.8 N/A
SUBTOTALS: 1,623,259 101,454 2,773,000 58.5 N/A
GRAND TOTALS: 11,784,365 693,198 27,536,500 42.8 N/A
20 Site capacity estimated in Phase II Disposal Site Selection Technical Appendix for non-dispersive sites is approximately 9,000,000 cubic yards, therefore (Site Capacity – Cumulative Volume)/average annual disposal volume = Estimated Time to Exceed Site Capacity. 21 Actual site capacity for dispersive sites is not limited, assuming complete dispersal of dredged material off site.
Biennial Report DY 2004/2005 72 April 1, 2006
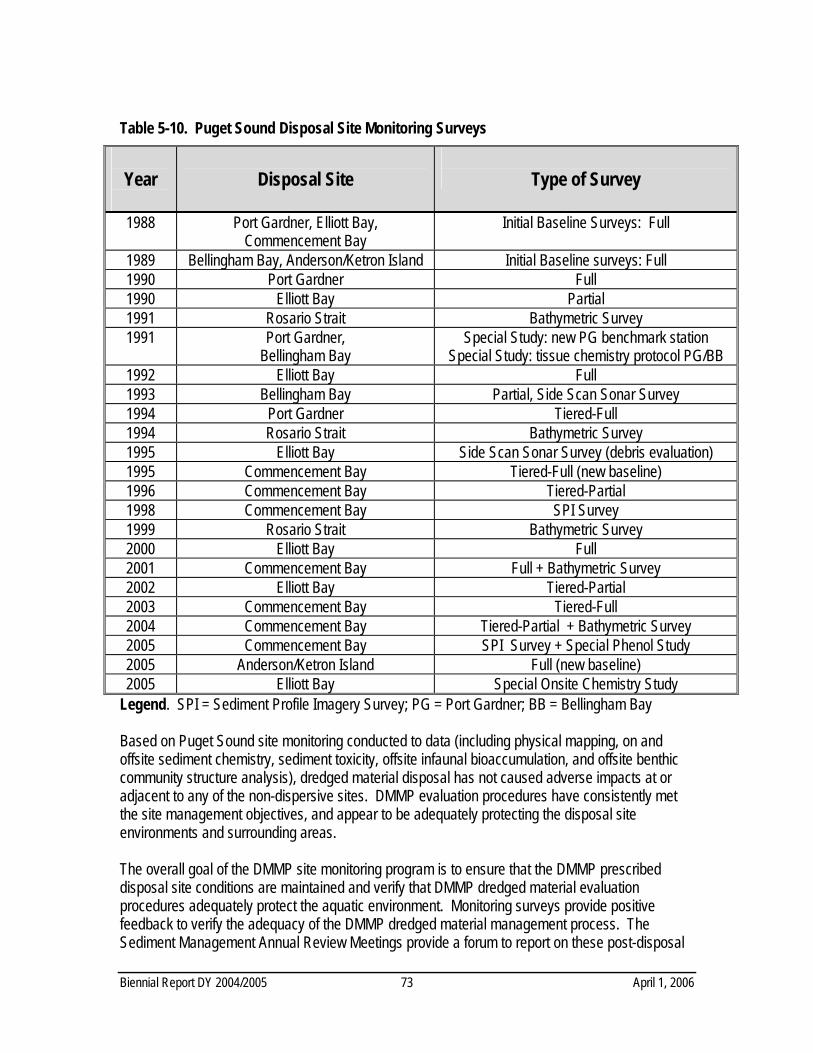
Table 5-10. Puget Sound Disposal Site Monitoring Surveys
Year
Disposal Site
Type of Survey
1988 Port Gardner, Elliott Bay, Commencement Bay
Initial Baseline Surveys: Full
1989 Bellingham Bay, Anderson/Ketron Island Initial Baseline surveys: Full 1990 Port Gardner Full 1990 Elliott Bay Partial 1991 Rosario Strait Bathymetric Survey 1991 Port Gardner,
Bellingham Bay Special Study: new PG benchmark station
Special Study: tissue chemistry protocol PG/BB 1992 Elliott Bay Full 1993 Bellingham Bay Partial, Side Scan Sonar Survey 1994 Port Gardner Tiered-Full 1994 Rosario Strait Bathymetric Survey 1995 Elliott Bay Side Scan Sonar Survey (debris evaluation) 1995 Commencement Bay Tiered-Full (new baseline) 1996 Commencement Bay Tiered-Partial 1998 Commencement Bay SPI Survey 1999 Rosario Strait Bathymetric Survey 2000 Elliott Bay Full 2001 Commencement Bay Full + Bathymetric Survey 2002 Elliott Bay Tiered-Partial 2003 Commencement Bay Tiered-Full 2004 Commencement Bay Tiered-Partial + Bathymetric Survey 2005 Commencement Bay SPI Survey + Special Phenol Study 2005 Anderson/Ketron Island Full (new baseline) 2005 Elliott Bay Special Onsite Chemistry Study
Legend. SPI = Sediment Profile Imagery Survey; PG = Port Gardner; BB = Bellingham Bay Based on Puget Sound site monitoring conducted to data (including physical mapping, on and offsite sediment chemistry, sediment toxicity, offsite infaunal bioaccumulation, and offsite benthic community structure analysis), dredged material disposal has not caused adverse impacts at or adjacent to any of the non-dispersive sites. DMMP evaluation procedures have consistently met the site management objectives, and appear to be adequately protecting the disposal site environments and surrounding areas. The overall goal of the DMMP site monitoring program is to ensure that the DMMP prescribed disposal site conditions are maintained and verify that DMMP dredged material evaluation procedures adequately protect the aquatic environment. Monitoring surveys provide positive feedback to verify the adequacy of the DMMP dredged material management process. The Sediment Management Annual Review Meetings provide a forum to report on these post-disposal
Biennial Report DY 2004/2005 73 April 1, 2006
survey findings conducted during any given dredging year, and any management plan adjustments if needed. The PSDDA Management Plan Reports (MPR, 1998, 1989) recognize that intensive post-disposal monitoring surveys would be required early in the program implementation to gather data on the adequacy of the evaluation procedures to meet the site management objectives. All the monitoring events to data have not detected unexpected adverse impacts at any of the non-dispersive sites that have been monitored. In accordance with the management plan, following the 1997 SMARM, the DMMP agencies reduced the frequency and scope of monitoring based on past documented compliance with the site management objectives. The DMMP agencies increased the disposal volume soft trigger initiating site monitoring from 300,000 cy to 500,000 cy at the Commencement Bay, Elliott Bay, and Port Gardner disposal sites following the 2002 SMARM, but left the volume trigger at 300,000 cy for the two less frequently used non-dispersive sites (Bellingham Bay and Ketron/Anderson Island). It should be emphasized that the monitoring triggers are soft triggers, and may be relaxed at the discretion of the DMMP agencies based on best-professional-judgment. The Corps, in consultation with the DMMP agencies re-initiated consultation process with the National Marine Fisheries Service (NMFS) and U.S. Fish and Wildlife Service (USFWS) under Section 7 of the Endangered Species Act (ESA) during March 2005 relative to the Puget Sound disposal sites after updating the existing programmatic biological evaluation. The findings of NMFS and USFWS in their respective concurrence letters (June 15, 2005 and May 17, 2005) found that disposal of dredged material at the five non-dispersive disposal sites and three dispersive sites “may affect, but are not likely to adversely affect” the listed species. In 1996, the Magnuson-Stevens Fishery Conservation and Management Act (MSFCMA) was reauthorized and amended to establish procedures designed to identify, conserve, and enhance Essential Fish Habitat (EFH) for those species regulated under a federal fisheries management plan (i.e. only for commercially harvested species). MSFCMA requires all federal agencies to consult with NMFS on all actions, or proposed actions, authorized, funded, or undertaken by the agency that may adversely affect EFH (MSFCMA 305(b)(2)). Therefore, the Corps, in consultation with the DMMP agencies, updated the existing Essential Fish Habitat Assessment for the eight PSDDA disposal sites in Puget Sound as part of the Programmatic Biological Evaluation for the Section 7 ESA Consultation. The objective of this EFH assessment was to describe potential adverse effects to designated EFH for federally managed fisheries species within the proposed action areas. It also describes conservation measures proposed by the U.S. Army Corps of Engineers (Corps) to avoid, minimize, or otherwise offset potential adverse effects to designated EFH resulting from the proposed action. Monitoring results verify that during the first 16 years of operation of the sites, the program management plan has effectively protected the environment from unacceptable impacts. Continued use of the DMMP management and monitoring program, including adaptive management, is expected to allow continued safe and publicly acceptable disposal of dredged materials. Therefore, potential cumulative impacts to designated EFH are not considered to be significant. The NMFS issued an opinion (June15, 2005 letter) under consultation on the EFH programmatic assessment, which will be in effect until June 2010, which states that the built-in conservation measures described in the EFH Assessment, while not completely avoiding the adverse effects attributable to open-water disposal of dredged material, they do minimize, to the maximum extent practicable, those effects.
Biennial Report DY 2004/2005 74 April 1, 2006
REFERENCES Long, E.R., M. Dutch, S. Aasen, K. Welch, and M.J. Hameedi. 2003. Chemical contamination,
acute toxicity in laboratory tests, and benthic impacts in sediments of Puget Sound. A summary of results of the joint 1997-1999 Ecology/NOAA survey. October 2003. Publication No. 03-03-049. Prepared by the Washington State Department of Ecology, Olympia, WA, and the National Oceanic and Atmospheric Administration, Silver Springs, Maryland (http://www.ecy.wa.gov/pubs/0303049.pdf)
PTI, 1988. Puget Sound Dredged Disposal Analysis: Baseline Survey of Phase I Disposal Sites.
Prepared for Washington Department of Ecology. PTI Environmental Services, Bellevue, WA.
PTI, 1989. Puget Sound Dredged Disposal Analysis: Baseline Survey of Phase II Disposal Sites.
Prepared for Washington Department of Ecology. PTI Environmental Services, Bellevue, WA.
Rhoads, D.C., and J.D. Germano. 1982. Characteristics of benthic processes using sediment-
profile imaging: an efficient method of Remote Ecological Monitoring of the Seafloor (REMOTS System). Mar. Ecol. Prog. Ser. 8: 115-128.
SAIC, 2004. 2004 Tiered-Partial Monitoring at Commencement Bay, Tacoma, WA. Draft Report.
Prepared for Washington Department of Natural Resources. Sciences Application International Corporation, Bothell, WA.
SAIC, 2005. Physical Monitoring and Phenol Study at the Commencement bay PSDDA Site,
Tacoma, Washington, Draft Report, December 9, 2005. Prepared for Washington Department of Natural Resources and the DMMP Agencies. Sciences Application International Corporation, Bothell, WA.
SAIC, 2005. 2005 Full Monitoring at Anderson/Ketron Island PSDDA Disposal Sites. Draft Report.
Prepared for Washington Department of Natural Resources and the DMMP Agencies. Sciences Application International Corporation, Bothell, WA.
SAIC, 2005. 2005 Contaminant Investigation at the Elliott Bay PSDDA Site, Draft Data Report.
Prepared for Washington Department of Natural Resources and the DMMP Agencies. Sciences Application International Corporation, Bothell, WA.
SAIC, 2006. Analysis of Archived Benthic Samples - Supplemental Data Report 2005 Full Monitoring at the Anderson/Ketron Islands PSDDA Site. Prepared for Washington Department of Natural Resources and the DMMP Agencies. Sciences Application International Corporation, Bothell, WA.
Biennial Report DY 2004/2005 75 April 1, 2006
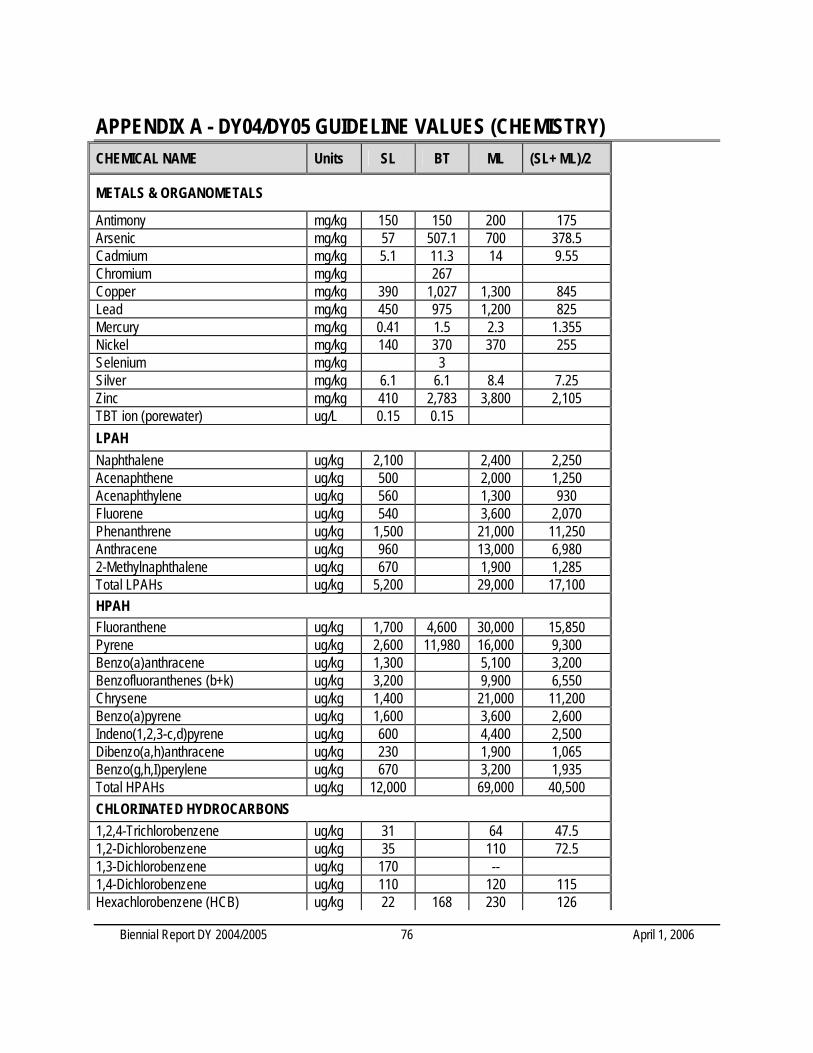
Biennial Report DY 2004/2005 76 April 1, 2006
APPENDIX A - DY04/DY05 GUIDELINE VALUES (CHEMISTRY) CHEMICAL NAME Units SL BT ML (SL+ ML)/2
METALS & ORGANOMETALS
Antimony mg/kg 150 150 200 175 Arsenic mg/kg 57 507.1 700 378.5 Cadmium mg/kg 5.1 11.3 14 9.55 Chromium mg/kg 267 Copper mg/kg 390 1,027 1,300 845 Lead mg/kg 450 975 1,200 825 Mercury mg/kg 0.41 1.5 2.3 1.355 Nickel mg/kg 140 370 370 255 Selenium mg/kg 3 Silver mg/kg 6.1 6.1 8.4 7.25 Zinc mg/kg 410 2,783 3,800 2,105 TBT ion (porewater) ug/L 0.15 0.15 LPAH Naphthalene ug/kg 2,100 2,400 2,250 Acenaphthene ug/kg 500 2,000 1,250 Acenaphthylene ug/kg 560 1,300 930 Fluorene ug/kg 540 3,600 2,070 Phenanthrene ug/kg 1,500 21,000 11,250 Anthracene ug/kg 960 13,000 6,980 2-Methylnaphthalene ug/kg 670 1,900 1,285 Total LPAHs ug/kg 5,200 29,000 17,100 HPAH Fluoranthene ug/kg 1,700 4,600 30,000 15,850 Pyrene ug/kg 2,600 11,980 16,000 9,300 Benzo(a)anthracene ug/kg 1,300 5,100 3,200 Benzofluoranthenes (b+k) ug/kg 3,200 9,900 6,550 Chrysene ug/kg 1,400 21,000 11,200 Benzo(a)pyrene ug/kg 1,600 3,600 2,600 Indeno(1,2,3-c,d)pyrene ug/kg 600 4,400 2,500 Dibenzo(a,h)anthracene ug/kg 230 1,900 1,065 Benzo(g,h,I)perylene ug/kg 670 3,200 1,935 Total HPAHs ug/kg 12,000 69,000 40,500 CHLORINATED HYDROCARBONS 1,2,4-Trichlorobenzene ug/kg 31 64 47.5 1,2-Dichlorobenzene ug/kg 35 110 72.5 1,3-Dichlorobenzene ug/kg 170 -- 1,4-Dichlorobenzene ug/kg 110 120 115 Hexachlorobenzene (HCB) ug/kg 22 168 230 126
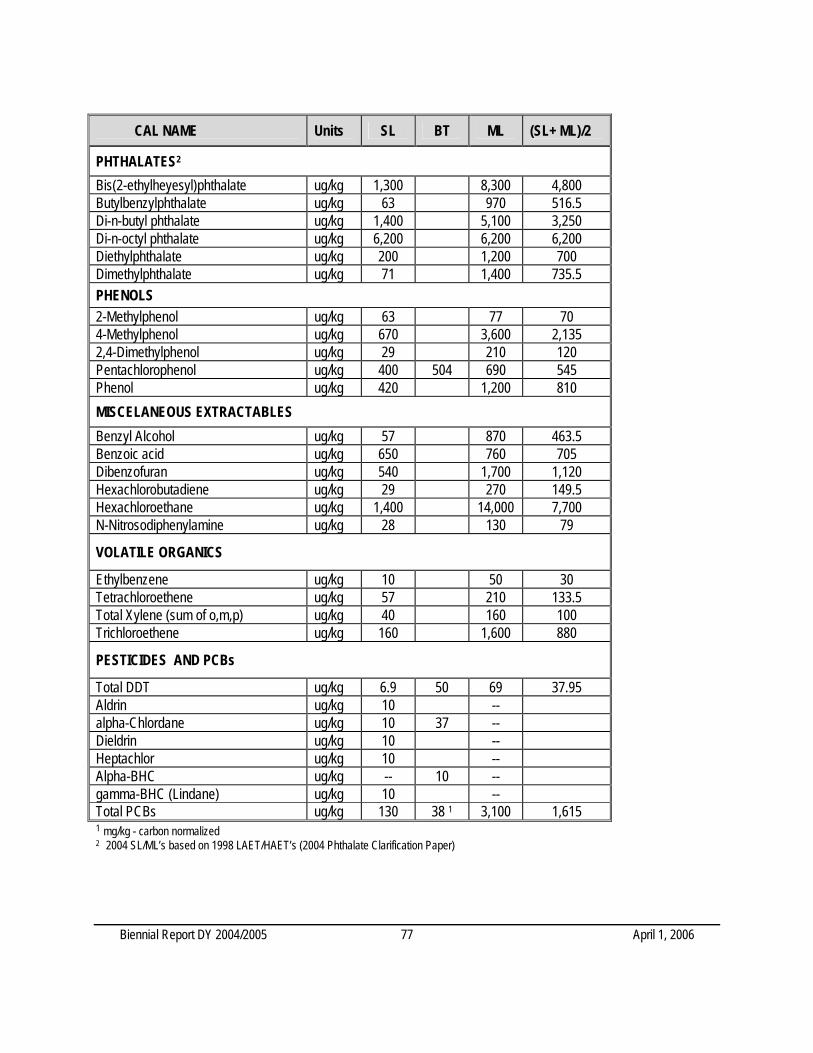
CHEMI
Biennial Report DY 2004/2005 77 April 1, 2006
CAL NAME Units SL BT ML (SL+ ML)/2
PHTHALATES2
Bis(2-ethylheyesyl)phthalate ug/kg 1,300 8,300 4,800 Butylbenzylphthalate ug/kg 63 970 516.5 Di-n-butyl phthalate ug/kg 1,400 5,100 3,250 Di-n-octyl phthalate ug/kg 6,200 6,200 6,200 Diethylphthalate ug/kg 200 1,200 700 Dimethylphthalate ug/kg 71 1,400 735.5 PHENOLS 2-Methylphenol ug/kg 63 77 70 4-Methylphenol ug/kg 670 3,600 2,135 2,4-Dimethylphenol ug/kg 29 210 120 Pentachlorophenol ug/kg 400 504 690 545 Phenol ug/kg 420 1,200 810 MISCELANEOUS EXTRACTABLES Benzyl Alcohol ug/kg 57 870 463.5 Benzoic acid ug/kg 650 760 705 Dibenzofuran ug/kg 540 1,700 1,120 Hexachlorobutadiene ug/kg 29 270 149.5 Hexachloroethane ug/kg 1,400 14,000 7,700 N-Nitrosodiphenylamine ug/kg 28 130 79
VOLATILE ORGANICS
Ethylbenzene ug/kg 10 50 30 Tetrachloroethene ug/kg 57 210 133.5 Total Xylene (sum of o,m,p) ug/kg 40 160 100 Trichloroethene ug/kg 160 1,600 880
PESTICIDES AND PCBs
Total DDT ug/kg 6.9 50 69 37.95 Aldrin ug/kg 10 -- alpha-Chlordane ug/kg 10 37 -- Dieldrin ug/kg 10 -- Heptachlor ug/kg 10 -- Alpha-BHC ug/kg -- 10 -- gamma-BHC (Lindane) ug/kg 10 -- Total PCBs ug/kg 130 38 1 3,100 1,615 1 mg/kg - carbon normalized 2 2004 SL/ML’s based on 1998 LAET/HAET’s (2004 Phthalate Clarification Paper)
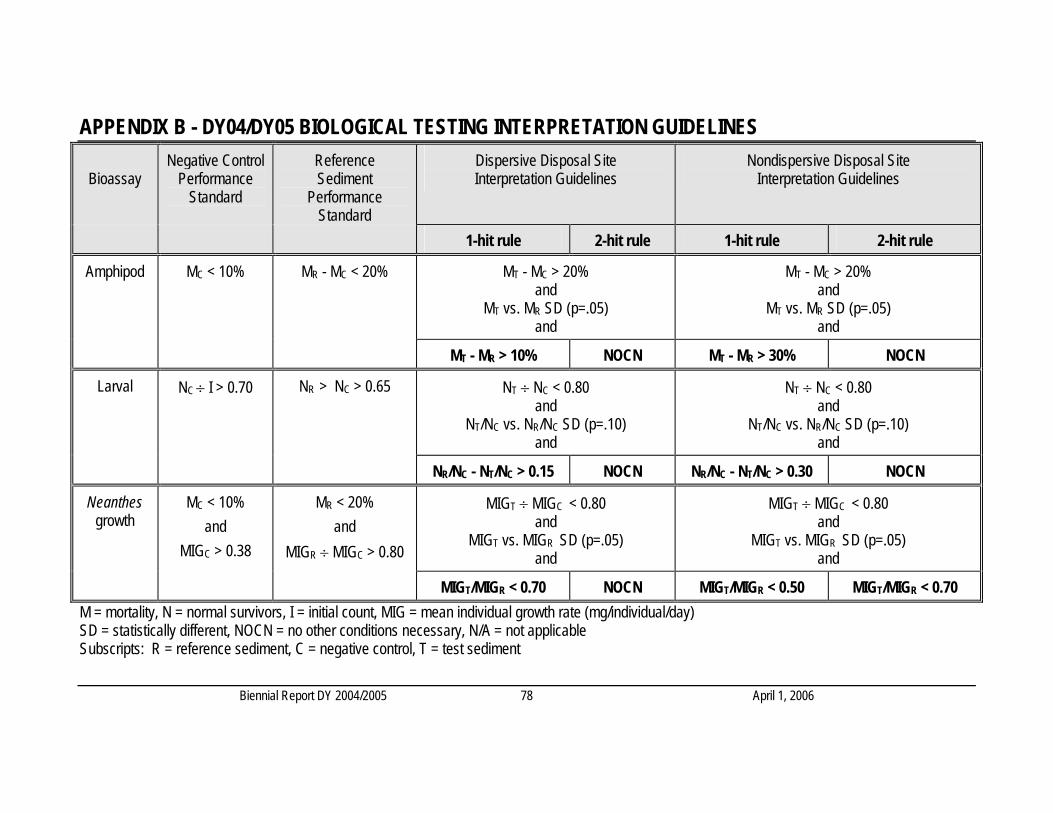
Biennial Report DY 2004/2005 78 April 1, 2006
APPENDIX B - DY04/DY05 BIOLOGICAL TESTING INTERPRETATION GUIDELINES
Bioassay Negative Control
Performance Standard
Reference Sediment
Performance Standard
Dispersive Disposal Site Interpretation Guidelines
Nondispersive Disposal Site Interpretation Guidelines
1-hit rule 2-hit rule 1-hit rule 2-hit rule
Amphipod MC < 10% MR - MC < 20% MT - MC > 20% and
MT vs. MR SD (p=.05) and
MT - MC > 20% and
MT vs. MR SD (p=.05) and
MT - MR > 10% NOCN MT - MR > 30% NOCN
Larval NC ÷ I > 0.70 NR > NC > 0.65 NT ÷ NC < 0.80 and
NT/NC vs. NR/NC SD (p=.10) and
NT ÷ NC < 0.80 and
NT/NC vs. NR/NC SD (p=.10) and
NR/NC - NT/NC > 0.15 NOCN NR/NC - NT/NC > 0.30 NOCN
Neanthes growth
MC < 10% and
MIGC > 0.38
MR < 20% and
MIGR ÷ MIGC > 0.80
MIGT ÷ MIGC < 0.80 and
MIGT vs. MIGR SD (p=.05) and
MIGT ÷ MIGC < 0.80 and
MIGT vs. MIGR SD (p=.05) and
MIGT/MIGR < 0.70 NOCN MIGT/MIGR < 0.50 MIGT/MIGR < 0.70 M = mortality, N = normal survivors, I = initial count, MIG = mean individual growth rate (mg/individual/day) SD = statistically different, NOCN = no other conditions necessary, N/A = not applicable Subscripts: R = reference sediment, C = negative control, T = test sediment
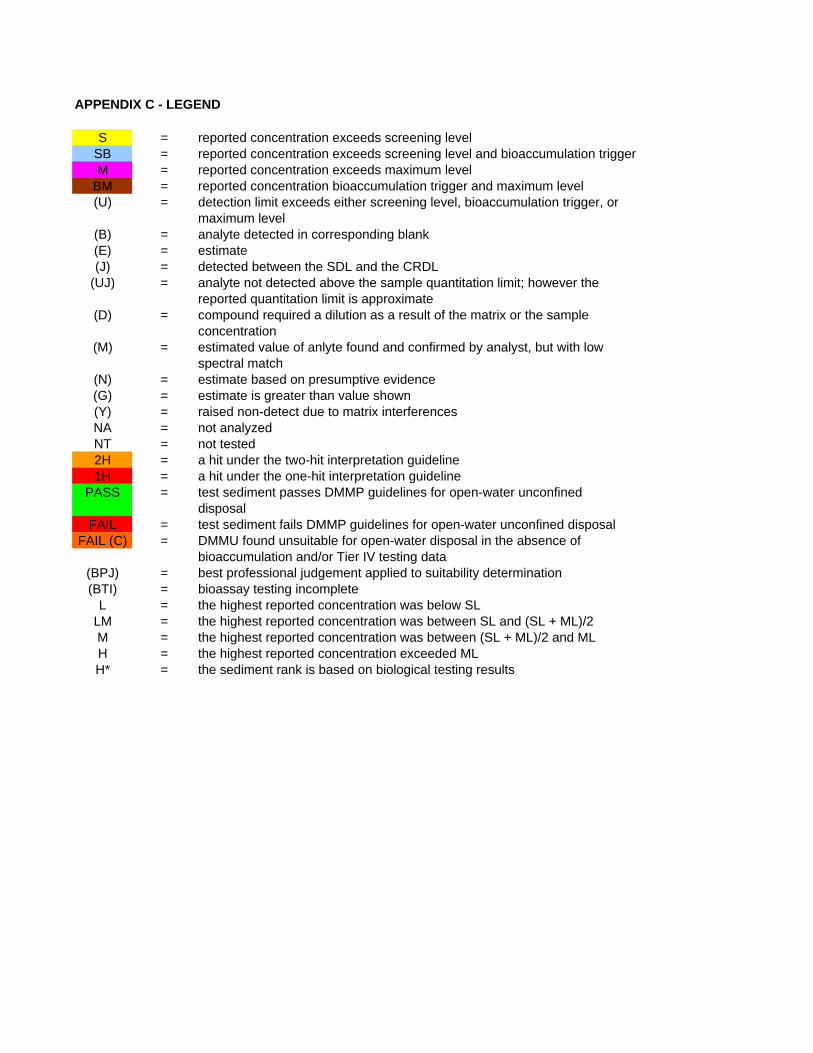
APPENDIX C - LEGEND
S = reported concentration exceeds screening levelSB = reported concentration exceeds screening level and bioaccumulation triggerM = reported concentration exceeds maximum level
BM = reported concentration bioaccumulation trigger and maximum level(U) = detection limit exceeds either screening level, bioaccumulation trigger, or
maximum level(B) = analyte detected in corresponding blank(E) = estimate(J) = detected between the SDL and the CRDL
(UJ) = analyte not detected above the sample quantitation limit; however the reported quantitation limit is approximate
(D) = compound required a dilution as a result of the matrix or the sampleconcentration
(M) = estimated value of anlyte found and confirmed by analyst, but with lowspectral match
(N) = estimate based on presumptive evidence(G) = estimate is greater than value shown(Y) = raised non-detect due to matrix interferencesNA = not analyzedNT = not tested2H = a hit under the two-hit interpretation guideline1H = a hit under the one-hit interpretation guideline
PASS = test sediment passes DMMP guidelines for open-water unconfineddisposal
FAIL = test sediment fails DMMP guidelines for open-water unconfined disposalFAIL (C) = DMMU found unsuitable for open-water disposal in the absence of
bioaccumulation and/or Tier IV testing data(BPJ) = best professional judgement applied to suitability determination(BTI) = bioassay testing incomplete
L = the highest reported concentration was below SLLM = the highest reported concentration was between SL and (SL + ML)/2M = the highest reported concentration was between (SL + ML)/2 and MLH = the highest reported concentration exceeded MLH* = the sediment rank is based on biological testing results
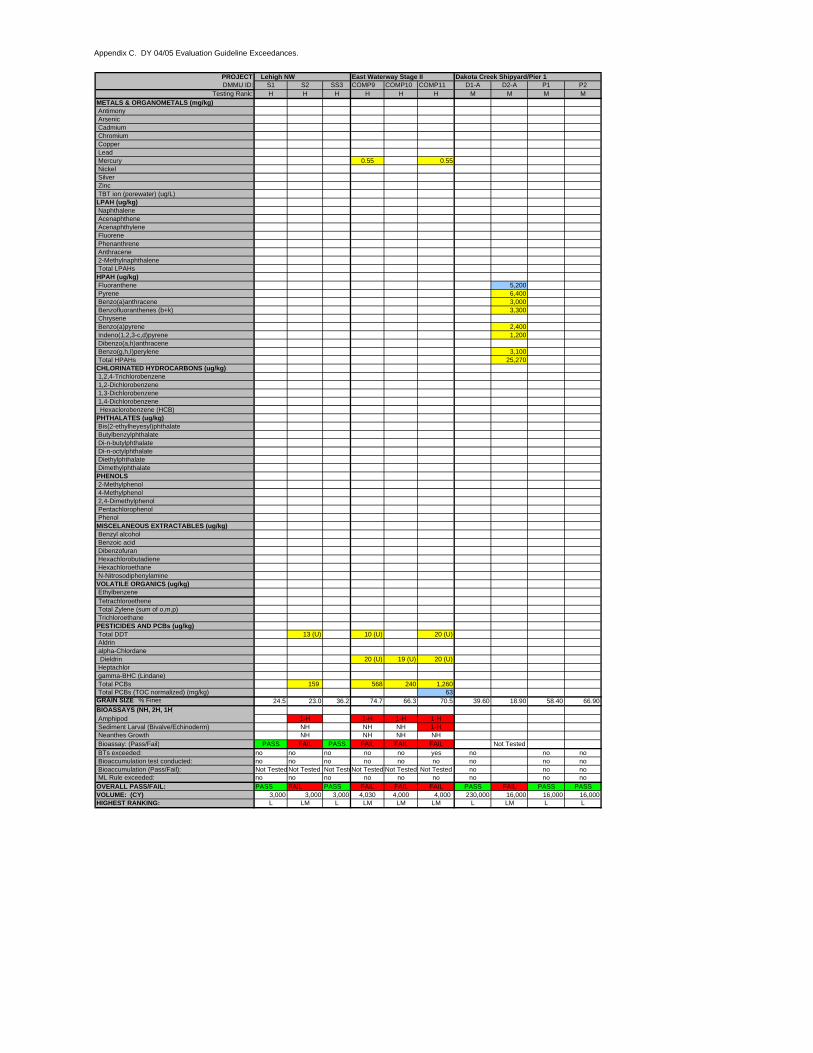
Appendix C. DY 04/05 Evaluation Guideline Exceedances.
PROJECT Lehigh NW East Waterway Stage II Dakota Creek Shipyard/Pier 1DMMU ID: S1 S2 SS3 COMP9 COMP10 COMP11 D1-A D2-A P1 P2
Testing Rank: H H H H H H M M M MMETALS & ORGANOMETALS (mg/kg) Antimony Arsenic Cadmium Chromium Copper Lead Mercury 0.55 0.55 Nickel Silver Zinc TBT ion (porewater) (ug/L)LPAH (ug/kg) Naphthalene Acenaphthene Acenaphthylene Fluorene Phenanthrene Anthracene 2-Methylnaphthalene Total LPAHsHPAH (ug/kg) Fluoranthene 5,200 Pyrene 6,400 Benzo(a)anthracene 3,000 Benzofluoranthenes (b+k) 3,300 Chrysene Benzo(a)pyrene 2,400 Indeno(1,2,3-c,d)pyrene 1,200 Dibenzo(a,h)anthracene Benzo(g,h,I)perylene 3,100 Total HPAHs 25,270CHLORINATED HYDROCARBONS (ug/kg) 1,2,4-Trichlorobenzene 1,2-Dichlorobenzene 1,3-Dichlorobenzene 1,4-Dichlorobenzene Hexaclorobenzene (HCB)PHTHALATES (ug/kg) Bis(2-ethylheyesyl)phthalate Butylbenzylphthalate Di-n-butylphthalate Di-n-octylphthalate Diethylphthalate DimethylphthalatePHENOLS 2-Methylphenol 4-Methylphenol 2,4-Dimethylphenol Pentachlorophenol PhenolMISCELANEOUS EXTRACTABLES (ug/kg) Benzyl alcohol Benzoic acid Dibenzofuran Hexachlorobutadiene Hexachloroethane N-NitrosodiphenylamineVOLATILE ORGANICS (ug/kg) Ethylbenzene Tetrachloroethene Total Zylene (sum of o,m,p) TrichloroethanePESTICIDES AND PCBs (ug/kg) Total DDT 13 (U) 10 (U) 20 (U) Aldrin alpha-Chlordane Dieldrin 20 (U) 19 (U) 20 (U) Heptachlor gamma-BHC (Lindane) Total PCBs 159 568 240 1,260 Total PCBs (TOC normalized) (mg/kg) 63GRAIN SIZE: % Fines 24.5 23.0 36.2 74.7 66.3 70.5 39.60 18.90 58.40 66.90BIOASSAYS (NH, 2H, 1H) Amphipod 1-H 1-H 1-H 1-H Sediment Larval (Bivalve/Echinoderm) NH NH NH 1-H Neanthes Growth NH NH NH NH Bioassay: (Pass/Fail) PASS FAIL PASS FAIL FAIL FAIL Not Tested BTs exceeded: no no no no no yes no no no Bioaccumulation test conducted: no no no no no no no no no Bioaccumulation (Pass/Fail): Not Tested Not Tested Not TesteNot Tested Not Tested Not Tested no no no ML Rule exceeded: no no no no no no no no noOVERALL PASS/FAIL: PASS FAIL PASS FAIL FAIL FAIL PASS FAIL PASS PASSVOLUME: (CY) 3,000 3,000 3,000 4,030 4,000 4,000 230,000 16,000 16,000 16,000HIGHEST RANKING: L LM L LM LM LM L LM L L
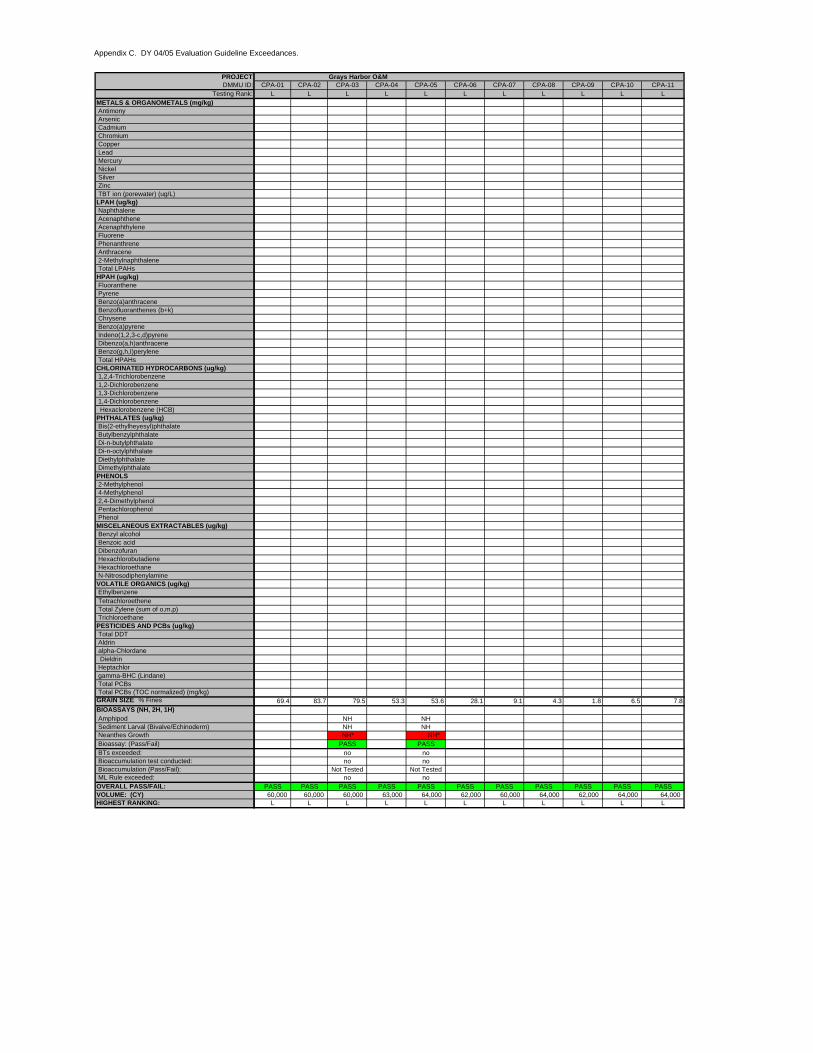
Appendix C. DY 04/05 Evaluation Guideline Exceedances.
PROJECTDMMU ID:
Testing Rank:METALS & ORGANOMETALS (mg/kg) Antimony Arsenic Cadmium Chromium Copper Lead Mercury Nickel Silver Zinc TBT ion (porewater) (ug/L)LPAH (ug/kg) Naphthalene Acenaphthene Acenaphthylene Fluorene Phenanthrene Anthracene 2-Methylnaphthalene Total LPAHsHPAH (ug/kg) Fluoranthene Pyrene Benzo(a)anthracene Benzofluoranthenes (b+k) Chrysene Benzo(a)pyrene Indeno(1,2,3-c,d)pyrene Dibenzo(a,h)anthracene Benzo(g,h,I)perylene Total HPAHsCHLORINATED HYDROCARBONS (ug/kg) 1,2,4-Trichlorobenzene 1,2-Dichlorobenzene 1,3-Dichlorobenzene 1,4-Dichlorobenzene Hexaclorobenzene (HCB)PHTHALATES (ug/kg) Bis(2-ethylheyesyl)phthalate Butylbenzylphthalate Di-n-butylphthalate Di-n-octylphthalate Diethylphthalate DimethylphthalatePHENOLS 2-Methylphenol 4-Methylphenol 2,4-Dimethylphenol Pentachlorophenol PhenolMISCELANEOUS EXTRACTABLES (ug/kg) Benzyl alcohol Benzoic acid Dibenzofuran Hexachlorobutadiene Hexachloroethane N-NitrosodiphenylamineVOLATILE ORGANICS (ug/kg) Ethylbenzene Tetrachloroethene Total Zylene (sum of o,m,p) TrichloroethanePESTICIDES AND PCBs (ug/kg) Total DDT Aldrin alpha-Chlordane Dieldrin Heptachlor gamma-BHC (Lindane) Total PCBs Total PCBs (TOC normalized) (mg/kg)GRAIN SIZE: % FinesBIOASSAYS (NH, 2H, 1H) Amphipod Sediment Larval (Bivalve/Echinoderm) Neanthes Growth Bioassay: (Pass/Fail) BTs exceeded: Bioaccumulation test conducted: Bioaccumulation (Pass/Fail): ML Rule exceeded:OVERALL PASS/FAIL:VOLUME: (CY)HIGHEST RANKING:
Grays Harbor O&MCPA-01 CPA-02 CPA-03 CPA-04 CPA-05 CPA-06 CPA-07 CPA-08 CPA-09 CPA-10 CPA-11
L L L L L L L L L L L
69.4 83.7 79.5 53.3 53.6 28.1 9.1 4.3 1.8 6.5 7.8
NH NHNH NHNH* NH*
PASS PASSno nono no
Not Tested Not Testedno no
PASS PASS PASS PASS PASS PASS PASS PASS PASS PASS PASS60,000 60,000 60,000 63,000 64,000 62,000 60,000 64,000 62,000 64,000 64,000
L L L L L L L L L L L
* *
A
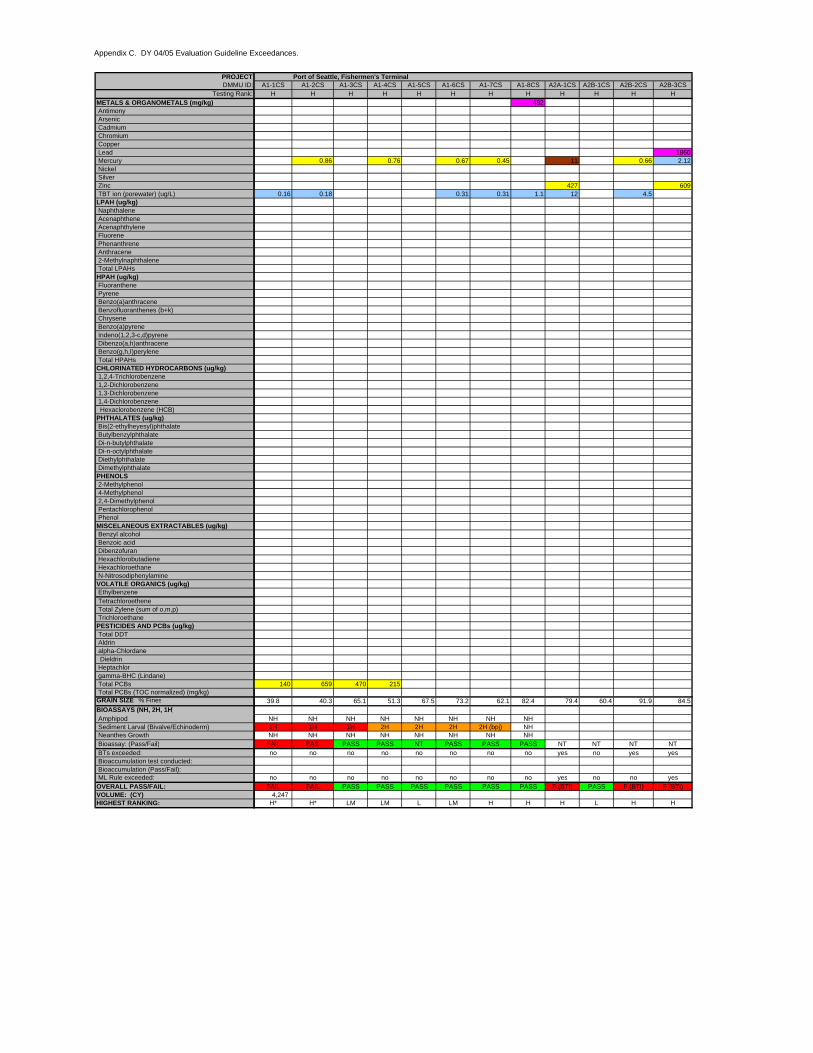
Appendix C. DY 04/05 Evaluation Guideline Exceedances.
PROJECTDMMU ID:
Testing Rank:METALS & ORGANOMETALS (mg/kg) Antimony Arsenic Cadmium Chromium Copper Lead Mercury Nickel Silver Zinc TBT ion (porewater) (ug/L)LPAH (ug/kg) Naphthalene Acenaphthene Acenaphthylene Fluorene Phenanthrene Anthracene 2-Methylnaphthalene Total LPAHsHPAH (ug/kg) Fluoranthene Pyrene Benzo(a)anthracene Benzofluoranthenes (b+k) Chrysene Benzo(a)pyrene Indeno(1,2,3-c,d)pyrene Dibenzo(a,h)anthracene Benzo(g,h,I)perylene Total HPAHsCHLORINATED HYDROCARBONS (ug/kg) 1,2,4-Trichlorobenzene 1,2-Dichlorobenzene 1,3-Dichlorobenzene 1,4-Dichlorobenzene Hexaclorobenzene (HCB)PHTHALATES (ug/kg) Bis(2-ethylheyesyl)phthalate Butylbenzylphthalate Di-n-butylphthalate Di-n-octylphthalate Diethylphthalate DimethylphthalatePHENOLS 2-Methylphenol 4-Methylphenol 2,4-Dimethylphenol Pentachlorophenol PhenolMISCELANEOUS EXTRACTABLES (ug/kg) Benzyl alcohol Benzoic acid Dibenzofuran Hexachlorobutadiene Hexachloroethane N-NitrosodiphenylamineVOLATILE ORGANICS (ug/kg) Ethylbenzene Tetrachloroethene Total Zylene (sum of o,m,p) TrichloroethanePESTICIDES AND PCBs (ug/kg) Total DDT Aldrin alpha-Chlordane Dieldrin Heptachlor gamma-BHC (Lindane) Total PCBs Total PCBs (TOC normalized) (mg/kg)GRAIN SIZE: % FinesBIOASSAYS (NH, 2H, 1H) Amphipod Sediment Larval (Bivalve/Echinoderm) Neanthes Growth Bioassay: (Pass/Fail) BTs exceeded: Bioaccumulation test conducted: Bioaccumulation (Pass/Fail): ML Rule exceeded:OVERALL PASS/FAIL:VOLUME: (CY)HIGHEST RANKING:
Port of Seattle, Fishermen's TerminalA1-1CS A1-2CS A1-3CS A1-4CS A1-5CS A1-6CS A1-7CS A1-8CS A2A-1CS A2B-1CS A2B-2CS A2B-3CS
H H H H H H H H H H H H482
18600.86 0.76 0.67 0.45 11 0.66 2.12
427 6090.16 0.18 0.31 0.31 1.1 12 4.5
140 659 470 215
39.8 40.3 65.1 51.3 67.5 73.2 62.1 82.4 79.4 60.4 91.9 84.5
NH NH NH NH NH NH NH NH1H 1H 1H 2H 2H 2H 2H (bpj) NHNH NH NH NH NH NH NH NH
FAIL FAIL PASS PASS NT PASS PASS PASS NT NT NT NTno no no no no no no no yes no yes yes
no no no no no no no no yes no no yesFAIL FAIL PASS PASS PASS PASS PASS PASS F (BTI) PASS F (BTI) F (BTI)
4,247 H* H* LM LM L LM H H H L H H
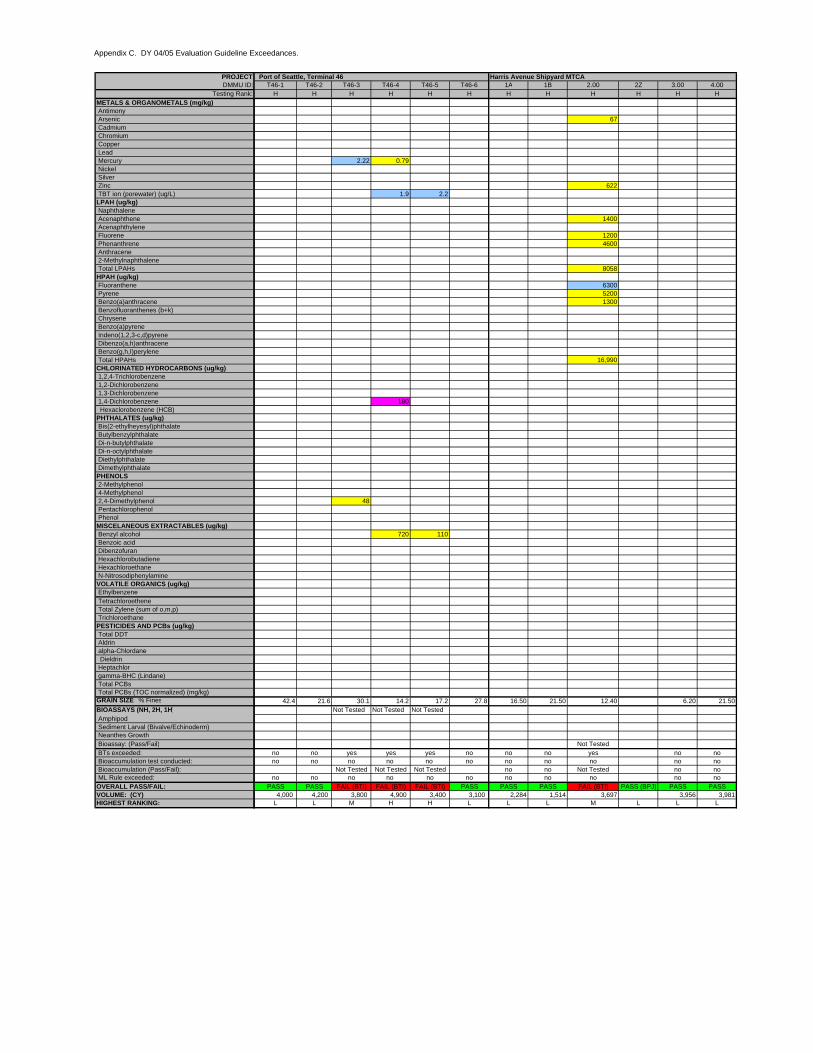
Appendix C. DY 04/05 Evaluation Guideline Exceedances.
PROJECTDMMU ID:
Testing Rank:METALS & ORGANOMETALS (mg/kg) Antimony Arsenic Cadmium Chromium Copper Lead Mercury Nickel Silver Zinc TBT ion (porewater) (ug/L)LPAH (ug/kg) Naphthalene Acenaphthene Acenaphthylene Fluorene Phenanthrene Anthracene 2-Methylnaphthalene Total LPAHsHPAH (ug/kg) Fluoranthene Pyrene Benzo(a)anthracene Benzofluoranthenes (b+k) Chrysene Benzo(a)pyrene Indeno(1,2,3-c,d)pyrene Dibenzo(a,h)anthracene Benzo(g,h,I)perylene Total HPAHsCHLORINATED HYDROCARBONS (ug/kg) 1,2,4-Trichlorobenzene 1,2-Dichlorobenzene 1,3-Dichlorobenzene 1,4-Dichlorobenzene Hexaclorobenzene (HCB)PHTHALATES (ug/kg) Bis(2-ethylheyesyl)phthalate Butylbenzylphthalate Di-n-butylphthalate Di-n-octylphthalate Diethylphthalate DimethylphthalatePHENOLS 2-Methylphenol 4-Methylphenol 2,4-Dimethylphenol Pentachlorophenol PhenolMISCELANEOUS EXTRACTABLES (ug/kg) Benzyl alcohol Benzoic acid Dibenzofuran Hexachlorobutadiene Hexachloroethane N-NitrosodiphenylamineVOLATILE ORGANICS (ug/kg) Ethylbenzene Tetrachloroethene Total Zylene (sum of o,m,p) TrichloroethanePESTICIDES AND PCBs (ug/kg) Total DDT Aldrin alpha-Chlordane Dieldrin Heptachlor gamma-BHC (Lindane) Total PCBs Total PCBs (TOC normalized) (mg/kg)GRAIN SIZE: % FinesBIOASSAYS (NH, 2H, 1H) Amphipod Sediment Larval (Bivalve/Echinoderm) Neanthes Growth Bioassay: (Pass/Fail) BTs exceeded: Bioaccumulation test conducted: Bioaccumulation (Pass/Fail): ML Rule exceeded:OVERALL PASS/FAIL:VOLUME: (CY)HIGHEST RANKING:
Port of Seattle, Terminal 46 Harris Avenue Shipyard MTCAT46-1 T46-2 T46-3 T46-4 T46-5 T46-6 1A 1B 2.00 2Z 3.00 4.00
H H H H H H H H H H H H
67
2.22 0.79
6221.9 2.2
1400
12004600
8058
630052001300
16,990
180
48
720 110
42.4 21.6 30.1 14.2 17.2 27.8 16.50 21.50 12.40 6.20 21.50Not Tested Not Tested Not Tested
Not Testedno no yes yes yes no no no yes no nono no no no no no no no no no no
Not Tested Not Tested Not Tested no no Not Tested no nono no no no no no no no no no no
PASS PASS FAIL (BTI) FAIL (BTI) FAIL (BTI) PASS PASS PASS FAIL (BTI) PASS (BPJ) PASS PASS4,000 4,200 3,800 4,900 3,400 3,100 2,284 1,514 3,697 3,956 3,981
L L M H H L L L M L L L
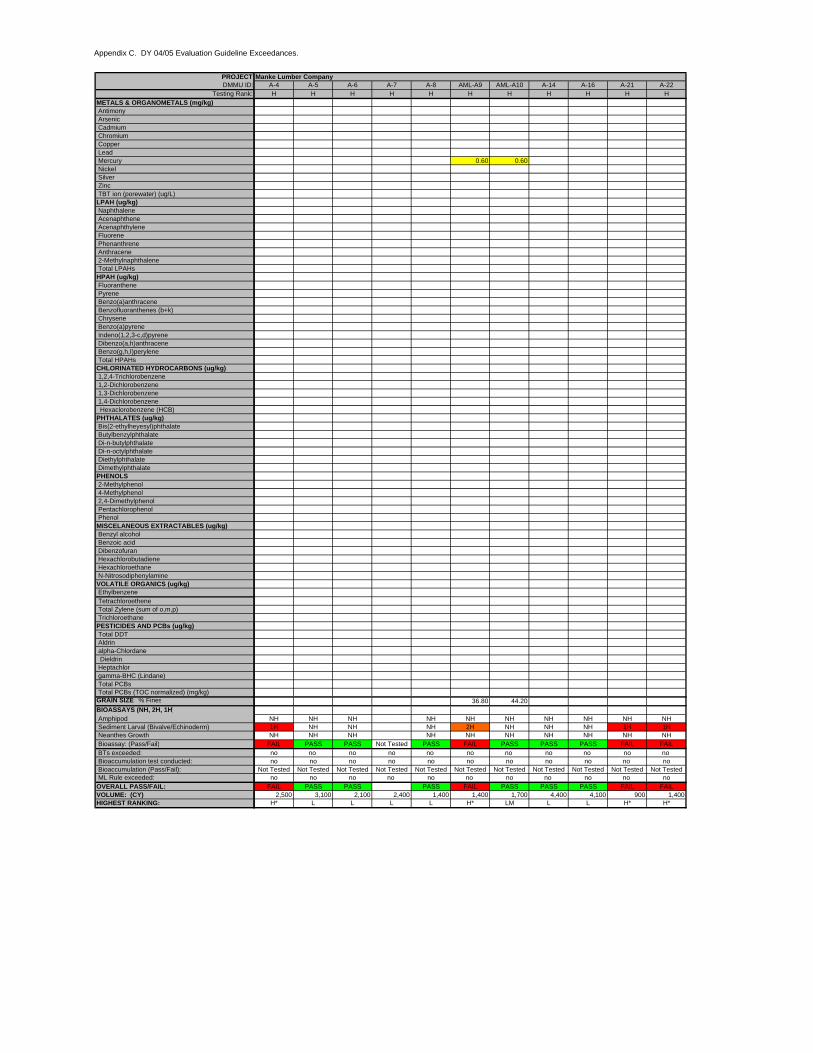
Appendix C. DY 04/05 Evaluation Guideline Exceedances.
PROJECTDMMU ID:
Testing Rank:METALS & ORGANOMETALS (mg/kg) Antimony Arsenic Cadmium Chromium Copper Lead Mercury Nickel Silver Zinc TBT ion (porewater) (ug/L)LPAH (ug/kg) Naphthalene Acenaphthene Acenaphthylene Fluorene Phenanthrene Anthracene 2-Methylnaphthalene Total LPAHsHPAH (ug/kg) Fluoranthene Pyrene Benzo(a)anthracene Benzofluoranthenes (b+k) Chrysene Benzo(a)pyrene Indeno(1,2,3-c,d)pyrene Dibenzo(a,h)anthracene Benzo(g,h,I)perylene Total HPAHsCHLORINATED HYDROCARBONS (ug/kg) 1,2,4-Trichlorobenzene 1,2-Dichlorobenzene 1,3-Dichlorobenzene 1,4-Dichlorobenzene Hexaclorobenzene (HCB)PHTHALATES (ug/kg) Bis(2-ethylheyesyl)phthalate Butylbenzylphthalate Di-n-butylphthalate Di-n-octylphthalate Diethylphthalate DimethylphthalatePHENOLS 2-Methylphenol 4-Methylphenol 2,4-Dimethylphenol Pentachlorophenol PhenolMISCELANEOUS EXTRACTABLES (ug/kg) Benzyl alcohol Benzoic acid Dibenzofuran Hexachlorobutadiene Hexachloroethane N-NitrosodiphenylamineVOLATILE ORGANICS (ug/kg) Ethylbenzene Tetrachloroethene Total Zylene (sum of o,m,p) TrichloroethanePESTICIDES AND PCBs (ug/kg) Total DDT Aldrin alpha-Chlordane Dieldrin Heptachlor gamma-BHC (Lindane) Total PCBs Total PCBs (TOC normalized) (mg/kg)GRAIN SIZE: % FinesBIOASSAYS (NH, 2H, 1H) Amphipod Sediment Larval (Bivalve/Echinoderm) Neanthes Growth Bioassay: (Pass/Fail) BTs exceeded: Bioaccumulation test conducted: Bioaccumulation (Pass/Fail): ML Rule exceeded:OVERALL PASS/FAIL:VOLUME: (CY)HIGHEST RANKING:
Manke Lumber CompanyA-4 A-5 A-6 A-7 A-8 AML-A9 AML-A10 A-14 A-16 A-21 A-22H H H H H H H H H H H
0.60 0.60
36.80 44.20
NH NH NH NH NH NH NH NH NH NH1H NH NH NH 2H NH NH NH 1H 1HNH NH NH NH NH NH NH NH NH NH
FAIL PASS PASS Not Tested PASS FAIL PASS PASS PASS FAIL FAILno no no no no no no no no no no no no no no no no no no no no no
Not Tested Not Tested Not Tested Not Tested Not Tested Not Tested Not Tested Not Tested Not Tested Not Tested Not Testedno no no no no no no no no no no
FAIL PASS PASS PASS FAIL PASS PASS PASS FAIL FAIL2,500 3,100 2,100 2,400 1,400 1,400 1,700 4,400 4,100 900 1,400
H* L L L L H* LM L L H* H*