bias in student evaluations of teaching: what’s the … · im here to talk to you today about...
TRANSCRIPT

All images used in this presentation are from Flickr’s commons (https://www.flickr.com/commons#faq) and carry no copyright restrictions. Hello, I’m Tanya. I work at Loughborough University, and I’m studying with Lancaster University. I’m here to talk to you today about bias in student evaluations of teaching, by which I basically mean module and programme surveys.
1

This is the outline of what I’ll be talking about. There are 15 slides in total, and they’re all numbered to help you follow along. My hope today is that you’ll walk away with a better understanding of the kinds of bias that might happen in SET, and that you'll be inspired to think about how this might be having an effect in your own institutions. All of this is based on a meta-study that I’ve done recently with Lancaster University, which I’m hoping to get published eventually.
2

3
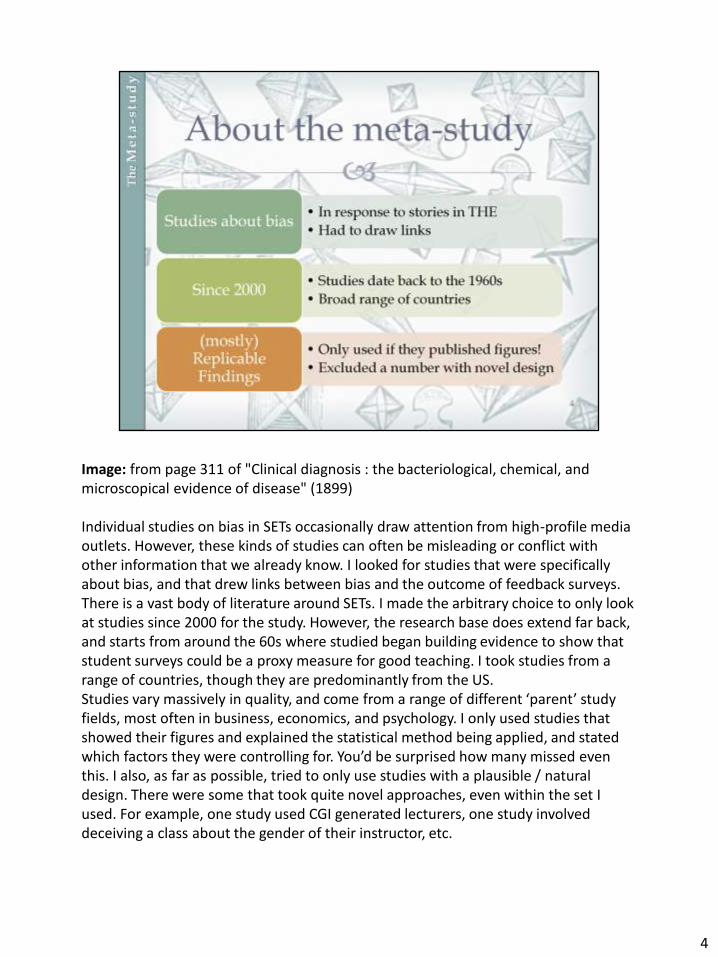
Image: from page 311 of "Clinical diagnosis : the bacteriological, chemical, and microscopical evidence of disease" (1899) Individual studies on bias in SETs occasionally draw attention from high-profile media outlets. However, these kinds of studies can often be misleading or conflict with other information that we already know. I looked for studies that were specifically about bias, and that drew links between bias and the outcome of feedback surveys. There is a vast body of literature around SETs. I made the arbitrary choice to only look at studies since 2000 for the study. However, the research base does extend far back, and starts from around the 60s where studied began building evidence to show that student surveys could be a proxy measure for good teaching. I took studies from a range of countries, though they are predominantly from the US. Studies vary massively in quality, and come from a range of different ‘parent’ study fields, most often in business, economics, and psychology. I only used studies that showed their figures and explained the statistical method being applied, and stated which factors they were controlling for. You’d be surprised how many missed even this. I also, as far as possible, tried to only use studies with a plausible / natural design. There were some that took quite novel approaches, even within the set I used. For example, one study used CGI generated lecturers, one study involved deceiving a class about the gender of their instructor, etc.
4

Image: from page 65 of "St. Nicholas [serial]" (1873) Student Evaluations can take a lot of different forms. I’ve presented a few of the major ones here in a grid. ‘Formative’ surveys are ones that we might run in the middle of a module or programme, ‘Summative’ surveys are ones that we might run at the end of a programme. We’re hopefully already familiar with the difference between satisfaction and engagement surveys! For the purpose of this metastudy I only looked at summative, satisfaction-oriented surveys. I also used a couple of rate my professor surveys – there is evidence out there which suggests that RMP results correlation with satisfaction survey results
5

6
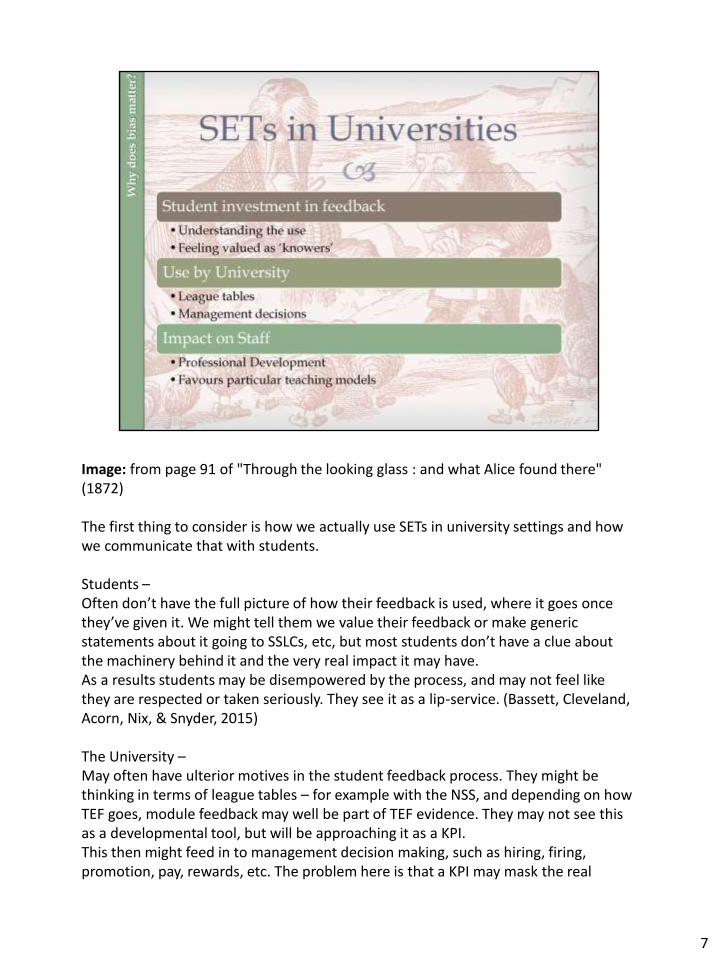
Image: from page 91 of "Through the looking glass : and what Alice found there" (1872) The first thing to consider is how we actually use SETs in university settings and how we communicate that with students. Students – Often don’t have the full picture of how their feedback is used, where it goes once they’ve given it. We might tell them we value their feedback or make generic statements about it going to SSLCs, etc, but most students don’t have a clue about the machinery behind it and the very real impact it may have. As a results students may be disempowered by the process, and may not feel like they are respected or taken seriously. They see it as a lip-service. (Bassett, Cleveland, Acorn, Nix, & Snyder, 2015) The University – May often have ulterior motives in the student feedback process. They might be thinking in terms of league tables – for example with the NSS, and depending on how TEF goes, module feedback may well be part of TEF evidence. They may not see this as a developmental tool, but will be approaching it as a KPI. This then might feed in to management decision making, such as hiring, firing, promotion, pay, rewards, etc. The problem here is that a KPI may mask the real
7
reason for the decision, which could be something subjective. For Staff – The content of student feedback forms often misses the ‘tacit’ knowledge contained in professional practice. The questions simply might not be relevant to helping staff develop themselves The content also tends to favour transmission models of teaching, i.e., where the lecturer is filling the students with knowledge, often in a lecture-seminar model of teaching method. This can mean that being innovative or favouring other teaching models would put you at a disadvantage.
7

Image: page 310 of "British bee journal & bee-keepers adviser" (1873) I’ve picked one graph here from recent HESA publications. (https://www.hesa.ac.uk/intros/staffintro1415 ) This graph shows the % of male and female staff within each salary range, and we can see here very clearly that there are significantly more male academic staff in the highest salary bracket (blue line), and that there are much more female staff in the middle salary bracket (green line) There are tonnes upon tonnes of figures like this I can show you, and I do recommend going away and looking at the work the Equality Challenge Unit does in highlighting issues of equality in HE. We know that there are fewer female and BME academics in professorial roles. We know that, compared to degrees studied, we have far fewer BME academics in general. Bias has a real impact, and if we are to use student feedback to make management decisions, we ought to ensure that this doesn’t perpetuate bias.
8
9

Image: page 106 of "Punch" (1841) In total, I managed to identify 12 studies that met my criteria. There were three main data sources – 2 studies used Rate my Prof, 9 studies used an internal survey of some sort, and 1 study used a national level survey (this was a US study) I’ll talk more about sources of bias very soon. I grouped these sources into 4 clusters – factors relating to the academic teacher, factors relating to the student doing the evaluation, factors to do with the module or programme, and miscellaneous factors. These included things like the time of day, and the semester. There were at least 10 different kinds of statistical approach used, which on the whole makes it hard to directly compare the outcomes.
10

Image from page 888 of "The natural history of plants, their forms, growth, reproduction, and distribution;" (1902) --- For the most part, categories have conflicting studies in them. I divided up papers into ‘positive effect’, ‘negative effect’, ‘other / mixed effect’ and ‘no effect’. It was rare that any one category was unanimous. For the most part there was little overlap in categories. Though I identified 27 in total, the majority of them only had one or two studies using that category. I expected a much greater convergence of categories, particularly around staff demographics. The most used categories were gender and perceived difficulty. It’s clear that these are the issues that are getting people interested. A few others have a single study in support. E.g., one study made a link with non-native speakers being scored worse; a few studies suggest students prefer lecturers of the same race. For the most part, it’s very inconclusive. So, here are the categories that I identify as being most likely to have an effect. I want you to take a quick look at this and think for a minute about what you expect the finding to be. … Gender was interesting once you dug into it. There were issues with some of the studies, which I’ll go over later, but basically 3 studies suggested women get scored worse (I’ve listed here as ‘mixed), two showed no difference between men and women, and the other two suggest that the relationship is more complex. These
11

studies also tracked the gender of the students, and found that students rated lecturers better when they were the same gender. By which I mean, female students rate female lecturers better, male students rate male lecturers better. Difficulty was also interesting. The studies that assumed a linear relationship found no effect on ratings for difficult or easy courses, based on students rating the difficulty themselves. However, the two other studies looked at this as a non-linear relationship and found a bell curve effect. When a course was too easy or too hard, it was rated worse. Students tended to rate courses better when the challenge was right. Grade was the only unanimous outcome, though this is a bit deceptive. I’ve mixed here studies that measured student’s grade expectations as well as students actual grade. In either case, the better a student does, or thinks they are doing, the better they grade the course. I think that’s quite positive really, as we want students to give good ratings to courses where they felt they learned a lot.
11

Image from page 166 of "Die Säugthiere in Abbildungen nach der Natur" (1774) -- The main thing I found undertaking the metastudy was that the quality of research in this area was very variable. It was clear in many cases that there were a lot of ‘pet projects’ aside from the researcher’s main field, quite often the research bases in the literature of the paper had no overlap. We saw already that there were a lot of different categories and very little overlap between what people used – there was also often no publishing of the actual questions used or detail about the circumstances. I originally set out to use reproducable studies only, but I had to weaken this stance! Validity was something that concerned me. I mentioned this briefly earlier. I think this was something most striking in th gender bias studies – quite often the only factor those studies used was gender. They hinted that other factors were available, but only showed results as they pertained to gender. This is a very good way of giving false positives, as if you have such a narrow field yes, you may well see a pattern. So the studies present themselves as evidence for gender bias but they haven’t factored out other reasons for bias. Okay, some studies went a bit too far, by including everything they could think of, but there needs to be a middle way… On the whole I think that middle way needs to be informed by a strong rationale. I was honestly shocked to find that studies in the main hadn’t considered issues
12

around disability or sexual orientation. The few studies that looked at race tended to only use race. This is where the Rate My Prof studies were of a better quality – they all captured and used the same characteristics, and I could be more confident on the whole that they had come to a good conclusion. I know what I would want is something that as far as possible covered off our legal duties to staff. This is particularly with reference to the Equalities Act 2010 (for UK contexts). The reason I worry so much about this is because I know for a fact two things: (1) we have a problem with representation in HE, particularly around race, disability and gender and (2) many universities use these kinds of surveys in academic PDR. If we have even the smallest reason to believe that this could be unfairly harming career progression for particular groups, I believe firmly that it is our duty to intervene and challenge these practices.
12

13

Image from page 96 of "St. Nicholas [serial]" (1873) --- So here I want to talk a bit about what the literature tells us about making good use of SETs. First, what we should avoid doing. Avoid over-interpreting small differences in means, or even in percent scores. We’ve probably all seen this happen. We might see a difference in the scores, but we don’t tend to stop to ask if that difference is significant. Now, the HEA when they report on PTES, PRES etc in their benchmarking reports are excellent for also reporting scores with tests of significance, but on the whole this isn’t something we do elsewhere. This is partly a general issue about statistical literacy, and making sure that we’re all able to understand what the figures we’re seeing might actually mean. Disengaged students. There was quite an amusing study recently about students just not payin attention to survey forms, and researchers caught them out by putting in some implausible questions like ‘I can teleport through space and time’ and found students agreed with the statements. I think some of this does come from us excluding students from the bigger picture of what we do with surveys, and what the actual purpose of a survey is. What should we consider doing? If possible, try to evaluate your own bias potential. Not everyone will have the capacity to do this, but if you can it might mean you can give better guidance to the
14

people interpreting the stats. If a statistical analysis isn’t possible, even having a policy where students who leave defamatory remarks, or remarks that go against your own diversity policies, have their responses barred. It won’t solve the problem but it will be a first step forward. Adding in indicators of statistical validity, and of course, knowing how to use them. This would mean showing confidence intervals, or showing chi-squared tests, or even quite simply showing the %change that accounts for a single student. A score of 60% agree looks quite different if you know that 1 student accounts for 10%, where in some courses one student might account for 0.5%. Use the comments. Use the comments. Please use the comments. The comments will give you much more information and can really help contextualise the kinds of scores that you get.
14

Image from page 23 of "Book of cats and dogs, and other friends, for little folks" (1885) --- So here I want to pose you with some questions, that I hope you’ll take a way with you. The very first thing I’m going to suggest here is going out and testing your survey with your students. See what it is they understand by the questions you’re asking. Big national surveys always do this and will publish reports that explain the results. I’m aware of a few universities who do this but for the most part it’s not very common practice. The better you understand what the students think they’re responding to, the easier it will be to interpret what they’re saying and have a set of questions that does what you need. Some question sets can really be a disadvantage for certain types of teaching, and you might find students respond neutrally or in a monotonic way because they don’t understand what you’re asking. It can be as simple as making tweaks to the questions so that they’re not in management speak. What other ways are staff supported? It worries me when I see survey outcomes as a single measure, which is meant to be developmental but rarely used in that spirit. Are there peer observation schemes? Do you operate any kind of mentoring? What you don’t want is for a survey to be life or death in career terms, nor the only source of information that a staff member has to understand how it is they’re performing. If you are using survey results as part of performance reviews, what else are you using? Are you presenting this alongside other information that might contextualise
15

the results? For example, are student progression rates looked at, are other forms of comments and feedback looked at? The most important thing, though, do academic staff have a voice in the process? Are they enabled to respond or comment on the results that they’re seeing? Were they involved even in picking and choosing the questions? If you’re seeing poor engagement from your students, it is quite likely because staff are disengaged. They might be worried about how the results are being used, an about what control they do or don’t have over it. It can be a major source of anxiety, and in an ideal world it should be an inclusive, iterative process.
15

I want to thank you now for listening. We’ve got a break here for some questions, but also please do feel free to mail me any questions if you think of something later on.
16