bi-ancestral depression gwas in the million veteran
TRANSCRIPT

ARTICLEShttps://doi.org/10.1038/s41593-021-00860-2
1Division of Human Genetics, Department of Psychiatry, Yale University School of Medicine, New Haven, CT, USA. 2Department of Psychiatry, Veterans Affairs Connecticut Healthcare Center, West Haven, CT, USA. 3Psychiatry Service, VA San Diego Healthcare System, San Diego, CA, USA. 4Departments of Psychiatry and Herbert Wertheim School of Public Health, University of California, San Diego, La Jolla, CA, USA. 5Cooperative Studies Program (CSP), VA Clinical Epidemiology Research Center (CERC), VA Connecticut Healthcare System, West Haven, CT, USA. 6Department of General Medicine, Yale University School of Medicine, New Haven, CT, USA. 7Massachusetts Veterans Epidemiology Research and Information Center (MAVERIC), VA Boston Healthcare System, Boston, MA, USA. 8Department of Psychiatry, Boston University School of Medicine, Boston, MA, USA. 9College of Medicine, University of Kentucky, Lexington, KY, USA. 10Department of Psychiatry, Yale University School of Medicine, New Haven, CT, USA. 11National Center for PTSD Clinical Neurosciences Division, US Department of Veterans Affairs, West Haven, CT, USA. 12Division of Psychiatry, Royal Edinburgh Hospital, University of Edinburgh, Edinburgh, UK. 1323andMe, Inc., Sunnyvale, CA, USA. 14Office of Medical Policy, Center for Drug Evaluation and Research, Food and Drug Administration (FDA), Silver Spring, MD, USA. 15These authors contributed equally: Daniel F. Levey, Murray B. Stein. *A list of authors and their affiliations appears at the end of the paper. ✉e-mail: [email protected]; [email protected]
Depression is the most common mental health condition, with lifetime prevalence in the United States of more than 20%1. Over 300 million people, or 4.4% of the world’s population,
are estimated to be affected by depression, which imposes substan-tial costs on individuals and on society at large. In the United States in 2013, health expenditures exceeded $90 billion for treatment of depression and anxiety disorders2. There also is a substantial per-sonal cost to depression; for example, 60% of people who die by suicide have a diagnosed mood disorder. Indeed, in several recent studies, depression and mood disorders have been shown to have genetic overlap with suicidal behavior3–6.
Only recently has substantial progress been made in understand-ing the underlying genetic architecture of depression, led by the Psychiatric Genomics Consortium (PGC) and a large meta-analysis combining results from the PGC7, the UK Biobank (UKB)8, FinnGen (http://r2.finngen.fi/pheno/F5_MOOD) and 23andMe9,10. In this article, we describe a genome-wide association study (GWAS) anal-ysis of ~310,000 participants from the U.S. Department of Veterans
Affairs (VA) Million Veteran Program (MVP). The MVP is one of the largest and most diverse biobanks in the world with genetic and electronic health record (EHR) data available. Several approaches have previously been taken regarding phenotypes selected for study for a depression GWAS. The PGC2 report7 used a variety of ascer-tainment methods within the cohorts used for meta-analysis, with a range of case definitions, including expert or clinician ascertain-ment of formal diagnostic major depressive disorder (MDD) crite-ria or treatment registers for approximately half of the cohorts, and combinations of self-report and clinical cutoffs on those self-report measures accounting for the other half7. Other studies8,10 inves-tigated a broader trait definition of depression, which provided a larger sample size; a greater number of novel loci were discovered, with the potential caveat of less specificity to depression11. In the MVP, we had several potential case definitions available and chose to focus on the definition that provided the highest heritability: the EHR-derived International Classification of Diseases (ICD) codes for MDD.
Bi-ancestral depression GWAS in the Million Veteran Program and meta-analysis in >1.2 million individuals highlight new therapeutic directions
Daniel F. Levey 1,2,15, Murray B. Stein 3,4,15 ✉, Frank R. Wendt 1,2, Gita A. Pathak1,2, Hang Zhou 1,2,
Mihaela Aslan5,6, Rachel Quaden7, Kelly M. Harrington7,8, Yaira Z. Nuñez1,2, Cassie Overstreet1,2,
Krishnan Radhakrishnan5,9, Gerard Sanacora10,11, Andrew M. McIntosh 12, Jingchunzi Shi13,
Suyash S. Shringarpure13, 23andMe Research Team*, the Million Veteran Program*, John Concato5,14,
Renato Polimanti 1,2 and Joel Gelernter 1,2 ✉
Major depressive disorder is the most common neuropsychiatric disorder, affecting 11% of veterans. Here we report results of a large meta-analysis of depression using data from the Million Veteran Program, 23andMe, UK Biobank and FinnGen, including individuals of European ancestry (n = 1,154,267; 340,591 cases) and African ancestry (n = 59,600; 25,843 cases). Transcriptome-wide association study analyses revealed significant associations with expression of NEGR1 in the hypothalamus and DRD2 in the nucleus accumbens, among others. We fine-mapped 178 genomic risk loci, and we identified likely pathogenic-ity in these variants and overlapping gene expression for 17 genes from our transcriptome-wide association study, including TRAF3. Finally, we were able to show substantial replications of our findings in a large independent cohort (n = 1,342,778) provided by 23andMe. This study sheds light on the genetic architecture of depression and provides new insight into the inter-relatedness of complex psychiatric traits.
NATuRe NeuROSCIeNCe | www.nature.com/natureneuroscience

ARTICLES NATURE NEUROSCIENCE
When combined with the previous analysis from the PGC, the UKB and 23andMe10, over 1.2 million participants were available for this study, which is, to our knowledge, the largest genetic analysis of depression to date. We identified 178 genetic risk loci and 223 inde-pendently significant single-nucleotide polymorphisms (SNPs). We used the genome-wide association summary statistics from this analysis to investigate genetic correlations between depression and other cohorts with different phenotypic assessments as well as overlap with other related traits. We used genomic structural equa-tion modeling (gSEM) to examine shared genetic architecture and pleiotropy among complex traits. We also investigated functional consequences through fine-mapping analysis, transcriptomic enrichment with respect to multiple brain tissues and functional annotation. The results provide a deep look into the genetic archi-tecture of depression and its underlying complex biology. Finally, we replicated our findings in an entirely independent sample of 1.3 million participants from 23andMe, demonstrating the consistency of GWAS findings once adequate power is achieved.
ResultsPrimary analysis. For the ICD code definition of MDD (see Methods for detailed diagnosis definitions), which was the pheno-type with the most available data for the MVP cohort, we conducted a GWAS on 250,215 individuals of European ancestry (EA; 83,810 cases). These MVP data were then included in a meta-analysis in METAL12 using inverse variance weighting with available depression GWAS summary statistics from cohorts of individuals of European
ancestry (hereafter, ‘MDD-META’; Fig. 1 and Table 1): the PGC and the UKB10, FinnGen (http://r2.finngen.fi/pheno/F5_MOOD) and 23andMe9, for a total of 1,154,267 individuals of European ancestry (340,591 cases). We identified 223 independently significant SNPs at 178 genomic risk loci in the primary analysis of European ances-try (Fig. 1). We also conducted a GWAS in the African American (AA) sample from MVP in 59,600 participants (25,843 cases). There were no genome-wide significant (GWS) findings from our primary analysis of MDD in African Americans, so we examined overlap with the 223 GWS SNPs from our primary MDD-META meta-analysis of European ancestry. Of the 223 GWS SNPs from the primary analysis, 206 were available after quality control in the AA cohort. We found that 61% (n = 125) of the European GWS SNPs had the same direction of effect in African Americans, with 20 nominally significant (P < 0.05) and one surviving Bonferroni correction. Finally, we conducted a transancestral meta-analysis of results from the primary GWAS of European and African ances-try. This transancestral analysis of 366,434 cases and 847,433 con-trols identified 233 independently significant SNPs at 183 genomic risk loci.
Replication of primary analysis results. We performed replication analysis in 1,342,778 independent samples provided by 23andMe, including 455,350 depression cases. Two hundred eleven variants were available for testing in the 23andMe sample. Of these 211 vari-ants, two (0.9%) had discordant effect direction but not significantly so (P ≥ 0.28); 209 variants (99.1%) had concordant effect directions;
MVP
200
2221
20
19
18
17
16
15
14
13
12
11
10
9
PGC MDD1
PGC MDD2
Current EA meta
(MDD meta)
PGC Hyde
Howard meta
Howard broad
depression
Hyde 23andMe
MVP AA
(MVP MDD)
MVP EA
(MVP MDD)
FinnGen mood
disorders
180
160
8
7
6
5
4
3
2
1
140
120
100
GW
S loci
80
60
40
20
0
Cases
0
50,0
00
100,
000
150,
000
200,
000
250,
000
300,
000
350,
000
Outside cohorts
Meta-analyses
Oute
rmost
Mid
dle
Innerm
ost
MVP MDD MDD meta
23andMe
PGC
FinnGen
UKBDepressive symptoms Depressive symptoms
SR Depression SR Depression meta
Depression defined from EHR
ICD codesDepression defined from EHR
ICD codes
PGC + UKB
Broad depression
Mood (affective)
disorders
Depression defined by
survey self-report
Depression defined by survey
self-report
Self-reported symptoms in
past 2 weeks (PHQ-2) Self-reported symptoms
in past 2 weeks (PHQ-2)
Self-reported symptoms in past
2 weeks (PHQ-2)
Self-reported diagnosis of
depression.
n = 250,215
n = 210,331
n = 169,546
n = 307,354
n = 1,154,267
n = 1,114,383
n = 286,821
n = 500,199
n = 96,499
n = 111,268
10 GWS loci
15 GWS loci
178 GWS loci
145 GWS loci
6 GWS loci
101 GWS loci*
0 GWS loci
3 GWS loci
27
20.25
1 5
56.
22
16.5
11
8.25
5.5
Fig. 1 | Design of the study and circular Manhattan plot. Top left: design of the study. Three phenotypes were evaluated within the MVP: MDD-META
(outermost ring, right panel), which was derived from ICD codes; SR Depression (middle ring, right panel), which was defined by self-reported diagnosis
of depression in the MVP survey; and depressive symptoms (innermost ring, right panel), which come from the PHQ-2 two-item scale found in the
MVP survey. MVP-MDD and SR Depression were each meta-analyzed with depression results from 23andMe, the PGC and FinnGen. MVP PHQ-2 was
meta-analyzed with results from the PHQ-2 two-item scale from the UKB. Right: circular Manhattan plot. Significant results are highlighted in purple.
Lower left: accelerating pace of loci discovery in depression GWAS. y axis indicates the number of discovered loci in a study, with the x axis showing the
number of cases included in each study. Red text and yellow markers indicate original analyses conducted for this study using MVP data for EA, AA and
the overall MDD-META meta-analysis of EAs.
NATuRe NeuROSCIeNCe | www.nature.com/natureneuroscience

ARTICLESNATURE NEUROSCIENCE
192 variants (91%) showed at least nominal significance (P < 0.05); 144 variants (68%) remained significant after Bonferroni correc-tion for multiple comparisons (P < 0.05/211 = 2.37 × 10⁻⁴); and 81 variants (38%) were genome-wide significant (P < 5 × 10⁻⁸). These results are reported in Supplementary Table 1.
Linkage disequilibrium score regression. Linkage disequilib-rium score regression (LDSC) was used in two ways: (1) to iden-tify genetic correlations and SNP-based heritability within each of the depression cohorts and phenotypes (Supplementary Table 5) and (2) to identify genetic correlation with other traits based on the primary meta-analysis (MDD-META). Heritability in the pri-mary MDD-META analysis was 11.3% (z = 29.63, sample preva-lence 28.6%, population prevalence 20%), whereas heritability in the secondary analyses of self-reported depression (SR Depression; Methods) and Patient Health Questionnaire-2 (PHQ-2) were 7.8% (z = 28.74, sample prevalence 27.1%, population prevalence 20%) and 5.5% (z = 14.0), respectively. Genetic correlation between depression phenotypes ranged from 0.59 to 1.21, with lower rg iden-tified between measures of depressive symptoms and case–control phenotypes (Fig. 2a). Some of the genetic correlations from the LDSC were greater than 1; genetic correlation from LDSC does not bound to 1 (ref. 13), and the instances with values higher than 1 occurred when testing in the same sample with similar pheno-type (rg = 1.07, standard error (SE) = 0.0343) between MDD and SR Depression within the MVP or between the somewhat smaller FinnGen sample and the large PGC/UKB broad depression (rg = 1.21, SE = 0.25) and 23andMe (rg = 1.07, SE = 0.21) samples. Linkage disequilibrium (LD) intercept (1.03, SE = 0.011) and attenuation ratio (0.0297, SE = 0.011) of the LDSC revealed minimal evidence for inflation or confounding, with 97% of inflation observed due to high polygenicity of depression.
Based on significant and robust heritability estimates (h2 z > 4), 1,457 traits from available GWAS summary statistics were suf-ficiently powered to assess genetic correlation with MDD-META. After multiple testing correction (P = 0.05/1,457 trait pairs = 3.43 × 10⁻⁵), 669 phenotypes were significantly genetically correlated with MDD-META (Fig. 2b and Supplementary File 1). The most significant phenotypic correlations with MDD-META
from each depressive trait category were: (1) depressive symp-toms (Social Science Genetic Association Consortium (SSGAC)) (rg = 0.943 ± 0.029, P = 1.76 × 10−228); (2) depression medica-tions (FinnGen) (rg = 0.890 ± 0.063, P = 6.22 × 10−45); (3) MDD (Psychiatry) (rg = 1.02 ± 0.017, P < 1.39 × 10−300); and (4) fre-quency of tiredness/lethargy in last 2 weeks (UKB Field ID 2080) (rg = 0.684 ± 0.018, P < 1.39 × 10−300). No brain imaging pheno-types met corrected significance criteria for genetic correlation with MDD-META; the most significantly genetically correlated brain imaging phenotype, using data provided from the Oxford Brain Imaging Genetics (BIG) project14, relative to MDD-META was left subcallosal cortex gray matter volume (BIG Field ID 0078) (rg = 0.205 ± 0.061, P = 9.00 × 10⁻⁴).
Transcriptome-wide association study. Gene-based association analysis was performed by integrating GWAS association statistics and expression quantitative trait loci (eQTL) data of all brain and whole-blood tissues from Genotype-Tissue Expression (GTEx) v8. To prioritize target genes further, joint effects of gene expres-sion correlation across tissues was leveraged using SMultiXcan15. One hundred fifty-three genes and their best representative tis-sues were below the Bonferroni corrected significance threshold (1.79 × 10⁻⁷) for predicted gene expression in 14 tissues (Fig. 3a and Supplementary File 2). Top genes for each tissue tested were as follows: amygdala (ZKSCAN4, P = 1.65 × 10⁻¹²), anterior cingu-late cortex (L3MBTL2, P = 1.09 × 10⁻¹⁴), caudate (ZNF184, P = 1.85 × 10⁻⁹), cerebellar hemisphere (PGBD1, P = 1.67 × 10⁻¹³), cerebel-lum (ZSCAN9, P = 8.4 × 10⁻¹⁷), cortex (TMEM161B, P = 1.84 × 10⁻¹²), frontal cortex (FAM120A, P = 3.25 × 10⁻¹⁰), hippocampus (ZSCAN12, P = 1.14 × 10⁻¹⁸), hypothalamus (NEGR1, P = 3.19 × 10⁻²⁵), nucleus accumbens (DRD2, P = 1.87 × 10⁻²⁰), putamen (LIN28B-AS1, P = 2.13 × 10⁻¹²), spinal cord c-1 (HIST1H1B, P = 2.90 × 10⁻¹⁸), substantia nigra (RP11–318C24.2, P = 2.41 × 10⁻¹²) and whole blood (ZNF165, P = 4.01 × 10⁻¹¹).
Variant prioritization. All 178 risk loci were fine-mapped (Fig. 3b, bottom panel); 1,620 SNPs in the causal set out of 14,016 GWS hits have high posterior probability for causal rela-tion with MDD-META (Fig. 3b, middle panel). The SNPs with casual posterior probability (CPP) ≥ 30% were annotated with Combined Annotation Dependent Depletion (CADD) score16. There were 19 SNPs with CADD scores >10, representing the top 1% of pathogenic variants across the human genome (Fig. 3b, top panel). These SNPs were annotated to genes positioned within ±100 kb. We found 17 genes overlapping with significant genes identified from cross-tissue transcriptome‐wide associa-tion study (TWAS) analysis. Each gene–tissue pair was tested for co-localization of the region for eQTL and GWAS. The coloc17 method tests probability of four hypotheses (H0–4). Of these, H4 tests the hypothesis that the same locus is shared between GWAS and tissue-specific eQTL. Loci that were found to have 80% or higher probability for H4 were compared, to understand the LD structure and the most prominent variant being shared by GWAS and eQTL. These gene–tissue pairs were CCDC71–amygdala (H4-CPP: 93.1%), FADS1–cerebellar hemisphere (H4-CPP: 96.6%), SPPL3–frontal cortex (H4-CPP: 83.9%), TRAF3–hypothalamus (H4-CPP: 95.2%) and LAMB2–whole blood (H4-CPP: 79.9%) (Supplementary File 2).
Tissue expression analysis and genome-wide gene-based associa-tion study. A genome-wide gene-based association study (GWGAS) conducted in Multi-Marker Analysis of GenoMic Annotation (MAGMA) using the MDD-META GWAS meta-analysis identi-fied 426 significant genes after Bonferroni correction for 16,038 protein-coding genes. MAGMA tissue expression analysis identified enrichment across all brain tissues and pituitary using data from
Table 1 | Demographics of european ancestry samples for different phenotype definitions
Cohort Case Control Total (% female)
MVP-MDD 83,810 166,405 250,215 (7)
MVP SR Depression 55,228 155,103 210,331 (7)
23andMe self-reported diagnosis of depression
75,607 231,747 307,354 (48)
PGC + UKB broad depression
170,756 329,443 500,199 (54)
FinnGen mood (affective) disorders
10,418 86,081 96,499
MDD-MeTA (MVP MDD + 23andMe + uKB/PGC + FinnGen)
340,591 813,676 1,154,267
SR Depression meta (MVP SR Depression + 23andMe + uKB/PGC + FinnGen)
312,009 802,374 1,114,383
MVP PHQ-2 175,553 (8)
UKB PHQ-2 111,268 (54)
PHQ-2 meta (MVP PHQ2 + uKB PHQ2)
286,821
NATuRe NeuROSCIeNCe | www.nature.com/natureneuroscience

ARTICLES NATURE NEUROSCIENCE
GTEX v8, with the strongest findings for Brodmann area 9 (P = 7.31 × 10⁻¹⁶) and no enrichment in non-neuronal tissue (Supplementary Fig. 1).
Gene ontology. Gene ontology analysis conducted in ShinyGO18 identified 219 biological processes with false discovery rate (FDR) < 0.05, with top findings involved in nervous system development (q = 1.20 × 10⁻¹⁰) and synapse assembly (q = 9.75 × 10⁻⁹) and orga-nization (q = 9.75 × 10⁻⁹) (Supplementary Table 2).
Drug mapping. The Manually Annotated Targets and Drugs Online Resource (MATADOR)19 database was tested for
enrichment for 426 significant genes from the MAGMA analy-sis. This analysis identified ten drug annotations with FDR < 0.05, including four drugs that are either estrogen receptor ago-nists (diethylstilbestrol, Implanon (etonogestril implant)) or anti-estrogens (tamoxifen and raloxifene), in addition to nicotine, cocaine, cyclothiazide, felbamate and riluzole.
Latent causal variable analysis. After filtering for suitable trait pairs with latent causal variable (LCV)-estimated h2 z-scores ≥ 4, 1,667 phenotypes were powered to evaluate causal estimates relative to MDD-META; no statistically significant putatively causal genetic causality proportions (GCPs) were detected.
MVP
MVP
phenotypes
Non-MVP
phenotypes
Non-MVP cohorts
rg1
–1
10
Num
ber
of phenoty
pes
1
FinnGen mood
disorders
FinnGen mood
disorders
4.3% (2.6)
UKB depressive
symptoms
UKB depressive
symptoms
4.5% (9.2)
Subjective
well-being
23andMe
depression
23andMe
depression
9.4% (16.5)
PGC broad
depression
PGC broad
depression
10.4% (25.4)
MVP depressive
symptoms
MVP depressive
symptoms
5.5% (14.0)
MVP MDD
11.3% (29.6)
1,000Tired (rg = 0.68)
Depression
medications
(rg = 0.89)
Depressive
symptoms
(rg = 0.94)
Major
depressive
disorder
(rg = 1.02)
Left
subcallosal
cortex gray
matter
volume
(rg = 0.20)
100
BIG
Total phenotypes tested
FDR significant
Nominally significant
Bonferroni significant
UKB FinnGen SSGAC Psychiatry
SR Depression
SR Depression
7.8% (28.9)
1.07 0.88 0.71 0.84 0.82
0.96
0.83
1.07
1.21
0.88
0.72
0.840.81
0.59
0.97
0.72 –0.44
–0.380.65
0.98
0.62
0.71
0.87
–0.55
–0.59
–0.64
–0.74
–0.81
Fig. 2 | Genetic correlation. Top: genetic correlations among depression phenotypes, with subjective well-being included as a negative correlation
comparator. Heritability (z-score) is given along the left axis of the matrix for each depression phenotype. Values within the matrix represent rg. All
correlations are significant after Bonferroni correction for multiple comparisons (0.05/28 = P < 0.0018). The largest P value was for the correlation
between FinnGen and UKB depressive symptoms (P = 4.06 × 10⁻⁵). P values and 95% CIs are reported in Supplementary Table 6. Bottom: summary
of genetic correlations between MDD-META and 1,457 phenotypes from large-scale genetic studies of mental health and behavior. The Psychiatry
category contains phenotypes from the PGC, the GWAS & Sequencing Consortium of Alcohol and Nicotine Use, the MVP and the International Cannabis
Consortium. The labels “Tired” and “Left subcallosal cortex gray matter volume” represent UKB Field ID 2080 and BIG Field ID 0078, respectively. P values
are two sided.
NATuRe NeuROSCIeNCe | www.nature.com/natureneuroscience

ARTICLESNATURE NEUROSCIENCE
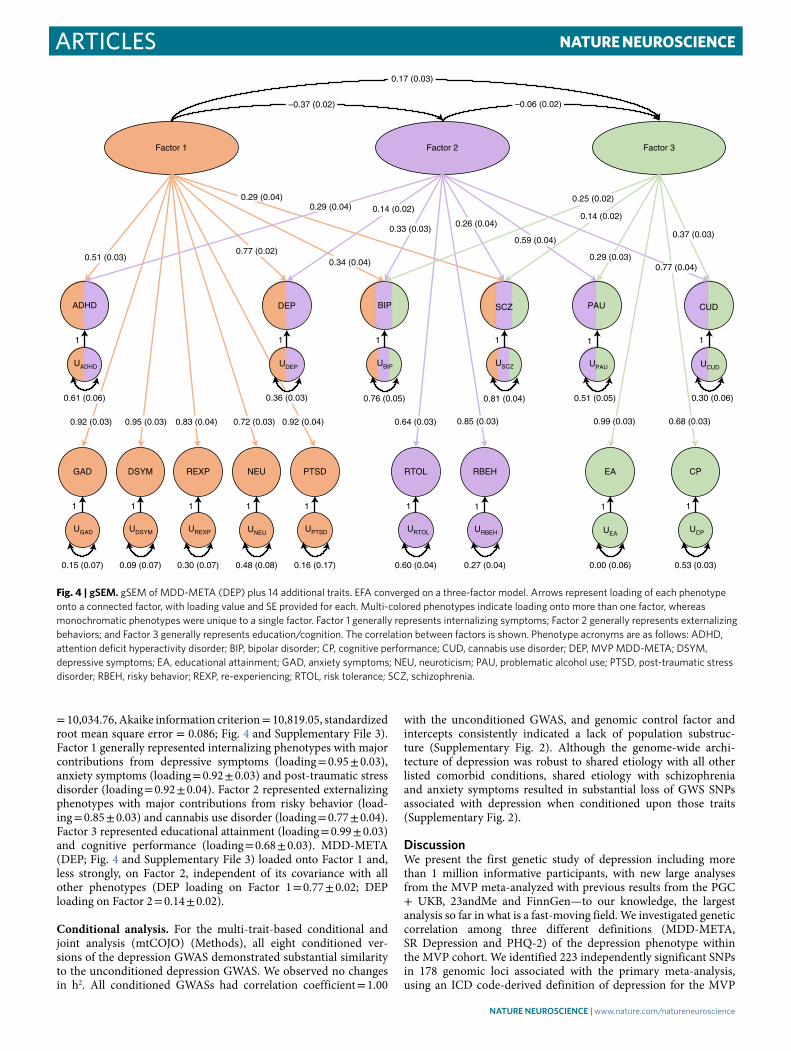
gSEM was used to evaluate how the MDD-META phenotype relates to 15 previously published large-scale GWASs of men-tal health and psychiatric phenotypes (Methods and Discussion). Exploratory factor analysis (EFA) was conducted simultaneously on all traits and supported three-factor (cumulative variance = 0.605) and four-factor (cumulative variance = 0.624) models, where each
factor contributed over 10% to the cumulative explained variance. Anorexia nervosa did not load onto any factor during EFA and was, therefore, excluded from confirmatory factor analysis (CFA). CFA did not converge on a four-factor model due to high correla-tion between two factors. CFA of the three-factor model produced modest fit (comparative fit index = 0.884, χ2 (83 degrees of freedom)
Amygdala ZKSCAN4
L3MBTL2
ZNF184
PGBD1
ZSCAN9
TMEM161B
CTA–14H9.5
DENND1B
CTD–2298J14.2
PRSS16
LRFN5
FAM120A
ZSCAN12
NEGR1
DRD2 ZNF197
AMT GPX1 FAM120AOS TRIM8
TMEM106B CCDC36 SORCS3 ZNF445 USP4 ZC3H7B BTN3A3 CD40 USP15
EP300 NICN1 MLF1 ZKSCAN8 ITPR3 RP11–220I1.5 NLGN1 FURIN TRAF3 CSE1L
RP1–153G14.4
LIN28B–AS1
HIST1H1B
RP11–318C24.2
HIST1H2BO
ZSCAN16
ZNF165 ANKK1 BTN3A2
CTC–498M16.4 BTN3A1
RERE TCTA LAMB2
ZNFX1
CLP1 ZNF660
EIF4E3
KCNG2 SCRN3 MIRLET7BHG PTCH1 CITF22–92A6.1 DCP2 BTN2A2 TP53I11
C15orf59–AS1DAG1
KLHDC8B PCDHA7 KIAA1143 TMEM258 LINC00997 RP11–571M6.17
SPPL3 ZDHHC5
SLC12A5 RHOA LINC00461
APEH TRMT61A CENPL
BSN–AS2 NT5C2 TIAF1 B4GALNT4
PCDHA5 CLOCK PPP3CC
AREL1
CRB1 YLPM1 PROX2 RP1–265C24.8 BAG5 LIN28B TCAIM STAU1 HSPA1L
CTC–467M3.3 ZNF852
ZKSCAN7 BSN
EBLN3P BTN2A1
KLF7 TMEM42 KLC1 OTOA ZNF501 ASCC3 FADS2 STK24 HSPE1
UBA7 POU5F2 RBX1 PCDHA1 HSPA1A TAL1 PCDHA2 PCDHA3FADS1HCG11
CELF4 FCF1 PAX6 LINC01415 CHADL LINC02060 RAB27B RASGRP1 LINC01305 PCDHA10
RP11–3B7.1 RP11–24H2.3 RP1–86C11.7 CTTNBP2 RCN1 MSH5 SF3B1 PCDHA8 ACVRL1 RP11–1I2.1 SMIM4 WDR55CKB
HIST1H2BN SLC25A17 SELENOH CCDC71 ZNF502 PARK2 ST13 ADARB2 DDX27 SORBS3 GPR27
Caudate (basal ganglia)
Cerebellar hemisphere
Cerebellum
z-score
(mean)
10
5
–5
0
Cortex
Hippocampus
Hypothalamus
Nucleus accumbens (basal ganglia)
Putamen (basal ganglia)
Spinal cord (cervical c-1)
Substantia nigra
Whole blood
25
Lowest P value Highest
Genes overlappingwith multi-tissue
TWAS(SNP ± 100 kb)
Functionalannotation
Finemapping
Independentloci observed
LAM
B2
KLHDC8B
CCDC36
CCDC71
SORCS3
TMEM
258
FADS2F
ADS1
ACVR
L1
SPPL3
AREL1
FCF1
TRAF3
YLPM
1
TIAF1
CELF
4
10
0
1
0.3
0
30
20
8
1 2 3 4 5 6 7 8
Chromosome
9 10 11 12 13 14 15 16 17 18 19 20 21 22
–lo
g10 (
P)
CP
PC
AD
D
Frontal cortex (BA9)
Anterior cingulate cortex (BA24)
Fig. 3 | Tissue-based gene association study (TWAS) and fine mapping. Top: tissue-based gene association study. The genes were tested using
MetaXcan for 13 brain tissues and whole blood from GTEx v8. The genes were compared across tissues to identify best representative tissues for each
gene using SMultiXcan. Genes are arranged in order from left to right by respective tissue-specific P value, with the lowest value on the left. The color
scale for the gene matrix is based on mean z-score. The values are reported in Supplementary File 2. Bottom: SNP prioritization using fine-mapping and
functional scoring. Bottom row, Manhattan plot showing each genomic risk locus in violet. Middle row, Each locus was fine-mapped, and the CPP on the
y axis is shown for SNPs from the causal set. The SNPs that had CPP ≥ 0.3 (30%) were annotated using CADD scores. Top row: The SNPs with CADD ≥
10 are highlighted in purple; these SNPs were positionally mapped to 107 genes within 100 kb. Only positional genes overlapping with multi-tissue TWAS
results (Supplementary Fig. 1) are annotated with vertical lines. Details of the prioritized SNPs are reported in Supplementary File 2.
NATuRe NeuROSCIeNCe | www.nature.com/natureneuroscience
ARTICLES NATURE NEUROSCIENCE
= 10,034.76, Akaike information criterion = 10,819.05, standardized root mean square error = 0.086; Fig. 4 and Supplementary File 3). Factor 1 generally represented internalizing phenotypes with major contributions from depressive symptoms (loading = 0.95 ± 0.03), anxiety symptoms (loading = 0.92 ± 0.03) and post-traumatic stress disorder (loading = 0.92 ± 0.04). Factor 2 represented externalizing phenotypes with major contributions from risky behavior (load-ing = 0.85 ± 0.03) and cannabis use disorder (loading = 0.77 ± 0.04). Factor 3 represented educational attainment (loading = 0.99 ± 0.03) and cognitive performance (loading = 0.68 ± 0.03). MDD-META (DEP; Fig. 4 and Supplementary File 3) loaded onto Factor 1 and, less strongly, on Factor 2, independent of its covariance with all other phenotypes (DEP loading on Factor 1 = 0.77 ± 0.02; DEP loading on Factor 2 = 0.14 ± 0.02).
Conditional analysis. For the multi-trait-based conditional and joint analysis (mtCOJO) (Methods), all eight conditioned ver-sions of the depression GWAS demonstrated substantial similarity to the unconditioned depression GWAS. We observed no changes in h2. All conditioned GWASs had correlation coefficient = 1.00
with the unconditioned GWAS, and genomic control factor and intercepts consistently indicated a lack of population substruc-ture (Supplementary Fig. 2). Although the genome-wide archi-tecture of depression was robust to shared etiology with all other listed comorbid conditions, shared etiology with schizophrenia and anxiety symptoms resulted in substantial loss of GWS SNPs associated with depression when conditioned upon those traits (Supplementary Fig. 2).
DiscussionWe present the first genetic study of depression including more than 1 million informative participants, with new large analyses from the MVP meta-analyzed with previous results from the PGC + UKB, 23andMe and FinnGen—to our knowledge, the largest analysis so far in what is a fast-moving field. We investigated genetic correlation among three different definitions (MDD-META, SR Depression and PHQ-2) of the depression phenotype within the MVP cohort. We identified 223 independently significant SNPs in 178 genomic loci associated with the primary meta-analysis, using an ICD code-derived definition of depression for the MVP
Factor 1 Factor 2 Factor 3
BIP SCZ CUD
GAD DSYM REXP NEU PTSD RTOL RBEH EA CP
UBIP USCZ UCUD
ADHD
UADHD
DEP
UDEP
UGAD UDSYM UREXP UNEUUPTSD URTOL URBEH UEA
UCP
0.17 (0.03)
–0.06 (0.02)–0.37 (0.02)
0.51 (0.03)0.77 (0.02)
0.29 (0.04)
0.34 (0.04)
PAU
UPAU
0.29 (0.04)
0.14 (0.02)
0.33 (0.03)0.26 (0.04)
0.59 (0.04)
0.29 (0.03)
0.14 (0.02)
0.25 (0.02)
0.37 (0.03)
0.77 (0.04)
0.68 (0.03)0.99 (0.03)0.85 (0.03)0.64 (0.03)0.92 (0.04)0.72 (0.03)0.83 (0.04)0.95 (0.03)0.92 (0.03)
1
0.61 (0.06)
1
0.36 (0.03)
1
0.76 (0.05)
1
0.81 (0.04)
1
0.51 (0.05)
1
0.30 (0.06)
1
0.15 (0.07)
1
0.09 (0.07)
1
0.30 (0.07)
1
0.48 (0.08)
1
0.16 (0.17)
1
0.60 (0.04)
1
0.27 (0.04)
1
0.00 (0.06)
1
0.53 (0.03)
Fig. 4 | gSeM. gSEM of MDD-META (DEP) plus 14 additional traits. EFA converged on a three-factor model. Arrows represent loading of each phenotype
onto a connected factor, with loading value and SE provided for each. Multi-colored phenotypes indicate loading onto more than one factor, whereas
monochromatic phenotypes were unique to a single factor. Factor 1 generally represents internalizing symptoms; Factor 2 generally represents externalizing
behaviors; and Factor 3 generally represents education/cognition. The correlation between factors is shown. Phenotype acronyms are as follows: ADHD,
attention deficit hyperactivity disorder; BIP, bipolar disorder; CP, cognitive performance; CUD, cannabis use disorder; DEP, MVP MDD-META; DSYM,
depressive symptoms; EA, educational attainment; GAD, anxiety symptoms; NEU, neuroticism; PAU, problematic alcohol use; PTSD, post-traumatic stress
disorder; RBEH, risky behavior; REXP, re-experiencing; RTOL, risk tolerance; SCZ, schizophrenia.
NATuRe NeuROSCIeNCe | www.nature.com/natureneuroscience

ARTICLESNATURE NEUROSCIENCE
sample and GWAS summary statistics from 23andMe, UKB, PGC and FinnGen. This finding is an increase of 77 loci over the larg-est previous study that investigated a similar phenotype10. As these cohorts used somewhat different definitions for depression (Table 1, Fig. 1a and Methods), we also used LDSC to examine genetic cor-relations between MVP depression phenotypes and these differen-tially defined depression phenotypes in independent cohorts. We investigated genetic correlation with 1,457 traits using available GWAS data, identifying 669 that were significantly correlated. We also used gSEM to evaluate how depression relates to other mental health and psychiatric phenotypes.
The MVP sample added substantially to our ability to discover new loci. Two of the most powerful previous studies conducted to date7,8 had substantial contributions from the UKB. UKB and MVP represent large and non-overlapping samples with consistent phe-notypic assessments. This consistency in collection reduces ascer-tainment heterogeneity within samples and likely increases power to detect new loci. Adding another massive homogenously pheno-typed sample here allowed us to discover 77 more loci than pre-viously identified. It also provides a novel and large independent cohort for conducting post-GWAS analyses, leveraging the substan-tial resources already produced by others in the field to improve understanding.
MVP is very informative for depression and related traits with several available measures, so we considered several different diag-nosis definitions (Table 1), as follows. In the MVP, we considered (1) an ICD code-based algorithm to determine depression case status based on diagnosis codes captured in the VA EHRs (MDD); (2) self-reported diagnosis of depression as reported in the MVP baseline survey (SR Depression); and (3) the two-item PHQ scale of depressive symptoms in the past 2 weeks, included in the MVP baseline survey (depressive symptoms). Genetic correlations among these traits were high (rg = 0.81–1.07). We consider the first of these–MDD-META–to be our ‘primary’ analysis based on the larger explained heritability and sample size.
For meta-analyses of MDD-META and SR Depression, we also used available GWAS summary statistics from 23andMe, UKB, PGC and FinnGen (Table 1). Genetic correlation was conducted among the phenotypes to be meta-analyzed together to quantify potential heterogeneity among the studies to be combined. These studies used a variety of phenotype definitions, with some combining clini-cal diagnosis of depression based on structured interview and other broader methods7, such as self-reported treatment7 or self-reported diagnosis items on questionnaires9. This analysis is discussed in greater detail in the Methods, but the genetic correlations among all traits ranged from 0.71 to 0.84.
We performed replication analysis in 1,342,778 samples pro-vided by 23andMe (non-overlapping with the 23andMe samples included in our MDD-META), including 455,350 depression cases. Ninety-nine percent of our findings showed concordant direction of effect between these two very large and independent cohorts. Of 211 variants tested, 209 (99%) had the same direction of effect; 192 (91%) showed at least nominal significance (P < 0.05); 144 (68%) remained significant after correction for multiple comparisons (P < 0.05/211 = 2.37 × 10⁻⁴); and 81 (38%) were independently genome-wide significant (P < 5 × 10⁻⁸). Only two (0.9%) SNPs were discordant, both with P > 0.05. This very strong replication indi-cates the consistency of the findings that we report herein.
The lead SNP from our primary analysis, rs7531118 (minor allele frequency = 0.48, P = 8.9 × 10⁻²⁹), maps close to the NEGR1 (neuro-nal growth regulator 1) gene and is a brain eQTL for NEGR1. This SNP was at least nominally significant with concordant effect direc-tion in all four studies included in this meta-analysis (MVP P = 4.9 × 10⁻⁵, FinnGen P = 0.04, PGC + UKB P = 1.6 × 10⁻¹⁷ and 23andMe P = 2.8 × 10⁻⁸). The SMultiXcan analysis prioritized hypothala-mus as related to NEGR1. Negr−/− mice have shown irregularities
in several brain regions, including reduced brain volume in the hip-pocampus, and have also shown abnormalities in social behavior and non-social interest20. Another study of Negr−/− mice identified a variety of depression-like and anxiety-like features in behavioral assays, such as elevated plus maze and forced swim tests21.
The DRD2 (D2 dopamine) receptor was another top finding from the TWAS analysis (Fig. 3a), with significant predicted decreased expression in the nucleus accumbens. The mesolimbic dopamine reward circuit, of which nucleus accumbens is a critical part, has long been implicated in depression22. A recent optogenetic study exam-ining dopaminergic ventral tegmental area (VTA) projections into nucleus accumbens found that dopamine receptors are required for the action of these neurons in depression-related escape behavior23. Depression-like behavior in animals might be related to depres-sion in humans through links to the reward system and symptoms of anhedonia. A recent randomized proof-of-mechanism trial24 investigated κ-opioid receptor (KOR) antagonists as treatment for anhedonia symptoms. KORs localize within the nucleus accumbens on the terminals of inputs from the mesolimbic dopamine reward circuit. Among the actions of KOR antagonists might be normaliza-tion of VTA KOR function and D2 neuron activation, leading to dis-inhibition of the excitatory circuit they project upon25. Indeed, the KOR JNJ-67953964 was found to increase VTA activation relative to placebo during reward anticipation, highlighting a potential thera-peutic mechanism by which KOR is thought to release inhibition on D2 dopaminergic projections. The group receiving JNJ-67953964 showed reduced anhedonic symptoms relative to controls24. That this gene and brain tissue emerged from hypothesis-free GWAS and TWAS tissue enrichment is a remarkable finding with respect to known biology and points to the potential value of other novel findings from this kind of research.
The CELF4 (CUGBP Elav-like family member 4) gene has been highlighted recently in an earlier precursor to this meta-analysis8 and was our top finding for convergence between functional vari-ant prioritization and multi-tissue TWAS results (Fig. 3b and Supplementary File 2). This gene is important in developmental disorders, with deletions of the 18q12.2 region that encompass the gene associated with autism spectrum disorder26. Celf4 mutant mice show aberrations in sodium channel function, perhaps through increased Nav1.6 in the axon initial segment of excitatory neurons, and increased susceptibility to seizures27. We agree with the asser-tion made in previous studies, now with additional functional and expression evidence, that CELF4 should be a focus of future brain research in depression and depression-like behaviors.
Genetic correlations with available GWAS summary statistics from 1,457 traits were conducted to assess overlap with other traits. There was high genetic correlation between our MDD-META meta-analysis and depression medication prescription in FinnGen (rg = 0.89). This could be of value in evaluating depression pheno-types from large cohorts with access to linked pharmacy records; anti-depressant medication prescription might be a viable proxy phenotype for depression diagnosis.
We used ShinyGO18 with the MATADOR19 database to iden-tify overlap between top MAGMA genes and drugs of interest (Supplementary Fig. 3). Riluzole, an NMDA antagonist currently used to treat amyotrophic lateral sclerosis, was one of our top find-ings. This drug is currently in trials for combination therapy for treatment-resistant depression28. Another drug, cyclothiazide, is an allosteric modulator of AMPA (glutamatergic) receptors. Allosteric modulation of glutamatergic receptors has been considered a mech-anistic treatment target for depression29. This screen also identified an anti-seizure medication, felbamate, which has side effects includ-ing increasing depressive symptoms, suicidal ideation and suicide attempts. These three identified drugs—riluzole, felbamate and cyclothiazide—have been shown to modulate glutamatergic activ-ity30. Although the exact mechanisms underlying the drugs’ effects
NATuRe NeuROSCIeNCe | www.nature.com/natureneuroscience

ARTICLES NATURE NEUROSCIENCE
on the system remain to be elucidated, it is especially interesting that they were identified in this study considering the emerging evi-dence of glutamate’s role in the pathophysiology and treatment of mood disorders and the recent U.S. Food and Drug Administration approval of esketamine for treatment-resistant depression. Riluzole has already been identified as a potential antidepressant treatment, with support for its antidepressant properties found in rodent models31 and small clinical studies. However, larger-scale clini-cal trials have not provided clear evidence to support its efficacy. These enrichments, from hypothesis-free association with depres-sion, show converging independent evidence from genetics of existing pharmacological targets based on underlying biological mechanisms.
gSEM was used to investigate relationships between MDD-META and 15 other mental health and neurocognitive phenotypes (Fig. 4 and Supplementary File 3); summary statistics come from the larg-est studies available. All traits tested except anorexia nervosa loaded onto at least one factor during exploratory analysis. We identified three factors, with MDD-META loading onto the first two indepen-dently of covariance with the other phenotypes. Factor 1 may be thought to represent internalizing phenotypes, with major contri-butions from MDD-META, anxiety symptoms and post-traumatic stress disorder. MDD-META also loaded (but less strongly) onto Factor 2, which broadly represents externalizing phenotypes and psychosis, with the major contributions coming from risky behavior and cannabis use disorder. MDD-META did not load onto Factor 3, which was mostly contributed to by educational attainment and cognitive performance and, thus, might represent a neurocogni-tive domain. Many cross-disorder studies using GWAS, this one included, align themselves in ways consistent with existing theories of psychopathology.
We prioritized variants using biologically and statistically informed annotations. To prioritize genes and their target tissues,
we integrated both transcriptomics and CADD score prioritized variants. This method aided in the identification of shared causal loci for phenotype and tissue-specific eQTLs as evidenced by the high probability for five of the 17 genes tested. SNPs at CCDC71 (coiled-coil domain containing 71) have been reported to be associ-ated with depressive symptoms in a multivariate genome-wide asso-ciation meta-analysis, and our prioritized SNP is in strong LD with that study’s lead SNP (current study rs7617480, r2 = 0.83, D′ = 1.0)32. The FADS1 (fatty acid desaturase 1) protein product is involved in fatty acid regulation, and variants in this region have been reported to be associated with depression and substance use disorders. There is consistent evidence in the literature for an association with depleted omega-3 and increased depression risk, although a role for omega-3 supplementation in the treatment of depression is still con-troversial33. Variants in SPPL3 (signal peptide peptidase-like 3) were reported by Hyde et al.9 to be associated with risk to major depres-sion. The TRAF3 (TNF receptor-associated factor 3) protein prod-uct controls type-1 interferon response34, and it has been reported that individuals treated with interferon are at high risk to develop depressive symptoms35. LAMB2 is involved in neuropathic pain and influencing gene expression changes in brain pathways implicated in depression36.
Because no GWS findings were identified in our primary analy-sis of African ancestry, we performed cross-ancestry lookups in the summary statistics of European ancestry. Of 223 GWS SNPs from the European ancestry meta-analysis, 206 were available in African ancestry; 61% (n = 125) had the same effect direction; 20 were nom-inally significant (P < 0.05); and one SNP survived Bonferroni cor-rection (Fig. 5). This SNP that survived multiple testing correction (rs1950829 European P = 7.24 × 10⁻¹⁹, African P = 9.34 × 10⁻⁶) is in an intron of the LRFN5 (leucine-rich repeat and fibronectin type III domain containing 5) gene. This gene was previously detected in genome-wide gene- and pathway-based analyses of depressive
12
a
SNPs Criteria
SNPs Criteria
GWS SNPs primary analysis
GWS SNPs primary analysis
GWS after AA quality control
GWS and available in replication cohort
Same effect direction
Same effect direction
Nominally significant
Nominally significant
Bonferroni significant
Bonferroni significant
GWS in replication cohort
223
223
206
125
20
1
211
209
192
144
81
ρ = 0.87
ρ = 0.39
8
4
0
–4
–8
–12
12
8
4
0
–4
–8
–12
–12 –8 –4 0 4 8 12
EUR 23andMe independent replication z-scores
–12 –8 –4 0 4 8 12
AA z-scores
EU
R M
DD
-ME
TA
z-s
co
res
EA
z-s
co
res
b
Fig. 5 | Similar ancestry and trans-ancestry replication analyses. a, Left: scatter plot for z-score effect sizes for 211 GWS SNPs (Spearman’s ρ = 0.87) from
the primary MDD-META GWAS on the y axis and the independent 23andMe replication cohort African ancestry (only) GWAS on the x axis. Right: overlap
of SNPs from European (EUR) and African ancestry GWASs. 223 GWS SNPs from the primary analysis, of which 211 were available in the independent
23andMe GWAS. Of the remaining SNPs, 209 (99%) had the same effect direction; 192 (91%) were nominally significant (P < 0.05); 144 (68%) were
Bonferroni significant after correcting for 211 comparisons; and 81 (38%) were independently genome-wide significant. b, Left: scatter plot for z-score
effect sizes for 206 GWS SNPs (Spearman’s ρ = 0.39) from the primary MDD-META GWAS of different ancestries, plotting z-score for European ancestry
(only) GWAS on the y axis and African ancestry (only) GWAS on the x axis. Right: overlap of SNPs from European and African ancestry GWASs. 223 GWS
SNPs from the primary analysis, of which 206 are available in the AA GWAS after quality control. Of the remaining SNPs, 125 (61%) had the same effect
direction; 20 were nominally significant (P < 0.05); and one was Bonferroni significant after correcting for 206 comparisons.
NATuRe NeuROSCIeNCe | www.nature.com/natureneuroscience

ARTICLESNATURE NEUROSCIENCE
symptom burden conducted in three cohorts from the Alzheimer’s Disease Neuroimaging Initiative, the Health and Retirement Study and the Indiana Memory and Aging Study37. As larger samples are collected for more diverse ancestry groups, we expect to see more novel loci identified for non-European populations. Finally, we conducted a transancestral meta-analysis by combining studies of African and European ancestries in 1,213,867 participants, thereby identifying 233 independent SNPs and 183 risk loci. For now, transancestral analysis is a way to leverage results from understudied populations.
We recognize limitations in our study. Maximizing the power available for this analysis comes at the cost of accepting broader biobank phenotyping approaches, which might reduce specific-ity of findings for the core depression phenotype11. Nonetheless, strong genetic correlations between the ICD-derived MDD and the broader definitions provide confidence in internal consis-tency, and future studies could look to further refine phenotyp-ing. Although all genetic correlations were significant, there was substantial variance (95% confidence interval (CI) = 0.72–1.7) in correlations with the FinnGen sample, probably due to power and heterogeneity in the broad phenotype that we used from this sample. Finally, other ancestries remain understudied in relation to Europeans. We hope that the initial results reported here for the MVP African ancestry sample can help advance the field by encouraging additional concerted research in African and other non-European ancestral groups.
In summary, we identified multiple novel loci, and several of these loci serve functions that should prioritize their further study in the pathology of major depression. We examined genetic corre-lations between depression GWAS and other external phenotypes, largely confirming and strengthening previous observations. We showed substantial enrichments for several brain regions, such as hypothalamus and frontal cortex, known to be important for depression. We also found strong support for the importance of DRD2 in the nucleus accumbens, a finding that is consistent with an emerging role for dopaminergic function in symptoms of anhedo-nia. Using gene and drug-based enrichments, we found overlapping biology with existing drugs—notably, those that affect glutama-tergic function but also those that influence the actions of estro-gen—that could offer repurposing opportunities. We used gSEM to show how the genetic architecture of depression maps onto the broader genetic structure of mental disorders and cognition, iden-tifying emergent overlap from hypothesis-free GWAS approaches with existing theories of psychopathology with regard to clusters of internalizing and externalizing disorders. Finally, we showed that many of our findings replicate in a large and independent cohort provided by 23andMe, providing evidence for the stability of GWAS findings from adequately powered cohorts.
Online contentAny methods, additional references, Nature Research report-ing summaries, source data, extended data, supplementary infor-mation, acknowledgements, peer review information; details of author contributions and competing interests; and statements of data and code availability are available at https://doi.org/10.1038/s41593-021-00860-2.
Received: 13 May 2020; Accepted: 16 April 2021; Published: xx xx xxxx
References 1. Hasin, D. S. et al. Epidemiology of adult DSM-5 major depressive
disorder and its specifiers in the United States. JAMA Psychiatry 75, 336–346 (2018).
2. Roehrig, C. Mental disorders top the list of the most costly conditions in the United States: $201 billion. Health Affairs 35, 1130–1135 (2016).
3. Mullins, N. et al. GWAS of suicide attempt in psychiatric disorders and association with major depression polygenic risk scores. Am. J. Psychiatry 176, 651–660 (2019).
4. Strawbridge, R. J. et al. Identification of novel genome-wide associations for suicidality in UK Biobank, genetic correlation with psychiatric disorders and polygenic association with completed suicide. EBioMedicine 41, 517–525 (2019).
5. Levey, D. F. et al. Genetic associations with suicide attempt severity and genetic overlap with major depression. Transl. Psychiatry 9, 22 (2019).
6. Docherty, A. R. et al. Genome-wide association study of suicide death and polygenic prediction of clinical antecedents. Am. J. Psychiatry 177, 917–927 (2020).
7. Wray, N. R. et al. Genome-wide association analyses identify 44 risk variants and refine the genetic architecture of major depression. Nat. Genet. 50, 668–681 (2018).
8. Howard, D. M. et al. Genome-wide association study of depression phenotypes in UK Biobank identifies variants in excitatory synaptic pathways. Nat. Commun. 9, 1470 (2018).
9. Hyde, C. L. et al. Identification of 15 genetic loci associated with risk of major depression in individuals of European descent. Nat. Genet. 48, 1031–1036 (2016).
10. Howard, D. M. et al. Genome-wide meta-analysis of depression identifies 102 independent variants and highlights the importance of the prefrontal brain regions. Nat. Neurosci. 22, 343–352 (2019).
11. Cai, N. et al. Minimal phenotyping yields genome-wide association signals of low specificity for major depression. Nat. Genet. 52, 437–447 (2020).
12. Willer, C. J. et al. Newly identified loci that influence lipid concentrations and risk of coronary artery disease. Nat. Genet. 40, 161–169 (2008).
13. Bulik-Sullivan, B. K. et al. LD score regression distinguishes confounding from polygenicity in genome-wide association studies. Nat. Genet. 47, 291–295 (2015).
14. Bycroft, C. et al. The UK Biobank resource with deep phenotyping and genomic data. Nature 562, 203–209 (2018).
15. Barbeira, A. N. et al. Integrating predicted transcriptome from multiple tissues improves association detection. PLoS Genet. 15, e1007889 (2019).
16. Rentzsch, P., Witten, D., Cooper, G. M., Shendure, J. & Kircher, M. CADD: predicting the deleteriousness of variants throughout the human genome. Nucleic Acids Res. 47, D886–D894 (2019).
17. Giambartolomei, C. et al. Bayesian test for colocalisation between pairs of genetic association studies using summary statistics. PLoS Genet. 10, e1004383 (2014).
18. Ge, S. X., Jung, D. & Yao, R. ShinyGO: a graphical enrichment tool for animals and plants. Bioinformatics 36, 2628–2629 (2019).
19. Gunther, S. et al. SuperTarget and Matador: resources for exploring drug-target relationships. Nucleic Acids Res. 36, D919–D922 (2008).
20. Singh, K. et al. Neural cell adhesion molecule Negr1 deficiency in mouse results in structural brain endophenotypes and behavioral deviations related to psychiatric disorders. Sci. Rep. 9, 5457 (2019).
21. Noh, K. et al. Negr1 controls adult hippocampal neurogenesis and affective behaviors. Mol. Psychiatry 24, 1189–1205 (2019).
22. Nestler, E. J. & Carlezon, W. A. Jr. The mesolimbic dopamine reward circuit in depression. Biol. Psychiatry 59, 1151–1159 (2006).
23. Tye, K. M. et al. Dopamine neurons modulate neural encoding and expression of depression-related behaviour. Nature 493, 537–541 (2013).
24. Krystal, A. D. et al. A randomized proof-of-mechanism trial applying the ‘fast-fail’ approach to evaluating κ-opioid antagonism as a treatment for anhedonia. Nat. Med. 26, 760–768 (2020).
25. Carlezon, W. A. Jr., Beguin, C., Knoll, A. T. & Cohen, B. M. Kappa-opioid ligands in the study and treatment of mood disorders. Pharmacol. Ther. 123, 334–343 (2009).
26. Gilling, M. et al. A 3.2 Mb deletion on 18q12 in a patient with childhood autism and high-grade myopia. Eur J Hum Genet 16, 312–319 (2008).
27. Sun, W. et al. Aberrant sodium channel activity in the complex seizure disorder of Celf4 mutant mice. J. Physiol. 591, 241–255 (2013).
28. Sakurai, H. et al. Longer-term open-label study of adjunctive riluzole in treatment-resistant depression. J. Affect. Disord. 258, 102–108 (2019).
29. Alt, A., Nisenbaum, E. S., Bleakman, D. & Witkin, J. M. A role for AMPA receptors in mood disorders. Biochem. Pharmacol. 71, 1273–1288 (2006).
30. Pittenger, C. et al. Riluzole in the treatment of mood and anxiety disorders. CNS Drugs 22, 761–786 (2008).
31. Chowdhury, G. M. et al. Transiently increased glutamate cycling in rat PFC is associated with rapid onset of antidepressant-like effects. Mol. Psychiatry 22, 120–126 (2017).
32. Baselmans, B. M. L. et al. Multivariate genome-wide analyses of the well-being spectrum. Nat. Genet. 51, 445–451 (2019).
33. Wani, A. L., Bhat, S. A. & Ara, A. Omega-3 fatty acids and the treatment of depression: a review of scientific evidence. Integr. Med. Res. 4, 132–141 (2015).
NATuRe NeuROSCIeNCe | www.nature.com/natureneuroscience

ARTICLES NATURE NEUROSCIENCE
34. Hacker, H., Tseng, P. H. & Karin, M. Expanding TRAF function: TRAF3 as a tri-faced immune regulator. Nat. Rev. Immunol. 11, 457–468 (2011).
35. Chiu, W. C., Su, Y. P., Su, K. P. & Chen, P. C. Recurrence of depressive disorders after interferon-induced depression. Transl. Psychiatry 7, e1026 (2017).
36. Descalzi, G. et al. Neuropathic pain promotes adaptive changes in gene expression in brain networks involved in stress and depression. Sci. Signal 10, eaaj1549 (2017).
37. Nho, K. et al. Comprehensive gene- and pathway-based analysis of depressive symptoms in older adults. J. Alzheimers Dis. 45, 1197–1206 (2015).
Publisher’s note Springer Nature remains neutral with regard to jurisdictional claims in
published maps and institutional affiliations.
© The Author(s), under exclusive licence to Springer Nature America, Inc. 2021
23andMe Research Team
Jingchunzi Shi13 and Suyash S. Shringarpure13
the Million Veteran Program
Daniel F. Levey1,2,15, Frank R. Wendt1,2, Gita A. Pathak1,2, Hang Zhou1,2, Mihaela Aslan5,6,
Rachel Quaden7, Kelly M. Harrington7,8, Yaira Z. Nuñez1,2, Cassie Overstreet1,2, John Concato5,14,
Renato Polimanti1,2 and Joel Gelernter1,2
NATuRe NeuROSCIeNCe | www.nature.com/natureneuroscience
ARTICLESNATURE NEUROSCIENCE
MethodsParticipants. The MVP cohort was previously described38–40. A GWAS was conducted in each of two tranches of data separately by ancestry, depending upon when the data became available. Ancestry was assigned using ten principal components (PCs) and the 1000 Genomes Project Phase 3 European and African reference within each tranche of data. For the analysis of the quantitative phenotype, we also performed a GWAS in the UKB sample. Finally, we conducted GWAS meta-analyses of traits related to depression using data from four large cohorts (Table 1 and Fig. 1a): the MVP34,41, the PGC/UKB10, FinnGen and 23andMe9. For the ICD definition of depression, the phenotype with the most available data for the MVP cohort, there were 1,154,267 total individuals for primary meta-analysis. For the secondary case–control meta-analysis, we performed a similar analysis except that we replaced the MDD diagnosis from MVP with the SR Depression GWAS for a total of 1,114,383 participants. For the secondary analysis of depressive symptoms by PHQ, we included 286,821 total participants from UKB and MVP. We also performed a GWAS in the MVP AA sample of 59,600 participants. We included these participants in a transancestral meta-analysis with a total sample size of 1,213,867 participants (Supplementary Fig. 5). Cohorts are detailed in Table 1. All data were collected independently, and, therefore, the analysts were blinded to the conditions of the analysis. No randomization was performed. No statistical methods were used to predetermine sample sizes, but our sample sizes are similar to those reported in previous publications8,10.
Phenotypes. Within MVP, three depression phenotypes were investigated across five different analyses. We used (1) an ICD code-based algorithm to determine depression case status based upon investigation of the EHRs (MDD, primary analysis), (2) self-reported physician diagnosis of depression as reported in the MVP baseline survey (SR Depression) and (3) the two-item PHQ scale of depressive symptoms in the past 2 weeks, included in the MVP baseline survey (depressive symptoms). Phenotypes in outside cohorts for UKB/PGC and 23andMe were previously described7–10. See Table 1 and Fig. 1 for a summary. For the ICD code-based algorithm in MVP, codes used to assess case status are presented in Supplementary Table 3. Cases included people with at least one inpatient diagnosis code or two outpatient diagnosis codes for MDD. Controls include only those without any inpatient or outpatient depression diagnosis codes for depression.
Secondary phenotype definitions. A similar meta-analysis was conducted using SR Depression (Methods) from MVP, conducted on 210,331 individuals who completed survey items on self-reported diagnosis of depression by a medical professional; the total meta-analysis with the traits from PGC, UKB and FinnGen included 1,114,383 individuals. A third analysis considered depressive symptoms from the PHQ-2 (ref. 42), a two-item scale that assesses depressive symptoms within the previous 2 weeks (Supplementary Table 4). For this phenotype, data were available only from MVP and UKB, with a total sample of 286,821 participants of European ancestry.
GWASs and meta-analyses. GWAS analysis was carried out in the MVP cohorts by logistic regression for MDD and SR Depression and by linear regression for PHQ-2 within each ancestry group and tranche using PLINK 2.0 on dosage data, covarying for age, sex and the first ten PCs. A similar GWAS was performed using linear regression in the UKB samples, also using age, sex and the first ten PCs for PHQ-2.
In individuals of European ancestry for MDD-META and SR Depression, meta-analysis was performed using METAL with inverse variance weighting for: MVP tranche 1, MVP tranche 2, the UKB/PGC MDD-META meta-analysis10, 23andMe9 and FinnGen mood (affective) disorders (http://r2.finngen.fi/pheno/F5_MOOD). For the PHQ-2 meta-analysis, the procedures were the same for the following samples: MVP tranche 1, MVP tranche 2 and UKB. Meta-analysis in the AA participants was carried out only between tranche 1 and 2 of the MVP data due to the absence of data in the other samples. Our results depend on contributions from many sources over many years. Some of the contributory studies and historical context of GWASs for MDD are presented in Supplementary Table 5.
The 23andMe phenotype was based on responses to four questions: ‘Have you ever been diagnosed by a doctor with any of the following psychiatric conditions?’, ‘Have you ever been diagnosed with clinical depression?’, ‘Have you ever been diagnosed with or treated for any of the following conditions? (Depression)’ and ‘In the last 2 years, have you been newly diagnosed with or started treatment for any of the following conditions? (Depression)’. Cases were defined as having responded ‘Yes’ to any of the above questions, and controls were defined when not a case and at least one ‘No’ response to the above questions.
The FinnGen diagnosis is defined by the F5 Mood category and was downloaded from Freeze 2 of the database (http://r2.finngen.fi/pheno/F5_MOOD). This phenotype is broad and contains manic episodes, bipolar disorders, depression, persistent mood disorders and other unspecified mood (affective) disorders. Data from UKB8 represent a broad depression phenotype based on affirmative responses to either of the following questions: ‘Have you ever seen a general practitioner for nerves, anxiety, tension or depression?’ and ‘Have you ever seen a psychiatrist for nerves, anxiety, tension or depression?’. PGC data also were
previously reported7 and come from a meta-analysis of 35 cohorts with a spectrum of depression phenotypes, including some with clinical diagnosis from structured interviews and others with broader definitions. LD intercept (1.03, SE = 0.011) and attenuation ratio (0.0297, SE = 0.011) of the LDSC revealed minimal evidence for inflation or confounding, with 97% of inflation observed due to high polygenicity of depression (Supplementary Fig. 4). Data distribution was assumed to be normal, but this was not formally tested.
Replication of primary analysis. An independent GWAS was run at 23andMe using logistic regression assuming an additive model for allelic effects while covarying for age, sex, four PCs and array platform, followed by SNP lookups of our 221 independent GWS SNPs. The phenotype was identical to that reported in ref. 9 (discussed in detail in the section above) but consisting of an entirely independent sample of 455,350 cases and 887,428 controls (n = 1,342,778) not previously included in any reported primary analysis.
Post-GWAS analysis. LDSC. For post-GWAS analysis, FinnGen was removed a priori due to potential for increased heterogeneity in the phenotype definition due to the broad nature of inclusion in the F5 Mood phenotype. Genetic correlation analyses were performed using LDSC to assess the degree of genetic overlap among phenotypes and across the cohorts included in the analysis. Per-trait observed-scale SNP-based heritability estimates were calculated via LDSC using the 1000 Genomes Project European linkage disequilibrium reference panel13. Heritability estimates were calculated for 1,468 phenotypes from FinnGen, 4,083 phenotypes from UKB, 3,143 brain image-derived phenotypes from the Oxford BIG project and phenotypes from the PGC, the SSGAC and the Genetics of Personality Consortium. Heritability z-scores were calculated by dividing the heritability estimate per phenotype by its associated SE. Phenotypes with heritability z-scores ≥ 4 were considered suitable for genetic correlation against MDD-META13. For continuous UKB phenotypes, we restricted our analyses to use inverse-rank normalized phenotypes instead of untransformed phenotypes. Genetic correlations are summarized by total phenotypes tested, nominally significant (P < 0.05) and after application of 5% FDR and Bonferroni thresholds (Fig. 2b).
LCV. The LCV model was used to infer genetic causal relationships between trait pairs using the 1000 Genomes Project European linkage disequilibrium reference panel. MDD-META was subjected to LCV with all traits described above for genetic correlation analysis. Due to differences in heritability calculation method and the number of SNPs used by LCV versus LDSC, genetic correlation results were not used to inform LCV trait pair selection. GCPs were interpreted only when the heritability z-score of both traits was ≥7, as determined by LCV, not LDSC43. Fully causal relationships were deduced for significant trait pairs with GCP estimates ≥0.70; otherwise, GCP estimates were considered evidence for partial causality43.
gSEM. gSEM was performed using GWAS summary statistics in the genomicSEM and lavaan R packages44. EFAs were performed on 16 traits simultaneously (MDD-META (the main phenotype of interest for this study), attention deficit hyperactivity disorder, anorexia nervosa, bipolar disorder, cannabis use disorder, cognitive performance, depressive symptoms, educational attainment, anxiety symptoms, neuroticism, post-traumatic stress disorder, problematic alcohol use, re-experiencing, risk tolerance, risky behavior and schizophrenia). EFAs were performed for 1 through n factors until the addition of factor n contributed less than 10% explained variance to the model. Confirmatory factor analysis was performed using the diagonally weighted least squares estimator and a genetic covariance matrix of munged GWAS summary statistics for all 16 phenotypes based on the 1000 Genome Project Phase 3 European linkage disequilibrium reference panel.
TWAS. We performed a TWAS using MetaXcan for 13 brain tissues and whole blood using GTEx v8. The MetaXcan framework consists of two prediction models for GTEx v8: elastic net and MASHR-based model for deriving eQTL values. The MASHR model is biologically informed, with deterministic approximation of posteriors-based fine-mapped variables, and recommended by the developers45. Because the eQTL effect is shared across several tissues, the joint effect of eQTL in 14 tissues was tested using SMultiXcan, developed under the MetaXcan toolkit15. We applied Bonferroni correction (corrected P-value threshold = 1.79 × 10⁻⁷) for all gene–tissue pairs tested.
Variant prioritization. Each of the risk loci, determined from functional mapping and annotation (FUMA) (default LD = 0.6), were fine-mapped using CAVIAR46. The set of causal SNPs were annotated with CADD16 scores followed by positional gene mapping within ±100 kb. The genes that overlapped with significant gene cross-tissue eQTL analysis were further tested for co-localization. Coloc17 was used to test co-localization between specific gene eQTL tissue pairs (GTEx v8). The LocusCompareR R package was used to generate regional plots of tissue-specific eQTL and GWAS P values.
NATuRe NeuROSCIeNCe | www.nature.com/natureneuroscience

ARTICLES NATURE NEUROSCIENCE
GWGAS and enrichment analysis. Summary statistics from the primary MDD-META meta-analysis were loaded into functional mapping and annotation of genome-wide association studies (FUMA GWAS) to test for gene-level associations using MAGMA47. Input SNPs were mapped to 17,927 protein-coding genes. The GWS threshold for the gene-based test was, therefore, determined to be P = 0.05/17,927 = 2.79 × 10⁻⁶. Genes from MAGMA’s gene-based association were used for gene ontology and drug set enrichment using the ShinyGO18 web tool.
Conditional analysis. To evaluate whether the genetic signal of depression was independent of signals from comorbid conditions, we employed mtCOJO in GCTA48. With mtCOJO, per-SNP effect estimates and association statistics of MDD-META were adjusted for the causal effects between MDD and seven comorbid conditions estimated by Mendelian randomization. We required at least two GWS SNPs after Heidi outlier testing with which to estimate causality between phenotypes. MDD was conditioned eight times: once each for alcohol use disorder, digestive disorders, educational attainment, fibromyalgia, neuroticism (SSGAC), schizophrenia and subjective well-being and once using all seven correlates simultaneously. In this experimental design, we generated eight new versions of depression GWAS summary statistics, termed ‘conditioned’ GWASs, to analyze for heritability, genetic correlation versus the original unconditioned depression GWAS, SNP effects and P-value survival. These analyses are described in the Methods under ‘Post-GWAS analysis: LDSC’. Conditioned GWASs generated from mtCOJO are free of collider biases when estimating causal relationship between depression and each comorbid condition49.
Due to SNP matching procedures to condition depression with other phenotypes, some GWS SNPs for depression were not found in the conditioned depression GWAS. Where necessary, we selected proxy SNPs for each depression GWS SNP using SNPsnap50 with default settings. For each conditioned version of the depression GWS, a subset of SNPs could not be matched using direct or proxy SNP matching.
Ethics statement. The Central VA Institutional Review Board (IRB) and site-specific IRBs approved the MVP study. All relevant ethical regulations for work with human subjects were followed in the conduct of the study, and written informed consent was obtained from all participants. For 23andMe, participants provided informed consent and participated in the research online, under a protocol approved by the external Association for the Accreditation of Human Research Protection Programs-accredited IRB, Ethical & Independent Review Services. Participants were included in the analysis on the basis of consent status as checked at the time data analyses were initiated.
Reporting Summary. Further information on research design is available in the Nature Research Reporting Summary linked to this article.
Data availabilityThe GWAS summary statistics generated and/or analyzed during this study are available via dbGaP; the dbGaP accession assigned to the Million Veteran Program is phs001672.v1.p.The full GWAS summary statistics for the 23andMe discovery dataset will be made available through 23andMe to qualified researchers under an agreement with 23andMe that protects the privacy of the 23andMe participants. Visit https://research.23andme.com/collaborate/#dataset-access/ for more information and to apply to access the data.
Code availabilityNo custom code was used in this study. Software and R packages used are discussed in the text.
References 38. Gelernter, J. et al. Genome-wide association study of post-traumatic stress
disorder reexperiencing symptoms in >165,000 US veterans. Nat. Neurosci. 22, 1394–1401 (2019).
39. Gaziano, J. M. et al. Million Veteran Program: a mega-biobank to study genetic influences on health and disease. J. Clin. Epidemiol. 70, 214–223 (2016).
40. Harrington, K. M. et al. Gender differences in demographic and health characteristics of the Million Veteran Program cohort. Womens Health Issues 29, S56–S66 (2019).
41. Levey, D. F. et al. Reproducible genetic risk loci for anxiety: results from ~200,000 participants in the Million Veteran Program. Am. J. Psychiatry 177, 223–232 (2020).
42. Kroenke, K., Spitzer, R. L. & Williams, J. B. The Patient Health Questionnaire-2: validity of a two-item depression screener. Med. Care 41, 1284–1292 (2003).
43. O’Connor, L. J. & Price, A. L. Distinguishing genetic correlation from causation across 52 diseases and complex traits. Nat. Genet. 50, 1728–1734 (2018).
44. Grotzinger, A. D. et al. Genomic structural equation modelling provides insights into the multivariate genetic architecture of complex traits. Nat. Hum. Behav. 3, 513–525 (2019).
45. Barbeira, A. N. et al. Exploring the phenotypic consequences of tissue specific gene expression variation inferred from GWAS summary statistics. Nat. Commun. 9, 1825 (2018).
46. Hormozdiari, F., Kostem, E., Kang, E. Y., Pasaniuc, B. & Eskin, E. Identifying causal variants at loci with multiple signals of association. Genetics 198, 497–508 (2014).
47. Watanabe, K., Taskesen, E., van Bochoven, A. & Posthuma, D. Functional mapping and annotation of genetic associations with FUMA. Nat. Commun. 8, 1826 (2017).
48. Zhu, Z. H. et al. Causal associations between risk factors and common diseases inferred from GWAS summary data. Nat. Commun. 9, 224 (2018).
49. Aschard, H., Vilhjalmsson, B. J., Joshi, A. D., Price, A. L. & Kraft, P. Adjusting for heritable covariates can bias effect estimates in genome-wide association studies. Am. J. Hum. Genet. 96, 329–339 (2015).
50. Pers, T. H., Timshel, P. & Hirschhorn, J. N. SNPsnap: a web-based tool for identification and annotation of matched SNPs. Bioinformatics 31, 418–420 (2015).
AcknowledgementsWe acknowledge the participants and investigators of the FinnGen study, 23andMe, the
UK Biobank, the PGC and the Million Veteran Program. We would like to thank the
research participants and employees of 23andMe for making this work possible. We thank
the veterans who participate in the Million Veteran Program. The following members of
the 23andMe Research Team contributed to this study: M. Agee, S. Aslibekyan, A. Auton,
R. K. Bell, K. Bryc, S. K. Clark, S. L. Elson, K. Fletez-Brant, P. Fontanillas, N. A. Furlotte,
P. M. Gandhi, K. Heilbron, B. Hicks, D. A. Hinds, K. E. Huber, E. M. Jewett, Y. Jiang,
A. Kleinman, K.-H. Lin, N. K. Litterman, M. K. Luff, J. C. McCreight, M. H. McIntyre,
K. F. McManus, J. L. Mountain, S. V. Mozaffari, P. Nandakumar, E. S. Noblin, C. A. M.
Northover, J. O’Connell, A. A. Petrakovitz, S. J. Pitts, G. D. Poznik, J. F. Sathirapongsasuti,
A. J. Shastri, J. F. Shelton, S. Shringarpure, C. Tian, J. Y. Tung, R. J. Tunney, V. Vacic,
X. Wang and A. S. Zare. From the Yale Department of Psychiatry, Division of Human
Genetics, we would like to thank and acknowledge the efforts of A. M. Lacobelle, C.
Robinson and C. Tyrell. Funding: this work was supported by funding from the Veterans
Affairs Office of Research and Development Million Veteran Program grant CX001849-
01 (MVP025) and VA Cooperative Studies Program CSP575B. D.F.L. was supported by an
NARSAD Young Investigator Grant from the Brain & Behavior Research Foundation.
Author contributionsJ.G. and M.B.S. secured funding for this project. D.F.L., M.B.S. and J.G. had primary
responsibility for design of the study. J.G., M.B.S. and J.C. conceived, supervised and
managed the study. K.R. and M.A. assisted with study administration. D.F.L., F.R.W.,
G.A.P., H.Z., J.S., S.S. and R.P. contributed to genetic and bioinformatic analyses. R.P.
was the senior statistical geneticist. K.H., R.Q. and D.F.L. contributed to phenotyping
and phenomic analyses. The initial manuscript was drafted by D.F.L., M.B.S. and J.G.
Manuscript contributions and interpretation of results were provided by D.F.L., M.B.S.,
F.R.W., G.A.P., K.H., G.S., H.Z., Y.Z.N., C.O., R.P., A.M., J.C. and J.G. The remaining
authors contributed to other organizational or data processing components of the study.
All authors saw, had the opportunity to comment on, and approved the final draft.
Competing interestsM.B.S. reports receiving consulting fees in the past 3 years from Acadia Pharmaceuticals,
Aptinyx, Bionomics, BioXcel Therapeutics, Boehringer Ingelheim, Clexio Biosciences,
EmpowerPharm, Engrail Therapeutics, Genentech/Roche, GW Pharmaceuticals,
Janssen, Jazz Pharmaceuticals and Oxeia Biopharmaceuticals. In the last 12 months,
G.S. has provided consulting services to Allergan, Axsome Therapeutics, Biohaven
Pharmaceuticals, Boehringer Ingelheim International, Bristol-Myers Squibb, Clexio
Biosciences, Epiodyne, Intra-Cellular Therapies, Janssen, Lundbeck, Minerva
Pharmaceuticals, Navitor Pharmaceuticals, NeuroRX, Noven Pharmaceuticals, Otsuka,
Perception Neuroscience, Praxis Seelos Pharmaceuticals and Vistagen Therapeutics.
G.S. has received funds for contracted research from Janssen Pharmaceuticals, Merck
and the Usona Institute. G.S. holds equity in Biohaven Pharmaceuticals and has received
royalties from Yale University, paid from patent licenses with Biohaven Pharmaceuticals.
J.S. and S.S. are employed by and hold stock or stock options in 23andMe, Inc. J.G. is
named as co-inventor on Patent Cooperation Treaty application no. 15/878,640 titled
‘Genotype-guided dosing of opioid agonists’, filed on January 24, 2018. All other authors
declare that they have no competing financial interests.
Additional informationSupplementary information The online version contains supplementary material
available at https://doi.org/10.1038/s41593-021-00860-2.
Correspondence and requests for materials should be addressed to M.B.S. or J.G.
Peer review information Nature Neuroscience thanks Gerome Breen and the other,
anonymous, reviewer(s) for their contribution to the peer review of this work.
Reprints and permissions information is available at www.nature.com/reprints.
NATuRe NeuROSCIeNCe | www.nature.com/natureneuroscience

1
natu
re research | rep
ortin
g su
mm
aryA
pril 2
02
0
Corresponding author(s):Joel Gelernter
Murray B. Stein
Last updated by author(s): Mar 16, 2021
Reporting SummaryNature Research wishes to improve the reproducibility of the work that we publish. This form provides structure for consistency and transparency
in reporting. For further information on Nature Research policies, see our Editorial Policies and the Editorial Policy Checklist.
StatisticsFor all statistical analyses, confirm that the following items are present in the figure legend, table legend, main text, or Methods section.
n/a Confirmed
The exact sample size (n) for each experimental group/condition, given as a discrete number and unit of measurement
A statement on whether measurements were taken from distinct samples or whether the same sample was measured repeatedly
The statistical test(s) used AND whether they are one- or two-sided
Only common tests should be described solely by name; describe more complex techniques in the Methods section.
A description of all covariates tested
A description of any assumptions or corrections, such as tests of normality and adjustment for multiple comparisons
A full description of the statistical parameters including central tendency (e.g. means) or other basic estimates (e.g. regression coefficient)
AND variation (e.g. standard deviation) or associated estimates of uncertainty (e.g. confidence intervals)
For null hypothesis testing, the test statistic (e.g. F, t, r) with confidence intervals, effect sizes, degrees of freedom and P value noted
Give P values as exact values whenever suitable.
For Bayesian analysis, information on the choice of priors and Markov chain Monte Carlo settings
For hierarchical and complex designs, identification of the appropriate level for tests and full reporting of outcomes
Estimates of effect sizes (e.g. Cohen's d, Pearson's r), indicating how they were calculated
Our web collection on statistics for biologists contains articles on many of the points above.
Software and code
Policy information about availability of computer code
Data collection No software was used for data collection.
Data analysis PLINK was used for GWAS, METAL was used for meta-analysis, R was used for statistical tests, all R packages are mentioned explicitly in text
where the package was used. The GTEx database v8 was used for tissue enrichment. MetaXcan was used to predict gene expression using
the GTEx database v8.
For manuscripts utilizing custom algorithms or software that are central to the research but not yet described in published literature, software must be made available to editors and
reviewers. We strongly encourage code deposition in a community repository (e.g. GitHub). See the Nature Research guidelines for submitting code & software for further information.
Data
Policy information about availability of data
All manuscripts must include a data availability statement. This statement should provide the following information, where applicable:
- Accession codes, unique identifiers, or web links for publicly available datasets
- A list of figures that have associated raw data
- A description of any restrictions on data availability
The GWAS summary statistics generated during and/or analyzed during the current study are available via dbGAP; the dbGaP accession assigned to the Million
Veteran Program is phs001672.v1.p. The website is: https://www.ncbi.nlm.nih.gov/projects/gap/cgi-bin/study.cgi?study_id=phs001672.v1.p1.
23andMe dataset access is available by request at the following website: https://research.23andme.com/dataset-access/

2
natu
re research | rep
ortin
g su
mm
aryA
pril 2
02
0
Field-specific reportingPlease select the one below that is the best fit for your research. If you are not sure, read the appropriate sections before making your selection.
Life sciences Behavioural & social sciences Ecological, evolutionary & environmental sciences
For a reference copy of the document with all sections, see nature.com/documents/nr-reporting-summary-flat.pdf
Life sciences study designAll studies must disclose on these points even when the disclosure is negative.
Sample size Sample size reflected our best efforts to gather all possible participants with genetic data and available phenotypes as described, including ICD
code derived diagnosis of depression, survey self-report of diagnosis of depression, and 2 item PHQ-2 depression screener.
Data exclusions All subjects that passed basic quality control, were assigned to either European or African ancestry, and had available phenotype information
were retained. Subjects with only one outpatient ICD code for depression were considered undefined and excluded from analysis. All
exclusion criteria were pre-established.
Replication 23andMe provided an independent replication sample of 1.3 million participants. These participants are distinct and
non-overlapping with the cohort used in the discovery analysis, but collection parameters and phenotype are the same (as the other 23andme
subjects included in the primary analysis). Of 211 variants tested, 209 (99%) had the same direction of effect, 192 showed at least nominal
significance p<0.05 (91%), 144 remained significant after correction for multiple comparisons p<0.05/211=2.37x10-4 (68%), and 81 were
independently genome-wide significant p<5x10⁻⁸ (38%). Only 2 SNPs were discordant, both with p>0.05 (0.9%).
Randomization Randomization was not applicable to this study. Cohorts were allocated to cases and controls based on available ICD codes in the electronic
health records of participants.
Blinding Data were collected entirely independently of the analysts. There was no need for blinding or randomization.
Reporting for specific materials, systems and methodsWe require information from authors about some types of materials, experimental systems and methods used in many studies. Here, indicate whether each material,
system or method listed is relevant to your study. If you are not sure if a list item applies to your research, read the appropriate section before selecting a response.
Materials & experimental systems
n/a Involved in the study
Antibodies
Eukaryotic cell lines
Palaeontology and archaeology
Animals and other organisms
Human research participants
Clinical data
Dual use research of concern
Methods
n/a Involved in the study
ChIP-seq
Flow cytometry
MRI-based neuroimaging
Human research participants
Policy information about studies involving human research participants
Population characteristics The MVP is made of of veterans receiving care in the VA Healthcare System. Participants were 64.78 years old on average.
The sample contained 91.9% males.
Recruitment All subjects are enrollees in the MVP. Active users of the Veterans Health Administration healthcare system (>8 million
veterans) learn of MVP via an invitational mailing and/or through MVP staff while receiving clinical care with informed
consent and HIPAA authorization as the only inclusion criteria. Enrollment involves providing a blood sample for genomic
analyses, allowing ongoing access to medical records and other administrative health data by authorized MVP staff, and
completing questionnaires.
Ethics oversight Research involving MVP in general is approved by the VA Central IRB; the current project was also approved by IRBs in
Boston, San Diego, and West Haven.
Note that full information on the approval of the study protocol must also be provided in the manuscript.