bhojendra*, ravi rakash aurya, latika b , h p preview ije
TRANSCRIPT

Indian Journal of Entomology, Review Article (2020) DoI No.:
GENETIC VARIABILITY IN PREDATORY STINK BUG ANDRALLUS SPINIDENS (F.) FROM NORTH-WEST HIMALAYA
Bhojendra*, ravi Prakash Maurya, Latika BrijwaL, hiManshu PatwaL and ParuL suyaL
Department of Entomology, College of Agriculture, G.B. Pant University of Agriculture and Technology,
Pantnagar-263145, U.S. Nagar, Uttarakhand *Email: [email protected] (corresponding author)
ABSTRACT
Present study deliberates on the geographical distribution and genetic variability of the predatory stink bug Andrallus spinidens (F.) from different crop ecosystems of north west Himalaya. Andrallus spinidens is an important biological control agent as it predates on lepidopteran larvae. Samples of this bug were collected from five locations of plains and hilly areas of Uttarakhand and subjected to RAPD-PCR analysis. The results revealed that of the 12 RAPD primers evaluated 10 primers generated 117 loci with 0.26 polymorphism information content (PIC), 2.75 marker index (MI), 4.67 resolving power (RP). RAPD primer, EF4 was found to be efficient in deciphering the variability with highest RP values of 7.71 with 4.37 MI and 0.39 PIC values. The samples were clustered locationwise with 0.26-0.95 similarity coefficient during cluster analysis using UPGMA method. The pairwise comparison analysis (PCA) also supported the clustering pattern obtained. The results reveal that genetically distant populations of A. spinidens prevail in all the five locations studied.
Key words: Andrallus spinidens, Himalaya, distribution, genetic variability, polymorphism, RAPD-PCR, primers, resolving power, cluster analysis
E:Review article-- 20024-Bhojendra
The Asopinae bug Andrallus spinidens F. (Hemiptera: Pentatomidae) is a generalist predator with biocontrol potential due to its wide host range and unique mode (extra oral digestion) of predation (Ho et al., 2003; Grazia et al., 2015). It is widely distributed (Distant, 1902; Thomas, 1994) and associated with agricultural environment feeding on major pests viz: Helicoverpa armigera, Chilo suppressalis, Rivulia sp., Naranga aenescens, Spodoptera litura and S.frugiperda (Rajendra and Patel, 1971; Rao and Rao, 1979; Singh and Singh, 1987; Mohaghegh and Massod, 2007; Claver and Jaiswal, 2013, Shylesha and Sravika, 2018). In India A. spinidens had been reported from Assam, Sikkim, Jharkhand, Meghalaya, West Bengal and Karnataka (Distant, 1902; 1908). In Uttarakhand, it is known as a predator of Zygograma bicolorata (Pandey et al., 2002) and S. litura (Maurya and Sharma, 2014).
The north west Himalayan region of Uttarakhand (28º43’-31º27’N, 77º 34’-81º02’E) (Anonymous, 2102-13) is rich in diversity and geographical features viz: high hills, mid hills, foot hills, valleys and Tarai region (Samant et al., 2007). Environmental condition having complex interaction with insect population and their morphology, reproduction, predatory efficiency, mortality, prey selection and longevity will also
affected with reffrence to their distribution or habitat geographical location (Sokolowski, 2001). In addition, A. spinidens can survive at various altitudes (Bhojendra et al., 2019) but the effect of climatic conditions on their genetic variability has not been not explored. The diversity of any population depends on its genotypic and environmental flexibility (Tauber et al., 1986). RAPD (Random amplified polymorphic DNA) marker is an efficient device to differentiate isolated population genetically (Fuchs et al., 1998; Pavlovcic et al., 2008). This study evaluates the effect of geographical locations on genetic variation of A. spinidens, so that a suitable strain for a particular geographical area can be identified for its utilization in biocontrol.
MATERIALS AND METHODS
The samples of A. spinidens were collected from various locations viz., plain/ tarai area (Pantnagar: 235 masl, Tanakpur: 255 masl, Ramnagar: 367 masl) and hilly area (Majhera: 922 masl, Almora: 1212 masl) in Kumaon region of Uttarakhand in northeest Himalaya during 2017-2018. From each location, three crop fields were surveyed and samples collected through hand picking and stored at -200C in 80% ethanol (Ellango et al., 2015). From these thorax muscle was randomly
PREVIEW
2 Indian Journal of Entomology, Review Article 2020
extracted for DNA isolation to avoid cross contamination (n=7) (Gracia et al., 1998). Genomic DNA was extracted with HipurATM Insect DNA Purification Kit (Himedia) from 50 mg samples (Sambrook, et al., 2001).
DNA amplification was performed with sets of 12 arbitrary deca-nucleotide RAPD primers (Kavar et al., 2006) in PCR thermo-cycler (Wee 32 Himedia). The RAPD primers were synthesized by Chromous Biotech Bangalore. For amplification 15 µl reaction mixture prepared by mixing of diluted DNA sample (2µl), 10Mm primer (1.2µl), 10X PCR buffer (1.5µl), 10Mm dNTP mix (0.9 µl), 5U/µl Taq DNA polymerase (0.3µl) and molecular biology grade water (9.1µl) following cycling protocol: Initial denaturation at 94°C for 5 min followed by 40 cycles of denaturation at 94°C for 45 sec, annealing at 30°C for 30 sec and extension at 72°C for 2 min. Final extension was carried out at 72°C for 5 minu (Williams et al., 1990; Tan et al., 2007). Amplified DNA was subjected to electrophoresis on 2.5% agarose gel at constant voltage of 70V with TAE (50X) buffer. DNA bands were visualized on UV gel documentation system and captured (Alpha innotech Alpha imager EC).
The DNA polymorphism was calculated by analysing the polymorphic and monomorphic bands resolved on gel image. Scoring of banding pattern was done by credited in binary medium where ‘1’ for presence and ‘0’ for absence of bands of different molecular weights were scored. Genetic distance based on Jaccard Coefficient (Jaccard, 1908) was calculated using NTSYSpc 2.11a software package (Rohlf, 2002). The distance coefficient obtained were used to construct the dendrogram using UPGMA (The unweighted pair group method with arithmetic average) employing the SHAN clustering algorithm in same software package. Principal component analysis (PCA) was used for clustering the populations in bidimentional scatter plot through R software package (Jombart, 2008; Lopes et al., 2017) and % Polymorphism (no of polymorphic loci/Total number of loci) computed. Polymorphism information content (PIC) was assessed according to Rodan-Ruiz et al. (2000) to detect ability of primer to establish polymorphism in the population depending on the number of alleles detected and on their distribution frequency: ,Where, PIC = Polymorphism information content of primer, PICi = polymorphism content of ith loci and, , where, Pi = Frequency of ith allele. Effective multiplex ratio (EMR) and Marker index (MI) were calculated according to Powell et al. (1996) in order to estimate the overall effectiveness of marker system, EMR= {np(np/n)},where, EMR = Effective multiplex
ratio, np = no. of polymorphic bands, n = no. of bands and MI=PICEMR. Resolution power (Rp) was assessed according to Prevost and Wilkinson (1999) to characterize the ability of primer combination to detect the difference between samples. Where, Bli = Band informativeness of ith loci, and where, Pi = Frequency of the ith allele.
RESULTS AND DISCUSSION
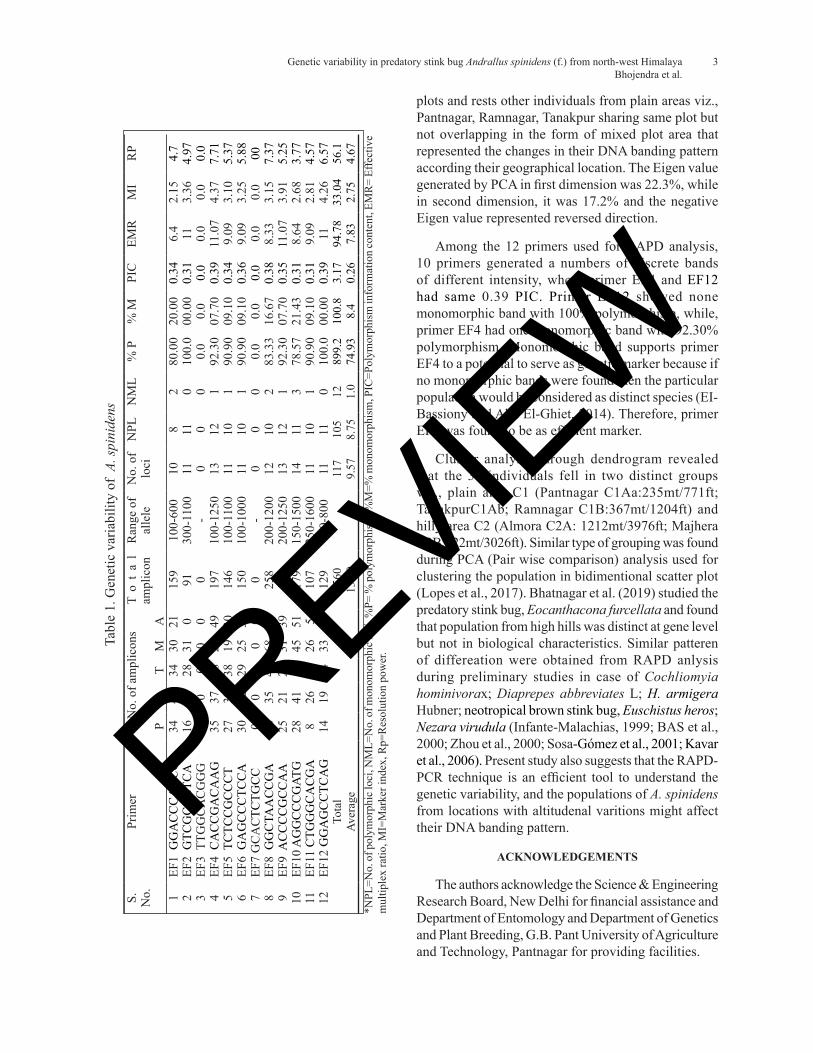
In the present study 35 samples of A. spinidens from five different locations of were analysed. Out of 12 RAPD primers, 10 primers were able to generate scorable banding pattern. These primers amplified numbers of separate loci of varying intensity with varying amplicon patterns, and the amplicons/ primer was found to be 130. The size and number of monomorphic and polymorphic loci varied- of 117 loci, 105 were polymorphic with 74.93% polymorphism, while, 12 loci were monomorphic with 8.4% monomorphism. The maximum 14 and minimum 10 loci amplified by EF10 and EF1, respectively. 100% polymorphism was detected with primer EF2 and EF12, while minimum 78.57% was with EF10. Polymorphism information contain (PIC) value depends on the frequency of loci was found to be 0.26 with maximum 0.39 in EF4 and EF12 and minimum 0.31 in EF2, EF10 and EF11 primers. Effective Multiplex ratio (EMR) of any primer depends upon the number and types of loci that ranged from 6.4 to 11.07 with 7.83 in 12 primers. Marker index depends upon PIC and EMR of particular primer (2.15 to 4.37, mean 2.75); and resolving power (RP) was from 3.77 to 7.71 (mean 4.67). The MI was found to be maximum of 4.37 with EF4 with a maximum RP of 7.71 (Table 1).
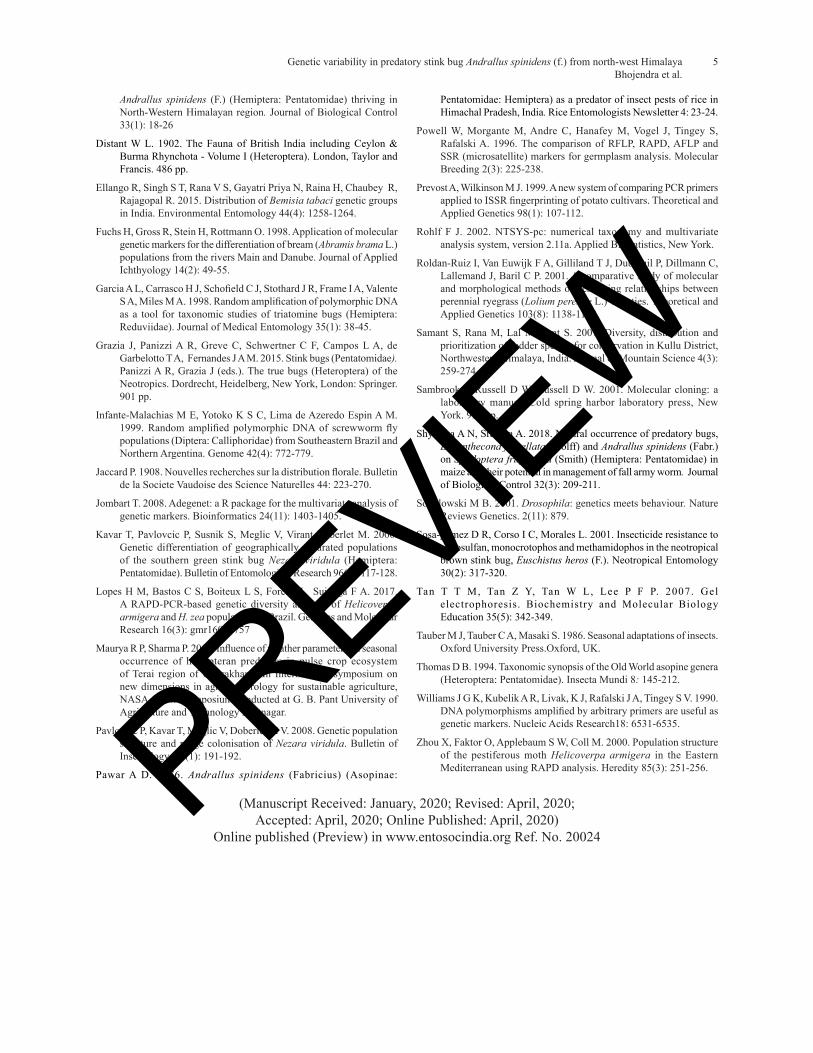
Scoring of 130.0 amplicons from 35 individuals generated a unique RAPD profile in the dendrogram (Fig. 1); genetic distance was 0.26, all individuals grouped in Cluster C as a main one subdivided into C1 and C2- C1 with those from the plain (Tarai) region consisting of Pantnagar (P1-7), Tanakpur (T1-7) and Ramnagar (R1-7) with 43% genetic similarity. The subfragments of C1are given in Fig. 1. On the other hand C2 consisting of the ones from the hilly areas revealed 40% similarity within individuals of Majhera (M1-7) and Almora (A1-7), with further subgroupings. Thus distinctive grouping was observed between hills and plain locations. The pair wise comparison among all 35 individuals through R software gave a scatter plot as given in Fig. 2. Like UPGMA, PCA separated Majhera (M1-7) and Almora (A1-7) into 2 individual
PREVIEW
Genetic variability in predatory stink bug Andrallus spinidens (f.) from north-west Himalaya 3 Bhojendra et al.
S.
No.
Prim
erN
o. o
f am
plic
ons
To
ta
l am
plic
onR
ange
of
alle
leN
o. o
f lo
ciN
PLN
ML
% P
% M
PIC
EMR
MI
RP
PR
TM
A1
EF1
GG
AC
CC
AA
CC
3440
3430
2115
910
0-60
010
82
80.0
020
.00
0.34
6.4
2.15
4.7
2EF
2 G
TCG
CC
GTC
A16
1628
310
9130
0-11
0011
110
100.
000
.00
0.31
113.
364.
973
EF3
TTG
GC
AC
GG
G0
00
00
0-
00
00.
00.
00.
00.
00.
00.
04
EF4
CA
CC
GA
CA
AG
3537
4828
4919
710
0-12
5013
121
92.3
007
.70
0.39
11.0
74.
377.
715
EF5
TC
TCC
GC
CC
T27
3338
1930
146
100-
1100
1110
190
.90
09.1
00.
349.
093.
105.
376
EF6
GA
GC
CC
TCC
A30
3229
2534
150
100-
1000
1110
190
.90
09.1
00.
369.
093.
255.
887
EF7
GC
AC
TCTG
CC
00
00
00
-0
00
0.0
0.0
0.0
0.0
0.0
008
EF8
GG
CTA
AC
CG
A36
3547
6872
258
200-
1200
1210
283
.33
16.6
70.
388.
333.
157.
379
EF9
AC
CC
CG
CC
AA
2521
2831
3914
420
0-12
5013
121
92.3
007
.70
0.35
11.0
73.
915.
2510
EF10
AG
GC
CC
GAT
G28
4114
4551
179
150-
1500
1411
378
.57
21.4
30.
318.
642.
683.
7711
EF11
CTG
GG
CA
CG
A8
2642
265
107
250-
1600
1110
190
.90
09.1
00.
319.
092.
814.
5712
EF12
GG
AG
CC
TCA
G14
1914
3349
129
150-
800
1111
010
0.0
00.0
00.
3911
4.26
6.57
Tota
l15
6011
710
512
899.
210
0.8
3.17
94.7
833
.04
56.1
Aver
age
130.
09.
578.
751.
074
.93
8.4
0.26
7.83
2.75
4.67
Tabl
e 1.
Gen
etic
var
iabi
lity
of A
. spi
nide
ns
*NPL
=No.
of p
olym
orph
ic lo
ci, N
ML=
No.
of m
onom
orph
ic lo
ci, %
P= %
pol
ymor
phis
m, %
M=%
mon
omor
phis
m, P
IC=P
olym
orph
ism
info
rmat
ion
cont
ent,
EMR
= Ef
fect
ive
mul
tiple
x ra
tio, M
I=M
arke
r ind
ex, R
p=R
esol
utio
n po
wer
.
plots and rests other individuals from plain areas viz., Pantnagar, Ramnagar, Tanakpur sharing same plot but not overlapping in the form of mixed plot area that represented the changes in their DNA banding pattern according their geographical location. The Eigen value generated by PCA in first dimension was 22.3%, while in second dimension, it was 17.2% and the negative Eigen value represented reversed direction.
Among the 12 primers used for RAPD analysis, 10 primers generated a numbers of discrete bands of different intensity, where primer EF4 and EF12 had same 0.39 PIC. Primer EF12 showed none monomorphic band with 100% polymorphism, while, primer EF4 had one monomorphic band with 92.30% polymorphism. Monomorphic band supports primer EF4 to a potential to serve as genetic marker because if no monomorphic bands were found then the particular population would be considered as distinct species (EI-Bassiony and Abu El-Ghiet, 2014). Therefore, primer EF4 was found to be as efficient marker.
Cluster analysis through dendrogram revealed that the 35 individuals fell in two distinct groups viz., plain area C1 (Pantnagar C1Aa:235mt/771ft; TanakpurC1Ab; Ramnagar C1B:367mt/1204ft) and hilly area C2 (Almora C2A: 1212mt/3976ft; Majhera C2B:922mt/3026ft). Similar type of grouping was found during PCA (Pair wise comparison) analysis used for clustering the population in bidimentional scatter plot (Lopes et al., 2017). Bhatnagar et al. (2019) studied the predatory stink bug, Eocanthacona furcellata and found that population from high hills was distinct at gene level but not in biological characteristics. Similar patteren of differeation were obtained from RAPD anlysis during preliminary studies in case of Cochliomyia hominivorax; Diaprepes abbreviates L; H. armigera Hubner; neotropical brown stink bug, Euschistus heros; Nezara virudula (Infante-Malachias, 1999; BAS et al., 2000; Zhou et al., 2000; Sosa-Gómez et al., 2001; Kavar et al., 2006). Present study also suggests that the RAPD-PCR technique is an efficient tool to understand the genetic variability, and the populations of A. spinidens from locations with altitudenal varitions might affect their DNA banding pattern.
ACKNOWLEDGEMENTS
The authors acknowledge the Science & Engineering Research Board, New Delhi for financial assistance and Department of Entomology and Department of Genetics and Plant Breeding, G.B. Pant University of Agriculture and Technology, Pantnagar for providing facilities.
PREVIEW

Genetic variability in predatory stink bug Andrallus spinidens (f.) from north-west Himalaya 4 Bhojendra et al.
REFERENCES
Anonymous. 2012-13. Uttarakhand at a glance. Directorate of economics and statistics. Govt. of Uttarakhand, Dehradun.
Bas B, Dalkilic Z, Peever T L, Nigg H N, Simpson S E, Gmitter F G, Adair R C. 2000. Genetic relationships among Florida Diaprepes abbreviatus (Coleoptera: Curculionidae) populations. Annals of the Entomological Society of America 93(3): 459-467.
Bhatnagar V R, Maurya R P, Brijwal L, Dobhal P, Suyal P, Singh N K. 2019. Study on variability among predatory stink bug, Eocanthecona furcellata (Wolff) (Hemiptera: Pentatomidae) population thriving in different agro-ecosystems of north-western Himalayas, India. Journal of Entomology and Zoology Studies 7(3): 726-736.
Bhojendra, Maurya R P, Brijwal L, Patwal H, Suyal P. 2019. Effect of diverse locations on the biological attributes of predatory bug,
Fig. 1. UPGMA dendrogram profile of A. spinidens (NTSYSpc 2.1a.) (P=Pantnagar, R=Ramnagar, T=Tanakpur, M=Majhera, A=Almora)
Fig. 2. Scatter plot- pairwise comparison analysis A. spinidens (R software) (P=Pantnagar, R=Ramnagar, T=Tanakpur, M=Majhera, A=Almora)
Fig. 3. Amplification profile of A. spinidens [L (Ladder 100bp), Pantnagar (P1-P7), Ramnagar (R1-R2), Tanakpur (T1-T7), Majhera (M1-M7) and Almora (A1-A7)] PREVIEW
Genetic variability in predatory stink bug Andrallus spinidens (f.) from north-west Himalaya 5 Bhojendra et al.
Andrallus spinidens (F.) (Hemiptera: Pentatomidae) thriving in North-Western Himalayan region. Journal of Biological Control 33(1): 18-26
Distant W L. 1902. The Fauna of British India including Ceylon & Burma Rhynchota - Volume I (Heteroptera). London, Taylor and Francis. 486 pp.
Ellango R, Singh S T, Rana V S, Gayatri Priya N, Raina H, Chaubey R, Rajagopal R. 2015. Distribution of Bemisia tabaci genetic groups in India. Environmental Entomology 44(4): 1258-1264.
Fuchs H, Gross R, Stein H, Rottmann O. 1998. Application of molecular genetic markers for the differentiation of bream (Abramis brama L.) populations from the rivers Main and Danube. Journal of Applied Ichthyology 14(2): 49-55.
Garcia A L, Carrasco H J, Schofield C J, Stothard J R, Frame I A, Valente S A, Miles M A. 1998. Random amplification of polymorphic DNA as a tool for taxonomic studies of triatomine bugs (Hemiptera: Reduviidae). Journal of Medical Entomology 35(1): 38-45.
Grazia J, Panizzi A R, Greve C, Schwertner C F, Campos L A, de Garbelotto T A, Fernandes J A M. 2015. Stink bugs (Pentatomidae). Panizzi A R, Grazia J (eds.). The true bugs (Heteroptera) of the Neotropics. Dordrecht, Heidelberg, New York, London: Springer. 901 pp.
Infante-Malachias M E, Yotoko K S C, Lima de Azeredo Espin A M. 1999. Random amplified polymorphic DNA of screwworm fly populations (Diptera: Calliphoridae) from Southeastern Brazil and Northern Argentina. Genome 42(4): 772-779.
Jaccard P. 1908. Nouvelles recherches sur la distribution florale. Bulletin de la Societe Vaudoise des Science Naturelles 44: 223-270.
Jombart T. 2008. Adegenet: a R package for the multivariate analysis of genetic markers. Bioinformatics 24(11): 1403-1405.
Kavar T, Pavlovcic P, Susnik S, Meglic V, Virant-Doberlet M. 2006. Genetic differentiation of geographically separated populations of the southern green stink bug Nezara viridula (Hemiptera: Pentatomidae). Bulletin of Entomological Research 96(2): 117-128.
Lopes H M, Bastos C S, Boiteux L S, Foresti J, Suinaga F A. 2017. A RAPD-PCR-based genetic diversity analysis of Helicoverpa armigera and H. zea populations in Brazil. Genetics and Molecular Research 16(3): gmr16038757
Maurya R P, Sharma P. 2014. Influence of weather parameters on seasonal occurrence of hemipteran predators in pulse crop ecosystem of Terai region of Uttarakhand. In International symposium on new dimensions in agrometeorology for sustainable agriculture, NASA-2014. Symposium conducted at G. B. Pant University of Agriculture and Technology Pantnagar.
Pavlovcic P, Kavar T, Meglic V, Doberlet M V. 2008. Genetic population structure and range colonisation of Nezara viridula. Bulletin of Insectology 61(1): 191-192.
Pawar A D. 1976. Andrallus spinidens (Fabricius) (Asopinae:
Pentatomidae: Hemiptera) as a predator of insect pests of rice in Himachal Pradesh, India. Rice Entomologists Newsletter 4: 23-24.
Powell W, Morgante M, Andre C, Hanafey M, Vogel J, Tingey S, Rafalski A. 1996. The comparison of RFLP, RAPD, AFLP and SSR (microsatellite) markers for germplasm analysis. Molecular Breeding 2(3): 225-238.
Prevost A, Wilkinson M J. 1999. A new system of comparing PCR primers applied to ISSR fingerprinting of potato cultivars. Theoretical and Applied Genetics 98(1): 107-112.
Rohlf F J. 2002. NTSYS-pc: numerical taxonomy and multivariate analysis system, version 2.11a. Applied Biostatistics, New York.
Roldan-Ruiz I, Van Euwijk F A, Gilliland T J, Dubreuil P, Dillmann C, Lallemand J, Baril C P. 2001. A comparative study of molecular and morphological methods of describing relationships between perennial ryegrass (Lolium perenne L.) varieties. Theoretical and Applied Genetics 103(8): 1138-1150.
Samant S, Rana M, Lal M, Pant S. 2007. Diversity, distribution and prioritization of fodder species for conservation in Kullu District, Northwestern Himalaya, India. Journal of Mountain Science 4(3): 259-274.
Sambrook J, Russell D W, Russell D W. 2001. Molecular cloning: a laboratory manual. Cold spring harbor laboratory press, New York. 999 pp.
Shylesha A N, Sravika A. 2018. Natural occurrence of predatory bugs, Eocanthecona furcellata (Wolff) and Andrallus spinidens (Fabr.) on Spodoptera frugiperda (Smith) (Hemiptera: Pentatomidae) in maize and their potential in management of fall army worm. Journal of Biological Control 32(3): 209-211.
Sokolowski M B. 2001. Drosophila: genetics meets behaviour. Nature Reviews Genetics. 2(11): 879.
Sosa-gómez D R, Corso I C, Morales L. 2001. Insecticide resistance to endosulfan, monocrotophos and methamidophos in the neotropical brown stink bug, Euschistus heros (F.). Neotropical Entomology 30(2): 317-320.
Tan T T M, Tan Z Y, Tan W L, Lee P F P. 2007. Gel electrophoresis. Biochemistry and Molecular Biology Education 35(5): 342-349.
Tauber M J, Tauber C A, Masaki S. 1986. Seasonal adaptations of insects. Oxford University Press.Oxford, UK.
Thomas D B. 1994. Taxonomic synopsis of the Old World asopine genera (Heteroptera: Pentatomidae). Insecta Mundi 8: 145-212.
Williams J G K, Kubelik A R, Livak, K J, Rafalski J A, Tingey S V. 1990. DNA polymorphisms amplified by arbitrary primers are useful as genetic markers. Nucleic Acids Research18: 6531-6535.
Zhou X, Faktor O, Applebaum S W, Coll M. 2000. Population structure of the pestiferous moth Helicoverpa armigera in the Eastern Mediterranean using RAPD analysis. Heredity 85(3): 251-256.
(Manuscript Received: January, 2020; Revised: April, 2020; Accepted: April, 2020; Online Published: April, 2020)
Online published (Preview) in www.entosocindia.org Ref. No. 20024PREVIEW