bh2 existing bh7 existing bh21 - jicaopen_jicareport.jica.go.jp/pdf/12068599_03.pdf · tc 2.615...
TRANSCRIPT

MASTER PLAN STUDY ON PORT DEVELOPMENT AND LOGISTICS IN GREATER JAKARTA METROPOLITAN AREA (JICA)
FINAL REPORT
3-41
(2) Marunda-Bekasi
1) Existing Borehole Data
The private investor for development of the Marunda Center had carried out number of subsoil conditions surveys including exploratory boring, undisturbed sampling and laboratory test in their commercial area.
The developer shared the soil data as obtained with the JICA study team. The location and soil profile of the subsoil conditions survey as carried out by them are shown in Figure 3.5-9 and Figure 3.5-10.
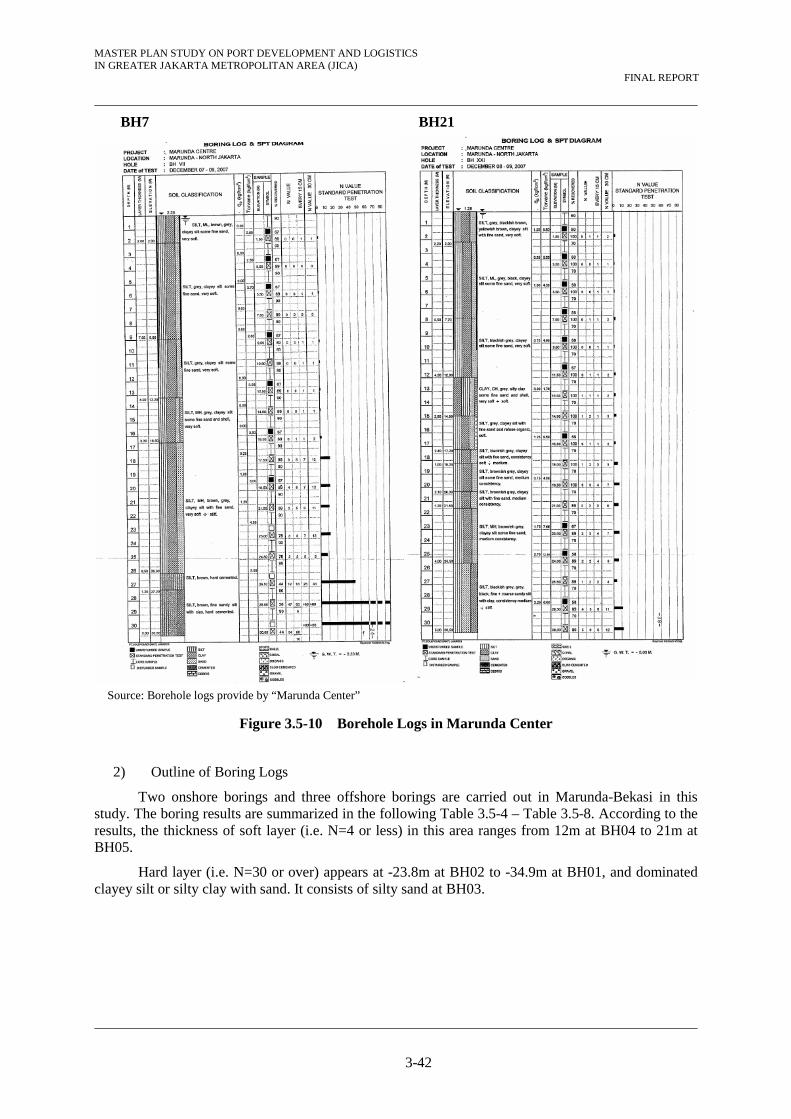
The survey indicates that the very soft layer (N value = 0 to 3) assumed deposited in alluvium covers the top of the surface, and medium stiff clayey silt, likely Pleistocene sediment (N-value = 5 to 12), is laid below the alluvium sediment. Stiff to hard clayey silt appeared under the Pleistocene sediment at Existing-BH7. The N-value of this hard silt shows 40 to 60 or over.
Figure 3.5-9 Location map of existing Boreholes in Marunda Center
Existing BH7
Existing BH21
BH2
Source: Location map provided by “Marunda Center”
MASTER PLAN STUDY ON PORT DEVELOPMENT AND LOGISTICS IN GREATER JAKARTA METROPOLITAN AREA (JICA)
FINAL REPORT
3-42
Figure 3.5-10 Borehole Logs in Marunda Center
2) Outline of Boring Logs
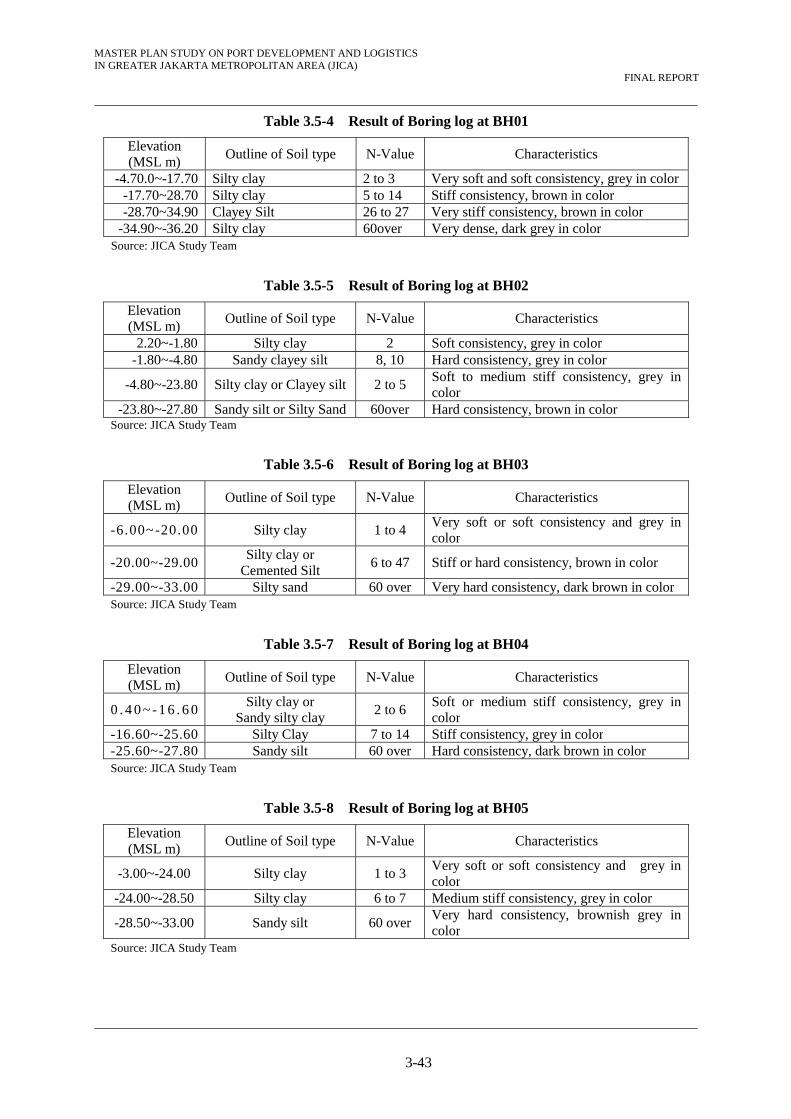
Two onshore borings and three offshore borings are carried out in Marunda-Bekasi in this study. The boring results are summarized in the following Table 3.5-4 – Table 3.5-8. According to the results, the thickness of soft layer (i.e. N=4 or less) in this area ranges from 12m at BH04 to 21m at BH05.
Hard layer (i.e. N=30 or over) appears at -23.8m at BH02 to -34.9m at BH01, and dominated clayey silt or silty clay with sand. It consists of silty sand at BH03.
Source: Borehole logs provide by “Marunda Center”
BH7 BH21
MASTER PLAN STUDY ON PORT DEVELOPMENT AND LOGISTICS IN GREATER JAKARTA METROPOLITAN AREA (JICA)
FINAL REPORT
3-43
Table 3.5-4 Result of Boring log at BH01
Elevation (MSL m)
Outline of Soil type N-Value Characteristics
-4.70.0~-17.70 Silty clay 2 to 3 Very soft and soft consistency, grey in color-17.70~28.70 Silty clay 5 to 14 Stiff consistency, brown in color -28.70~34.90 Clayey Silt 26 to 27 Very stiff consistency, brown in color
-34.90~-36.20 Silty clay 60over Very dense, dark grey in color Source: JICA Study Team
Table 3.5-5 Result of Boring log at BH02
Elevation (MSL m)
Outline of Soil type N-Value Characteristics
2.20~-1.80 Silty clay 2 Soft consistency, grey in color -1.80~-4.80 Sandy clayey silt 8, 10 Hard consistency, grey in color
-4.80~-23.80 Silty clay or Clayey silt 2 to 5 Soft to medium stiff consistency, grey in color
-23.80~-27.80 Sandy silt or Silty Sand 60over Hard consistency, brown in color Source: JICA Study Team
Table 3.5-6 Result of Boring log at BH03
Elevation (MSL m)
Outline of Soil type N-Value Characteristics
-6.00~-20.00 Silty clay 1 to 4 Very soft or soft consistency and grey in color
-20.00~-29.00 Silty clay or
Cemented Silt 6 to 47 Stiff or hard consistency, brown in color
-29.00~-33.00 Silty sand 60 over Very hard consistency, dark brown in colorSource: JICA Study Team
Table 3.5-7 Result of Boring log at BH04
Elevation (MSL m)
Outline of Soil type N-Value Characteristics
0 . 4 0 ~ -1 6 . 6 0 Silty clay or
Sandy silty clay 2 to 6
Soft or medium stiff consistency, grey in color
-16.60~-25.60 Silty Clay 7 to 14 Stiff consistency, grey in color -25.60~-27.80 Sandy silt 60 over Hard consistency, dark brown in color Source: JICA Study Team
Table 3.5-8 Result of Boring log at BH05
Elevation (MSL m)
Outline of Soil type N-Value Characteristics
-3.00~-24.00 Silty clay 1 to 3 Very soft or soft consistency and grey in color
-24.00~-28.50 Silty clay 6 to 7 Medium stiff consistency, grey in color
-28.50~-33.00 Sandy silt 60 over Very hard consistency, brownish grey in color
Source: JICA Study Team
MASTER PLAN STUDY ON PORT DEVELOPMENT AND LOGISTICS IN GREATER JAKARTA METROPOLITAN AREA (JICA)
FINAL REPORT
3-44
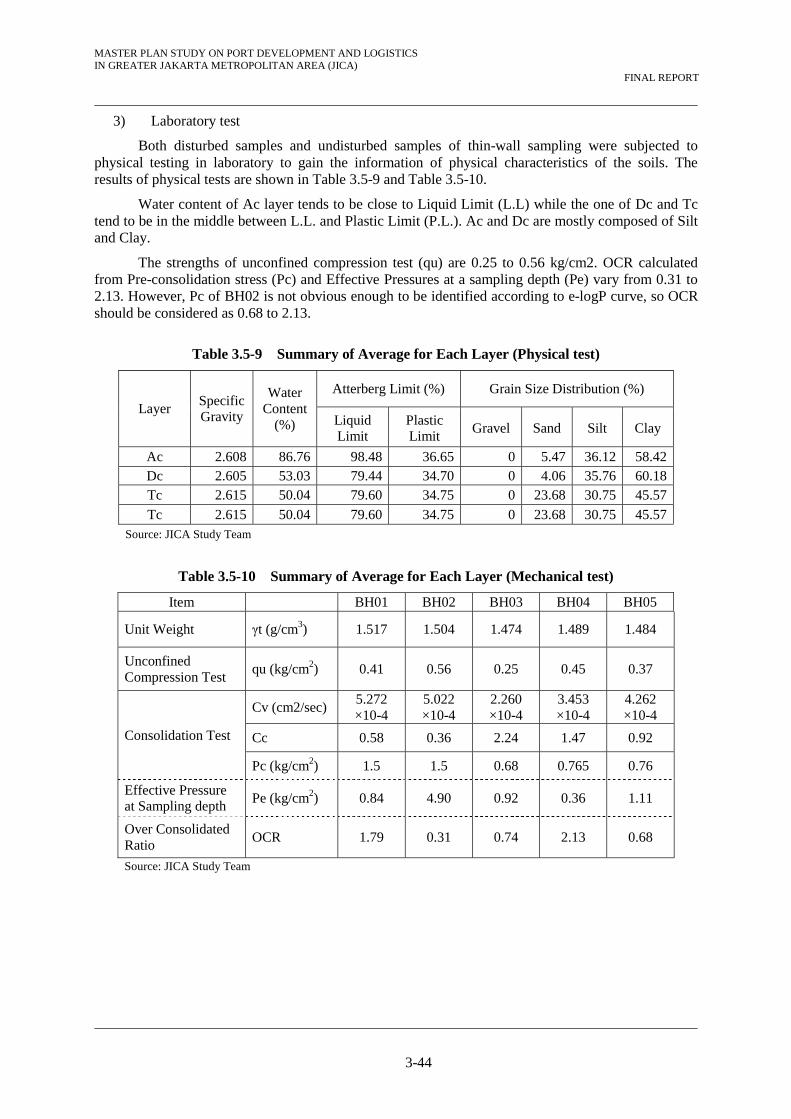
3) Laboratory test
Both disturbed samples and undisturbed samples of thin-wall sampling were subjected to physical testing in laboratory to gain the information of physical characteristics of the soils. The results of physical tests are shown in Table 3.5-9 and Table 3.5-10.
Water content of Ac layer tends to be close to Liquid Limit (L.L) while the one of Dc and Tc tend to be in the middle between L.L. and Plastic Limit (P.L.). Ac and Dc are mostly composed of Silt and Clay.
The strengths of unconfined compression test (qu) are 0.25 to 0.56 kg/cm2. OCR calculated from Pre-consolidation stress (Pc) and Effective Pressures at a sampling depth (Pe) vary from 0.31 to 2.13. However, Pc of BH02 is not obvious enough to be identified according to e-logP curve, so OCR should be considered as 0.68 to 2.13.
Table 3.5-9 Summary of Average for Each Layer (Physical test)
Layer SpecificGravity
Water Content
(%)
Atterberg Limit (%) Grain Size Distribution (%)
Liquid Limit
Plastic Limit
Gravel Sand Silt Clay
Ac 2.608 86.76 98.48 36.65 0 5.47 36.12 58.42Dc 2.605 53.03 79.44 34.70 0 4.06 35.76 60.18Tc 2.615 50.04 79.60 34.75 0 23.68 30.75 45.57
Tc 2.615 50.04 79.60 34.75 0 23.68 30.75 45.57Source: JICA Study Team
Table 3.5-10 Summary of Average for Each Layer (Mechanical test)
Item BH01 BH02 BH03 BH04 BH05
Unit Weight γt (g/cm3) 1.517 1.504 1.474 1.489 1.484
Unconfined Compression Test
qu (kg/cm2) 0.41 0.56 0.25 0.45 0.37
Consolidation Test
Cv (cm2/sec) 5.272 ×10⁻⁴
5.022 ×10⁻⁴
2.260 ×10⁻⁴
3.453 ×10⁻⁴
4.262 ×10⁻⁴
Cc 0.58 0.36 2.24 1.47 0.92
Pc (kg/cm2) 1.5 1.5 0.68 0.765 0.76
Effective Pressure at Sampling depth
Pe (kg/cm2) 0.84 4.90 0.92 0.36 1.11
Over Consolidated Ratio
OCR 1.79 0.31 0.74 2.13 0.68
Source: JICA Study Team
MASTER PLAN STUDY ON PORT DEVELOPMENT AND LOGISTICS IN GREATER JAKARTA METROPOLITAN AREA (JICA)
FINAL REPORT
3-45
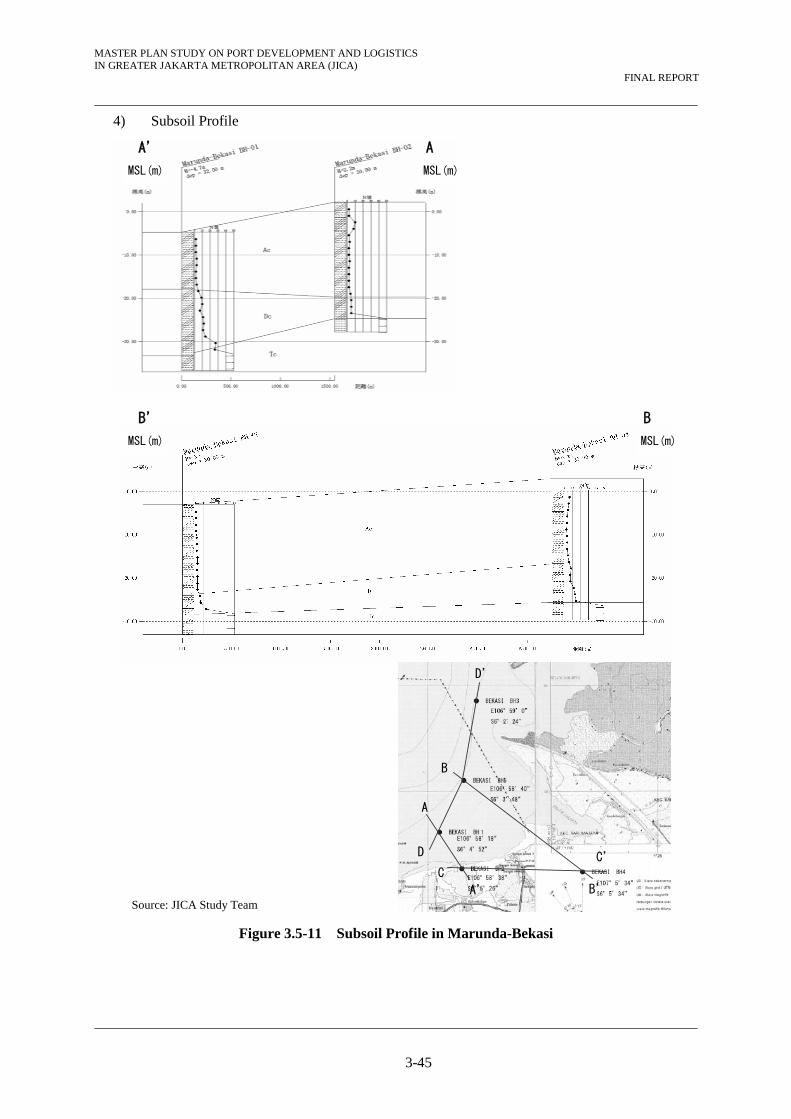
4) Subsoil Profile
Figure 3.5-11 Subsoil Profile in Marunda-Bekasi
A’
MSL(m)
A
A’
B
B’
C C’ D
D’
A
MSL(m)
B’
MSL(m)
B
MSL(m)
Source: JICA Study Team

MASTER PLAN STUDY ON PORT DEVELOPMENT AND LOGISTICS IN GREATER JAKARTA METROPOLITAN AREA (JICA)
FINAL REPORT
3-46
Figure 3.5-12 Subsoil Profile in Marunda-Bekasi
A
A’
B
B’
C C’ D
D’
D
MSL(m)
D’
MSL(m)
D
MSL(m)
C’
MSL(m)
Source: JICA Study Team
MASTER PLAN STUDY ON PORT DEVELOPMENT AND LOGISTICS IN GREATER JAKARTA METROPOLITAN AREA (JICA)
FINAL REPORT
3-47
(3) Cilamaya
1) Existing borehole data
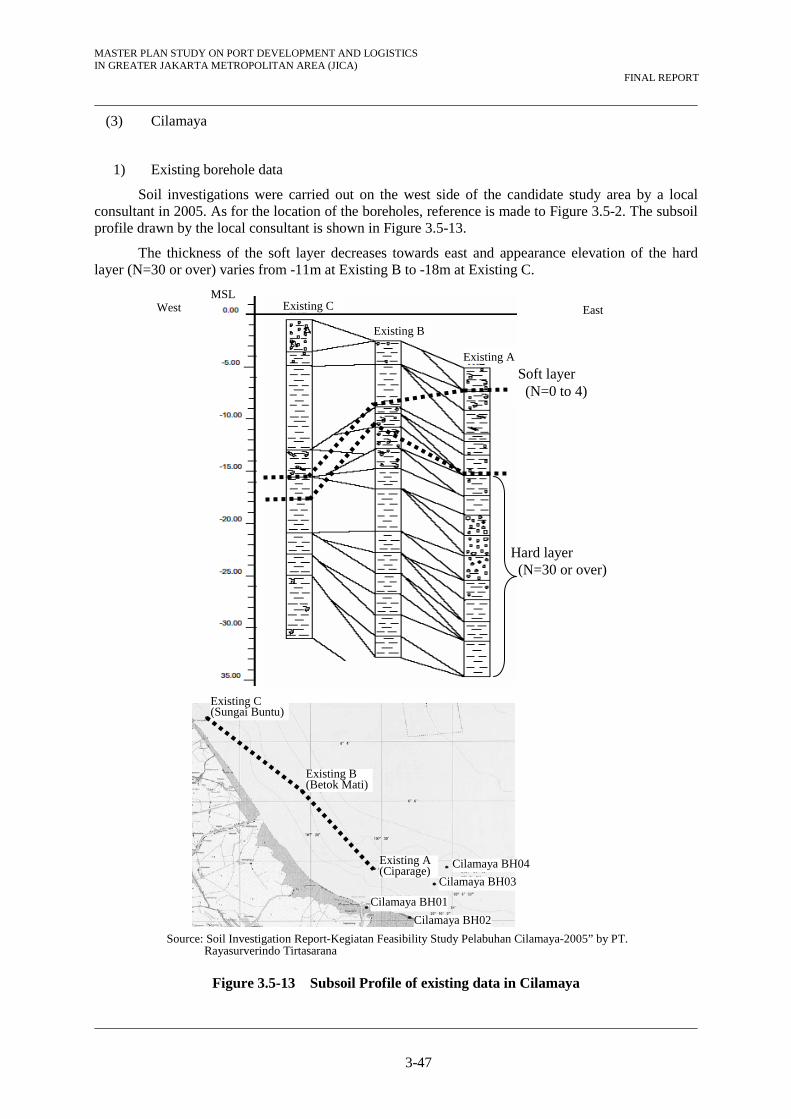
Soil investigations were carried out on the west side of the candidate study area by a local consultant in 2005. As for the location of the boreholes, reference is made to Figure 3.5-2. The subsoil profile drawn by the local consultant is shown in Figure 3.5-13.
The thickness of the soft layer decreases towards east and appearance elevation of the hard layer (N=30 or over) varies from -11m at Existing B to -18m at Existing C.
Figure 3.5-13 Subsoil Profile of existing data in Cilamaya
Soft layer (N=0 to 4)
East West
Existing A
Existing B
Existing CMSL
Hard layer (N=30 or over)
Cilamaya BH04
Cilamaya BH03
Cilamaya BH01
Cilamaya BH02
Existing A(Ciparage)
Existing B(Betok Mati)
Existing C (Sungai Buntu)
Source: Soil Investigation Report-Kegiatan Feasibility Study Pelabuhan Cilamaya-2005” by PT. Rayasurverindo Tirtasarana
MASTER PLAN STUDY ON PORT DEVELOPMENT AND LOGISTICS IN GREATER JAKARTA METROPOLITAN AREA (JICA)
FINAL REPORT
3-48
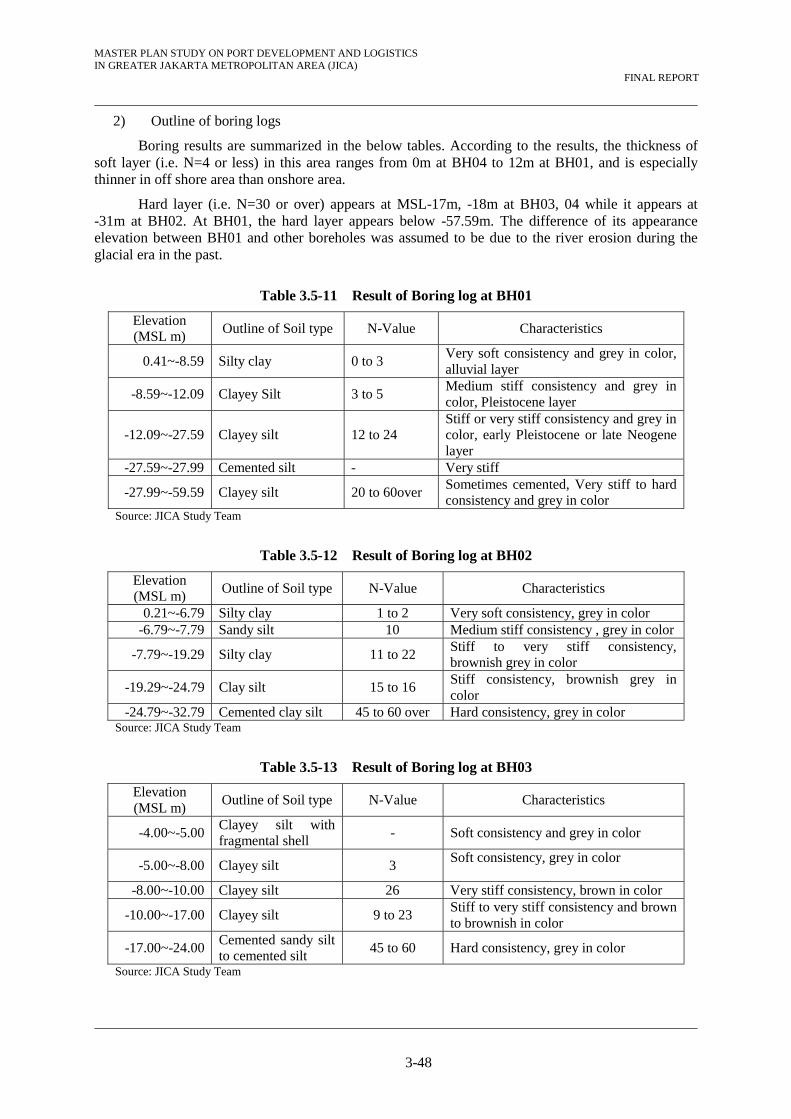
2) Outline of boring logs
Boring results are summarized in the below tables. According to the results, the thickness of soft layer (i.e. N=4 or less) in this area ranges from 0m at BH04 to 12m at BH01, and is especially thinner in off shore area than onshore area.
Hard layer (i.e. N=30 or over) appears at MSL-17m, -18m at BH03, 04 while it appears at -31m at BH02. At BH01, the hard layer appears below -57.59m. The difference of its appearance elevation between BH01 and other boreholes was assumed to be due to the river erosion during the glacial era in the past.
Table 3.5-11 Result of Boring log at BH01
Elevation (MSL m)
Outline of Soil type N-Value Characteristics
0.41~-8.59 Silty clay 0 to 3 Very soft consistency and grey in color, alluvial layer
-8.59~-12.09 Clayey Silt 3 to 5 Medium stiff consistency and grey in color, Pleistocene layer
-12.09~-27.59 Clayey silt 12 to 24 Stiff or very stiff consistency and grey in color, early Pleistocene or late Neogene layer
-27.59~-27.99 Cemented silt - Very stiff
-27.99~-59.59 Clayey silt 20 to 60over Sometimes cemented, Very stiff to hard consistency and grey in color
Source: JICA Study Team
Table 3.5-12 Result of Boring log at BH02
Elevation (MSL m)
Outline of Soil type N-Value Characteristics
0.21~-6.79 Silty clay 1 to 2 Very soft consistency, grey in color -6.79~-7.79 Sandy silt 10 Medium stiff consistency , grey in color
-7.79~-19.29 Silty clay 11 to 22 Stiff to very stiff consistency, brownish grey in color
-19.29~-24.79 Clay silt 15 to 16 Stiff consistency, brownish grey in color
-24.79~-32.79 Cemented clay silt 45 to 60 over Hard consistency, grey in color Source: JICA Study Team
Table 3.5-13 Result of Boring log at BH03
Elevation (MSL m)
Outline of Soil type N-Value Characteristics
-4.00~-5.00 Clayey silt with fragmental shell
- Soft consistency and grey in color
-5.00~-8.00 Clayey silt 3 Soft consistency, grey in color
-8.00~-10.00 Clayey silt 26 Very stiff consistency, brown in color
-10.00~-17.00 Clayey silt 9 to 23 Stiff to very stiff consistency and brown to brownish in color
-17.00~-24.00 Cemented sandy silt to cemented silt
45 to 60 Hard consistency, grey in color
Source: JICA Study Team

MASTER PLAN STUDY ON PORT DEVELOPMENT AND LOGISTICS IN GREATER JAKARTA METROPOLITAN AREA (JICA)
FINAL REPORT
3-49
Table 3.5-14 Result of Boring log at BH01
Elevation (MSL m)
Outline of Soil type N-Value Characteristics
-7.00~-9.00 Clayey silt 12 Stiff consistency, grey in color -9.00~-12.00 Cemented sandy silt 60 over Hard consistency, brown in color
-12.00~-18.00 Clay silt 23 to 28 Very stiff consistency, light brown to brownish grey in color
-18.00~-20.00 Cemented clayey silt 33 Hard consistency, grey in color
-20.00~-21.50 Silty sand mixed with gravel
47 Dense condition, grey in color
-21.50~-25.00 Cemented clayey silt 37 to 60over Hard consistency, brown in color Source: JICA Study Team
3) Laboratory test
Both disturbed samples and undisturbed samples of thin-wall sampling were subjected to physical testing in laboratory to obtain information on the physical characteristics of the soils. The results of physical tests are shown in Table 3.5-15 and Table 3.5-16.
Water content of Ac layer tends to be close to Liquid Limit (L.L) while the one of Dc and Tc tends to be in the middle between L.L. and Plastic Limit (P.L.) or close to P.L. Ac and Dc are mostly occupied by Silt and Clay. The strengths of unconfined compression test (qu) are 0.08 to 0.13 kg/cm2. OCR calculated from Pre-consolidation stress (Pc) and Effective Pressure at a sampling depth (Pe) vary from 1.67 to 10.8. However, Pc of BH02 is not obvious enough to be identified according to e-logP curve, so OCR should be considered as 1.67 to 2.73.
Table 3.5-15 Summary of Average for Each Layer (Physical test)
Layer Specific Gravity
Water Content
(%)
Atterberg Limit (%) Grain Size Distribution (%)
Liquid Limit
Plastic Limit
Gravel Sand Silt Clay
Ac 2.579 93.04 101.64 36.09 0 5.27 36.66 58.07Dc 2.619 42.26 73.20 33.94 0 11.16 35.61 53.99Tc 2.650 32.81 77.83 34.51 0 20.43 33.03 46.58
Source: JICA Study Team
Table 3.5-16 Summary of Average for Each Layer (Mechanical test)
Item BH01 BH02 BH03 Unit Weight γt (g/cm3) 1.229 1.354 1.39
Unconfined Compression Test
qu (kg/cm2) 0.08 0.1 0.13
Consolidation Test Cv (cm2/sec) 4.251×10⁻⁴ 4.021×10⁻⁴ 3.027×10⁻⁴
Cc 1.9 0.81 0.5 Pc (kg/cm2) 0.5 2.6 1.39
Effective Pressure at Sampling depth
Pe (kg/cm2) 0.30 0.24 0.51
Over Consolidated Ratio OCR 1.67 10.8 2.73 Source: JICA Study Team
MASTER PLAN STUDY ON PORT DEVELOPMENT AND LOGISTICS IN GREATER JAKARTA METROPOLITAN AREA (JICA)
FINAL REPORT
3-50
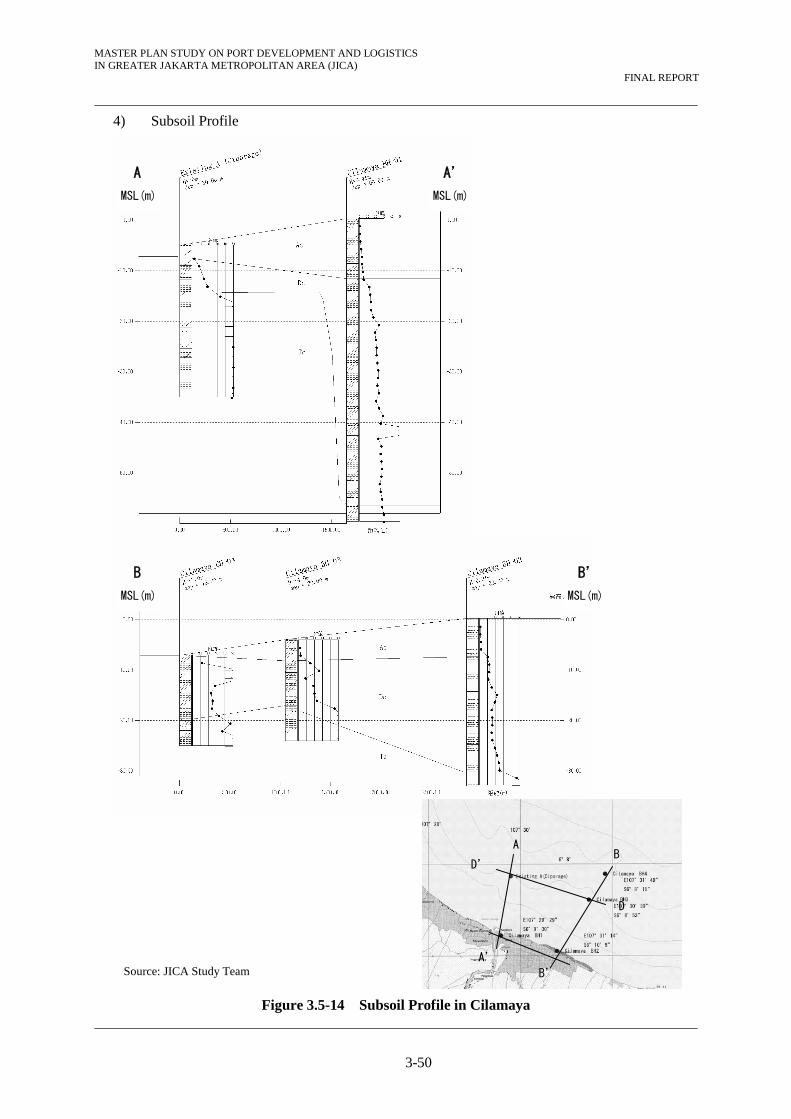
4) Subsoil Profile
Figure 3.5-14 Subsoil Profile in Cilamaya
A
MSL(m)
A’
MSL(m)
B
MSL(m)
B’
MSL(m)
AB
A’
B’
D’
D
Source: JICA Study Team
MASTER PLAN STUDY ON PORT DEVELOPMENT AND LOGISTICS IN GREATER JAKARTA METROPOLITAN AREA (JICA)
FINAL REPORT
3-51
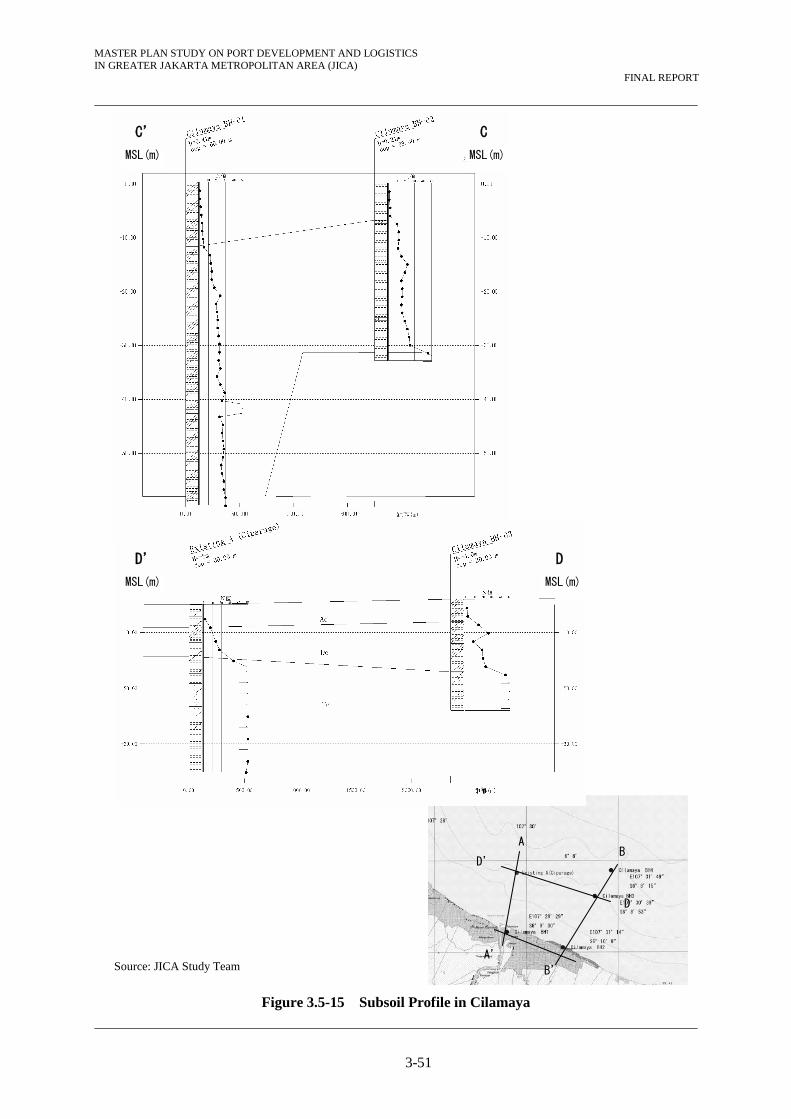
Figure 3.5-15 Subsoil Profile in Cilamaya
C’
MSL(m)
C
MSL(m)
D’
MSL(m)
D
MSL(m)
AB
A’
B’
D’
D
Source: JICA Study Team

MASTER PLAN STUDY ON PORT DEVELOPMENT AND LOGISTICS IN GREATER JAKARTA METROPOLITAN AREA (JICA)
FINAL REPORT
3-52
(4) Ciasem
1) Outline of boring logs
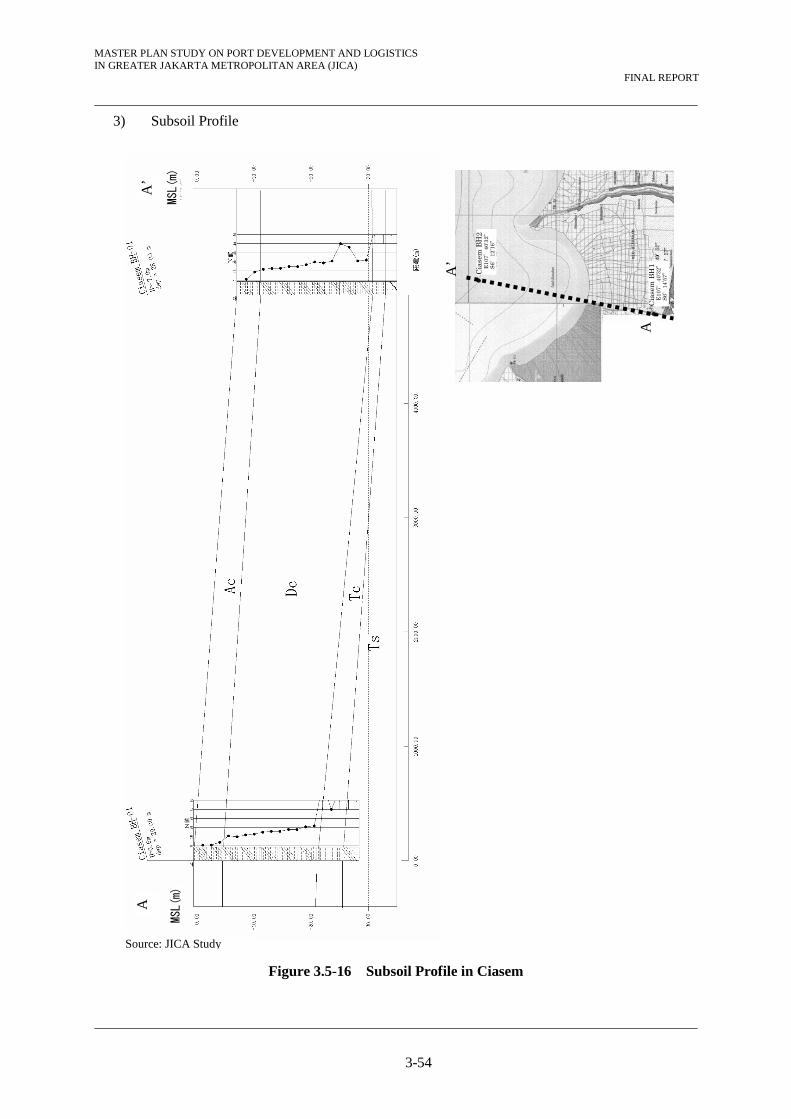
Boring results are summarized in the below tables. According to the results, the thickness of soft layer (i.e. N=4 or less) is thin, from 2m at BH02 to 5m at BH01.
Hard layer (i.e. N=30 or over) appears at -21.40 m, -31 m at BH01, 02.
Table 3.5-17 Summary of Boring log at BH01
Elevation (MSL m)
Outline of Soil type N-Value Characteristics
0.60~-4.40 Sandy silty clay with fragmental shell
1 to 4 Soft consistency, grey in color
-4.40~-11.60 Silty clay 10 to 15 Stiff consistency , brown in color -11.60~-21.40 Silty clay 15 to 24 Very stiff consistency, brown in color -21.40~-25.40 Cemented clayey silt 60 over Hard consistency, grey in color
-25.40~-28.40 Silty sand mixed with gravel
60 over Very dense condition, grey in color
Source: JICA Study Team
Table 3.5-18 Summary of Boring log at BH02
Elevation (MSL m)
Outline of Soil type N-Value Characteristics
-7.00~-9.00 Sandy silt 1 Very soft, grey in color
-9.00~-20.00 Clayey silt 9 to 17 Stiff consistency , grayish brown in color
-20.00~-24.00 Clayey silt 17 to 21 Very stiff consistency, grey in color -24.00~-27.00 Cemented clayey silt 36 to 40 Hard consistency, grey in color
-27.00~-31.00 Silty clay 21 to 22 Very stiff consistency, grayish brown in color
-31.00~-33.00 Cemented silty clay 57 to 60 Hard in consistency, grey in color -33.00~-34.00 Sand mixed with gravel 60 over Very dense, grey in color
Source: JICA Study Team
2) Laboratory test
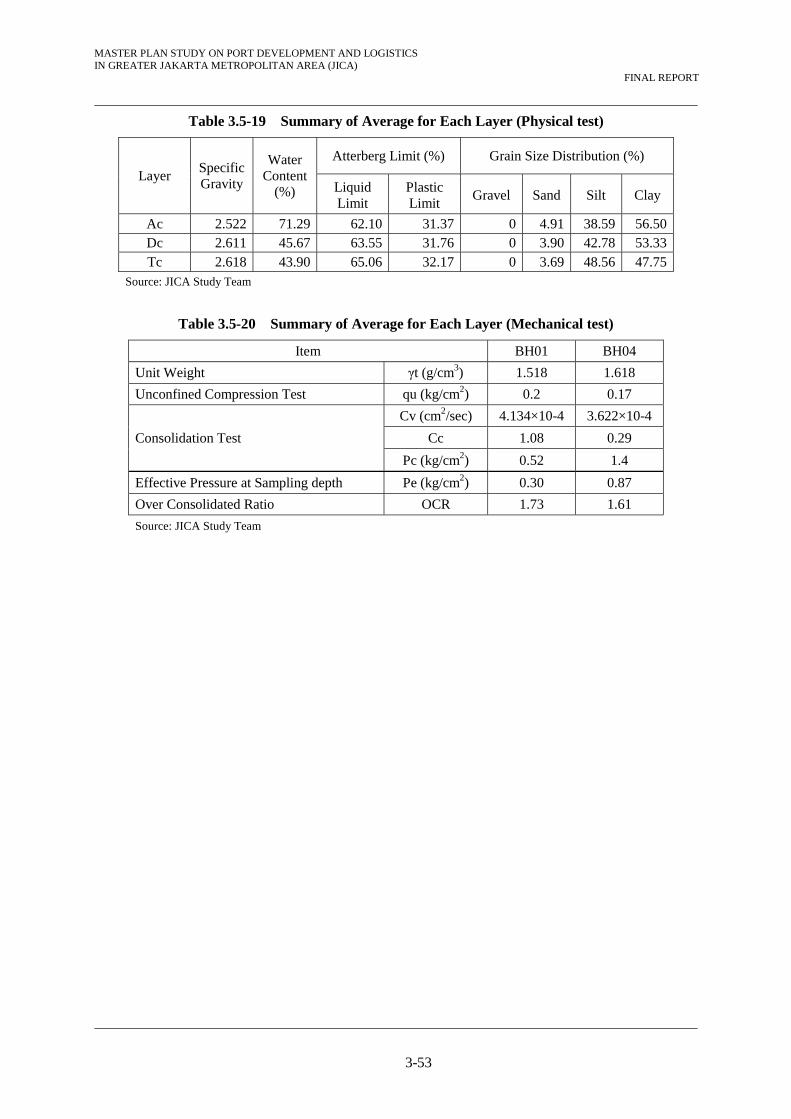
Both disturbed samples and undisturbed samples of thin-wall sampling were subjected to physical testing in laboratory to obtain information on the physical characteristics of the soils. The results of physical tests are shown in Table 3.5-19 and Table 3.5-20.
Average of water content of Ac layer is beyond Liquid Limit (L.L) while the one of Dc and Tc tend to be in the middle between L.L. and Plastic Limit (P.L.). All the layers are mostly composed of Silt and Clay.
The strengths of unconfined compression test (qu) are 0.17 to 0.2 kg/cm2. OCR calculated from Pre-consolidation stress (Pc) and Effective Pressure at a sampling depth (Pe) vary from 1.61 to 1.73.
MASTER PLAN STUDY ON PORT DEVELOPMENT AND LOGISTICS IN GREATER JAKARTA METROPOLITAN AREA (JICA)
FINAL REPORT
3-53
Table 3.5-19 Summary of Average for Each Layer (Physical test)
Layer Specific Gravity
Water Content
(%)
Atterberg Limit (%) Grain Size Distribution (%)
Liquid Limit
Plastic Limit
Gravel Sand Silt Clay
Ac 2.522 71.29 62.10 31.37 0 4.91 38.59 56.50Dc 2.611 45.67 63.55 31.76 0 3.90 42.78 53.33Tc 2.618 43.90 65.06 32.17 0 3.69 48.56 47.75
Source: JICA Study Team
Table 3.5-20 Summary of Average for Each Layer (Mechanical test)
Item BH01 BH04
Unit Weight γt (g/cm3) 1.518 1.618
Unconfined Compression Test qu (kg/cm2) 0.2 0.17
Consolidation Test
Cv (cm2/sec) 4.134×10⁻⁴ 3.622×10⁻⁴
Cc 1.08 0.29
Pc (kg/cm2) 0.52 1.4
Effective Pressure at Sampling depth Pe (kg/cm2) 0.30 0.87
Over Consolidated Ratio OCR 1.73 1.61
Source: JICA Study Team
MASTER PLAN STUDY ON PORT DEVELOPMENT AND LOGISTICS IN GREATER JAKARTA METROPOLITAN AREA (JICA)
FINAL REPORT
3-54
3) Subsoil Profile
Figure 3.5-16 Subsoil Profile in Ciasem
A
’ A
MSL(
m)
MSL(
m)
Cias
emBH
2E1
07°
40’3
2”
S6°
12’16
”
Cias
emBH
1E1
07°
40’3
2”
S6°
14’57
” A’
A
Source: JICA Study
MASTER PLAN STUDY ON PORT DEVELOPMENT AND LOGISTICS IN GREATER JAKARTA METROPOLITAN AREA (JICA)
FINAL REPORT
3-55
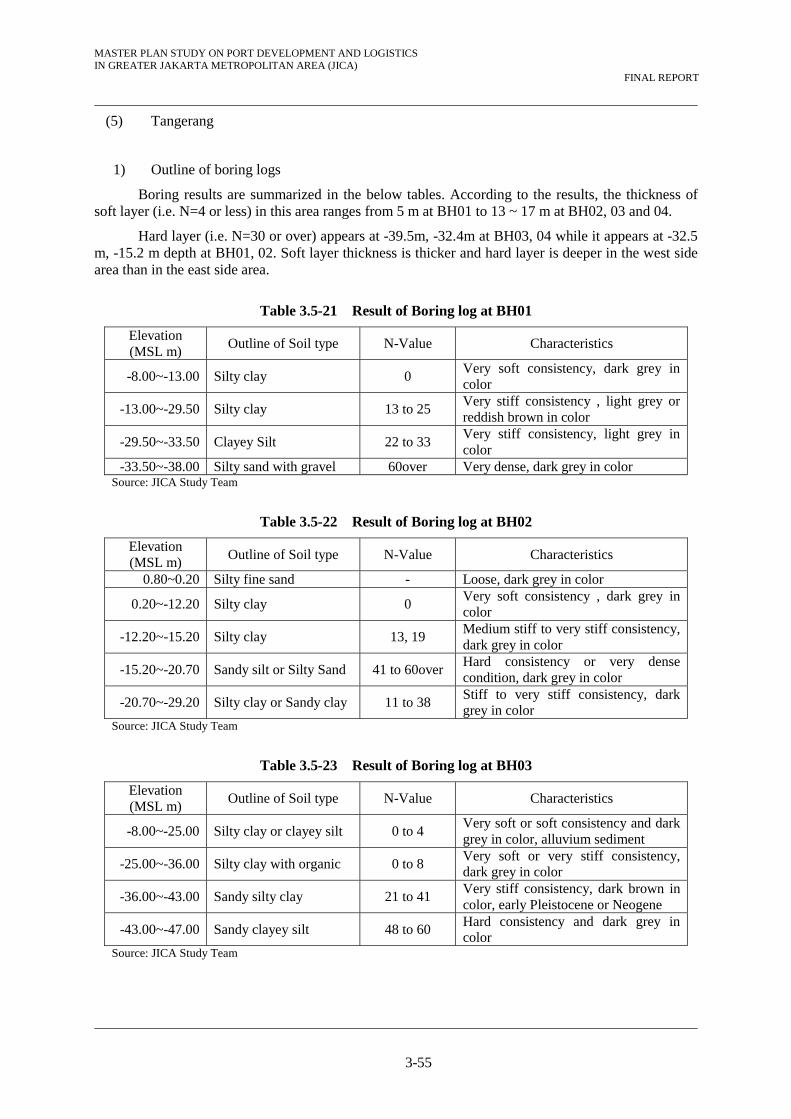
(5) Tangerang
1) Outline of boring logs
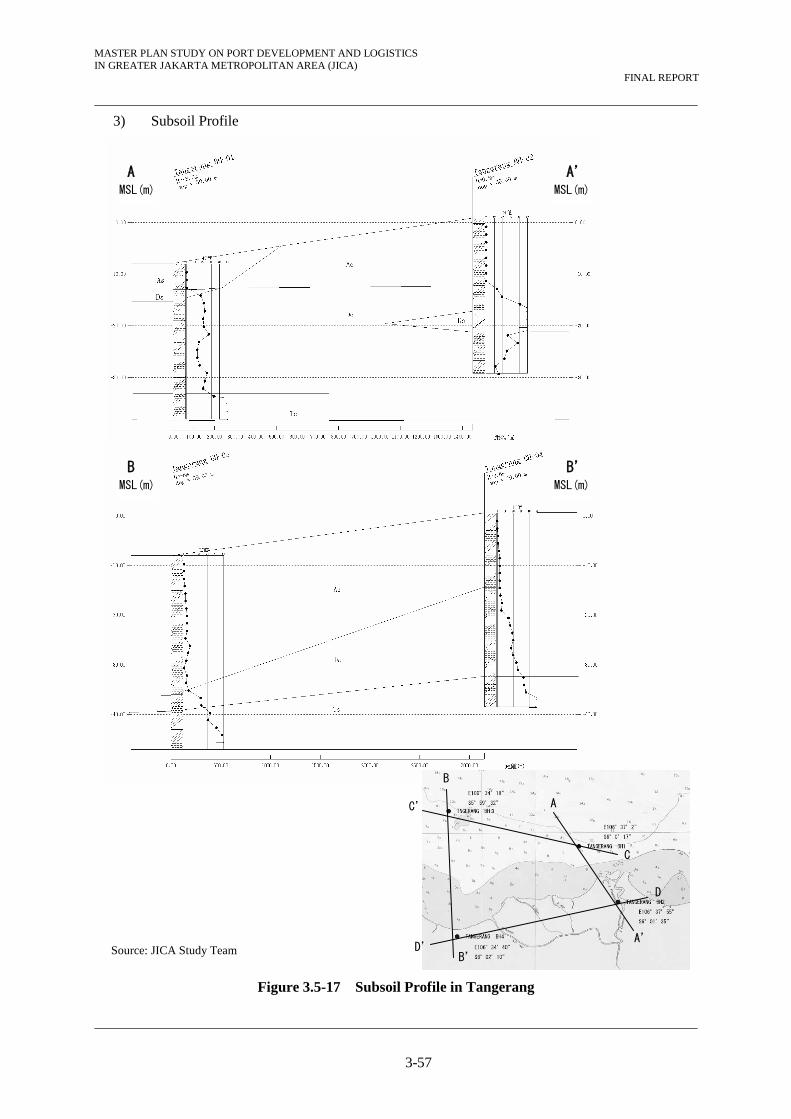
Boring results are summarized in the below tables. According to the results, the thickness of soft layer (i.e. N=4 or less) in this area ranges from 5 m at BH01 to 13 ~ 17 m at BH02, 03 and 04.
Hard layer (i.e. N=30 or over) appears at -39.5m, -32.4m at BH03, 04 while it appears at -32.5 m, -15.2 m depth at BH01, 02. Soft layer thickness is thicker and hard layer is deeper in the west side area than in the east side area.
Table 3.5-21 Result of Boring log at BH01
Elevation (MSL m)
Outline of Soil type N-Value Characteristics
-8.00~-13.00 Silty clay 0 Very soft consistency, dark grey in color
-13.00~-29.50 Silty clay 13 to 25 Very stiff consistency , light grey or reddish brown in color
-29.50~-33.50 Clayey Silt 22 to 33 Very stiff consistency, light grey in color
-33.50~-38.00 Silty sand with gravel 60over Very dense, dark grey in color Source: JICA Study Team
Table 3.5-22 Result of Boring log at BH02
Elevation (MSL m)
Outline of Soil type N-Value Characteristics
0.80~0.20 Silty fine sand - Loose, dark grey in color
0.20~-12.20 Silty clay 0 Very soft consistency , dark grey in color
-12.20~-15.20 Silty clay 13, 19 Medium stiff to very stiff consistency, dark grey in color
-15.20~-20.70 Sandy silt or Silty Sand 41 to 60over Hard consistency or very dense condition, dark grey in color
-20.70~-29.20 Silty clay or Sandy clay 11 to 38 Stiff to very stiff consistency, dark grey in color
Source: JICA Study Team
Table 3.5-23 Result of Boring log at BH03
Elevation (MSL m)
Outline of Soil type N-Value Characteristics
-8.00~-25.00 Silty clay or clayey silt 0 to 4 Very soft or soft consistency and dark grey in color, alluvium sediment
-25.00~-36.00 Silty clay with organic 0 to 8 Very soft or very stiff consistency, dark grey in color
-36.00~-43.00 Sandy silty clay 21 to 41 Very stiff consistency, dark brown in color, early Pleistocene or Neogene
-43.00~-47.00 Sandy clayey silt 48 to 60 Hard consistency and dark grey in color
Source: JICA Study Team
MASTER PLAN STUDY ON PORT DEVELOPMENT AND LOGISTICS IN GREATER JAKARTA METROPOLITAN AREA (JICA)
FINAL REPORT
3-56
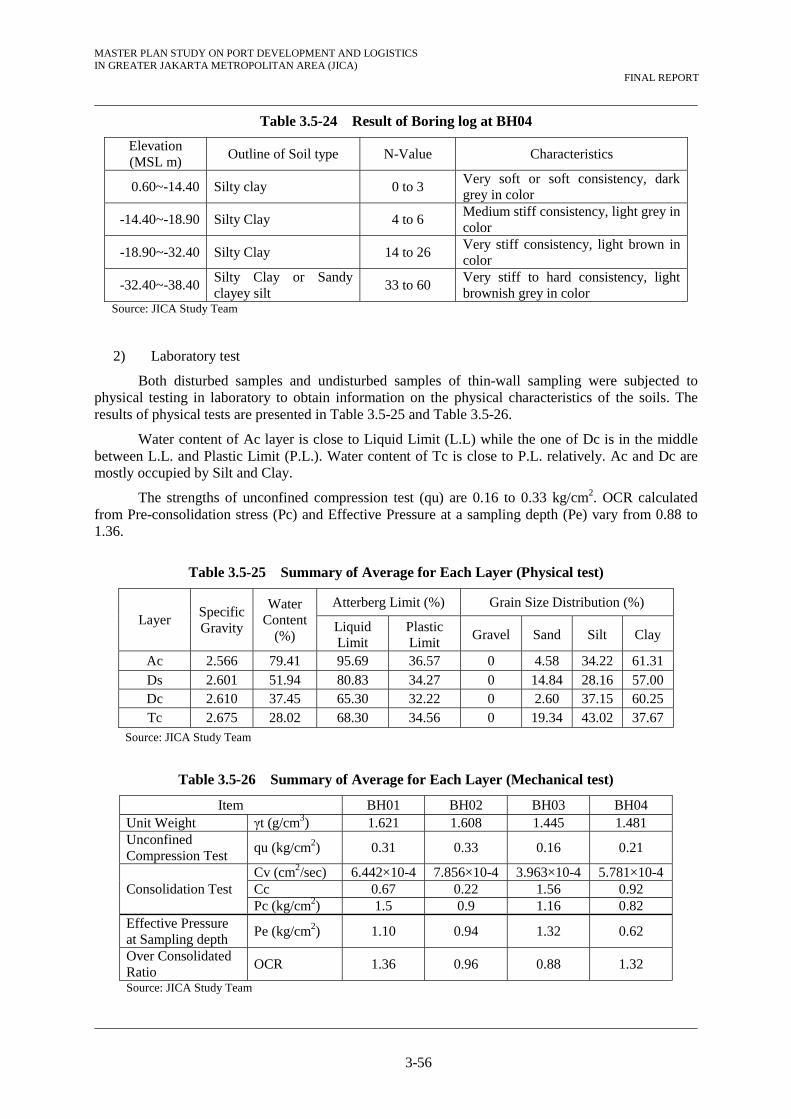
Table 3.5-24 Result of Boring log at BH04
Elevation (MSL m)
Outline of Soil type N-Value Characteristics
0.60~-14.40 Silty clay 0 to 3 Very soft or soft consistency, dark grey in color
-14.40~-18.90 Silty Clay 4 to 6 Medium stiff consistency, light grey in color
-18.90~-32.40 Silty Clay 14 to 26 Very stiff consistency, light brown in color
-32.40~-38.40 Silty Clay or Sandy clayey silt
33 to 60 Very stiff to hard consistency, light brownish grey in color
Source: JICA Study Team
2) Laboratory test
Both disturbed samples and undisturbed samples of thin-wall sampling were subjected to physical testing in laboratory to obtain information on the physical characteristics of the soils. The results of physical tests are presented in Table 3.5-25 and Table 3.5-26.
Water content of Ac layer is close to Liquid Limit (L.L) while the one of Dc is in the middle between L.L. and Plastic Limit (P.L.). Water content of Tc is close to P.L. relatively. Ac and Dc are mostly occupied by Silt and Clay.
The strengths of unconfined compression test (qu) are 0.16 to 0.33 kg/cm2. OCR calculated from Pre-consolidation stress (Pc) and Effective Pressure at a sampling depth (Pe) vary from 0.88 to 1.36.
Table 3.5-25 Summary of Average for Each Layer (Physical test)
Layer Specific Gravity
Water Content
(%)
Atterberg Limit (%) Grain Size Distribution (%)
Liquid Limit
Plastic Limit
Gravel Sand Silt Clay
Ac 2.566 79.41 95.69 36.57 0 4.58 34.22 61.31Ds 2.601 51.94 80.83 34.27 0 14.84 28.16 57.00Dc 2.610 37.45 65.30 32.22 0 2.60 37.15 60.25Tc 2.675 28.02 68.30 34.56 0 19.34 43.02 37.67
Source: JICA Study Team
Table 3.5-26 Summary of Average for Each Layer (Mechanical test)
Item BH01 BH02 BH03 BH04 Unit Weight γt (g/cm3) 1.621 1.608 1.445 1.481 Unconfined Compression Test
qu (kg/cm2) 0.31 0.33 0.16 0.21
Consolidation Test Cv (cm2/sec) 6.442×10⁻⁴ 7.856×10⁻⁴ 3.963×10⁻⁴ 5.781×10⁻⁴Cc 0.67 0.22 1.56 0.92 Pc (kg/cm2) 1.5 0.9 1.16 0.82
Effective Pressure at Sampling depth
Pe (kg/cm2) 1.10 0.94 1.32 0.62
Over Consolidated Ratio
OCR 1.36 0.96 0.88 1.32
Source: JICA Study Team
MASTER PLAN STUDY ON PORT DEVELOPMENT AND LOGISTICS IN GREATER JAKARTA METROPOLITAN AREA (JICA)
FINAL REPORT
3-57
3) Subsoil Profile
Figure 3.5-17 Subsoil Profile in Tangerang
A A’ MSL(m) MSL(m)
B B’ MSL(m) MSL(m)
B
C’ A
C
D
A’
B’ D’ Source: JICA Study Team
MASTER PLAN STUDY ON PORT DEVELOPMENT AND LOGISTICS IN GREATER JAKARTA METROPOLITAN AREA (JICA)
FINAL REPORT
3-58
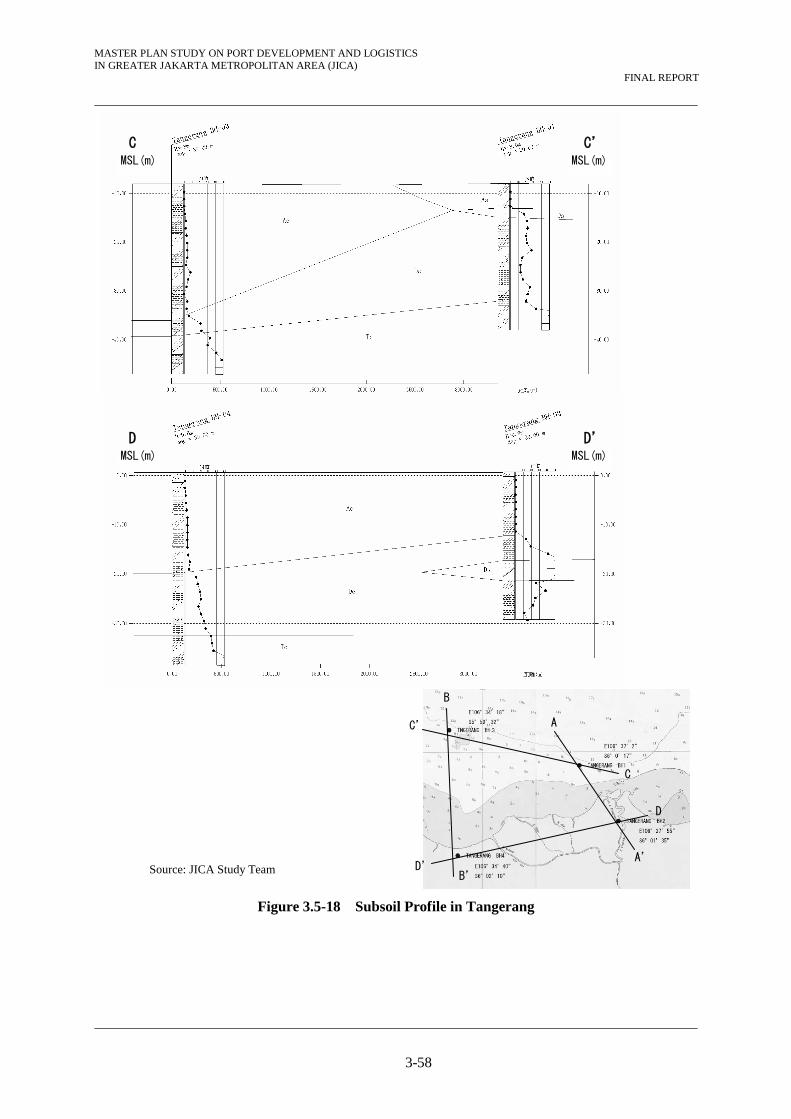
Figure 3.5-18 Subsoil Profile in Tangerang
C C’ MSL(m) MSL(m)
D D’ MSL(m) MSL(m)
B
C’ A
C
D
A’
B’ D’ Source: JICA Study Team

MASTER PLAN STUDY ON PORT DEVELOPMENT AND LOGISTICS IN GREATER JAKARTA METROPOLITAN AREA (JICA)
FINAL REPORT
3-59
3.5.3 North Kalibaru
(1) Subsoil conditions survey
In response to the request for a further examination of subsoil at North Kalibaru, an additional subsoil investigation was planned to get the actual soil condition at offshore Tanjung Priok Port. The additional borehole locations were decided by considering the planned port area. BH01 was within the proposed navigation dredging area. BH02 was on the periphery of the proposed reclamation area. BH03 was in the proposed reclamation area and located on the same longitude of BH01 and closer to the landside.
Site works were executed during the northwest monsoon season, and high waves and rainfall disturbed the works frequently, especially in the afternoon. Attention also had to be paid to securing site safety.
Each boring location was decided by the portable GPS induction. After the confirmation of locations, bamboo platform was assembled and boring machine was installed properly on it. Offshore boring was conducted at MSL-5.1 m (BH01), -7.1 m (BH02) and -9.2 m (BH03).
The summary of soil investigation is shown in Table 3.5-27. The coordinates and the elevation of boreholes are shown in Table 3.5-28.
Laboratory tests were carried out based on the standards shown in Table 3.5-29.
Table 3.5-27 Summary of Soil Investigation
Area Bore
hole No. Onshore /Offshore
Drilling Length
SPTUndisturbed
Sampling
Laboratory Test Physical
Test Mechanical
Test
North Kalibaru
BH01 Off Shore 30 m 20 1 11 1
BH02 Off Shore 30 m 20 1 11 1
BH03 Off Shore 30 m 20 1 11 1 TOTAL 90 m 60 3 33 3 Source: JICA Study Team
Table 3.5-28 Location and Elevation of Boreholes
Area Borehole No. Coordinate
Elevation Latitude Longitude
North Kalibaru
BH01 S 06o 04’ 25.0” E 106o 54’ 00.0” -9.2m
BH02 S 06o 04’ 51.3” E 106o 54’ 46.2” -7.1m
BH03 S 06o 05’ 17.7” E 106o 53’ 59.4” -5.1m
Source: JICA Study Team

MASTER PLAN STUDY ON PORT DEVELOPMENT AND LOGISTICS IN GREATER JAKARTA METROPOLITAN AREA (JICA)
FINAL REPORT
3-60
Table 3.5-29 Standards for Laboratory Tests
Physical tests Mechanical Tests Items Standard Items Standard
Grain Size ASTM D422-63 Unit Weight ASTM D7263
Specific Gravity ASTM D854-10 Unconfined Compression Test
ASTM D2166
Water Content ASTM D2216 Consolidation Test ASTM D2435 Atterberg Limit Test (Liquid Limit/Plastic Limit)
ASTM D4318
Source: JICA Study Team
Outline of Soil Conditions
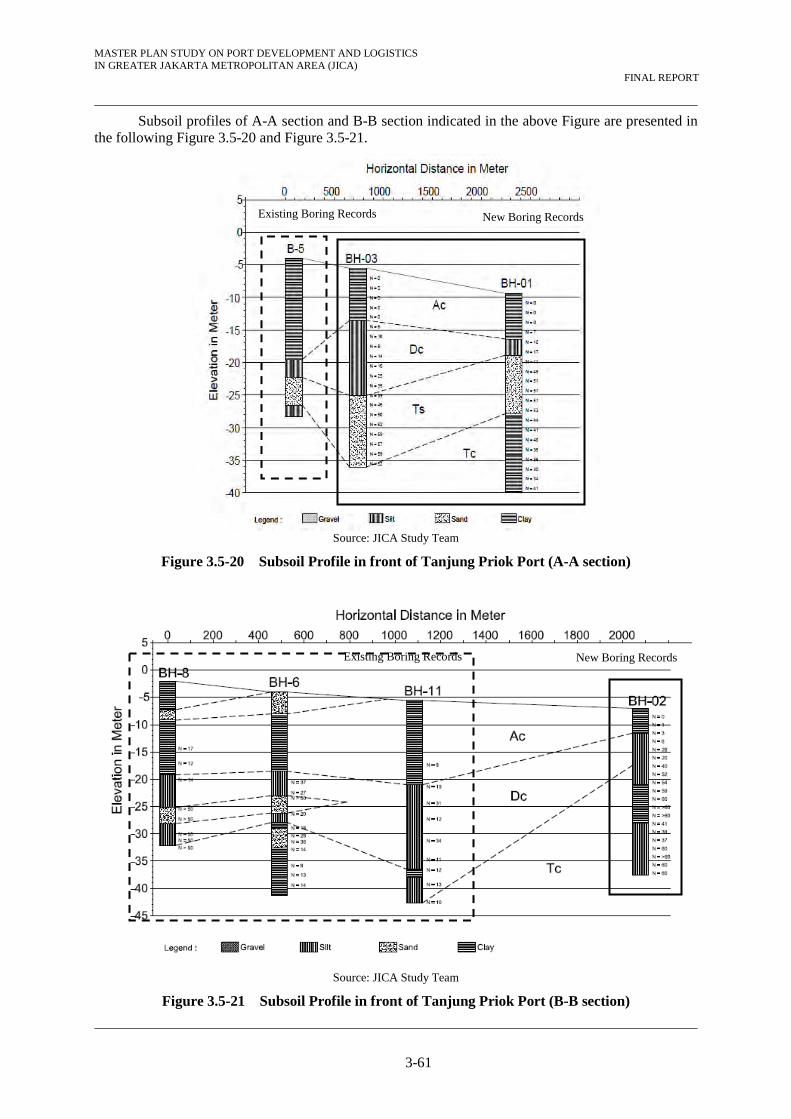
JICA Study Team (2002) carried out a soil investigation in Tanjung Priok Port with exploratory borings and laboratory tests at 3 points. Many of other soil investigations and laboratory tests were also executed by PELINDO II, and JICA Study Team acquired those data in 2002 (location of the investigations are shown in Figure 3.5-19).
The seabed soils (from the seabed to approximately -35m) in front of Tanjung Priok Port from existing bore holes (B-1, 2, 3, 4, 5, 6 and 11) and in the west area of the port from JICA Study in 2002 (OSB-1, 2 and 3) are classified into mainly three layers as follows;
- The first layer is a soft layer, its thickness is approximately 5m to 13m, and its N-value is approximately 0.
- The second layer is a deposit consisting of volcanic ash in the elevation range of approximately -10m to -25m, with N-value of approximately 6.
- The third layer is a deposit consisting of volcanic ash, sand and silts in the elevation range of approximately -20m to -25m below, with a N-value of approximately 50 or more than 50.
In this study, the records from the newly executed three (3) boring tests and the some of the above-mentioned previous records are examined comprehensively.
Source: JICA Study Team
Figure 3.5-19 Borehole locations in Tanjung Priok Port and North Kalibaru
AA
BB
BH 01
BH 03
B-5
BH 02
BH 11
BH 6
BH 8
LAUT JAWA
Legend
New offshore boring point
Existing offshore boring point
LAUT JAWA
LAUT JAWA
06° 04' 25'' 106° 54' 0''Elev. -9.2
06° 05' 17,7'' 106° 53' 59,4''Elev. -5.1
06° 04' 51,3'' 106° 54' 46,2''Elev. -7.1
B-1 B-2
B-3 B-4
OSB 1
OSB 2
OSB 3
MASTER PLAN STUDY ON PORT DEVELOPMENT AND LOGISTICS IN GREATER JAKARTA METROPOLITAN AREA (JICA)
FINAL REPORT
3-61
Subsoil profiles of A-A section and B-B section indicated in the above Figure are presented in the following Figure 3.5-20 and Figure 3.5-21.
Source: JICA Study Team
Figure 3.5-20 Subsoil Profile in front of Tanjung Priok Port (A-A section)
Source: JICA Study Team
Figure 3.5-21 Subsoil Profile in front of Tanjung Priok Port (B-B section)
Existing Boring Records New Boring Records
New Boring RecordsExisting Boring Records

MASTER PLAN STUDY ON PORT DEVELOPMENT AND LOGISTICS IN GREATER JAKARTA METROPOLITAN AREA (JICA)
FINAL REPORT
3-62
(2) Investigation Results
1) Outline of boring logs
Three (3) offshore borings were carried out in North Kalibaru in this study. The boring results are summarized in the below tables. According to the results, the thickness of soft layer (i.e. N=4 or less) in this area varies in the range 6m to 9m.
Hard layer (i.e. N=30 or over) appears at 10m depth at BH01, at 10m at BH02, and at 18m at BH03.
Table 3.5-30 The Result of Boring log at BH01
Elevation (MSL m)
Outline of Soil type N-Value Characteristics
-9.2 ~ -16.2 Silty clay or Clayed silt 0 - 10 Very soft consistency, dark grey in colour
-16.2 ~ -18.7 Sandy Silt 10 to 17 Medium to stiff consistency , light brown in colour
-18.7 ~ -27.7 Sand 17 to 53 very dense consistency, black in colour -27.7 ~ -33.7 Silty Clay or Clayed silt 53 to 35 Very stiff consistency, black in colour -33.7 ~ -39.7 Silty Clay or Clayed silt 35 to 41 Very stiff consistency, dark grey in colour Source: JICA Study Team
Table 3.5-31 The Result of Boring log at BH02
Elevation (MSL m)
Outline of Soil type N-Value Characteristics
-7.1 ~ -11.6 Silty clay or Clayed silt 0 - 1 Very soft consistency, dark grey in colour
-11.6 ~ -21.1 Sandy Silt 1 to 54 Medium to very stiff consistency , light and dark brown in colour
-21.1 ~ -28.1 Silty clay 54 to 60 Very stiff consistency, dark grey in colour -28.1 ~ -33.1 Sandy silt 41 to 60 Stiff consistency, dark grey in colour -33.1 ~ -37.6 Sandy silt > 60 Very stiff consistency, dark grey in colour Source: JICA Study Team
Table 3.5-32 The Result of Boring log at BH03
Elevation (MSL m)
Outline of Soil type N-Value Characteristics
-5.1 ~ -13.1 Silty clay or Clayed silt 0 Very soft consistency, dark grey in colour
-13.1 ~ -24.6 Sandy silt 6 to 38 Medium to very stiff consistency, light and dark brown in colour
-24.6 ~ -30.1 Silty clay 38 to 52 very stiff consistency, dark grey in colour
-30.1 ~ -35.6 Medium sand 52 to 59 Very dense consistency, black in colour Source: JICA Study Team
2) Laboratory test
Both disturbed and undisturbed samples extracted from thin-wall sampling were subjected to physical and mechanical testing in laboratory to obtain information on the characteristics of the soils. The results of physical and mechanical tests are shown in Table 3.5-33, Table 3.5-34, Table 3.5-35 and Table 3.5-36.
MASTER PLAN STUDY ON PORT DEVELOPMENT AND LOGISTICS IN GREATER JAKARTA METROPOLITAN AREA (JICA)
FINAL REPORT
3-63
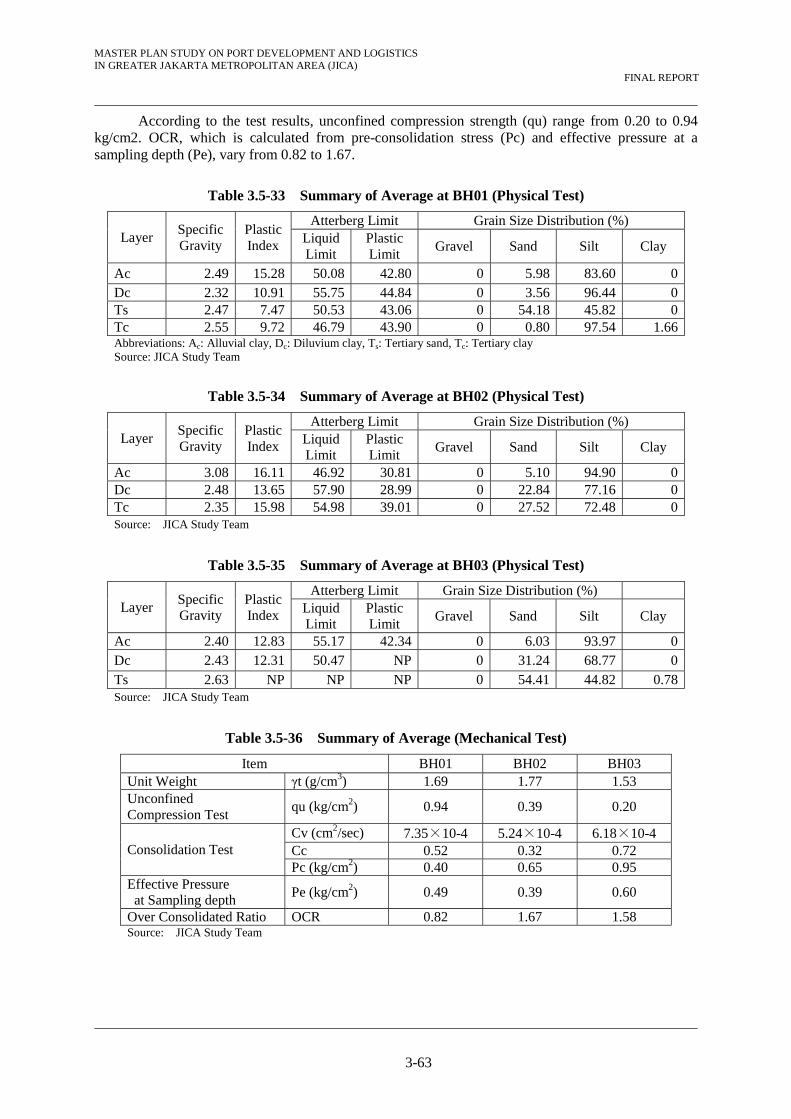
According to the test results, unconfined compression strength (qu) range from 0.20 to 0.94 kg/cm2. OCR, which is calculated from pre-consolidation stress (Pc) and effective pressure at a sampling depth (Pe), vary from 0.82 to 1.67.
Table 3.5-33 Summary of Average at BH01 (Physical Test)
Layer Specific Gravity
Plastic Index
Atterberg Limit Grain Size Distribution (%) Liquid Limit
Plastic Limit
Gravel Sand Silt Clay
Ac 2.49 15.28 50.08 42.80 0 5.98 83.60 0Dc 2.32 10.91 55.75 44.84 0 3.56 96.44 0Ts 2.47 7.47 50.53 43.06 0 54.18 45.82 0Tc 2.55 9.72 46.79 43.90 0 0.80 97.54 1.66Abbreviations: Ac: Alluvial clay, Dc: Diluvium clay, Ts: Tertiary sand, Tc: Tertiary clay Source: JICA Study Team
Table 3.5-34 Summary of Average at BH02 (Physical Test)
Layer Specific Gravity
Plastic Index
Atterberg Limit Grain Size Distribution (%) Liquid Limit
Plastic Limit
Gravel Sand Silt Clay
Ac 3.08 16.11 46.92 30.81 0 5.10 94.90 0Dc 2.48 13.65 57.90 28.99 0 22.84 77.16 0Tc 2.35 15.98 54.98 39.01 0 27.52 72.48 0Source: JICA Study Team
Table 3.5-35 Summary of Average at BH03 (Physical Test)
Layer Specific Gravity
Plastic Index
Atterberg Limit Grain Size Distribution (%) Liquid Limit
Plastic Limit
Gravel Sand Silt Clay
Ac 2.40 12.83 55.17 42.34 0 6.03 93.97 0Dc 2.43 12.31 50.47 NP 0 31.24 68.77 0Ts 2.63 NP NP NP 0 54.41 44.82 0.78Source: JICA Study Team
Table 3.5-36 Summary of Average (Mechanical Test)
Item BH01 BH02 BH03 Unit Weight γt (g/cm3) 1.69 1.77 1.53 Unconfined Compression Test
qu (kg/cm2) 0.94 0.39 0.20
Consolidation Test Cv (cm2/sec) 7.35×10⁻⁴ 5.24×10⁻⁴ 6.18×10⁻⁴ Cc 0.52 0.32 0.72 Pc (kg/cm2) 0.40 0.65 0.95
Effective Pressure at Sampling depth
Pe (kg/cm2) 0.49 0.39 0.60
Over Consolidated Ratio OCR 0.82 1.67 1.58 Source: JICA Study Team

MASTER PLAN STUDY ON PORT DEVELOPMENT AND LOGISTICS IN GREATER JAKARTA METROPOLITAN AREA (JICA)
FINAL REPORT
3-64
3.5.4 Summary of Subsoil Condition
(1) Soft Layer Thickness
The thicknesses of soft layer at each site are shown in Figure 3.5-22.
Main soft layers consist of silty clay or clayey silt at Marunda/Bekasi, Cilamaya, Ciasem and Tangerang while mainly silty clay or sandy silt in North Kalibaru. While the soft layer’s thickness at Cilamaya is 6m on average, the ones at Tangerang and Marunda are 15m to 16m on average. BH04 in Cilamaya, the soft layer is less than 50cm thickness. The soft layer is also less than 5m in Ciasem. In North Kalibaru, the average thickness of soft layer is 7m.
0
5
10
15
20
25
BH
01
BH
02
BH
03
BH
04
BH
05
BH
01
BH
02
BH
03
BH
04
BH
01
BH
02
BH
01
BH
02
BH
03
BH
04
BH
01
BH
02
BH
03
Marunda-Bekasi Cilamaya Ciasem Tangerang North Kalibaru
Site name, BH No.
Thi
ckn
ess
(m)
Thickness of soft layer(N=0 to 4)
Thickness of soft layer(N=0)
Source: JICA Study Team
Figure 3.5-22 Soft Layer Thickness at Candidate Terminal Sites
(2) Elevation of Hard Layer Encountered at Each Site
In the case of the three (3) additional boring tests in North Kalibaru, it can be said that the appearance of hard layer (SPT-N=30 and/ or over) is from around -20m and it consists of clay or silt and fine sand. The hard layer (N>50) appears 2.0 to 5.0m deeper than hard layer (N=30 or over).
Figure 3.5-23 shows the encountering elevations of hard layer (SPT-N=30 and over N>50) of not only the additional three (3) additional boring results in North Kalibaru but also past survey results in Marunda-Bekasi, Cilamaya, Chiasem and Tangerang executed in July 2010. Comparing the additional results in North Kalibaru to others, the appearance of hard layer in North Kalibaru is shallower than other four (4) sites.
The layer (N=30 and/ or over) can be considered as a bearing layer for shallow footing. It is also possible to be considered as a bearing layer by applying friction piling due to the required load. The layer (N>50) is recommended as a bearing layer for piling foundation of structure requiring heavy load.

MASTER PLAN STUDY ON PORT DEVELOPMENT AND LOGISTICS IN GREATER JAKARTA METROPOLITAN AREA (JICA)
FINAL REPORT
3-65
-60
-50
-40
-30
-20
-10
0
BH
01
BH
02
BH
03
BH
04
BH
05
BH
01
BH
02
BH
03
BH
04
BH
01
BH
02
BH
01
BH
02
BH
03
BH
04
BH
01
BH
02
BH
03
Marunda-Bekasi Cilamaya Ciasem Tangerang North Kalibaru
Site name, BH No.
MS
L (m
)
MSL of hard layer(N≧30)
MSL of hard layer(N>50)
Source: JICA Study Team
Figure 3.5-23 Elevation of Hard Layer encountered at each site
(3) Subsoil Condition at Tangerang
In Tangerang, soft layer of the west region (BH03 &04) is thicker than that of the east region (BH01 &02). In Marunda, the range of thickness of soft layer is varied and relatively thinner than the other sites. In North Kalibaru, the thickness at BH03, which is located closer to the landside, is thicker than other two (2) results from BH01 and BH02.
The consolidation test results show that the soft layer in all of the sites seems to be normally-consolidated (OCR≒1) or slightly over-consolidated clay (OCR<2) except some samples, which are assumed to be disturbed before the test. Therefore, final settlement by reclamation work can be small if the effective overburden stress including reclamation work does not exceed Pc.
(4) Subsoil Condition at Cilamaya
In Cilamaya offshore, “Soil Replacement” of the soft layer is applicable because the layer is less than 5 m thick. However, Soil Replacement method, which is to replace superficial soft material with fine sand, does not seem to be applicable in other sites. The main reason to disallow this method is that the existing soft layer is too thick, more than 5m in thickness, to remove. In addition, considering the assumed huge dredging volume and the scale of work that would be required, it is not a viable method from financial and work-period management aspects.
On the other hand, “Preloading” seems to be effective in Cilamaya onshore, Marunda-Bekasi, Tangerang and North Kalibaru. In particular, the surface layer of Tangerang is so soft, SPT-N=0, that it will take more time to be consolidated than the other sites. Therefore, “Vertical drain” with “Preloading” should be considered to enhance the consolidation process and to reduce the consolidation time up to certain degree of consolidation, ex 90%.
(5) Subsoil Condition at North Kalibaru
In the case of three (3) additional boring tests in North Kalibaru, it can be said that soft layer consists of mainly silty clay or sandy silt. According to the survey results, the soft layer at BH03, which is located closer to the landside, is thicker than other two (2) results from BH01 and BH02.
Figure 3.5-22 shows the thickness of soft layers of not only the additional three (3) boring results in North Kalibaru but also past survey results in Marunda-Bekasi, Cilamaya, Chiasem and

MASTER PLAN STUDY ON PORT DEVELOPMENT AND LOGISTICS IN GREATER JAKARTA METROPOLITAN AREA (JICA)
FINAL REPORT
3-66
Tangerang executed in July 2010. Comparing the additional results in North Kalibaru to others, the thickness of soft layer in North Kalibaru is thinner than the sites at Marunda-Bekashi and Tangerang.
The consolidation test results show that the soft layer at BH01, 02 and 03 seem to be normally-consolidated (OCR≒1) or slightly over-consolidated clay (OCR< 2) similar to previous results at Marunda-Bekasi, Cilamaya, Ciasem and Tangerang. Therefore, it can be assumed that final settlement by reclamation work can be relatively small if the effective overburden stress including reclamation work does not exceed the value of Pc.
(6) Improvement of Existing Poor Soil Condition
As a result of comprehensive examination on reclamation work based on the test results from the additional three (3) boring tests in North Kalibaru, Soil Replacement method, which is to replace superficial soft material with fine sand, does not seem to be applicable. The main reason to disallow this method is that the existing soft layer is too thick, more than 5m in thickness, to remove. In addition, considering the assumed huge dredging volume and the scale of work that would be required, it is not a viable method from financial and work-period management aspects.
On the other hand, considering the soil characteristics, Preloading method seems to be effective. If Vertical Drain method is adopted in addition to Preloading method, it might be more effective to enhance the consolidation process, and to reduce the consolidation time up to certain degree of consolidation, ex 90%.
For the construction of breakwater and revetment, Sand Compaction Pile method or Deep Soil Mixing method should be examined to adapt to the foundation. In case of applying Sand Compaction method, a huge amount of fine sand is required. However, considering environmental aspects and the surroundings in/around the North Kalibaru area, it might be difficult to acquire such a volume sand of the necessary quality. In case of the Deep Soil Mixing method, cement as the main material seems to be easily procured and work quality can be controlled easier because residual settlement is minimal if improvement work is done by bearing layer. However, it must be noted that the cost of this method is relatively higher and that such an advanced method has never been applied before in the republic of Indonesia.
As another option, Compaction/ Jet Grouting method can be considered to increase the rate of consolidation and reduce total amount of settlement.
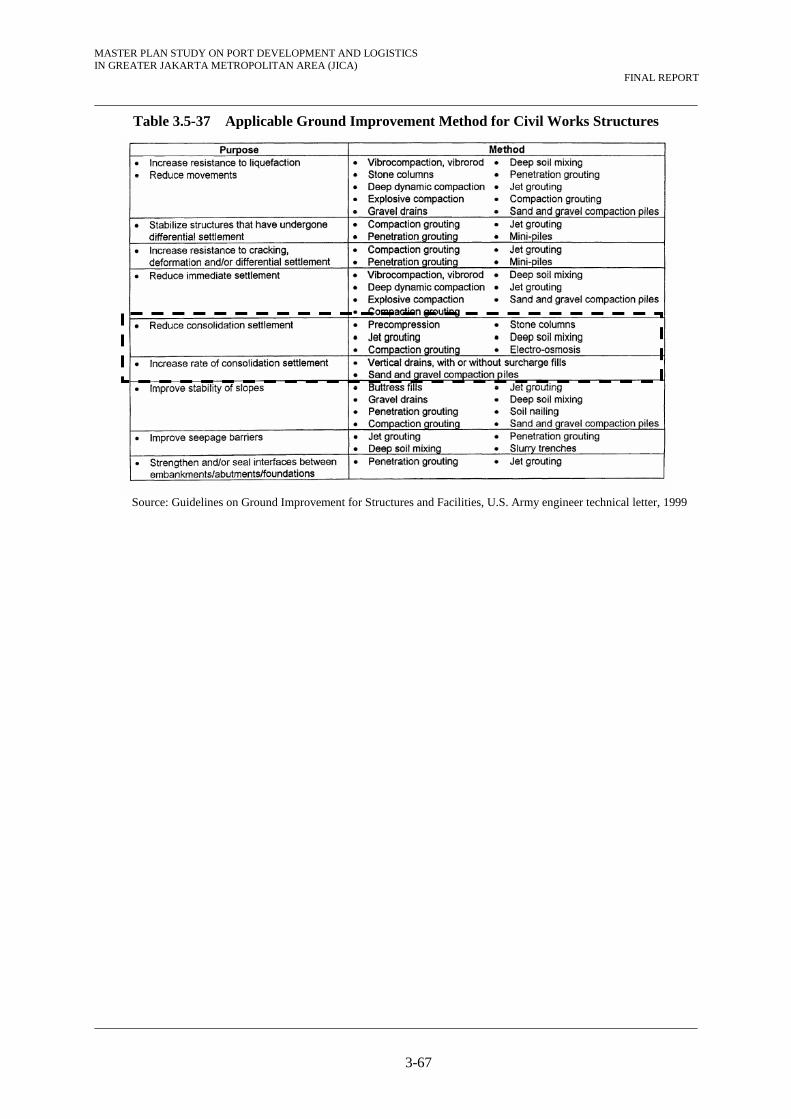
The improvement methods of the existing poor soil conditions at Cilamaya and North kalibaru area can be summarized as follows.
MASTER PLAN STUDY ON PORT DEVELOPMENT AND LOGISTICS IN GREATER JAKARTA METROPOLITAN AREA (JICA)
FINAL REPORT
3-67
Table 3.5-37 Applicable Ground Improvement Method for Civil Works Structures
Source: Guidelines on Ground Improvement for Structures and Facilities, U.S. Army engineer technical letter, 1999

MASTER PLAN STUDY ON PORT DEVELOPMENT AND LOGISTICS IN GREATER JAKARTA METROPOLITAN AREA (JICA)
FINAL REPORT

MASTER PLAN STUDY ON PORT DEVELOPMENT AND LOGISTICS IN GREATER JAKARTA METROPOLITAN AREA (JICA)
FINAL REPORT
4-1
CHAPTER 4 MASTER PLAN FOR PORT DEVELOPMENT AND LOGISTICS IN AND AROUND GREATER JAKARTA METROPOLITAN AREA
4.1 Socio-economic Framework
4.1.1 Population
In 2005, BPS, Bappenas with the support of UNFPA conducted Indonesian Population Projection 2000-2025 primarily based on the SP2000.
According to the projection, the population of Indonesia during the next twenty-five years will increase from 205.1 million in 2000 to 273.2 million in 2025. Average growth per year over the period 2000-2025 shows a tendency to decline continuously. In the decade 1990-2000, the population of Indonesia increased at the rate of 1.49 percent per year, then between the periods 2000-2005 and 2020-2025 fell to 1.34 percent and 0.92 percent per year (See Figure 4.1-1)
Population Growth and Projection
0.0
50,000.0
100,000.0
150,000.0
200,000.0
250,000.0
300,000.0
2000
2003
2006
2009
2012
2015
2018
2021
2024
year
thou
sand
Sumatera
Java
Bali and Nusa Tenggara
Kalimantan
Sulawesi
Maluku and Papua
Indonesia
Annual Growth Rate of Population
0
0.005
0.01
0.015
0.02
0.025
2000-2005
2000-2008
2000-2009
2000-2010
2000-2015
2000-2020
2000-2025
year
%
Sumatera
Java
Bali and Nusa Tenggara
Kalimantan
Sulawesi
Maluku and Papua
Indonesia
Historical Trend and Projection of Indonesia's Population Growth Rate
0.000%
0.500%
1.000%
1.500%
2001
2003
2005
2007
2009
2011
2013
2015
2017
2019
2021
2023
2025
year
Gro
wth
Rat
e(%
)
Source: Indonesia Population Projection, BPS, 2005
Figure 4.1-1 Historical Trend and Projection of Indonesia’s Population Growth Rate
4.1.2 GDP (Gross Domestic Product)
(1) Indonesia
During the Asian economic crisis, Indonesian’s GDP growth rate sharply dropped to -13.1% per annum in 1998 and only 0.79 % in 1999. Indonesian economy, however, got back on track in 2000 with the healthy growth rate of 5.35%. Since then, the national economy has showed steady growth with annual growth rates of about 5 %. In 2008 it registered 6.007% (See Table 4.1-1).

MASTER PLAN STUDY ON PORT DEVELOPMENT AND LOGISTICS IN GREATER JAKARTA METROPOLITAN AREA (JICA)
FINAL REPORT
4-2
Table 4.1-1 Growth Rates of Indonesia
Year 2000 2001 2002 2003 2004 2005 2006 2007 2008GDP Growth(annual %)
5.350 3.643 4.499 4.780 5.031 5.693 5.501 6.345 6.007
Source: International Monetary Fund, World Economic Outlook Database, April 2010
Indonesia's recent GDP growth rates are still less than the 7.2 % average GDP growth the country experienced during the period of 1990-1996, however, during the 2nd quarter of 2010, economists as well as the Indonesian Government expressed that GDP would grow steadily in the range of 6.0% to 7.0%. Furthermore, the Indonesian Government announced a growth rate of 7.7% in 2014 as the Governments Policy Target.
In the Greater Jakarta Metropolitan Ports Study in 2003, the JICA study team assumed that Indonesia’s GDP growth rate in 2003 will be nearly same as that in 2002, and that a 6 % growth rate will be realized in 2006. It is also assumed that the 6 % growth rate will be maintained afterwards through 2012, and then will slightly decline because the population growth rate has been continuously decreasing as shown earlier.
(2) Major Trade Partners
Formulating future economic frameworks of trade partners is also one of the important works of the demand forecast.
Japan, the United States, Singapore, Malaysia and China have been the major trade partners with Indonesia in recent decades. In addition to these individual countries, Asia and Europe as regional economic compounds are also important trade partners.
GDP growth rates of these countries and regions after 1990 are shown in Figure 4.1-2. Economies of East Asia and Pacific region had shown the highest growth rates of more than 8 % before the year 1997 when the region’s economic prosperity collapsed due to the financial crisis.
United States has shown steady economic growth for the last decade, with growth rates in the range of 2 – 4 %. On the contrary, Japan as well as Euro area has been in an economic slump since 1998, and annual growth rates have been around 1 or 2 % recently.
GDP Growth Rate (annual percent)
-6.000
-4.000
-2.000
0.000
2.000
4.000
6.000
8.000
2000
2002
2004
2006
2008
2010
2012
2014
year
%
World
Euro area
ASEAN-5
United States
Japan
Indonesia
Source: IMF World Economic Outlook Database April 2010
Figure 4.1-2 Growth Rate in Major Trade Partners
Future GDP growth rates of the trade partners were taken and extrapolated from the International Monetary Fund (IMF), World Economic Outlook Database April 2010 and official announcement of the Indonesian Government.
MASTER PLAN STUDY ON PORT DEVELOPMENT AND LOGISTICS IN GREATER JAKARTA METROPOLITAN AREA (JICA)
FINAL REPORT
4-3
(3) GDP Growth Rate
In the fall of 2008, global economy faced a severe challenge generated from the collapse of the housing market. Economic slump was not limited to US; the European market and Japan were affected as well. Developing economies including Indonesia were also not immune to the world financial crisis.
The 2010 – 2014 National Medium-Term Development Plan (RPJMN 2010-2014) is the second phase of the 2005-2025 National Long-Term Development Plan promulgated through Law 17/2007. The RPJMN 2010-2014 contains the national development strategy, general policies, programs of ministries/agencies and cross-ministries/agencies, regional and cross-regional programs, as well as the macroeconomic framework.
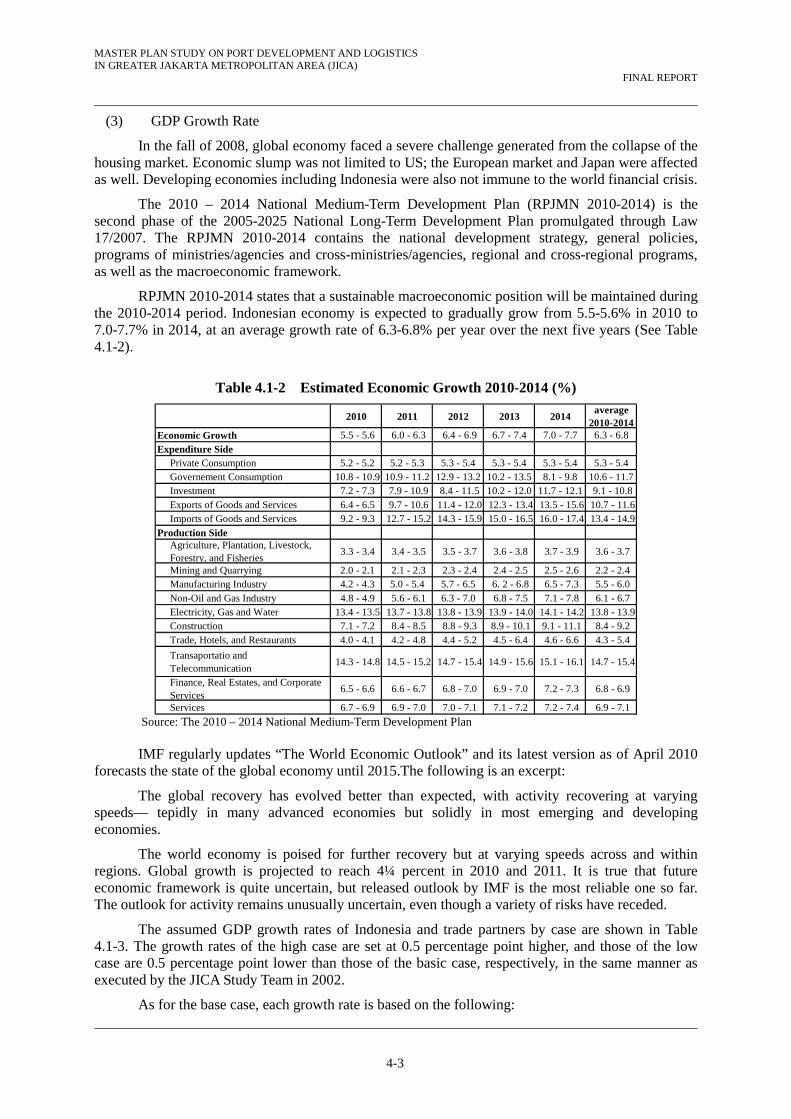
RPJMN 2010-2014 states that a sustainable macroeconomic position will be maintained during the 2010-2014 period. Indonesian economy is expected to gradually grow from 5.5-5.6% in 2010 to 7.0-7.7% in 2014, at an average growth rate of 6.3-6.8% per year over the next five years (See Table 4.1-2).
Table 4.1-2 Estimated Economic Growth 2010-2014 (%)
2010 2011 2012 2013 2014average
2010-2014Economic Growth 5.5 - 5.6 6.0 - 6.3 6.4 - 6.9 6.7 - 7.4 7.0 - 7.7 6.3 - 6.8
Expenditure SidePrivate Consumption 5.2 - 5.2 5.2 - 5.3 5.3 - 5.4 5.3 - 5.4 5.3 - 5.4 5.3 - 5.4Governement Consumption 10.8 - 10.9 10.9 - 11.2 12.9 - 13.2 10.2 - 13.5 8.1 - 9.8 10.6 - 11.7Investment 7.2 - 7.3 7.9 - 10.9 8.4 - 11.5 10.2 - 12.0 11.7 - 12.1 9.1 - 10.8Exports of Goods and Services 6.4 - 6.5 9.7 - 10.6 11.4 - 12.0 12.3 - 13.4 13.5 - 15.6 10.7 - 11.6Imports of Goods and Services 9.2 - 9.3 12.7 - 15.2 14.3 - 15.9 15.0 - 16.5 16.0 - 17.4 13.4 - 14.9
Production SideAgriculture, Plantation, Livestock,Forestry, and Fisheries
3.3 - 3.4 3.4 - 3.5 3.5 - 3.7 3.6 - 3.8 3.7 - 3.9 3.6 - 3.7
Mining and Quarrying 2.0 - 2.1 2.1 - 2.3 2.3 - 2.4 2.4 - 2.5 2.5 - 2.6 2.2 - 2.4Manufacturing Industry 4.2 - 4.3 5.0 - 5.4 5.7 - 6.5 6. 2 - 6.8 6.5 - 7.3 5.5 - 6.0Non-Oil and Gas Industry 4.8 - 4.9 5.6 - 6.1 6.3 - 7.0 6.8 - 7.5 7.1 - 7.8 6.1 - 6.7Electricity, Gas and Water 13.4 - 13.5 13.7 - 13.8 13.8 - 13.9 13.9 - 14.0 14.1 - 14.2 13.8 - 13.9Construction 7.1 - 7.2 8.4 - 8.5 8.8 - 9.3 8.9 - 10.1 9.1 - 11.1 8.4 - 9.2Trade, Hotels, and Restaurants 4.0 - 4.1 4.2 - 4.8 4.4 - 5.2 4.5 - 6.4 4.6 - 6.6 4.3 - 5.4
Transaportatio andTelecommunication
14.3 - 14.8 14.5 - 15.2 14.7 - 15.4 14.9 - 15.6 15.1 - 16.1 14.7 - 15.4
Finance, Real Estates, and CorporateServices
6.5 - 6.6 6.6 - 6.7 6.8 - 7.0 6.9 - 7.0 7.2 - 7.3 6.8 - 6.9
Services 6.7 - 6.9 6.9 - 7.0 7.0 - 7.1 7.1 - 7.2 7.2 - 7.4 6.9 - 7.1 Source: The 2010 – 2014 National Medium-Term Development Plan
IMF regularly updates “The World Economic Outlook” and its latest version as of April 2010
forecasts the state of the global economy until 2015.The following is an excerpt:
The global recovery has evolved better than expected, with activity recovering at varying speeds–– tepidly in many advanced economies but solidly in most emerging and developing economies.
The world economy is poised for further recovery but at varying speeds across and within regions. Global growth is projected to reach 4¼ percent in 2010 and 2011. It is true that future economic framework is quite uncertain, but released outlook by IMF is the most reliable one so far. The outlook for activity remains unusually uncertain, even though a variety of risks have receded.
The assumed GDP growth rates of Indonesia and trade partners by case are shown in Table 4.1-3. The growth rates of the high case are set at 0.5 percentage point higher, and those of the low case are 0.5 percentage point lower than those of the basic case, respectively, in the same manner as executed by the JICA Study Team in 2002.
As for the base case, each growth rate is based on the following:
MASTER PLAN STUDY ON PORT DEVELOPMENT AND LOGISTICS IN GREATER JAKARTA METROPOLITAN AREA (JICA)
FINAL REPORT
4-4
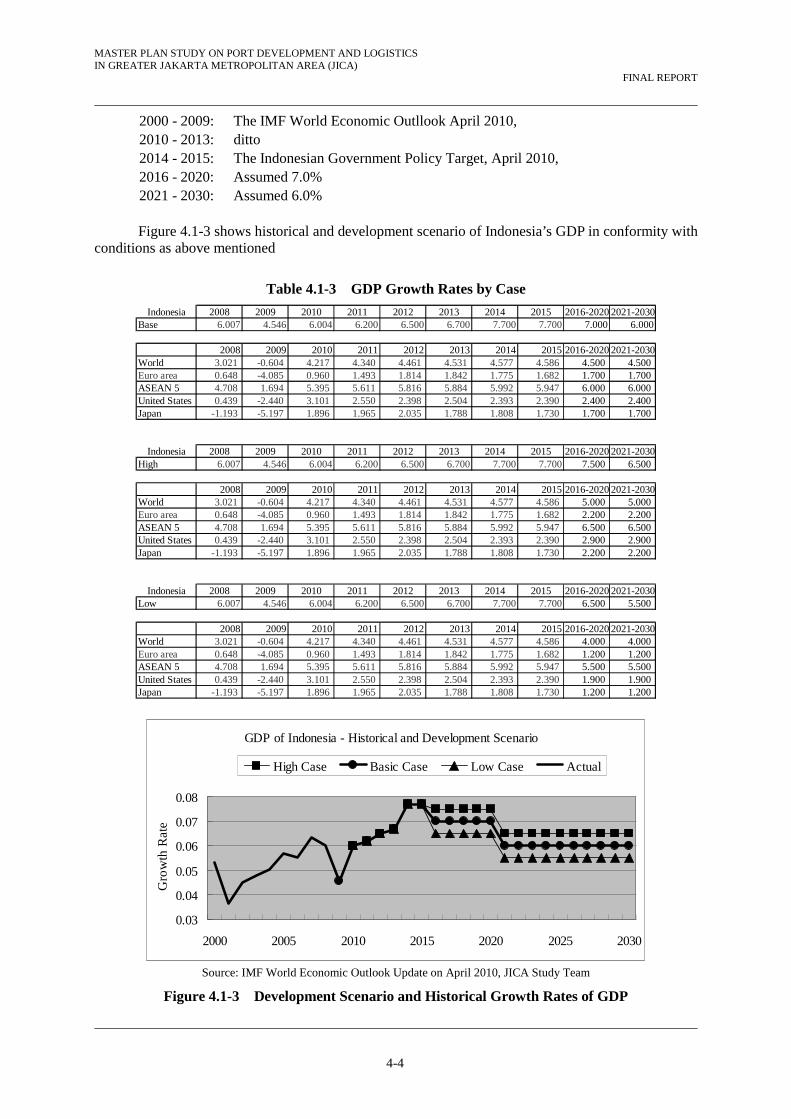
2000 - 2009: The IMF World Economic Outllook April 2010, 2010 - 2013: ditto 2014 - 2015: The Indonesian Government Policy Target, April 2010, 2016 - 2020: Assumed 7.0% 2021 - 2030: Assumed 6.0%
Figure 4.1-3 shows historical and development scenario of Indonesia’s GDP in conformity with
conditions as above mentioned
Table 4.1-3 GDP Growth Rates by Case
Indonesia 2008 2009 2010 2011 2012 2013 2014 2015 2016-2020 2021-2030Base 6.007 4.546 6.004 6.200 6.500 6.700 7.700 7.700 7.000 6.000
2008 2009 2010 2011 2012 2013 2014 2015 2016-2020 2021-2030World 3.021 -0.604 4.217 4.340 4.461 4.531 4.577 4.586 4.500 4.500Euro area 0.648 -4.085 0.960 1.493 1.814 1.842 1.775 1.682 1.700 1.700ASEAN 5 4.708 1.694 5.395 5.611 5.816 5.884 5.992 5.947 6.000 6.000United States 0.439 -2.440 3.101 2.550 2.398 2.504 2.393 2.390 2.400 2.400Japan -1.193 -5.197 1.896 1.965 2.035 1.788 1.808 1.730 1.700 1.700
Indonesia 2008 2009 2010 2011 2012 2013 2014 2015 2016-2020 2021-2030High 6.007 4.546 6.004 6.200 6.500 6.700 7.700 7.700 7.500 6.500
2008 2009 2010 2011 2012 2013 2014 2015 2016-2020 2021-2030World 3.021 -0.604 4.217 4.340 4.461 4.531 4.577 4.586 5.000 5.000Euro area 0.648 -4.085 0.960 1.493 1.814 1.842 1.775 1.682 2.200 2.200ASEAN 5 4.708 1.694 5.395 5.611 5.816 5.884 5.992 5.947 6.500 6.500United States 0.439 -2.440 3.101 2.550 2.398 2.504 2.393 2.390 2.900 2.900Japan -1.193 -5.197 1.896 1.965 2.035 1.788 1.808 1.730 2.200 2.200
Indonesia 2008 2009 2010 2011 2012 2013 2014 2015 2016-2020 2021-2030Low 6.007 4.546 6.004 6.200 6.500 6.700 7.700 7.700 6.500 5.500
2008 2009 2010 2011 2012 2013 2014 2015 2016-2020 2021-2030World 3.021 -0.604 4.217 4.340 4.461 4.531 4.577 4.586 4.000 4.000Euro area 0.648 -4.085 0.960 1.493 1.814 1.842 1.775 1.682 1.200 1.200ASEAN 5 4.708 1.694 5.395 5.611 5.816 5.884 5.992 5.947 5.500 5.500United States 0.439 -2.440 3.101 2.550 2.398 2.504 2.393 2.390 1.900 1.900Japan -1.193 -5.197 1.896 1.965 2.035 1.788 1.808 1.730 1.200 1.200
GDP of Indonesia - Historical and Development Scenario
0.03
0.04
0.05
0.06
0.07
0.08
2000 2005 2010 2015 2020 2025 2030
Gro
wth
Rat
e
High Case Basic Case Low Case Actual
Source: IMF World Economic Outlook Update on April 2010, JICA Study Team
Figure 4.1-3 Development Scenario and Historical Growth Rates of GDP
MASTER PLAN STUDY ON PORT DEVELOPMENT AND LOGISTICS IN GREATER JAKARTA METROPOLITAN AREA (JICA)
FINAL REPORT
4-5
4.1.3 Regional Socio-economic framework
(1) Population
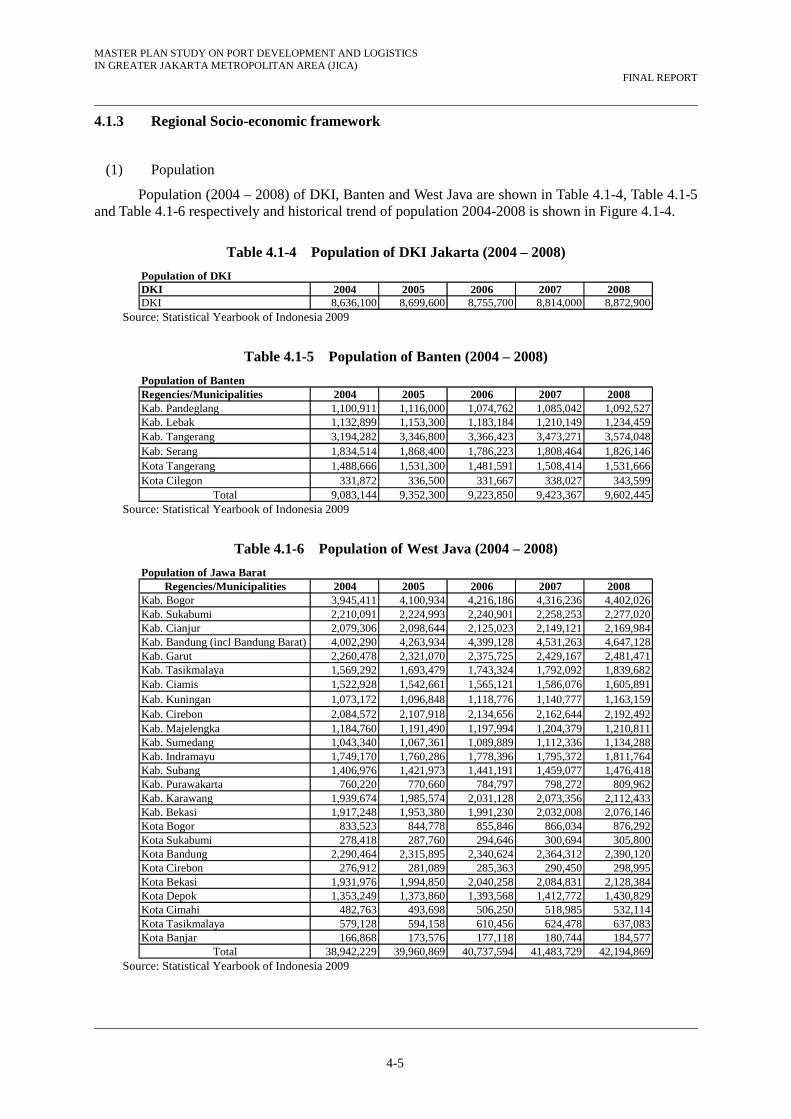
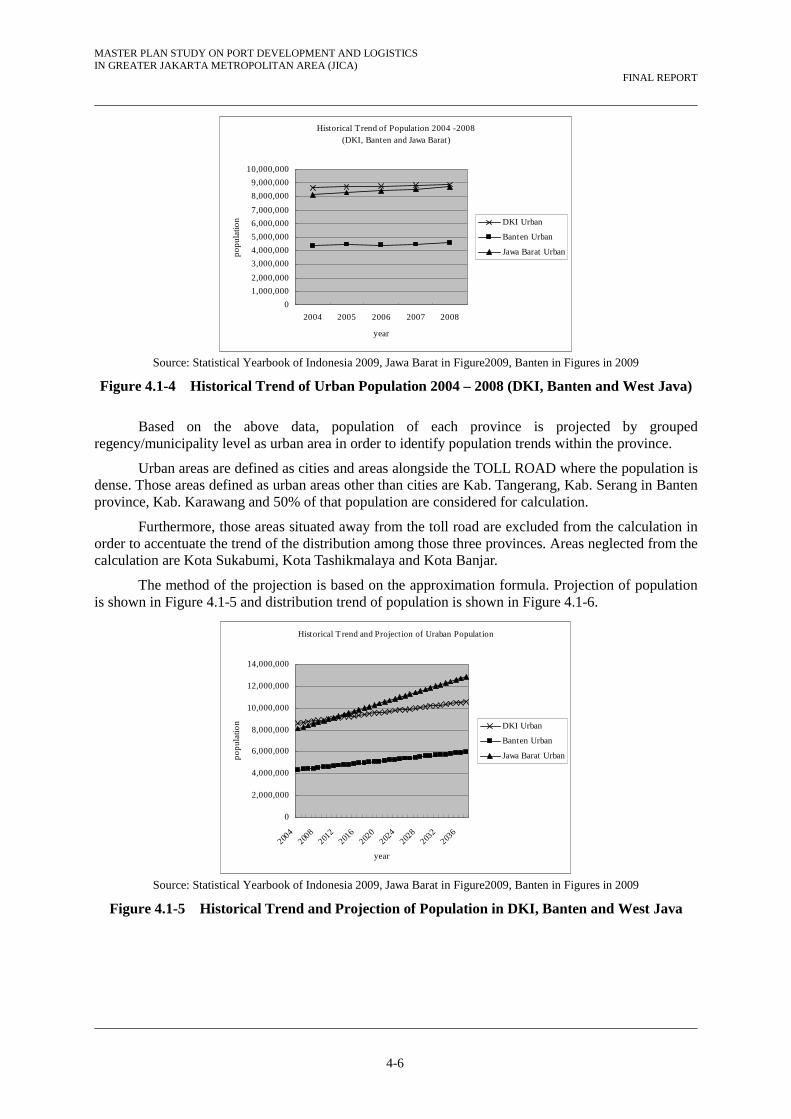
Population (2004 – 2008) of DKI, Banten and West Java are shown in Table 4.1-4, Table 4.1-5 and Table 4.1-6 respectively and historical trend of population 2004-2008 is shown in Figure 4.1-4.
Table 4.1-4 Population of DKI Jakarta (2004 – 2008)
Population of DKI DKI 2004 2005 2006 2007 2008DKI 8,636,100 8,699,600 8,755,700 8,814,000 8,872,900
Source: Statistical Yearbook of Indonesia 2009
Table 4.1-5 Population of Banten (2004 – 2008)
Population of Banten Regencies/Municipalities 2004 2005 2006 2007 2008Kab. Pandeglang 1,100,911 1,116,000 1,074,762 1,085,042 1,092,527Kab. Lebak 1,132,899 1,153,300 1,183,184 1,210,149 1,234,459Kab. Tangerang 3,194,282 3,346,800 3,366,423 3,473,271 3,574,048Kab. Serang 1,834,514 1,868,400 1,786,223 1,808,464 1,826,146Kota Tangerang 1,488,666 1,531,300 1,481,591 1,508,414 1,531,666Kota Cilegon 331,872 336,500 331,667 338,027 343,599
Total 9,083,144 9,352,300 9,223,850 9,423,367 9,602,445 Source: Statistical Yearbook of Indonesia 2009
Table 4.1-6 Population of West Java (2004 – 2008)
Population of Jawa BaratRegencies/Municipalities 2004 2005 2006 2007 2008
Kab. Bogor 3,945,411 4,100,934 4,216,186 4,316,236 4,402,026Kab. Sukabumi 2,210,091 2,224,993 2,240,901 2,258,253 2,277,020Kab. Cianjur 2,079,306 2,098,644 2,125,023 2,149,121 2,169,984Kab. Bandung (incl Bandung Barat) 4,002,290 4,263,934 4,399,128 4,531,263 4,647,128Kab. Garut 2,260,478 2,321,070 2,375,725 2,429,167 2,481,471Kab. Tasikmalaya 1,569,292 1,693,479 1,743,324 1,792,092 1,839,682Kab. Ciamis 1,522,928 1,542,661 1,565,121 1,586,076 1,605,891Kab. Kuningan 1,073,172 1,096,848 1,118,776 1,140,777 1,163,159Kab. Cirebon 2,084,572 2,107,918 2,134,656 2,162,644 2,192,492Kab. Majelengka 1,184,760 1,191,490 1,197,994 1,204,379 1,210,811Kab. Sumedang 1,043,340 1,067,361 1,089,889 1,112,336 1,134,288Kab. Indramayu 1,749,170 1,760,286 1,778,396 1,795,372 1,811,764Kab. Subang 1,406,976 1,421,973 1,441,191 1,459,077 1,476,418Kab. Purawakarta 760,220 770,660 784,797 798,272 809,962Kab. Karawang 1,939,674 1,985,574 2,031,128 2,073,356 2,112,433Kab. Bekasi 1,917,248 1,953,380 1,991,230 2,032,008 2,076,146Kota Bogor 833,523 844,778 855,846 866,034 876,292Kota Sukabumi 278,418 287,760 294,646 300,694 305,800Kota Bandung 2,290,464 2,315,895 2,340,624 2,364,312 2,390,120Kota Cirebon 276,912 281,089 285,363 290,450 298,995Kota Bekasi 1,931,976 1,994,850 2,040,258 2,084,831 2,128,384Kota Depok 1,353,249 1,373,860 1,393,568 1,412,772 1,430,829Kota Cimahi 482,763 493,698 506,250 518,985 532,114Kota Tasikmalaya 579,128 594,158 610,456 624,478 637,083Kota Banjar 166,868 173,576 177,118 180,744 184,577
Total 38,942,229 39,960,869 40,737,594 41,483,729 42,194,869 Source: Statistical Yearbook of Indonesia 2009
MASTER PLAN STUDY ON PORT DEVELOPMENT AND LOGISTICS IN GREATER JAKARTA METROPOLITAN AREA (JICA)
FINAL REPORT
4-6
Historical Trend of Population 2004 -2008(DKI, Banten and Jawa Barat)
0
1,000,000
2,000,000
3,000,000
4,000,000
5,000,000
6,000,000
7,000,000
8,000,000
9,000,000
10,000,000
2004 2005 2006 2007 2008
year
popu
latio
n DKI Urban
Banten Urban
Jawa Barat Urban
Source: Statistical Yearbook of Indonesia 2009, Jawa Barat in Figure2009, Banten in Figures in 2009
Figure 4.1-4 Historical Trend of Urban Population 2004 – 2008 (DKI, Banten and West Java)
Based on the above data, population of each province is projected by grouped regency/municipality level as urban area in order to identify population trends within the province.
Urban areas are defined as cities and areas alongside the TOLL ROAD where the population is dense. Those areas defined as urban areas other than cities are Kab. Tangerang, Kab. Serang in Banten province, Kab. Karawang and 50% of that population are considered for calculation.
Furthermore, those areas situated away from the toll road are excluded from the calculation in order to accentuate the trend of the distribution among those three provinces. Areas neglected from the calculation are Kota Sukabumi, Kota Tashikmalaya and Kota Banjar.
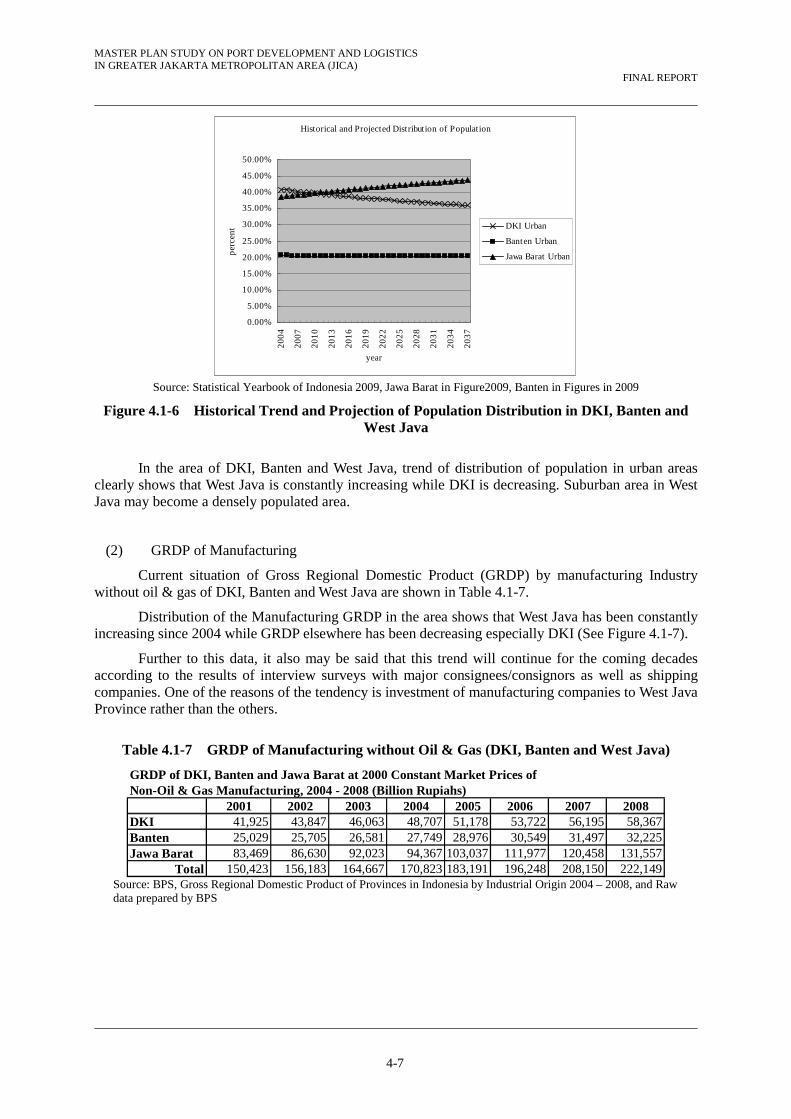
The method of the projection is based on the approximation formula. Projection of population is shown in Figure 4.1-5 and distribution trend of population is shown in Figure 4.1-6.
Historical T rend and Projection of Uraban Population
0
2,000,000
4,000,000
6,000,000
8,000,000
10,000,000
12,000,000
14,000,000
2004
2008
2012
2016
2020
2024
2028
2032
2036
year
pop
ulat
ion DKI Urban
Banten Urban
Jawa Barat Urban
Source: Statistical Yearbook of Indonesia 2009, Jawa Barat in Figure2009, Banten in Figures in 2009
Figure 4.1-5 Historical Trend and Projection of Population in DKI, Banten and West Java
MASTER PLAN STUDY ON PORT DEVELOPMENT AND LOGISTICS IN GREATER JAKARTA METROPOLITAN AREA (JICA)
FINAL REPORT
4-7
Historical and Projected Distribution of Population
0.00%
5.00%
10.00%
15.00%
20.00%
25.00%
30.00%
35.00%
40.00%
45.00%
50.00%
200
4
200
7
201
0
201
3
201
6
201
9
202
2
202
5
202
8
203
1
203
4
203
7
year
per
cent
DKI Urban
Banten Urban
Jawa Barat Urban
Source: Statistical Yearbook of Indonesia 2009, Jawa Barat in Figure2009, Banten in Figures in 2009
Figure 4.1-6 Historical Trend and Projection of Population Distribution in DKI, Banten and West Java
In the area of DKI, Banten and West Java, trend of distribution of population in urban areas clearly shows that West Java is constantly increasing while DKI is decreasing. Suburban area in West Java may become a densely populated area.
(2) GRDP of Manufacturing
Current situation of Gross Regional Domestic Product (GRDP) by manufacturing Industry without oil & gas of DKI, Banten and West Java are shown in Table 4.1-7.
Distribution of the Manufacturing GRDP in the area shows that West Java has been constantly increasing since 2004 while GRDP elsewhere has been decreasing especially DKI (See Figure 4.1-7).
Further to this data, it also may be said that this trend will continue for the coming decades according to the results of interview surveys with major consignees/consignors as well as shipping companies. One of the reasons of the tendency is investment of manufacturing companies to West Java Province rather than the others.
Table 4.1-7 GRDP of Manufacturing without Oil & Gas (DKI, Banten and West Java)
GRDP of DKI, Banten and Jawa Barat at 2000 Constant Market Prices ofNon-Oil & Gas Manufacturing, 2004 - 2008 (Billion Rupiahs)
2001 2002 2003 2004 2005 2006 2007 2008DKI 41,925 43,847 46,063 48,707 51,178 53,722 56,195 58,367Banten 25,029 25,705 26,581 27,749 28,976 30,549 31,497 32,225Jawa Barat 83,469 86,630 92,023 94,367 103,037 111,977 120,458 131,557
Total 150,423 156,183 164,667 170,823 183,191 196,248 208,150 222,149 Source: BPS, Gross Regional Domestic Product of Provinces in Indonesia by Industrial Origin 2004 – 2008, and Raw data prepared by BPS

MASTER PLAN STUDY ON PORT DEVELOPMENT AND LOGISTICS IN GREATER JAKARTA METROPOLITAN AREA (JICA)
FINAL REPORT
4-8
Distribution of GRDP of Non-Oil & Gas Manufaturing
10%
20%
30%
40%
50%
60%20
01
2002
2003
2004
2005
2006
2007
2008
year
Perc
ent DKI
Banten
Jawa Barat
Distribution of GRDP of Non-Oil & Gas Manufacturing
0.00%
10.00%
20.00%
30.00%
40.00%
50.00%
60.00%
70.00%
80.00%
90.00%
2001
2004
2007
2010
2013
2016
2019
2022
2025
2028
2031
2034
2037
yearbi
llion
rup
iah
DKI
Banten
Jawa Barat
Source: BPS, Gross Regional Domestic Product of Provinces in Indonesia by Industrial Origin 2004 – 2008, and Raw data prepared by BPS
Figure 4.1-7 Current Share and Projection of GRDP of Non Oil & Gas Manufacturing
4.2 Cargo Demand Forecast
4.2.1 Container Cargoes
(1) International Container
A total of 28.6 million tons of international cargo were handled at Tanjung Priok Port in 2009 in the form of containers, which was equivalent to 2.74 million TEU. There used to be three dedicated container terminals: JICT I & II and KOJA terminal while JICT II is not operational at present because of customs practice reasons. These dedicated container terminals handle international containers. Conventional berths are also used for handling international containers, which account for 14.2% of the total international containers at the port in 2009.
A regression model was developed and applied to forecast future port demand taking into consideration the correlation between cargo volume (ton) and magnitude of economic activities in the hinterland.
Y = a + bX Where, X: Independent Variable Y: Dependent Variable a, b: Constants
Firstly, future cargo tonnage transported by containers was forecast using the regression model. This work is implemented for export and import cargo individually. Trade partners’ weighted GDP was applied as an independent variable for export cargo, and GRDP of the hinterland of Tanjung Priok Port for import cargo. Correlation coefficient (R) of the model is 0.984 for export and 0.932 for import cargo.
Secondly, the number of containers is estimated as follows;
N = V/W × 1/(1 – E) Where, N: Number of containers (TEUs/year) V: Cargo tonnage in containers (tons/year) W: Cargo weight per loaded 20 ft container

MASTER PLAN STUDY ON PORT DEVELOPMENT AND LOGISTICS IN GREATER JAKARTA METROPOLITAN AREA (JICA)
FINAL REPORT
4-9
(tons/TEU) E: Percentage of empty container
The average cargo weight per loaded 20 ft container (W) is set as 10.5 ton for export containers
and 11.0 ton for import containers based on the actual past records at JICT (see Figure 4.2-1). Although average tonnages per loaded TEU are quite similar for both import container and export one, the total cargo tonnage of imported containers is larger than that of exported. Therefore, import container cargoes need a larger number of laden container boxes (TEUs) than export container cargoes. Percentage of empty container among import container is set as 5 %, taking into consideration the actual records of JICT and prospect of container operation.
8.0
9.0
10.0
11.0
12.0
2002 2003 2004 2005 2006 2007 2008 2009
Unloading Loading
Source: JICT
Figure 4.2-1 Average Tonnage Per Laden TEU at JICT
Considering the fact that a highway network system in Java Island is under development, and that Tanjung Priok Port is by far the largest container port in Indonesia, it is reasonable to assume that the number of exported containers is the same as those of imported containers in the long run. The difference between the number of imported container and that of exported containers calculated from the cargo tonnage will be the number of exported empty containers.
Under the three socioeconomic frameworks, container throughputs were forecast. Total tonnage and the number of containers of international trade in the target years for the basic case are calculated at 61.2 million tons, 7.3 million TEU in 2020, and 106.2 million tons and 13.4 million TEU in 2030. Resulting TEU in the high case is 7.5% higher and that in the low case is 7.1% lower than the basic case in 2030, as shown in Figure 4.2-2 and Table 4.2-1.

MASTER PLAN STUDY ON PORT DEVELOPMENT AND LOGISTICS IN GREATER JAKARTA METROPOLITAN AREA (JICA)
FINAL REPORT
4-10
0
2,000,000
4,000,000
6,000,000
8,000,000
10,000,000
12,000,000
14,000,000
16,000,000
1995 2000 2005 2010 2015 2020 2025 2030
High Basic Low
Source: Forecast by JICA Study Team
Figure 4.2-2 Forecast of International Container Throughput by Case at Tg. Priok.
Table 4.2-1 Forecast of International Container Throughput by Case at Tanjung Priok
High Case
Ton ('000) TEU ('000) Ton ('000) TEU ('000) Ton ('000) TEU ('000)2009 15,616 1,445 12,980 1,291 28,596 2,7362015 26,341 2,661 18,345 2,661 44,685 5,3212020 38,860 3,719 24,140 3,719 63,000 7,4372025 54,129 5,180 31,274 5,180 85,403 10,3602030 75,050 7,182 40,130 7,182 115,180 14,364
Basic Case
Ton ('000) TEU ('000) Ton ('000) TEU ('000) Ton ('000) TEU ('000)2009 15,616 1,445 12,980 1,291 28,596 2,7362015 26,341 2,661 18,345 2,661 44,685 5,3212020 37,909 3,628 23,244 3,628 61,153 7,2552025 51,543 4,932 29,169 4,932 80,711 9,8652030 69,787 6,678 36,396 6,678 106,183 13,356
Low Case
Ton ('000) TEU ('000) Ton ('000) TEU ('000) Ton ('000) TEU ('000)2009 15,616 1,445 12,980 1,291 28,596 2,7362015 26,341 2,661 18,345 2,661 44,685 5,3212020 36,976 3,538 22,365 3,538 59,342 7,0772025 49,063 4,695 27,153 4,695 76,216 9,3902030 64,860 6,207 32,906 6,207 97,765 12,413
Import Export Total
Import Export Total
Import Export Total
Source: Forecast by JICA Study Team

MASTER PLAN STUDY ON PORT DEVELOPMENT AND LOGISTICS IN GREATER JAKARTA METROPOLITAN AREA (JICA)
FINAL REPORT
4-11
(2) Domestic Container
A total of 7.7 million tons or 1.07 million TEU of domestic containers were handled at Tanjung Priok Port in 2009. These domestic containers are loaded and unloaded at conventional berths. Although dedicated container terminals such as JICT are also used for loading/unloading containers coming from/going to remote islands, the volume is minimal.
Future demand for domestic containers is also forecast basically in the same manner as the international containers. However, a multiple regression analysis with a Dummy variable is employed instead of a single regression analysis.
In the case of the relationship between container cargo tonnage and GRDP in the port hinterland, a high correlation is not found for the period of 1991-2009 because of the discontinuity during the economic crisis (see Figure 4.2-3). Unloading container tonnage at Tanjung Priok Port is shown on the Y-axis, and port hinterland GRDP is on the X-axis. The corresponding plots make two groups, revealing a poor correlation between the two variables during this period. Coefficient of determination (R2) of the simple regression analysis during 1991-2009 is calculated at 0.7853, which is not sufficient for forecasting the future port demand.
Domestic Unloading
y = 8.0147x - 2870.3
R2 = 0.7853
-500
0
500
1,000
1,500
2,000
2,500
3,000
3,500
300 400 500 600 700 800
Hinterland GDP
('000 T
on)
Source: JICA Study Team
Figure 4.2-3 Simple Regression Analysis between Container Tonnage and GRDP
Another method to examine how one variable is related to other variables is Multiple Regression. Multiple Regression is the extension of simple regression, to take account of more than one independent variable. It is obviously the appropriate technique when we want to examine the effect on Y of several X variables simultaneously.
Now we introduce Dummy Variable (D) into the Multiple Regression Model in the following form;
Y = a + bX + cD D is a 0-1 variable that clearly distinguishes between the two groups.
It is assumed that observed data of a dependent variable can be classified into two groups;
initial stage on containerization in the interisland shipping (D=0), and afer 2002 (D=1). Then relative to the reference line where D=0, the line where D= 1 is parallel and c units higher.
The Multiple Regression Model with a dummy variable was evaluated using the same data on cargo tonnage and GDP shown in the above figure so as to check whether this model was suitable enough to forecast future port demand. Coefficient of determination (R2) was significantly improved from the simple regression model and turned out to be 0.947 for unloading case and 0.962 for loading
MASTER PLAN STUDY ON PORT DEVELOPMENT AND LOGISTICS IN GREATER JAKARTA METROPOLITAN AREA (JICA)
FINAL REPORT
4-12
case. JICA study team will apply the multiple regression model with dummy variable in order to forecast the future port demand whenever appropriate.
The average cargo weight per laden 20 ft container is set as 12.0 tons for both loading and unloading containers taking into consideration the actual working records at conventional wharves. Percentage of empty container is set as 5% for loading containers based on the actual records and future prospects.
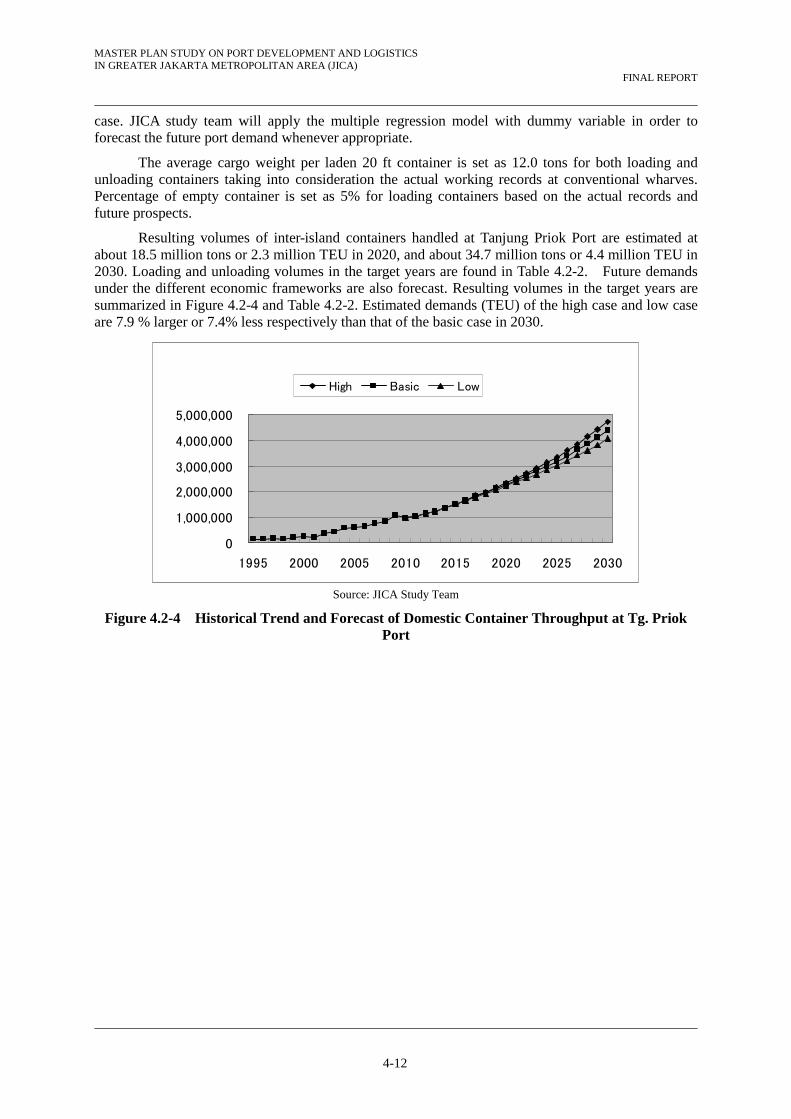
Resulting volumes of inter-island containers handled at Tanjung Priok Port are estimated at about 18.5 million tons or 2.3 million TEU in 2020, and about 34.7 million tons or 4.4 million TEU in 2030. Loading and unloading volumes in the target years are found in Table 4.2-2. Future demands under the different economic frameworks are also forecast. Resulting volumes in the target years are summarized in Figure 4.2-4 and Table 4.2-2. Estimated demands (TEU) of the high case and low case are 7.9 % larger or 7.4% less respectively than that of the basic case in 2030.
0
1,000,000
2,000,000
3,000,000
4,000,000
5,000,000
1995 2000 2005 2010 2015 2020 2025 2030
High Basic Low
Source: JICA Study Team
Figure 4.2-4 Historical Trend and Forecast of Domestic Container Throughput at Tg. Priok Port

MASTER PLAN STUDY ON PORT DEVELOPMENT AND LOGISTICS IN GREATER JAKARTA METROPOLITAN AREA (JICA)
FINAL REPORT
4-13
Table 4.2-2 Forecast of Domestic Container Throughput by Case at Tanjung Priok Port
High Case
Ton ('000) TEU ('000) Ton ('000) TEU ('000) Ton ('000) TEU ('000)2009 2,417 524 5,244 544 7,662 1,068 2015 3,868 761 8,824 761 12,692 1,523 2020 5,430 1,173 13,599 1,173 19,030 2,347 2025 7,335 1,676 19,424 1,676 26,759 3,352 2030 9,945 2,364 27,404 2,364 37,349 4,728
Basic Case
Ton ('000) TEU ('000) Ton ('000) TEU ('000) Ton ('000) TEU ('000)2009 2,417 524 5,244 544 7,662 1,068 2015 3,868 761 8,824 761 12,692 1,523 2020 5,312 1,142 13,237 1,142 18,549 2,284 2025 7,013 1,591 18,437 1,591 25,450 3,181 2030 9,289 2,191 25,396 2,191 34,685 4,382
Low Case
Ton ('000) TEU ('000) Ton ('000) TEU ('000) Ton ('000) TEU ('000)2009 2,417 524 5,244 544 7,662 1,068 2015 3,868 761 8,824 761 12,692 1,523 2020 5,195 1,111 12,881 1,111 18,076 2,223 2025 6,703 1,509 17,491 1,509 24,194 3,018 2030 8,674 2,029 23,517 2,029 32,191 4,058
Total
Unloading Loading Total
Unloading Loading
Unloading Loading Total
Source: Forecast by JICA Study Team
(3) Transshipment Container
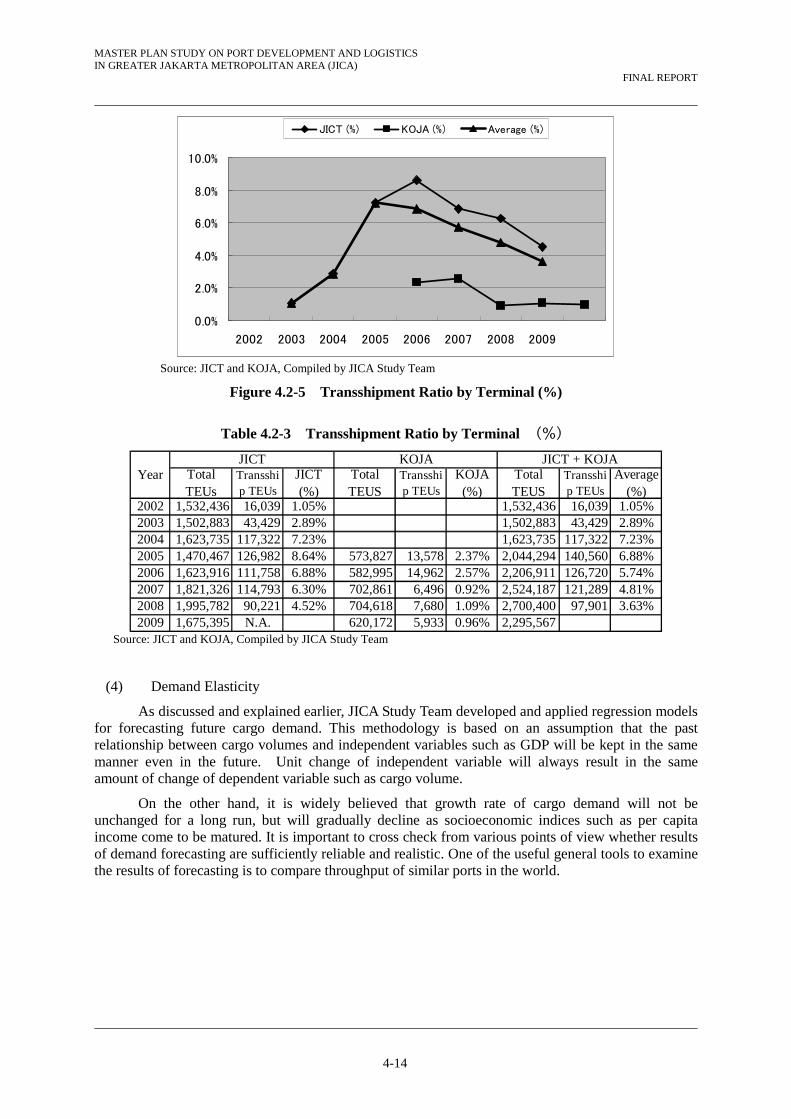
According to container throughput statistics, a total of 90,221 TEU of containers (unloading / loading total) were transshipped at JICT in 2008. This volume was equivalent to 4.52% of the total throughput at JICT. On the other hand, it is reported that transshipped volume at KOJA was 7,680 TEU in 2008, which corresponded to 1.09% of the total throughput at the terminal (see Table 4.2-3).
Transshipment ratio of both JICT and KOJA terminals for the latest several years are shown in Figure 4.2-5. During 2002–2006 transshipment ratio showed an increasing tendency and reached over eight percent, but has since been gradually decreasing. By terminals, JICT has a higher transshipment ratio than KOJA, and currently in the neighborhood of 5 percent. Transshipment ratio at KOJA has been one percent for the last three years.
According to information given by a local shipping line, JICT offers a special tariff for transshipment containers in order to attract customers. Other shippers suggested that they select a port depending upon service level which terminal operators and shipping lines offer. It is useful to transfer the following remarks which a local shipping operator made to the JICA Study Team: “Tanjung Priok Port has already served as a transshipment port for Banjarmasin, Pontianak, and Panjang even if currently at a small scale. This can be jacked up if infrastructure and institutional arrangements at Tanjung Priok Port are improved and better than those at Singapore so as to do this business.”
Presently transshipment ratio at Tg. Priok Port is not significant from the view point of terminal throughput level and will not affect the result of demand forecast substantially. Throughput of the transshipment containers is included in the international throughput in this study.
MASTER PLAN STUDY ON PORT DEVELOPMENT AND LOGISTICS IN GREATER JAKARTA METROPOLITAN AREA (JICA)
FINAL REPORT
4-14
0.0%
2.0%
4.0%
6.0%
8.0%
10.0%
2002 2003 2004 2005 2006 2007 2008 2009
JICT (%) KOJA (%) Average (%)
Source: JICT and KOJA, Compiled by JICA Study Team
Figure 4.2-5 Transshipment Ratio by Terminal (%)
Table 4.2-3 Transshipment Ratio by Terminal (%)
2002 1,532,436 16,039 1.05% 1,532,436 16,039 1.05%2003 1,502,883 43,429 2.89% 1,502,883 43,429 2.89%2004 1,623,735 117,322 7.23% 1,623,735 117,322 7.23%2005 1,470,467 126,982 8.64% 573,827 13,578 2.37% 2,044,294 140,560 6.88%2006 1,623,916 111,758 6.88% 582,995 14,962 2.57% 2,206,911 126,720 5.74%2007 1,821,326 114,793 6.30% 702,861 6,496 0.92% 2,524,187 121,289 4.81%2008 1,995,782 90,221 4.52% 704,618 7,680 1.09% 2,700,400 97,901 3.63%2009 1,675,395 N.A. 620,172 5,933 0.96% 2,295,567
KOJA JICT + KOJATotalTEUs
Transship TEUs
JICT(%)
TotalTEUS
Transship TEUs
KOJA(%)
JICTYear Total
TEUSTransship TEUs
Average(%)
Source: JICT and KOJA, Compiled by JICA Study Team
(4) Demand Elasticity
As discussed and explained earlier, JICA Study Team developed and applied regression models for forecasting future cargo demand. This methodology is based on an assumption that the past relationship between cargo volumes and independent variables such as GDP will be kept in the same manner even in the future. Unit change of independent variable will always result in the same amount of change of dependent variable such as cargo volume.
On the other hand, it is widely believed that growth rate of cargo demand will not be unchanged for a long run, but will gradually decline as socioeconomic indices such as per capita income come to be matured. It is important to cross check from various points of view whether results of demand forecasting are sufficiently reliable and realistic. One of the useful general tools to examine the results of forecasting is to compare throughput of similar ports in the world.
MASTER PLAN STUDY ON PORT DEVELOPMENT AND LOGISTICS IN GREATER JAKARTA METROPOLITAN AREA (JICA)
FINAL REPORT
4-15
TEU
2,000,000
2,500,000
3,000,000
3,500,000
4,000,000
4,500,000
1999 2000 2001 2002 2003 2004 2005 2006 2007 2008
Tokyo Yokohama Tanjung Priok
Source: JICA Study Team
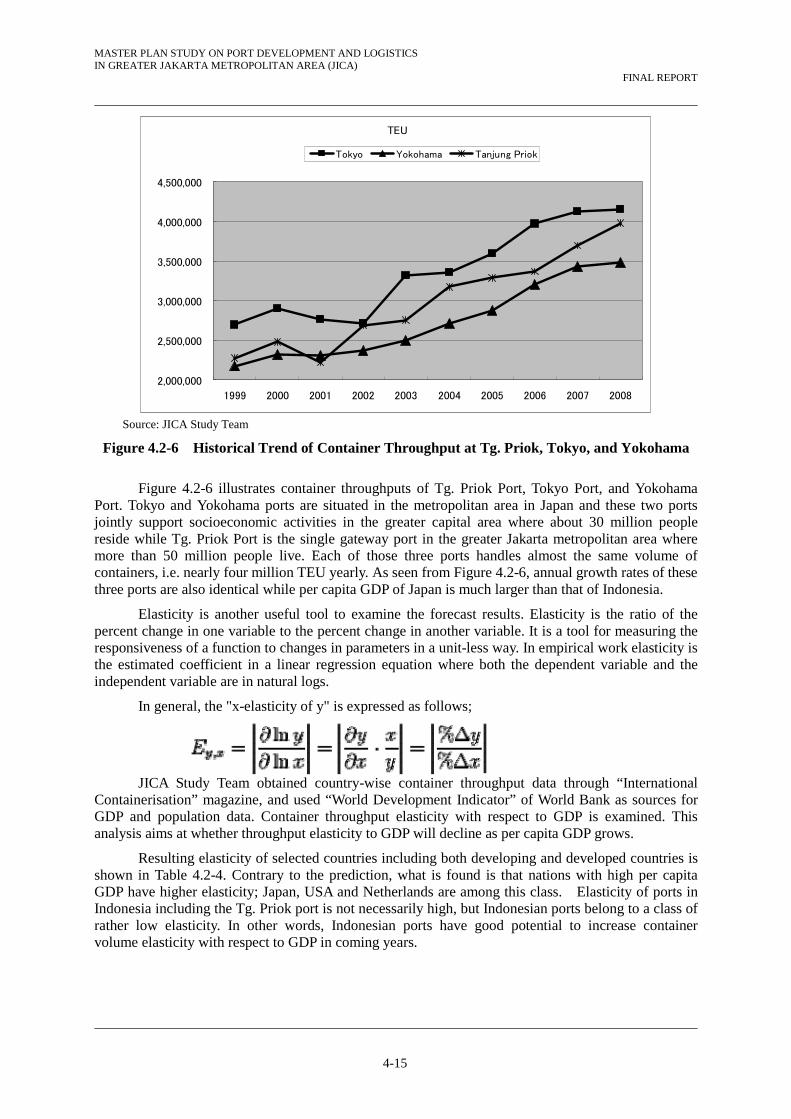
Figure 4.2-6 Historical Trend of Container Throughput at Tg. Priok, Tokyo, and Yokohama
Figure 4.2-6 illustrates container throughputs of Tg. Priok Port, Tokyo Port, and Yokohama Port. Tokyo and Yokohama ports are situated in the metropolitan area in Japan and these two ports jointly support socioeconomic activities in the greater capital area where about 30 million people reside while Tg. Priok Port is the single gateway port in the greater Jakarta metropolitan area where more than 50 million people live. Each of those three ports handles almost the same volume of containers, i.e. nearly four million TEU yearly. As seen from Figure 4.2-6, annual growth rates of these three ports are also identical while per capita GDP of Japan is much larger than that of Indonesia.
Elasticity is another useful tool to examine the forecast results. Elasticity is the ratio of the percent change in one variable to the percent change in another variable. It is a tool for measuring the responsiveness of a function to changes in parameters in a unit-less way. In empirical work elasticity is the estimated coefficient in a linear regression equation where both the dependent variable and the independent variable are in natural logs.
In general, the "x-elasticity of y" is expressed as follows;
JICA Study Team obtained country-wise container throughput data through “International
Containerisation” magazine, and used “World Development Indicator” of World Bank as sources for GDP and population data. Container throughput elasticity with respect to GDP is examined. This analysis aims at whether throughput elasticity to GDP will decline as per capita GDP grows.
Resulting elasticity of selected countries including both developing and developed countries is shown in Table 4.2-4. Contrary to the prediction, what is found is that nations with high per capita GDP have higher elasticity; Japan, USA and Netherlands are among this class. Elasticity of ports in Indonesia including the Tg. Priok port is not necessarily high, but Indonesian ports belong to a class of rather low elasticity. In other words, Indonesian ports have good potential to increase container volume elasticity with respect to GDP in coming years.
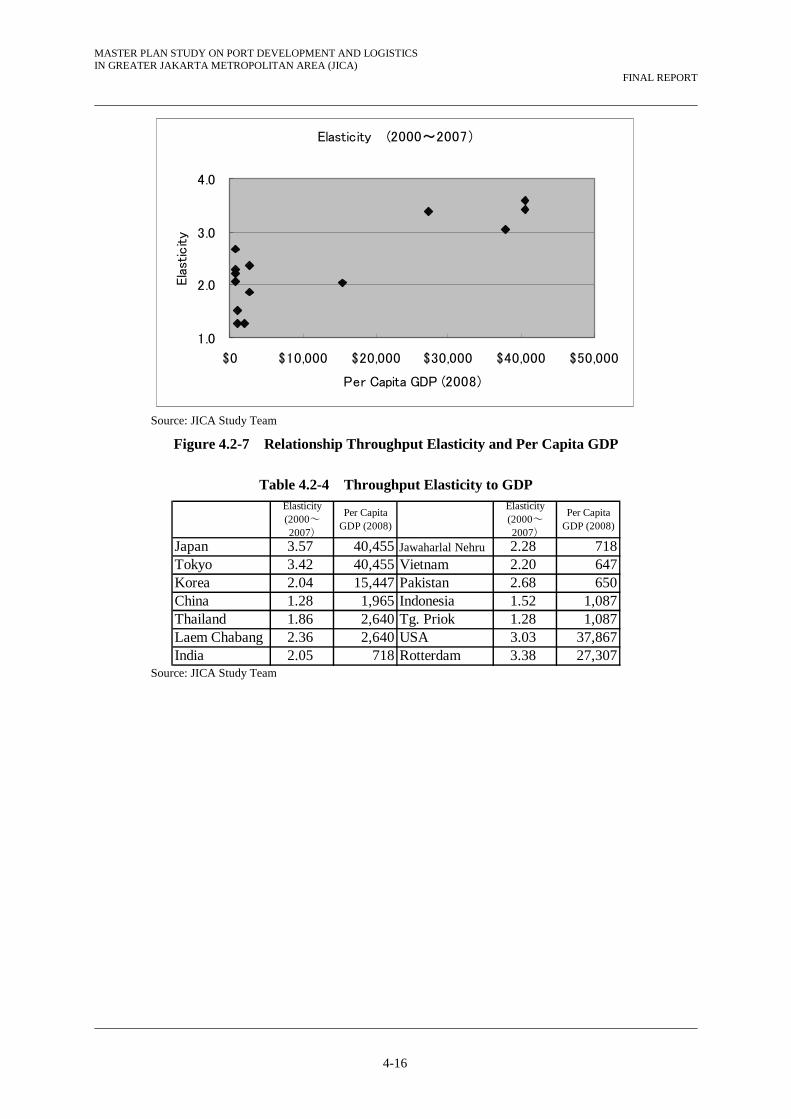
MASTER PLAN STUDY ON PORT DEVELOPMENT AND LOGISTICS IN GREATER JAKARTA METROPOLITAN AREA (JICA)
FINAL REPORT
4-16
Elasticity (2000~2007)
1.0
2.0
3.0
4.0
$0 $10,000 $20,000 $30,000 $40,000 $50,000
Per Capita GDP (2008)
Ela
stic
ity
Source: JICA Study Team
Figure 4.2-7 Relationship Throughput Elasticity and Per Capita GDP
Table 4.2-4 Throughput Elasticity to GDP
Japan 3.57 40,455 Jawaharlal Nehru 2.28 718Tokyo 3.42 40,455 Vietnam 2.20 647Korea 2.04 15,447 Pakistan 2.68 650China 1.28 1,965 Indonesia 1.52 1,087Thailand 1.86 2,640 Tg. Priok 1.28 1,087Laem Chabang 2.36 2,640 USA 3.03 37,867India 2.05 718 Rotterdam 3.38 27,307
Elasticity(2000~
2007)
Per CapitaGDP (2008)
Elasticity(2000~
2007)
Per CapitaGDP (2008)
Source: JICA Study Team
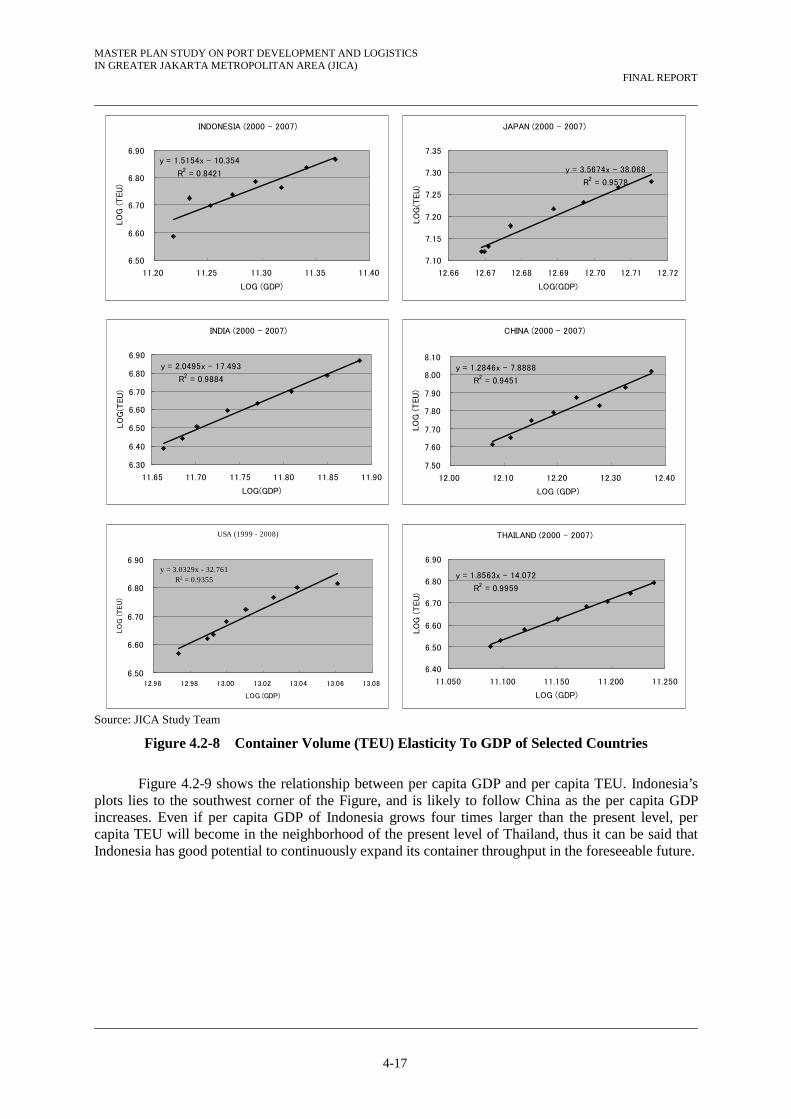
MASTER PLAN STUDY ON PORT DEVELOPMENT AND LOGISTICS IN GREATER JAKARTA METROPOLITAN AREA (JICA)
FINAL REPORT
4-17
CHINA (2000 - 2007)
y = 1.2846x - 7.8888
R2 = 0.9451
7.50
7.60
7.70
7.80
7.90
8.00
8.10
12.00 12.10 12.20 12.30 12.40
LOG (GDP)
LO
G (
TEU
)
JAPAN (2000 - 2007)
y = 3.5674x - 38.068
R2 = 0.9578
7.10
7.15
7.20
7.25
7.30
7.35
12.66 12.67 12.68 12.69 12.70 12.71 12.72
LOG(GDP)
LO
G(T
EU
)
INDIA (2000 - 2007)
y = 2.0495x - 17.493
R2 = 0.9884
6.30
6.40
6.50
6.60
6.70
6.80
6.90
11.65 11.70 11.75 11.80 11.85 11.90
LOG(GDP)
LO
G(T
EU
)INDONESIA (2000 - 2007)
y = 1.5154x - 10.354
R2 = 0.8421
6.50
6.60
6.70
6.80
6.90
11.20 11.25 11.30 11.35 11.40
LOG (GDP)
LO
G (
TEU
)
THAILAND (2000 - 2007)
y = 1.8563x - 14.072
R2 = 0.9959
6.40
6.50
6.60
6.70
6.80
6.90
11.050 11.100 11.150 11.200 11.250
LOG (GDP)
LO
G (
TEU
)
USA (1999 - 2008)
y = 3.0329x - 32.761R2 = 0.9355
6.50
6.60
6.70
6.80
6.90
12.96 12.98 13.00 13.02 13.04 13.06 13.08
LOG (GDP)
LO
G (T
EU
)
Source: JICA Study Team
Figure 4.2-8 Container Volume (TEU) Elasticity To GDP of Selected Countries
Figure 4.2-9 shows the relationship between per capita GDP and per capita TEU. Indonesia’s plots lies to the southwest corner of the Figure, and is likely to follow China as the per capita GDP increases. Even if per capita GDP of Indonesia grows four times larger than the present level, per capita TEU will become in the neighborhood of the present level of Thailand, thus it can be said that Indonesia has good potential to continuously expand its container throughput in the foreseeable future.
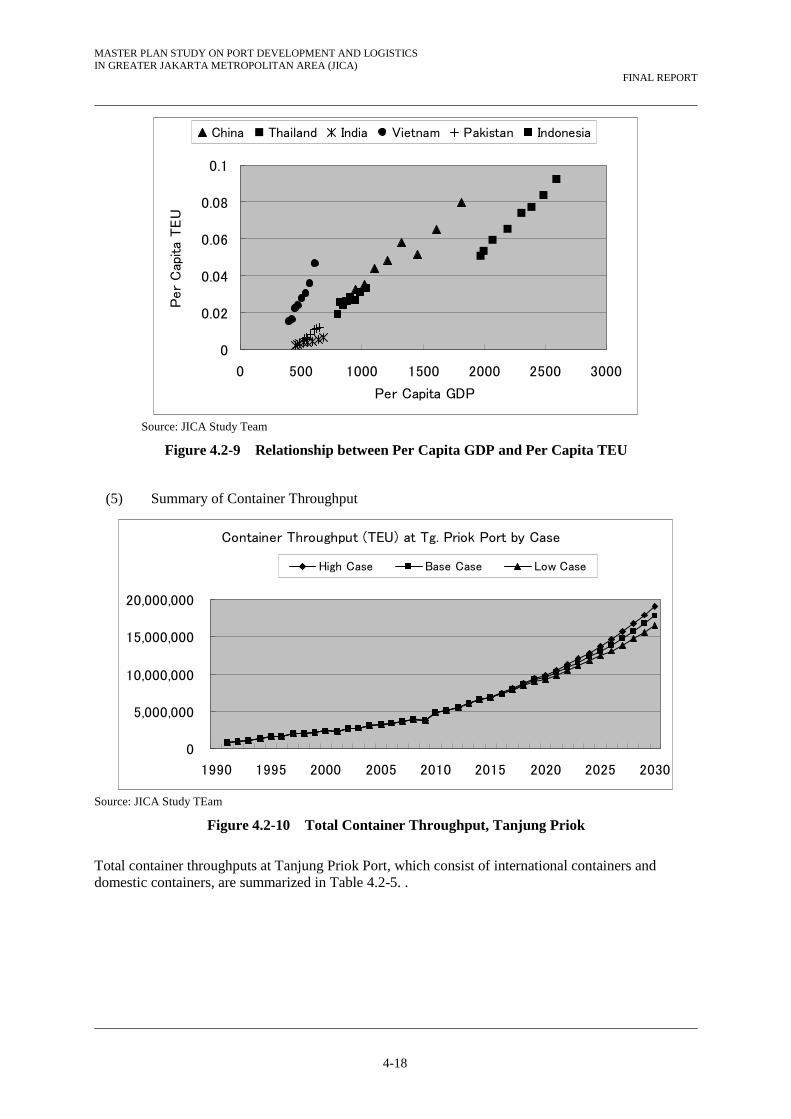
MASTER PLAN STUDY ON PORT DEVELOPMENT AND LOGISTICS IN GREATER JAKARTA METROPOLITAN AREA (JICA)
FINAL REPORT
4-18
0
0.02
0.04
0.06
0.08
0.1
0 500 1000 1500 2000 2500 3000
Per Capita GDP
Per
Cap
ita
TEU
China Thailand India Vietnam Pakistan Indonesia
Source: JICA Study Team
Figure 4.2-9 Relationship between Per Capita GDP and Per Capita TEU
(5) Summary of Container Throughput
Container Throughput (TEU) at Tg. Priok Port by Case
0
5,000,000
10,000,000
15,000,000
20,000,000
1990 1995 2000 2005 2010 2015 2020 2025 2030
High Case Base Case Low Case
Source: JICA Study TEam
Figure 4.2-10 Total Container Throughput, Tanjung Priok
Total container throughputs at Tanjung Priok Port, which consist of international containers and domestic containers, are summarized in Table 4.2-5. .

MASTER PLAN STUDY ON PORT DEVELOPMENT AND LOGISTICS IN GREATER JAKARTA METROPOLITAN AREA (JICA)
FINAL REPORT
4-19
Table 4.2-5 Total Container Throughput at Tanjung Priok
High Case
Ton ('000) TEU ('000) Ton ('000) TEU ('000) Ton ('000) TEU ('000)2009 28,596 2,736 7,662 1,068 36,258 3,804 2015 44,685 5,321 12,692 1,523 57,377 6,844 2020 63,000 7,437 19,030 2,347 82,029 9,784 2025 85,403 10,360 26,759 3,352 112,162 13,711 2030 115,180 14,364 37,349 4,728 152,529 19,092
Basic Case
Ton ('000) TEU ('000) Ton ('000) TEU ('000) Ton ('000) TEU ('000)2009 28,596 2,736 7,662 1,068 36,258 3,804 2015 44,685 5,321 12,692 1,523 57,378 6,844 2020 61,153 7,255 18,549 2,284 79,702 9,539 2025 80,711 9,865 25,450 3,181 106,161 13,046 2030 106,183 13,356 34,685 4,382 140,868 17,738
Low Case
Ton ('000) TEU ('000) Ton ('000) TEU ('000) Ton ('000) TEU ('000)2009 28,596 2,736 7,662 1,068 36,258 3,804 2015 44,685 5,321 12,692 1,523 57,377 6,844 2020 59,342 7,077 18,076 2,223 77,418 9,299 2025 76,216 9,390 24,194 3,018 100,411 12,408 2030 97,765 12,413 32,191 4,058 129,956 16,471
International Total Domestic Total Grand Total
International Total Domestic Total Grand Total
International Total Domestic Total Grand Total
Source: Forecast by JICA Study Team
4.2.2 Non-Container Cargoes
(1) Major Non-container Cargoes
Indonesia Port Corporation II (ICPII) provided the JICA Study Team with commodity-wise information on cargo tonnage during the period 2000-2009 although classification of cargo is not necessarily consistent throughout the years.
According to the commodity-wise cargo tonnage statistics in 2009, commodities with more than one million tons can be listed in Table 4.2-6. Petroleum Product, Iron and Steel、and Coal are among the largest commodity group at Tg. Priok Port.
Table 4.2-6 Commodities with more than one million tons
(Unit: ton)No. Commodity Category Unit Import Export Unloading Loading Total
2 Cement and Clinker Ton 14,643 1,943,484 722,102 352,767 3,032,9963 Wheat Ton 1,814,400 22,500 104,721 0 1,941,6214 Crude Palm Oil 15,895 26,150 1,465,354 18,989 1,526,3885 Iron & Steel Ton 2,670,899 396,583 78,997 125,864 3,272,3436 Coal Ton 133,638 0 2,946,000 8,745 3,088,3837 Sand Ton 124,300 4,000 1,883,309 39,984 2,051,5938 Forest Product Ton 214,561 771 769,591 81,734 1,066,6579 Petroleum Product Ton 3,205,411 58,073 1,912,028 10,848 5,186,360
Source: TG. Priok Port Office, Pelindo II
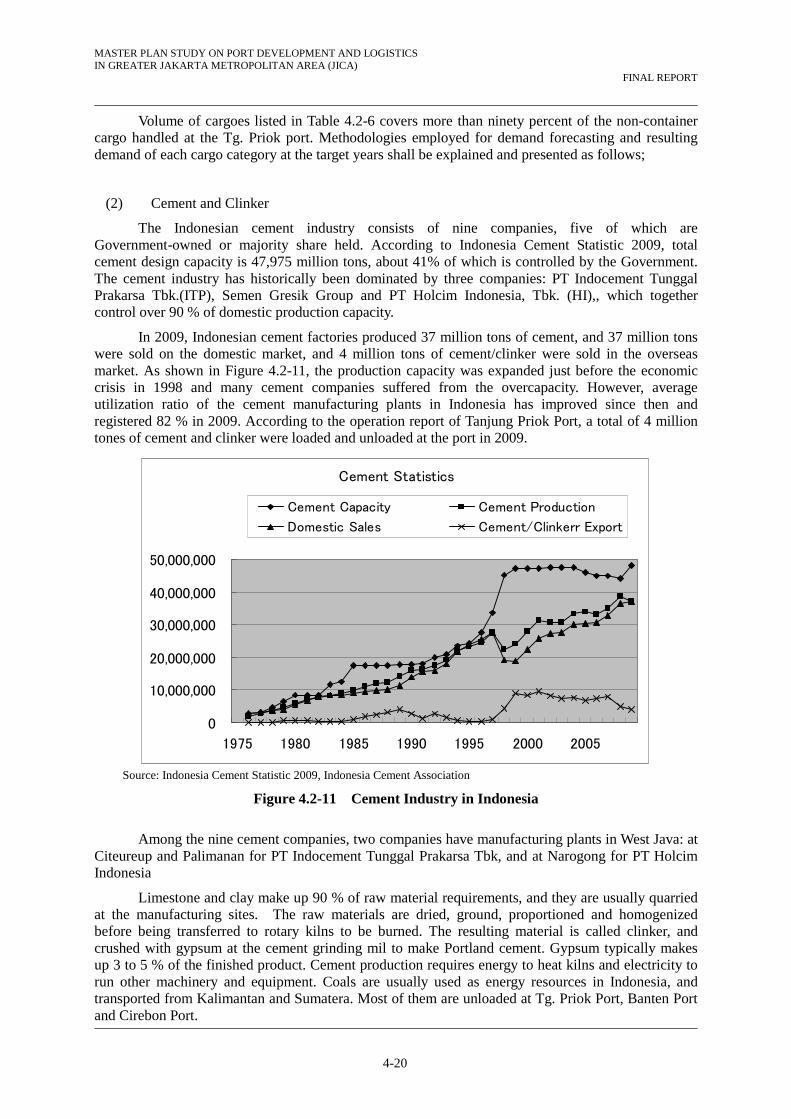
MASTER PLAN STUDY ON PORT DEVELOPMENT AND LOGISTICS IN GREATER JAKARTA METROPOLITAN AREA (JICA)
FINAL REPORT
4-20
Volume of cargoes listed in Table 4.2-6 covers more than ninety percent of the non-container cargo handled at the Tg. Priok port. Methodologies employed for demand forecasting and resulting demand of each cargo category at the target years shall be explained and presented as follows;
(2) Cement and Clinker
The Indonesian cement industry consists of nine companies, five of which are Government-owned or majority share held. According to Indonesia Cement Statistic 2009, total cement design capacity is 47,975 million tons, about 41% of which is controlled by the Government. The cement industry has historically been dominated by three companies: PT Indocement Tunggal Prakarsa Tbk.(ITP), Semen Gresik Group and PT Holcim Indonesia, Tbk. (HI),, which together control over 90 % of domestic production capacity.
In 2009, Indonesian cement factories produced 37 million tons of cement, and 37 million tons were sold on the domestic market, and 4 million tons of cement/clinker were sold in the overseas market. As shown in Figure 4.2-11, the production capacity was expanded just before the economic crisis in 1998 and many cement companies suffered from the overcapacity. However, average utilization ratio of the cement manufacturing plants in Indonesia has improved since then and registered 82 % in 2009. According to the operation report of Tanjung Priok Port, a total of 4 million tones of cement and clinker were loaded and unloaded at the port in 2009.
Cement Statistics
0
10,000,000
20,000,000
30,000,000
40,000,000
50,000,000
1975 1980 1985 1990 1995 2000 2005
Cement Capacity Cement Production
Domestic Sales Cement/Clinkerr Export
Source: Indonesia Cement Statistic 2009, Indonesia Cement Association
Figure 4.2-11 Cement Industry in Indonesia
Among the nine cement companies, two companies have manufacturing plants in West Java: at Citeureup and Palimanan for PT Indocement Tunggal Prakarsa Tbk, and at Narogong for PT Holcim Indonesia
Limestone and clay make up 90 % of raw material requirements, and they are usually quarried at the manufacturing sites. The raw materials are dried, ground, proportioned and homogenized before being transferred to rotary kilns to be burned. The resulting material is called clinker, and crushed with gypsum at the cement grinding mil to make Portland cement. Gypsum typically makes up 3 to 5 % of the finished product. Cement production requires energy to heat kilns and electricity to run other machinery and equipment. Coals are usually used as energy resources in Indonesia, and transported from Kalimantan and Sumatera. Most of them are unloaded at Tg. Priok Port, Banten Port and Cirebon Port.

MASTER PLAN STUDY ON PORT DEVELOPMENT AND LOGISTICS IN GREATER JAKARTA METROPOLITAN AREA (JICA)
FINAL REPORT
4-21
According to Indonesia Cement Association, domestic cement sales will reach 4.9 million tons in 2015. For forecasting the domestic sales during 2016-2030, JICA Study Team developed a regression model with independent variables of the construction sector’s GDP and Dummy. Future growth rates of the construction sector’s GDP is assumed same as those of the National GDP.
Resulting domestic cement sales are estimated at 113 million tons in 2030, i.e., 398.5 kg per capita. Cement consumptions per capita in ASEAN Countries in 2008 are summarized in Table 4.2-7; 1,020 kg per capita for Singapore, 612 kg for Malaysia, and 461 kg for Vietnam, respectively. Indonesia only consumed 168 kg of cement per capita in 2008, hence has a good potential for expansion.
Table 4.2-7 Cement Consumption in ASEAN Countries - 2008
Population Cement Consumption Per Capita Consumption
Million '000 Ton kg/capitaSingapore 4.8 4,900 1,021Brunei 0.4 246 615Malaysia 27.7 16,962 612Thailand 63.4 23,921 377Vietnam 86.5 39,846 461Philippines 90.4 13,217 146Indonesia 226 38,072 168
Source: Indonesia Cement Association, 2010
In order to increase the utilization rate of the manufacturing plants, Indonesian cement companies expanded overseas markets after the economic crisis in 1998 and about 7 to 9 million tons of cement/clinker, which was nearly 20% of the production capacity, were annually exported to overseas market. With the increase of the domestic demand, export volume decreased significantly, and in 2009 export volume of cement/clinker dropped to 4 million tons, which was equivalent to 8.4% of the total production capacity. Considering these situations surrounding the Indonesian cement market, the JICA study team assumes that 5 percent of the cement production capacity will be sold to overseas markets in the form of cement and clinker. It is also assumed that Tanjung Priok Port will handle 50 % of the total Indonesian exported volume of cement and clinker based on the actual cargo tonnage and market shares.
Indonesia Cement Association revealed the capacity projection of each cement company up to 2015 as shown in Table 4.2-8. JICA Study Team follows the Association’s capacity projection up to 2015, and assumes that cement industries will expand their production capacities to meet the market demand even afterward.
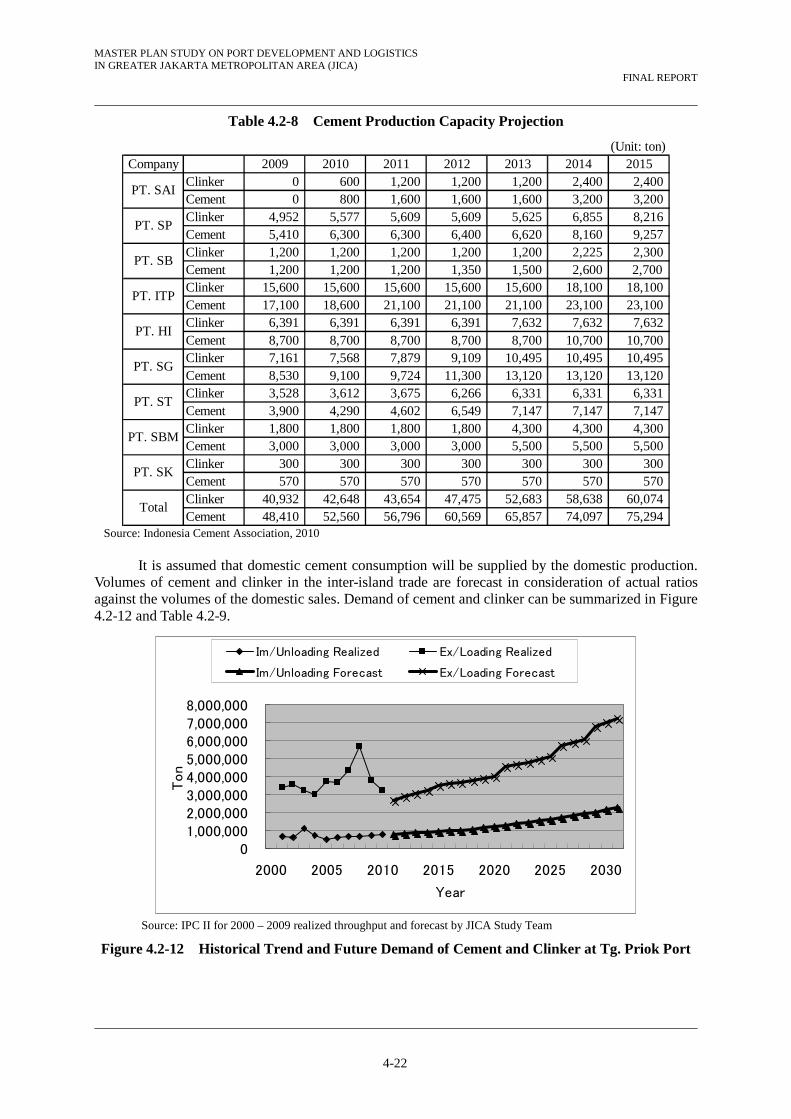
MASTER PLAN STUDY ON PORT DEVELOPMENT AND LOGISTICS IN GREATER JAKARTA METROPOLITAN AREA (JICA)
FINAL REPORT
4-22
Table 4.2-8 Cement Production Capacity Projection
(Unit: ton)Company 2009 2010 2011 2012 2013 2014 2015
Clinker 0 600 1,200 1,200 1,200 2,400 2,400Cement 0 800 1,600 1,600 1,600 3,200 3,200Clinker 4,952 5,577 5,609 5,609 5,625 6,855 8,216Cement 5,410 6,300 6,300 6,400 6,620 8,160 9,257Clinker 1,200 1,200 1,200 1,200 1,200 2,225 2,300Cement 1,200 1,200 1,200 1,350 1,500 2,600 2,700 Clinker 15,600 15,600 15,600 15,600 15,600 18,100 18,100Cement 17,100 18,600 21,100 21,100 21,100 23,100 23,100Clinker 6,391 6,391 6,391 6,391 7,632 7,632 7,632Cement 8,700 8,700 8,700 8,700 8,700 10,700 10,700Clinker 7,161 7,568 7,879 9,109 10,495 10,495 10,495Cement 8,530 9,100 9,724 11,300 13,120 13,120 13,120Clinker 3,528 3,612 3,675 6,266 6,331 6,331 6,331Cement 3,900 4,290 4,602 6,549 7,147 7,147 7,147Clinker 1,800 1,800 1,800 1,800 4,300 4,300 4,300Cement 3,000 3,000 3,000 3,000 5,500 5,500 5,500Clinker 300 300 300 300 300 300 300Cement 570 570 570 570 570 570 570Clinker 40,932 42,648 43,654 47,475 52,683 58,638 60,074Cement 48,410 52,560 56,796 60,569 65,857 74,097 75,294
PT. SK
Total
PT. HI
PT. SG
PT. ST
PT. SBM
PT. SAI
PT. SP
PT. SB
PT. ITP
Source: Indonesia Cement Association, 2010
It is assumed that domestic cement consumption will be supplied by the domestic production.
Volumes of cement and clinker in the inter-island trade are forecast in consideration of actual ratios against the volumes of the domestic sales. Demand of cement and clinker can be summarized in Figure 4.2-12 and Table 4.2-9.
01,000,0002,000,0003,000,0004,000,0005,000,0006,000,0007,000,0008,000,000
2000 2005 2010 2015 2020 2025 2030
Year
Ton
Im/Unloading Realized Ex/Loading Realized
Im/Unloading Forecast Ex/Loading Forecast
Source: IPC II for 2000 – 2009 realized throughput and forecast by JICA Study Team
Figure 4.2-12 Historical Trend and Future Demand of Cement and Clinker at Tg. Priok Port
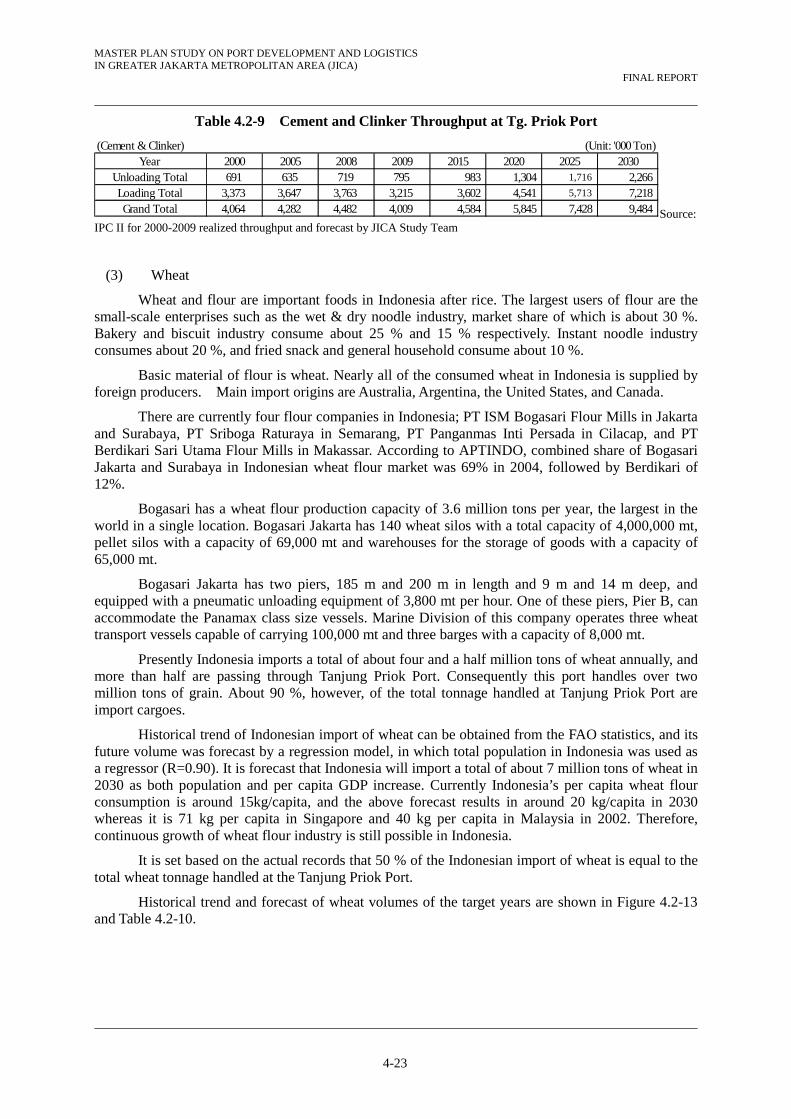
MASTER PLAN STUDY ON PORT DEVELOPMENT AND LOGISTICS IN GREATER JAKARTA METROPOLITAN AREA (JICA)
FINAL REPORT
4-23
Table 4.2-9 Cement and Clinker Throughput at Tg. Priok Port
(Cement & Clinker) (Unit: '000 Ton)2000 2005 2008 2009 2015 2020 2025 2030691 635 719 795 983 1,304 1,716 2,266
3,373 3,647 3,763 3,215 3,602 4,541 5,713 7,218 4,064 4,282 4,482 4,009 4,584 5,845 7,428 9,484
Year Unloading Total Loading Total Grand Total Source:
IPC II for 2000-2009 realized throughput and forecast by JICA Study Team
(3) Wheat
Wheat and flour are important foods in Indonesia after rice. The largest users of flour are the small-scale enterprises such as the wet & dry noodle industry, market share of which is about 30 %. Bakery and biscuit industry consume about 25 % and 15 % respectively. Instant noodle industry consumes about 20 %, and fried snack and general household consume about 10 %.
Basic material of flour is wheat. Nearly all of the consumed wheat in Indonesia is supplied by foreign producers. Main import origins are Australia, Argentina, the United States, and Canada.
There are currently four flour companies in Indonesia; PT ISM Bogasari Flour Mills in Jakarta and Surabaya, PT Sriboga Raturaya in Semarang, PT Panganmas Inti Persada in Cilacap, and PT Berdikari Sari Utama Flour Mills in Makassar. According to APTINDO, combined share of Bogasari Jakarta and Surabaya in Indonesian wheat flour market was 69% in 2004, followed by Berdikari of 12%.
Bogasari has a wheat flour production capacity of 3.6 million tons per year, the largest in the world in a single location. Bogasari Jakarta has 140 wheat silos with a total capacity of 4,000,000 mt, pellet silos with a capacity of 69,000 mt and warehouses for the storage of goods with a capacity of 65,000 mt.
Bogasari Jakarta has two piers, 185 m and 200 m in length and 9 m and 14 m deep, and equipped with a pneumatic unloading equipment of 3,800 mt per hour. One of these piers, Pier B, can accommodate the Panamax class size vessels. Marine Division of this company operates three wheat transport vessels capable of carrying 100,000 mt and three barges with a capacity of 8,000 mt.
Presently Indonesia imports a total of about four and a half million tons of wheat annually, and more than half are passing through Tanjung Priok Port. Consequently this port handles over two million tons of grain. About 90 %, however, of the total tonnage handled at Tanjung Priok Port are import cargoes.
Historical trend of Indonesian import of wheat can be obtained from the FAO statistics, and its future volume was forecast by a regression model, in which total population in Indonesia was used as a regressor (R=0.90). It is forecast that Indonesia will import a total of about 7 million tons of wheat in 2030 as both population and per capita GDP increase. Currently Indonesia’s per capita wheat flour consumption is around 15kg/capita, and the above forecast results in around 20 kg/capita in 2030 whereas it is 71 kg per capita in Singapore and 40 kg per capita in Malaysia in 2002. Therefore, continuous growth of wheat flour industry is still possible in Indonesia.
It is set based on the actual records that 50 % of the Indonesian import of wheat is equal to the total wheat tonnage handled at the Tanjung Priok Port.
Historical trend and forecast of wheat volumes of the target years are shown in Figure 4.2-13 and Table 4.2-10.
MASTER PLAN STUDY ON PORT DEVELOPMENT AND LOGISTICS IN GREATER JAKARTA METROPOLITAN AREA (JICA)
FINAL REPORT
4-24
1,500,000
2,000,000
2,500,000
3,000,000
3,500,000
4,000,000
2000 2005 2010 2015 2020 2025 2030
Import/Unloading Realized Forecast
Source: IPC II for 2000-2009 realized throughput and forecast by JICA Study Team
Figure 4.2-13 Historical Trend and Demand of Wheat at Tg. Priok Port
Table 4.2-10 Wheat Throughput at Tg. Priok Port
(Unit: '000 Ton)2000 2005 2008 2009 2015 2020 2025 20302,155 1,823 1,980 1,919 2,756 3,058 3,333 3,589
301 - 13 23 - - - - 2,457 1,823 1,993 1,942 2,756 3,058 3,333 3,589
Year Unloading Total Loading Total Grand Total
Source: IPC II for 2000-2009 realized throughput and forecast by JICA Study Team
(4) Crude Palm Oil(CPO)
Crude Palm Oil (CPO) is mainly used to produce refined, bleached and deodorized palm oil (RBDPO). RBDPO is further fractionated to produce RBD olein and RBD stearine. RBD olein is used mainly in the manufacture of cooking oil and margarine. RBD stearine is primarily used in the manufacturing of soaps and detergent. The CPO-derived cooking oil industry has experienced continuous growth in the last 10 years, along with the growth of the country’s palm oil industry.
Indonesia produced about 17 million tones of CPO in 2007 (11 million tons of large estates and 6 million tons of small holders estates), and ranked as the largest CPO producer in the world, surpassing Malaysia. As shown in Table 4.2-11, annual growth rates of palm oil in Indonesia have been more than ten percent during the last decade. According to a local newspaper, CPO output was registered at 20.3 million tons in 2009.
Table 4.2-11 Palm Oil Production of Indonesia
(Unit: '000 ton)Year 2000 2001 2002 2003 2004 2005 2006 2007
Production (MT) 6,855 7,775 9,370 10,600 12,380 14,100 15,881 16,900Growth Rate (%) 13.42% 20.51% 13.13% 16.79% 13.89% 12.63% 6.42%
Source: FAO
Currently, about forty percent of CPO is consumed domestically. It is reported that the government plans to cap crude palm oil exports at 50 percent of output by 2015 and 30 percent by
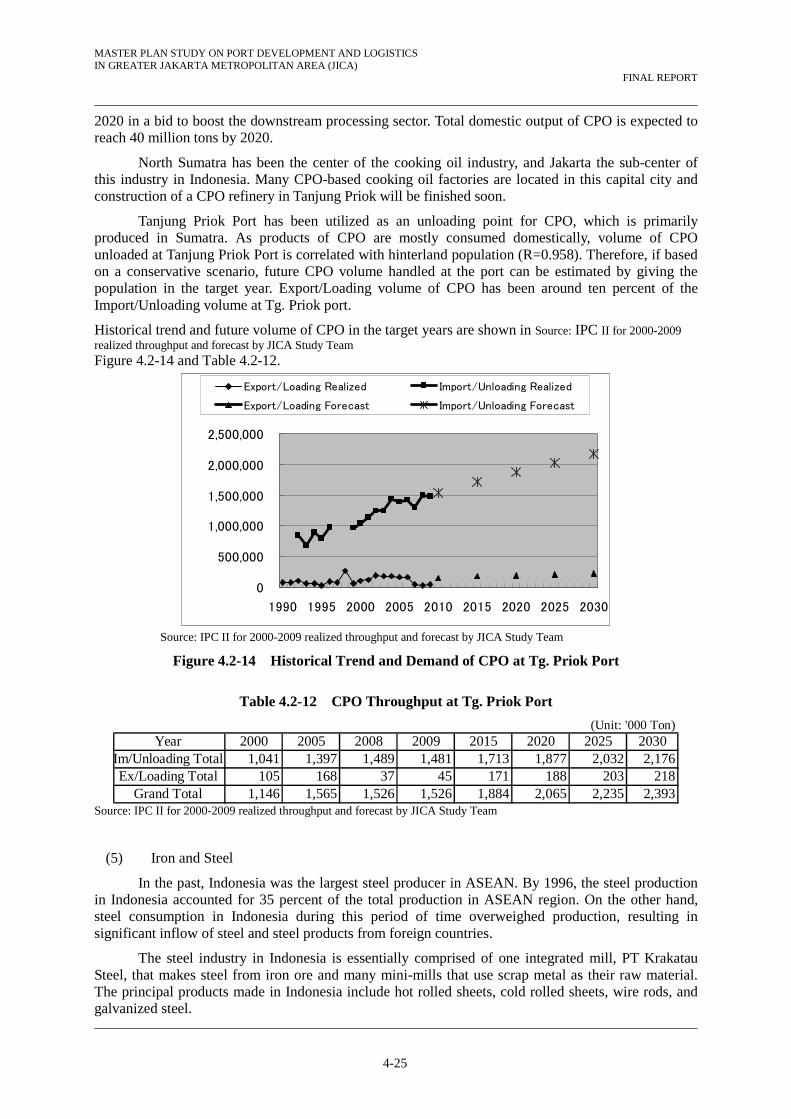
MASTER PLAN STUDY ON PORT DEVELOPMENT AND LOGISTICS IN GREATER JAKARTA METROPOLITAN AREA (JICA)
FINAL REPORT
4-25
2020 in a bid to boost the downstream processing sector. Total domestic output of CPO is expected to reach 40 million tons by 2020.
North Sumatra has been the center of the cooking oil industry, and Jakarta the sub-center of this industry in Indonesia. Many CPO-based cooking oil factories are located in this capital city and construction of a CPO refinery in Tanjung Priok will be finished soon.
Tanjung Priok Port has been utilized as an unloading point for CPO, which is primarily produced in Sumatra. As products of CPO are mostly consumed domestically, volume of CPO unloaded at Tanjung Priok Port is correlated with hinterland population (R=0.958). Therefore, if based on a conservative scenario, future CPO volume handled at the port can be estimated by giving the population in the target year. Export/Loading volume of CPO has been around ten percent of the Import/Unloading volume at Tg. Priok port.
Historical trend and future volume of CPO in the target years are shown in Source: IPC II for 2000-2009 realized throughput and forecast by JICA Study Team Figure 4.2-14 and Table 4.2-12.
0
500,000
1,000,000
1,500,000
2,000,000
2,500,000
1990 1995 2000 2005 2010 2015 2020 2025 2030
Export/Loading Realized Import/Unloading Realized
Export/Loading Forecast Import/Unloading Forecast
Source: IPC II for 2000-2009 realized throughput and forecast by JICA Study Team
Figure 4.2-14 Historical Trend and Demand of CPO at Tg. Priok Port
Table 4.2-12 CPO Throughput at Tg. Priok Port
(Unit: '000 Ton)2000 2005 2008 2009 2015 2020 2025 2030
1,041 1,397 1,489 1,481 1,713 1,877 2,032 2,176105 168 37 45 171 188 203 218
1,146 1,565 1,526 1,526 1,884 2,065 2,235 2,393
Im/Unloading Total Ex/Loading Total
Grand Total
Year
Source: IPC II for 2000-2009 realized throughput and forecast by JICA Study Team
(5) Iron and Steel
In the past, Indonesia was the largest steel producer in ASEAN. By 1996, the steel production in Indonesia accounted for 35 percent of the total production in ASEAN region. On the other hand, steel consumption in Indonesia during this period of time overweighed production, resulting in significant inflow of steel and steel products from foreign countries.
The steel industry in Indonesia is essentially comprised of one integrated mill, PT Krakatau Steel, that makes steel from iron ore and many mini-mills that use scrap metal as their raw material. The principal products made in Indonesia include hot rolled sheets, cold rolled sheets, wire rods, and galvanized steel.
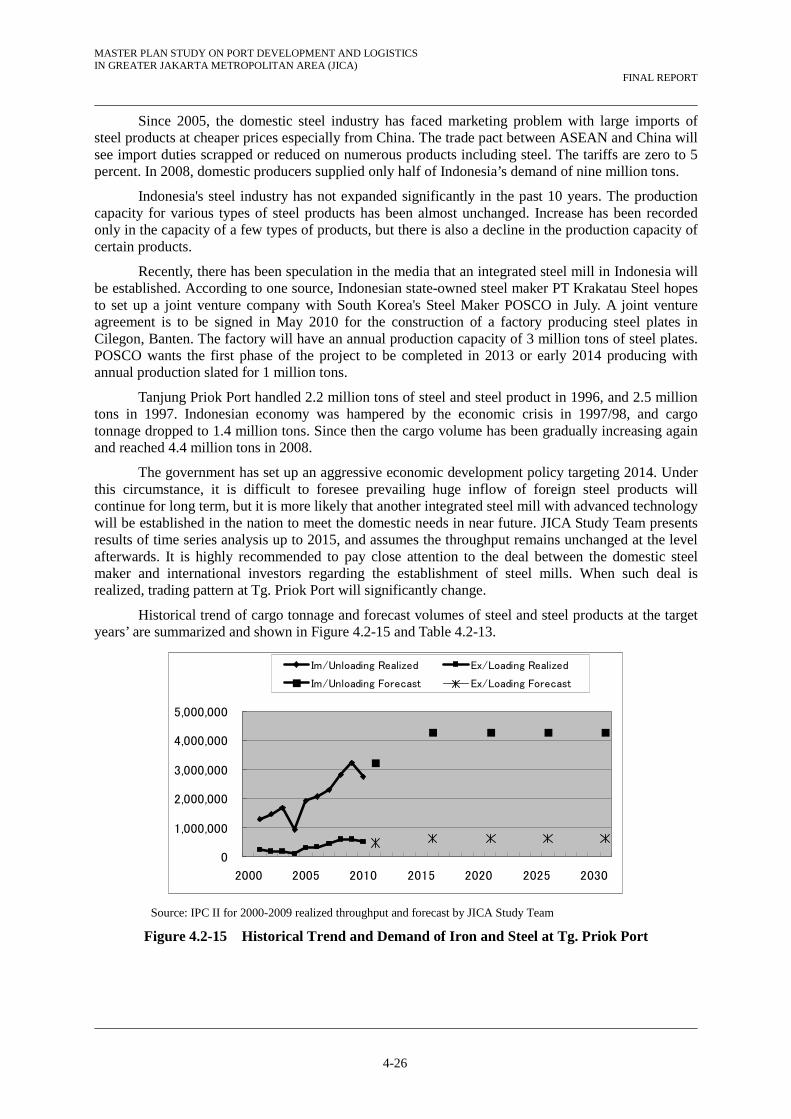
MASTER PLAN STUDY ON PORT DEVELOPMENT AND LOGISTICS IN GREATER JAKARTA METROPOLITAN AREA (JICA)
FINAL REPORT
4-26
Since 2005, the domestic steel industry has faced marketing problem with large imports of steel products at cheaper prices especially from China. The trade pact between ASEAN and China will see import duties scrapped or reduced on numerous products including steel. The tariffs are zero to 5 percent. In 2008, domestic producers supplied only half of Indonesia’s demand of nine million tons.
Indonesia's steel industry has not expanded significantly in the past 10 years. The production capacity for various types of steel products has been almost unchanged. Increase has been recorded only in the capacity of a few types of products, but there is also a decline in the production capacity of certain products.
Recently, there has been speculation in the media that an integrated steel mill in Indonesia will be established. According to one source, Indonesian state-owned steel maker PT Krakatau Steel hopes to set up a joint venture company with South Korea's Steel Maker POSCO in July. A joint venture agreement is to be signed in May 2010 for the construction of a factory producing steel plates in Cilegon, Banten. The factory will have an annual production capacity of 3 million tons of steel plates. POSCO wants the first phase of the project to be completed in 2013 or early 2014 producing with annual production slated for 1 million tons.
Tanjung Priok Port handled 2.2 million tons of steel and steel product in 1996, and 2.5 million tons in 1997. Indonesian economy was hampered by the economic crisis in 1997/98, and cargo tonnage dropped to 1.4 million tons. Since then the cargo volume has been gradually increasing again and reached 4.4 million tons in 2008.
The government has set up an aggressive economic development policy targeting 2014. Under this circumstance, it is difficult to foresee prevailing huge inflow of foreign steel products will continue for long term, but it is more likely that another integrated steel mill with advanced technology will be established in the nation to meet the domestic needs in near future. JICA Study Team presents results of time series analysis up to 2015, and assumes the throughput remains unchanged at the level afterwards. It is highly recommended to pay close attention to the deal between the domestic steel maker and international investors regarding the establishment of steel mills. When such deal is realized, trading pattern at Tg. Priok Port will significantly change.
Historical trend of cargo tonnage and forecast volumes of steel and steel products at the target years’ are summarized and shown in Figure 4.2-15 and Table 4.2-13.
0
1,000,000
2,000,000
3,000,000
4,000,000
5,000,000
2000 2005 2010 2015 2020 2025 2030
Im/Unloading Realized Ex/Loading Realized
Im/Unloading Forecast Ex/Loading Forecast
Source: IPC II for 2000-2009 realized throughput and forecast by JICA Study Team
Figure 4.2-15 Historical Trend and Demand of Iron and Steel at Tg. Priok Port

MASTER PLAN STUDY ON PORT DEVELOPMENT AND LOGISTICS IN GREATER JAKARTA METROPOLITAN AREA (JICA)
FINAL REPORT
4-27
Table 4.2-13 Iron and Steel Throughput at Tg. Priok Port
(Unit: '000 Ton)2000 2005 2008 2009 2015 2020 2025 20301,505 2,399 3,810 3,272 4,291 4,291 4,291 4,291
226 335 591 522 644 644 644 644 1,731 2,734 4,402 3,795 4,935 4,935 4,935 4,935
Im/Unloading Total Ex/Loading Total
Grand Total
Year
Source: IPC II for 2000-2009 realized throughput and forecast by JICA Study Team
(6) Coal
Coal is an energy alternative to petroleum because of relatively low cost. Coal is used for many purposes in Indonesia, particularly electric power (about 65%), cement industries (15%), metallurgy and paper (10%), and also power source for some other industries (10%).
Indonesia’s coal production has increased in recent years, and today the country is one of the world’s chief coal exporters. The country’s coal reserves mainly are located in Sumatra and Kalimantan. In Kalimantan, East Kalimantan Province and South Kalimantan Province are main coal producers in Indonesia.
Indonesia adopted National Coal Policy in January 2004, which seeks to promote the development of the country’s coal resources to meet domestic requirements and to increase coal exports in the long-run. In 2008, 65 million tons of coal were consumed domestically while 160 million tons were exported. Directorate General of Mineral, Coal and Geothermal forecast that export volume of coal will remain at the level of 150 million tons per year and domestic consumption will increase rapidly and reach 220 million tons in 2025. However, the price gap between export and domestic market will have to be addressed.
Coal Production, Domestic Sales and Export (Million Ton)
0
100
200
300
400
500
1995 2000 2005 2010 2015 2020 2025
Production Domestic Export
Source: Directorate of Mineral and Coal Enterprise-“Indonesia Mineral and Coal Statistic 2005
Figure 4.2-16 Indonesia Coal Production, Domestic Sales and Export (Million tons)
Tanjung Priok port has not substantially been handling coal for many years. In 2002, this port unloaded 375, 000 tons of coal. Since then, volume of coal unloaded at the Tanjung Priok port has been increasing rapidly in reflection of the New Coal Policy. It is certain that the demand for coal will continue to grow unless other alternative energy resource comes into existence.

MASTER PLAN STUDY ON PORT DEVELOPMENT AND LOGISTICS IN GREATER JAKARTA METROPOLITAN AREA (JICA)
FINAL REPORT
4-28
In 2009 the Tanjung Priok port unloaded about three million tons of coal, which were mainly used as fuel for cement manufacturing plants in West Java. Indonesia Cement Association revealed the required volume of coal for cement industry up to 2015 (see Table 4.2-14). Compound annual growth rate of required volume of coal during 2009 – 2015 for Indonesia cement industry total is 8.9 percent while that for Holcim cement and Indocement, which have cement manufacturing plants in West Java, is 3.1 percent.
Table 4.2-14 Coal Type in Cement Industry
Cement Company Calory 2009 2010 2011 2012 2013 2014 2015> 6,000 cal 367,359 367,359 149,701 173,071 0 0 0 5,500-6,000 cal 612,266 612,266 748,505 865,355 692,670 692,670 692,670< 5,500 cal 244,906 244,906 598,804 692,284 1,616,230 1,616,230 1,616,230> 6,000 cal 211,644 211,644 5,500-6,000 cal 403,725 406,042 406,042 496,241 594,765< 5,500 cal 57,725 57,725 609,062 609,062 610,800 744,361 892,148> 6,000 cal 207,054 207,054 215,676 244,841 247,368 247,368 247,368 5,500-6,000 cal 483,126 483,126 503,243 856,942 865,787 865,787 865,787< 5,500 cal 0 0 0 122,420 123,684 123,684 123,684> 6,000 cal 0 0 0 0 0 0 0 5,500-6,000 cal 0 0 0 0 0 0 0< 5,500 cal 955,856 955,856 948,855 981,654 1,231,654 1,231,654 1,231,654> 6,000 cal 304,200 304,200 304,200 304,200 304,200 352,950 352,950 5,500-6,000 cal 1,419,600 1,419,600 1,419,600 1,419,600 1,419,600 1,647,100 1,647,100< 5,500 cal 304,200 304,200 304,200 304,200 304,200 352,950 352,950> 6,000 cal 179 179 204 204 204 204 204 5,500-6,000 cal 0 0 0 0 0 222 222< 5,500 cal 0 0 0 0 0 0 0> 6,000 cal 0 0 0 0 0 0 0 5,500-6,000 cal 0 0 320 320 320 640 640< 5,500 cal 0 0 0 0 0 0 0> 6,000 cal 0 0 0 0 0 0 0 5,500-6,000 cal 360 360 360 360 1,200 1,200 1,200< 5,500 cal 0 0 0 0 0 0
Total 5,168,475 5,168,475 6,206,455 6,980,555 7,823,959 8,373,261 8,619,572
PT IndocementTunggal PrakarsaTbk
PT SemenBaturaja
PT SementAndalas Indonesia
PT SemenBosowa Maros
PT Semen Gresik
PT Semen Padang
PT Semen Tonasa
PT HolcimIndonesia
Source: Indonesia Cement Association, 2010
Future coal demand is forecast assuming the same annual growth rate as the cement industry
because main consignees of this commodity at the Tg. Priok port are cement manufacturing companies. Decision of locations where huge volume of coal should be handled involves policy judgment taking into consideration the economy, space planning, and environment and social matters.
Historical trend and future volume of coal in the target years are shown in Figure 4.2-17 and Table 4.2-15.
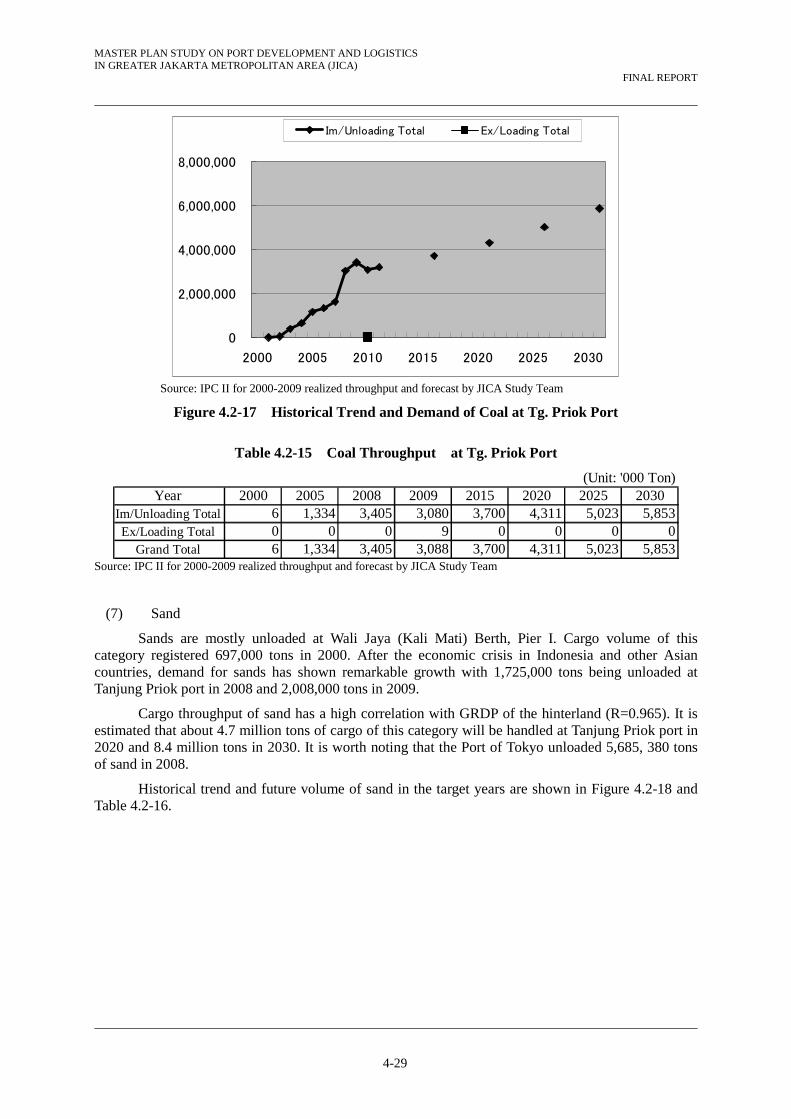
MASTER PLAN STUDY ON PORT DEVELOPMENT AND LOGISTICS IN GREATER JAKARTA METROPOLITAN AREA (JICA)
FINAL REPORT
4-29
0
2,000,000
4,000,000
6,000,000
8,000,000
2000 2005 2010 2015 2020 2025 2030
Im/Unloading Total Ex/Loading Total
Source: IPC II for 2000-2009 realized throughput and forecast by JICA Study Team
Figure 4.2-17 Historical Trend and Demand of Coal at Tg. Priok Port
Table 4.2-15 Coal Throughput at Tg. Priok Port
(Unit: '000 Ton)2000 2005 2008 2009 2015 2020 2025 2030
6 1,334 3,405 3,080 3,700 4,311 5,023 5,8530 0 0 9 0 0 0 06 1,334 3,405 3,088 3,700 4,311 5,023 5,853
Year Im/Unloading Total Ex/Loading Total
Grand Total Source: IPC II for 2000-2009 realized throughput and forecast by JICA Study Team
(7) Sand
Sands are mostly unloaded at Wali Jaya (Kali Mati) Berth, Pier I. Cargo volume of this category registered 697,000 tons in 2000. After the economic crisis in Indonesia and other Asian countries, demand for sands has shown remarkable growth with 1,725,000 tons being unloaded at Tanjung Priok port in 2008 and 2,008,000 tons in 2009.
Cargo throughput of sand has a high correlation with GRDP of the hinterland (R=0.965). It is estimated that about 4.7 million tons of cargo of this category will be handled at Tanjung Priok port in 2020 and 8.4 million tons in 2030. It is worth noting that the Port of Tokyo unloaded 5,685, 380 tons of sand in 2008.
Historical trend and future volume of sand in the target years are shown in Figure 4.2-18 and Table 4.2-16.

MASTER PLAN STUDY ON PORT DEVELOPMENT AND LOGISTICS IN GREATER JAKARTA METROPOLITAN AREA (JICA)
FINAL REPORT
4-30
0
1,000
2,000
3,000
4,000
5,000
6,000
7,000
8,000
9,000
1990 1995 2000 2005 2010 2015 2020 2025 2030
( '0
00)
Realized Forecast
Source: IPC II for 2000-2009 realized throughput and forecast by JICA Study Team
Figure 4.2-18 Historical Trend and Demand of Sand at Tg. Priok Port
Table 4.2-16 Sand Throughput at Tg. Priok Port
(Unit: '000 Ton)2000 2005 2008 2009 2015 2020 2025 2030
697 1,413 1,725 2,008 3,351 4,700 6,290 8,417 - - - 44 - - - -
697 1,413 1,725 2,052 3,351 4,700 6,290 8,417
Year Im/Unloading Total
Ex/Loading Total
Grand Total (Remarks; Port of Tokyo unloaded 5,685,380 tons of sand in 2008.) Source: IPC II for 2000-2009 realized throughput and forecast by JICA Study Team
(8) Forest Product
“Forest Product” is, in these cargo statistics, a generic name of a class of port cargo, and consists of log, lumber, timber, plywood, fire board, pulp, and even paper and roll tissue are included in this category. Therefore, “Forest Product” includes not only raw materials, but also manufactured goods.
Percentage of “paper” in this category has been declining for the past years. During 1990 to 2002, more than 200,000 tons of paper was loaded and unloaded at Tanjung Priok port per year, but presently cargo volume of paper is only 10,000 tons.
On the contrary, pulp is the leading commodity of this class and amounts to nearly one million tons. About three quarters of the total throughput of the pulp are coming through interisland trade, and its manufactured products are mostly consumed domestically.
Figure 4.2-19 shows historical trend of “Forest Product” throughput at the Tg. Priok port, and reveals that volume of cargo has not significantly changed but has been rather stable by remaining in the range of between 1.0 and 1.5 million ton. It is likely that cargo volume will remain in the same range unless manufacturing capacity is increased.
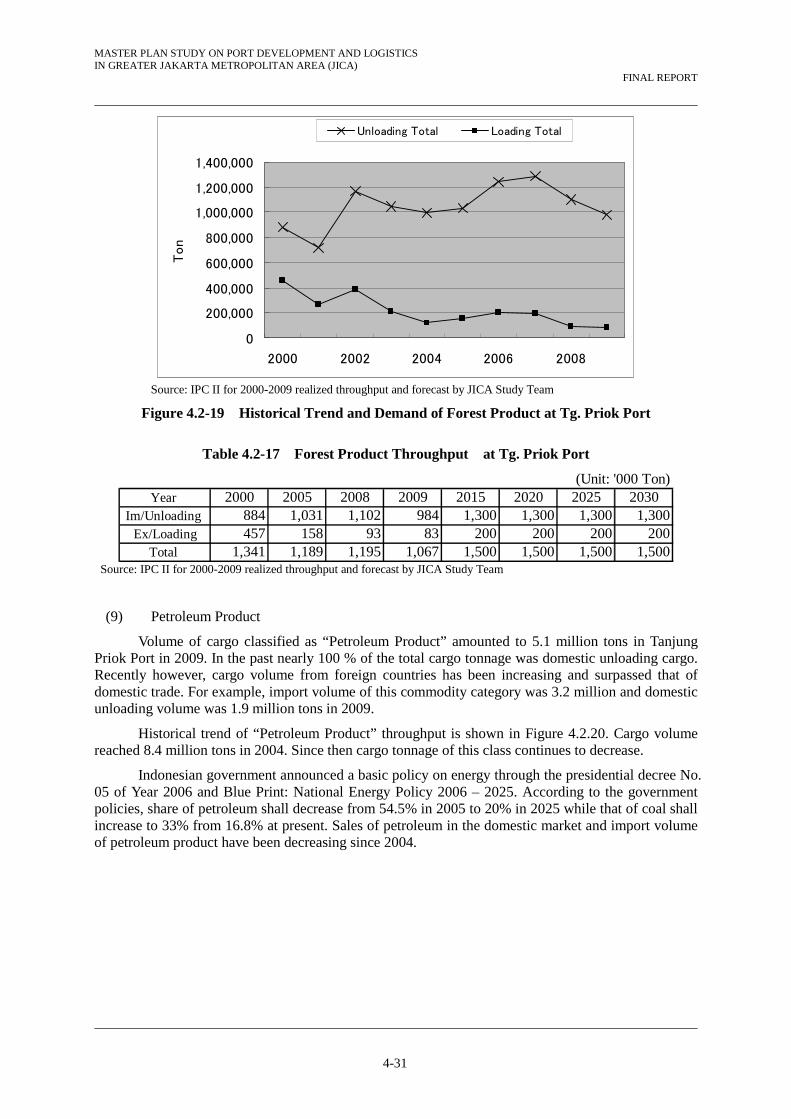
MASTER PLAN STUDY ON PORT DEVELOPMENT AND LOGISTICS IN GREATER JAKARTA METROPOLITAN AREA (JICA)
FINAL REPORT
4-31
0
200,000
400,000
600,000
800,000
1,000,000
1,200,000
1,400,000
2000 2002 2004 2006 2008
Ton
Unloading Total Loading Total
Source: IPC II for 2000-2009 realized throughput and forecast by JICA Study Team
Figure 4.2-19 Historical Trend and Demand of Forest Product at Tg. Priok Port
Table 4.2-17 Forest Product Throughput at Tg. Priok Port
(Unit: '000 Ton)2000 2005 2008 2009 2015 2020 2025 2030
884 1,031 1,102 984 1,300 1,300 1,300 1,300457 158 93 83 200 200 200 200
1,341 1,189 1,195 1,067 1,500 1,500 1,500 1,500
Year Im/Unloading
Ex/LoadingTotal
Source: IPC II for 2000-2009 realized throughput and forecast by JICA Study Team
(9) Petroleum Product
Volume of cargo classified as “Petroleum Product” amounted to 5.1 million tons in Tanjung Priok Port in 2009. In the past nearly 100 % of the total cargo tonnage was domestic unloading cargo. Recently however, cargo volume from foreign countries has been increasing and surpassed that of domestic trade. For example, import volume of this commodity category was 3.2 million and domestic unloading volume was 1.9 million tons in 2009.
Historical trend of “Petroleum Product” throughput is shown in Figure 4.2.20. Cargo volume reached 8.4 million tons in 2004. Since then cargo tonnage of this class continues to decrease.
Indonesian government announced a basic policy on energy through the presidential decree No. 05 of Year 2006 and Blue Print: National Energy Policy 2006 – 2025. According to the government policies, share of petroleum shall decrease from 54.5% in 2005 to 20% in 2025 while that of coal shall increase to 33% from 16.8% at present. Sales of petroleum in the domestic market and import volume of petroleum product have been decreasing since 2004.
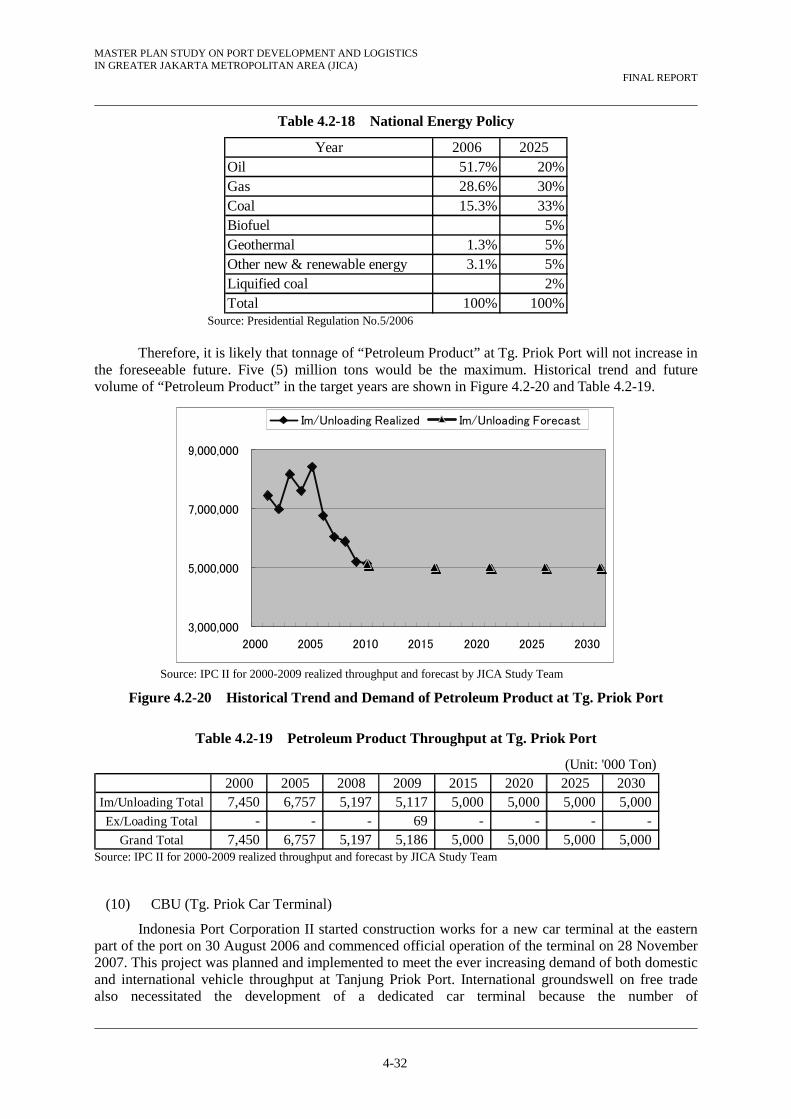
MASTER PLAN STUDY ON PORT DEVELOPMENT AND LOGISTICS IN GREATER JAKARTA METROPOLITAN AREA (JICA)
FINAL REPORT
4-32
Table 4.2-18 National Energy Policy
Year 2006 2025Oil 51.7% 20%Gas 28.6% 30%Coal 15.3% 33%Biofuel 5%Geothermal 1.3% 5%Other new & renewable energy 3.1% 5%Liquified coal 2%Total 100% 100%
Source: Presidential Regulation No.5/2006
Therefore, it is likely that tonnage of “Petroleum Product” at Tg. Priok Port will not increase in the foreseeable future. Five (5) million tons would be the maximum. Historical trend and future volume of “Petroleum Product” in the target years are shown in Figure 4.2-20 and Table 4.2-19.
3,000,000
5,000,000
7,000,000
9,000,000
2000 2005 2010 2015 2020 2025 2030
Im/Unloading Realized Im/Unloading Forecast
Source: IPC II for 2000-2009 realized throughput and forecast by JICA Study Team
Figure 4.2-20 Historical Trend and Demand of Petroleum Product at Tg. Priok Port
Table 4.2-19 Petroleum Product Throughput at Tg. Priok Port
(Unit: '000 Ton)2000 2005 2008 2009 2015 2020 2025 20307,450 6,757 5,197 5,117 5,000 5,000 5,000 5,000
- - - 69 - - - - 7,450 6,757 5,197 5,186 5,000 5,000 5,000 5,000
Im/Unloading Total
Ex/Loading Total
Grand Total Source: IPC II for 2000-2009 realized throughput and forecast by JICA Study Team
(10) CBU (Tg. Priok Car Terminal)
Indonesia Port Corporation II started construction works for a new car terminal at the eastern part of the port on 30 August 2006 and commenced official operation of the terminal on 28 November 2007. This project was planned and implemented to meet the ever increasing demand of both domestic and international vehicle throughput at Tanjung Priok Port. International groundswell on free trade also necessitated the development of a dedicated car terminal because the number of
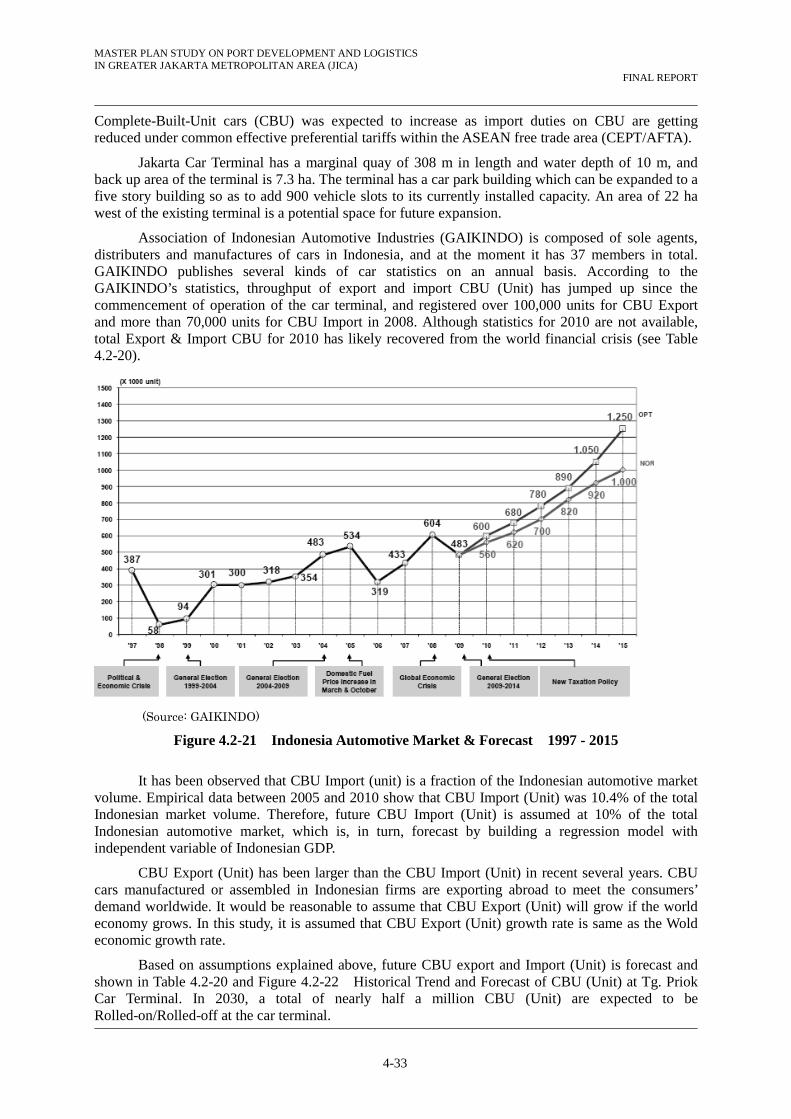
MASTER PLAN STUDY ON PORT DEVELOPMENT AND LOGISTICS IN GREATER JAKARTA METROPOLITAN AREA (JICA)
FINAL REPORT
4-33
Complete-Built-Unit cars (CBU) was expected to increase as import duties on CBU are getting reduced under common effective preferential tariffs within the ASEAN free trade area (CEPT/AFTA).
Jakarta Car Terminal has a marginal quay of 308 m in length and water depth of 10 m, and back up area of the terminal is 7.3 ha. The terminal has a car park building which can be expanded to a five story building so as to add 900 vehicle slots to its currently installed capacity. An area of 22 ha west of the existing terminal is a potential space for future expansion.
Association of Indonesian Automotive Industries (GAIKINDO) is composed of sole agents, distributers and manufactures of cars in Indonesia, and at the moment it has 37 members in total. GAIKINDO publishes several kinds of car statistics on an annual basis. According to the GAIKINDO’s statistics, throughput of export and import CBU (Unit) has jumped up since the commencement of operation of the car terminal, and registered over 100,000 units for CBU Export and more than 70,000 units for CBU Import in 2008. Although statistics for 2010 are not available, total Export & Import CBU for 2010 has likely recovered from the world financial crisis (see Table 4.2-20).
(Source: GAIKINDO)
Figure 4.2-21 Indonesia Automotive Market & Forecast 1997 - 2015
It has been observed that CBU Import (unit) is a fraction of the Indonesian automotive market volume. Empirical data between 2005 and 2010 show that CBU Import (Unit) was 10.4% of the total Indonesian market volume. Therefore, future CBU Import (Unit) is assumed at 10% of the total Indonesian automotive market, which is, in turn, forecast by building a regression model with independent variable of Indonesian GDP.
CBU Export (Unit) has been larger than the CBU Import (Unit) in recent several years. CBU cars manufactured or assembled in Indonesian firms are exporting abroad to meet the consumers’ demand worldwide. It would be reasonable to assume that CBU Export (Unit) will grow if the world economy grows. In this study, it is assumed that CBU Export (Unit) growth rate is same as the Wold economic growth rate.
Based on assumptions explained above, future CBU export and Import (Unit) is forecast and shown in Table 4.2-20 and Figure 4.2-22 Historical Trend and Forecast of CBU (Unit) at Tg. Priok Car Terminal. In 2030, a total of nearly half a million CBU (Unit) are expected to be Rolled-on/Rolled-off at the car terminal.
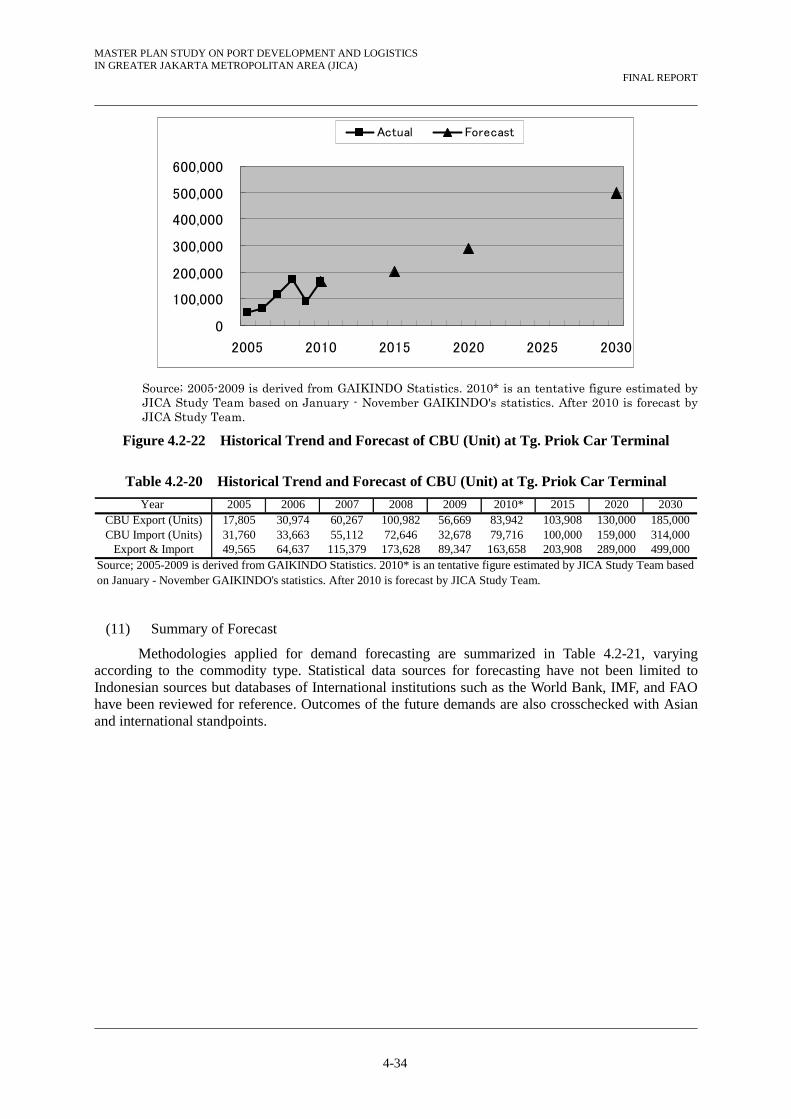
MASTER PLAN STUDY ON PORT DEVELOPMENT AND LOGISTICS IN GREATER JAKARTA METROPOLITAN AREA (JICA)
FINAL REPORT
4-34
0
100,000
200,000
300,000
400,000
500,000
600,000
2005 2010 2015 2020 2025 2030
Actual Forecast
Source; 2005-2009 is derived from GAIKINDO Statistics. 2010* is an tentative figure estimated by JICA Study Team based on January - November GAIKINDO's statistics. After 2010 is forecast by JICA Study Team.
Figure 4.2-22 Historical Trend and Forecast of CBU (Unit) at Tg. Priok Car Terminal
Table 4.2-20 Historical Trend and Forecast of CBU (Unit) at Tg. Priok Car Terminal
Year 2005 2006 2007 2008 2009 2010* 2015 2020 2030CBU Export (Units) 17,805 30,974 60,267 100,982 56,669 83,942 103,908 130,000 185,000CBU Import (Units) 31,760 33,663 55,112 72,646 32,678 79,716 100,000 159,000 314,000
Export & Import 49,565 64,637 115,379 173,628 89,347 163,658 203,908 289,000 499,000Source; 2005-2009 is derived from GAIKINDO Statistics. 2010* is an tentative figure estimated by JICA Study Team basedon January - November GAIKINDO's statistics. After 2010 is forecast by JICA Study Team.
(11) Summary of Forecast
Methodologies applied for demand forecasting are summarized in Table 4.2-21, varying according to the commodity type. Statistical data sources for forecasting have not been limited to Indonesian sources but databases of International institutions such as the World Bank, IMF, and FAO have been reviewed for reference. Outcomes of the future demands are also crosschecked with Asian and international standpoints.

MASTER PLAN STUDY ON PORT DEVELOPMENT AND LOGISTICS IN GREATER JAKARTA METROPOLITAN AREA (JICA)
FINAL REPORT
4-35
Table 4.2-21 Methodology Employed for Commodity-wise Demand Forecasting
Commodity Methodology
Cement and Clinker
Domestic sales up to 2015 is based on Indonesia Cement Association's forecast. For 2016-2-30,regressed against construction sector’s GDP and Dummy variable. Cement production capacityprojection is based on Indonesia Cement Association's forecast. Export of cement/clinker isassumed at 5% of the production capacity. Tg Priok Port will handle 50% of national export. Inter-island trade is forecast in cosideration of actual ratio against the volume of domestic sales.
WheatIndonesian wheat import volume is regressed against total population in Indonesia. It is set thattotal wheat tonnage handled at the Tanjung Priok Port is equal to 50 % of the Indonesian importof wheat.
Crude Palm Oil Regressed against hinterland population. 10% of Im/Unloading will be Ex/Loading volume.
Iron and SteelTime series analysis until 2015, and assume the throughput remains unchanged at the 2015 levelafterwards.
Coal Coals fired at cement industries in the hinterland are expected to grow at 3.1% per year.
Sand Regressed against Hinterland GRDP.
Forest Product Largest volume in the past
Petroleum Product Tonnage has been decreasing since 2004. Five million tons will be at most.
CBU (Car)CBU import is set at 10% of Indonesia automotive market volume, which is regressed by domesticGDP. Growth rate of CBU export is same as that of World's GDP.
(Source: JICA Study Team)
Results of the demand forecast for Non-container major cargoes, which correspond to the basic case, are summarized in Table 4.2-22.

MASTER PLAN STUDY ON PORT DEVELOPMENT AND LOGISTICS IN GREATER JAKARTA METROPOLITAN AREA (JICA)
FINAL REPORT
4-36
Table 4.2-22 Summary of Demand Forecast by Major Commodity
(Unit: ' 000 Ton)Commodity Trade Type 2009 2015 2020 2025 2030
Im/Unloading Total 795 983 1,304 1,716 2,266Ex/Loading Total 3,215 3,602 4,541 5,713 7,218Grand Total 4,009 4,584 5,845 7,428 9,484Im/Unloading Total 1,919 2,756 3,058 3,333 3,589Ex/Loading Total 23 0 0 0 0
Grand Total 1,942 2,756 3,058 3,333 3,589Im/Unloading Total 1,481 1,713 1,877 2,032 2,176Ex/Loading Total 45 171 188 203 218
Grand Total 1,526 1,884 2,065 2,235 2,393Im/Unloading Total 3,272 4,291 4,291 4,291 4,291Ex/Loading Total 522 644 644 644 644
Grand Total 3,795 4,935 4,935 4,935 4,935Im/Unloading Total 3,080 3,700 4,311 5,023 5,853Ex/Loading Total 9 0 0 0 0
Grand Total 3,088 3,700 4,311 5,023 5,853Im/Unloading Total 2,008 3,351 4,700 6,290 8,417Ex/Loading Total 44 0 0 0 0
Grand Total 2,052 3,351 4,700 6,290 8,417Im/Unloading Total 984 1,300 1,300 1,300 1,300Ex/Loading Total 83 200 200 200 200
Grand Total 1,067 1,500 1,500 1,500 1,500Im/Unloading Total 5,117 5,000 5,000 5,000 5,000Ex/Loading Total 69 0 0 0 0
Grand Total 5,186 5,000 5,000 5,000 5,000CBU Import (Unit) 32,678 100,000 159,000 235,000 314,000CBU Export (Unit) 56,669 103,908 130,000 155,000 185,000
Grand Total 89,347 203,908 289,000 390,000 499,000(Source: JICA Study Team)
CBU (Car)
Coal
Sand
Forest Product
PetroleumProduct
Cement &Clinker
Wheat
Crude Palm Oil
Iron and Steel
4.3 Estimate of Cargo Handling Capacity of Tanjung Priok Port
4.3.1 General
The capacity of the existing port facilities for container-handling at Tanjung Priok Port has been estimated so as to plan the new container terminal which will receive the excess once current capacity at the existing facilities is reached.
The estimation has been divided into two steps. Firstly, the capacity for handling international containers at JCT has been estimated. Then, the capacity for handling domestic containers at conventional wharf areas containing the island wharf, the first wharf, the second wharf and the third wharf has been estimated.
In this estimation, according to Pelindo II plan, it is assumed that JICT II and MTI will be converted from international container terminals into domestic container terminals.
4.3.2 International Containers
(1) Berthing Capacity
JCT comprising JICT I-North, JICT I-West, KOJA and MAL has 9 berths in total. According to the berthing records in 2009, the following conditions have been assumed:
JICT I-North, KOJA and MAL (6B) Gross container handling productivity 63 boxes/hr/vessel Average lot per vessel 1,270 boxes/vessel

MASTER PLAN STUDY ON PORT DEVELOPMENT AND LOGISTICS IN GREATER JAKARTA METROPOLITAN AREA (JICA)
FINAL REPORT
4-37
Average berthing time 20 hr/vessel Weekly service 5 services/week
Total Capacity 2,971,000 TEUs/year JICT I-West (3B)
Gross container handling productivity 42 boxes/hr/vessel Average lot per vessel 840 boxes/vessel Average berthing time 20 hr/vessel Weekly service 5 services/week
Total Capacity 983,000 TEUs/year From the above, their total capacity has been estimated as 4 million TEUs per annum. In addition, the capacity of JICT II and MTI has been estimated as 900,000 TEUs in total
before the conversion from international containers to domestic container terminals. Thus total capacity has been estimated as 4.9 million According to the demand forecast, capacity will be reached in 2014.
(2) Storage Capacity
Container dwelling conditions of JCT have been identified using a computer simulation model assuming the above-mentioned 4 million TEU containers are handled in a year and assuming weekly services are provided (see Figure 4.3-1)
0
2000
4000
6000
8000
10000
12000
14000
16000
18000
20000
50 70 90 110 130 150 170 190 210 230 250
Days
Empty Containers
Import Containers
Export Containers
TEU
s
Source: JICA Study Team
Figure 4.3-1 Container Dwelling at Container Yard
According to the result shown in Figure 4.3-1, the total container storage capacity corresponding to 4 million TEUs handled in a year is as follows:
- Import containers: 18,000 TEUs - Export containers: 12,000 TEUs - Empty containers: 4,000 TEUs

MASTER PLAN STUDY ON PORT DEVELOPMENT AND LOGISTICS IN GREATER JAKARTA METROPOLITAN AREA (JICA)
FINAL REPORT
4-38
Thus, required storage capacity has been estimated as 34,000 TEUs.
On the other hand, the ground slots of the existing container yards including the yard under expansion are as follows:
- JICT: 10,000 ground slots - KOJA: 6,200 ground slots - MAL: 1,000 ground slots
Thus, the total ground slots of JCT are 17,200. Assuming 4 high stacking and operational factor of 0.75, the total storage capacity has been estimated as 52,000 TEUs, and exceeds the required capacity mentioned above. Hence, the required capacity has been determined by the berthing capacity.
4.3.3 Domestic Containers
Domestic containers are handled at the conventional berths where conventional cargoes such as cement, CPO and steel products are also handled. Hence, the analysis of seaside capacity for handling both domestic containers and conventional cargoes at the existing Tanjung Priok Port has been conducted by using a computer simulation model. The seaside capacity is determined by the combination of the capacities of access channel and berths themselves. The shortage of capacity at berths with high berth occupancy rate causes offshore waiting for certain ships. Additionally, the shortage of access channel capacity also causes offshore waiting for all calling ships.
As to the seaside capacity covering simultaneously both access channel and berths, there are two categories. One is adequate capacity to keep a service level for a calling vessel at a port (hereinafter referred to as “the adequate seaside capacity”). The service level is expressed as the percentage of an offshore waiting time to the turnaround time from arrival to departure of a vessel at a port excluding ship off-shore waiting time. The figure of around 10% is generally used as the adequate service level, and is adopted in this study.
The other is the capacity that enables the number of vessels receivable at berths to be maximized during a certain period (one year), in which offshore ship waiting is on the verge of sharply increasing (hereinafter referred to as “the absolute seaside capacity”).
- Berths
The berth conditions as shown in Table 4.3.1 have been used. JICT II and MTI have been assumed to be converted to domestic containers
- Cargo-handling Productivities
Actual cargo-handling productivities have been applied.
- Vessel arrival pattern
Both a random arrival pattern for conventional cargoes and regular arrival schedules for container cargoes have been applied.
- Breakwater and basins
It has been assumed that the on-going project to move the breakwater and to dredge in front of JCT will be completed in terms of navigational conditions.
- Access Channel
It has been assumed that the access channel will be widened to two-way channel according to Pelindo II Plan. Inside the port, access channel is used for turning basins, and hence, when a vessel is turning, the other vessel cannot navigate. Those navigational and maneuvering conditions have been considered in the simulation.
According to the results of the simulation, in 2019 the service level will be 20% with an average off-shore waiting of 8 hours per vessel which satisfies the adequate

MASTER PLAN STUDY ON PORT DEVELOPMENT AND LOGISTICS IN GREATER JAKARTA METROPOLITAN AREA (JICA)
FINAL REPORT
4-39
service level. Then in the next year, 2020, the service level will jump to 113% with an average off-shore waiting of 45 hours per vessel which does not satisfy the adequate service level. Hence, it has been judged that the saturation year will be 2019 and consequently the adequate capacity has been estimated as the volume in 2019, viz. 2.1 million TEUs of containers.
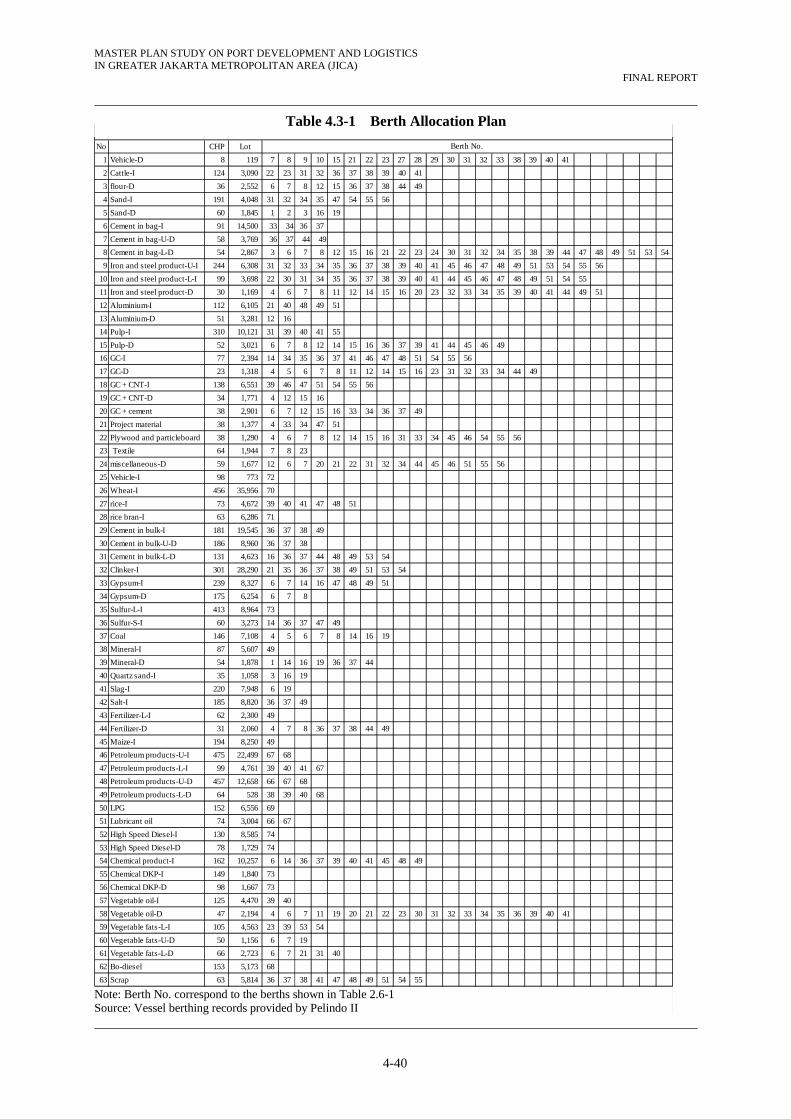
MASTER PLAN STUDY ON PORT DEVELOPMENT AND LOGISTICS IN GREATER JAKARTA METROPOLITAN AREA (JICA)
FINAL REPORT
4-40
Table 4.3-1 Berth Allocation Plan
No CHP Lot
1 Vehicle-D 8 119 7 8 9 10 15 21 22 23 27 28 29 30 31 32 33 38 39 40 41
2 Cattle-I 124 3,090 22 23 31 32 36 37 38 39 40 41
3 flour-D 36 2,552 6 7 8 12 15 36 37 38 44 49
4 Sand-I 191 4,048 31 32 34 35 47 54 55 56
5 Sand-D 60 1,845 1 2 3 16 19
6 Cement in bag-I 91 14,500 33 34 36 37
7 Cement in bag-U-D 58 3,769 36 37 44 49
8 Cement in bag-L-D 54 2,867 3 6 7 8 12 15 16 21 22 23 24 30 31 32 34 35 38 39 44 47 48 49 51 53 54
9 Iron and steel product-U-I 244 6,308 31 32 33 34 35 36 37 38 39 40 41 45 46 47 48 49 51 53 54 55 56
10 Iron and steel product-L-I 99 3,698 22 30 31 34 35 36 37 38 39 40 41 44 45 46 47 48 49 51 54 55
11 Iron and steel product-D 30 1,169 4 6 7 8 11 12 14 15 16 20 23 32 33 34 35 39 40 41 44 49 51
12 Aluminium-I 112 6,105 21 40 48 49 51
13 Aluminium-D 51 3,281 12 16
14 Pulp-I 310 10,121 31 39 40 41 55
15 Pulp-D 52 3,021 6 7 8 12 14 15 16 36 37 39 41 44 45 46 49
16 GC-I 77 2,394 14 34 35 36 37 41 46 47 48 51 54 55 56
17 GC-D 23 1,318 4 5 6 7 8 11 12 14 15 16 23 31 32 33 34 44 49
18 GC + CNT-I 138 6,551 39 46 47 51 54 55 56
19 GC + CNT-D 34 1,771 4 12 15 16
20 GC + cement 38 2,901 6 7 12 15 16 33 34 36 37 49
21 Project material 38 1,377 4 33 34 47 51
22 Plywood and particleboard 38 1,290 4 6 7 8 12 14 15 16 31 33 34 45 46 54 55 56
23 Textile 64 1,944 7 8 23
24 miscellaneous-D 59 1,677 12 6 7 20 21 22 31 32 34 44 45 46 51 55 56
25 Vehicle-I 98 773 72
26 Wheat-I 456 35,956 70
27 rice-I 73 4,672 39 40 41 47 48 51
28 rice bran-I 63 6,286 71
29 Cement in bulk-I 181 19,545 36 37 38 49
30 Cement in bulk-U-D 186 8,960 36 37 38
31 Cement in bulk-L-D 131 4,623 16 36 37 44 48 49 53 54
32 Clinker-I 301 28,290 21 35 36 37 38 49 51 53 54
33 Gypsum-I 239 8,327 6 7 14 16 47 48 49 51
34 Gypsum-D 175 6,254 6 7 8
35 Sulfur-L-I 413 8,964 73
36 Sulfur-S-I 60 3,273 14 36 37 47 49
37 Coal 146 7,108 4 5 6 7 8 14 16 19
38 Mineral-I 87 5,607 49
39 Mineral-D 54 1,878 1 14 16 19 36 37 44
40 Quartz sand-I 35 1,058 3 16 19
41 Slag-I 220 7,948 6 19
42 Salt-I 185 8,820 36 37 49
43 Fertilizer-L-I 62 2,300 49
44 Fertilizer-D 31 2,060 4 7 8 36 37 38 44 49
45 Maize-I 194 8,250 49
46 Petroleum products-U-I 475 22,499 67 68
47 Petroleum products-L-I 99 4,761 39 40 41 67
48 Petroleum products-U-D 457 12,658 66 67 68
49 Petroleum products-L-D 64 528 38 39 40 68
50 LPG 152 6,556 69
51 Lubricant oil 74 3,004 66 67
52 High Speed Diesel-I 130 8,585 74
53 High Speed Diesel-D 78 1,729 74
54 Chemical product-I 162 10,257 6 14 36 37 39 40 41 45 48 49
55 Chemical DKP-I 149 1,840 73
56 Chemical DKP-D 98 1,667 73
57 Vegetable oil-I 125 4,470 39 40
58 Vegetable oil-D 47 2,194 4 6 7 11 19 20 21 22 23 30 31 32 33 34 35 36 39 40 41
59 Vegetable fats-L-I 105 4,563 23 39 53 54
60 Vegetable fats-U-D 50 1,156 6 7 19
61 Vegetable fats-L-D 66 2,723 6 7 21 31 40
62 Bo-diesel 153 5,173 68
63 Scrap 63 5,814 36 37 38 41 47 48 49 51 54 55
Berth No.
Note: Berth No. correspond to the berths shown in Table 2.6-1 Source: Vessel berthing records provided by Pelindo II

MASTER PLAN STUDY ON PORT DEVELOPMENT AND LOGISTICS IN GREATER JAKARTA METROPOLITAN AREA (JICA)
FINAL REPORT
4-41
0
20
40
60
80
100
120
140
160
180
200
0 50 100 150 200 250 300 350
Off
hor
e W
aiti
ng S
hip
No
Days
Fig. 4.3.2 Estimated Number of Off-shore Waiting Ships at Tanjung Priok Port
2020
2021
2015
Source: JICA Study Team
Figure 4.3-2 Estimated Number of Off-shore Waiting Ships at Tanjung Priok Port
4.4 Estimate of Traffic Capacities of the Existing Roads and Railway
4.4.1 Traffic condition on toll road
(1) Current condition
1) Jakarta Metropolitan Area
The transportation system in Jakarta Metropolitan Area is facing a serious traffic congestion problem. Despite being 6 lanes on JIUT and JORR, the vehicle/capacity ratio as of April 2010 is beyond 0.8 in most sections. In addition, there are bottleneck points in which the queue from the on and off ramp prevent the smooth flow of traffic on the main carriageway.
The vehicle/capacity ratio of each section on the toll road is as follows.

MASTER PLAN STUDY ON PORT DEVELOPMENT AND LOGISTICS IN GREATER JAKARTA METROPOLITAN AREA (JICA)
FINAL REPORT
4-42
Source: Jasa Marga
Figure 4.4-1 V/C ratio on toll road in April 2010
>1.0
1.0 – 0.8
<0.8

MASTER PLAN STUDY ON PORT DEVELOPMENT AND LOGISTICS IN GREATER JAKARTA METROPOLITAN AREA (JICA)
FINAL REPORT
4-43
Table 4.4-1 V/C ratio on toll road in April 2010
No TOL ROAD LINK Length (Km)
Number of lane V/C Ratio From JKT To JKT From JKT To JKT
I JAGORAWI 1 Cililitan –TMII 5.00 4 4 1.08 1.02 2 TMII – Pasar Rebo 1.80 3 3 1.19 1.17 3 Pasar Rebo – Cibubur 6.70 3 3 1.00 1.34 4 Cibubur – Cimanggis 5.50 3 3 0.88 0.93 5 Cimanggis – Gunung Putri 4.50 3 3 0.80 0.84 6 Gunung Putri – Cibinong 3.00 3 3 0.79 0.83 7 Cibinong – Sentul Utara 6.00 3 3 0.70 0.73 8 Sentul Utara – Sentul Selatan 4.00 3 3 0.66 0.66 9 Sentul Selatan – Bogor IC 3.50 3 3 0.56 0.55 10 Bogor IC – Ciawi 7.00 2 2 0.53 0.57 11 Bogor IC – Bogor 3.00 2 2 0.55 0.55 II JAKARTA – CIKAMPEK 1 Cawang – Pd Gede Barat 4.50 4 4 0.99 0.94 2 Pd Gede Barat – Pd Gede Timur 4.00 4 4 0.83 0.81 3 Pd Gede Timur – Cikunir IC 1.50 4 4 0.67 0.65 4 Cikunir IC – Bekasi Barat 4.00 4 4 0.95 0.96 5 Bekasi Barat – Bekasi Timur 3.00 4 4 0.85 0.85 6 Bekasi Timur – Tambun 4.70 4 4 0.79 0.79 7 Tambun – Cibitung 2.30 4 4 0.74 0.74 8 Cibitung – Cikarang 6.00 3 3 0.84 0.84 9 Cikarang – Cikarang Timur 5.50 3 3 0.62 0.62 10 Cikarang Timur – Karawang Barat 10.50 3 3 0.60 0.60 11 Karawang Barat – Karawang Timur 7.70 3 3 0.67 0.66 12 Karawang Timur – Dawuan IC 12.30 3 3 0.59 0.58 13 Dawuan IC – Kalihurip 1.00 2 2 0.38 0.41 14 Kalihurip – Cikampek 5.50 2 2 0.29 0.31 III JAKARTA – TANGERANG Link 1 Tomang – Kebon Jeruk 3.60 3 3 1.20 0.79 2 Kebon Jeruk – Meruya 2.50 3 3 0.72 0.81 3 Meruya – Kembangan 3.00 3 3 0.73 0.63 4 Kembangan – Tangerang 10.00 3 3 0.73 0.74 5 Tangerang – Karawaci 2.00 3 3 0.65 0.67 6 Karawaci – Tangerang Barat 5.70 3 3 0.45 0.47 Ruas ULUJAMI – SERPONG 1 IC Ulujami – Bintaro 3.00 3 3 0.47 0.54 2 Bintaro – Pondok Ranji 2.50 3 3 0.65 0.67 IV CAWANG TOMANG CENGKARENG 1 Cawang IC – Ciliwung 2.00 3 3 1.07 1.07 2 Ciliwung – Tebet 1.10 3 3 1.18 1.18 3 Tebet – Pancoran 1.10 3 3 1.11 1.08 4 Pancoran – Kuningan2 0.60 3 3 1.21 1.20 5 Kuningan2 – Kuningan 1 1.50 3 3 1.04 1.04 6 Kuningan 1 – Semanggi 1.45 3 3 1.10 1.04 7 Semanggi – Senayan 1.25 3 3 0.86 0.85 8 Senayan – Pejompongan 0.70 3 3 1.01 1.03 9 Pejompongan – Slipi 1 1.30 3 3 0.84 0.95 10 Slipi 1 – Slipi 2 0.10 3 3 0.98 0.95 11 Slipi 2 – Tomang IC 0.90 3 3 0.87 0.98 12 Tomang IC – Grogol 1.50 3 3 0.52 0.58 13 Grogol – Jelambar 2.40 3 3 0.34 0.74 14 Jelambar – Angke 2.10 3 3 0.48 0.68 15 Angke – Pluit IC 1.00 3 3 0.55 0.67 16 Pluit IC – Pluit 1.20 3 3 0.40 0.70 17 Pluit – Kapuk 1.80 3 3 0.39 0.70 18 Kapuk – Cengkareng Junction 3.60 4 4 0.38 0.38 19 Cengkareng Junction – Bandara 5.60 2 2 0.55 0.55
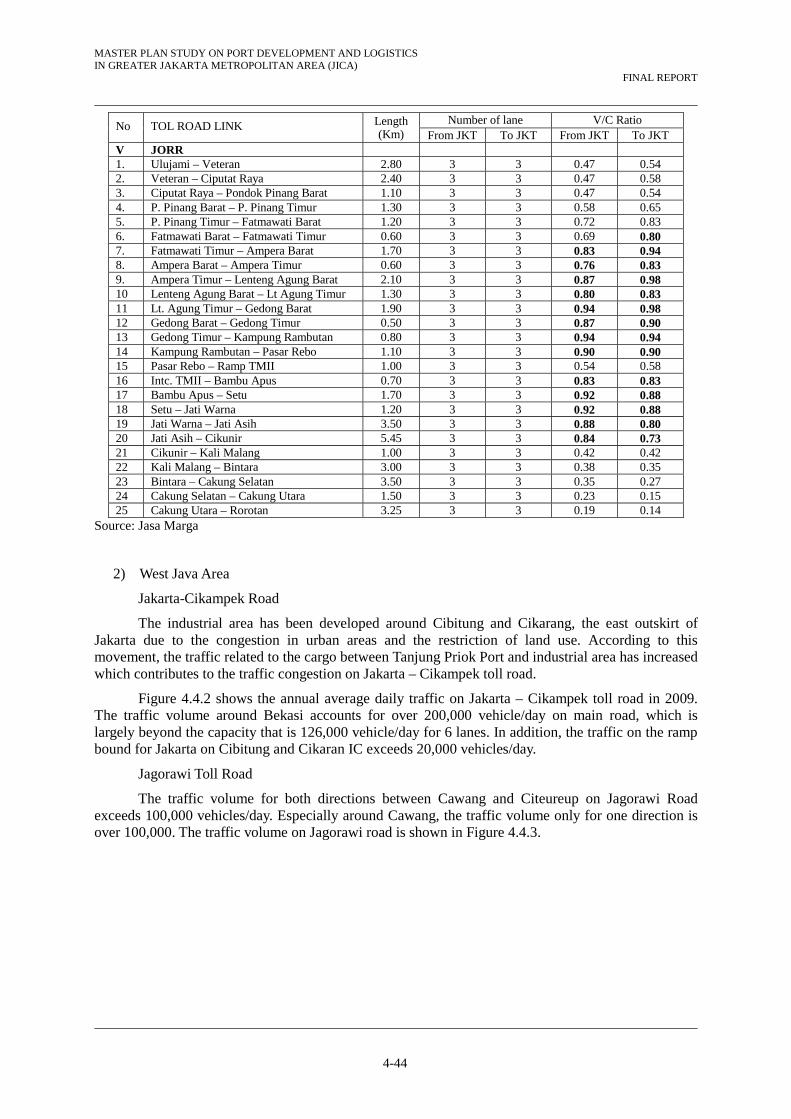
MASTER PLAN STUDY ON PORT DEVELOPMENT AND LOGISTICS IN GREATER JAKARTA METROPOLITAN AREA (JICA)
FINAL REPORT
4-44
No TOL ROAD LINK Length (Km)
Number of lane V/C Ratio From JKT To JKT From JKT To JKT
V JORR 1. Ulujami – Veteran 2.80 3 3 0.47 0.54 2. Veteran – Ciputat Raya 2.40 3 3 0.47 0.58 3. Ciputat Raya – Pondok Pinang Barat 1.10 3 3 0.47 0.54 4. P. Pinang Barat – P. Pinang Timur 1.30 3 3 0.58 0.65 5. P. Pinang Timur – Fatmawati Barat 1.20 3 3 0.72 0.83 6. Fatmawati Barat – Fatmawati Timur 0.60 3 3 0.69 0.80 7. Fatmawati Timur – Ampera Barat 1.70 3 3 0.83 0.94 8. Ampera Barat – Ampera Timur 0.60 3 3 0.76 0.83 9. Ampera Timur – Lenteng Agung Barat 2.10 3 3 0.87 0.98 10 Lenteng Agung Barat – Lt Agung Timur 1.30 3 3 0.80 0.83 11 Lt. Agung Timur – Gedong Barat 1.90 3 3 0.94 0.98 12 Gedong Barat – Gedong Timur 0.50 3 3 0.87 0.90 13 Gedong Timur – Kampung Rambutan 0.80 3 3 0.94 0.94 14 Kampung Rambutan – Pasar Rebo 1.10 3 3 0.90 0.90 15 Pasar Rebo – Ramp TMII 1.00 3 3 0.54 0.58 16 Intc. TMII – Bambu Apus 0.70 3 3 0.83 0.83 17 Bambu Apus – Setu 1.70 3 3 0.92 0.88 18 Setu – Jati Warna 1.20 3 3 0.92 0.88 19 Jati Warna – Jati Asih 3.50 3 3 0.88 0.80 20 Jati Asih – Cikunir 5.45 3 3 0.84 0.73 21 Cikunir – Kali Malang 1.00 3 3 0.42 0.42 22 Kali Malang – Bintara 3.00 3 3 0.38 0.35 23 Bintara – Cakung Selatan 3.50 3 3 0.35 0.27 24 Cakung Selatan – Cakung Utara 1.50 3 3 0.23 0.15 25 Cakung Utara – Rorotan 3.25 3 3 0.19 0.14
Source: Jasa Marga
2) West Java Area
Jakarta-Cikampek Road
The industrial area has been developed around Cibitung and Cikarang, the east outskirt of Jakarta due to the congestion in urban areas and the restriction of land use. According to this movement, the traffic related to the cargo between Tanjung Priok Port and industrial area has increased which contributes to the traffic congestion on Jakarta – Cikampek toll road.
Figure 4.4.2 shows the annual average daily traffic on Jakarta – Cikampek toll road in 2009. The traffic volume around Bekasi accounts for over 200,000 vehicle/day on main road, which is largely beyond the capacity that is 126,000 vehicle/day for 6 lanes. In addition, the traffic on the ramp bound for Jakarta on Cibitung and Cikaran IC exceeds 20,000 vehicles/day.
Jagorawi Toll Road
The traffic volume for both directions between Cawang and Citeureup on Jagorawi Road exceeds 100,000 vehicles/day. Especially around Cawang, the traffic volume only for one direction is over 100,000. The traffic volume on Jagorawi road is shown in Figure 4.4.3.
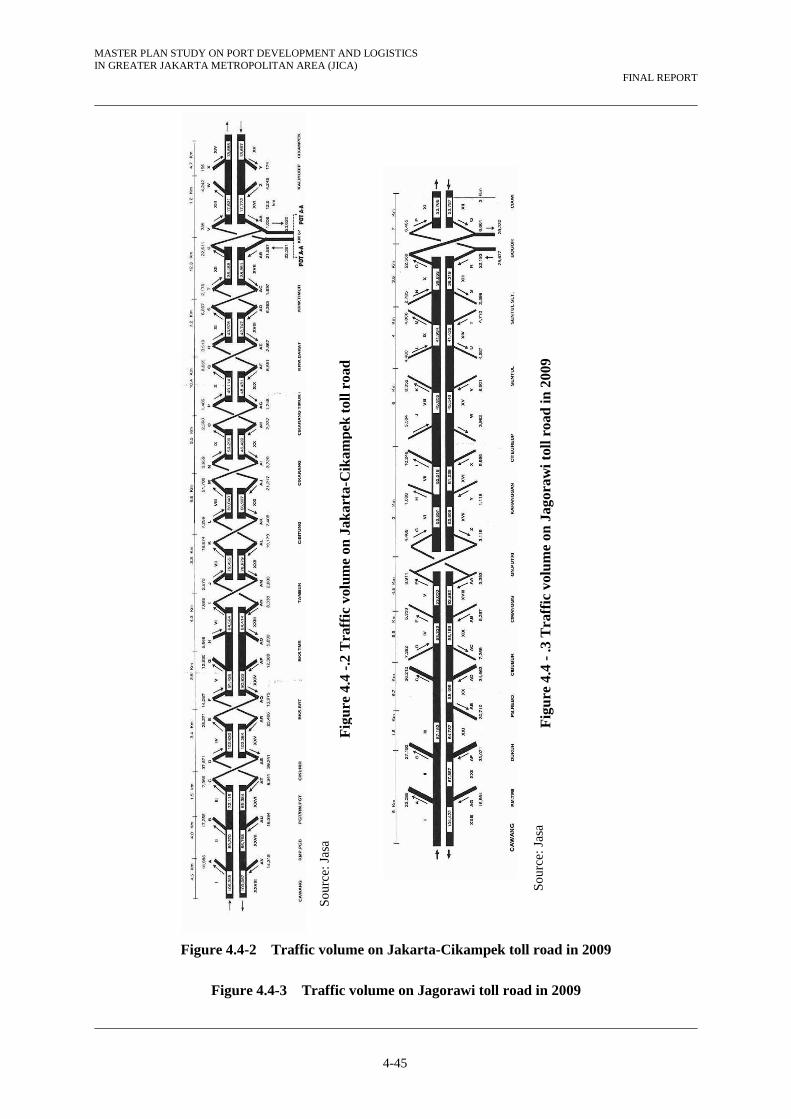
MASTER PLAN STUDY ON PORT DEVELOPMENT AND LOGISTICS IN GREATER JAKARTA METROPOLITAN AREA (JICA)
FINAL REPORT
4-45
Figure 4.4-2 Traffic volume on Jakarta-Cikampek toll road in 2009
Figure 4.4-3 Traffic volume on Jagorawi toll road in 2009
Fig
ure
4.4
-.2
Tra
ffic
vol
ume
on J
akar
ta-C
ikam
pek
toll
roa
d
Fig
ure
4.4
- .3
Tra
ffic
vol
um
e on
Jag
oraw
i tol
l roa
d in
200
9
Sour
ce: J
asa
Sour
ce: J
asa

MASTER PLAN STUDY ON PORT DEVELOPMENT AND LOGISTICS IN GREATER JAKARTA METROPOLITAN AREA (JICA)
FINAL REPORT
4-46
(2) Future forecast of traffic demands in Jakarta Metropolitan Area
The future traffic volume around JABODETABEK area in 2011 and 2020 was forecasted in “The Study on Integrated Transportation Master Plan for JABODETABEK (PHASEII)” in 2004 and reviewed and updated it in “The Detailed Design for Tanjung Priok Access Road” conducted in 2007. According to the result, by the opening of JORR and JORR2, the traffic volume is expected to decrease temporarily on Jagowawi, Jakarta-Cikampek and JIUT in 2011. However, it will continue to increase and the Vehicle Capacity ratio (VCR) is beyond 1.0 on most of the roads at 2020. It is obvious that the traffic volume will be overflowed in the near future by not only the cargo but also ordinary vehicles, so reducing the traffic is the one of most important issues in JABODETABEK.
Too Road Section 2011 2020 V/C Too Road Section 2011 2020 V/C
Jogorawi J-1 171,700 211,200 1.8 TgPA TP-1 77,000 114,000 1.0J-2 139,700 201,100 1.7 TP-2 33,100 55,400 0.5J-3 114,400 154,700 1.0 TP-3 8,400 24,000 0.2
Jakarta-Cikampek JC-1 174,600 244,600 2.0 Becakayu BK-1 82,000 189,800 1.6JC-2 118,500 170,400 1.4 BK-2 35,900 110,900 0.9JC-3 93,800 118,800 1.0 Depok Antasari DA-1 89,300 177,900 1.5
Jakarta-Tangerang JT-1 202,500 249,900 2.1 DA-2 23,700 72,000 0.6JT-2 167,100 214,600 1.8 2nd JORR 2J-1 6,300 19,000 0.2JT-3 97,900 138,500 1.2 2J-2 4,300 43,400 0.4
Cengkareng Access CA-1 134,200 158,900 1.3 2J-3 18,800 59,700 0.5CA-2 111,700 141,600 1.2 2J-4 56,400 130,300 1.1
JIUT JI-1 168,300 201,000 1.7 2J-5 58,100 161,100 1.3JI-2 121,900 156,300 1.3 2J-6 45,100 132,900 1.1JI-3 171,100 206,600 1.7 2J-7 62,300 122,100 1.0JI-4 86,600 98,600 0.8 2J-8 61,400 117,600 1.0JI-5 155,900 191,700 1.6 DKI Inner Ring Road IR-1 128,600 1.1
Jakarta-Serpong SR-1 75,900 138,800 1.2 IR-2 158,600 1.3JORR W1 JW-1 78,800 134,600 1.1 IR-3 149,100 1.2
JW-2 142,000 200,100 1.7 IR-4 103,300 0.9JW-3 163,500 206,900 1.7 IR-5 50,100 0.4
JORR-S JS-1 169,900 204,200 1.7 IR-6 144,700 1.2JS-2 183,700 232,000 1.9 IR-7 100,800 0.8JS-3 170,300 218,100 1.8 IR-8 117,400 1.0
JORR-E JE-1 140,100 192,500 1.6 IR-9 158,100 1.3JE-2 120,100 196,400 1.6 IR-10 124,200 1.0JE-3 176,600 1.5
Source: Design report for Tanjung Priok Access Road, Ministry of Public Works, 2008
Figure 4.4-4 Future traffic volume in 2020
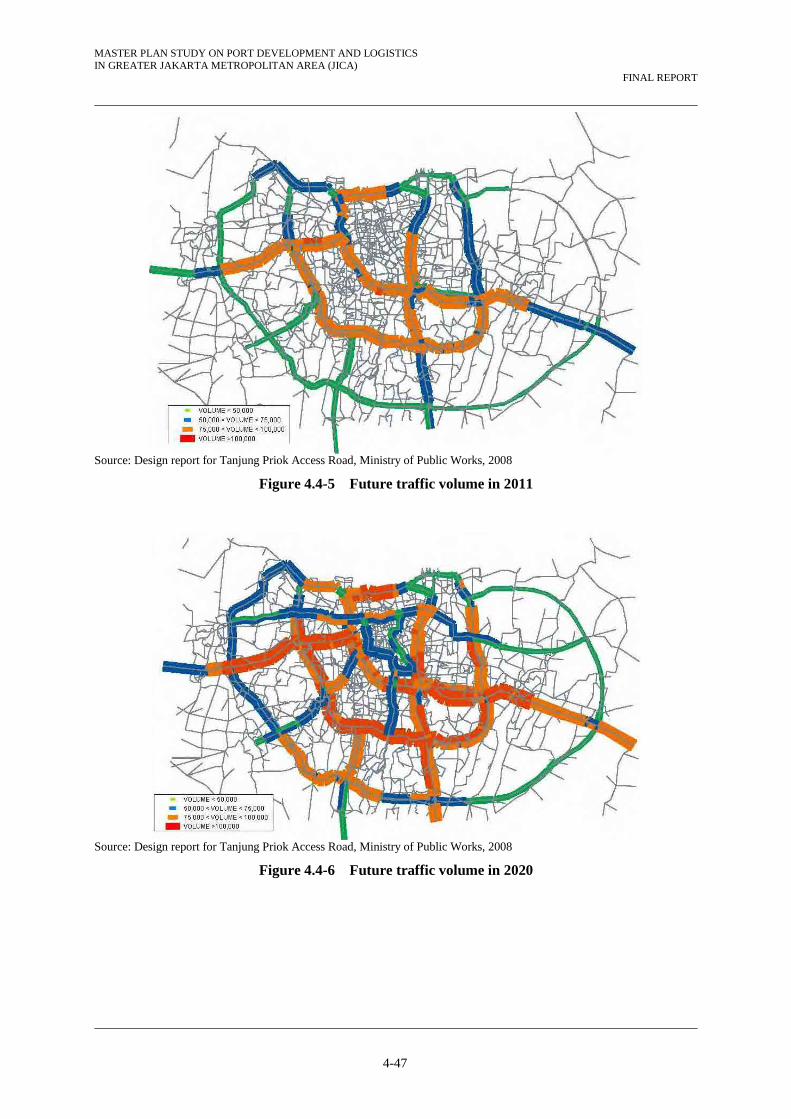
MASTER PLAN STUDY ON PORT DEVELOPMENT AND LOGISTICS IN GREATER JAKARTA METROPOLITAN AREA (JICA)
FINAL REPORT
4-47
Source: Design report for Tanjung Priok Access Road, Ministry of Public Works, 2008
Figure 4.4-5 Future traffic volume in 2011
Source: Design report for Tanjung Priok Access Road, Ministry of Public Works, 2008
Figure 4.4-6 Future traffic volume in 2020
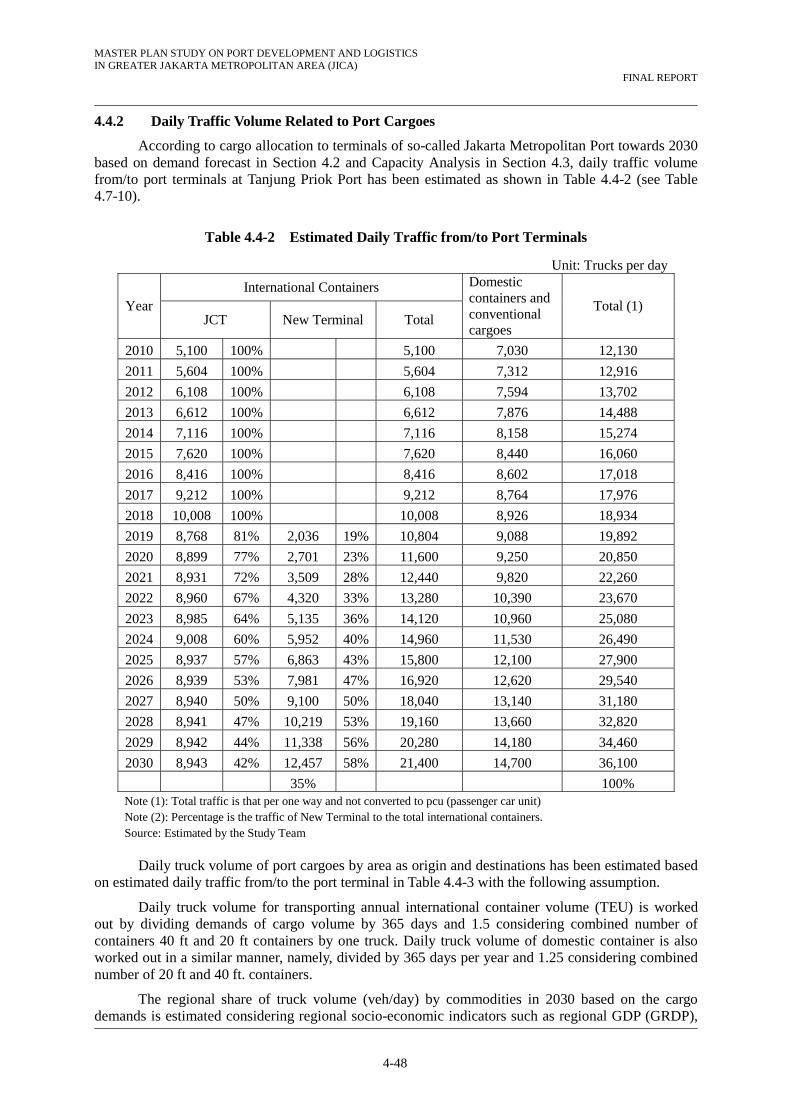
MASTER PLAN STUDY ON PORT DEVELOPMENT AND LOGISTICS IN GREATER JAKARTA METROPOLITAN AREA (JICA)
FINAL REPORT
4-48
4.4.2 Daily Traffic Volume Related to Port Cargoes
According to cargo allocation to terminals of so-called Jakarta Metropolitan Port towards 2030 based on demand forecast in Section 4.2 and Capacity Analysis in Section 4.3, daily traffic volume from/to port terminals at Tanjung Priok Port has been estimated as shown in Table 4.4-2 (see Table 4.7-10).
Table 4.4-2 Estimated Daily Traffic from/to Port Terminals
Unit: Trucks per day
Year International Containers Domestic
containers and conventional cargoes
Total (1) JCT New Terminal Total
2010 5,100 100% 5,100 7,030 12,130
2011 5,604 100% 5,604 7,312 12,916
2012 6,108 100% 6,108 7,594 13,702
2013 6,612 100% 6,612 7,876 14,488
2014 7,116 100% 7,116 8,158 15,274
2015 7,620 100% 7,620 8,440 16,060
2016 8,416 100% 8,416 8,602 17,018
2017 9,212 100% 9,212 8,764 17,976
2018 10,008 100% 10,008 8,926 18,934
2019 8,768 81% 2,036 19% 10,804 9,088 19,892
2020 8,899 77% 2,701 23% 11,600 9,250 20,850
2021 8,931 72% 3,509 28% 12,440 9,820 22,260
2022 8,960 67% 4,320 33% 13,280 10,390 23,670
2023 8,985 64% 5,135 36% 14,120 10,960 25,080
2024 9,008 60% 5,952 40% 14,960 11,530 26,490
2025 8,937 57% 6,863 43% 15,800 12,100 27,900
2026 8,939 53% 7,981 47% 16,920 12,620 29,540
2027 8,940 50% 9,100 50% 18,040 13,140 31,180
2028 8,941 47% 10,219 53% 19,160 13,660 32,820
2029 8,942 44% 11,338 56% 20,280 14,180 34,460
2030 8,943 42% 12,457 58% 21,400 14,700 36,100
35% 100% Note (1): Total traffic is that per one way and not converted to pcu (passenger car unit) Note (2): Percentage is the traffic of New Terminal to the total international containers. Source: Estimated by the Study Team
Daily truck volume of port cargoes by area as origin and destinations has been estimated based
on estimated daily traffic from/to the port terminal in Table 4.4-3 with the following assumption.
Daily truck volume for transporting annual international container volume (TEU) is worked out by dividing demands of cargo volume by 365 days and 1.5 considering combined number of containers 40 ft and 20 ft containers by one truck. Daily truck volume of domestic container is also worked out in a similar manner, namely, divided by 365 days per year and 1.25 considering combined number of 20 ft and 40 ft. containers.
The regional share of truck volume (veh/day) by commodities in 2030 based on the cargo demands is estimated considering regional socio-economic indicators such as regional GDP (GRDP),

MASTER PLAN STUDY ON PORT DEVELOPMENT AND LOGISTICS IN GREATER JAKARTA METROPOLITAN AREA (JICA)
FINAL REPORT
4-49
regional population, and consumption level (see Section 4.1), and OD survey (see section 2.10). The result of regional share of truck traffic volume is shown in Table 4.4-3.
Table 4.4-3 Truck Traffic by area as origins and destinations of port cargoes
Unit: vehicle per day
Consumer goods 4,076 20.3% 7,376 36.8% 6,886 34.3% 1,712 8.5% 20,050 100%
Cargoes related to manufacturing industries 1,409 8.8% 2,777 17.3% 9,975 62.1% 1,886 11.8% 16,050 100%
5,485 10,153 16,861 3,598 36,100 Total
Total Traffic
Source: The Study Team
Banten Province DKI JakartaNorth east area of
West Java ProvinceSouth West area ofWest Java Province
Type of cargo transported by truck
In case required magnitude of new terminal facilities are developed at respective candidate
sites, the volume of trucks (veh/day) using toll roads within JABODETABEK area for transporting port cargo is estimated and shown in matrix format of OD (Origin and Destination) traffic related to port cargoes based on the estimated annual truck traffic by terminals and regional truck traffic forecast in Table 4.4-3 and Table 4.4-3 respectively.
Table 4.4-4 shows the findings of truck traffic distribution by OD in the matrix format by using the toll roads within JABODETABEK area. The truck volume is indicated by unit of veh/day. The figures are converted to PCU (passenger car unit) for assessing the balance of demands and capacity of the planned lanes of the toll roads and by calculating percentage of truck traffic occupancy on the toll roads. The veh/day of truck traffic is converted to PCU by multiplying PCU factor of design standard in Indonesia.
According to the past traffic survey by JICA Study in 2002, the percentage of truck for transporting port cargo to the total traffic volume including passenger cars, buses etc without converting pcu basis was around 20% on the roads around Tanjung Priok Port, equivalent to 50 % in term of pcu unit. In the case of traffic counting survey by Directorate General of Highways Ministry of Public Works in 2009, the ratio of truck traffic in the toll roads on some section of Jakarta – Cikanpec Toll Road has been around 10%, equivalent to 30% in terms of pcu unit.
It is considered that this ratio of occupancy of trucks in the city traffic indicates the saturated capacity of the arterial city road. Beyond this ratio heavy congestion will occur and road service level will decline.
The results of the estimation of the occupancy ratio of port-related truck traffic to road capacities on toll roads on the basis of PCU in 2030 are shown in Table 4.4-4. Note that PCU factor for the heavy truck is “3” according to the design standard in Indonesia.

MASTER PLAN STUDY ON PORT DEVELOPMENT AND LOGISTICS IN GREATER JAKARTA METROPOLITAN AREA (JICA)
FINAL REPORT
4-50
Table 4.4-4 Truck volume related to port cargo and truck occupancy
Route Nos.
of Lane
Capacity (pcu/day)
Tanjung Priok Cilamaya Tangerang
Truck Volume
(veh/day)
Truck occupancy
Truck Volume
(veh/day)
Truck occupancy
Truck Volume
(veh/day)
Truck occupancy
A JKT~Merek 3 60,000 5,485 27% 5,485 27% - 0%
B JKT~Bogor 3 60,000 3,598 18% 3,598 18% 3,598 18%
C 2nd JORR(NE) 3 60,000 16,861 84% 8,003 40% 13,488 67%
D 2nd JORR(SE) 3 60,000 - 0% 3,598 18% 3,373 17%
E 2nd JORR(NW) 3 60,000 5,485 27% 5,485 27% 6,970 35%
F 2nd JORR(SW) 3 60,000 - 0% - 0% 6,970 35%
G JKT~Cikampek 4 80,000 16,861 63% 4,405 17% 16,861 63%
H JIUT (NS) 3 60,000 13,751 69% 10,153 51% 10,153 51% Source: JICA Study Team
In the case of full concentration to Tanjung Priok Port, the truck occupancy on 2nd Outer Ring Road (NE), Jakarta Cikampek Toll Road and the JIUT (NS) show extraordinarily high ratios, viz. 84%, 63% and 69%, which are far exceeding the above mentioned figures of 30 ~ 50% obtained from the actual traffic survey data. This suggests that full concentration to Tanjung Priok Port would contribute to the overcapacity of those accessible toll roads.
Alternatively in the case of developing a new terminal at Cilamaya area, the occupancy ratio of truck traffic through the toll roads concerned to a new terminal will be less than 50 % in most sections, which will relieve the heavy traffic congestion in the metropolitan area and maintain the required service level of toll roads. On the other hand, developing a new terminal at Tangerang would result in similar high burden percentages by truck traffic occupancy in the accessible toll roads.
4.4.3 Railway transportation line capacity between Tanjung Priok – Jatinegara – Bekasi – Cikarang – Cikampek
The line capacity of the existing railway facilities between Tanjung Priok and Bekasi stations is shown in the following tables:
A
E
F
B
G
DH
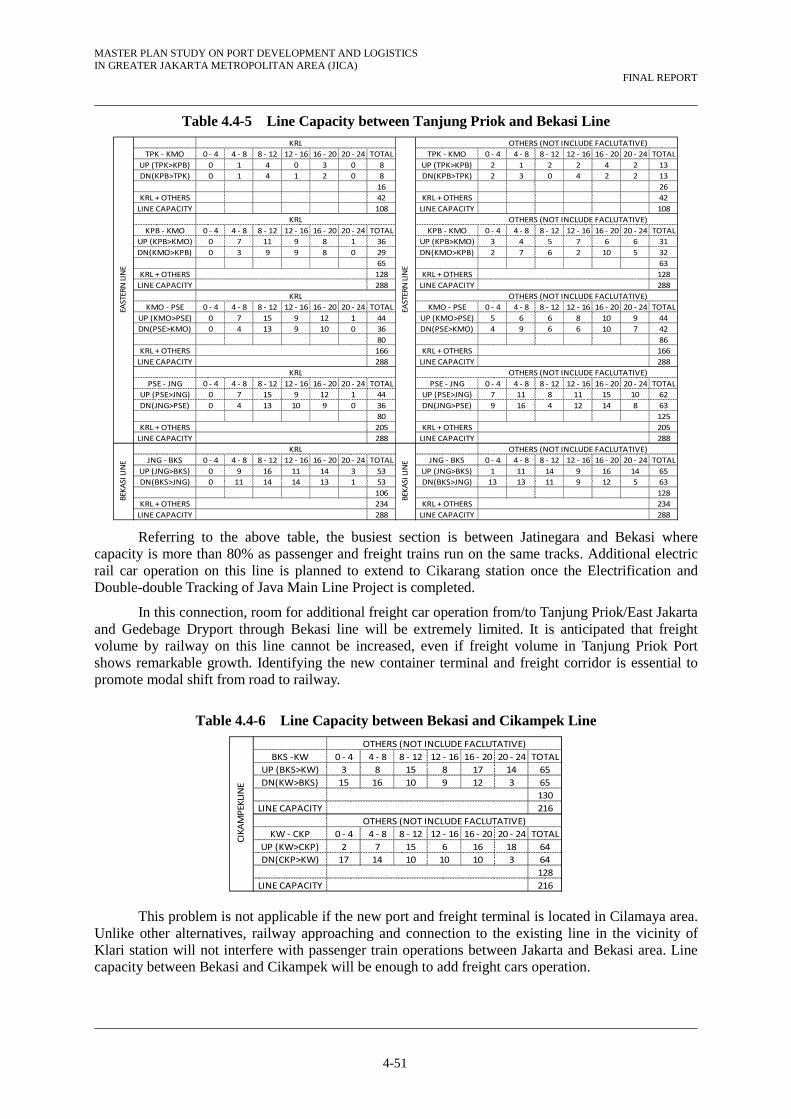
MASTER PLAN STUDY ON PORT DEVELOPMENT AND LOGISTICS IN GREATER JAKARTA METROPOLITAN AREA (JICA)
FINAL REPORT
4-51
Table 4.4-5 Line Capacity between Tanjung Priok and Bekasi Line
TPK ‐ KMO 0 ‐ 4 4 ‐ 8 8 ‐ 12 12 ‐ 16 16 ‐ 20 20 ‐ 24 TOTAL TPK ‐ KMO 0 ‐ 4 4 ‐ 8 8 ‐ 12 12 ‐ 16 16 ‐ 20 20 ‐ 24 TOTAL
UP (TPK>KPB) 0 1 4 0 3 0 8 UP (TPK>KPB) 2 1 2 2 4 2 13
DN(KPB>TPK) 0 1 4 1 2 0 8 DN(KPB>TPK) 2 3 0 4 2 2 13
16 26
KRL + OTHERS 42 KRL + OTHERS 42
LINE CAPACITY 108 LINE CAPACITY 108
KPB ‐ KMO 0 ‐ 4 4 ‐ 8 8 ‐ 12 12 ‐ 16 16 ‐ 20 20 ‐ 24 TOTAL KPB ‐ KMO 0 ‐ 4 4 ‐ 8 8 ‐ 12 12 ‐ 16 16 ‐ 20 20 ‐ 24 TOTAL
UP (KPB>KMO) 0 7 11 9 8 1 36 UP (KPB>KMO) 3 4 5 7 6 6 31
DN(KMO>KPB) 0 3 9 9 8 0 29 DN(KMO>KPB) 2 7 6 2 10 5 32
65 63
KRL + OTHERS 128 KRL + OTHERS 128
LINE CAPACITY 288 LINE CAPACITY 288
KMO ‐ PSE 0 ‐ 4 4 ‐ 8 8 ‐ 12 12 ‐ 16 16 ‐ 20 20 ‐ 24 TOTAL KMO ‐ PSE 0 ‐ 4 4 ‐ 8 8 ‐ 12 12 ‐ 16 16 ‐ 20 20 ‐ 24 TOTAL
UP (KMO>PSE) 0 7 15 9 12 1 44 UP (KMO>PSE) 5 6 6 8 10 9 44
DN(PSE>KMO) 0 4 13 9 10 0 36 DN(PSE>KMO) 4 9 6 6 10 7 42
80 86
KRL + OTHERS 166 KRL + OTHERS 166
LINE CAPACITY 288 LINE CAPACITY 288
PSE ‐ JNG 0 ‐ 4 4 ‐ 8 8 ‐ 12 12 ‐ 16 16 ‐ 20 20 ‐ 24 TOTAL PSE ‐ JNG 0 ‐ 4 4 ‐ 8 8 ‐ 12 12 ‐ 16 16 ‐ 20 20 ‐ 24 TOTAL
UP (PSE>JNG) 0 7 15 9 12 1 44 UP (PSE>JNG) 7 11 8 11 15 10 62
DN(JNG>PSE) 0 4 13 10 9 0 36 DN(JNG>PSE) 9 16 4 12 14 8 63
80 125
KRL + OTHERS 205 KRL + OTHERS 205
LINE CAPACITY 288 LINE CAPACITY 288
JNG ‐ BKS 0 ‐ 4 4 ‐ 8 8 ‐ 12 12 ‐ 16 16 ‐ 20 20 ‐ 24 TOTAL JNG ‐ BKS 0 ‐ 4 4 ‐ 8 8 ‐ 12 12 ‐ 16 16 ‐ 20 20 ‐ 24 TOTAL
UP (JNG>BKS) 0 9 16 11 14 3 53 UP (JNG>BKS) 1 11 14 9 16 14 65
DN(BKS>JNG) 0 11 14 14 13 1 53 DN(BKS>JNG) 13 13 11 9 12 5 63
106 128
KRL + OTHERS 234 KRL + OTHERS 234
LINE CAPACITY 288 LINE CAPACITY 288
EASTERN LINE
EASTERN LINE
KRL OTHERS (NOT INCLUDE FACLUTATIVE)
OTHERS (NOT INCLUDE FACLUTATIVE)KRL
BEKASI LINE
OTHERS (NOT INCLUDE FACLUTATIVE)
KRL OTHERS (NOT INCLUDE FACLUTATIVE)
KRL OTHERS (NOT INCLUDE FACLUTATIVE)
KRL
BEKASI LINE
Referring to the above table, the busiest section is between Jatinegara and Bekasi where capacity is more than 80% as passenger and freight trains run on the same tracks. Additional electric rail car operation on this line is planned to extend to Cikarang station once the Electrification and Double-double Tracking of Java Main Line Project is completed.
In this connection, room for additional freight car operation from/to Tanjung Priok/East Jakarta and Gedebage Dryport through Bekasi line will be extremely limited. It is anticipated that freight volume by railway on this line cannot be increased, even if freight volume in Tanjung Priok Port shows remarkable growth. Identifying the new container terminal and freight corridor is essential to promote modal shift from road to railway.
Table 4.4-6 Line Capacity between Bekasi and Cikampek Line
BKS ‐KW 0 ‐ 4 4 ‐ 8 8 ‐ 12 12 ‐ 16 16 ‐ 20 20 ‐ 24 TOTAL
UP (BKS>KW) 3 8 15 8 17 14 65
DN(KW>BKS) 15 16 10 9 12 3 65
130
LINE CAPACITY 216
KW ‐ CKP 0 ‐ 4 4 ‐ 8 8 ‐ 12 12 ‐ 16 16 ‐ 20 20 ‐ 24 TOTAL
UP (KW>CKP) 2 7 15 6 16 18 64
DN(CKP>KW) 17 14 10 10 10 3 64
128
LINE CAPACITY 216
OTHERS (NOT INCLUDE FACLUTATIVE)
CIKAMPEKLINE
OTHERS (NOT INCLUDE FACLUTATIVE)
This problem is not applicable if the new port and freight terminal is located in Cilamaya area. Unlike other alternatives, railway approaching and connection to the existing line in the vicinity of Klari station will not interfere with passenger train operations between Jakarta and Bekasi area. Line capacity between Bekasi and Cikampek will be enough to add freight cars operation.

MASTER PLAN STUDY ON PORT DEVELOPMENT AND LOGISTICS IN GREATER JAKARTA METROPOLITAN AREA (JICA)
FINAL REPORT
4-52
4.4.4 Railway transportation line capacity between Cikampek – Purwakarta – Padalaran – Bandung – Gedebage
The line capacity on the existing railway facilities between Cikampek and Gedebage stations is shown in the following table:
Table 4.4-7 Line Capacity between Cikampek and Gedebage
CKP ‐ PDL TOTAL
UP (CKP>PDL) 19
DN(PDL>CKP) 18
37
LINE CAPACITY 96
PDL ‐ BD TOTAL
UP (PDL>BD) 33
DN(BD>PDL) 35
68
LINE CAPACITY 216
BD ‐ GDB TOTAL
UP (BD>GDB) 38
DN(GDB>BD) 38
76
LINE CAPACITY 216
7
0 ‐ 8 8 ‐ 16 16 ‐ 24
16 10
9
11 13 14
6 6
0 ‐ 8 8 ‐ 16 16 ‐ 24
16 ‐ 24
BANDUNG LINE OTHERS (NOT INCLUDE FACLUTATIVE)
OTHERS (NOT INCLUDE FACLUTATIVE)
10 16 12
13
OTHERS (NOT INCLUDE FACLUTATIVE)
13
5 8 6
6
0 ‐ 8 8 ‐ 16
Within the whole Bandung line, line capacity is still sufficient for the operation of additional freight cars, except the short distance between Kiaracondon and Gedebage. To secure the operational efficiency, not only capacity increase in this short section, but also bottlenecks of railway infrastructure such as gradient, curve, and effective length in station yard shall be improved.
4.4.5 All factors of railway transportation capability between Tanjung Priok and Gedebage
Physical constraints of railway infrastructure in Tanjung Priok - Gedebage Corridor are summarized below:
- Maximum gradient 16‰ (Between Purwakarta and Padalarang) - Minimum curve 150 meter (Between Puwakarta and Cisomang) - Minimum effective length 168 meter (Cikadondong) - Minimum Line Capacity 96 (Between Purwakarta and Padalarang)
Other constraints, as already mentioned in Chapter 2, are summarized below:
- Transportation time and tariff are unable to compete with truck transportation. This is largely due to highway road between Jakarta and Bandung and to chronic traffic jam between Tanjung Priok Port and Pasoso Station.
4.5 Basic Concept of Port Development Plan in Greater Jakarta Metropolitan Area
The purpose of the Master Plan for the port development in Greater Jakarta Metropolitan Area (target year 2030) is to serve as a target and guideline for phase plans including the Phase I Project urgently required.
Prior to making the Master Plan, the objectives of the development of the Port have been recognized as follows:
- To set up a New Container Terminal to receive containers overflowing from the existing container terminals (JCT) at Tanjung Priok Terminal which has limited expandable space within the existing port area and is anticipated to be soon

MASTER PLAN STUDY ON PORT DEVELOPMENT AND LOGISTICS IN GREATER JAKARTA METROPOLITAN AREA (JICA)
FINAL REPORT
4-53
saturated for ever increasing container-handling demand. - To redevelop conventional wharves at Tanjung Priok Terminal so as to meet
increasing domestic containers and conventional cargoes. - To set up a New Petroleum Terminal through transferring the existing terminal in
the vicinity of urban area at Tanjung Priok Terminal - To set up a New Dry Bulk Terminal through transferring cargoes currently
handled at berths in the vicinity of urban area at Tanjung Priok Terminal
The following current bottlenecks and disadvantages have been recognized at Tanjung Priok Terminal.
Excessive congestion on port access roads
Port users such as forwarders, trucking companies and consignors/consignees are suffering from excessive road traffic congestion in the hinterland of the port especially within JABODETABEK (Jakarta, Bogor, Depok, Tangeran and Bekesi) area.
Congestion within the port
There is a shortage of the port facilities including the number of berths and yard space, resulting in the congestion within the port. Even container ships scheduled for regular services are occasionally forced to wait off-shore. In addition, due to the shortage of yard space, container dwelling time is restricted and containers are often shifted to off-dock yards without notice to consignees generating additional expenses.
Insufficient water depth and space of turning basins to receive larger container ships
As to container ships, as shown in Fig. 4.7.8 below, it is anticipated that in 2014 the total container capacity of Post-Panamax Type ships will exceed the sum of capacities of Panamax Type and Handy-size in a clear trend that the sizes of container ships are getting larger and larger.
Despite the trend, shipping lines hesitate to bring even Panamax Type container ships with only 3,000 TEU capacities due to shallowness in the access channel and alongside berths as well as the narrowness of turning basins.
On the other hand, the water depth of the existing petroleum berths at Tanjung Priok Terminal is insufficient to receive larger petroleum product tankers importing petroleum to Indonesia from the Middle East, and larger tankers are forced to transship oils to smaller tankers in deep sea waters.
Environmental burden on urban areas in the vicinity of the existing Tanjung Priok Terminal by port activities
Petroleum tank farms connected with the existing petroleum jetties are surrounded by the urban area of Jakarta Metropolis. In addition dust cargoes such as coal and sand are handled at the west side of the terminal adjacent to the urban area. Massive traffic of heavy vehicles is generated from the port activities at the existing terminal and is mixed with city traffic.
Taking the above aspects into account, the Master Plan for the port development in Greater Jakarta Metropolitan Area has been made according to the following principles:
- To propose a new terminal so as to receive increasing international containers to be overflowed from JCT at Tanjung Priok Terminal with a target year of 2030
- To propose redevelopment plan of the existing conventional wharves at Tanjung Priok Terminal so as to receive both increasing domestic containers and conventional cargoes
- To propose a transfer of the existing petroleum jetties and the tank farms connected with them to a new location off the existing facilities so as to ensure safety in urban areas adjacent to the existing petroleum terminal
- To propose a transfer of the current handling of dust cargoes to new location so as
MASTER PLAN STUDY ON PORT DEVELOPMENT AND LOGISTICS IN GREATER JAKARTA METROPOLITAN AREA (JICA)
FINAL REPORT
4-54
to reduce scattering of dust to urban areas adjacent to the existing berths handling them
- To propose a port access road having the linkage with a road network in the port hinterland so as to enable smooth distribution of port cargoes to/from consignors/consignees of port cargoes and simultaneously alleviate further burden by port traffic to city traffic within JABODETABEK area
- To propose recommendations on the improvement of railway access to Tanjung Priok Terminal for port cargoe traffic for the purpose of converting the traffic from the excessively congested road to railway
- To pay due attention to environmental issues through conducting SEA (Strategic Environmental Assessment) prior to finalizing the Master Plan, especially focusing on the harmonization with the spatial plans of the central, provincial and regent governments and other related activities at a planned port location
- To take into consideration the potential shallow sea terminals extending off from Marunda to Tarumajaya by pursuing possible linkage with Tanjung Priok Terminal as a deep-sea terminal through barge transport
- To propose adequate functional allotment among the existing and potential terminals which are under the umbrella of Tanjung Priok Port aiming at making the most of limited resources including waters, land and funds
Based on the above principles, the Master Plan has been made according to the following
steps:
First step (Screening the potential candidate sites)
Through the capacity analysis, it has been judged that the demand for international containers in the target year exceeds the potential capacity of JCT at Tanjung Priok Terminal and hence a new terminal is required to receive excess containers from JCT.
The nine potential candidate sites for the above new international container terminal, have been listed and then screened based on various criteria so as to narrow down into several sites and proceed to more detailed comparison based on estimated costs, economic viability, social and environmental considerations and so on.
According to the above screening in the first step, the nine listed candidate sites have been narrowed down into the following three sites:
- North Kalibaru, - Cilamaya, - Tangerang
Second step (Drafting development options for international containers)
Taking account of the forecast demand, capacity analyses and the three candidate sites, the following three options for the development of international container terminals have been drafted and compared with each other:
Option 1: Full concentration on Tanjung Priok Terminal Option 2: Split to Tanjung Priok Terminal and Cilamaya Option 3: Split to Tanjung Priok Terminal and Tangerang
Third step (Making the respective terminal development plans corresponding to the three
options and the selection of the optimum plan)
The three options mentioned in “the second step” mentioned above have been proposed solely focusing on the development of international container terminals.

MASTER PLAN STUDY ON PORT DEVELOPMENT AND LOGISTICS IN GREATER JAKARTA METROPOLITAN AREA (JICA)
FINAL REPORT
4-55
Those three options have been compared and then the optimum plan has been selected solely focusing on the services for international containers.
Forth step (Comparison of the three Alternatives of the selected optimum Option Plan and the selection of the Optimum Alternative Plan)
Fifth step (Making the development plan for domestic containers and conventional cargoes)
Sixth step (Drafting the Master Plan of Tanjung Priok Port)
The Master Plan of Tanjung Priok Port has been drafted by integrating the development plan for international containers and the development plan for domestic containers and conventional cargoes.
4.6 Screening of Potential Candidate Sites for a New International Container Terminal
4.6.1 List of Potential Candidate Sites
As shown in Section 2.2, the following ten conceptual port development plans have been proposed by various organizations including West Java Provincial Government, DKI Jakarta, Bekesi Regent, Tangeran Regent, Pelindo II and private developers. The sites of their plans have been listed as potential candidate sites for a new container terminal in this Study.
DKI Jakarta 1) North Kalibaru 2) Off Marunda Area between the existing Kalibaru Port and the border to Regent
Bekesi West Java Province
3) Off Marunda Center in Regent Bekesi (Kabupaten Bekesi) 4) Left Bank of Karang River (Ci Karang) in Regent Bekesi (Kabupaten Bekesi) 5) Muara Gembong Area in Regent Bekesi (Kabupaten Bekesi) 6) Cilamaya Coast in Regent Karawan (Kabupaten Karawan) 7) Ciasem Bay Coast in Regent Subong (Kabupaten Subong) Banten Province
8) Tangeran Coast in Regent Tangeran (Kabupaten Tangeran) 9) Bojonegara Port
4.6.2 Criteria for Screening Potential Candidate Sites
In this study, in the first step, those nine plans have been reviewed as potential candidate sites. Then, in the second step, screening has been done to select candidate sites for the new container terminals out of those potential candidate sites. When screening, the following criteria have been applied:
1) Designation of protected forest (Hutan Lindun) by the Ministry of Forestry
2) Conformance with the Spatial Plan of the Provincial Governments
3) Conformance with the Spatial Plan of the Regent Governments (Kabupaten)
4) Ecological importance
5) Coastal line changes
6) JAPODETABEK traffic congestion
MASTER PLAN STUDY ON PORT DEVELOPMENT AND LOGISTICS IN GREATER JAKARTA METROPOLITAN AREA (JICA)
FINAL REPORT
4-56
7) Distance from the major consumption area (Jakarta) in view of economical land transport
8) Distance from the major industrial areas (area along Jakarta – Cikampec Toll Road) in view of economical land transport
9) Sustainable maintenance dredging along deepwater access channel
4.6.3 Individual Evaluations for International Container Terminal
(1) North Kalibaru
Even if the second outer ring road (JORR2) is completed, it is predicted that JORR” will not be able to afford to accommodate port related vehicles to and from the New Terminal at North Kalibaru.
To alleviate the congestion forecast at JORR2, it is necessary to construct a new access road to the major industrial estates in Bekesi~Karawan areas along Jakarta – Cikampec Toll Road.
If the new access road to the above industrial estates is realized, the new road could afford to accommodate the port. If that is the case, it is predicted that the congestion within JABODETABEK toll road will be accelerated due to further concentration of international containers to Tanjung Priok Terminal. That means a negative factor to ABODETABEK toll road congestion
(2) Marunda (Jakarta)
Negative factors are acceleration to JABODETABEK toll road congestion and infeasibility of maintaining deep-water access channel for an international container terminal. Those sites will be usable for local terminals with shallow-water berths.
(3) Off Marunda Center
ditto
(4) Tarumajaya in Bekesi
Taking account of an excessive extension of the coast line due to sedimentation from Karan River (Ci Karan), it seems to be difficult to develop this site for either a shallow or deep-water container terminal.
(5) Muara Gembong in Bekesi
Taking account of many negative factors including natural and ecological conditions, it seems to be difficult to justify developing this site for an international container terminal.
(6) Cilamaya in Karawan
This site has no specific negative factor for constructing a deep-sea international container terminal.
A new access road toward Karawan industrial area must be constructed.
MASTER PLAN STUDY ON PORT DEVELOPMENT AND LOGISTICS IN GREATER JAKARTA METROPOLITAN AREA (JICA)
FINAL REPORT
4-57
(7) Ciasem in Subang
Taking account of regulated forest areas designated by the Ministry of Forest as well as spatial plans of local government, it would be difficult to develop this site for a international container terminal.
(8) Tangerang
Negative factor is acceleration of JABODETABEK toll road congestion even if the second ring road is completed.
If a new terminal aims to attract containers from the West Java Province beyond DKI Jakarta, it seems to be difficult to alleviate the above negative factor in terms of traffic congestion.
Taking account that Tangerang has good natural conditions, the site has the potential to be developed as a deep-sea marine terminal to serve for local hinterland in the vicinity of the site in Banten Province without passing through DKI Jakarta.
(9) Bojonegara
Negative factor is the long distance from both major industrial and consumption areas. There is a plan to develop the port as a petroleum port as well as a conventional cargo port rather than an international container port.
4.6.4 Result of the Screening
According to the basic concept of the New Container Terminal mentioned in Section 4.5 and the criteria mentioned in Section 4.6.2, screening of the above nine potential sites has been conducted and it has been narrowed down into the three sites, viz. North Kalibaru, Cilamaya and Tangerang. The remaining six potential sites have been ruled out due to having fatal negative factors for the construction of a deep sea marine terminal for international containers as summarized in Table 4.6-1 (see Figure 4.6-1)

MASTER PLAN STUDY ON PORT DEVELOPMENT AND LOGISTICS IN GREATER JAKARTA METROPOLITAN AREA (JICA)
FINAL REPORT
4-58
Table 4.6-1 Screening of Potential Sites for a New Container Terminal
The
Min
iste
ryof
For
estr
yPr
ovin
cial
Gov
ernm
ent
Gov
ernm
ent o
fR
egen
tM
ajor
indu
stri
alar
eas
Maj
or c
onsu
mp-
tion
are
a1
Nor
th K
alib
aru
Acc
elar
atio
n60
7
2M
arun
da (
Jaka
rta)
Acc
elar
atio
n57
10In
feas
ible
3M
arun
da C
ente
rA
ccel
arat
ion
5512
Infe
asib
le
4T
arum
ajay
a (B
ekes
i)D
isob
edie
nce
Exc
essi
veA
ccel
arat
ion
5332
Infe
asib
le
5M
uara
Gem
bong
(B
ekes
i)D
isob
edie
nce
Dis
obed
ienc
eD
isob
edie
nce
Impo
rtan
tU
nsta
ble
Acc
elar
atio
n60
40
6C
ilam
aya
All
evia
tion
3080
7C
iase
mD
isob
edie
nce
Dis
obed
ienc
eD
isob
edie
nce
All
evia
tion
5510
0
8T
ange
rang
Acc
elar
atio
n10
050
9B
ojon
egar
aA
ccel
arat
ion
180
> 1
0012
0 >
100
Not
e:
So
urce
: Stu
dy T
eam
Neg
ativ
e fa
ctor
Mai
nten
ance
dred
ging
Pla
ceR
egul
ated
For
est
Are
a (H
utan
Lin
dung
)E
colo
gica
lIm
port
ance
Coa
stal
Lin
eC
hang
esJA
BO
DE
TA
BE
Ktr
affi
c co
nges
tion
Lan
d T
rans
port
Dis
tanc
es (
km)
to a
new
ter
min
al

MASTER PLAN STUDY ON PORT DEVELOPMENT AND LOGISTICS IN GREATER JAKARTA METROPOLITAN AREA (JICA)
FINAL REPORT
4-59
Source: Made by the Study Team based on the data from Fairplay
Figure 4.6-1 Potential Candidate Sites for International Container Terminal in the Jakarta Metropolitan Area
Taking account of the forecast demand, capacity analyses and the three sites, viz. North Kalibaru, Cilamaya and Tangerang, the following three options for the development of international container terminals have been drafted.
Option 1: Fully concentration to Tanjung Priok Terminal JCT: 4.0 North Kalibaru Phase I: 1.9 million TEUs North Kalibaru Phases II~ III: 7.5 million TEUs
Total: 13.4 million TEUs
Option 2: Split to Tanjung Priok Terminal and Cilamaya JCT: 4.0 North Kalibaru Phase I: 1.9 million TEUs Cilamaya Phases II~III: 7.5 million TEUs
Total: 13.4 million TEUs
Option 3 Split to Tanjung Priok Terminal and Tangerang JCT: 4.0 North Kalibaru Phase I: 1.9 North Kalibaru Phases II~ III: 5.5 million TEUs Tangerang: 2.0 million TEUs
Total: 13.4 million TEUs

MASTER PLAN STUDY ON PORT DEVELOPMENT AND LOGISTICS IN GREATER JAKARTA METROPOLITAN AREA (JICA)
FINAL REPORT
4-60
4.7 Three Options for a New International Container Terminal
4.7.1 Development Fully Concentrated at off North Kalibaru (Option-1)
In this section, long-term development plan for Tanjung Priok Terminal has been studied corresponding to “the Third Step” mentioned in the previous section “4.5”. In this study the area off North Kalibaru is considered the only space for further expansion for Tanjung Priok Terminal so as to meet increasing demand of international containers towards the target year 2030.
(1) Required Access Channel Dimensions
In the first step of the access channel planning, the representative principal dimensions of large container vessels which have a possibility of calling at new berths to be developed off North Kalibaru have been taken into account.
In the second step of the channel planning, the required dimensions of the access channel comprising width and water depth which accommodate so-called design vessels, the maximum vessel dimensions have been determined.
1) Representative Principal Dimensions of Container Vessels
Representative principal dimensions of large container vessels potentially calling at the new container terminal to be allocated on candidate sites along northern coastal areas extending from in West Java Province, through DKI Jakarta to Banten Province have been analyzed and shown below.
Correlation between DWT and principal dimensions of Post-Panamax and Panamax container ships are shown in Figure 4.7-1 ~ Figure 4.7-7. In those figures, all the ships currently in operations worldwide are covered.
39.00
40.00
41.00
42.00
43.00
44.00
45.00
46.00
47.00
48.00
49.00
50.00
51.00
52.00
53.00
54.00
70,000 80,000 90,000 100,000 110,000 120,000 130,000 140,000 150,000 160,000 170,000
B M
LD
(m)
DWT
B MLD
y=bx^a+c
Source: Compiled by the Study Team based on the data from Fairplay
Figure 4.7-1 Correlation between DWT-Beam Length in Post-Panamax Container Ships
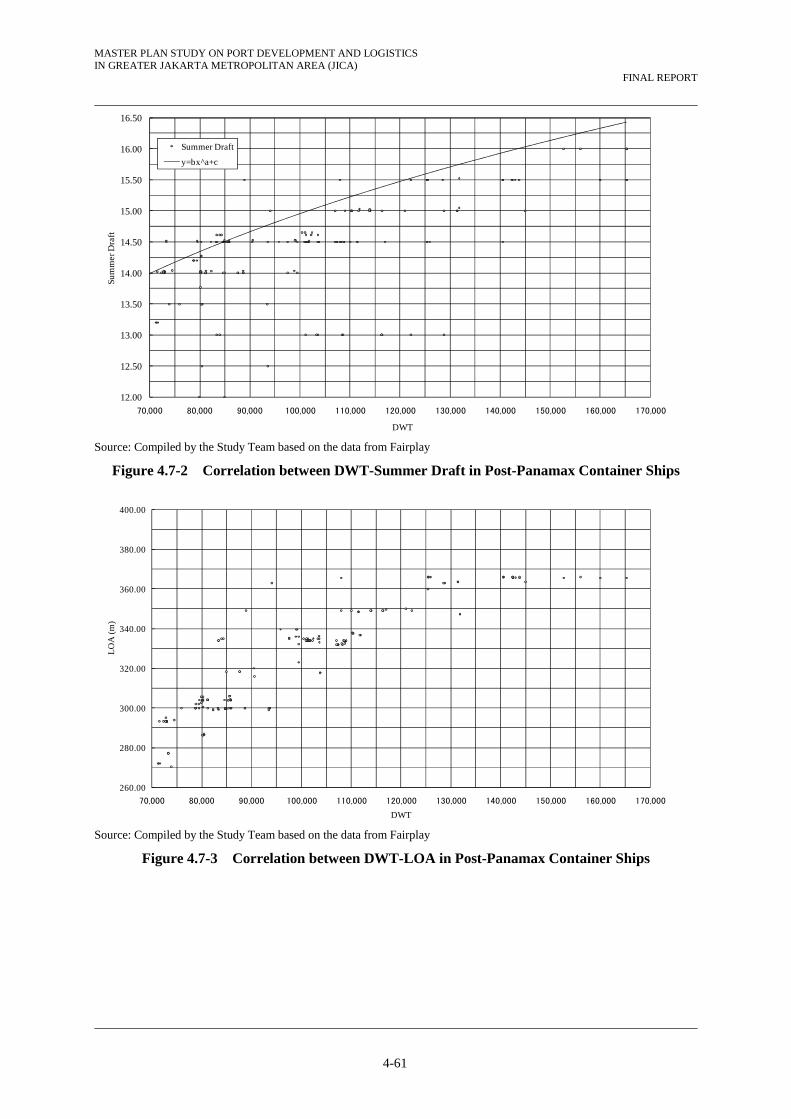
MASTER PLAN STUDY ON PORT DEVELOPMENT AND LOGISTICS IN GREATER JAKARTA METROPOLITAN AREA (JICA)
FINAL REPORT
4-61
12.00
12.50
13.00
13.50
14.00
14.50
15.00
15.50
16.00
16.50
70,000 80,000 90,000 100,000 110,000 120,000 130,000 140,000 150,000 160,000 170,000
Sum
mer
Dra
ft
DWT
Summer Draft
y=bx^a+c
Source: Compiled by the Study Team based on the data from Fairplay
Figure 4.7-2 Correlation between DWT-Summer Draft in Post-Panamax Container Ships
260.00
280.00
300.00
320.00
340.00
360.00
380.00
400.00
70,000 80,000 90,000 100,000 110,000 120,000 130,000 140,000 150,000 160,000 170,000
LO
A (m
)
DWT
Source: Compiled by the Study Team based on the data from Fairplay
Figure 4.7-3 Correlation between DWT-LOA in Post-Panamax Container Ships
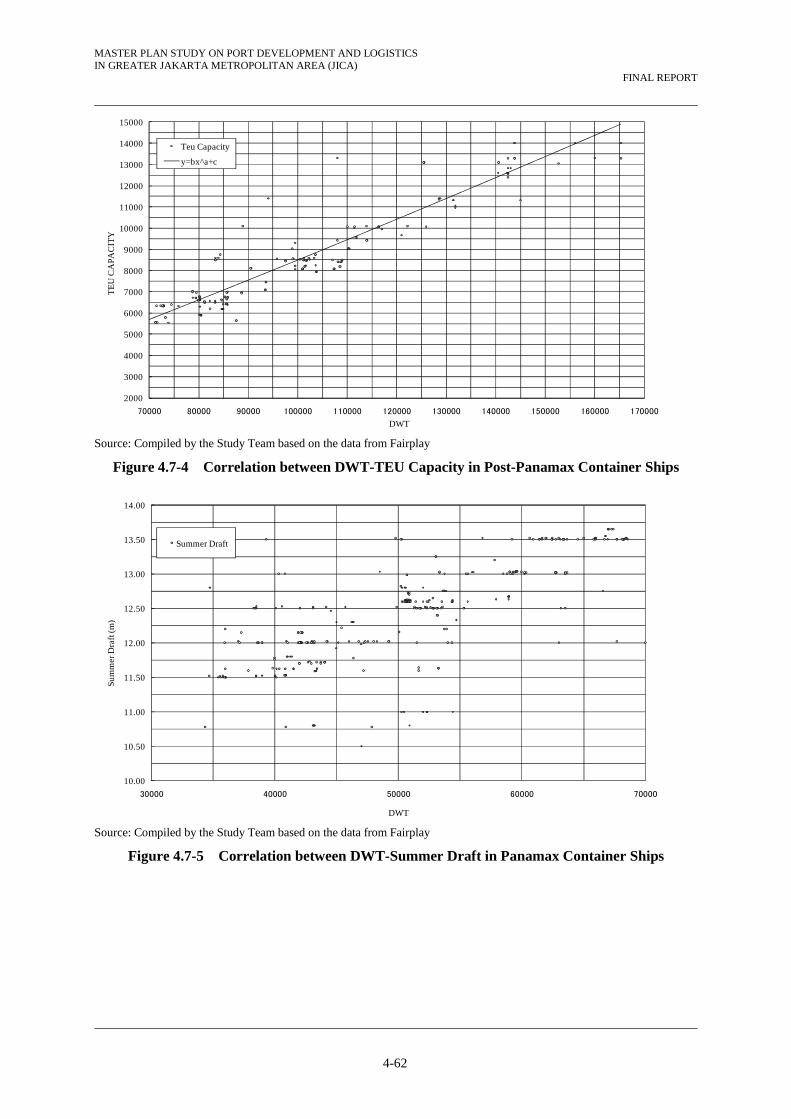
MASTER PLAN STUDY ON PORT DEVELOPMENT AND LOGISTICS IN GREATER JAKARTA METROPOLITAN AREA (JICA)
FINAL REPORT
4-62
2000
3000
4000
5000
6000
7000
8000
9000
10000
11000
12000
13000
14000
15000
70000 80000 90000 100000 110000 120000 130000 140000 150000 160000 170000
TE
U C
APA
CIT
Y
DWT
Teu Capacity
y=bx^a+c
Source: Compiled by the Study Team based on the data from Fairplay
Figure 4.7-4 Correlation between DWT-TEU Capacity in Post-Panamax Container Ships
10.00
10.50
11.00
11.50
12.00
12.50
13.00
13.50
14.00
30000 40000 50000 60000 70000
Sum
mer
Dra
ft (m
)
DWT
Summer Draft
Source: Compiled by the Study Team based on the data from Fairplay
Figure 4.7-5 Correlation between DWT-Summer Draft in Panamax Container Ships

MASTER PLAN STUDY ON PORT DEVELOPMENT AND LOGISTICS IN GREATER JAKARTA METROPOLITAN AREA (JICA)
FINAL REPORT
4-63
190.00
210.00
230.00
250.00
270.00
290.00
30000 40000 50000 60000 70000
LO
A (m
)
DWT
Source: Compiled by the Study Team based on the data from Fairplay
Figure 4.7-6 Correlation between DWT-LOA in Panamax Container Ships
1000
2000
3000
4000
5000
6000
30000 40000 50000 60000 70000
TE
U C
APA
CIT
Y
DWT
Source: Compiled by the Study Team based on the data from Fairplay
Figure 4.7-7 Correlation between DWT-TEU in Panamax Container Ships
As to container ship size, there is a clear trend that container ship sizes are getting larger year by year. In the year of 2007, container ships of Post-Panamax Type exceeded those of Panamax Type in terms of the total amount of TEU capacity. Since then, the gap has been getting wider (see Figure 4.7-8). Taking account of due deliveries, in 2014, it is forecast that the percentage of Post-Panamax Type will reach 51%, whereas Panamax Type and Handy-Size will be 30% and 19%, respectively.
Among Post-Panamax Type container ships, ship sizes are getting larger towards Super-Post Panamax and ULC S (Ultra Large Container Ship).
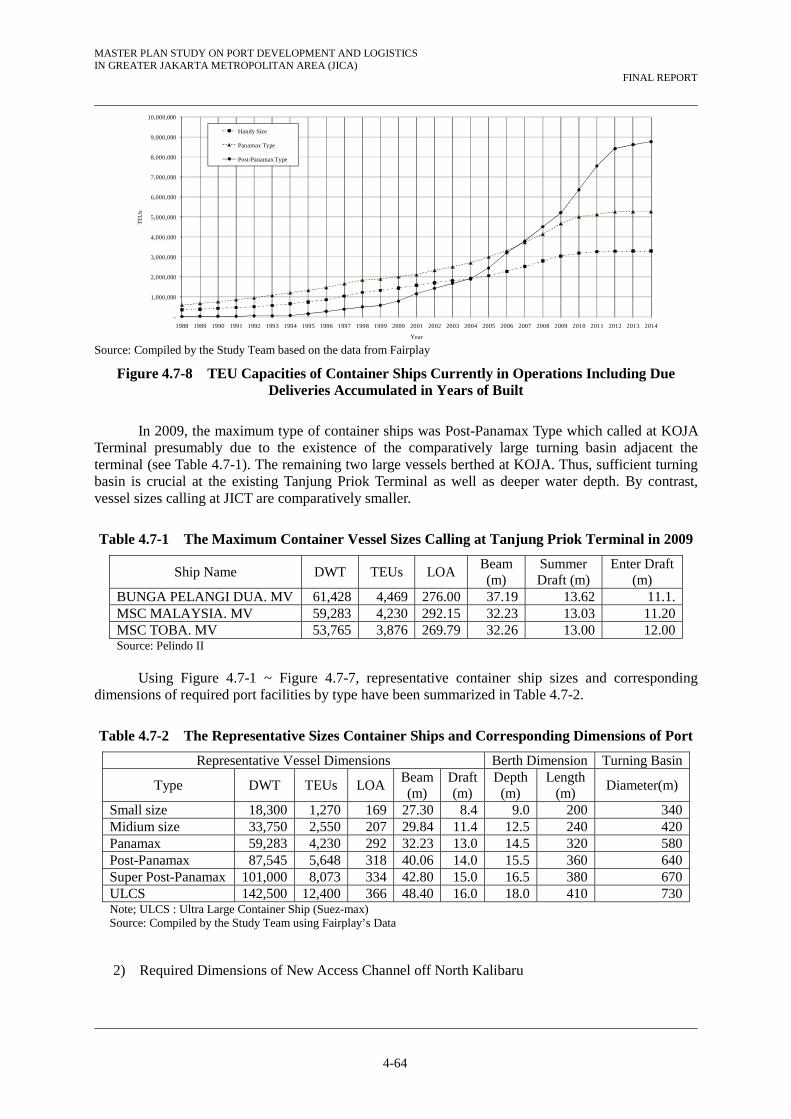
MASTER PLAN STUDY ON PORT DEVELOPMENT AND LOGISTICS IN GREATER JAKARTA METROPOLITAN AREA (JICA)
FINAL REPORT
4-64
-
1,000,000
2,000,000
3,000,000
4,000,000
5,000,000
6,000,000
7,000,000
8,000,000
9,000,000
10,000,000
1988 1989 1990 1991 1992 1993 1994 1995 1996 1997 1998 1999 2000 2001 2002 2003 2004 2005 2006 2007 2008 2009 2010 2011 2012 2013 2014
TE
Us
Year
Handy Size
Panamax Type
Post-Panamax Type
Source: Compiled by the Study Team based on the data from Fairplay
Figure 4.7-8 TEU Capacities of Container Ships Currently in Operations Including Due Deliveries Accumulated in Years of Built
In 2009, the maximum type of container ships was Post-Panamax Type which called at KOJA Terminal presumably due to the existence of the comparatively large turning basin adjacent the terminal (see Table 4.7-1). The remaining two large vessels berthed at KOJA. Thus, sufficient turning basin is crucial at the existing Tanjung Priok Terminal as well as deeper water depth. By contrast, vessel sizes calling at JICT are comparatively smaller.
Table 4.7-1 The Maximum Container Vessel Sizes Calling at Tanjung Priok Terminal in 2009
Ship Name DWT TEUs LOABeam (m)
Summer Draft (m)
Enter Draft (m)
BUNGA PELANGI DUA. MV 61,428 4,469 276.00 37.19 13.62 11.1.MSC MALAYSIA. MV 59,283 4,230 292.15 32.23 13.03 11.20MSC TOBA. MV 53,765 3,876 269.79 32.26 13.00 12.00Source: Pelindo II
Using Figure 4.7-1 ~ Figure 4.7-7, representative container ship sizes and corresponding
dimensions of required port facilities by type have been summarized in Table 4.7-2.
Table 4.7-2 The Representative Sizes Container Ships and Corresponding Dimensions of Port
Representative Vessel Dimensions Berth Dimension Turning Basin
Type DWT TEUs LOABeam(m)
Draft(m)
Depth(m)
Length (m)
Diameter(m)
Small size 18,300 1,270 169 27.30 8.4 9.0 200 340Midium size 33,750 2,550 207 29.84 11.4 12.5 240 420Panamax 59,283 4,230 292 32.23 13.0 14.5 320 580Post-Panamax 87,545 5,648 318 40.06 14.0 15.5 360 640Super Post-Panamax 101,000 8,073 334 42.80 15.0 16.5 380 670ULCS 142,500 12,400 366 48.40 16.0 18.0 410 730Note; ULCS : Ultra Large Container Ship (Suez-max) Source: Compiled by the Study Team using Fairplay’s Data
2) Required Dimensions of New Access Channel off North Kalibaru

MASTER PLAN STUDY ON PORT DEVELOPMENT AND LOGISTICS IN GREATER JAKARTA METROPOLITAN AREA (JICA)
FINAL REPORT
4-65
The bottom width of the planned two-way access channel has been designed through applying the prevailing guidelines including PIANC. According to the PIANC Guidelines, the required channel width has been estimated as 7.8 B (breadth of design vessel). Its breakdown is shown as follows:
- Basic Maneuvering lane 1.5B X 2- Bank Clearance 0.5B x 2- Vessel Speed 0.1B x 2- Cross current 0.1B x 2- Aids to navigation 0.1B x 2- Bottom surface 0.1B x 2- Depth of waterway 0.4B x 2- Hazardous 0.5B x 2- Passing lane 1.2B total 7.8B
In addition to PIANC guidelines, the deviation angle method has also been applied assuming
the angle of 15°. Required channel widths for ULCS (Ultra-Large Container Ships) according to PIANC Guidelines and the Deviation Angle Method are shown in Table 4.7-3. The required water depth for ULCS has been estimated to be 18 meters.
Table 4.7-3 Dimensions of Planned New Navigational Channel in the New Terminal
Maximum design vessel: Ultra Large Container Ship
Number of Lanes
PIANC Guideline Deviation Angle Method
Channel Width (D) m
Beam (B) m
LOA (A) m Channel
Width (D) m
Beam (B) m
LOA (A) m
48.40 366 48.4 366
D/B D/L D/B D/L
One-way 190 3.8 0.5 190 3.8 0.5
Two-way 380 7.8 1.0 380 7.8 1.0
Source: Made by the Study Team
Required channel widths for Super Post-Panamax Container Ships according to PIANC
Guidelines and the Deviation Angle Method are shown in Table 4.7-4. The required water depth for the ships has been estimated to be 16.5 meters.

MASTER PLAN STUDY ON PORT DEVELOPMENT AND LOGISTICS IN GREATER JAKARTA METROPOLITAN AREA (JICA)
FINAL REPORT
4-66
Table 4.7-4 Dimensions of Planned New Navigational Channel in the New Terminal
Maximum design vessel: Super Post-Panamax
Number of Lanes
PIANC Guideline Deviation Angle Method
Channel Width (D) m
Beam (B) m
LOA (A) m Channel
Width (D)
Beam (B) m
LOA (A) m
42.80 338 42.8 338
D/B D/L D/B D/L
One-way 160 3.8 0.5 170 4.0 0.5
Two-way 330 7.8 1.0 340 7.9 1.0
Source: Made by the Study Team
Required channel widths for Post-Panamax Container Ships are shown in Table 4.7-5. The
required water depth for the ships has been estimated to be 15.5 meters.
Table 4.7-5 Dimensions of Planned New Navigational Channel in the New Terminal
Maximum design vessel: Post-Panamax
Number of Lanes
PIANC Guideline Deviation Angle Method
Channel Width (D) m
Beam (B) m
LOA (A) m Channel
Width (D)
Beam (B) m
LOA (A) m
40.06 318 40.06 318
D/B D/L D/B D/L
One-way 150 3.8 0.5 160 4.0 0.5
Two-way 310 7.8 1.0 320 8.0 1.0
Source: Made by the Study Team
(2) Require Dimensions of New Berths off North Kalibaru
1) Vessel Size
The potentiality of direct services to Europe from the new terminal has been examined based on a cost analysis. The conditions and result of the analysis have been summarized in Table 4.7-6. As shown in the table, direct services by mother vessel and feeder services through transshipment at Singapore have been compared. In the case of direct services, three types of mother vessels, viz. Post-Panamax, Super-Post Panamax and ULCS have been used for comparison. In addition, their laden container numbers between Singapore and the new terminal have been assumed the same by taking account that larger type has a disadvantage compared to smaller types in terms of collectability of containers from the container market.
As indicated in “Transport Cost Index”, direct services are more economical than transshipment services regardless of the lower laden percentage due to high transshipment cost. Furthermore, larger vessels are more economical among Post-Panamax ships. However, there is no decisive difference among the four cases shown in the table.
If that is the case, direct services should be promoted rather than feeder services so as to avoid possible cargo damage by stevedoring at a transshipment port and to achieve shorter transport time for a destination port.

MASTER PLAN STUDY ON PORT DEVELOPMENT AND LOGISTICS IN GREATER JAKARTA METROPOLITAN AREA (JICA)
FINAL REPORT
4-67
On the other hand, as to the selection of the design vessel size among larger container ships, larger ones have a disadvantage compared to smaller types in terms of collectability of containers as mentioned above.
From the above, in this study, ordinary Post-Panamax type container ship with the capacity of around 6,000 TEUs has been selected as the maximum ship size for port facility planning.
Table 4.7-6 Container Transport Cost Comparison among various Ship Sizes on the Route between Jakarta Metropolitan Area and Europe via Singapore
TEU Capacity
Ship Type Laden Percentage between Jakarta and Singapore
Transshipment/ Direct
Transport Cost Index between
Jakarta and Europe
1,270 Feeder Ship/Post Panamax 100% (800 boxes)
Transshipment106
5,650 Post-Panamax 30% (1000 boxes) Direct 100
8,000 Super Post-Panamax 21% (1000 boxes) Direct 100
10,000 Ultra Large Container Ship 17% (1000 boxes) Direct 95
Source: Estimated by the Study Team
Principal dimensions of the design vessel of Post-Panamax Type are shown below:
- DWT: 88,000 tons - TEU Capacity: 5,600 TEUs - LOA: 320 m - Beam: 40 m - Summer draft: 14 m
2) Berth Dimensions:
To accommodate the design vessel mentioned in the former Clause “a.”, the following berth dimensions are required:
- Berth length: 360 m - Water depth: -15.5 m
(3) Berth Allocation Plan at Tanjung Priok Terminal
1) Target Container Volume for the New Terminal at North Kalibaru
According to the result of cargo demand forecast indicated in Section 4.2.1, the total volume of international containers in the target year of 2030 has been estimated as 13.4 million TEUs. As shown in Section 4, the capacity of the existing facilities of Tanjung Priok Terminal has been estimated as 4.9 million TEUs and this capacity is forecast to be reached by 2014.
Based on the above assumption, and taking account of the conversion of JICT II and MTI currently used for international containers into domestic container terminals, the required capacity for the new terminal has been estimated as 9.4 million TEUs in 2030 as computed as follows (see Table 4.7-10):
13.4 million TEUs –4.0 million TEUs = 9.4 million TEUs per annum

MASTER PLAN STUDY ON PORT DEVELOPMENT AND LOGISTICS IN GREATER JAKARTA METROPOLITAN AREA (JICA)
FINAL REPORT
4-68
2) Container Vessel Sizes Used for Berth Allocation Plan
Although Post-Panamax container ship has been selected as the maximum sized ship for the facility planning, she is not the only ship to call the new terminal. In other words, various ship sizes need to be considered to make an economical plan as shown in Table 4.7-7.
Table 4.7-7 Vessel Sizes Used for Berth Allocation Plan
Type DWT TEUs LOA Beam(m)
Draft(m)
Depth (m)
Length (m)
Small size 18,300 1,270 169 27.30 8.4 9.0 200 Midium size 33,750 2,550 207 29.84 11.4 12.5 240 Panamax 59,283 4,230 292 32.23 13.0 14.5 320 Post-Panamax 87,545 5,648 318 40.06 14.0 15.5 360 Source: The Study Team
3) Allocation of Containers by Ship Type
Containers to be handled at the new terminal in 2030 have been allocated as indicated in Table 4.7-8 by taking into account that direct calls will be promoted more than at present as mentioned in Section 4.5.2 (1).
Table 4.7-8 Allocation of Containers by Ship Type at a New Terminal in 2030
Unit: ‘000TEUs/year
Direct/Transshipment TotalAllocation
Small size Medium size Panamax Post-Panamax Eastbound Direct 60% 5,640 2,820 2,820 Westbound Direct 10% 940 940 Transshipment 30% 2,820 1,410 1,410 Total 100% 9,400 1,410 4,230 2,820 940 Source: Estimated by the Study Team
4) Required Berth Length
Taking into account the possible configuration of North Kalibaru container berth and phased implementation, the berth has been proposed as a so-called continuous berth with the same water depth in the condition that various types of container ships as shown in Table 4.7.1 will berth at various places rather than fixed places according to their various LOAs.
To simplify the calculation of required berth length, actual unit productivity per unit berth length achieved by JICT North in 2009, viz. 1,600 TEUs/m/year, has been applied (see Section 4.3.2 (1)). The resulting figure is 5,800 m as shown below:
- Required berth length: 9,400,000 TEUs/year /(1,600 TEUs/m/year) = 5,800 m The above result has been crosschecked by using berth-wise productivity intuitionally
understandable as follows:
- Calling ship types : Solely Panamax-type container ships
- Container-handling productivity: 25 boxes /hr/Gantry crane - TEU-box ratio = 1.5 - Berthing hours: 20 hrs - Gantry crane units per berth: 3 units - Berth length: 320 m - Number of weekly service per berth: 7 services x 0.65
- Yearly calls per berth: 237 calls (actual record of JCT in Dec. 2009)
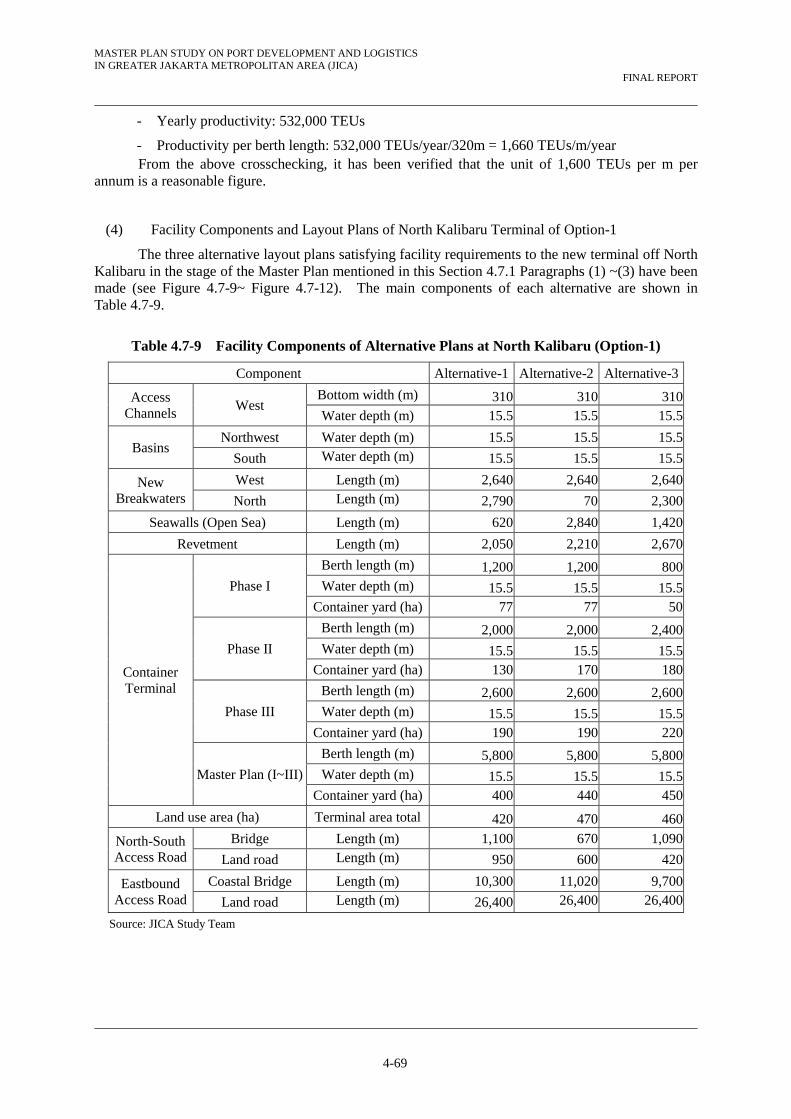
MASTER PLAN STUDY ON PORT DEVELOPMENT AND LOGISTICS IN GREATER JAKARTA METROPOLITAN AREA (JICA)
FINAL REPORT
4-69
- Yearly productivity: 532,000 TEUs
- Productivity per berth length: 532,000 TEUs/year/320m = 1,660 TEUs/m/year From the above crosschecking, it has been verified that the unit of 1,600 TEUs per m per
annum is a reasonable figure.
(4) Facility Components and Layout Plans of North Kalibaru Terminal of Option-1
The three alternative layout plans satisfying facility requirements to the new terminal off North Kalibaru in the stage of the Master Plan mentioned in this Section 4.7.1 Paragraphs (1) ~(3) have been made (see Figure 4.7-9~ Figure 4.7-12). The main components of each alternative are shown in Table 4.7-9.
Table 4.7-9 Facility Components of Alternative Plans at North Kalibaru (Option-1)
Component Alternative-1 Alternative-2 Alternative-3
Access Channels
West Bottom width (m) 310 310 310Water depth (m) 15.5 15.5 15.5
Basins Northwest Water depth (m) 15.5 15.5 15.5
South Water depth (m) 15.5 15.5 15.5
New Breakwaters
West Length (m) 2,640 2,640 2,640
North Length (m) 2,790 70 2,300
Seawalls (Open Sea) Length (m) 620 2,840 1,420
Revetment Length (m) 2,050 2,210 2,670
Container Terminal
Phase I
Berth length (m) 1,200 1,200 800Water depth (m) 15.5 15.5 15.5
Container yard (ha) 77 77 50
Phase II
Berth length (m) 2,000 2,000 2,400Water depth (m) 15.5 15.5 15.5
Container yard (ha) 130 170 180
Phase III
Berth length (m) 2,600 2,600 2,600Water depth (m) 15.5 15.5 15.5
Container yard (ha) 190 190 220
Master Plan (I~III)
Berth length (m) 5,800 5,800 5,800Water depth (m) 15.5 15.5 15.5
Container yard (ha) 400 440 450
Land use area (ha) Terminal area total 420 470 460
North-South Access Road
Bridge Length (m) 1,100 670 1,090
Land road Length (m) 950 600 420
Eastbound Access Road
Coastal Bridge Length (m) 10,300 11,020 9,700
Land road Length (m) 26,400 26,400 26,400
Source: JICA Study Team
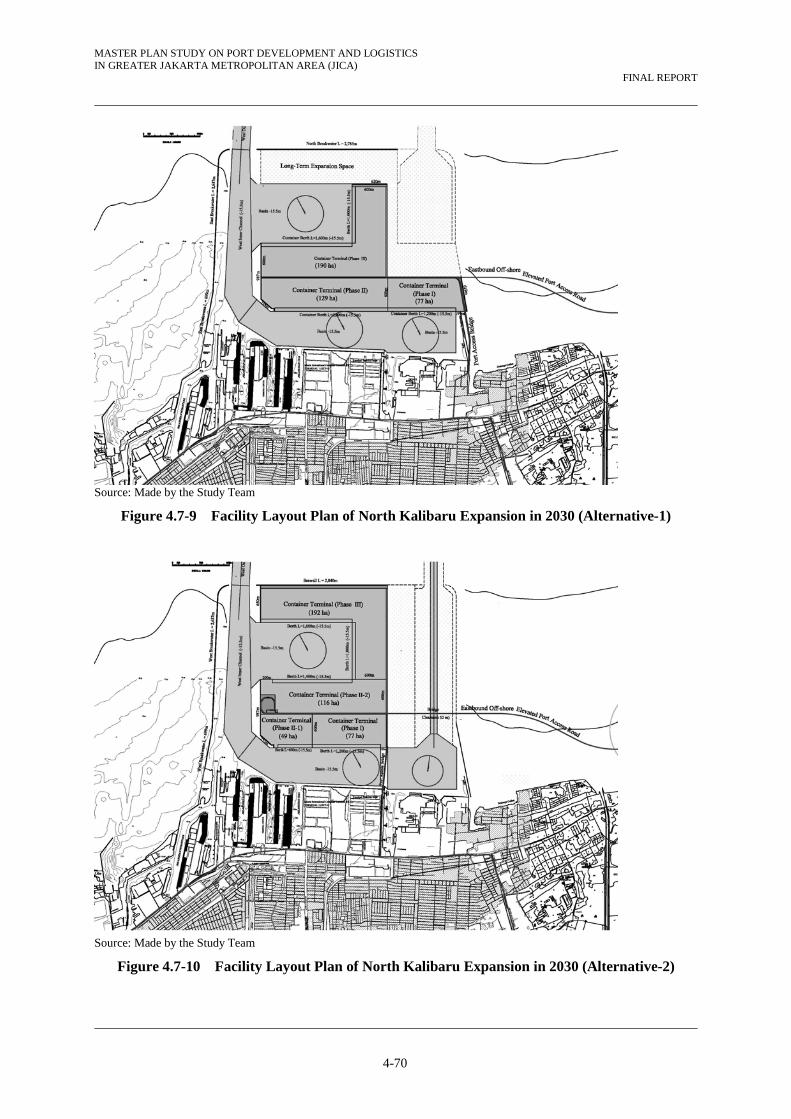
MASTER PLAN STUDY ON PORT DEVELOPMENT AND LOGISTICS IN GREATER JAKARTA METROPOLITAN AREA (JICA)
FINAL REPORT
4-70
Source: Made by the Study Team
Figure 4.7-9 Facility Layout Plan of North Kalibaru Expansion in 2030 (Alternative-1)
Source: Made by the Study Team
Figure 4.7-10 Facility Layout Plan of North Kalibaru Expansion in 2030 (Alternative-2)

MASTER PLAN STUDY ON PORT DEVELOPMENT AND LOGISTICS IN GREATER JAKARTA METROPOLITAN AREA (JICA)
FINAL REPORT
4-71
Source: Made by the Study Team
Figure 4.7-11 Facility Layout Plan of North Kalibaru Expansion in 2030 (Alternative-3)
Industrial Area
To Cikampek
Planned newport terminal
New portaccess road
JORR2
Source: Made by the Study Team
Figure 4.7-12 Access Road to North Kalibaru (Option-1)