bh ffm13 ppt_ch06
TRANSCRIPT
© 2013 Cengage Learning. All Rights Reserved. May not be scanned, copied, or duplicated, or posted to a publicly accessible website, in whole or in part.
Interest Rates
Cost of Money and Interest Rate LevelsDeterminants of Interest Rates
The Term Structure and Yield CurvesUsing Yield Curves to Estimate Future
Interest Rates
Chapter 6
6-1

© 2013 Cengage Learning. All Rights Reserved. May not be scanned, copied, or duplicated, or posted to a publicly accessible website, in whole or in part.
What four factors affect the level of interest rates?
• Production opportunities
• Time preferences for consumption
• Risk
• Expected inflation
6-2

© 2013 Cengage Learning. All Rights Reserved. May not be scanned, copied, or duplicated, or posted to a publicly accessible website, in whole or in part.
“Nominal” vs. “Real” Rates
r= represents any nominal rate
r*= represents the “real” risk-free rate of interest. Like a T-bill rate, if there was no inflation. Typically ranges from 1% to 5% per year.
rRF= represents the rate of interest on Treasury securities.
6-3

© 2013 Cengage Learning. All Rights Reserved. May not be scanned, copied, or duplicated, or posted to a publicly accessible website, in whole or in part.
Determinants of Interest Rates
r = r* + IP + DRP + LP + MRP
r = required return on a debt security
r* = real risk-free rate of interest
IP = inflation premium
DRP = default risk premium
LP = liquidity premium
MRP = maturity risk premium
6-4
© 2013 Cengage Learning. All Rights Reserved. May not be scanned, copied, or duplicated, or posted to a publicly accessible website, in whole or in part.
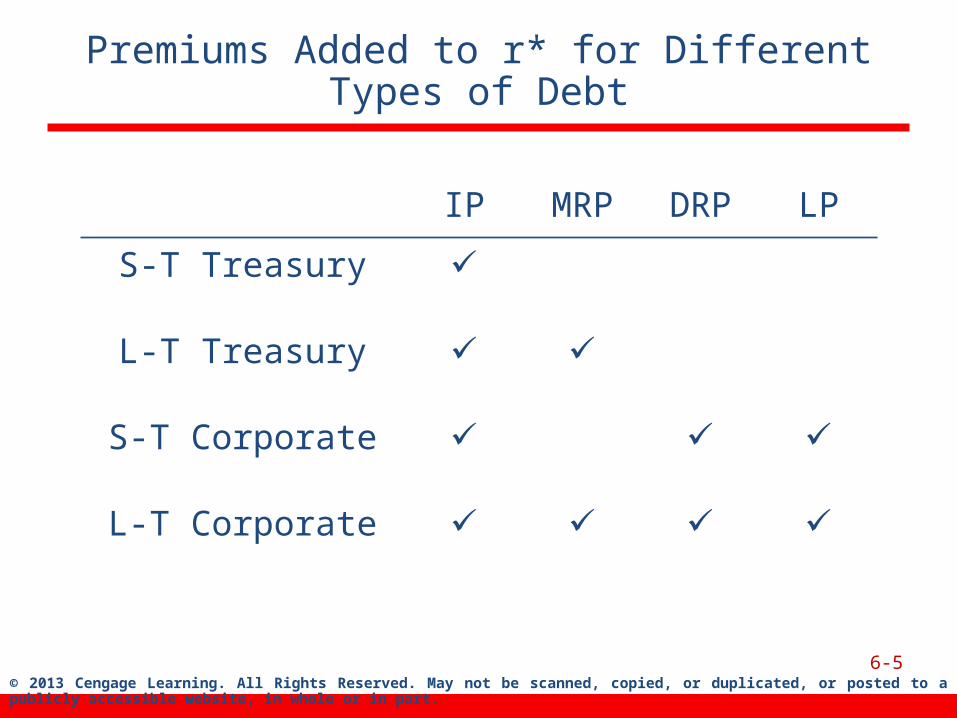
Premiums Added to r* for Different Types of Debt
IP MRP DRP LP
S-T Treasury
L-T Treasury
S-T Corporate
L-T Corporate
6-5
© 2013 Cengage Learning. All Rights Reserved. May not be scanned, copied, or duplicated, or posted to a publicly accessible website, in whole or in part.
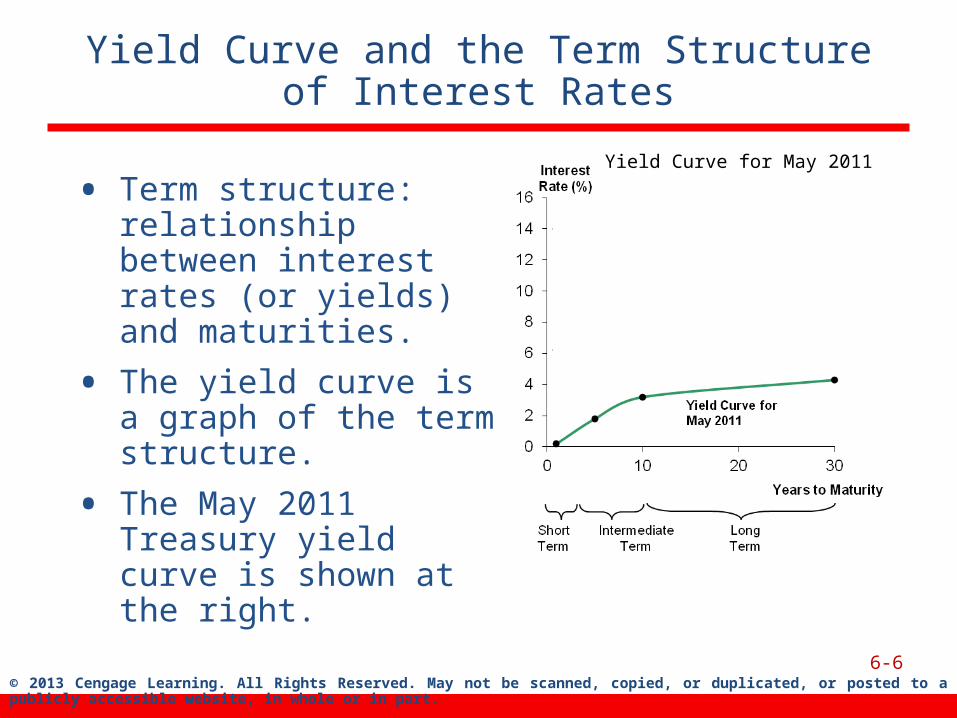
Yield Curve and the Term Structure of Interest Rates
• Term structure: relationship between interest rates (or yields) and maturities.
• The yield curve is a graph of the term structure.
• The May 2011 Treasury yield curve is shown at the right.
6-6
Yield Curve for May 2011

© 2013 Cengage Learning. All Rights Reserved. May not be scanned, copied, or duplicated, or posted to a publicly accessible website, in whole or in part.
Constructing the Yield Curve: Inflation
6-7
N
INFLIP
N
1tt
N
• Step 1: Find the average expected inflation rate over Years 1 to N:
© 2013 Cengage Learning. All Rights Reserved. May not be scanned, copied, or duplicated, or posted to a publicly accessible website, in whole or in part.
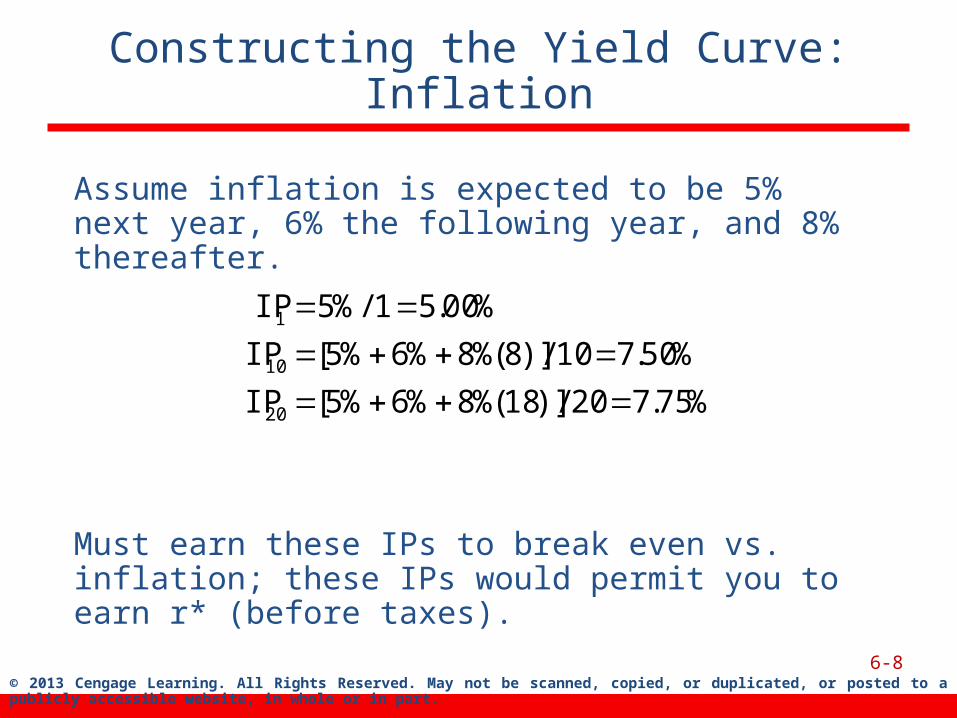
Constructing the Yield Curve: Inflation
Assume inflation is expected to be 5% next year, 6% the following year, and 8% thereafter.
Must earn these IPs to break even vs. inflation; these IPs would permit you to earn r* (before taxes).
6-8
%75.720/)]18%(8%6%5[IP%50.710/)]8%(8%6%5[IP
%00.51/%5IP
20
10
1

© 2013 Cengage Learning. All Rights Reserved. May not be scanned, copied, or duplicated, or posted to a publicly accessible website, in whole or in part.
Constructing the Yield Curve: Maturity Risk
• Step 2: Find the appropriate maturity risk premium (MRP). For this example, the following equation will be used to find a security’s appropriate maturity risk premium.
MRPt = 0.1% (t – 1)
6-9

© 2013 Cengage Learning. All Rights Reserved. May not be scanned, copied, or duplicated, or posted to a publicly accessible website, in whole or in part.
Constructing the Yield Curve: Maturity Risk
Using the given equation:
Notice that since the equation is linear, the maturity risk premium is increasing as the time to maturity increases, as it should be.
6-10
%9.1)120(%1.0MRP
%9.0)110(%1.0MRP
%0.0)11(%1.0MRP
20
10
1
© 2013 Cengage Learning. All Rights Reserved. May not be scanned, copied, or duplicated, or posted to a publicly accessible website, in whole or in part.
Add the IPs and MRPs to r* to Find the Appropriate Nominal Rates
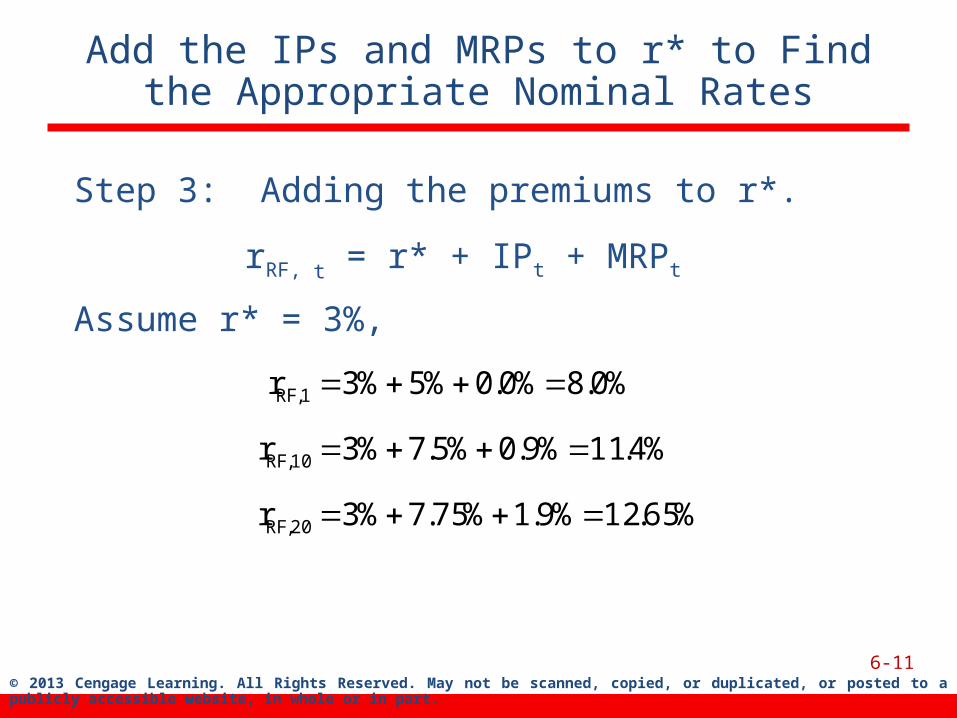
Step 3: Adding the premiums to r*.
rRF, t = r* + IPt + MRPt
Assume r* = 3%,
6-11
%65.12%9.1%75.7%3r
%4.11%9.0%5.7%3r
%0.8%0.0%5%3r
20,RF
10,RF
1,RF
© 2013 Cengage Learning. All Rights Reserved. May not be scanned, copied, or duplicated, or posted to a publicly accessible website, in whole or in part.
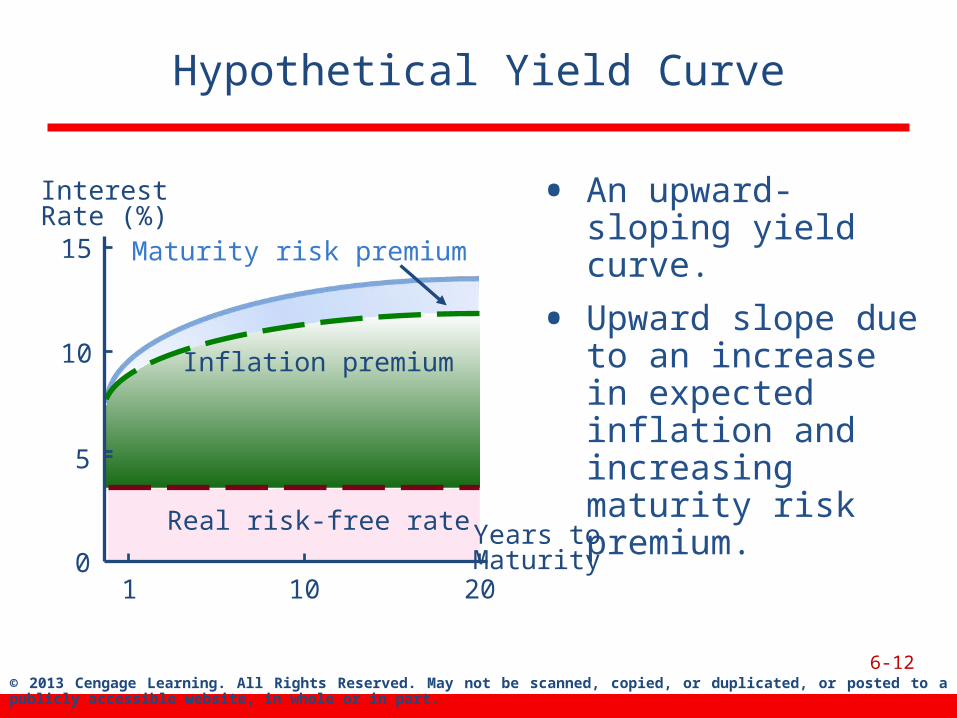
Hypothetical Yield Curve
• An upward-sloping yield curve.
• Upward slope due to an increase in expected inflation and increasing maturity risk premium.
6-12
Years to Maturity
Real risk-free rate
0
5
10
15
1
InterestRate (%)
Maturity risk premium
Inflation premium
10 20
© 2013 Cengage Learning. All Rights Reserved. May not be scanned, copied, or duplicated, or posted to a publicly accessible website, in whole or in part.
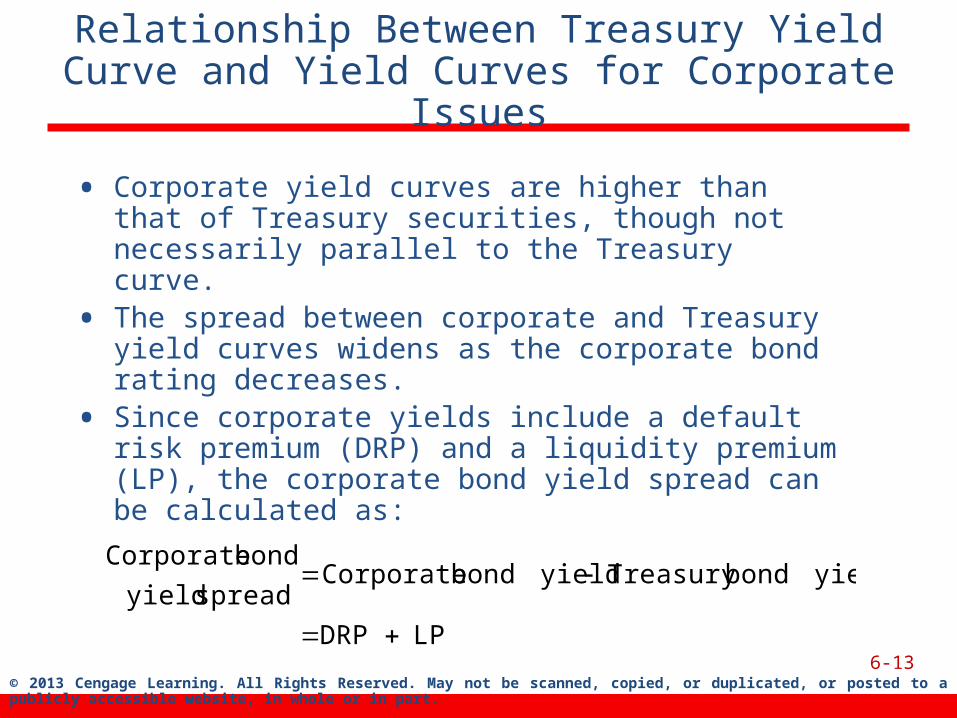
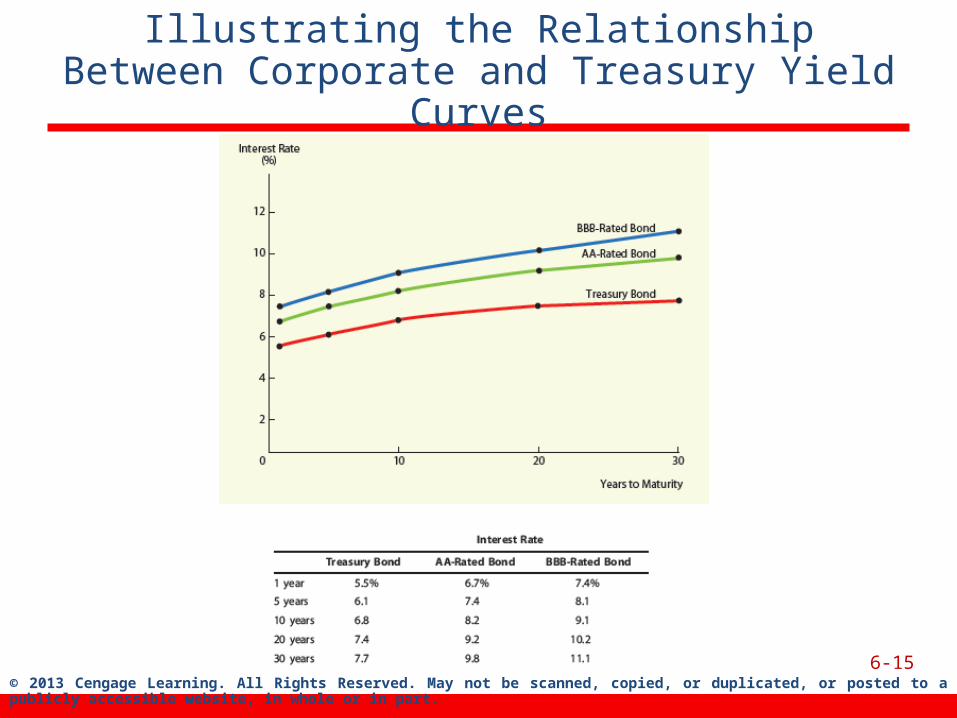
Relationship Between Treasury Yield Curve and Yield Curves for Corporate Issues
• Corporate yield curves are higher than that of Treasury securities, though not necessarily parallel to the Treasury curve.
• The spread between corporate and Treasury yield curves widens as the corporate bond rating decreases.
• Since corporate yields include a default risk premium (DRP) and a liquidity premium (LP), the corporate bond yield spread can be calculated as:
6-13LP DRP
yieldbondTreasury yieldbond Corporatespread yield
bond Corporate
© 2013 Cengage Learning. All Rights Reserved. May not be scanned, copied, or duplicated, or posted to a publicly accessible website, in whole or in part.
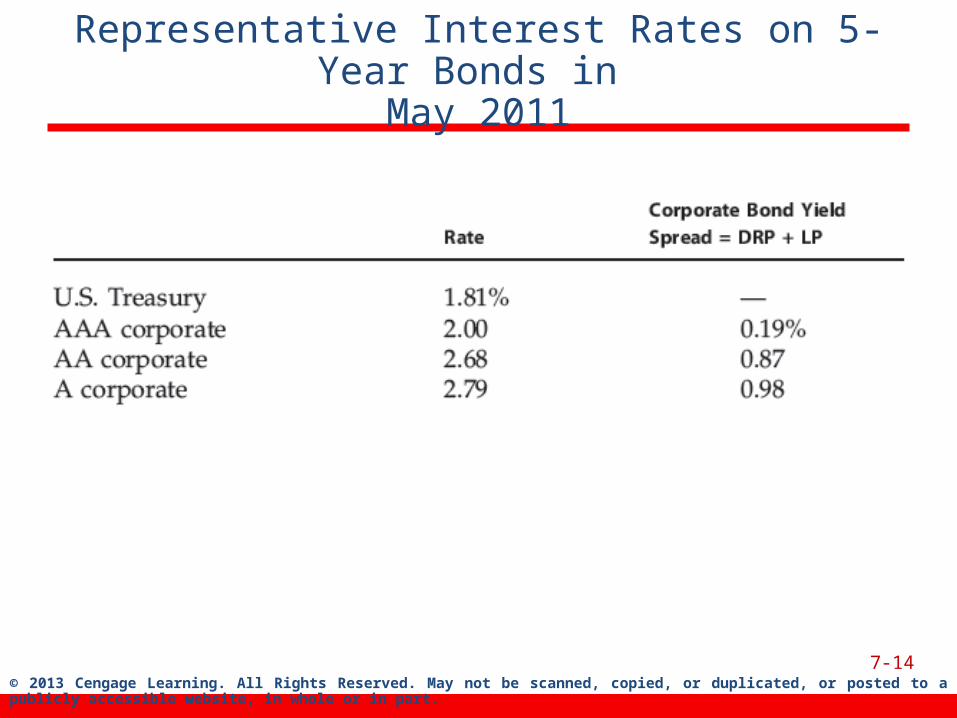
Representative Interest Rates on 5-Year Bonds in May 2011
7-14
© 2013 Cengage Learning. All Rights Reserved. May not be scanned, copied, or duplicated, or posted to a publicly accessible website, in whole or in part.
Illustrating the Relationship Between Corporate and Treasury Yield Curves
6-15
© 2013 Cengage Learning. All Rights Reserved. May not be scanned, copied, or duplicated, or posted to a publicly accessible website, in whole or in part.
Pure Expectations Theory
• The pure expectations theory contends that the shape of the yield curve depends on investors’ expectations about future interest rates.
• If interest rates are expected to increase, L-T rates will be higher than S-T rates, and vice-versa. Thus, the yield curve can slope up, down, or even bow.
6-16

© 2013 Cengage Learning. All Rights Reserved. May not be scanned, copied, or duplicated, or posted to a publicly accessible website, in whole or in part.
Assumptions of Pure Expectations
• Assumes that the maturity risk premium for Treasury securities is zero.
• Long-term rates are an average of current and future short-term rates.
• If the pure expectations theory is correct, you can use the yield curve to “back out” expected future interest rates.
6-17
© 2013 Cengage Learning. All Rights Reserved. May not be scanned, copied, or duplicated, or posted to a publicly accessible website, in whole or in part.
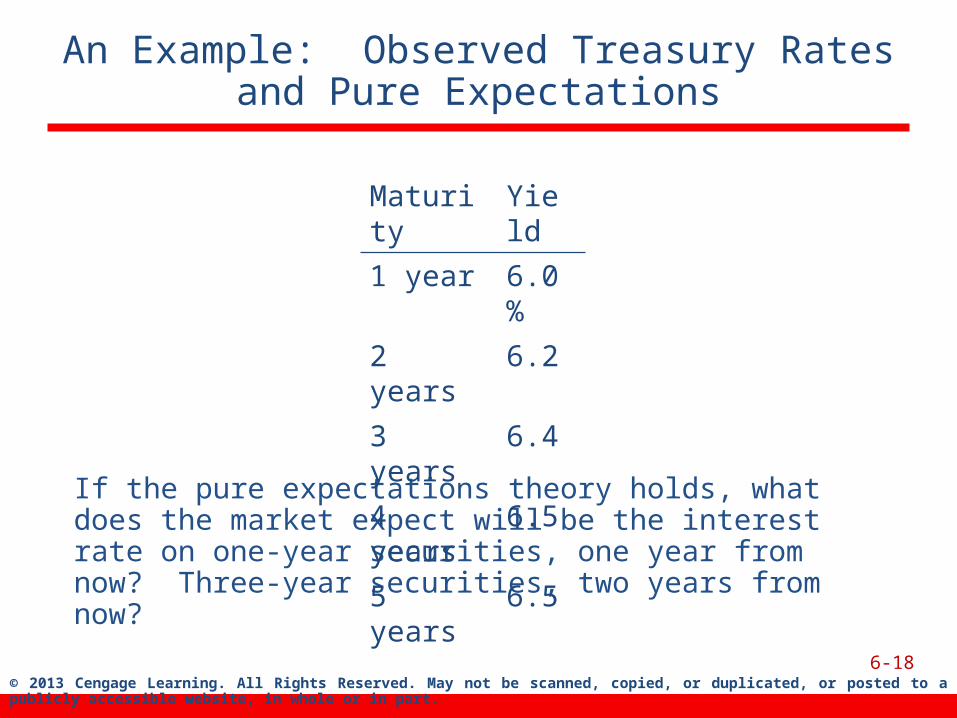
An Example: Observed Treasury Rates and Pure Expectations
If the pure expectations theory holds, what does the market expect will be the interest rate on one-year securities, one year from now? Three-year securities, two years from now?
6-18
Maturity Yield
1 year 6.0%
2 years 6.2
3 years 6.4
4 years 6.5
5 years 6.5
© 2013 Cengage Learning. All Rights Reserved. May not be scanned, copied, or duplicated, or posted to a publicly accessible website, in whole or in part.
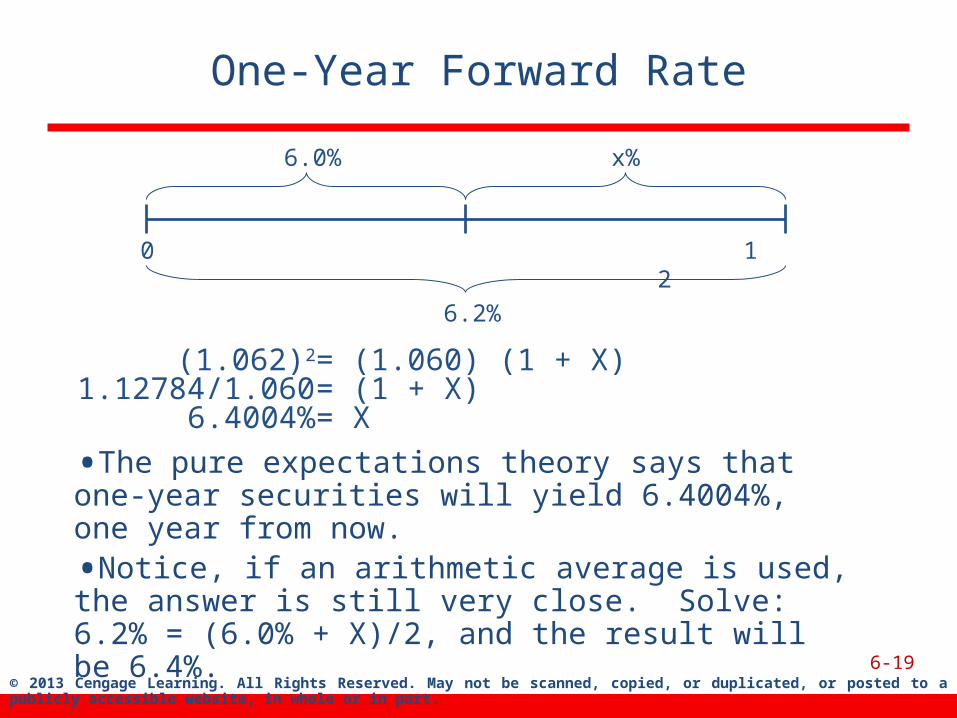
One-Year Forward Rate
(1.062)2 = (1.060) (1 + X)1.12784/1.060 = (1 + X)
6.4004% = X
•The pure expectations theory says that one-year securities will yield 6.4004%, one year from now. •Notice, if an arithmetic average is used, the answer is still very close. Solve: 6.2% = (6.0% + X)/2, and the result will be 6.4%.
6-19
0 1 2
6.0% x%
6.2%
© 2013 Cengage Learning. All Rights Reserved. May not be scanned, copied, or duplicated, or posted to a publicly accessible website, in whole or in part.
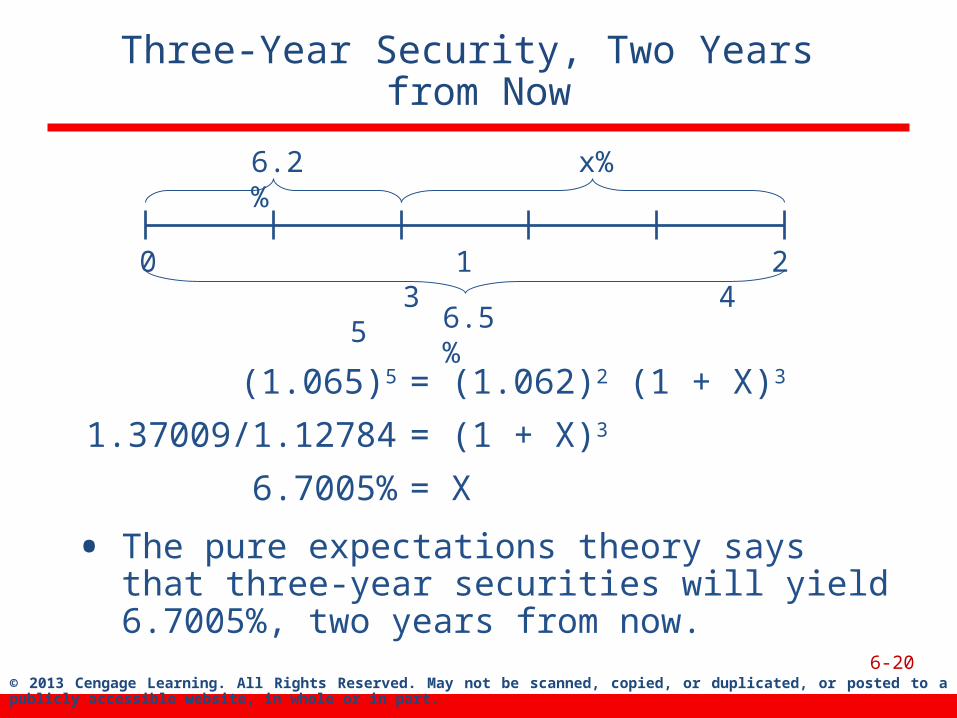
Three-Year Security, Two Years from Now
(1.065)5 = (1.062)2 (1 + X)3
1.37009/1.12784 = (1 + X)3
6.7005% = X
6-20
0 1 2 3 4 5
6.2% x%
6.5%
• The pure expectations theory says that three-year securities will yield 6.7005%, two years from now.
© 2013 Cengage Learning. All Rights Reserved. May not be scanned, copied, or duplicated, or posted to a publicly accessible website, in whole or in part.
Conclusions about Pure Expectations
• Some would argue that the MRP ≠ 0, and hence the pure expectations theory is incorrect.
• Most evidence supports the general view that lenders prefer S-T securities, and view L-T securities as riskier.
– Thus, investors demand a premium to persuade them to hold L-T securities (i.e., MRP > 0).
6-21

© 2013 Cengage Learning. All Rights Reserved. May not be scanned, copied, or duplicated, or posted to a publicly accessible website, in whole or in part.
Macroeconomic Factors That Influence Interest Rate Levels
• Federal reserve policy
• Federal budget deficits or surpluses
• International factors
• Level of business activity
6-22