bgaap consolidated accounts 2020
TRANSCRIPT
2020
#energy
#sustainability
ORES Assets BGAAP
consolidated accounts

Name and form
ORES Assets. Intermunicipal Cooperative Association.
Head office
Avenue Jean Mermoz 14, 6041 Gosselies.
Incorporation
Deed of incorporation published in the Appendices to the Moniteur belge (Belgian Official Gazette) of 10 January 2014 under number 14012014.
Articles of Association
The articles of association have been amended on several occasions most recently under the terms of a deed received by notary, Mr Frédéric de RUYVER, residing in Court-Saint-Etienne, on 18 June 2020, published in the Appendices to the Moniteur belge dated 13 July 2020 under number 20079215.
# p.1ORES Assets BGAAP consolidated accounts 2020
I. INTRODUCTION 21. Message from the Chairman of the Executive Board .................................................................................................................................................................. 42. Presentation of the company ...................................................................................................................................................................................................................................... 6
II. ACTIVITY AND SUSTAINABLE DEVELOPMENT REPORT – NON-FINANCIAL INFORMATION STATEMENT 81. 2020 at a glance .......................................................................................................................................................................................................................................................................102. Corporate social responsibility and sustainable development ....................................................................................................................................123. Energy transition and the environment ......................................................................................................................................................................................................164. Reliable and sustainable networks ...................................................................................................................................................................................................................325. Customers at the heart of the business .....................................................................................................................................................................................................446. Corporate culture and wellbeing at work ................................................................................................................................................................................................547. Governance and transparency ...............................................................................................................................................................................................................................598. Ethics and fair practices .................................................................................................................................................................................................................................................659. Societal engagement and local roots ...........................................................................................................................................................................................................67
III. MANAGEMENT REPORT 701. Notes to the annual financial statements ................................................................................................................................................................................................722. Annual financial statements ......................................................................................................................................................................................................................................85
IV. AUDITORS’ REPORT 116
V. REMUNERATION REPORTS 1241. Presentation of the management bodies ............................................................................................................................................................................................1262. Report from the ORES Assets Remuneration Committee ..............................................................................................................................................1273. Report from the ORES Appointments and Remuneration Committee .........................................................................................................1284. Report from the Board of Directors of ORES Assets .............................................................................................................................................................1295. Report from the Board of Directors of ORES ..................................................................................................................................................................................134
VI. SPECIFIC REPORT ON SHAREHOLDINGS 146
VII. GRI INDEX 150
Table of contents
#p.2 ORES Assets BGAAP consolidated accounts 2020
IINTRODUCTION
Message from the Chairman of the Executive Board
Presentation of the company
4
6
1.
2.
# p.3ORES Assets BGAAP consolidated accounts 2020
#p.4 ORES Assets BGAAP consolidated accounts 2020
1. Message from the Chairman of the Executive Board
2020 will remain in people’s memories as a year filled with uncertainty. When, on 9 January, the World Health Organisation announced the appearance of a deadly new coronavirus in the city of Wuhan, China, no one could have imagined then the impact that this situation would have on our lives in the months ahead and the dreadful health, social and economic consequences it would bring.
Now, as they look back at their business and publish their annual reports, countless companies and manufacturers are seeing the spectre of COVID overshadowing their results. ORES, like all companies responsible for providing so-called “essential” services for the community, has had both the duty and the good fortune to be able to continue its activities throughout the year.
We have, of course, also been affected by the pandemic and our ability to demonstrate our responsiveness and resilience in these troubled times has been put to the test. In order to participate in the collective health effort and to protect our colleagues and customers, we suspended work on our projects in mid-March, before gradually resuming in April. Nevertheless, we maintained our presence on the ground in such a way that was indispensable for the continued reliable distribution of energy. Various occurrences disrupted our roadmap and we experienced some difficulties along the way – my thoughts go in particular to the large-scale IT outage that affected the system handling budget meters – but, looking back today, we can safely say that ORES always did its utmost to be there for its customers.
# p.5ORES Assets BGAAP consolidated accounts 2020
As an introduction to this annual report, I would like to present a positive message. I would like to highlight the speed with which company staff adjusted to the circumstances, not only so that they could continue providing our essential services to the public at large, but also to enable the company’s major projects to take new steps forward. Whether it was facilitating and accelerating energy transition, implementing communicating digital metering systems, developing synergies between operators and continuing to make life easier for customers, including those who are most vulnerable, ORES was there. Despite the difficulties inherent to the health crisis – changes to timetables, mandatory working from home for many, interruptions to supply chains on a global scale – our colleagues were able to reinvent themselves, come up with solutions in their jobs and continue to work with great determination and efficiency.
Against a background of social distancing and barrier health gestures, ORES did not distance itself from its everyday partners. Quite the opposite, in fact. Mindful of the recovery that will come after this health crisis, our company chose to continue meeting – albeit virtually – representatives from the public authorities, was well as various providers in the world of energy, consumer rights associations and more vulnerable people, representatives from SMEs and the self-employed, representatives from the academic world and many more. It emerged from these exchanges that the main expectation of our stakeholders in relation to ORES as a network manager lies in providing active, effective and dependable guidance and support for energy transition that is beneficial for the planet and synonymous with opportunities for businesses and to the advantage of every category of consumer.
This inclusive and local energy transition is the vision that we put forward in our strategic plan 2021-2023 and which was demonstrated by the numerous projects we undertook last year. For example, in the context of the implementation of renewable energy communities, in the use of innovative technologies and artificial intelligence for better managing the intermittent nature of renewable energy, or in our support for the promotion of new sectors, such as biomethane, which was injected for the first time into our distribution network in 2020.
Finally, from a financial point of view, our business continued throughout the year, enabling us to maintain our position and strength. Our results are comparable with those of the previous financial year, which is encouraging both for the next stages in our ambitious investment plan and for our shareholders.
I trust you will enjoy reading this report.
Fernand Grifnée
Chairman of the Executive Board
#p.6 ORES Assets BGAAP consolidated accounts 2020
2. Presentation of the companyORES is deeply anchored in Walloon society: it manages and operates the electricity and/or gas distribution networks in three out of four local authority areas, as well as the public lighting stock. The company guides the public authorities in their energy transition and invests in infrastructures and systems preparing the future of the energy market.
The health crisis that marked 2020 and the early months of 2021 has served to reaffirm the importance of companies that provide basic services to the population. ORES guarantees access to energy for households, professionals, companies and public services and, as such, it is in one of the country’s crucial sectors.
A critical mission
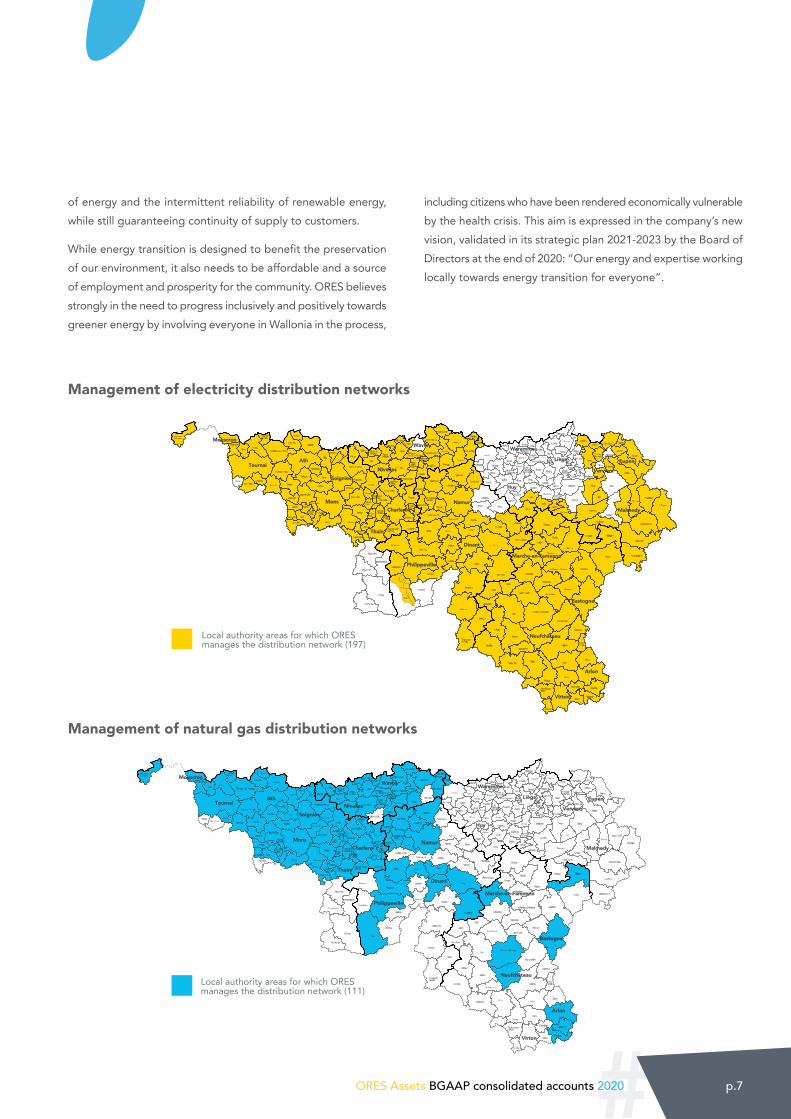
With its 2,400 employees – engineers, technicians, IT specialists and administrative staff – ORES operates nearly 52,000 kilometres of electricity networks in 197 local authority areas and almost 10,000 kilometres of gas networks in 111. In doing so, the company supplies some 1.4 million customers with energy, 24 hours a day, 365 days a year. The company also maintains and monitors the modernisation of the stock of public lighting in more than 75% of local authority areas in Wallonia, currently representing a little over 460,000 lighting points.
As a leading player in the economy, ORES has invested 1.6 billion euros in distribution networks over the past six years in order to guarantee the quality of customer supplies and to prepare for the future. At the same time, the company seeks to controls its overheads and, for the past few years it has kept distribution charges – which represent a significant portion of customers’ energy bills – below the level of inflation.
Making energy easier, making life easier
ORES aims to make life easier for its customers in terms of energy by providing them with local services geared to their requirements. For the past few years, the company has worked on simplifying the procedures related to work requests: connections to the network, the installation or relocation of meters, synchronising works with water distribution and telecoms operators, etc.
The company also conducts fundamental work to ensure that the energy market functions properly: collecting and validating data for the consumption and production of energy, updating this data in the access register, managing changes of providers and relocations.
Elsewhere, through its Open Data process and as a party involved in energy transition, ORES aimed in 2020 to make available all usable data linked to its work as a network manager. The data that can be accessed via the ORES website – in compliance with the General Data Protection Regulation – is intended for a range of uses and for partners that include customers, local authorities, government departments, the academic world, companies working in innovation, European projects and public or private administrations, etc.
Finally, through its public service obligations (PSO), ORES seeks to guarantee access to energy for all. The company provides prepayment solutions for customers in payment arrears with their providers, participating in local energy committees (LEC) in PCSWs by providing guidance and support to customers experiencing difficulties in paying, while providing social supplies to customers who meet the conditions to receive a grant.
The challenge: inclusive energy transition
The company aims to make all of its technological expertise and networks available for energy transition in the Walloon Region and to help society as a whole to move away from its dependence on fossil fuels. In 2021, in the same way as the country’s other energy network managers, ORES was granted the title of “SDG Voice” – i.e. to be an ambassador for the Sustainable Development Goals of the United Nations.
Since it was created, ORES has connected almost 140,000 decentralised renewable electricity production units – wind, photovoltaic, hydraulic or biomass – to its electricity networks. In 2020, the first injection station in Wallonia for biomethane produced from organic waste from farming was connected to the gas distribution network. ORES is working on innovative solutions designed to increase the ratio of renewable energy in its networks and to accelerate ecological transition: the use of artificial intelligence to avoid network congestion, community renewable energy projects, opening the energy networks to alternative mobility, etc. The challenge is to be able to transform the network so that it can adapt to these new bidirectional flows
# p.7ORES Assets BGAAP consolidated accounts 2020
of energy and the intermittent reliability of renewable energy, while still guaranteeing continuity of supply to customers.
While energy transition is designed to benefit the preservation of our environment, it also needs to be affordable and a source of employment and prosperity for the community. ORES believes strongly in the need to progress inclusively and positively towards greener energy by involving everyone in Wallonia in the process,
including citizens who have been rendered economically vulnerable by the health crisis. This aim is expressed in the company’s new vision, validated in its strategic plan 2021-2023 by the Board of Directors at the end of 2020: “Our energy and expertise working locally towards energy transition for everyone”.
Beauvechain
Chaumont-Gistoux
Court-Saint-Étienne
Grez-Doiceau
Incourt
Jodoigne
Mont-Saint-Guibert
Perwez
Rixensart
Villers-la-Ville
Chastre
Hélécine
Lasne Orp-JaucheOttignies-Louvain-la-Neuve
Ramillies
Walhain
Comines-Wameton
La Roche-en-Ardenne
Nassogne
Rendeux
Tenneville
Manhay
Bertrix
Bouillon
Daverdisse
Herbeumont
Léglise
Libin
Paliseul
Saint-Hubert
Tellin
Wellin
Libramont-Chevigny
Chiny
Étalle
Florenville
Meix-devant-Virton
Musson
Saint-Léger
Tintigny
Flobecq
Châtelet
Farcien-nes
Fleurus
Gerpinnes
Montigny-le-Tilleul
Aiseau - Presles
Dour
Frameries
Honnelles Quévy
Beaumont
Chimay
Erquelinnes
Froidchapelle
Lobbes
Merbes- le-Château
Momignies
Estinnes
Ham-sur-Heure -Nalinnes
Sivry-Rance
Amay
Burdinne
Clavier
Ferrières
Hamoir
Héron
Marchin
Modave
Nandrin
Ouffet
Verlaine
Villers- le-Bouillet
Wanze
Anthisnes
Engis
Tinlot
Ans
Awans
Aywaille
Bassenge
Beyne-Heusay
Chaud-fontaine
Comblain-au-Pont
Dalhem
Esneux
Fléron
Herstal
JuprelleOupeye
Saint-Nicolas
Seraing
Soumagne
Sprimont
Visé
Grâce-Hollogne
Blégny
Flémalle
Neupré
Trooz
Amel/Amblève
Aubel
Baelen
Bullingen
Butgenbach
Dison
Herve
Jalhay
Kelmis
Lierneux
Limbourg
Lontzen
Olne
Pepinster
Raeren
Sankt-Vith
Spa
Stavelot
Stoumont
Theux
Waimes
Welkenraedt
Trois-Ponts
Burg-Reuland
Plombières
Thimister- Clermont
Berloz
Braives
Crisnée
DonceelFexhe-le-Haut-ClocherGeer
Hannut
LincentOreye
Remicourt
Saint-Georges-sur-Meuse
Wasseige
Faimes
Braine-L'alleud
Braine-le-Château
Genappe
Ittre
La Hulpe
Tubize
Waterloo
Rebecq
Beloeil
Bernissart
Brugelette
Chièvres
Ellezelles
Frasnes - Lez - Anvaing
Chapelle-lez-Herlaimont
Courcelles
Fontaine-l'Évêque
Manage
Pont-à-Celles
Seneffe
Les Bons Villers
BoussuHensies
Jurbise
Lens
Quaregnon
Quiévrain
Saint-Ghislain
Colfon-Taine
Braine-le-Comte
Enghien
La Louvière
Lessines
Le Roeulx
Silly
Écaussines
Ander-Lues
Binche
Morlan-Welz
Antoing
Celles
Estaimpuis
Pecq
Péruwelz
RumesBrunehaut
Leuze-en-Hainaut
Mont-de-l'Enclus
Attert
Aubange
Marte-Lange
Messancy
Fauvillers
Houffalize
Vielsalm
Vaux-sur-Sûre
Gouvy
Sainte-Ode
Durbuy
Érezée
Hotton
Rouvroy
Habay
Anhée
Beauraing
Bièvre
Ciney
Gedinne
Hamois
Havelange
Houyet
Onhaye
Rochefort
Somme-Leuze
Yvoir
Hastière
Vresse-sur-Semois
Andenne
Assesse
Éghezée
Floreffe
Fosses-la-Ville
Gesves
Mettet
Ohey
Profondeville
Sombreffe
Sambreville
Fernelmont
Jemeppe-sur- Sambre
La Bruyère
Gembloux
Cerfontaine
Couvin
Doische
Florennes
Walcourt
Viroinval Bertogne
AthTournai
Mouscron
Soignies
Mons
Charleroi
Thuin
Nivelles
Wavre
Namur
Philippeville
Dinant
Huy
Waremme
Liège
Verviers
Marche-en-Famenne
Bastogne
Neufchâteau
Virton
Arlon
Malmedy
Eupen
www.ores.be
Gestion des réseaux de distribution en gaz naturel
Légende
Communes pour lesquelles ORES est gestionnaire du réseau de distribution (111)
Janvier 2020
C
M
J
CM
MJ
CJ
CMJ
N
ai158557640420_2020-01_ORES_map_gestion_reseau_distribution_G_FR_A0.pdf 1 30/03/2020 15:53:26
Beauvechain
Chaumont-Gistoux
Court-Saint-Étienne
Grez-Doiceau
Incourt
Jodoigne
Mont-saint-Guibert
Perwez
Rixensart
Villers-la-Ville
Chastre
Hélécine
Lasne Orp-JaucheOttignies-Louvain-la-Neuve
Ramillies
Walhain
Comines-Wameton
La Roche-en-Ardenne
Nassogne
Rendeux
Tenneville
Manhay
Bertrix
Bouillon
Daverdisse
Herbeumont
Léglise
Libin
Paliseul
Saint-Hubert
Tellin
Wellin
Libramont-Chevigny
Chiny
Étalle
Florenville
Meix-devant-Virton
Musson
Saint-Léger
Tintigny
Flobecq
Châtelet
Farcien-nes
Fleurus
Gerpinnes
Montigny-le-Tilleul
Aiseau - Presles
Dour
Frameries
Honnelles Quévy
Beaumont
Chimay
Erquelinnes
Froidchapelle
Lobbes
Merbes- le-Château
Momignies
Estinnes
Ham-sur-Heure -Nalinnes
Sivry-Rance
Amay
Burdinne
Clavier
Ferrières
Hamoir
Héron
Marchin
Modave
Nandrin
Ouffet
Verlaine
Villers- Le-bouillet
Wanze
Anthisnes
Engis
Tinlot
Ans
Awans
Aywaille
Bassenge
Beyne-Heusay
Chaud-fontaine
Comblain-au-Pont
Dalhem
Esneux
Fléron
Herstal
JuprelleOupeye
Saint-Nicolas
Seraing
Soumagne
Sprimont
Visé
Grâce-Hollogne
Blégny
Flémalle
Neupré
Trooz
Amel/Amblève
Aubel
Baelen
Bullingen
Butgenbach
Dison
Herve
Jalhay
Kelmis
Lierneux
Limbourg
Lontzen
Olne
Pepinster
Raeren
Sankt-Vith
Spa
Stavelot
Stoumont
Theux
Waimes
Welkenraedt
Trois-Ponts
Burg-Reuland
Plombières
Thimister-Clermont
Berloz
Braives
Crisnée
DonceelFexhe-le-Haut-ClocherGeer
Hannut
LincentOreye
Remicourt
Saint-Georges-sur-Meuse
Wasseige
Faimes
Braine-l'Alleud
Braine-le-Château
Genappe
Ittre
La Hulpe
Tubize
Waterloo
Rebecq
Beloeil
Bernissart
Brugelette
Chièvres
Ellezelles
Frasnes - Lez - Anvaing
Chapelle-lez-Herlaimont
Courcelles
Fontaine-l’Évêque
Manage
Pont-à-Celles
Seneffe
Les Bons Villers
BoussuHensies
Jurbise
Lens
Quaregnon
Quiévrain
Saint-Ghislain
Colfon-Taine
Braine-le-Comte
Enghien
La Louvière
Lessines
Le Roeulx
Silly
Écaussines
Ander-Lues
Binche
Morlan-Welz
Antoing
Celles
Estaimpuis
Pecq
Péruwelz
RumesBrunehaut
Leuze-en-Hainaut
Mont-de-l'Enclus
Attert
Aubange
Marte-Lange
Messancy
Bertogne
Fauvillers
Houffalize
Vielsalm
Vaux-sur-Sûre
Gouvy
Sainte-Ode
Durbuy
Érezée
Hotton
Rouvroy
Habay
Anhée
Beauraing
Bièvre
Ciney
Gedinne
Hamois
Havelange
Houyet
Onhaye
Rochefort
Somme-Leuze
Yvoir
Hastière
Vresse-sur-Semois
Andenne
Assesse
Éghezée
Floreffe
Fosses-la-Ville
Gesves
Mettet
Ohey
Profondeville
Sombreffe
Sambreville
Fernelmont
Jemeppe-sur- Sambre
La Bruyère
Gembloux
Cerfontaine
Couvin
Doische
Florennes
Walcourt
Viroinval
AthTournai
Mouscron
Soignies
Mons
Charleroi
Thuin
Nivelles
Wavre
Namur
Philippeville
Dinant
Huy
Waremme
Liège
Verviers
Marche-en-Famenne
Bastogne
Neufchâteau
Virton
Arlon
Malmedy
Eupen
www.ores.be
Gestion des réseaux de distribution en électricité
Légende
Communes pour lesquelles ORES est gestionnaire du réseau de distribution (197)
Janvier 2020
ai158557846728_2020_01_ORES_map_gestion_reseau_distribution_E_FR_A0.pdf 1 30/03/2020 16:27:51
Management of electricity distribution networks
Management of natural gas distribution networks
Local authority areas for which ORES manages the distribution network (197)
Local authority areas for which ORES manages the distribution network (111)
#p.8 ORES Assets BGAAP consolidated accounts 2020
IIACTIVITY AND SUSTAINABLE DEVELOPMENT REPORT – NON-FINANCIAL INFORMATION STATEMENT
1. 2020 at a glance ...................................................................................................................................................................................................... 102. Corporate social responsibility and sustainable development ................................................................... 123. Energy transition and the environment ..................................................................................................................................... 164. Reliable and sustainable networks ..................................................................................................................................................325. Customers at the heart of the business ....................................................................................................................................446. Corporate culture and wellbeing at work ...............................................................................................................................547. Governance and transparency ..............................................................................................................................................................598. Ethics and fair practices ................................................................................................................................................................................659. Societal engagement and local roots .......................................................................................................................................... 67
# p.9ORES Assets BGAAP consolidated accounts 2020
#p.10 ORES Assets BGAAP consolidated accounts 2020
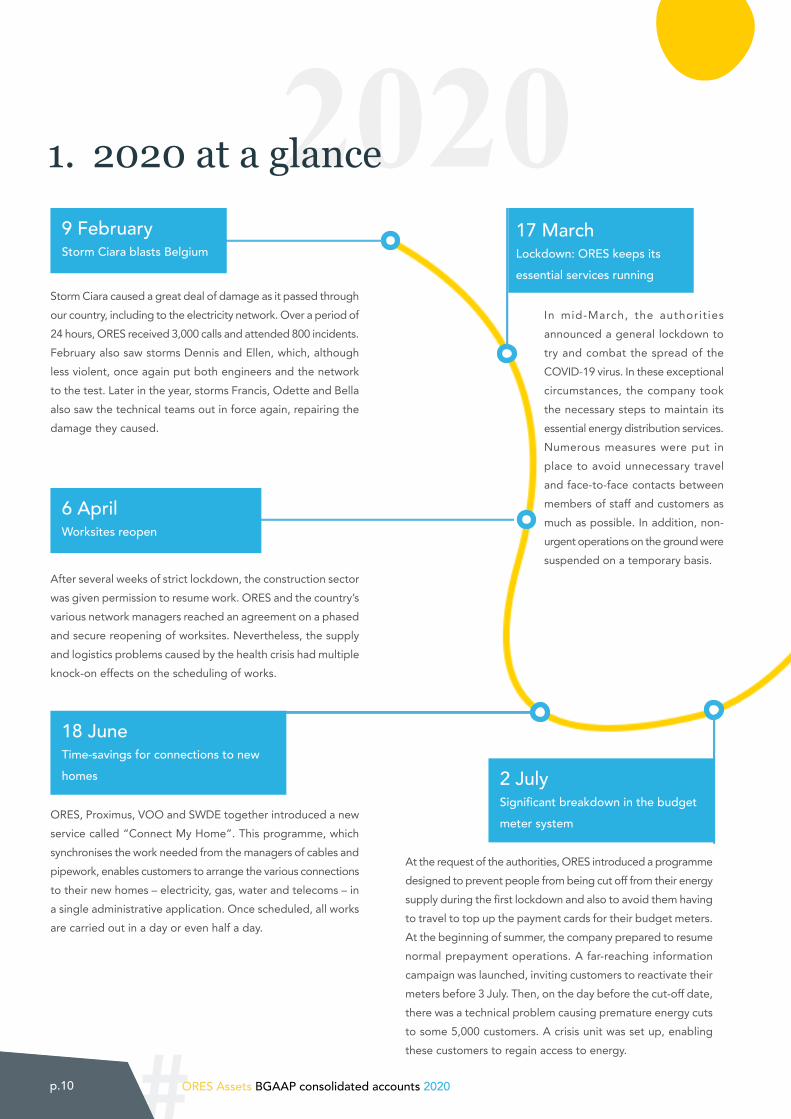
20201. 2020 at a glance9 FebruaryStorm Ciara blasts Belgium
17 MarchLockdown: ORES keeps its
essential services running
6 AprilWorksites reopen
18 JuneTime-savings for connections to new
homes 2 JulySignificant breakdown in the budget
meter system
Storm Ciara caused a great deal of damage as it passed through our country, including to the electricity network. Over a period of 24 hours, ORES received 3,000 calls and attended 800 incidents. February also saw storms Dennis and Ellen, which, although less violent, once again put both engineers and the network to the test. Later in the year, storms Francis, Odette and Bella also saw the technical teams out in force again, repairing the damage they caused.
After several weeks of strict lockdown, the construction sector was given permission to resume work. ORES and the country’s various network managers reached an agreement on a phased and secure reopening of worksites. Nevertheless, the supply and logistics problems caused by the health crisis had multiple knock-on effects on the scheduling of works.
At the request of the authorities, ORES introduced a programme designed to prevent people from being cut off from their energy supply during the first lockdown and also to avoid them having to travel to top up the payment cards for their budget meters. At the beginning of summer, the company prepared to resume normal prepayment operations. A far-reaching information campaign was launched, inviting customers to reactivate their meters before 3 July. Then, on the day before the cut-off date, there was a technical problem causing premature energy cuts to some 5,000 customers. A crisis unit was set up, enabling these customers to regain access to energy.
ORES, Proximus, VOO and SWDE together introduced a new service called “Connect My Home”. This programme, which synchronises the work needed from the managers of cables and pipework, enables customers to arrange the various connections to their new homes – electricity, gas, water and telecoms – in a single administrative application. Once scheduled, all works are carried out in a day or even half a day.
In mid-March, the authorit ies announced a general lockdown to try and combat the spread of the COVID-19 virus. In these exceptional circumstances, the company took the necessary steps to maintain its essential energy distribution services. Numerous measures were put in place to avoid unnecessary travel and face-to-face contacts between members of staff and customers as much as possible. In addition, non-urgent operations on the ground were suspended on a temporary basis.
# p.11ORES Assets BGAAP consolidated accounts 2020
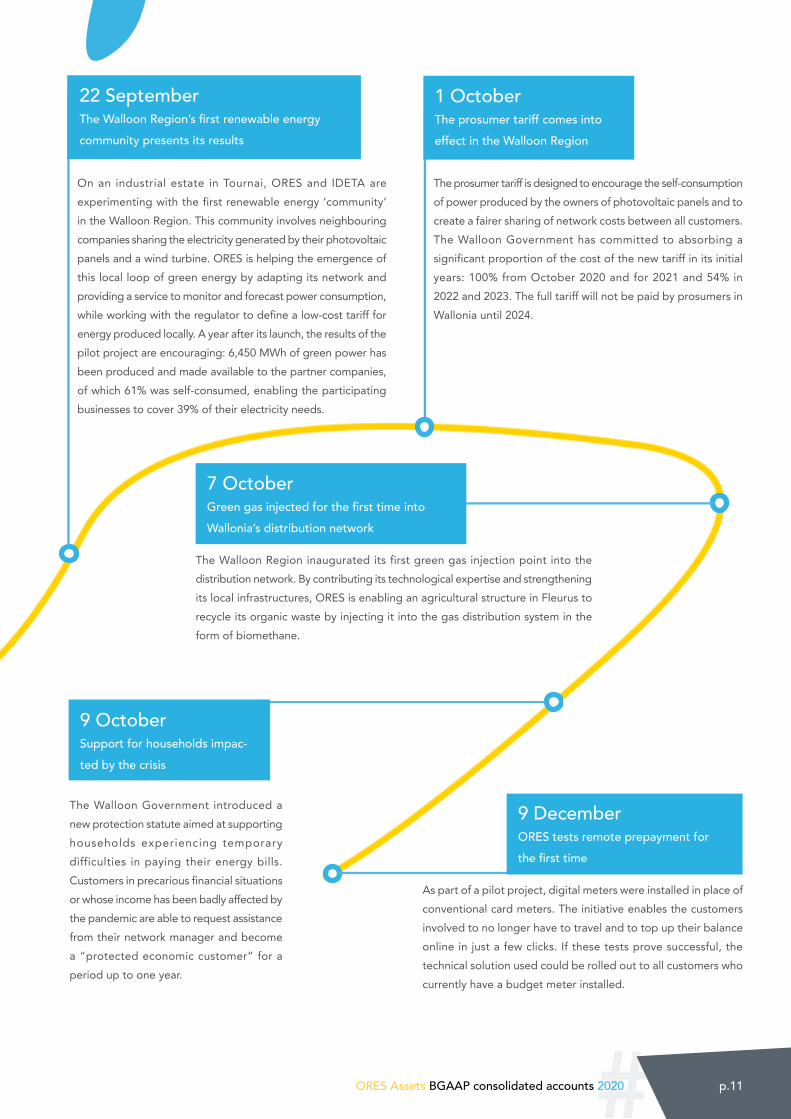
22 SeptemberThe Walloon Region’s first renewable energy
community presents its results
1 OctoberThe prosumer tariff comes into
effect in the Walloon Region
On an industrial estate in Tournai, ORES and IDETA are experimenting with the first renewable energy ‘community’ in the Walloon Region. This community involves neighbouring companies sharing the electricity generated by their photovoltaic panels and a wind turbine. ORES is helping the emergence of this local loop of green energy by adapting its network and providing a service to monitor and forecast power consumption, while working with the regulator to define a low-cost tariff for energy produced locally. A year after its launch, the results of the pilot project are encouraging: 6,450 MWh of green power has been produced and made available to the partner companies, of which 61% was self-consumed, enabling the participating businesses to cover 39% of their electricity needs.
The prosumer tariff is designed to encourage the self-consumption of power produced by the owners of photovoltaic panels and to create a fairer sharing of network costs between all customers. The Walloon Government has committed to absorbing a significant proportion of the cost of the new tariff in its initial years: 100% from October 2020 and for 2021 and 54% in 2022 and 2023. The full tariff will not be paid by prosumers in Wallonia until 2024.
7 OctoberGreen gas injected for the first time into
Wallonia’s distribution network
9 OctoberSupport for households impac-
ted by the crisis
9 DecemberORES tests remote prepayment for
the first time
The Walloon Region inaugurated its first green gas injection point into the distribution network. By contributing its technological expertise and strengthening its local infrastructures, ORES is enabling an agricultural structure in Fleurus to recycle its organic waste by injecting it into the gas distribution system in the form of biomethane.
The Walloon Government introduced a new protection statute aimed at supporting households experiencing temporary difficulties in paying their energy bills. Customers in precarious financial situations or whose income has been badly affected by the pandemic are able to request assistance from their network manager and become a “protected economic customer” for a period up to one year.
As part of a pilot project, digital meters were installed in place of conventional card meters. The initiative enables the customers involved to no longer have to travel and to top up their balance online in just a few clicks. If these tests prove successful, the technical solution used could be rolled out to all customers who currently have a budget meter installed.
#p.12 ORES Assets BGAAP consolidated accounts 2020
2. Corporate social responsibility and sustainable development
Very much aware of its societal responsibilities to all Walloons, in 2020 ORES formalised its policy on sustainable development, based on the United Nations’ 17 Sustainable Development Goals (SDG). This policy is one of the driving forces of the company’s strategic plan 2021-2023. Called “SDG Voice” – in other words an SDG ambassador – for the whole of 2021 along with the eight other Belgian electricity and gas network operators, as well as their professional federation, Synergrid, the company also re-examined the main issues of sustainability and its priorities with its stakeholders.
ORSCAN ME
# p.13ORES Assets BGAAP consolidated accounts 2020
The GRI as a powerful beacon
Since 2018, ORES has elected to structure and report on its approach to sustainability based on the guidelines of the Global
Reporting Initiative (GRI), which is currently the benchmark for best practices. The company’s economic, social and environmental performance is presented in this report in line with GRI methodology.
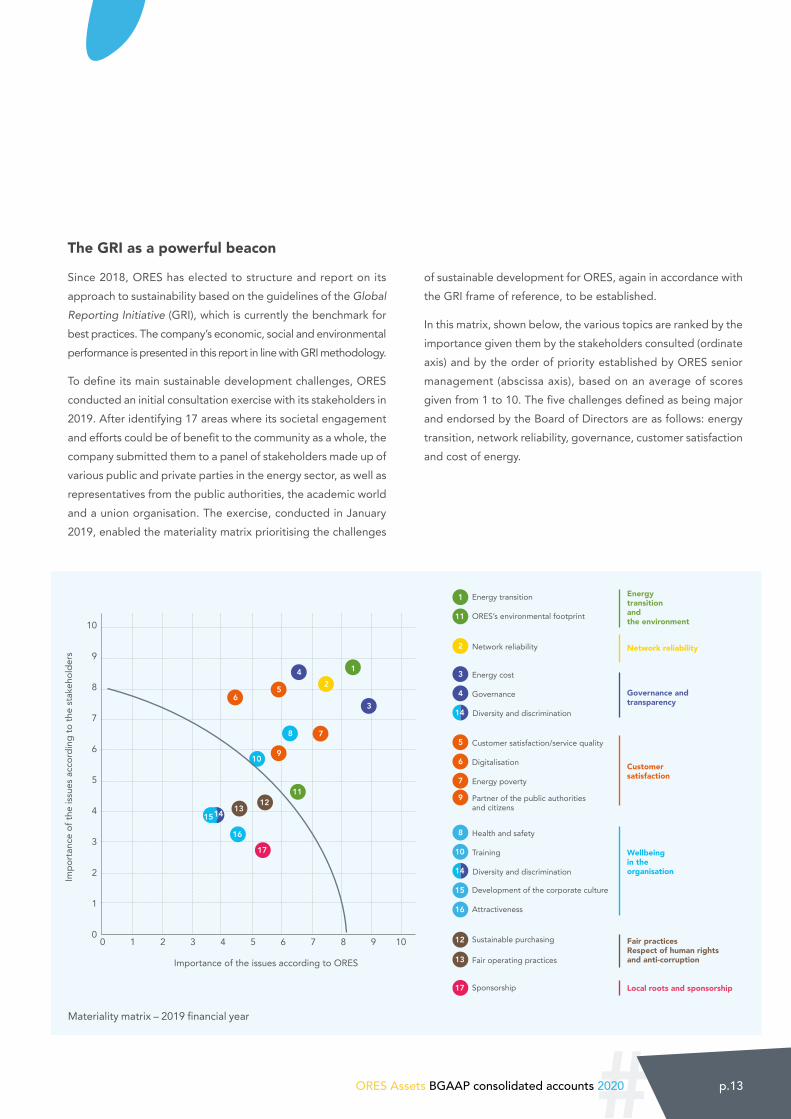
To define its main sustainable development challenges, ORES conducted an initial consultation exercise with its stakeholders in 2019. After identifying 17 areas where its societal engagement and efforts could be of benefit to the community as a whole, the company submitted them to a panel of stakeholders made up of various public and private parties in the energy sector, as well as representatives from the public authorities, the academic world and a union organisation. The exercise, conducted in January 2019, enabled the materiality matrix prioritising the challenges
of sustainable development for ORES, again in accordance with the GRI frame of reference, to be established.
In this matrix, shown below, the various topics are ranked by the importance given them by the stakeholders consulted (ordinate axis) and by the order of priority established by ORES senior management (abscissa axis), based on an average of scores given from 1 to 10. The five challenges defined as being major and endorsed by the Board of Directors are as follows: energy transition, network reliability, governance, customer satisfaction and cost of energy.
Materiality matrix – 2019 financial year
10
9
8
7
6
5
4
3
2
1
00 1 2 3 4 5 6 7 8 9 10
65
42
3
9
13
11
1
78
10
16
17
Impo
rtanc
e of
the
issue
s acc
ordi
ng to
the
stak
ehol
ders
Importance of the issues according to ORES
Energy transition Energy transition and the environment
Governance and transparency
Fair practices Respect of human rights and anti-corruption
Local roots and sponsorship
Customer satisfaction
Wellbeing in the organisation
Network reliability
1
ORES’s environmental footprint11
Sustainable purchasing12
Network reliability2
Energy cost3
Governance4
Customer satisfaction/service quality5
Digitalisation6
Fair operating practices13
Energy poverty7
Health and safety8
Training10
Diversity and discrimination
Diversity and discrimination
Development of the corporate culture15
Attractiveness16
Sponsorship17
Partner of the public authorities and citizens
912
14
14
1514
#p.14 ORES Assets BGAAP consolidated accounts 2020
Stakeholder consultation
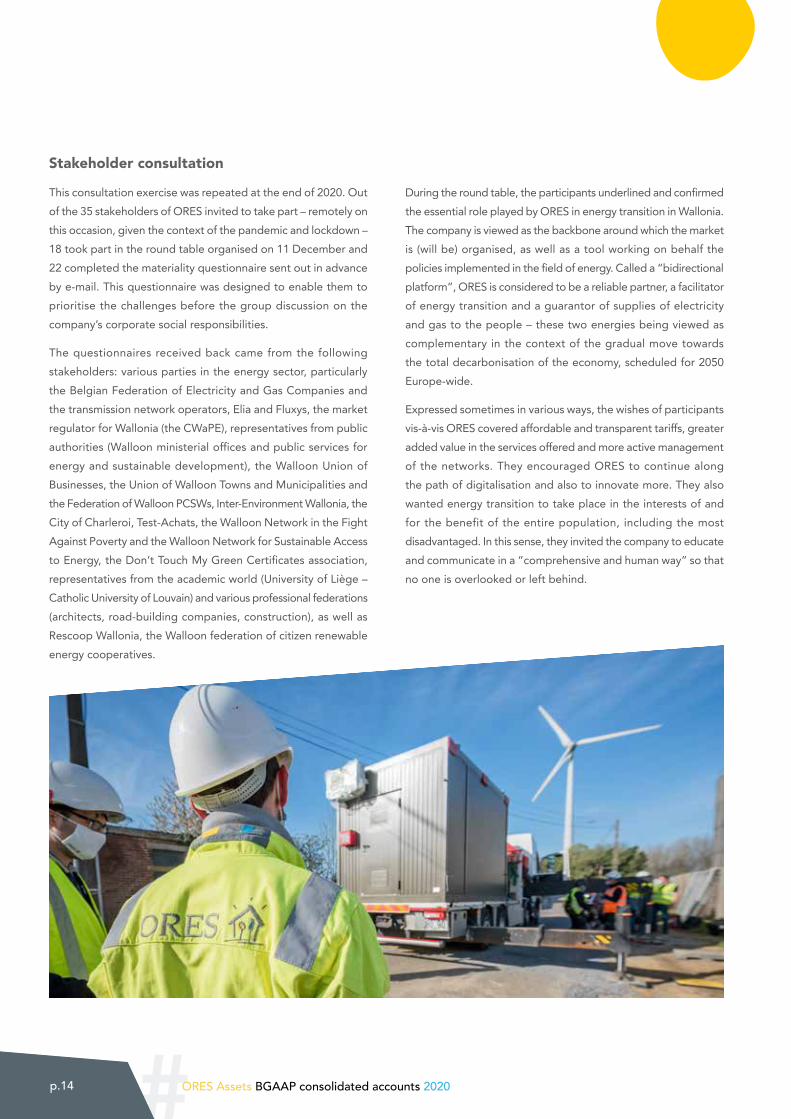
This consultation exercise was repeated at the end of 2020. Out of the 35 stakeholders of ORES invited to take part – remotely on this occasion, given the context of the pandemic and lockdown – 18 took part in the round table organised on 11 December and 22 completed the materiality questionnaire sent out in advance by e-mail. This questionnaire was designed to enable them to prioritise the challenges before the group discussion on the company’s corporate social responsibilities.
The questionnaires received back came from the following stakeholders: various parties in the energy sector, particularly the Belgian Federation of Electricity and Gas Companies and the transmission network operators, Elia and Fluxys, the market regulator for Wallonia (the CWaPE), representatives from public authorities (Walloon ministerial offices and public services for energy and sustainable development), the Walloon Union of Businesses, the Union of Walloon Towns and Municipalities and the Federation of Walloon PCSWs, Inter-Environment Wallonia, the City of Charleroi, Test-Achats, the Walloon Network in the Fight Against Poverty and the Walloon Network for Sustainable Access to Energy, the Don’t Touch My Green Certificates association, representatives from the academic world (University of Liège – Catholic University of Louvain) and various professional federations (architects, road-building companies, construction), as well as Rescoop Wallonia, the Walloon federation of citizen renewable energy cooperatives.
During the round table, the participants underlined and confirmed the essential role played by ORES in energy transition in Wallonia. The company is viewed as the backbone around which the market is (will be) organised, as well as a tool working on behalf the policies implemented in the field of energy. Called a “bidirectional platform”, ORES is considered to be a reliable partner, a facilitator of energy transition and a guarantor of supplies of electricity and gas to the people – these two energies being viewed as complementary in the context of the gradual move towards the total decarbonisation of the economy, scheduled for 2050 Europe-wide.
Expressed sometimes in various ways, the wishes of participants vis-à-vis ORES covered affordable and transparent tariffs, greater added value in the services offered and more active management of the networks. They encouraged ORES to continue along the path of digitalisation and also to innovate more. They also wanted energy transition to take place in the interests of and for the benefit of the entire population, including the most disadvantaged. In this sense, they invited the company to educate and communicate in a “comprehensive and human way” so that no one is overlooked or left behind.
# p.15ORES Assets BGAAP consolidated accounts 2020
10
9
8
7
6
5
4
3
2
1
00 1 2 3 4 5 6 7 8 9 10
8
1 2
135
7
12
17
Impo
rtanc
e of
the
issue
s acc
ordi
ng to
the
stak
ehol
ders
Importance of the issues according to ORES
Energy transitionEnergy transition and the environment
Governance and transparency
Ethics and fair practices
Societal engagement and local roots
Customer at the heart of the business
Corporate culture and wellbeing at work
Network reliability
4
ORES’s environmental footprint 10
Sustainable purchasing11
Network reliability3
Energy cost2
Governance1
14
Customer satisfaction/service quality 8
Digitalisation
Fair operating practices16
Energy poverty13
Health and safety5
Training7
15 Diversity and discrimination
Partner of the public authorities and citizens
Development of the corporate culture9
Attractiveness12
Sponsorship17
16
15
A new materiality matrix
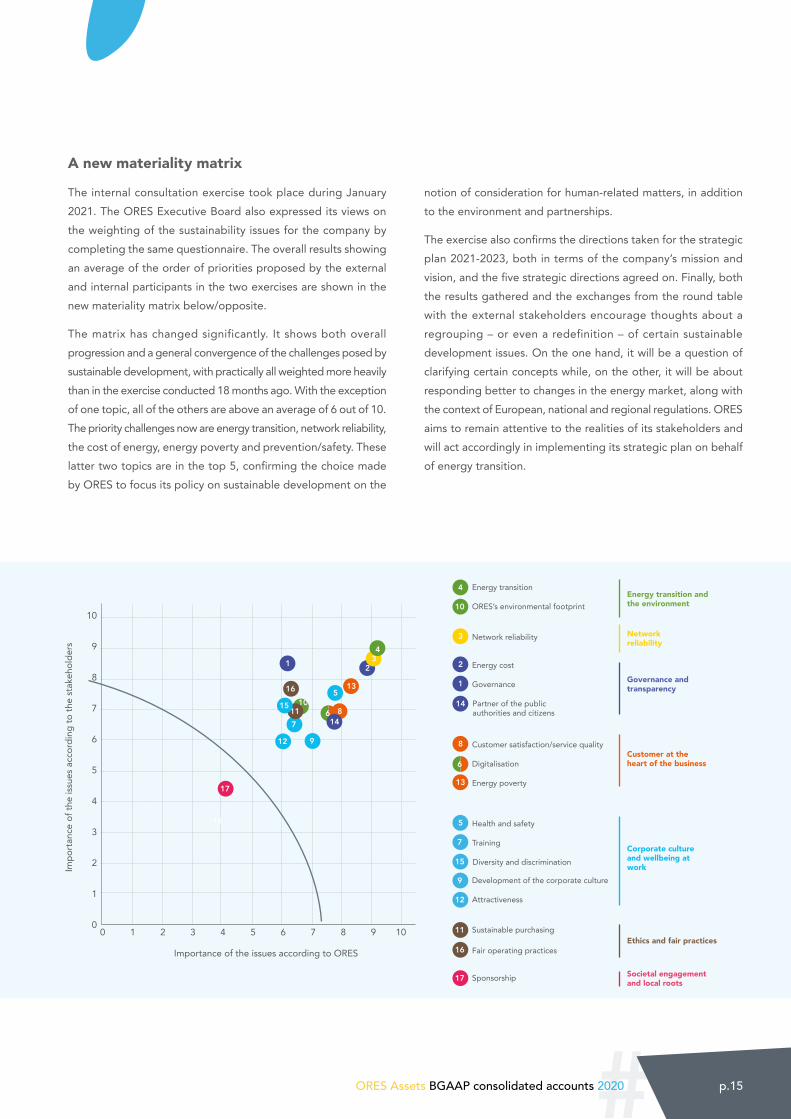
The internal consultation exercise took place during January 2021. The ORES Executive Board also expressed its views on the weighting of the sustainability issues for the company by completing the same questionnaire. The overall results showing an average of the order of priorities proposed by the external and internal participants in the two exercises are shown in the new materiality matrix below/opposite.
The matrix has changed significantly. It shows both overall progression and a general convergence of the challenges posed by sustainable development, with practically all weighted more heavily than in the exercise conducted 18 months ago. With the exception of one topic, all of the others are above an average of 6 out of 10. The priority challenges now are energy transition, network reliability, the cost of energy, energy poverty and prevention/safety. These latter two topics are in the top 5, confirming the choice made by ORES to focus its policy on sustainable development on the
notion of consideration for human-related matters, in addition to the environment and partnerships.
The exercise also confirms the directions taken for the strategic plan 2021-2023, both in terms of the company’s mission and vision, and the five strategic directions agreed on. Finally, both the results gathered and the exchanges from the round table with the external stakeholders encourage thoughts about a regrouping – or even a redefinition – of certain sustainable development issues. On the one hand, it will be a question of clarifying certain concepts while, on the other, it will be about responding better to changes in the energy market, along with the context of European, national and regional regulations. ORES aims to remain attentive to the realities of its stakeholders and will act accordingly in implementing its strategic plan on behalf of energy transition.
34
9
1115
10
6
614
#p.16 ORES Assets BGAAP consolidated accounts 2020
3. Energy transition and the environment
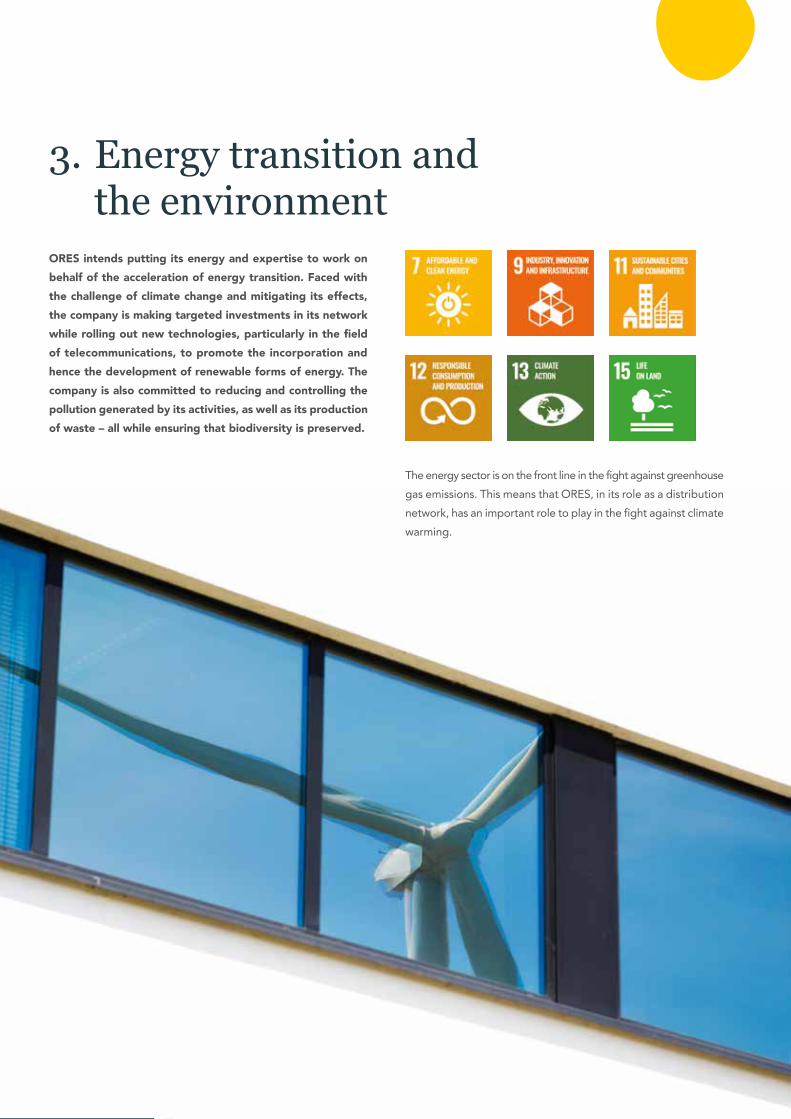
ORES intends putting its energy and expertise to work on behalf of the acceleration of energy transition. Faced with the challenge of climate change and mitigating its effects, the company is making targeted investments in its network while rolling out new technologies, particularly in the field of telecommunications, to promote the incorporation and hence the development of renewable forms of energy. The company is also committed to reducing and controlling the pollution generated by its activities, as well as its production of waste – all while ensuring that biodiversity is preserved.
The energy sector is on the front line in the fight against greenhouse gas emissions. This means that ORES, in its role as a distribution network, has an important role to play in the fight against climate warming.

# p.17ORES Assets BGAAP consolidated accounts 2020
Facilitating the connection and injection of renewable energies
In terms of energy transition, one of the main missions of the network managers consists of accommodating and providing more active and effective management of the growing quantities of energy generated by green and renewable production units.
The Walloon Region has set ambitious targets in terms of renewable energy in the context of its contribution to the national Energy Climate 2030 plan. The impact of this development is becoming increasingly significant for network management. From just a few thousand at the end of the 2000s, today there are over 165,000 local production units – photovoltaic, wind, hydraulic, biomass and others – connected to the electricity grid in Wallonia, of which almost 140,000 are connected to the ORES network. The vast majority of these units are solar photovoltaic systems and wind turbines/farms. In 2020, despite the difficulties linked to the health crisis, the installed power represented by these units increased by 10%, to reach 1,986 MW, or the equivalent of the nominal output of two nuclear reactors. Between now and 2030, in line with the targets for Wallonia, this figure is due to exceed 6,000 MW.
For the first time in the Walloon Region, the gas distribution network also “went green”, with the connection of a first biomethanisation unit in Fleurus, which is still the biggest installation in the country in terms of the injection of biomethane (600 m³ per hour). This green gas production structure is a 100% example of the circular economy, because local farmers and businesses in the region are able to recycle their organic waste in the system to convert it into clean, local renewable energy that is then channelled via the ORES network to customers in the neighbouring local authority areas. In 2021, at least two other projects are due for completion, in Quévy and Les Bons Villers.
As a result, the energy market is becoming both greener and more local, with initiatives coming from private individuals and cooperatives, as well as businesses and public organisations. There are also production units owned by conventional providers and operators.
#p.18 ORES Assets BGAAP consolidated accounts 2020
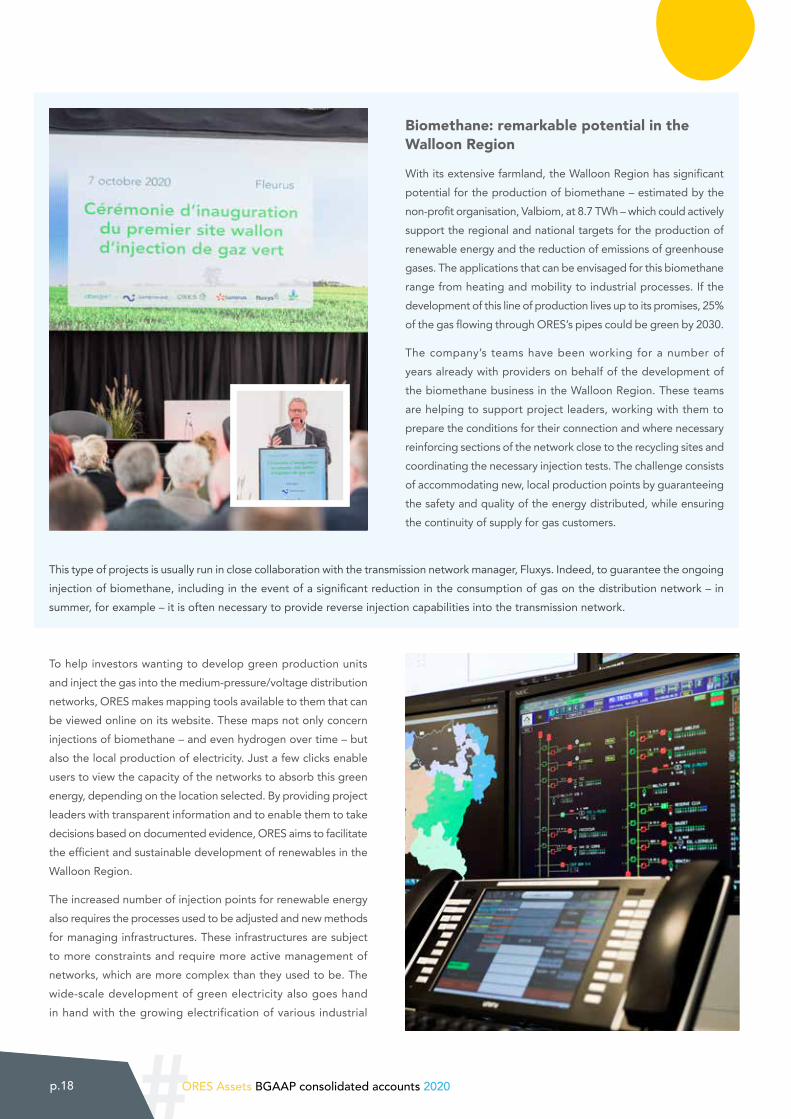
Biomethane: remarkable potential in the Walloon Region
With its extensive farmland, the Walloon Region has significant potential for the production of biomethane – estimated by the non-profit organisation, Valbiom, at 8.7 TWh – which could actively support the regional and national targets for the production of renewable energy and the reduction of emissions of greenhouse gases. The applications that can be envisaged for this biomethane range from heating and mobility to industrial processes. If the development of this line of production lives up to its promises, 25% of the gas flowing through ORES’s pipes could be green by 2030.
The company’s teams have been working for a number of years already with providers on behalf of the development of the biomethane business in the Walloon Region. These teams are helping to support project leaders, working with them to prepare the conditions for their connection and where necessary reinforcing sections of the network close to the recycling sites and coordinating the necessary injection tests. The challenge consists of accommodating new, local production points by guaranteeing the safety and quality of the energy distributed, while ensuring the continuity of supply for gas customers.
This type of projects is usually run in close collaboration with the transmission network manager, Fluxys. Indeed, to guarantee the ongoing injection of biomethane, including in the event of a significant reduction in the consumption of gas on the distribution network – in summer, for example – it is often necessary to provide reverse injection capabilities into the transmission network.
To help investors wanting to develop green production units and inject the gas into the medium-pressure/voltage distribution networks, ORES makes mapping tools available to them that can be viewed online on its website. These maps not only concern injections of biomethane – and even hydrogen over time – but also the local production of electricity. Just a few clicks enable users to view the capacity of the networks to absorb this green energy, depending on the location selected. By providing project leaders with transparent information and to enable them to take decisions based on documented evidence, ORES aims to facilitate the efficient and sustainable development of renewables in the Walloon Region.
The increased number of injection points for renewable energy also requires the processes used to be adjusted and new methods for managing infrastructures. These infrastructures are subject to more constraints and require more active management of networks, which are more complex than they used to be. The wide-scale development of green electricity also goes hand in hand with the growing electrification of various industrial
# p.19ORES Assets BGAAP consolidated accounts 2020
processes and everyday activities, such as electric mobility or the development of heat pumps. This means that peak times for drawing and injecting power, which is one of the constraints and main elements regarding the sizing of the power network, will also be affected by these changes.
Beyond their pursuit of a targeted and ambitious investment policy focused on modernising the networks, the teams at ORES have been working on flexibility mechanisms for some years. The company offers flexible connection contracts to large customers for which the total supply of energy is not guaranteed at all times. It also carries out direct work – within the context of the technical flexibility mechanism – on certain production units so that they can adapt to potential congestion situations. This latter mechanism, which is essential for guaranteeing optimum
integration of renewables, also brings constraints for producers. To keep these issues to a minimum, ORES has developed an artificial intelligence tool in collaboration with the University of Liège and its spin-off, BlackLight Analytics. This new calculation algorithm, called O-ONE (ORES - Operator Network Expert), makes it possible to calculate and anticipate network constraints in order to maximise injectable – and injected – power into the network by decentralised production units. The tests conducted in 2020, in particular to maximise the injection of renewable electricity from the Lierneux windfarm in the province of Liège, demonstrated the potential for upward adjustment of injection limits by up to 10%. The system will now be able to be used for other production units and improve the injection level of green electricity into the power network.
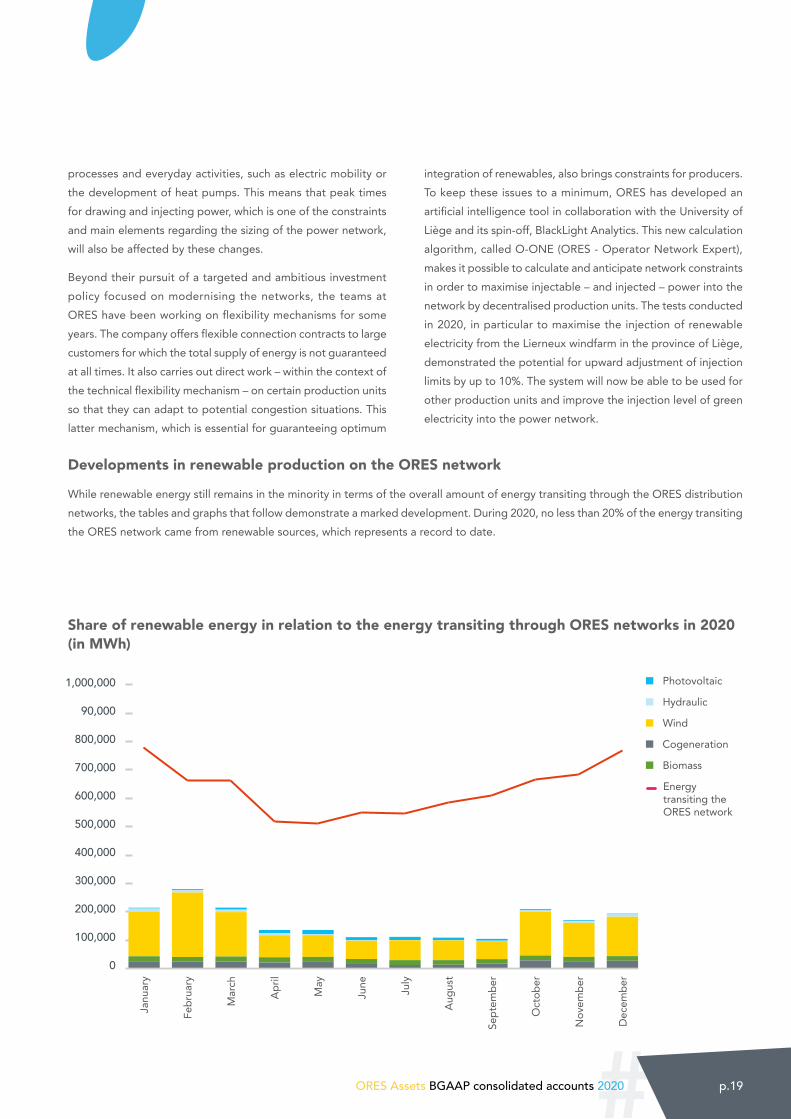
Developments in renewable production on the ORES network
While renewable energy still remains in the minority in terms of the overall amount of energy transiting through the ORES distribution networks, the tables and graphs that follow demonstrate a marked development. During 2020, no less than 20% of the energy transiting the ORES network came from renewable sources, which represents a record to date.
Share of renewable energy in relation to the energy transiting through ORES networks in 2020 (in MWh)
1,000,000
90,000
800,000
700,000
600,000
500,000
400,000
300,000
200,000
100,000
0
Photovoltaic
Hydraulic
Wind
Cogeneration
Biomass
Energy transiting the ORES network
Janu
ary
Febr
uary
Mar
ch
April
May
June July
Augu
st
Sept
embe
r
Oct
ober
Nov
embe
r
Dec
embe
r 0
200000
400000
600000
800000
1000000
0
200000
400000
600000
800000
1000000
Dec-20Nov-20Oct-20Sep-20Aug-20Jul-20Jun-20May-20Apr-20Mar-20Feb-20Jan-20
#p.20 ORES Assets BGAAP consolidated accounts 2020
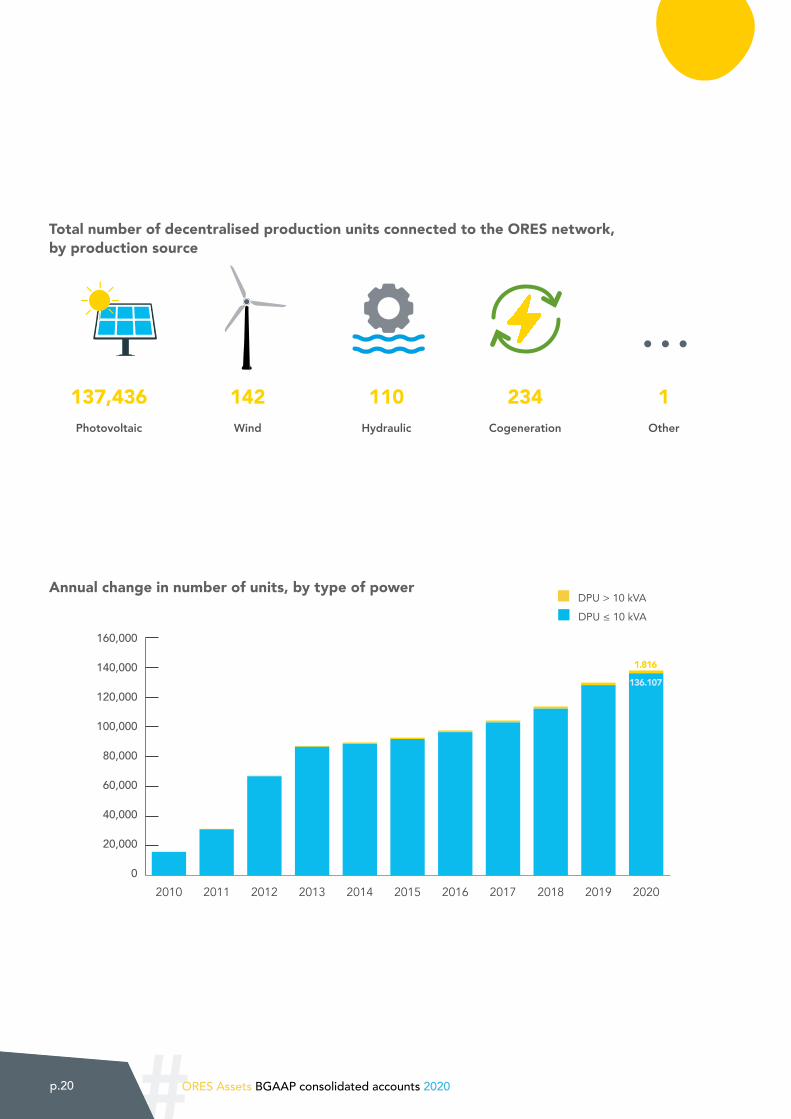
Total number of decentralised production units connected to the ORES network, by production source
Annual change in number of units, by type of power DPU > 10 kVA
DPU ≤ 10 kVA
160,000
140,000
120,000
100,000
80,000
60,000
40,000
20,000
0
Photovoltaic Wind Hydraulic Cogeneration Other
137,436 142 110 234 1
0
20000
40000
60000
80000
100000
120000
140000
160000
20202019201820172016201520142013201220112010
…
136.107
1.816
# p.21ORES Assets BGAAP consolidated accounts 2020
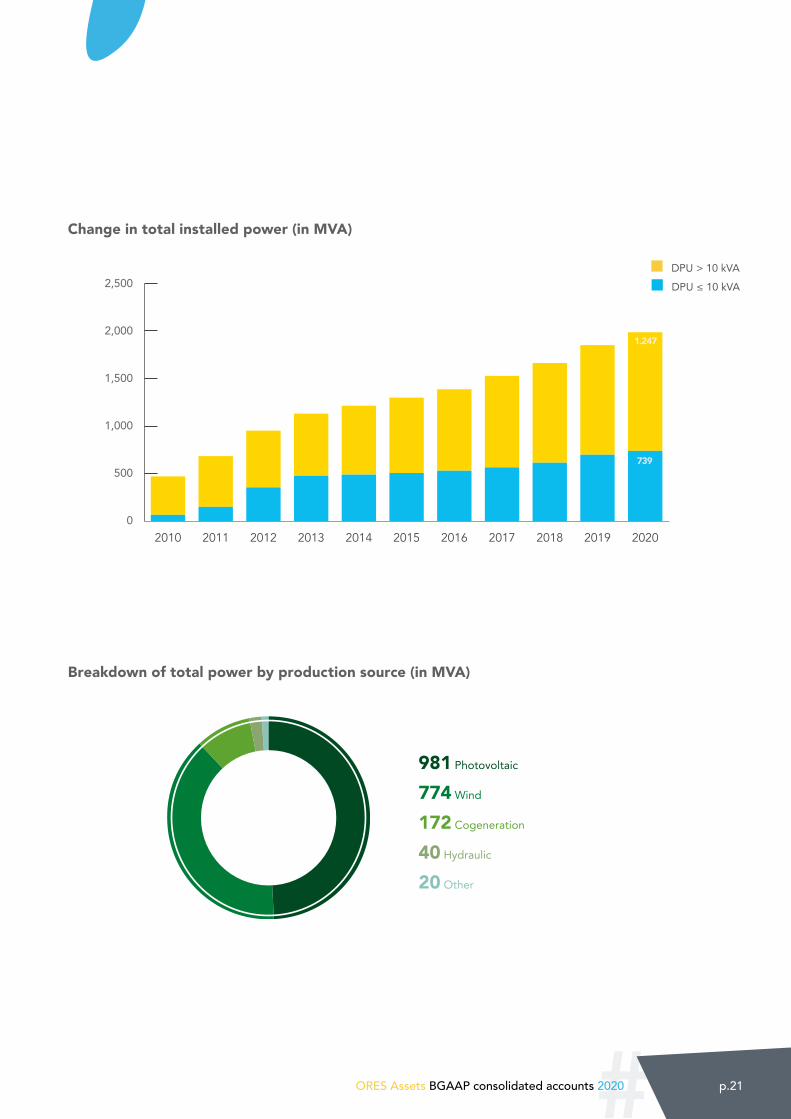
Breakdown of total power by production source (in MVA)
Change in total installed power (in MVA)
2,500
2,000
1,500
1,000
500
00
500
1000
1500
2000
2500
20202019201820172016201520142013201220112010
DPU > 10 kVA
DPU ≤ 10 kVA
981 Photovoltaic
774 Wind
172 Cogeneration
40 Hydraulic
20 Other
739
1.247
#p.22 ORES Assets BGAAP consolidated accounts 2020
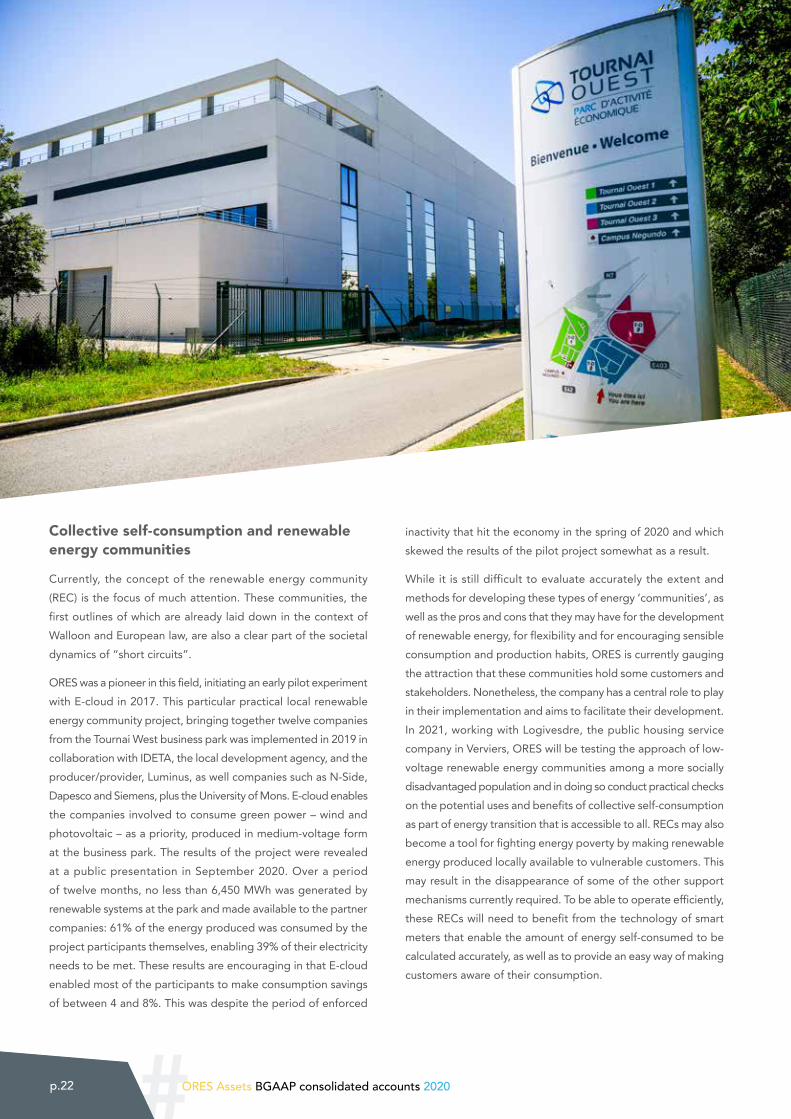
Collective self-consumption and renewable energy communities
Currently, the concept of the renewable energy community (REC) is the focus of much attention. These communities, the first outlines of which are already laid down in the context of Walloon and European law, are also a clear part of the societal dynamics of “short circuits”.
ORES was a pioneer in this field, initiating an early pilot experiment with E-cloud in 2017. This particular practical local renewable energy community project, bringing together twelve companies from the Tournai West business park was implemented in 2019 in collaboration with IDETA, the local development agency, and the producer/provider, Luminus, as well companies such as N-Side, Dapesco and Siemens, plus the University of Mons. E-cloud enables the companies involved to consume green power – wind and photovoltaic – as a priority, produced in medium-voltage form at the business park. The results of the project were revealed at a public presentation in September 2020. Over a period of twelve months, no less than 6,450 MWh was generated by renewable systems at the park and made available to the partner companies: 61% of the energy produced was consumed by the project participants themselves, enabling 39% of their electricity needs to be met. These results are encouraging in that E-cloud enabled most of the participants to make consumption savings of between 4 and 8%. This was despite the period of enforced
inactivity that hit the economy in the spring of 2020 and which skewed the results of the pilot project somewhat as a result.
While it is still difficult to evaluate accurately the extent and methods for developing these types of energy ‘communities’, as well as the pros and cons that they may have for the development of renewable energy, for flexibility and for encouraging sensible consumption and production habits, ORES is currently gauging the attraction that these communities hold some customers and stakeholders. Nonetheless, the company has a central role to play in their implementation and aims to facilitate their development. In 2021, working with Logivesdre, the public housing service company in Verviers, ORES will be testing the approach of low-voltage renewable energy communities among a more socially disadvantaged population and in doing so conduct practical checks on the potential uses and benefits of collective self-consumption as part of energy transition that is accessible to all. RECs may also become a tool for fighting energy poverty by making renewable energy produced locally available to vulnerable customers. This may result in the disappearance of some of the other support mechanisms currently required. To be able to operate efficiently, these RECs will need to benefit from the technology of smart meters that enable the amount of energy self-consumed to be calculated accurately, as well as to provide an easy way of making customers aware of their consumption.
# p.23ORES Assets BGAAP consolidated accounts 2020
Reduction of network losses
In terms of energy efficiency and especially losses of electricity from the grid – an important factor in the carbon footprint of the power grid managers – ORES has been making both technical and administrative efforts for a number of years. Over a period of five years, these efforts have enabled the company to reduce the overall figure for electricity losses occurring across some 52,000 km of network, by over 76 GWh out of an initial total of 731 GWh. This reduction of more than 10% has been achieved with quantity of energy transmitted remaining practically constant, whereas the length of the electricity networks managed by ORES grew by almost 3.5% over the same period. This improvement is due in particular to the works to modernise and upgrade the grid, as well as precise and targeted audits of the levels of energy consumed, designed to limit non-technical losses, including meter fraud.
Support for alternative mobility
Another theme that has become essential these days when talking about ecological transition, environmental protection and the fight against climate change, is mobility. The legislative framework is changing, with older and more polluting vehicles being taxed more heavily and even banned from driving in some cities or regions. The electrification of vehicles is now fully underway and some manufacturers have already taken very specific decisions in this regard. As of 31 December 2020, Belgium had more than 120,000 vehicles powered by “virtuous” fuels, such as plug-in petrol and diesel hybrids, fully electric, compressed natural gas (CNG) and hydrogen. Of this number, almost 27% were electric and 18% CNG.
While fast recharging at home for electric or CNG vehicles presents some constraints, ORES is supporting a number of public and private providers seeking to install public recharging terminals and charging stations. This essentially involves informing them
about the capacity of the networks available to accommodate
their facilities at a lower cost, supporting them through the
licensing procedures and, of course, connecting these facilities
to the distribution network. In the local authority areas associated
with the company, 39 public recharging terminals have been
installed in recent years to enable public partners to promote
electric mobility.
Although a fossil fuel, the gas used as fuel is becoming a practical
transition solution in the context of the gradual decarbonisation
of society: CNG vehicles have the benefit of emitting less CO2
than their diesel or petrol equivalents and practically no nitrogen
oxide. From a health point of view they also have a crucial role
to play given that their emissions of fine particles are 77% lower
than conventionally powered vehicles. This means they help with
air quality. And with the future development of bio-CNG – the
first public service station in the Walloon Region supplying this
green, sustainable fuel was opened in March 2021 – they will
provide even more benefit to the environment.
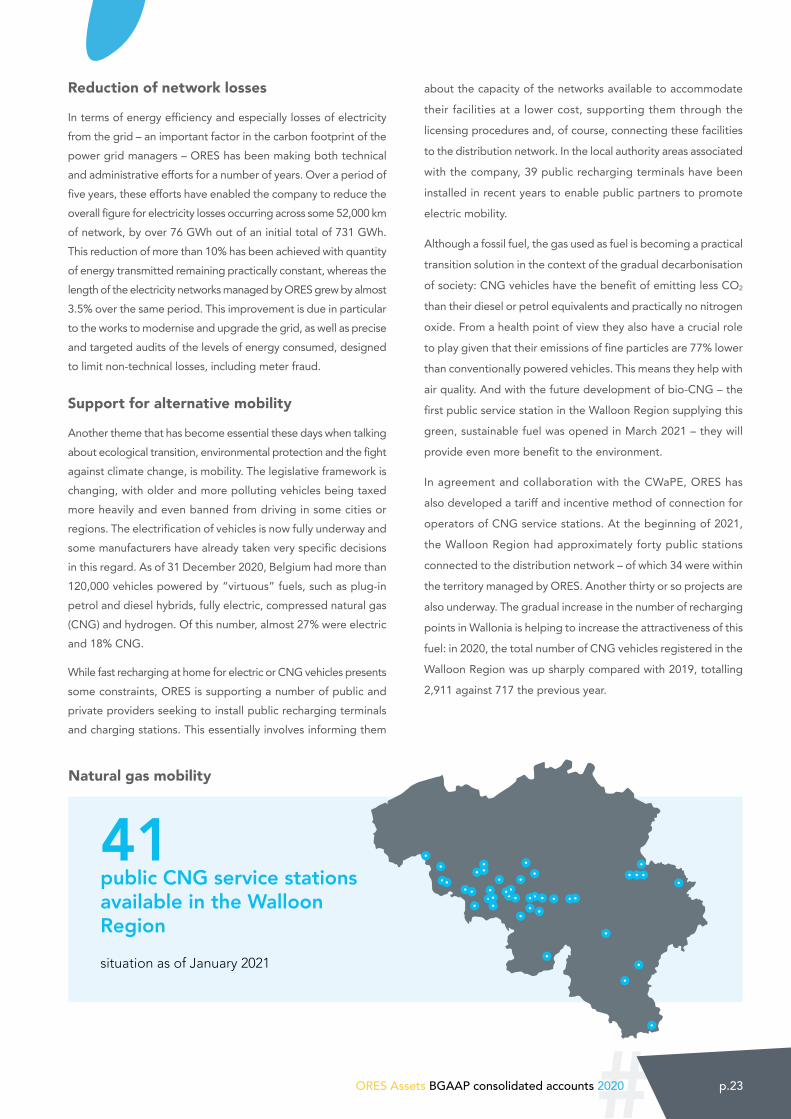
In agreement and collaboration with the CWaPE, ORES has
also developed a tariff and incentive method of connection for
operators of CNG service stations. At the beginning of 2021,
the Walloon Region had approximately forty public stations
connected to the distribution network – of which 34 were within
the territory managed by ORES. Another thirty or so projects are
also underway. The gradual increase in the number of recharging
points in Wallonia is helping to increase the attractiveness of this
fuel: in 2020, the total number of CNG vehicles registered in the
Walloon Region was up sharply compared with 2019, totalling
2,911 against 717 the previous year.
Natural gas mobility
41public CNG service stations available in the Walloon Region
situation as of January 2021
#p.24 ORES Assets BGAAP consolidated accounts 2020
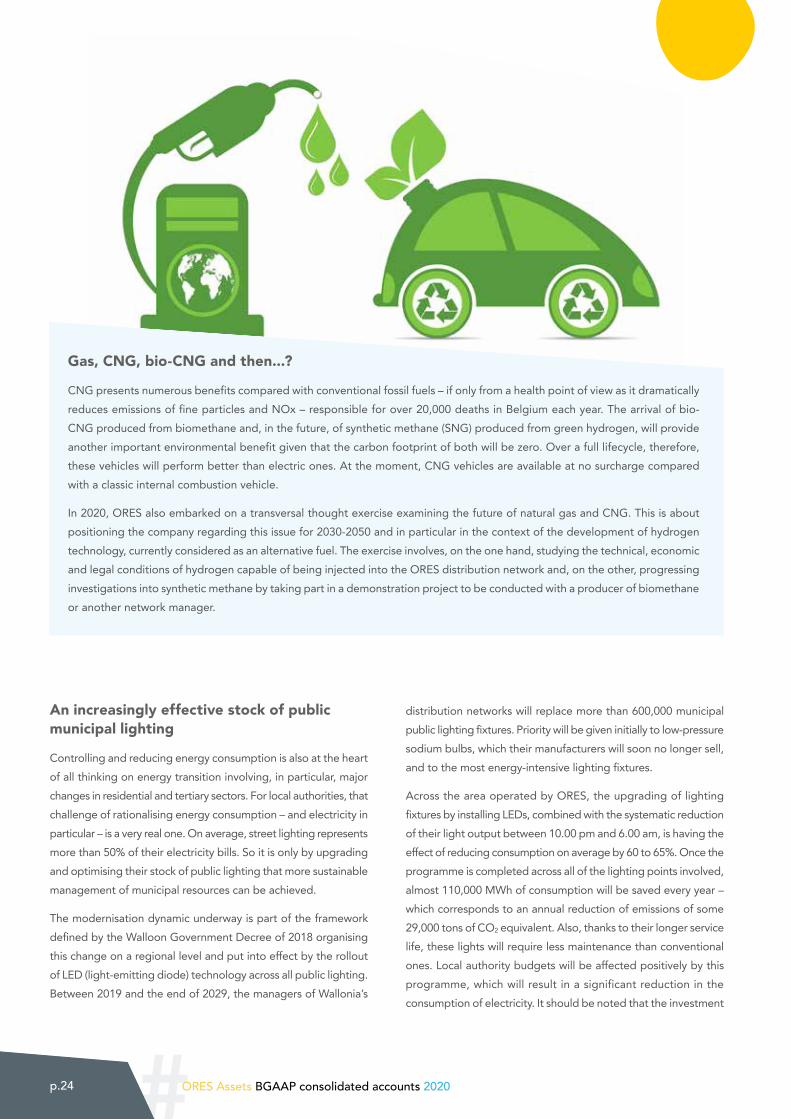
Gas, CNG, bio-CNG and then...?
CNG presents numerous benefits compared with conventional fossil fuels – if only from a health point of view as it dramatically reduces emissions of fine particles and NOx – responsible for over 20,000 deaths in Belgium each year. The arrival of bio-CNG produced from biomethane and, in the future, of synthetic methane (SNG) produced from green hydrogen, will provide another important environmental benefit given that the carbon footprint of both will be zero. Over a full lifecycle, therefore, these vehicles will perform better than electric ones. At the moment, CNG vehicles are available at no surcharge compared with a classic internal combustion vehicle.
In 2020, ORES also embarked on a transversal thought exercise examining the future of natural gas and CNG. This is about positioning the company regarding this issue for 2030-2050 and in particular in the context of the development of hydrogen technology, currently considered as an alternative fuel. The exercise involves, on the one hand, studying the technical, economic and legal conditions of hydrogen capable of being injected into the ORES distribution network and, on the other, progressing investigations into synthetic methane by taking part in a demonstration project to be conducted with a producer of biomethane or another network manager.
An increasingly effective stock of public municipal lighting
Controlling and reducing energy consumption is also at the heart of all thinking on energy transition involving, in particular, major changes in residential and tertiary sectors. For local authorities, that challenge of rationalising energy consumption – and electricity in particular – is a very real one. On average, street lighting represents more than 50% of their electricity bills. So it is only by upgrading and optimising their stock of public lighting that more sustainable management of municipal resources can be achieved.
The modernisation dynamic underway is part of the framework defined by the Walloon Government Decree of 2018 organising this change on a regional level and put into effect by the rollout of LED (light-emitting diode) technology across all public lighting. Between 2019 and the end of 2029, the managers of Wallonia’s
distribution networks will replace more than 600,000 municipal public lighting fixtures. Priority will be given initially to low-pressure sodium bulbs, which their manufacturers will soon no longer sell, and to the most energy-intensive lighting fixtures.
Across the area operated by ORES, the upgrading of lighting fixtures by installing LEDs, combined with the systematic reduction of their light output between 10.00 pm and 6.00 am, is having the effect of reducing consumption on average by 60 to 65%. Once the programme is completed across all of the lighting points involved, almost 110,000 MWh of consumption will be saved every year – which corresponds to an annual reduction of emissions of some 29,000 tons of CO2 equivalent. Also, thanks to their longer service life, these lights will require less maintenance than conventional ones. Local authority budgets will be affected positively by this programme, which will result in a significant reduction in the consumption of electricity. It should be noted that the investment
# p.25ORES Assets BGAAP consolidated accounts 2020
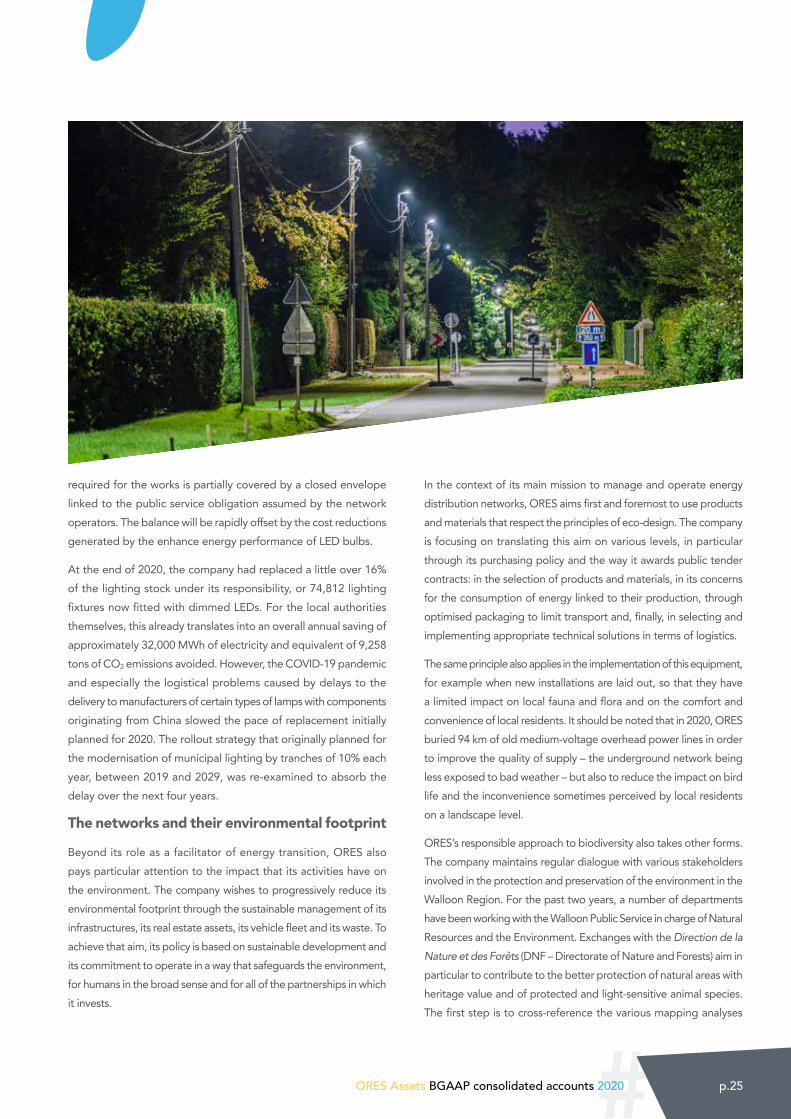
required for the works is partially covered by a closed envelope linked to the public service obligation assumed by the network operators. The balance will be rapidly offset by the cost reductions generated by the enhance energy performance of LED bulbs.
At the end of 2020, the company had replaced a little over 16% of the lighting stock under its responsibility, or 74,812 lighting fixtures now fitted with dimmed LEDs. For the local authorities themselves, this already translates into an overall annual saving of approximately 32,000 MWh of electricity and equivalent of 9,258 tons of CO2 emissions avoided. However, the COVID-19 pandemic and especially the logistical problems caused by delays to the delivery to manufacturers of certain types of lamps with components originating from China slowed the pace of replacement initially planned for 2020. The rollout strategy that originally planned for the modernisation of municipal lighting by tranches of 10% each year, between 2019 and 2029, was re-examined to absorb the delay over the next four years.
The networks and their environmental footprint
Beyond its role as a facilitator of energy transition, ORES also pays particular attention to the impact that its activities have on the environment. The company wishes to progressively reduce its environmental footprint through the sustainable management of its infrastructures, its real estate assets, its vehicle fleet and its waste. To achieve that aim, its policy is based on sustainable development and its commitment to operate in a way that safeguards the environment, for humans in the broad sense and for all of the partnerships in which it invests.
In the context of its main mission to manage and operate energy distribution networks, ORES aims first and foremost to use products and materials that respect the principles of eco-design. The company is focusing on translating this aim on various levels, in particular through its purchasing policy and the way it awards public tender contracts: in the selection of products and materials, in its concerns for the consumption of energy linked to their production, through optimised packaging to limit transport and, finally, in selecting and implementing appropriate technical solutions in terms of logistics.
The same principle also applies in the implementation of this equipment, for example when new installations are laid out, so that they have a limited impact on local fauna and flora and on the comfort and convenience of local residents. It should be noted that in 2020, ORES buried 94 km of old medium-voltage overhead power lines in order to improve the quality of supply – the underground network being less exposed to bad weather – but also to reduce the impact on bird life and the inconvenience sometimes perceived by local residents on a landscape level.
ORES’s responsible approach to biodiversity also takes other forms. The company maintains regular dialogue with various stakeholders involved in the protection and preservation of the environment in the Walloon Region. For the past two years, a number of departments have been working with the Walloon Public Service in charge of Natural Resources and the Environment. Exchanges with the Direction de la
Nature et des Forêts (DNF – Directorate of Nature and Forests) aim in particular to contribute to the better protection of natural areas with heritage value and of protected and light-sensitive animal species. The first step is to cross-reference the various mapping analyses
#p.26 ORES Assets BGAAP consolidated accounts 2020
in order to identify “sensitive” municipal road sections. Proximity to the Natura 2000 network and sites of great biological interest (fauna and flora), the presence of protected light-avoiding species, allocation to the sector plan, proximity to surface water, proximity to housing, grouping of the lighting points concerned into consistent sections, etc. All these elements are analysed so that ORES’s partner municipalities can be better informed and supported in their decisions on the modernisation of lighting fixtures on the one hand, and on questions of reducing or even eliminating lighting near sensitive sites, on the other.
ORES is also very aware of the issue of bird mortality caused by overhead electricity lines, which is one of the main factors in the non-natural mortality of medium-sized and large birds in Europe. In the east of the territory managed by ORES, the close contacts established with Natagora, and especially with its German-speaking section, enable targeted interventions to be made in relation to bird deaths recorded. During 2020, some of the sections of medium-voltage lines, transformers, poles and connectors reported as being problematic by members of Natagora were made safe in order to limit their negative impact.
Energy savings
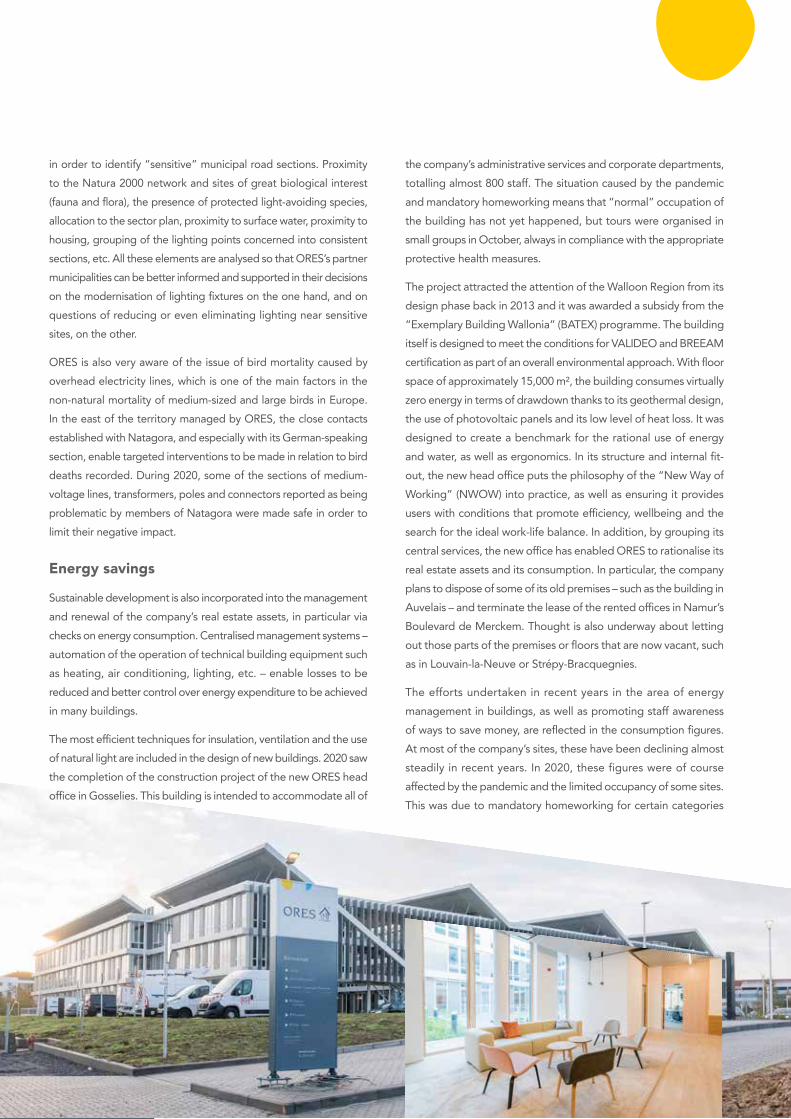
Sustainable development is also incorporated into the management and renewal of the company’s real estate assets, in particular via checks on energy consumption. Centralised management systems – automation of the operation of technical building equipment such as heating, air conditioning, lighting, etc. – enable losses to be reduced and better control over energy expenditure to be achieved in many buildings.
The most efficient techniques for insulation, ventilation and the use of natural light are included in the design of new buildings. 2020 saw the completion of the construction project of the new ORES head office in Gosselies. This building is intended to accommodate all of
the company’s administrative services and corporate departments, totalling almost 800 staff. The situation caused by the pandemic and mandatory homeworking means that “normal” occupation of the building has not yet happened, but tours were organised in small groups in October, always in compliance with the appropriate protective health measures.
The project attracted the attention of the Walloon Region from its design phase back in 2013 and it was awarded a subsidy from the “Exemplary Building Wallonia” (BATEX) programme. The building itself is designed to meet the conditions for VALIDEO and BREEAM certification as part of an overall environmental approach. With floor space of approximately 15,000 m², the building consumes virtually zero energy in terms of drawdown thanks to its geothermal design, the use of photovoltaic panels and its low level of heat loss. It was designed to create a benchmark for the rational use of energy and water, as well as ergonomics. In its structure and internal fit-out, the new head office puts the philosophy of the “New Way of Working” (NWOW) into practice, as well as ensuring it provides users with conditions that promote efficiency, wellbeing and the search for the ideal work-life balance. In addition, by grouping its central services, the new office has enabled ORES to rationalise its real estate assets and its consumption. In particular, the company plans to dispose of some of its old premises – such as the building in Auvelais – and terminate the lease of the rented offices in Namur’s Boulevard de Merckem. Thought is also underway about letting out those parts of the premises or floors that are now vacant, such as in Louvain-la-Neuve or Strépy-Bracquegnies.
The efforts undertaken in recent years in the area of energy management in buildings, as well as promoting staff awareness of ways to save money, are reflected in the consumption figures. At most of the company’s sites, these have been declining almost steadily in recent years. In 2020, these figures were of course affected by the pandemic and the limited occupancy of some sites. This was due to mandatory homeworking for certain categories
# p.27ORES Assets BGAAP consolidated accounts 2020
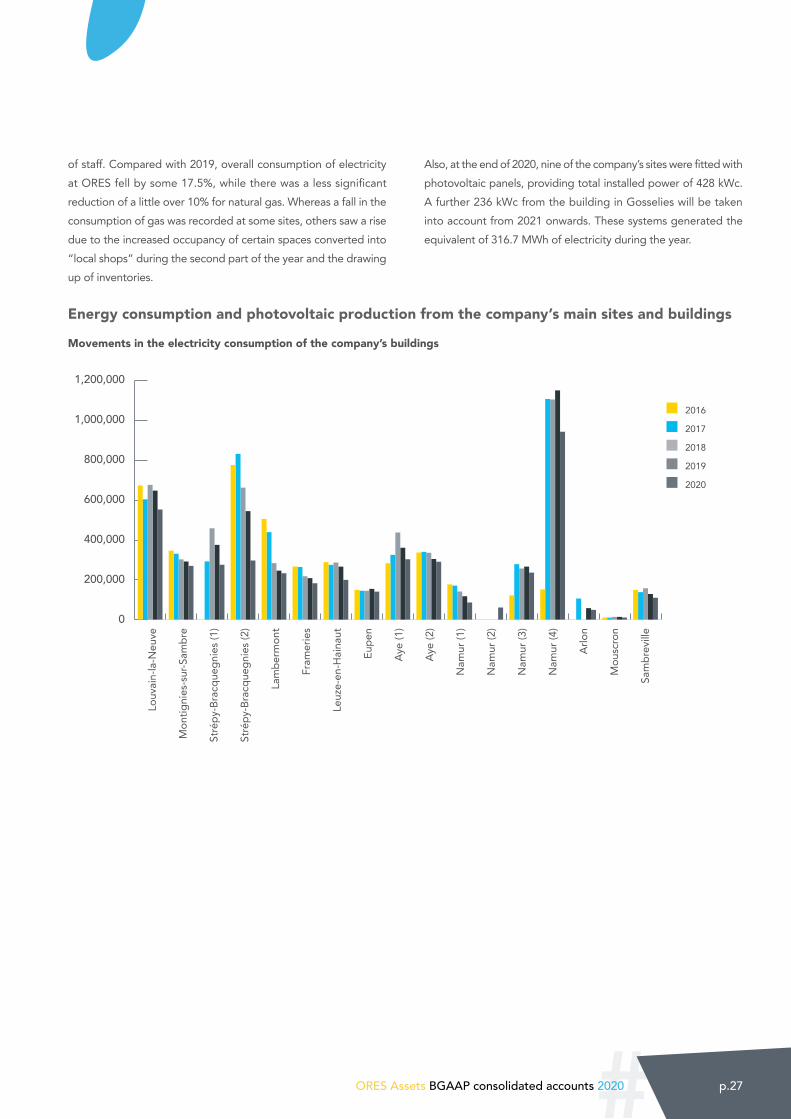
of staff. Compared with 2019, overall consumption of electricity at ORES fell by some 17.5%, while there was a less significant reduction of a little over 10% for natural gas. Whereas a fall in the consumption of gas was recorded at some sites, others saw a rise due to the increased occupancy of certain spaces converted into “local shops” during the second part of the year and the drawing up of inventories.
Also, at the end of 2020, nine of the company’s sites were fitted with photovoltaic panels, providing total installed power of 428 kWc. A further 236 kWc from the building in Gosselies will be taken into account from 2021 onwards. These systems generated the equivalent of 316.7 MWh of electricity during the year.
Energy consumption and photovoltaic production from the company’s main sites and buildings
Movements in the electricity consumption of the company’s buildings
Louv
ain-
la-N
euve
Mon
tigni
es-s
ur-S
ambr
e
Stré
py-B
racq
uegn
ies (
1)
Stré
py-B
racq
uegn
ies (
2)
Lam
berm
ont
Fram
erie
s
Leuz
e-en
-Hai
naut
Eupe
n
Aye
(1)
Aye
(2)
Nam
ur (1
)
Nam
ur (2
)
Nam
ur (3
)
Nam
ur (4
)
Arlo
n
Mou
scro
n
Sam
brev
ille 0
200000
400000
600000
800000
1000000
1200000 2020
2019
2018
2017
2016
SambrevilleMouscronArlonNamur DispatchingNamur EliaNamur PrintshopNamur IDEGAye Magasin/CDFAye PôleEupenLeuzeFrameriesLambermontStrépy 12Strépy 4Montignies-sur-SambreLouvain La Neuve
1,200,000
1,000,000
800,000
600,000
400,000
200,000
0
2016
2017
2018
2019
2020
#p.28 ORES Assets BGAAP consolidated accounts 2020
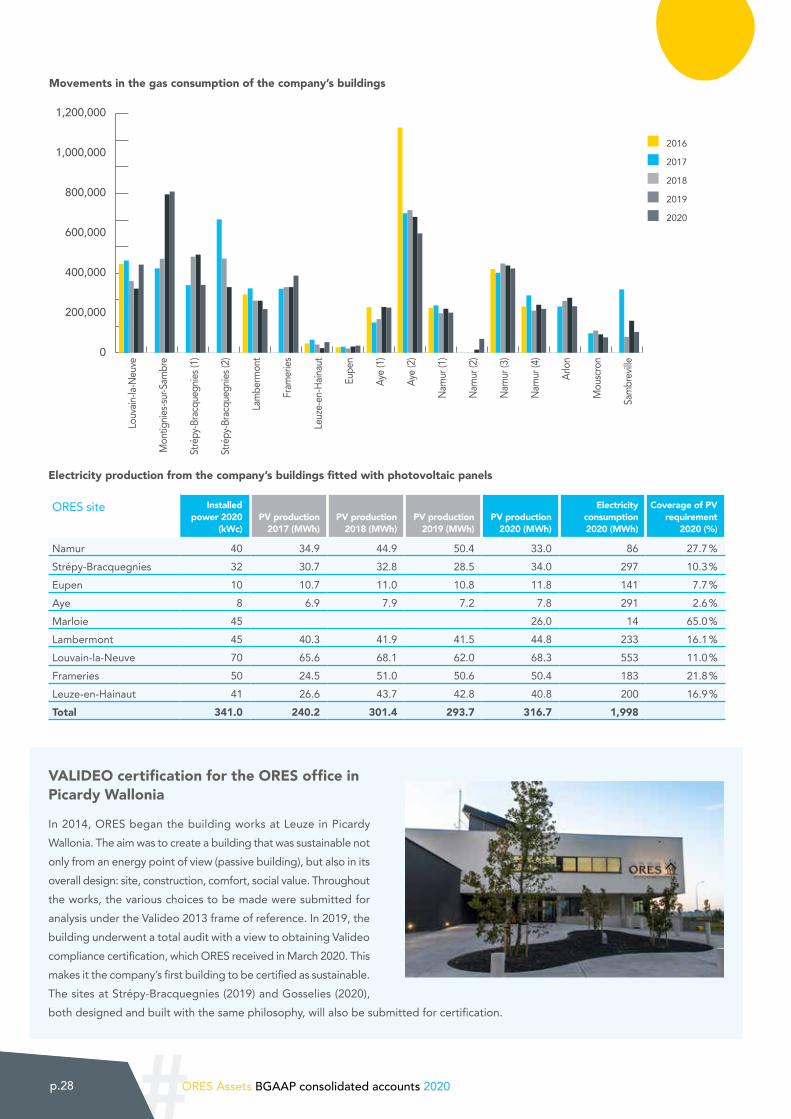
Electricity production from the company’s buildings fitted with photovoltaic panels
ORES site Installed power 2020
(kWc)PV production
2017 (MWh) PV production
2018 (MWh) PV production
2019 (MWh) PV production
2020 (MWh)
Electricity consumption 2020 (MWh)
Coverage of PV requirement
2020 (%)
Namur 40 34.9 44.9 50.4 33.0 86 27.7 %Strépy-Bracquegnies 32 30.7 32.8 28.5 34.0 297 10.3 %Eupen 10 10.7 11.0 10.8 11.8 141 7.7 %Aye 8 6.9 7.9 7.2 7.8 291 2.6 %Marloie 45 26.0 14 65.0 %Lambermont 45 40.3 41.9 41.5 44.8 233 16.1 %Louvain-la-Neuve 70 65.6 68.1 62.0 68.3 553 11.0 %Frameries 50 24.5 51.0 50.6 50.4 183 21.8 %Leuze-en-Hainaut 41 26.6 43.7 42.8 40.8 200 16.9 %Total 341.0 240.2 301.4 293.7 316.7 1,998
VALIDEO certification for the ORES office in Picardy Wallonia
In 2014, ORES began the building works at Leuze in Picardy Wallonia. The aim was to create a building that was sustainable not only from an energy point of view (passive building), but also in its overall design: site, construction, comfort, social value. Throughout the works, the various choices to be made were submitted for analysis under the Valideo 2013 frame of reference. In 2019, the building underwent a total audit with a view to obtaining Valideo compliance certification, which ORES received in March 2020. This makes it the company’s first building to be certified as sustainable. The sites at Strépy-Bracquegnies (2019) and Gosselies (2020), both designed and built with the same philosophy, will also be submitted for certification.
Movements in the gas consumption of the company’s buildings
0
200000
400000
600000
800000
1000000
1200000
1400000
1600000
1800000 2020
2019
2018
2017
2016
SambrevilleMouscronArlonNamur DispatchingNamur EliaNamur PrintshopNamur IDEGAye Magasin/CDFAye PôleEupenLeuzeFrameriesLambermontStrépy 12Strépy 4Montignies-sur-SambreLouvain La Neuve
1,200,000
1,000,000
800,000
600,000
400,000
200,000
0
2016
2017
2018
2019
2020
Louv
ain-la
-Neu
ve
Mon
tignie
s-sur
-Sam
bre
Stré
py-B
racq
uegn
ies (1
)
Stré
py-B
racq
uegn
ies (2
)
Lam
berm
ont
Fram
eries
Leuz
e-en
-Hain
aut
Eupe
n
Aye (
1)
Aye (
2)
Nam
ur (1
)
Nam
ur (2
)
Nam
ur (3
)
Nam
ur (4
)
Arlon
Mou
scro
n
Sam
brev
ille
# p.29ORES Assets BGAAP consolidated accounts 2020
Management and supervisory staff who are entitled to a leased company car, also have a financial incentive to opt for CNG or hybrid electric models. In 2020, 47 managers had opted for one or the other solution.
Carpooling is also encouraged for employees travelling to work in a private vehicle. In 2020, the carpooling figures dropped very sharply, to practically zero, due to the pandemic. On the other hand, “teleworking” or working from home became the order of the day and was made mandatory for administrative staff during the two periods of lockdown experienced during the year.
Responsible waste management
As part of the new overall 5-year prevention and protection plan, the management of waste is currently the subject of a process designed to redefine procedures and responsibilities, particularly in terms of tracking rubbish collections and recycling, with the overall aim being to keep improving waste management. In 2020, due to the pandemic and the phase during which non-urgent
works were suspended in the spring, followed by a gradual resumption, the waste generated by the company was down overall by 7.5% compared with 2019.
As far as ordinary industrial waste (known as Class II waste) is concerned, ORES has been implementing selective sorting for some years now, with tangible effects. Suppliers have also been encouraged to reduce excessive packaging. These measures are beginning to bear fruit, with ORES recording a little over 449 tons in 2020, which was the lowest figure for this category of waste since records have been kept. This downward trend involves most categories of waste, with the exception of the quantities of asbestos removed while maintaining the distribution cabinets and for contaminated soil, both of which receive special attention. Details of these changes, by waste type and method of processing, are shown in the tables below.
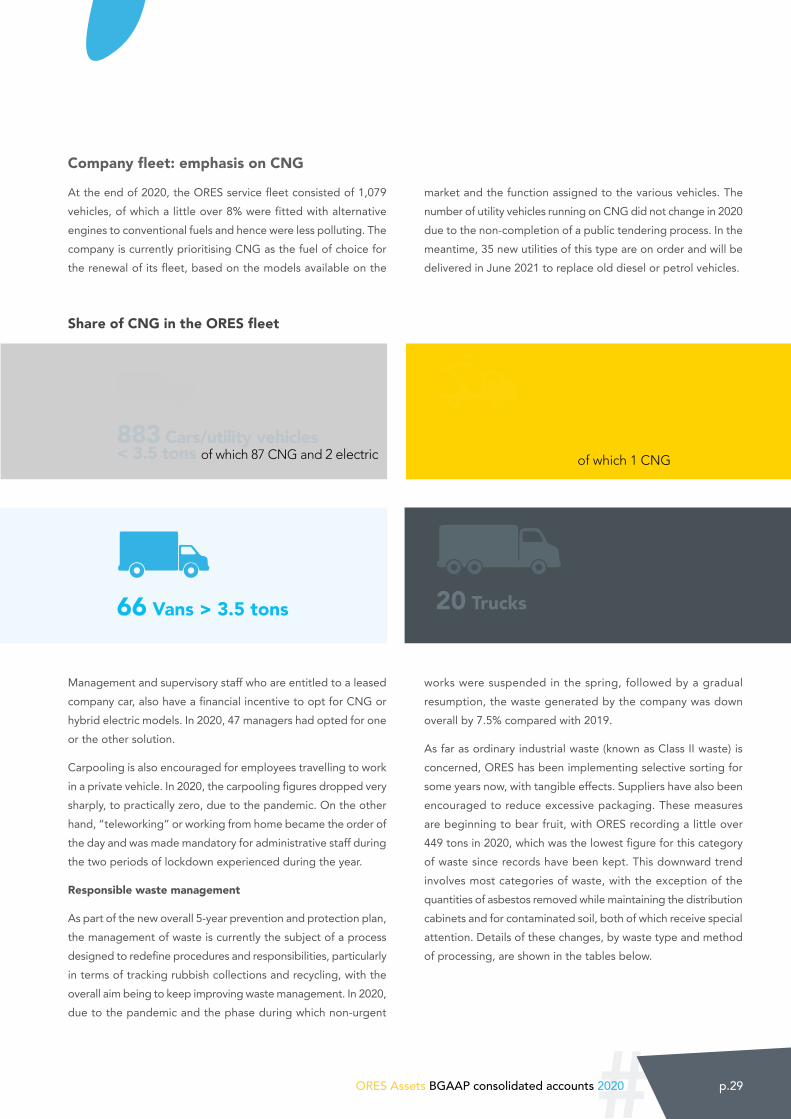
Company fleet: emphasis on CNG
At the end of 2020, the ORES service fleet consisted of 1,079 vehicles, of which a little over 8% were fitted with alternative engines to conventional fuels and hence were less polluting. The company is currently prioritising CNG as the fuel of choice for the renewal of its fleet, based on the models available on the
market and the function assigned to the various vehicles. The number of utility vehicles running on CNG did not change in 2020 due to the non-completion of a public tendering process. In the meantime, 35 new utilities of this type are on order and will be delivered in June 2021 to replace old diesel or petrol vehicles.
110 Truck-mounted aerial platforms of which 1 CNG
20 Trucks
Share of CNG in the ORES fleet
883 Cars/utility vehicles< 3.5 tons of which 87 CNG and 2 electric
66 Vans > 3.5 tons
#p.30 ORES Assets BGAAP consolidated accounts 2020
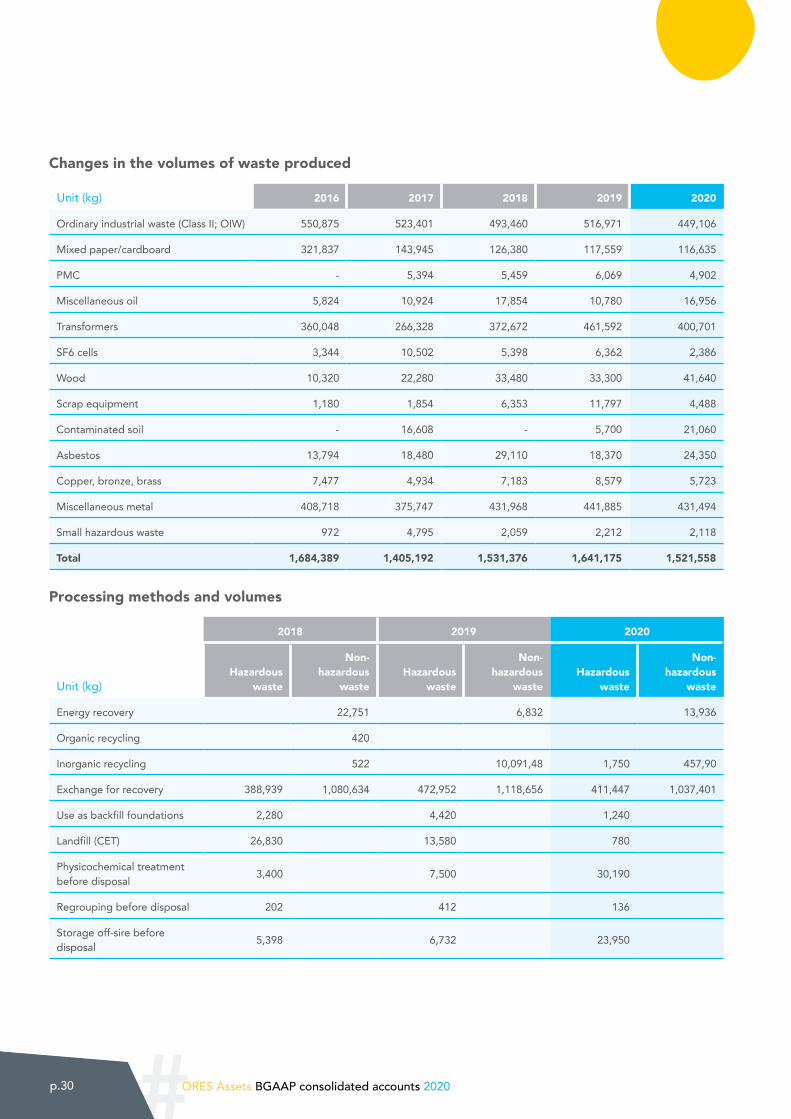
Changes in the volumes of waste produced
Unit (kg) 2016 2017 2018 2019 2020
Ordinary industrial waste (Class II; OIW) 550,875 523,401 493,460 516,971 449,106
Mixed paper/cardboard 321,837 143,945 126,380 117,559 116,635
PMC - 5,394 5,459 6,069 4,902
Miscellaneous oil 5,824 10,924 17,854 10,780 16,956
Transformers 360,048 266,328 372,672 461,592 400,701
SF6 cells 3,344 10,502 5,398 6,362 2,386
Wood 10,320 22,280 33,480 33,300 41,640
Scrap equipment 1,180 1,854 6,353 11,797 4,488
Contaminated soil - 16,608 - 5,700 21,060
Asbestos 13,794 18,480 29,110 18,370 24,350
Copper, bronze, brass 7,477 4,934 7,183 8,579 5,723
Miscellaneous metal 408,718 375,747 431,968 441,885 431,494
Small hazardous waste 972 4,795 2,059 2,212 2,118
Total 1,684,389 1,405,192 1,531,376 1,641,175 1,521,558
Processing methods and volumes
2018 2019 2020
Unit (kg)Hazardous
waste
Non-hazardous
wasteHazardous
waste
Non-hazardous
wasteHazardous
waste
Non-hazardous
waste
Energy recovery 22,751 6,832 13,936
Organic recycling 420
Inorganic recycling 522 10,091,48 1,750 457,90
Exchange for recovery 388,939 1,080,634 472,952 1,118,656 411,447 1,037,401
Use as backfill foundations 2,280 4,420 1,240
Landfill (CET) 26,830 13,580 780
Physicochemical treatment before disposal 3,400 7,500 30,190
Regrouping before disposal 202 412 136
Storage off-sire before disposal 5,398 6,732 23,950
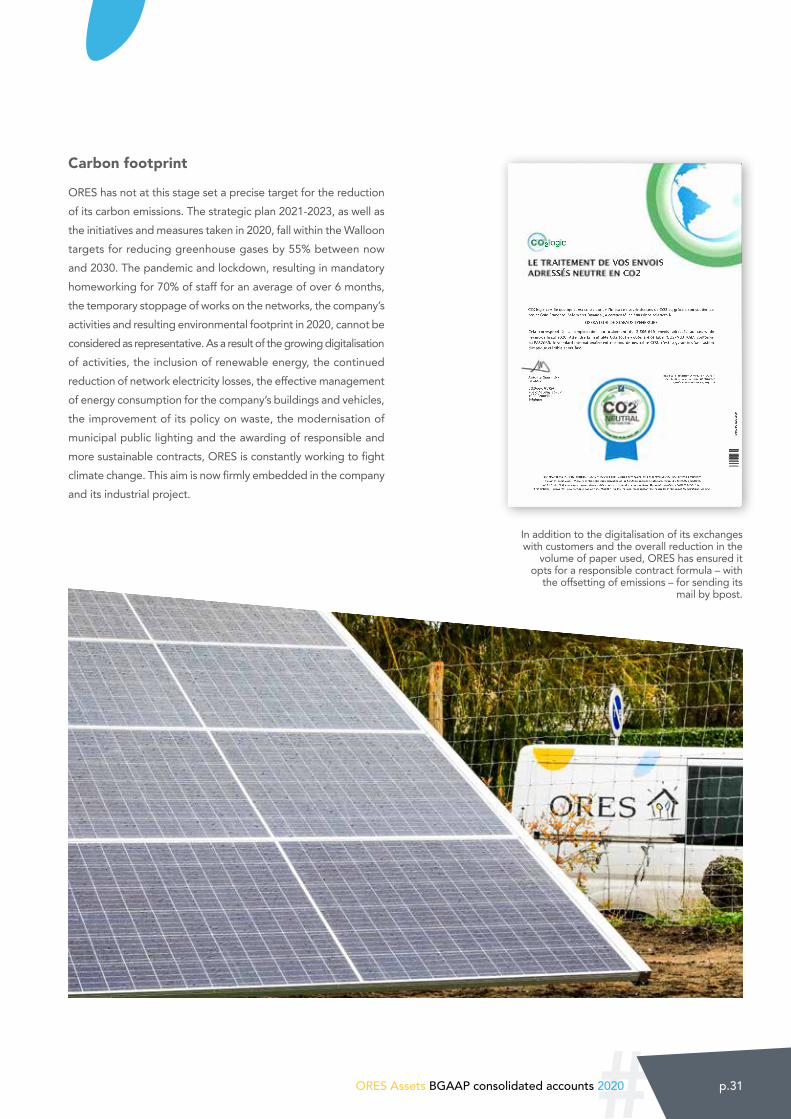
# p.31ORES Assets BGAAP consolidated accounts 2020
Carbon footprint
ORES has not at this stage set a precise target for the reduction of its carbon emissions. The strategic plan 2021-2023, as well as the initiatives and measures taken in 2020, fall within the Walloon targets for reducing greenhouse gases by 55% between now and 2030. The pandemic and lockdown, resulting in mandatory homeworking for 70% of staff for an average of over 6 months, the temporary stoppage of works on the networks, the company’s activities and resulting environmental footprint in 2020, cannot be considered as representative. As a result of the growing digitalisation of activities, the inclusion of renewable energy, the continued reduction of network electricity losses, the effective management of energy consumption for the company’s buildings and vehicles, the improvement of its policy on waste, the modernisation of municipal public lighting and the awarding of responsible and more sustainable contracts, ORES is constantly working to fight climate change. This aim is now firmly embedded in the company and its industrial project.
In addition to the digitalisation of its exchanges
with customers and the overall reduction in the volume of paper used, ORES has ensured it
opts for a responsible contract formula – with the offsetting of emissions – for sending its
mail by bpost.
#p.32 ORES Assets BGAAP consolidated accounts 2020
4. Reliable and sustainable networks
As reaffirmed by ORES’s stakeholders in December 2020, the reliability of its distribution networks is one of the major sustainability challenges for the future. Essential as they are for the community, businesses and households, like genuine cardiovascular systems of society, the electricity and gas networks are the backbone around which energy transition is built.
Overall, the main responsibility of ORES in its role as a DNM is to guarantee the long-term reliability of its energy distribution networks. To contribute actively to the dynamic of energy transition and incorporate the power output from renewable sources, ORES must continue investing in a way that is effective and economically efficient. In the face of climate change and its effects, guaranteeing supply is more important than ever, as is the resilience of the networks, for the benefit of the whole population, which needs to rely legitimately on continued high-quality supplies of energy. The operating and breakdown repair services at ORES are organised and sized to be able to take action on the ground 24/7, particularly if there is an electricity supply problem or an incident in the gas network.
In 2020, against a background marked in particular by the health measures taken against the pandemic, adjustments had to be made to the management of these networks, especially during the first lockdown. Investment works, connections and other work scheduled with customers, as well as maintenance and modernisation works on the networks were totally suspended for a number of weeks, with a gradual resumption of work from May onwards.
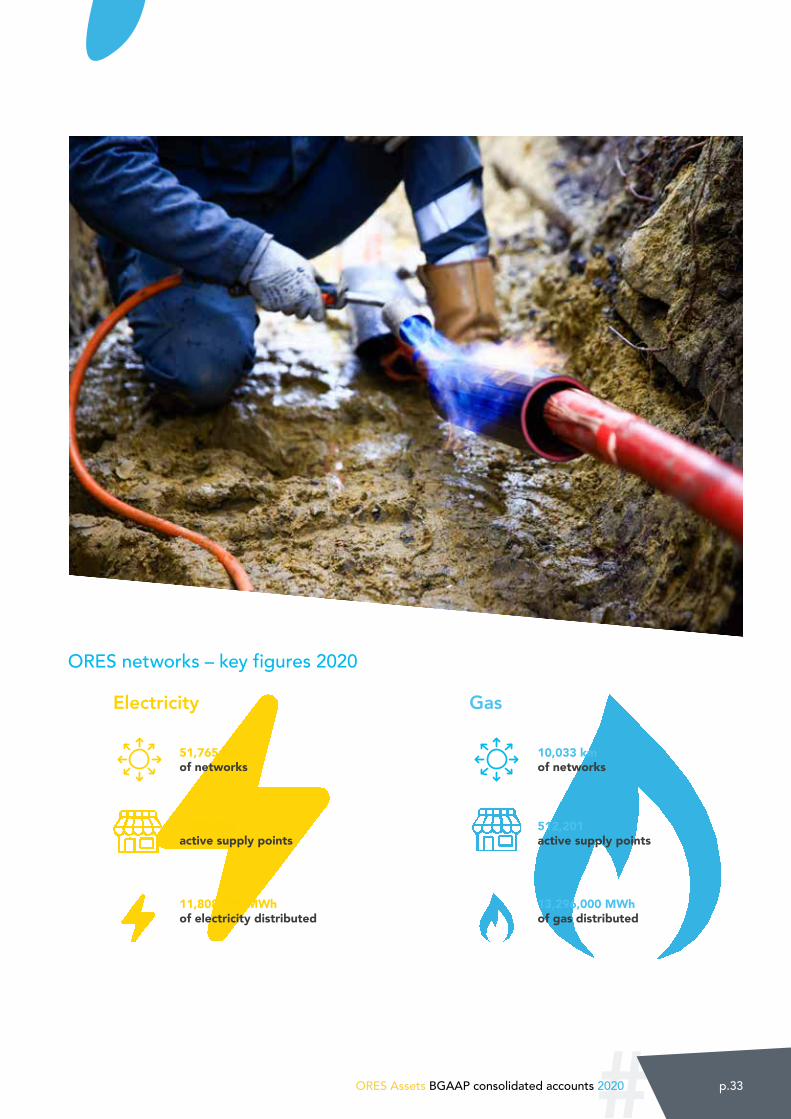
# p.33ORES Assets BGAAP consolidated accounts 2020
ORES networks – key figures 2020
51,765 km of networks
10,033 km of networks
GasElectricity
1,379,894 active supply points
512,201 active supply points
11,808,075 MWh of electricity distributed
13,296,000 MWhof gas distributed
#p.34 ORES Assets BGAAP consolidated accounts 2020
Electricity distribution networks
21,496 kmMedium-voltage
electricity network
30,269 kmLow-voltage
electricity network
Despite the temporary suspension of work on the network infrastructures, breakdown and emergency services continued working throughout the year. Our teams were called out 10,514 times to work on the electricity network in 2020. This figure was
slightly lower (down 4.5%) than the average for the past four years. The length of the work and the time to restore power on the medium-voltage network were down for scheduled work, and stable – in combined time – for outages or “unplanned downtime”.
Average in hours 2019
Average in hours 2020
Planned downtime – response times 00:35:53 00:22:38
Restoration of power supply 03:15:56 03:10:22
Unplanned downtime – response times 00:45:00 00:43:00
Restoration of power supply 00:44:21 00:46:09
On the low-voltage network that supplies customers directly from distribution cabinets, outages may be caused by damage or technical defects, as well as by bad weather and “outside influences” – usually cables pulled out by companies carrying out roadworks close to network infrastructures. The indicators relating to response times were up slightly (+4 minutes) compared with the previous year. This situation was associated in particular
with the significant weather events that occurred during the year and the management of their effects on the 19,200 km of low-voltage overhead electricity networks. The number of outages resulting in downtimes of more than 6 hours were also up – 108 compared with 82 in 2019 – due to the storms at the beginning and end of the year (see box).
Average in hours 2019
Average in hours 2020
Average time to arrive on-site 00:50:46 00:52:35
Average work time 01:07:53 01:10:04
Unplanned downtime 01:58:39 02:02:39
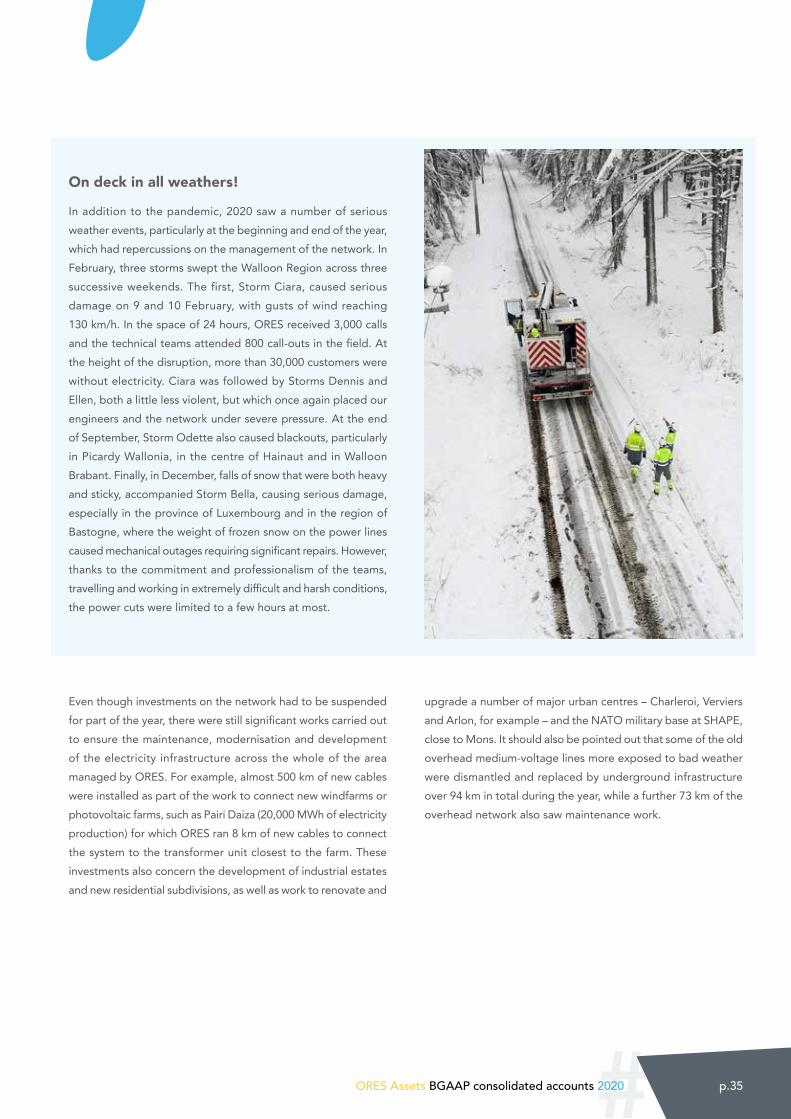
# p.35ORES Assets BGAAP consolidated accounts 2020
On deck in all weathers!
In addition to the pandemic, 2020 saw a number of serious weather events, particularly at the beginning and end of the year, which had repercussions on the management of the network. In February, three storms swept the Walloon Region across three successive weekends. The first, Storm Ciara, caused serious damage on 9 and 10 February, with gusts of wind reaching 130 km/h. In the space of 24 hours, ORES received 3,000 calls and the technical teams attended 800 call-outs in the field. At the height of the disruption, more than 30,000 customers were without electricity. Ciara was followed by Storms Dennis and Ellen, both a little less violent, but which once again placed our engineers and the network under severe pressure. At the end of September, Storm Odette also caused blackouts, particularly in Picardy Wallonia, in the centre of Hainaut and in Walloon Brabant. Finally, in December, falls of snow that were both heavy and sticky, accompanied Storm Bella, causing serious damage, especially in the province of Luxembourg and in the region of Bastogne, where the weight of frozen snow on the power lines caused mechanical outages requiring significant repairs. However, thanks to the commitment and professionalism of the teams, travelling and working in extremely difficult and harsh conditions, the power cuts were limited to a few hours at most.
Even though investments on the network had to be suspended for part of the year, there were still significant works carried out to ensure the maintenance, modernisation and development of the electricity infrastructure across the whole of the area managed by ORES. For example, almost 500 km of new cables were installed as part of the work to connect new windfarms or photovoltaic farms, such as Pairi Daiza (20,000 MWh of electricity production) for which ORES ran 8 km of new cables to connect the system to the transformer unit closest to the farm. These investments also concern the development of industrial estates and new residential subdivisions, as well as work to renovate and
upgrade a number of major urban centres – Charleroi, Verviers and Arlon, for example – and the NATO military base at SHAPE, close to Mons. It should also be pointed out that some of the old overhead medium-voltage lines more exposed to bad weather were dismantled and replaced by underground infrastructure over 94 km in total during the year, while a further 73 km of the overhead network also saw maintenance work.
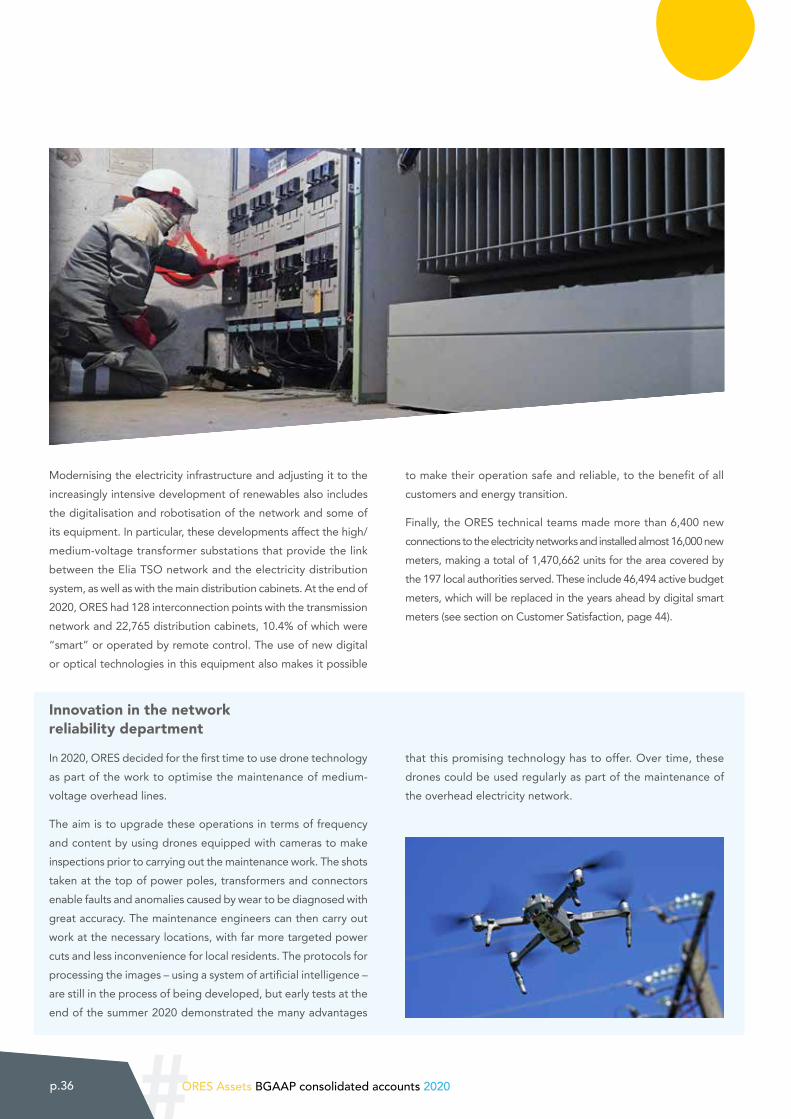
#p.36 ORES Assets BGAAP consolidated accounts 2020
Modernising the electricity infrastructure and adjusting it to the increasingly intensive development of renewables also includes the digitalisation and robotisation of the network and some of its equipment. In particular, these developments affect the high/medium-voltage transformer substations that provide the link between the Elia TSO network and the electricity distribution system, as well as with the main distribution cabinets. At the end of 2020, ORES had 128 interconnection points with the transmission network and 22,765 distribution cabinets, 10.4% of which were “smart” or operated by remote control. The use of new digital or optical technologies in this equipment also makes it possible
to make their operation safe and reliable, to the benefit of all customers and energy transition.
Finally, the ORES technical teams made more than 6,400 new connections to the electricity networks and installed almost 16,000 new meters, making a total of 1,470,662 units for the area covered by the 197 local authorities served. These include 46,494 active budget meters, which will be replaced in the years ahead by digital smart meters (see section on Customer Satisfaction, page 44).
Innovation in the network reliability department
In 2020, ORES decided for the first time to use drone technology as part of the work to optimise the maintenance of medium-voltage overhead lines.
The aim is to upgrade these operations in terms of frequency and content by using drones equipped with cameras to make inspections prior to carrying out the maintenance work. The shots taken at the top of power poles, transformers and connectors enable faults and anomalies caused by wear to be diagnosed with great accuracy. The maintenance engineers can then carry out work at the necessary locations, with far more targeted power cuts and less inconvenience for local residents. The protocols for processing the images – using a system of artificial intelligence – are still in the process of being developed, but early tests at the end of the summer 2020 demonstrated the many advantages
that this promising technology has to offer. Over time, these drones could be used regularly as part of the maintenance of the overhead electricity network.

# p.37ORES Assets BGAAP consolidated accounts 2020
Response to operating problems
On 28 May 2020, at 2.15 in the morning, ORES suffered an attempt to steal cables on a footbridge over the river Sambre at Monceau, near Charleroi. This footbridge was a sensitive component in the network because it carried 9 medium-voltage main feeder cables supplying part of the Charleroi area from a nearby transformer. The attempted theft ended up causing a fire and all of the cables – including a feeder supplying André Vésale hospital – were seriously damaged. This deprived more than 15,000 customers of their power supply, creating a critical and highly problematic situation in terms of network management.
Fortunately, there were investment works already underway at this location – including in particular drilling under the Sambre – designed to make this footbridge redundant in favour of an underground solution. A crisis meeting was convened at very short notice with the subcontractors and ORES teams to organise works immediately, operating round the clock. In the space of just one week, 400 metres of trenches were dug and new cables run, enabling the footbridge to be permanently abandoned.
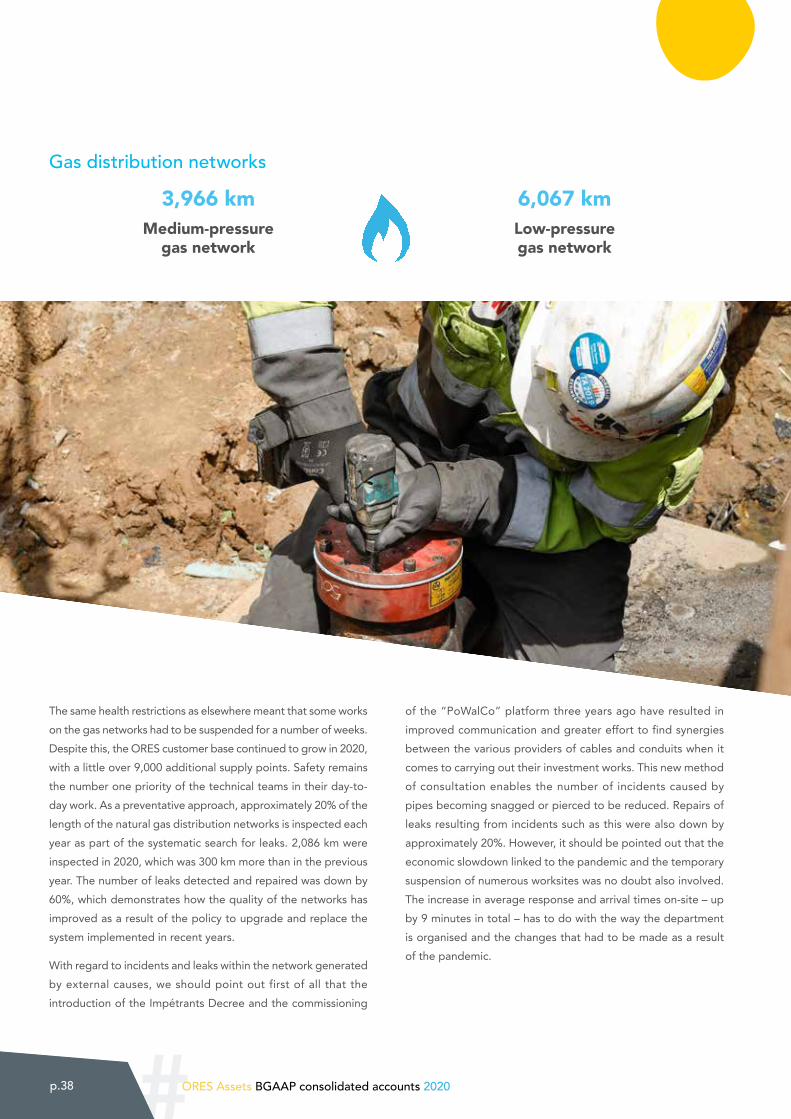
#p.38 ORES Assets BGAAP consolidated accounts 2020
Gas distribution networks
3,966 kmMedium-pressure
gas network
6,067 kmLow-pressure gas network
The same health restrictions as elsewhere meant that some works on the gas networks had to be suspended for a number of weeks. Despite this, the ORES customer base continued to grow in 2020, with a little over 9,000 additional supply points. Safety remains the number one priority of the technical teams in their day-to-day work. As a preventative approach, approximately 20% of the length of the natural gas distribution networks is inspected each year as part of the systematic search for leaks. 2,086 km were inspected in 2020, which was 300 km more than in the previous year. The number of leaks detected and repaired was down by 60%, which demonstrates how the quality of the networks has improved as a result of the policy to upgrade and replace the system implemented in recent years.
With regard to incidents and leaks within the network generated by external causes, we should point out first of all that the introduction of the Impétrants Decree and the commissioning
of the “PoWalCo” platform three years ago have resulted in improved communication and greater effort to find synergies between the various providers of cables and conduits when it comes to carrying out their investment works. This new method of consultation enables the number of incidents caused by pipes becoming snagged or pierced to be reduced. Repairs of leaks resulting from incidents such as this were also down by approximately 20%. However, it should be pointed out that the economic slowdown linked to the pandemic and the temporary suspension of numerous worksites was no doubt also involved. The increase in average response and arrival times on-site – up by 9 minutes in total – has to do with the way the department is organised and the changes that had to be made as a result of the pandemic.
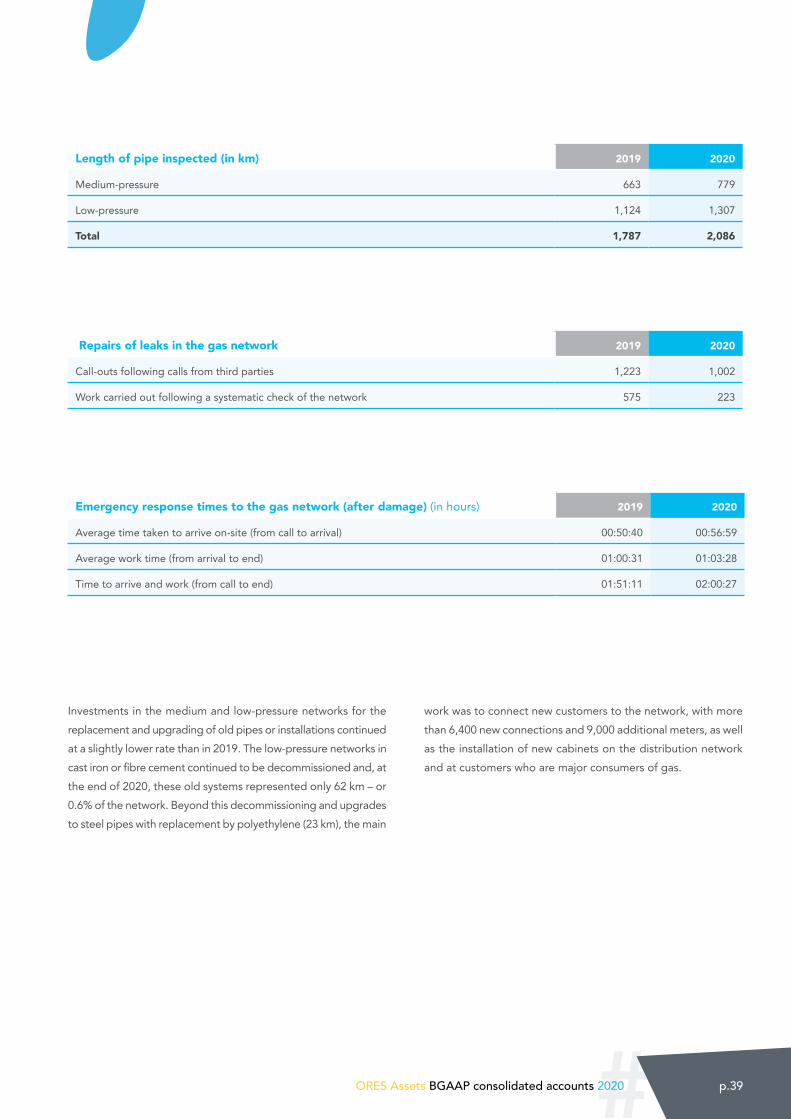
# p.39ORES Assets BGAAP consolidated accounts 2020
Length of pipe inspected (in km) 2019 2020
Medium-pressure 663 779
Low-pressure 1,124 1,307
Total 1,787 2,086
Repairs of leaks in the gas network 2019 2020
Call-outs following calls from third parties 1,223 1,002
Work carried out following a systematic check of the network 575 223
Emergency response times to the gas network (after damage) (in hours) 2019 2020
Average time taken to arrive on-site (from call to arrival) 00:50:40 00:56:59
Average work time (from arrival to end) 01:00:31 01:03:28
Time to arrive and work (from call to end) 01:51:11 02:00:27
Investments in the medium and low-pressure networks for the replacement and upgrading of old pipes or installations continued at a slightly lower rate than in 2019. The low-pressure networks in cast iron or fibre cement continued to be decommissioned and, at the end of 2020, these old systems represented only 62 km – or 0.6% of the network. Beyond this decommissioning and upgrades to steel pipes with replacement by polyethylene (23 km), the main
work was to connect new customers to the network, with more than 6,400 new connections and 9,000 additional meters, as well as the installation of new cabinets on the distribution network and at customers who are major consumers of gas.
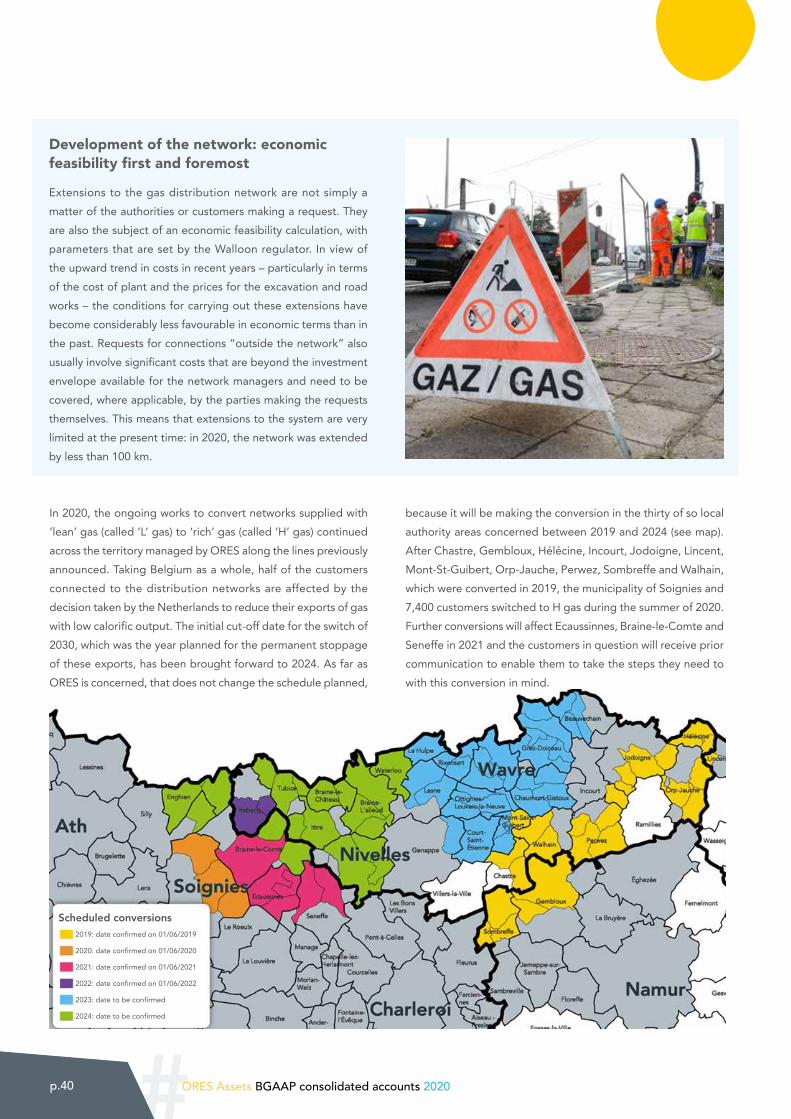
#p.40 ORES Assets BGAAP consolidated accounts 2020
Development of the network: economic feasibility first and foremost
Extensions to the gas distribution network are not simply a matter of the authorities or customers making a request. They are also the subject of an economic feasibility calculation, with parameters that are set by the Walloon regulator. In view of the upward trend in costs in recent years – particularly in terms of the cost of plant and the prices for the excavation and road works – the conditions for carrying out these extensions have become considerably less favourable in economic terms than in the past. Requests for connections “outside the network” also usually involve significant costs that are beyond the investment envelope available for the network managers and need to be covered, where applicable, by the parties making the requests themselves. This means that extensions to the system are very limited at the present time: in 2020, the network was extended by less than 100 km.
In 2020, the ongoing works to convert networks supplied with ‘lean’ gas (called ‘L’ gas) to ‘rich’ gas (called ‘H’ gas) continued across the territory managed by ORES along the lines previously announced. Taking Belgium as a whole, half of the customers connected to the distribution networks are affected by the decision taken by the Netherlands to reduce their exports of gas with low calorific output. The initial cut-off date for the switch of 2030, which was the year planned for the permanent stoppage of these exports, has been brought forward to 2024. As far as ORES is concerned, that does not change the schedule planned,
because it will be making the conversion in the thirty of so local authority areas concerned between 2019 and 2024 (see map). After Chastre, Gembloux, Hélécine, Incourt, Jodoigne, Lincent, Mont-St-Guibert, Orp-Jauche, Perwez, Sombreffe and Walhain, which were converted in 2019, the municipality of Soignies and 7,400 customers switched to H gas during the summer of 2020. Further conversions will affect Ecaussinnes, Braine-le-Comte and Seneffe in 2021 and the customers in question will receive prior communication to enable them to take the steps they need to with this conversion in mind.
2019: date confirmed on 01/06/2019
2020: date confirmed on 01/06/2020
2021: date confirmed on 01/06/2021
2022: date confirmed on 01/06/2022
2023: date to be confirmed
2024: date to be confirmed
Scheduled conversions
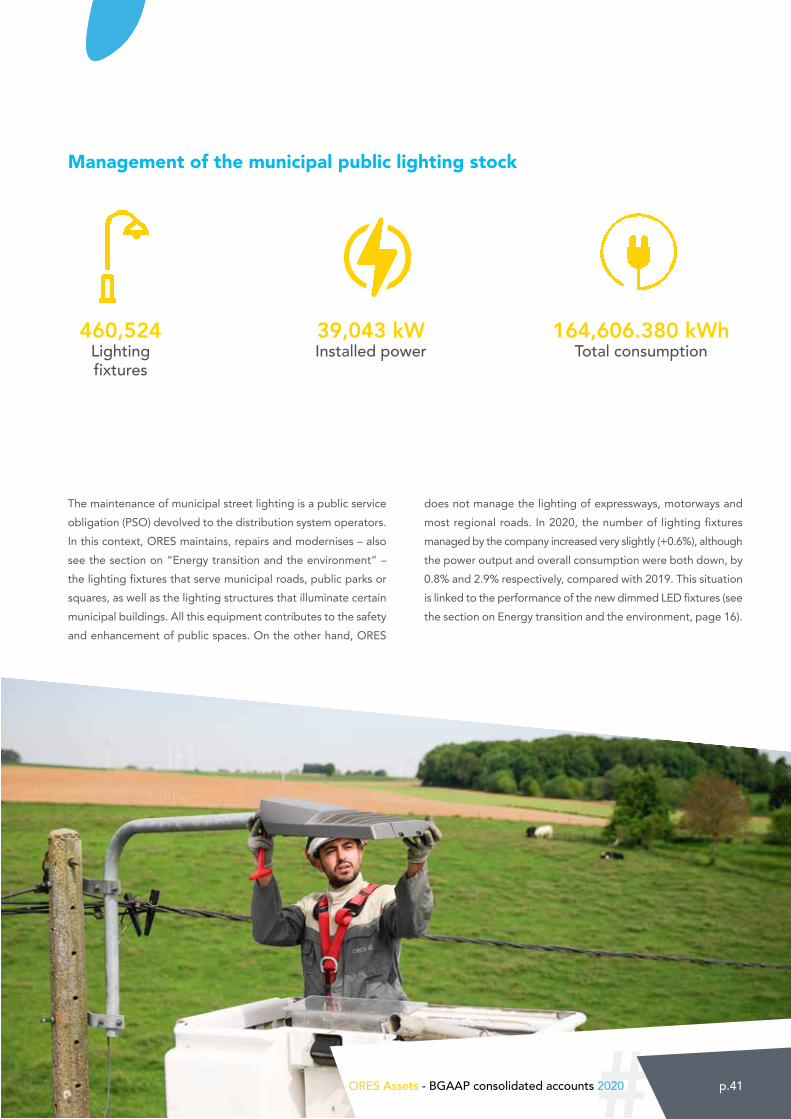
# p.41ORES Assets BGAAP consolidated accounts 2020#ORES Assets - BGAAP consolidated accounts 2020 p.41
Management of the municipal public lighting stock
460,524Lighting fixtures
39,043 kWInstalled power
164,606.380 kWhTotal consumption
The maintenance of municipal street lighting is a public service obligation (PSO) devolved to the distribution system operators. In this context, ORES maintains, repairs and modernises – also see the section on “Energy transition and the environment” – the lighting fixtures that serve municipal roads, public parks or squares, as well as the lighting structures that illuminate certain municipal buildings. All this equipment contributes to the safety and enhancement of public spaces. On the other hand, ORES
does not manage the lighting of expressways, motorways and most regional roads. In 2020, the number of lighting fixtures managed by the company increased very slightly (+0.6%), although the power output and overall consumption were both down, by 0.8% and 2.9% respectively, compared with 2019. This situation is linked to the performance of the new dimmed LED fixtures (see the section on Energy transition and the environment, page 16).
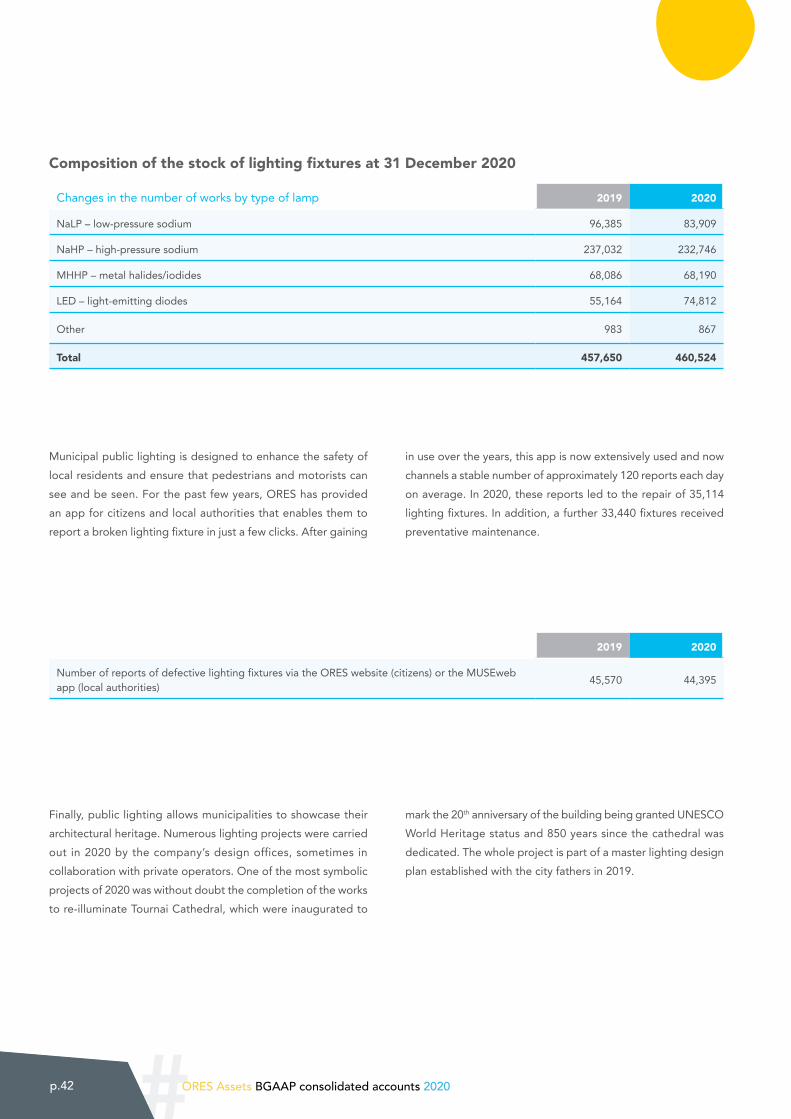
#p.42 ORES Assets BGAAP consolidated accounts 2020
Municipal public lighting is designed to enhance the safety of local residents and ensure that pedestrians and motorists can see and be seen. For the past few years, ORES has provided an app for citizens and local authorities that enables them to report a broken lighting fixture in just a few clicks. After gaining
in use over the years, this app is now extensively used and now channels a stable number of approximately 120 reports each day on average. In 2020, these reports led to the repair of 35,114 lighting fixtures. In addition, a further 33,440 fixtures received preventative maintenance.
Finally, public lighting allows municipalities to showcase their architectural heritage. Numerous lighting projects were carried out in 2020 by the company’s design offices, sometimes in collaboration with private operators. One of the most symbolic projects of 2020 was without doubt the completion of the works to re-illuminate Tournai Cathedral, which were inaugurated to
mark the 20th anniversary of the building being granted UNESCO World Heritage status and 850 years since the cathedral was dedicated. The whole project is part of a master lighting design plan established with the city fathers in 2019.
Composition of the stock of lighting fixtures at 31 December 2020
Changes in the number of works by type of lamp 2019 2020
NaLP – low-pressure sodium 96,385 83,909
NaHP – high-pressure sodium 237,032 232,746
MHHP – metal halides/iodides 68,086 68,190
LED – light-emitting diodes 55,164 74,812
Other 983 867
Total 457,650 460,524
2019 2020
Number of reports of defective lighting fixtures via the ORES website (citizens) or the MUSEweb app (local authorities) 45,570 44,395
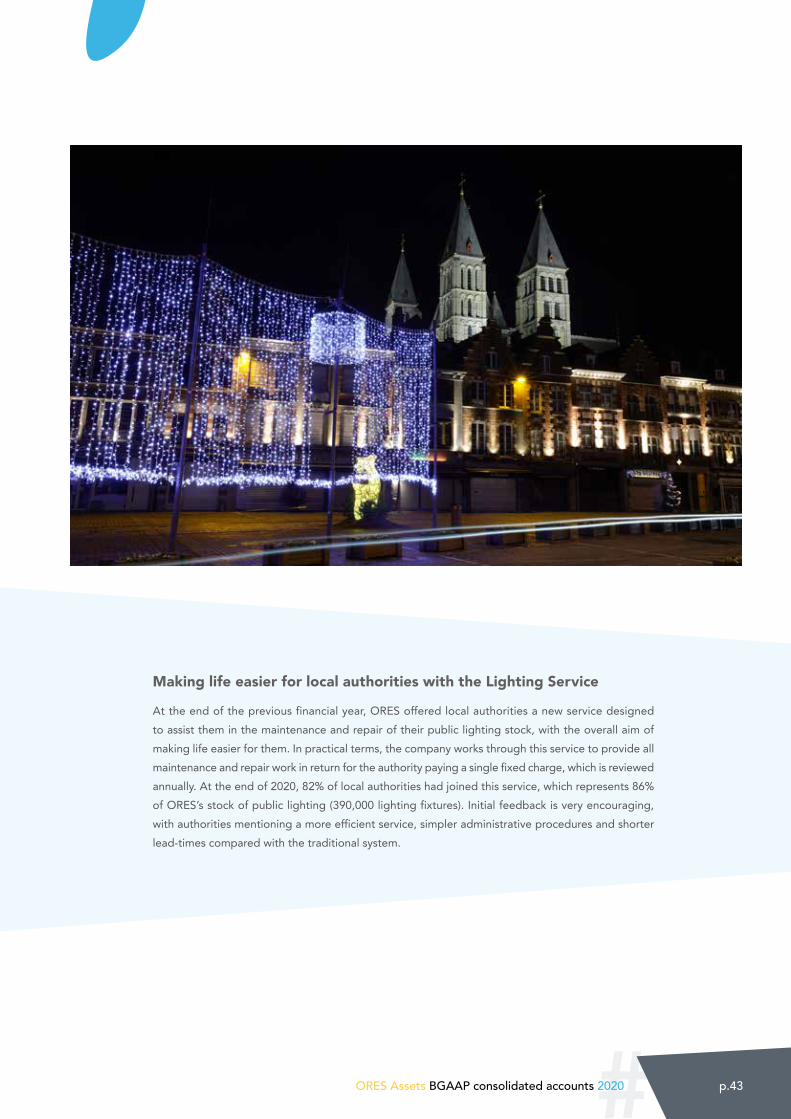
# p.43ORES Assets BGAAP consolidated accounts 2020
Making life easier for local authorities with the Lighting Service
At the end of the previous financial year, ORES offered local authorities a new service designed to assist them in the maintenance and repair of their public lighting stock, with the overall aim of making life easier for them. In practical terms, the company works through this service to provide all maintenance and repair work in return for the authority paying a single fixed charge, which is reviewed annually. At the end of 2020, 82% of local authorities had joined this service, which represents 86% of ORES’s stock of public lighting (390,000 lighting fixtures). Initial feedback is very encouraging, with authorities mentioning a more efficient service, simpler administrative procedures and shorter lead-times compared with the traditional system.

#p.44 ORES Assets BGAAP consolidated accounts 2020
In its strategic plan 2021-2023, ORES reaffirmed the importance of the customer for the way the company conducts its business and for its continuity. ORES aims to make life easier for its customers. Their satisfaction regarding the services provided is assessed regularly and, where necessary, the range of service is adjusted to meet the needs expressed. Digital transformation continues in addition to traditional channels of interaction, with the aim of also strengthening social inclusion in terms of access to energy transition.
As part of operating its various business lines, ORES take changes to the needs of customers into account in order to offer them a service that meets their expectations. In 2020, the company implemented a number of initiatives to that end by improving the quality of its range of services and making communication and
interaction smoother with customers. Also, in its public service missions and obligations of a social nature, the year was marked by the pandemic and the responses brought to bear to cater for the difficulties encountered by vulnerable people.
5. Customers at the heart of the business
Connect My Home
June 2020 saw the official launch of a service totally focused on the needs of residential customers involved in their own building project. Initiated by ORES in the form of a pilot in 2015, the Connect My Home service is the first of its kind for Belgium: for the first time, four operators of cables and conduits – ORES, Proximus, VOO and SWDE – are offering to take care of the connection of new homes to the electricity, gas, water and telecoms networks via a single administrative request, for a single price and with no surcharges. An ORES customer adviser manages the whole business, from the customer making the request, right through to completion of the works. Once the work has been scheduled,
everything is completed in a day, sometimes even half a day. The customer saves time, effort and stress. For the local authorities involved, this service also offers a range of benefits, because they have to deal with fewer permit applications, while the inconvenience of having multiple works going on in the same road or street is also avoided. At the end of 2020, Connect My Home was available from the four partners in all local authority areas where they operate, with the exception of areas in Walloon Brabant and the province of Luxembourg, where the service will be rolled out at the beginning of 2021.
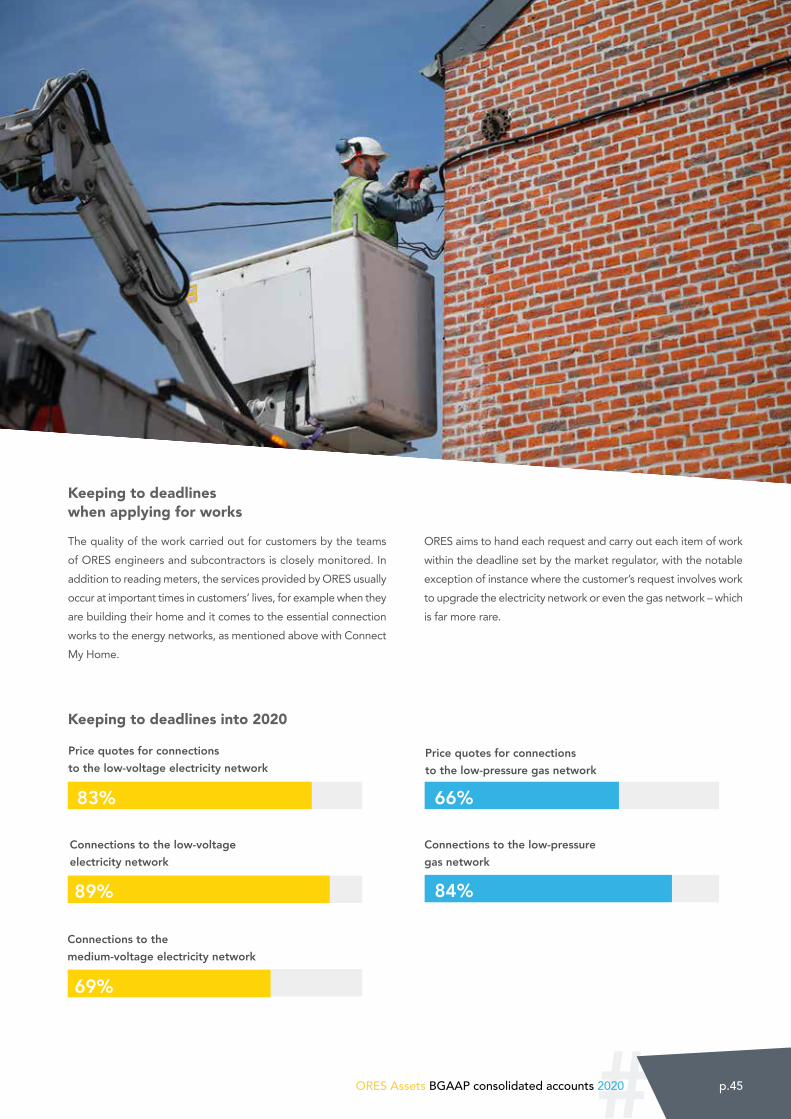
# p.45ORES Assets BGAAP consolidated accounts 2020
Keeping to deadlines when applying for works
The quality of the work carried out for customers by the teams of ORES engineers and subcontractors is closely monitored. In addition to reading meters, the services provided by ORES usually occur at important times in customers’ lives, for example when they are building their home and it comes to the essential connection works to the energy networks, as mentioned above with Connect My Home.
ORES aims to hand each request and carry out each item of work within the deadline set by the market regulator, with the notable exception of instance where the customer’s request involves work to upgrade the electricity network or even the gas network – which is far more rare.
Keeping to deadlines into 2020
Connections to the low-voltage electricity network
Price quotes for connections to the low-voltage electricity network
Price quotes for connections to the low-pressure gas network
Connections to the low-pressure gas network
Connections to the medium-voltage electricity network
83% 66%
84%89%
69%
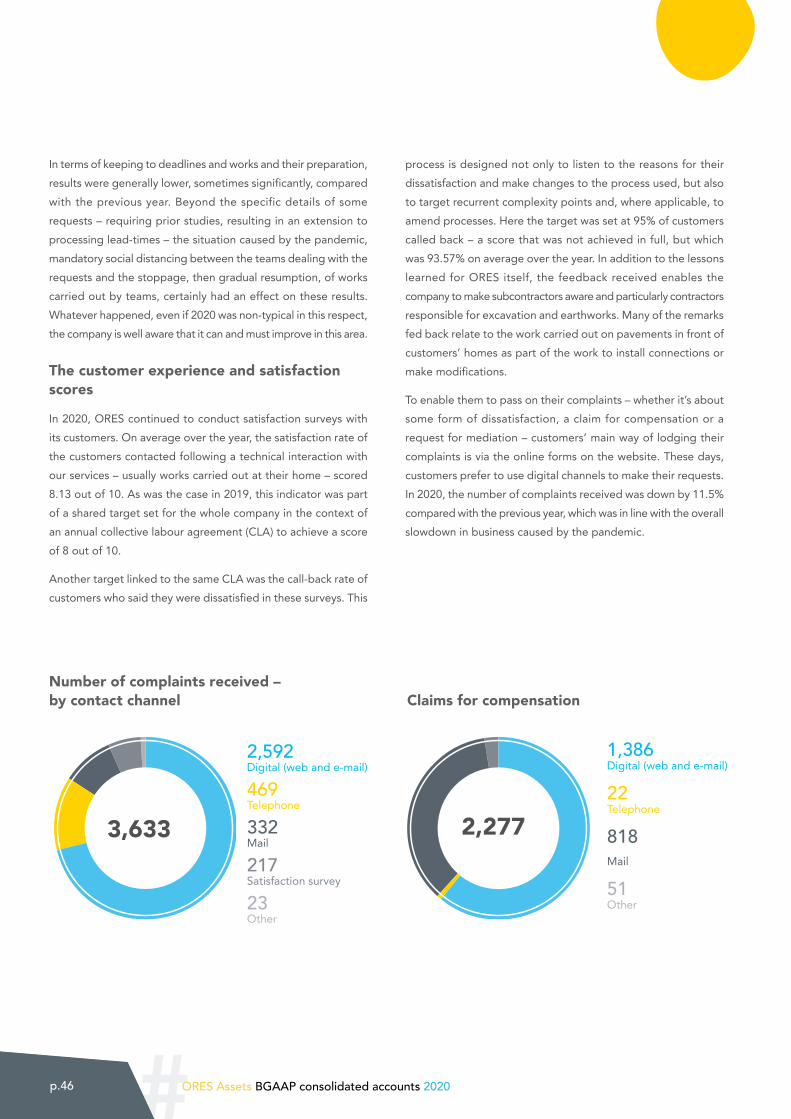
#p.46 ORES Assets BGAAP consolidated accounts 2020
In terms of keeping to deadlines and works and their preparation, results were generally lower, sometimes significantly, compared with the previous year. Beyond the specific details of some requests – requiring prior studies, resulting in an extension to processing lead-times – the situation caused by the pandemic, mandatory social distancing between the teams dealing with the requests and the stoppage, then gradual resumption, of works carried out by teams, certainly had an effect on these results. Whatever happened, even if 2020 was non-typical in this respect, the company is well aware that it can and must improve in this area.
The customer experience and satisfaction scores
In 2020, ORES continued to conduct satisfaction surveys with its customers. On average over the year, the satisfaction rate of the customers contacted following a technical interaction with our services – usually works carried out at their home – scored 8.13 out of 10. As was the case in 2019, this indicator was part of a shared target set for the whole company in the context of an annual collective labour agreement (CLA) to achieve a score of 8 out of 10.
Another target linked to the same CLA was the call-back rate of customers who said they were dissatisfied in these surveys. This
process is designed not only to listen to the reasons for their dissatisfaction and make changes to the process used, but also to target recurrent complexity points and, where applicable, to amend processes. Here the target was set at 95% of customers called back – a score that was not achieved in full, but which was 93.57% on average over the year. In addition to the lessons learned for ORES itself, the feedback received enables the company to make subcontractors aware and particularly contractors responsible for excavation and earthworks. Many of the remarks fed back relate to the work carried out on pavements in front of customers’ homes as part of the work to install connections or make modifications.
To enable them to pass on their complaints – whether it’s about some form of dissatisfaction, a claim for compensation or a request for mediation – customers’ main way of lodging their complaints is via the online forms on the website. These days, customers prefer to use digital channels to make their requests. In 2020, the number of complaints received was down by 11.5% compared with the previous year, which was in line with the overall slowdown in business caused by the pandemic.
3,633 2,277
Number of complaints received – by contact channel Claims for compensation
2,592 Digital (web and e-mail)
469 Telephone
332 Mail
217 Satisfaction survey
23 Other
1,386 Digital (web and e-mail)
22 Telephone
818 Mail 51 Other
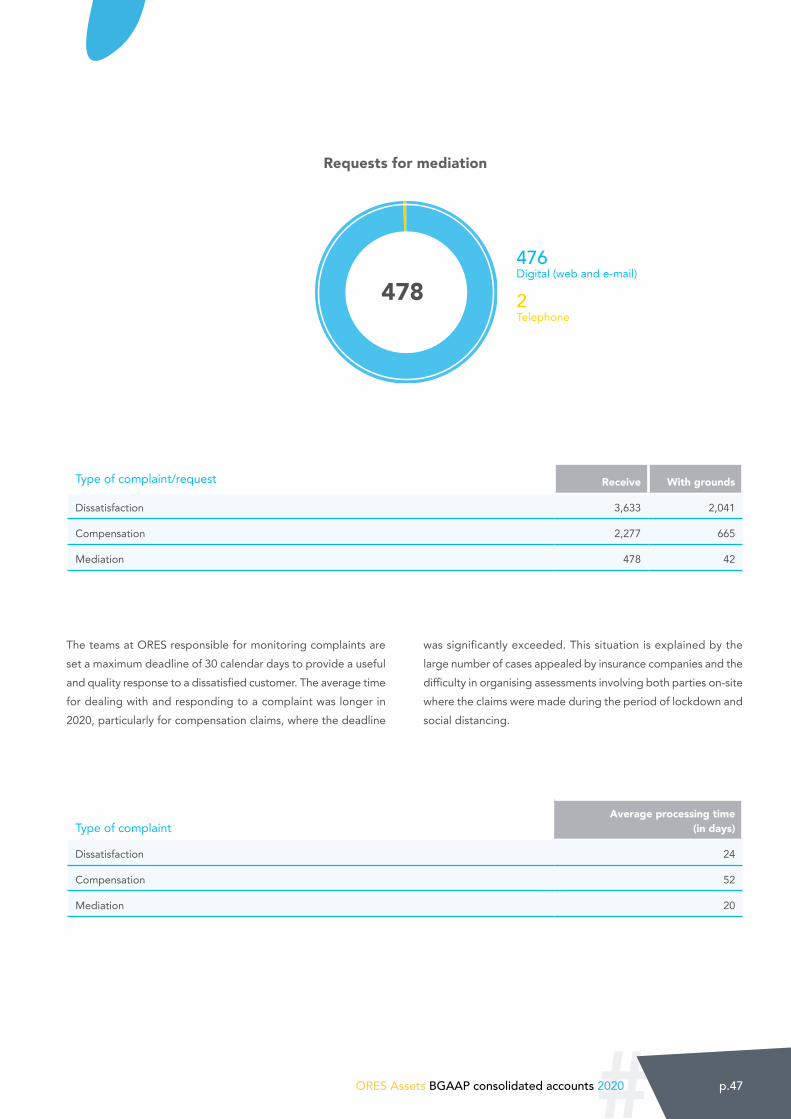
# p.47ORES Assets BGAAP consolidated accounts 2020
The teams at ORES responsible for monitoring complaints are set a maximum deadline of 30 calendar days to provide a useful and quality response to a dissatisfied customer. The average time for dealing with and responding to a complaint was longer in 2020, particularly for compensation claims, where the deadline
was significantly exceeded. This situation is explained by the large number of cases appealed by insurance companies and the difficulty in organising assessments involving both parties on-site where the claims were made during the period of lockdown and social distancing.
478
Requests for mediation
Type of complaint/request Receive With grounds
Dissatisfaction 3,633 2,041
Compensation 2,277 665
Mediation 478 42
Type of complaintAverage processing time
(in days)
Dissatisfaction 24
Compensation 52
Mediation 20
476 Digital (web and e-mail)
2 Telephone
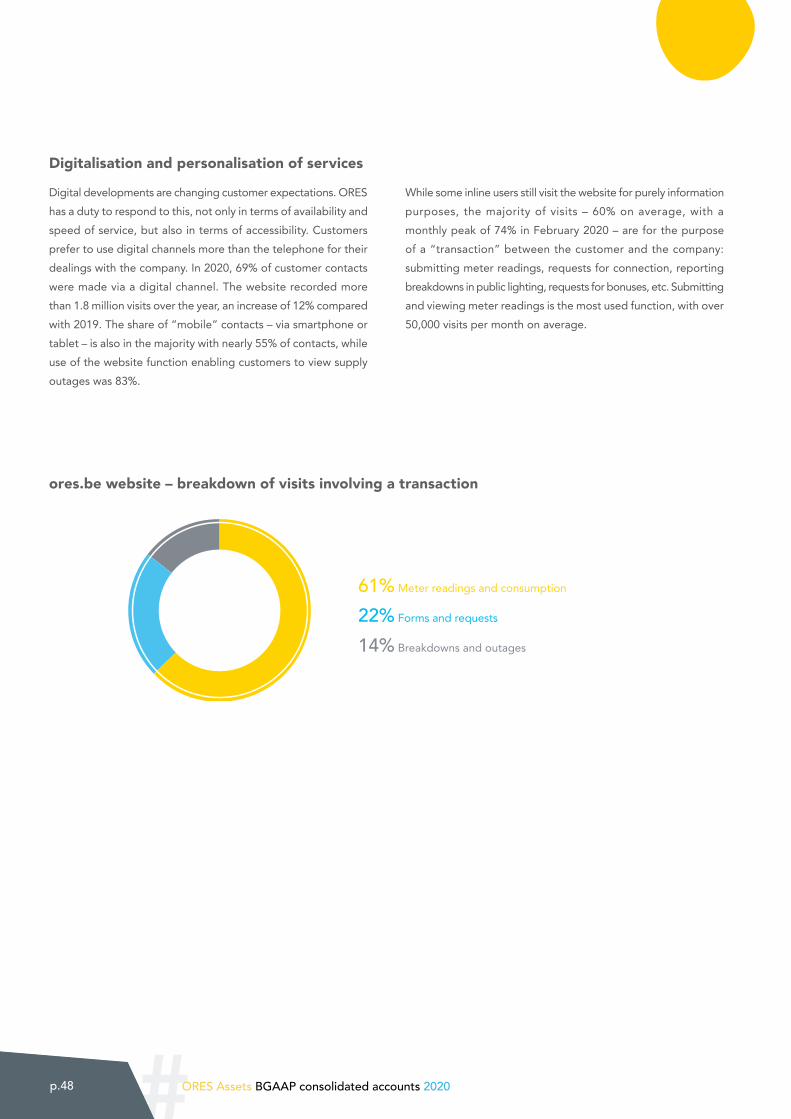
#p.48 ORES Assets BGAAP consolidated accounts 2020
Digitalisation and personalisation of services
Digital developments are changing customer expectations. ORES has a duty to respond to this, not only in terms of availability and speed of service, but also in terms of accessibility. Customers prefer to use digital channels more than the telephone for their dealings with the company. In 2020, 69% of customer contacts were made via a digital channel. The website recorded more than 1.8 million visits over the year, an increase of 12% compared with 2019. The share of “mobile” contacts – via smartphone or tablet – is also in the majority with nearly 55% of contacts, while use of the website function enabling customers to view supply outages was 83%.
While some inline users still visit the website for purely information purposes, the majority of visits – 60% on average, with a monthly peak of 74% in February 2020 – are for the purpose of a “transaction” between the customer and the company: submitting meter readings, requests for connection, reporting breakdowns in public lighting, requests for bonuses, etc. Submitting and viewing meter readings is the most used function, with over 50,000 visits per month on average.
ores.be website – breakdown of visits involving a transaction
61% Meter readings and consumption
22% Forms and requests
14% Breakdowns and outages

# p.49ORES Assets BGAAP consolidated accounts 2020
The digitalisation of customer interactions also generates an increased offering and the introduction of new functional features to the website. In 2020, special emphasis was placed on interactions in terms of incidents: breakdowns, outages, defective public lighting fixtures, etc. The sections of the website relating to these issues have been reviewed and enhanced. New services are being prepared for 2021. Also, in the context of the introduction of the prosumer tariff and bonuses by the Walloon Government in October, the website was modified to help guide customers
in their dealings. A significant increase in visits was recorded in November and December.
Social networks - both internal and external - are also an integral part of the company’s communication policy. Whether it is Facebook, Twitter or Instagram, these modes of interaction are increasingly popular with the public. Facebook remains the most successful channel.
The COVID-19 crisis once again increased the coverage and impact of digital communication, online and social networks. The Facebook page and specific pages on the website focusing on certain areas of information demonstrated their great usefulness in times of lockdown. In the spring of 2020, after the adoption by the Walloon Government of specific measures to assist customers
supplied by budget meters, visits to the pages dedicated to these customers broke all records. There were peaks of up to 20,000 visits a day, whereas the average number of visits to ores.be is more usually around 35,000 per week. Visits to the site are constantly increasing and have doubled in the space of four years.
“My consumption under the microscope”
In 2020, as part of the rollout of the first communicating digital meters on its territory, ORES contributed to the enhancement of “maconsosouslaloupe.be”, a collaborative website designed to help customers use their new meter. This free site, developed under the auspices of the Tweed cluster with ORES, RESA, Sibelga and the Volta federation as partners, gives users simple and practical access to a wide range of information about the products and services that can be installed via the meter’s “customer ports”. The website is aimed at both private individuals and installers, as well as at the developers of services and applications for managing energy consumption.
Facebook figures 2020
Number of subscribers to the ORES page
Average number of reactions to posts
Average reach of posts per day(online users)
Average number of private messages received each month
10,986 3,107
395137
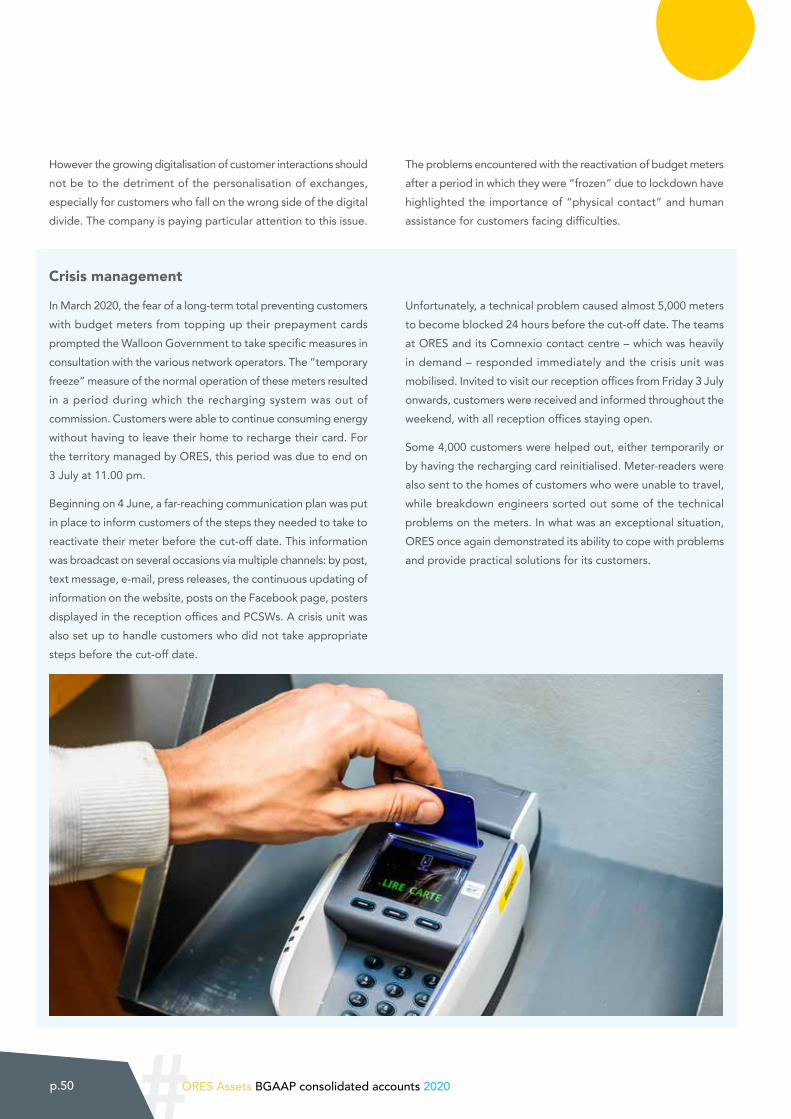
#p.50 ORES Assets BGAAP consolidated accounts 2020
Crisis management
In March 2020, the fear of a long-term total preventing customers with budget meters from topping up their prepayment cards prompted the Walloon Government to take specific measures in consultation with the various network operators. The “temporary freeze” measure of the normal operation of these meters resulted in a period during which the recharging system was out of commission. Customers were able to continue consuming energy without having to leave their home to recharge their card. For the territory managed by ORES, this period was due to end on 3 July at 11.00 pm.
Beginning on 4 June, a far-reaching communication plan was put in place to inform customers of the steps they needed to take to reactivate their meter before the cut-off date. This information was broadcast on several occasions via multiple channels: by post, text message, e-mail, press releases, the continuous updating of information on the website, posts on the Facebook page, posters displayed in the reception offices and PCSWs. A crisis unit was also set up to handle customers who did not take appropriate steps before the cut-off date.
Unfortunately, a technical problem caused almost 5,000 meters to become blocked 24 hours before the cut-off date. The teams at ORES and its Comnexio contact centre – which was heavily in demand – responded immediately and the crisis unit was mobilised. Invited to visit our reception offices from Friday 3 July onwards, customers were received and informed throughout the weekend, with all reception offices staying open.
Some 4,000 customers were helped out, either temporarily or by having the recharging card reinitialised. Meter-readers were also sent to the homes of customers who were unable to travel, while breakdown engineers sorted out some of the technical problems on the meters. In what was an exceptional situation, ORES once again demonstrated its ability to cope with problems and provide practical solutions for its customers.
However the growing digitalisation of customer interactions should not be to the detriment of the personalisation of exchanges, especially for customers who fall on the wrong side of the digital divide. The company is paying particular attention to this issue.
The problems encountered with the reactivation of budget meters after a period in which they were “frozen” due to lockdown have highlighted the importance of “physical contact” and human assistance for customers facing difficulties.
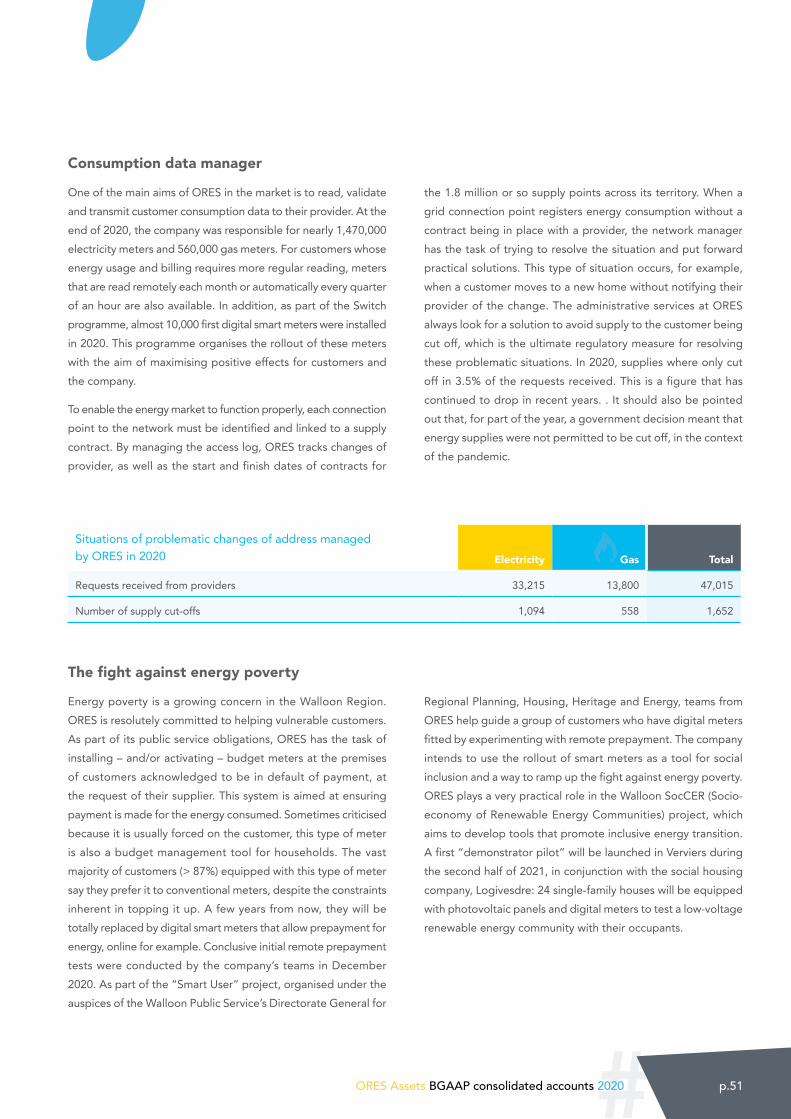
# p.51ORES Assets BGAAP consolidated accounts 2020
Consumption data manager
One of the main aims of ORES in the market is to read, validate and transmit customer consumption data to their provider. At the end of 2020, the company was responsible for nearly 1,470,000 electricity meters and 560,000 gas meters. For customers whose energy usage and billing requires more regular reading, meters that are read remotely each month or automatically every quarter of an hour are also available. In addition, as part of the Switch programme, almost 10,000 first digital smart meters were installed in 2020. This programme organises the rollout of these meters with the aim of maximising positive effects for customers and the company.
To enable the energy market to function properly, each connection point to the network must be identified and linked to a supply contract. By managing the access log, ORES tracks changes of provider, as well as the start and finish dates of contracts for
the 1.8 million or so supply points across its territory. When a grid connection point registers energy consumption without a contract being in place with a provider, the network manager has the task of trying to resolve the situation and put forward practical solutions. This type of situation occurs, for example, when a customer moves to a new home without notifying their provider of the change. The administrative services at ORES always look for a solution to avoid supply to the customer being cut off, which is the ultimate regulatory measure for resolving these problematic situations. In 2020, supplies where only cut off in 3.5% of the requests received. This is a figure that has continued to drop in recent years. . It should also be pointed out that, for part of the year, a government decision meant that energy supplies were not permitted to be cut off, in the context of the pandemic.
Situations of problematic changes of address managed by ORES in 2020 Electricity Gas Total
Requests received from providers 33,215 13,800 47,015
Number of supply cut-offs 1,094 558 1,652
The fight against energy poverty
Energy poverty is a growing concern in the Walloon Region. ORES is resolutely committed to helping vulnerable customers. As part of its public service obligations, ORES has the task of installing – and/or activating – budget meters at the premises of customers acknowledged to be in default of payment, at the request of their supplier. This system is aimed at ensuring payment is made for the energy consumed. Sometimes criticised because it is usually forced on the customer, this type of meter is also a budget management tool for households. The vast majority of customers (> 87%) equipped with this type of meter say they prefer it to conventional meters, despite the constraints inherent in topping it up. A few years from now, they will be totally replaced by digital smart meters that allow prepayment for energy, online for example. Conclusive initial remote prepayment tests were conducted by the company’s teams in December 2020. As part of the “Smart User” project, organised under the auspices of the Walloon Public Service’s Directorate General for
Regional Planning, Housing, Heritage and Energy, teams from ORES help guide a group of customers who have digital meters fitted by experimenting with remote prepayment. The company intends to use the rollout of smart meters as a tool for social inclusion and a way to ramp up the fight against energy poverty. ORES plays a very practical role in the Walloon SocCER (Socio-economy of Renewable Energy Communities) project, which aims to develop tools that promote inclusive energy transition. A first “demonstrator pilot” will be launched in Verviers during the second half of 2021, in conjunction with the social housing company, Logivesdre: 24 single-family houses will be equipped with photovoltaic panels and digital meters to test a low-voltage renewable energy community with their occupants.
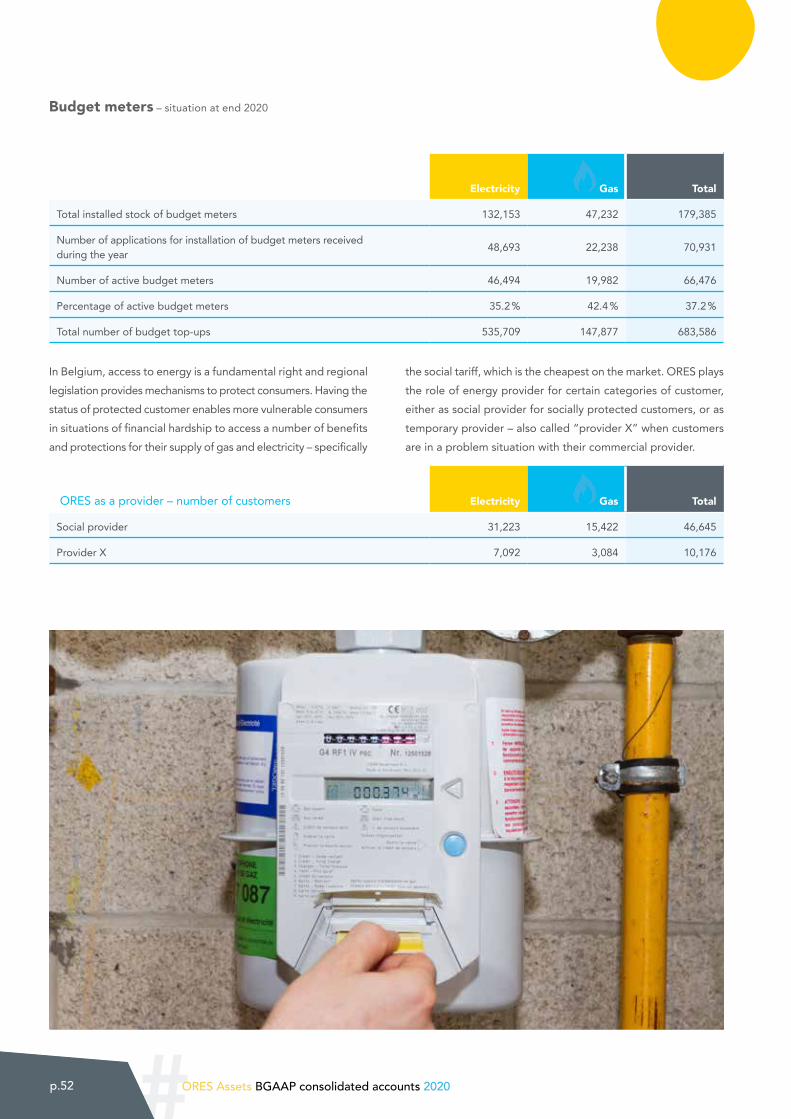
#p.52 ORES Assets BGAAP consolidated accounts 2020
Budget meters – situation at end 2020
Electricity Gas Total
Total installed stock of budget meters 132,153 47,232 179,385
Number of applications for installation of budget meters received during the year 48,693 22,238 70,931
Number of active budget meters 46,494 19,982 66,476
Percentage of active budget meters 35.2 % 42.4 % 37.2 %
Total number of budget top-ups 535,709 147,877 683,586
In Belgium, access to energy is a fundamental right and regional legislation provides mechanisms to protect consumers. Having the status of protected customer enables more vulnerable consumers in situations of financial hardship to access a number of benefits and protections for their supply of gas and electricity – specifically
the social tariff, which is the cheapest on the market. ORES plays the role of energy provider for certain categories of customer, either as social provider for socially protected customers, or as temporary provider – also called “provider X” when customers are in a problem situation with their commercial provider.
ORES as a provider – number of customers Electricity Gas Total
Social provider 31,223 15,422 46,645
Provider X 7,092 3,084 10,176

# p.53ORES Assets BGAAP consolidated accounts 2020
Protected customers are guided by ORES in their processes for accessing energy. 2020 saw their number grow significantly (+5.3%), in particular as a result of the effects of the pandemic and less directly following measures adopted in October 2020 by the Walloon Government (see box). These customers benefit from the social tariff, which is the lowest on the market, and they also have the possibility to call on “winter assistance” from 1 November to 15 March if they do not have the financial means to heat themselves during this period of the year.
ORES acts as a facilitator for these customers with Local Energy Committees (CLEs), in collaboration with the PCSWs and local authority social action councils. These CLEs come together to find specific and individual solutions for customers who are going through difficult times or who can no longer afford to pay for their energy consumption.
Number of cases examined by Local Energy Committees in 2020 Electricity Gas Total
Minimum supply cases 103 103
Cases relating to the loss of protected customer status 1,609 899 2,508
Cases concerning the granting of natural gas supply cards in the winter period 919 919
Support for households affected financially by the pandemic
On 10 October 2020, in the aim of assisting and protecting individuals particularly badly affected financially by the COVID-19 crisis, with limited income and struggling to pay their energy bills, the Walloon Government defined a new category of regional protected customer: cyclical protected customers.
Being granted this status enables the customer in question to benefit from the supply of electricity and/or gas at the social tariff for a period of one year. This provision is designed to temporarily relieve these customers from the burden of their energy bills. By mid-March 2021, some 380 customers had lodged an application for this status with ORES.
In addition, at the beginning of 2021, the Federal Government decided to grant a temporary right to the social tariff to all residential customers receiving increased benefits (“BIM” customers), from 1 February to 31 December inclusive. This tariff is applied automatically to recipients by the electricity providers, based on information provided by FPS Economy.
#p.54 ORES Assets BGAAP consolidated accounts 2020
The environment in which ORES carries out its tasks is constantly changing – and quickly: energy transition, technological developments, more sophisticated energy markets, digitalisation, changes in customer requirements and expectations, the demands of immediacy, growing energy poverty, the emergence of new ways of working, etc. Change is everywhere. And 2020 saw yet another change, totally unexpected, in the form of a health crisis with unprecedented consequences that put the resilience of the company’s teams to the test.
As part of its transformation process, ORES is banking on the expertise and professionalism of its staff. It is also relying on caring and reinforced leadership: each level of the hierarchy must reflect the values of the company’s corporate culture. Processes and organisation also need to be adjusted and simplified to enable ORES to be more efficient. This requires a whole new level of agility and the COVID-19 pandemic has underlined the essential character of how important this faculty of agility is for the company.
As part of its strategy and to put its vision of the future into effect, ORES aims to mobilise all of its staff, introduce new dynamics and roll out new tools. This is to enable the company to continue its basic tasks while transforming itself, maintaining safety and enhancing the wellbeing of its employees, who are its primary resource.
6. Corporate culture and wellbeing at work

# p.55ORES Assets BGAAP consolidated accounts 2020
As a result, ORES carefully monitors the maintenance and development of the talents of the people who work for the company, particularly through its training policy. In view of the nature of its business and the risks associated with it, ORES has for many years cultivated a dynamic of health and safety, which it intends to strengthen still further in the future. Finally, the company has every intention of providing an overall working environment that not only promotes efficiency, but also collaboration, trust and a good work-life balance in order to achieve “wellbeing”.
COVID-19 and safety
Management of the pandemic and its consequences occupied a good deal of 2020, requiring major involvement from many of the company’s departments. A COVID crisis unit was quickly put in place in March to define the company’s policy, as well as the procedures and recommendations to be implemented. Regularly faced with crisis situations in the management of its networks, for example following unexpected weather events, ORES was quickly able to organise itself, on the one hand to safeguard the safety of staff members and, on the other hand, to continue its public service tasks that are so important for the population. In doing so, the company benefited from the reliability of its networks of electricity and gas, as well as from the investments made in its
IT infrastructure, without which it would not have been possible to keep more than 1400 people in permanent “homeworking” on a day-to-day basis. But despite the uncertainties inherent to the situation, the company maintained its course. In terms of managing its network tasks, beyond the suspension of works in the spring, one of the principal difficulties encountered afterwards was the effect of the pandemic on the supply chain. Sometimes, the equipment required was not available in sufficient quantities for work to continue. Throughout 2020 and into the beginning of 2021, which is still affected by COVID-19, our main care is for the health and safety of our staff – and this takes precedence in all decision taken.
Given these unusual conditions, the review of ORES safety indicators in 2020 is a favourable one: the company recorded 20 accidents resulting in temporary incapacity for work (TIW) – two of which were directly related to activities on the gas and electricity networks – compared with 32 in the previous year. It is important to emphasise that 45% of these accidents occurred in the context of travelling and that this trend has continued at the beginning of 2021. An awareness campaign to staff is planned for 2021 to reduce the occurrence of this type of accident.
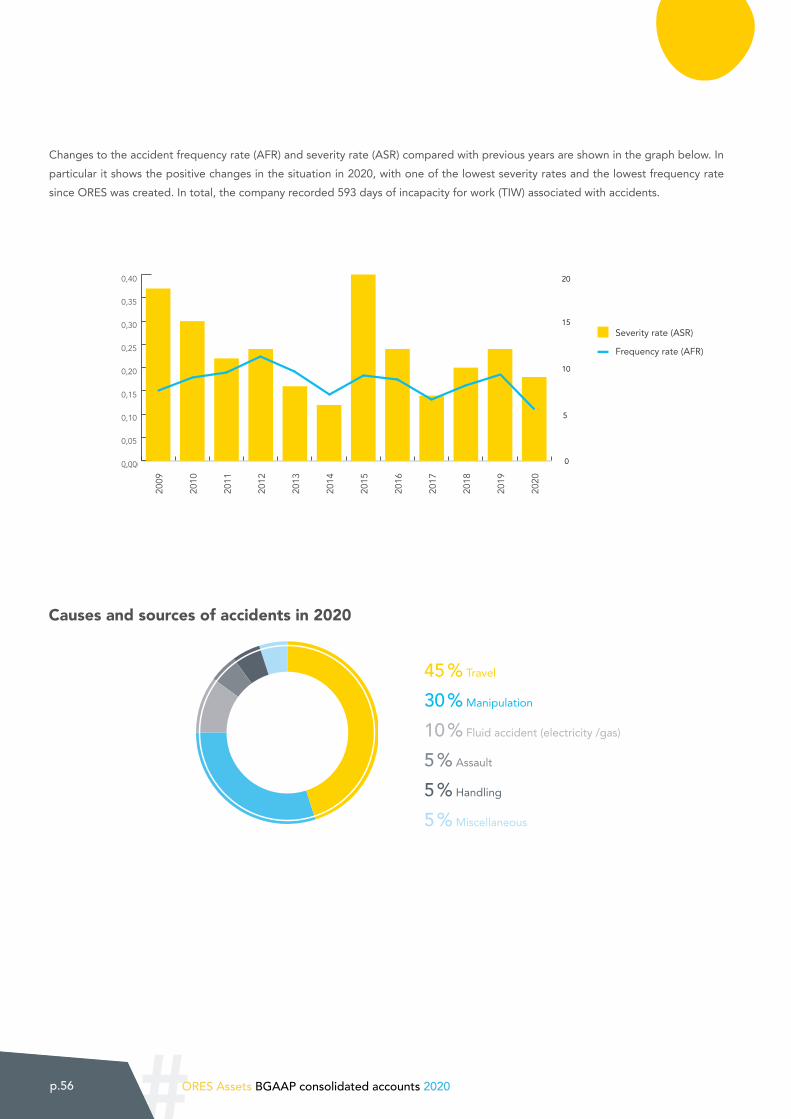
#p.56 ORES Assets BGAAP consolidated accounts 2020
Changes to the accident frequency rate (AFR) and severity rate (ASR) compared with previous years are shown in the graph below. In particular it shows the positive changes in the situation in 2020, with one of the lowest severity rates and the lowest frequency rate since ORES was created. In total, the company recorded 593 days of incapacity for work (TIW) associated with accidents.
Causes and sources of accidents in 2020
45 % Travel
30 % Manipulation
10 % Fluid accident (electricity /gas)
5 % Assault
5 % Handling
5 % Miscellaneous
2009
2010
2011
2012
2013
2014
2015
2016
2017
2018
2019
2020
Severity rate (ASR)
Frequency rate (AFR)
0.00
0.05
0.10
0.15
0.20
0.25
0.30
0.35
0.40
202020192018201720162015201420132012201120102009
0
5
10
15
200,40
0,35
0,30
0,25
0,20
0,15
0,10
0,05
0,00

# p.57ORES Assets BGAAP consolidated accounts 2020
During 2020, in consultation with all of the company departments, the internal Health & Safety Department developed the ORES General Safety Plan 2021-2025. This plan, which is both multidisciplinary and transversal in the projects it proposes, will become the backbone of the implementation of health and safety in the company for the next five years.
The aim is to firmly establish a culture of safety, wellbeing and the environment at ORES, with the aim of achieving “better-being” for its staff. The special feature of the plan is its ability to adapt to the needs of each department, service and employee so that everyone can go at their own pace. In addition, for 2021, the H&S department and the Executive Board have set a more ambitious and proactive safety target than in previous years: the aim is not to exceed 26 accidents, with a maximum of 712 days’ TIW, which corresponds to a frequency rate of 7.50 and a severity rate of 0.20.
Employment, recruitment and training
At the end of 2019, ORES had a total workforce of 2,369 active employees – 2,247 of whom were employed on open-ended contracts. Women represented 32% of the total workforce.
In the context of its transformation, ORES also continues to search for new talent. The pandemic slowed the pace of recruitment and in 2020, with 107 new employees joining the ranks of ORES,
whereas 137 left the company. Specific days for recruiting engineers – called “ORES TechniDays” – also saw their frequency slow down. However, thanks to the dedication and enthusiasm of the Recruitment department and colleagues at the company’s two training centres and the Health & Safety department, a number of TechniDays focusing on electricity or gas were finally held in compliance with health rules and ensuring safety for one and all. In total, 53 candidates were tested, with 21 of them signing an employment contract at the conclusion of the selection process.
To enable everyone to approach the change with confidence and find his or her place as part of the company of tomorrow, ORES places great faith in the training of its staff. 2020 was put to good use by the company’s Talent team to complete preparations for the implementation of the “Talentsoft” platform. This IT tool, which focuses in particular on the development of professional skills and knowledge, enables members of staff to control their own training pathway, in consultation with their line management. Digital training courses are also available to enable employees to be trained at their own pace and when it suits them best. 2020 was, of course, marked by health restrictions and the difficulties associated with organising “face-to-face” training, especially technical courses. This resulted in a sharp reduction of the average number of hours’ training per member of staff, which fell from 47.13 hours in 2019 to 14.85 in 2020.
Breakdown of staff by gender and age group
EmployeesSupervisory
staffManagerial
staffSenior manage-
ment staff Total
Male 48.32 % 10.85 % 8.23 % 0.25 % 68.00 %
Female 26.23 % 3.00 % 3.29 % 0.17 % 32.00 %
74.21 % 13.85 % 11.52 % 0.42 % 100 %
EmployeesSupervisory
staffManagerial
staffSenior manage-
ment staff Total
<30 year 10.72 % 0.00 % 0.80 % 0.00 % 11.52 %
>=30 <50 year 49.85 % 7.43 % 7.68 % 0.17 % 65.13 %
>=50 year 13.63 % 6.42 % 3.04 % 0.25 % 23.34 %
74.21 % 13.85 % 11.52 % 0.42 % 100 %
#p.58 ORES Assets BGAAP consolidated accounts 2020
Training by occupational category and gender (in hours)
Male Female Total
Senior management staff 3.35 21.41 12.38
Managerial staff 10.30 10.28 10.30
Supervisory staff 10.10 8.25 9.74
Employees 19.48 10.79 16.55
Average 16.77 10.56 14.85
Efficiency and managing recognition
At the end of 2019, after lengthy consultation with the organisations representing the workers, a collective labour agreement relative to improving pay conditions was reached for employed staff. The company has elected to modify the process of assessment and recognition and the old assessment system, called “PACT”, was discontinued on 1 January 2020. It has been replaced by the introduction of a salary scale based on 14 pay classes, together with the establishment of a process for managing development and recognition. This process, based along three main lines – collective and/or individual ambitions, ongoing feedback, maintenance of development – has now been formalised and digitalised. It is based on Talentsoft, the new training and development management platform, mentioned above. A “Managing Development and Recognition” training course that is freely available online enables employees to familiarise themselves with the various stages of the process.
Development of the culture and architectural approach
Wellbeing at work is an essential element in evolving a corporate culture that develops as it goes along. The pandemic, plus lockdown, mandatory working from home for over 70% of staff and complying with strict health rules, has caused considerable changes to be made to the implementation of initiatives planned as part of the process of developing the corporate culture.
Conceived and designed to be the catalyst and symbol of this cultural evolution, the company’s head office in Gosselies was initially intended to bring together 800 colleagues in a new working environment that was modern, sustainable and focused on collaboration. The pandemic changed all that and the process of the building’s new occupants being introduced to their new
premises was limited to a brief guided tour conducted on-site at the end of October 2020. Organised in small groups of tem or so people, in line with the hygiene rules, these tours went on for four days and enabled the company staff to acquaint themselves more fully with their future work setting.
Maintained despite the circumstances, this relocation to the new offices marked the culmination of a project whose beginnings date back to 2013. In addition to the project team, representatives from many of the company’s departments worked together on creating this building, its amenities and the way it is equipped. The building itself totally embodies the new way of working on which ORES has embarked, in its architecture, the way it is organised and the services it provides. A wonderfully professional business tool, symbol of a resolutely forward-looking company, the new offices are also a place for people to meet, making it ideal for transversality and creativity.
The desire demonstrated by ORES to offer the people who work for the company premises that are both pleasant and focused on operational efficiency does not just concern the head office in Gosselies or the sites at Leuze and Strépy-Bracquegnies, which also reflect the company’s corporate evolution. This desire also flows on into the province of Luxembourg, where the teams working in the areas of Marche-en-Famenne (2019), Recogne (2020) and Étalle (2021) now also occupy buildings that are larger and better suited to the business of network operator, as well as the logistics that go with it. Solutions are also being examined at Gedinne in the province of Namur and at Mouscron in Picardy Wallonia for the establishment of more functional premises, particularly with regard to the geographical areas in which the technical teams operate.
# p.59ORES Assets BGAAP consolidated accounts 2020#ORES Assets - BGAAP consolidated accounts 2020 p.59
7. Governance and transparencyThe rules of governance at ORES are detailed in the “Corporate Governance Charter” that was updated in June 2020, as well as by its “Charter of Ethics”. Taking the adoption of the 2018 General Data Protection Regulation a step further, in March 2020 the company also approved reports relating to its activities and the measures taken to protect the confidentiality of the information about which it gains knowledge.
Corporate governance encompasses a set of rules and behaviours based on the principles of transparency and accountability which, by establishing a proper balance between the spirit of the company and the way it is controlled, is designed to enable the company’s objectives to be set, along with the means to achieve them with regard to its values and missions.
The ORES Governance Charter, available from the company website, sets out the terms under which the company’s management bodies operate. It also establishes the principle for the remuneration of the members of these various bodies.
Pursuant to the Local Democracy and Decentralisation Code (CDLD) and the requirements of the Code of Companies and Associations (CS&A), this annual report describes the missions of these bodies, as well as the remuneration of their members in the section headed “Remuneration reports” (page 142).
A single manager with strong local roots
When the company was created in 2009, ORES was the technical operated appointed by eight intermunicipal distribution systems operators (DSOs) – IDEG, IEH, IGH, Interest, Interlux, Intermosane, Sedilec and Simogel – to operate their infrastructures.
As part of an initial governance reform, these eight intermunicipal companies merged at the end of 2013 to create a single DSO for all of their territories. This was how ORES Assets came into being, with the status of a cooperative intermunicipal company with limited liability. To continue ensuring representation of the local interests of each entity, the merger of the intermunicipal companies was accompanied by the creation of eight sector committees within the new structure. These committees were responsible for approving network investment and adaptation plans for their geographical area, as well as the proposed tariffs that concerned them.
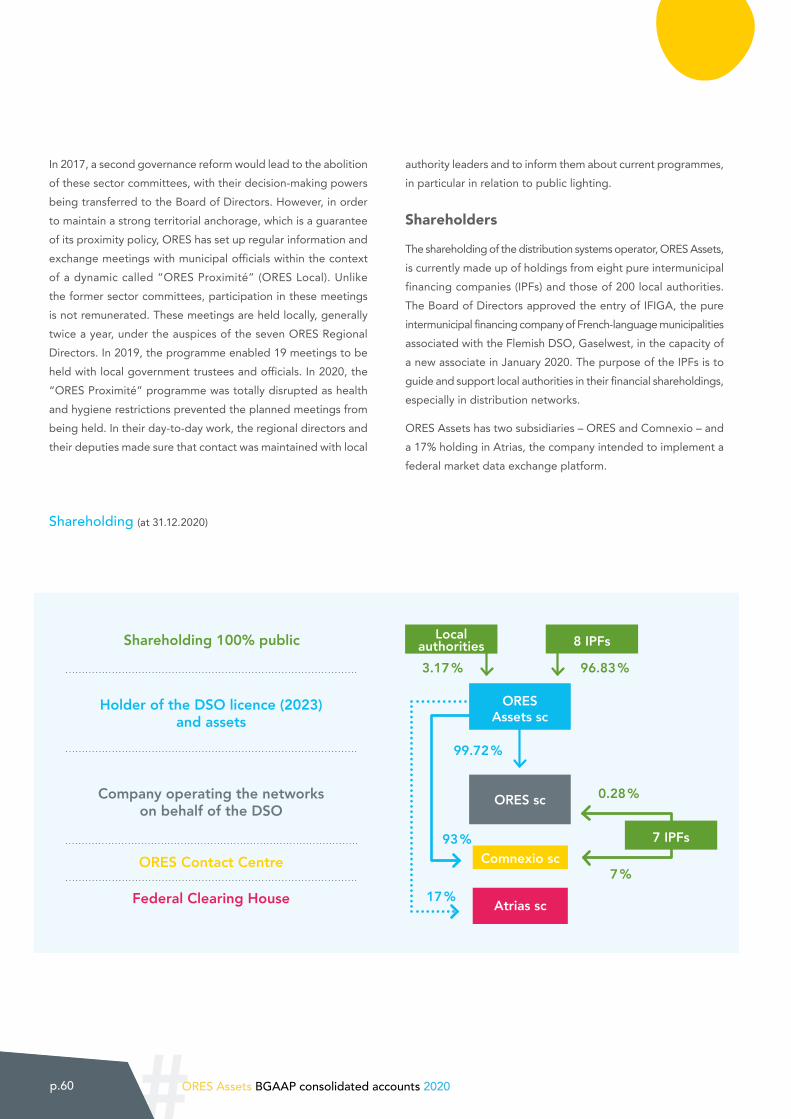
#p.60 ORES Assets BGAAP consolidated accounts 2020
In 2017, a second governance reform would lead to the abolition of these sector committees, with their decision-making powers being transferred to the Board of Directors. However, in order to maintain a strong territorial anchorage, which is a guarantee of its proximity policy, ORES has set up regular information and exchange meetings with municipal officials within the context of a dynamic called “ORES Proximité” (ORES Local). Unlike the former sector committees, participation in these meetings is not remunerated. These meetings are held locally, generally twice a year, under the auspices of the seven ORES Regional Directors. In 2019, the programme enabled 19 meetings to be held with local government trustees and officials. In 2020, the “ORES Proximité” programme was totally disrupted as health and hygiene restrictions prevented the planned meetings from being held. In their day-to-day work, the regional directors and their deputies made sure that contact was maintained with local
authority leaders and to inform them about current programmes, in particular in relation to public lighting.
Shareholders
The shareholding of the distribution systems operator, ORES Assets, is currently made up of holdings from eight pure intermunicipal financing companies (IPFs) and those of 200 local authorities. The Board of Directors approved the entry of IFIGA, the pure intermunicipal financing company of French-language municipalities associated with the Flemish DSO, Gaselwest, in the capacity of a new associate in January 2020. The purpose of the IPFs is to guide and support local authorities in their financial shareholdings, especially in distribution networks.
ORES Assets has two subsidiaries – ORES and Comnexio – and a 17% holding in Atrias, the company intended to implement a federal market data exchange platform.
Shareholding (at 31.12.2020)
Comnexio scORES Contact Centre
Holder of the DSO licence (2023) and assets
Shareholding 100% public
Company operating the networks on behalf of the DSO
Federal Clearing House
ORES sc
Atrias sc
ORESAssets sc
Local authorities 8 IPFs
99.72 %
93 %
17 %
96.83 %3.17 %
0.28 %
7 %
7 IPFs
# p.61ORES Assets BGAAP consolidated accounts 2020
Business strategy and follow-up
In 2020, ORES decided to re-examine its mission, vision and strategy, agreed for the previous few years. There were a number of reasons behind this process: to verify the appropriateness of the strategic plan with the expectations of the company’s stakeholders; to set new targets to be achieve before the end of the tariff period, in accordance with the resources allocated by CWaPE, via the distribution tariffs 2019-2023 (see below), and, finally, to look beyond 2023 to anticipate the major trends to be incorporated in the company’s strategic vision and to prepare the forthcoming tariff period 2024-2028.
This exercise was significantly disrupted by the pandemic and was conducted in a totally unusual manner, mainly via “virtual” discussions – and against a background of crisis management that required much input. Nevertheless, it managed to produce major results thanks to the involvement of the Board of Directors, the Executive Board and numerous senior managers in the company. The relevance of the strategic adopted for the past several years was confirmed, while incorporating new dimensions and ambitions, particularly in terms of corporate vision. This new roadmap was presented at the end of the year and is available on the company website. In particular, it identifies the financial resources for enabling its implementation.
To be able to assess the application of this plan, the Board of Directors receives a document each quarter tracking the main strategic indicators, as well as various reports each year relating to the economic situation, activities and the risks facing the company.
It should also be emphasised that regular training courses are organised for the members of the Board of Directors. These courses are designed to maintain and develop the directors’ level of knowledge about the issues facing the company and to ensure that their skills are updated within the exercise of their position. In 2020, two training seminars had been planned on topics related to energy transition and the sustainability of the company’s activities: renewable energy, local production, the role of ORES, the effects of tariffs, equalisation, etc. The two seminars, which were to have been held on 19 and 20 March and on 22 and 23 October respectively, had to be cancelled due to the lockdown measures taken by the National Safety Committee, meeting on 12 March 2020 and then due to the worsening of the health situation and the tightening of preventative measures in October.
Internal governance
In the context of its activities and their management, ORES has established mechanisms that make up its management system – in other words, its internal governance.
The objectives of these mechanisms include the following:
• to demonstrate the ability to provide services that meet stakeholder expectations and the applicable legal and regulatory requirements on an ongoing basis;
• to increase customer satisfaction through continuous improvement.
This management system complies with the ISO 9001 standard and is based on the IPMS (Integrated Performance Management System) standard in order to integrate quality assurance.
The key principle of operational governance at ORES is accountability: decisions are made at the most appropriate level within a given mandate. This principle is entirely complementary with the delegation of day-to-day and operational management given by the Board of Directors to the Executive Board, and with the principle of management based on trust that ORES implements internally, in its corporate culture – see the section on “Work culture and well-being within the organisation”.
The general principles of governance and risk management, applicable to all of the company’s activities, are described in a directive for internal use and available to members of staff.
The in-depth analysis work commenced on the business model in 2019 continued in 2020. This process is designed to arrive at a new model. The aim is to tend towards greater simplicity, more efficiency and greater accountability, with stronger involvement from all managers.
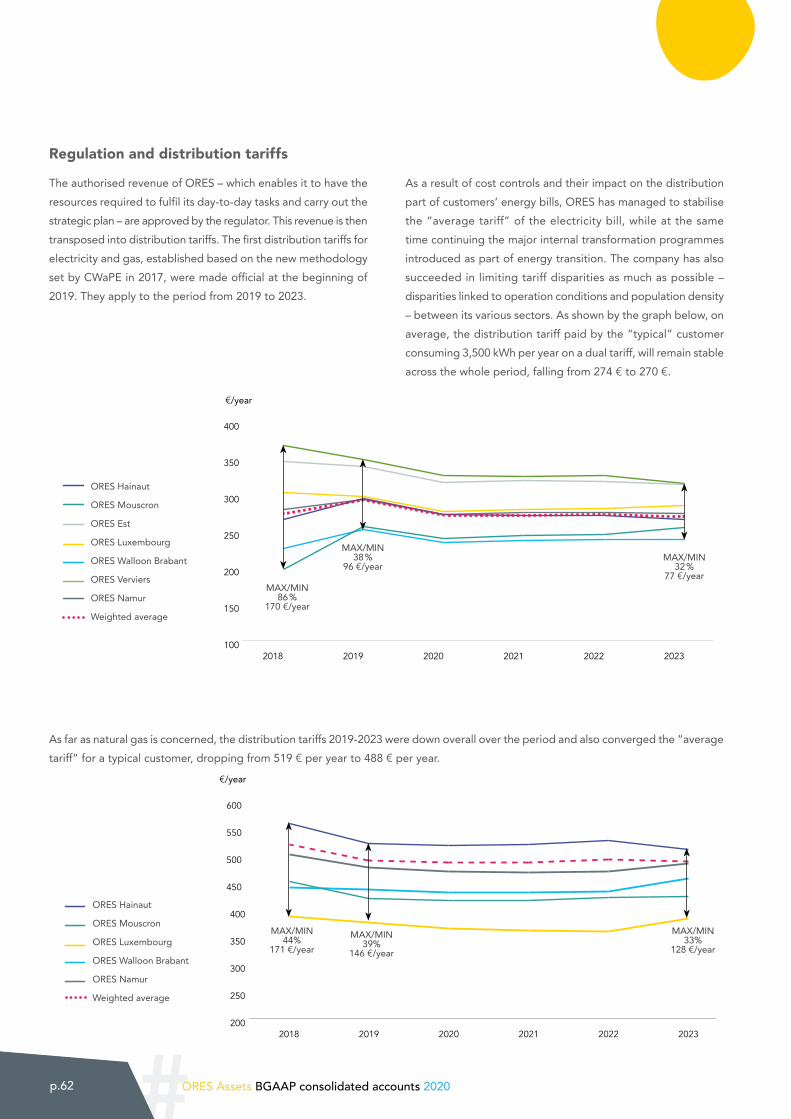
#p.62 ORES Assets BGAAP consolidated accounts 2020
Regulation and distribution tariffs
The authorised revenue of ORES – which enables it to have the resources required to fulfil its day-to-day tasks and carry out the strategic plan – are approved by the regulator. This revenue is then transposed into distribution tariffs. The first distribution tariffs for electricity and gas, established based on the new methodology set by CWaPE in 2017, were made official at the beginning of 2019. They apply to the period from 2019 to 2023.
As a result of cost controls and their impact on the distribution part of customers’ energy bills, ORES has managed to stabilise the “average tariff” of the electricity bill, while at the same time continuing the major internal transformation programmes introduced as part of energy transition. The company has also succeeded in limiting tariff disparities as much as possible – disparities linked to operation conditions and population density – between its various sectors. As shown by the graph below, on average, the distribution tariff paid by the “typical” customer consuming 3,500 kWh per year on a dual tariff, will remain stable across the whole period, falling from 274 € to 270 €.
As far as natural gas is concerned, the distribution tariffs 2019-2023 were down overall over the period and also converged the “average tariff” for a typical customer, dropping from 519 € per year to 488 € per year.
100
150
200
250
300
350
400 Moyenne pondérée
Namur
Verviers
BW
Luxembourg
Est
Mouscron
Hainaut202320222021202020192018
MAX/MIN86 %
170 €/year
€/year
MAX/MIN38 %
96 €/yearMAX/MIN
32 % 77 €/year
ORES Hainaut
ORES Mouscron
ORES Est
ORES Luxembourg
ORES Walloon Brabant
ORES Verviers
ORES Namur
Weighted average
ORES Hainaut
ORES Mouscron
ORES Luxembourg
ORES Walloon Brabant
ORES Namur
Weighted average
200
250
300
350
400
450
500
550
600 Moyenne pondérée
Namur
BW
Luxembourg
Mouscron
Hainaut
202320222021202020192018
MAX/MIN44%
171 €/year
€/year
MAX/MIN39%
146 €/year
MAX/MIN33%
128 €/year
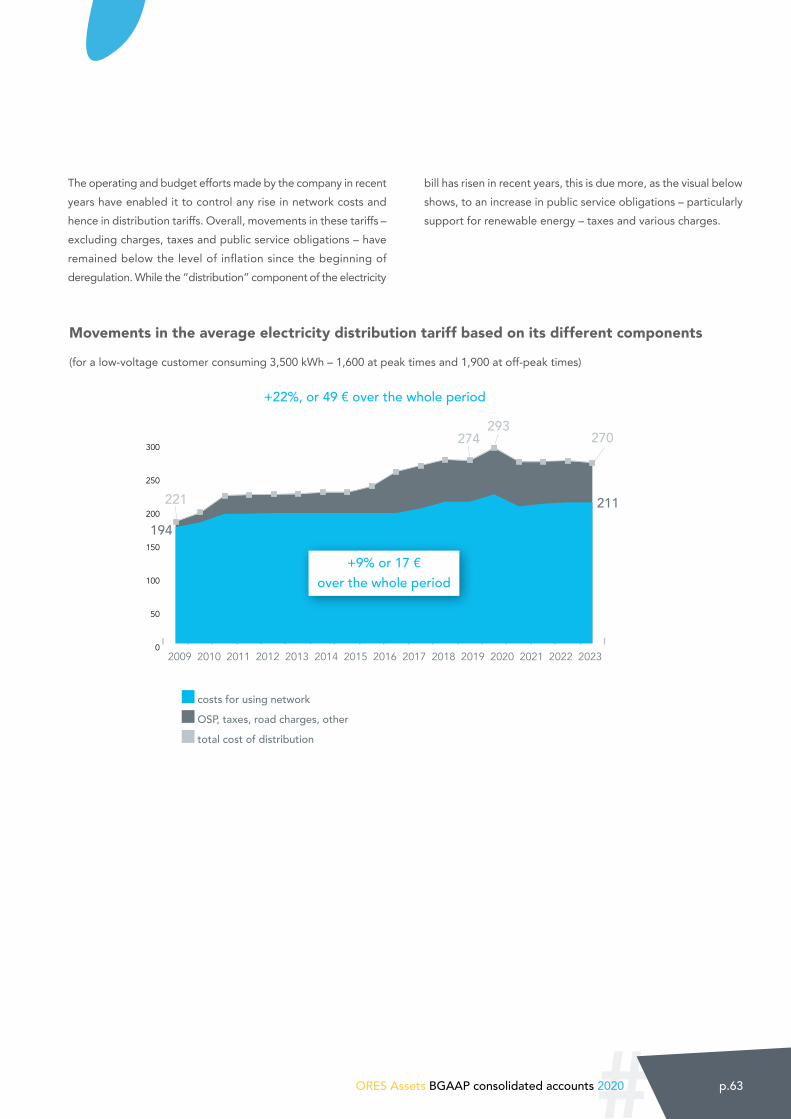
# p.63ORES Assets BGAAP consolidated accounts 2020
The operating and budget efforts made by the company in recent years have enabled it to control any rise in network costs and hence in distribution tariffs. Overall, movements in these tariffs – excluding charges, taxes and public service obligations – have remained below the level of inflation since the beginning of deregulation. While the “distribution” component of the electricity
bill has risen in recent years, this is due more, as the visual below shows, to an increase in public service obligations – particularly support for renewable energy – taxes and various charges.
Movements in the average electricity distribution tariff based on its different components
(for a low-voltage customer consuming 3,500 kWh – 1,600 at peak times and 1,900 at off-peak times)
2009 2010 2011 2012 2013 2014 2015 2016 2017 2018 2019 2020 2021 2022 2023
270293
274
221
0
50
100
150
200
250
300
194
211
+9% or 17 € over the whole period
+22%, or 49 € over the whole period
costs for using network
OSP, taxes, road charges, other
total cost of distribution
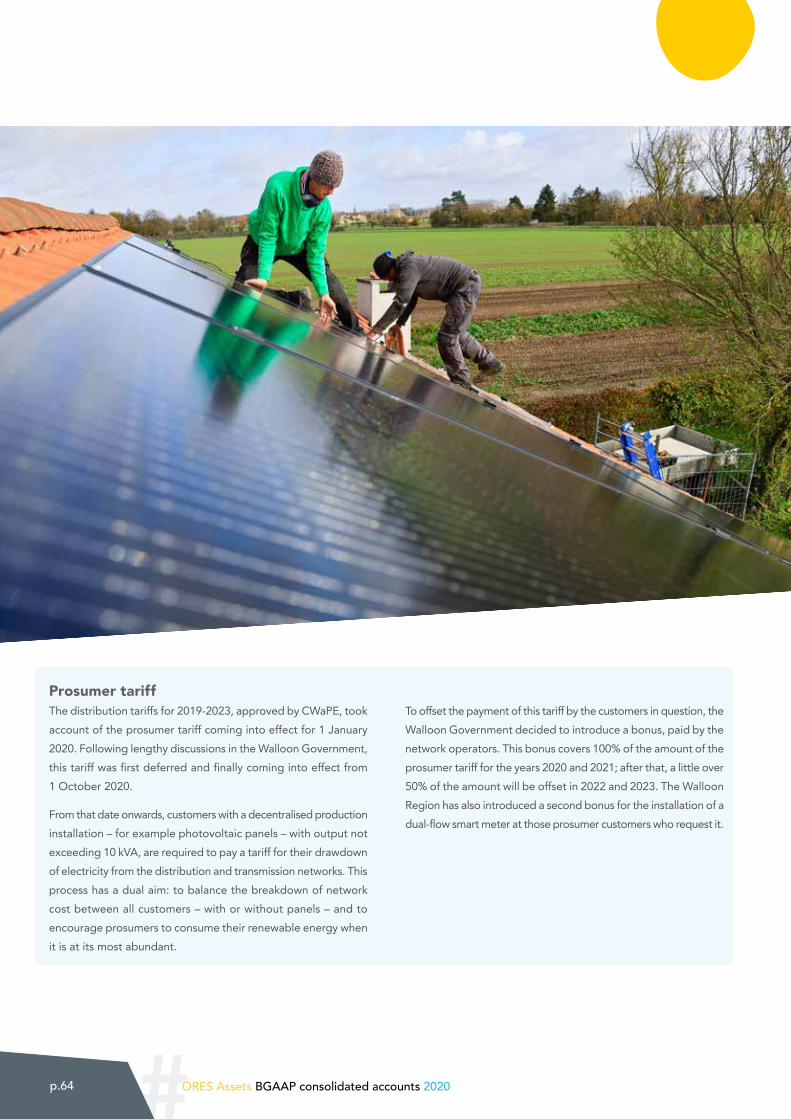
#p.64 ORES Assets BGAAP consolidated accounts 2020
Prosumer tariffThe distribution tariffs for 2019-2023, approved by CWaPE, took account of the prosumer tariff coming into effect for 1 January 2020. Following lengthy discussions in the Walloon Government, this tariff was first deferred and finally coming into effect from 1 October 2020.
From that date onwards, customers with a decentralised production installation – for example photovoltaic panels – with output not exceeding 10 kVA, are required to pay a tariff for their drawdown of electricity from the distribution and transmission networks. This process has a dual aim: to balance the breakdown of network cost between all customers – with or without panels – and to encourage prosumers to consume their renewable energy when it is at its most abundant.
To offset the payment of this tariff by the customers in question, the Walloon Government decided to introduce a bonus, paid by the network operators. This bonus covers 100% of the amount of the prosumer tariff for the years 2020 and 2021; after that, a little over 50% of the amount will be offset in 2022 and 2023. The Walloon Region has also introduced a second bonus for the installation of a dual-flow smart meter at those prosumer customers who request it.

# p.65ORES Assets BGAAP consolidated accounts 2020
8. Ethics and fair practicesIn terms of corporate social responsibility, ORES implements the resources needed to ensure fair practices in its relations at every level, as well as the sustainability and conformity of the products that it uses. As a leading economic player in the Walloon Region, the company generates business and jobs for numerous external suppliers, the vast majority of them local.
The company aims to set an example in all its practices. The way in which it conducts its relations and transactions with its stakeholders relies on strong ethics and specific measures designed in particular to prevent any corruption. ORES is progressively putting a sustainable and responsible purchasing policy in place, with the emphasis on compliance by its suppliers and subcontractors of the laws in effect regarding human rights, social dumping, corruption, health and safety and the environment, as well as compliance with the legislation on personal data in particular.
Setting the example internally
The company’s ethics are based on five values: professionalism, a sense of accountability, a sense of service, daring and the “respect and conviviality” value to which should also be added the spirit of impartiality, non-discrimination and independence
vis-à-vis other providers in the marketplace, in addition to ORES’s role as distribution systems manager and the fact that it holds a monopoly.
Each and every member of staff undertakes to abide by the basic rules formalised in an internal charter of ethics. These rules cover the use of the company’s property and resources, the instructions to follow in the event of attempted corruption or conflict of interest, the protection of information and data – and in particular information deemed to be privileged, etc.
Internal audit processes are also implemented for orders of equipment that is out of stock: the dual approval of requests by line management, calls for tenders from various suppliers, the definition of signatory powers, monitoring purchase orders, etc.
#p.66 ORES Assets BGAAP consolidated accounts 2020
Relations with stakeholders
In the same way, ORES requires its suppliers, contractors and service providers to comply with a code of ethics. The areas covered in the code of ethics document are very much identical to the internal charter of ethics.
The company applies the regulations governing public tendering processes in line with the thresholds set by the legislation. The three main categories of tender relate to works, services and supplies. The total volume of turnover represented by the contracts awarded in 2020 by the company was close to 170 million euros. All parties submitting tenders – both Belgian and international – are required to respect various clauses aimed at stemming the flow of social dumping: checks of the company’s criminal record, confirmation and verification that social security contributions and tax obligations have been complied with in full.
Contracts that are the most liable to fraud, especially those associated with on-site works, are regulated by special provisions. Successful tenderers are required to comply with the obligations designed to ensure that both works and workers are properly registered, as well as issues such as their pay, the reporting
of seconded personnel, sufficient knowledge on the part of subcontracted workers of the local language, decent and convenient accommodation for workers who are unable to return to their homes on a daily basis, etc. Deterrent, one-off or daily penalties are set out in the specifications, based on any violations recorded.
Limiting subcontracting to one or two levels, depending on the contract, also aims to strengthen the measures put in place by legislation to combat social dumping. The tenderer must ensure that the “tender form” documents are completed with respect to subcontractors, regardless of the extent to which they are involved and regardless of their place in the subcontracting chain.
Finally, co-contractors are required to respect the five basic standards of the International Labour Organisation: freedom of association and effective recognition of the right to collective bargaining, elimination of forced or compulsory labour, effective abolition of child labour, improvement in working conditions, elimination of discrimination in terms of employment and occupation.
Monitoring and assessing contractors
To ensure cost control, compliance with regulations and quality of the work it subcontracts to its service providers, ORES has set up a unit that continually monitors and assesses this work, in particular through site visits. Points of attention include: administrative thoroughness, flexibility and responsiveness, quality of work, organisation and, most importantly, safety. ORES’s customers are also consulted in order to assess the quality of the external service providers responsible for the work that concerns them.
Sustainable purchasing policy
For supply contracts, ORES encourages reference to “eco-labels” and “eco-responsible” products or equivalent. In practical terms, when it supplies itself with services or materials, the company bases its actions on specific regulations in terms of health, safety and environmental protection. This regulation specifies the safety requirements and stipulates the supplier’s obligation to comply with environmental regulations on waste management, as well as the obligation to provide information about any incident that
may have an impact on the environment and the obligation to take appropriate measures to limit damage in the event of an incident, etc.
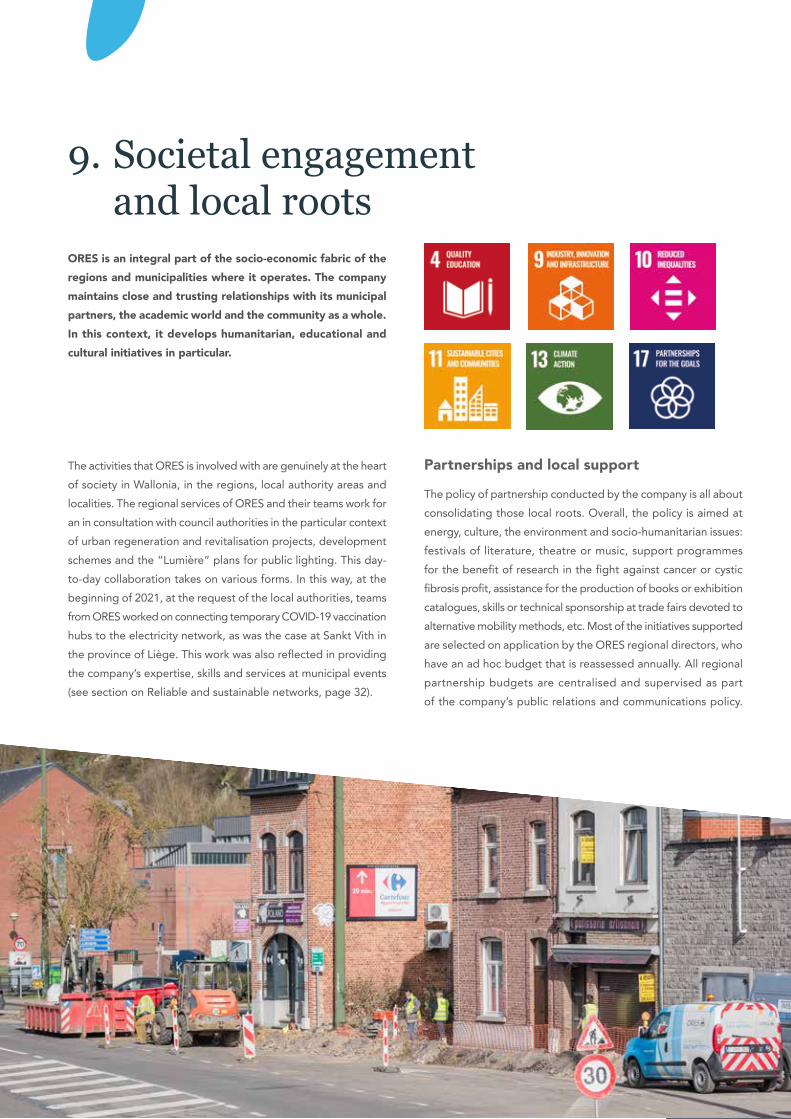
# p.67ORES Assets BGAAP consolidated accounts 2020
9. Societal engagement and local roots
ORES is an integral part of the socio-economic fabric of the regions and municipalities where it operates. The company maintains close and trusting relationships with its municipal partners, the academic world and the community as a whole. In this context, it develops humanitarian, educational and cultural initiatives in particular.
The activities that ORES is involved with are genuinely at the heart of society in Wallonia, in the regions, local authority areas and localities. The regional services of ORES and their teams work for an in consultation with council authorities in the particular context of urban regeneration and revitalisation projects, development schemes and the “Lumière” plans for public lighting. This day-to-day collaboration takes on various forms. In this way, at the beginning of 2021, at the request of the local authorities, teams from ORES worked on connecting temporary COVID-19 vaccination hubs to the electricity network, as was the case at Sankt Vith in the province of Liège. This work was also reflected in providing the company’s expertise, skills and services at municipal events (see section on Reliable and sustainable networks, page 32).
Partnerships and local support
The policy of partnership conducted by the company is all about consolidating those local roots. Overall, the policy is aimed at energy, culture, the environment and socio-humanitarian issues: festivals of literature, theatre or music, support programmes for the benefit of research in the fight against cancer or cystic fibrosis profit, assistance for the production of books or exhibition catalogues, skills or technical sponsorship at trade fairs devoted to alternative mobility methods, etc. Most of the initiatives supported are selected on application by the ORES regional directors, who have an ad hoc budget that is reassessed annually. All regional partnership budgets are centralised and supervised as part of the company’s public relations and communications policy.
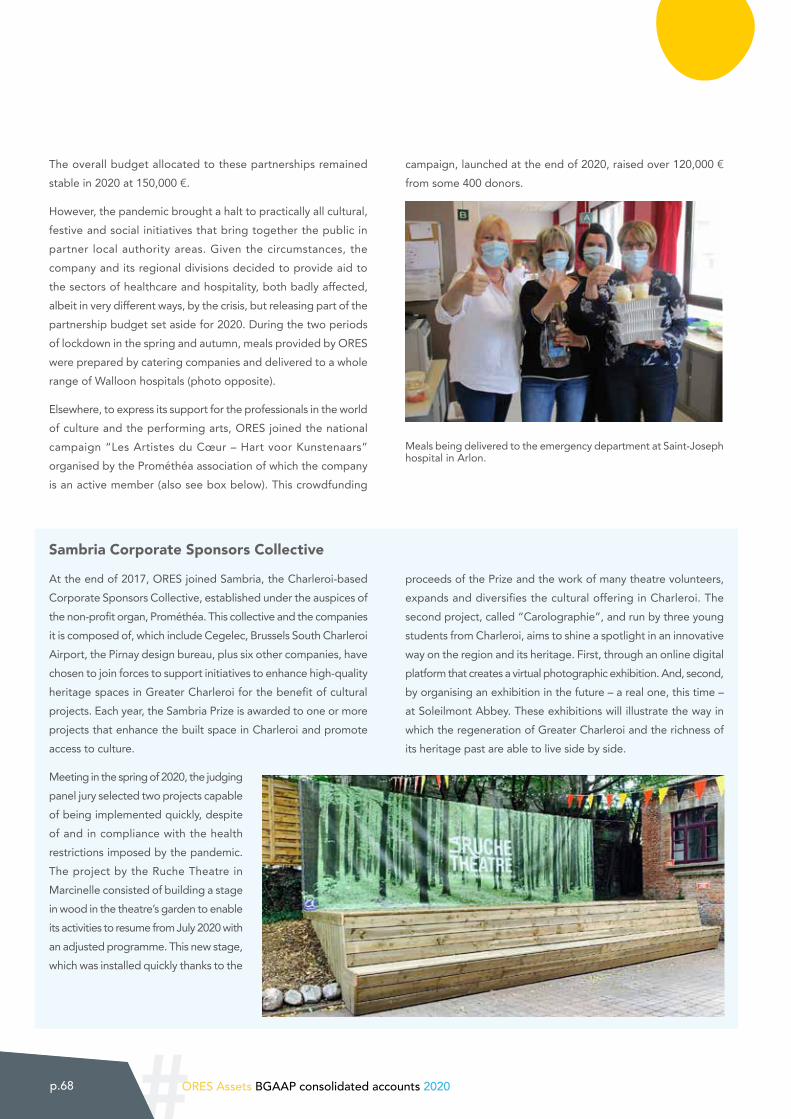
#p.68 ORES Assets BGAAP consolidated accounts 2020
The overall budget allocated to these partnerships remained stable in 2020 at 150,000 €.
However, the pandemic brought a halt to practically all cultural, festive and social initiatives that bring together the public in partner local authority areas. Given the circumstances, the company and its regional divisions decided to provide aid to the sectors of healthcare and hospitality, both badly affected, albeit in very different ways, by the crisis, but releasing part of the partnership budget set aside for 2020. During the two periods of lockdown in the spring and autumn, meals provided by ORES were prepared by catering companies and delivered to a whole range of Walloon hospitals (photo opposite).
Elsewhere, to express its support for the professionals in the world of culture and the performing arts, ORES joined the national campaign “Les Artistes du Cœur – Hart voor Kunstenaars” organised by the Prométhéa association of which the company is an active member (also see box below). This crowdfunding
campaign, launched at the end of 2020, raised over 120,000 € from some 400 donors.
Meals being delivered to the emergency department at Saint-Joseph hospital in Arlon.
Sambria Corporate Sponsors Collective
At the end of 2017, ORES joined Sambria, the Charleroi-based Corporate Sponsors Collective, established under the auspices of the non-profit organ, Prométhéa. This collective and the companies it is composed of, which include Cegelec, Brussels South Charleroi Airport, the Pirnay design bureau, plus six other companies, have chosen to join forces to support initiatives to enhance high-quality heritage spaces in Greater Charleroi for the benefit of cultural projects. Each year, the Sambria Prize is awarded to one or more projects that enhance the built space in Charleroi and promote access to culture.
Meeting in the spring of 2020, the judging panel jury selected two projects capable of being implemented quickly, despite of and in compliance with the health restrictions imposed by the pandemic. The project by the Ruche Theatre in Marcinelle consisted of building a stage in wood in the theatre’s garden to enable its activities to resume from July 2020 with an adjusted programme. This new stage, which was installed quickly thanks to the
proceeds of the Prize and the work of many theatre volunteers, expands and diversifies the cultural offering in Charleroi. The second project, called “Carolographie”, and run by three young students from Charleroi, aims to shine a spotlight in an innovative way on the region and its heritage. First, through an online digital platform that creates a virtual photographic exhibition. And, second, by organising an exhibition in the future – a real one, this time – at Soleilmont Abbey. These exhibitions will illustrate the way in which the regeneration of Greater Charleroi and the richness of its heritage past are able to live side by side.
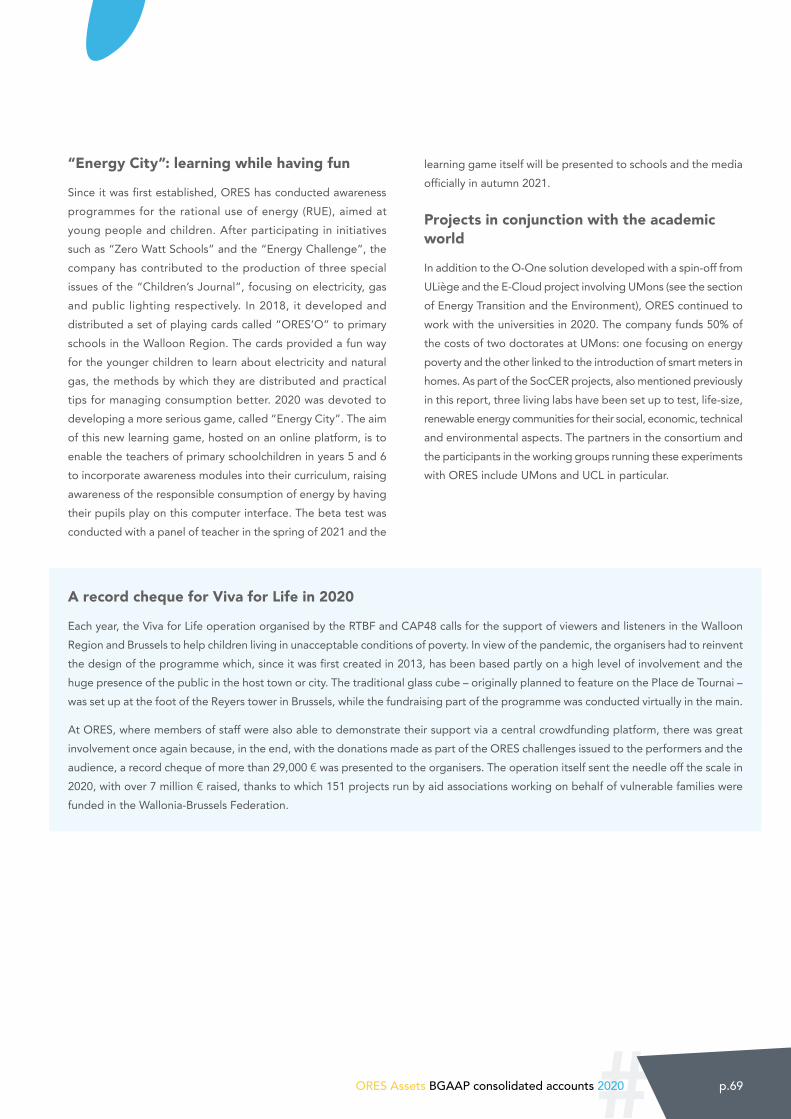
# p.69ORES Assets BGAAP consolidated accounts 2020
“Energy City”: learning while having fun
Since it was first established, ORES has conducted awareness programmes for the rational use of energy (RUE), aimed at young people and children. After participating in initiatives such as “Zero Watt Schools” and the “Energy Challenge”, the company has contributed to the production of three special issues of the “Children’s Journal”, focusing on electricity, gas and public lighting respectively. In 2018, it developed and distributed a set of playing cards called “ORES’O” to primary schools in the Walloon Region. The cards provided a fun way for the younger children to learn about electricity and natural gas, the methods by which they are distributed and practical tips for managing consumption better. 2020 was devoted to developing a more serious game, called “Energy City”. The aim of this new learning game, hosted on an online platform, is to enable the teachers of primary schoolchildren in years 5 and 6 to incorporate awareness modules into their curriculum, raising awareness of the responsible consumption of energy by having their pupils play on this computer interface. The beta test was conducted with a panel of teacher in the spring of 2021 and the
learning game itself will be presented to schools and the media officially in autumn 2021.
Projects in conjunction with the academic world
In addition to the O-One solution developed with a spin-off from ULiège and the E-Cloud project involving UMons (see the section of Energy Transition and the Environment), ORES continued to work with the universities in 2020. The company funds 50% of the costs of two doctorates at UMons: one focusing on energy poverty and the other linked to the introduction of smart meters in homes. As part of the SocCER projects, also mentioned previously in this report, three living labs have been set up to test, life-size, renewable energy communities for their social, economic, technical and environmental aspects. The partners in the consortium and the participants in the working groups running these experiments with ORES include UMons and UCL in particular.
A record cheque for Viva for Life in 2020
Each year, the Viva for Life operation organised by the RTBF and CAP48 calls for the support of viewers and listeners in the Walloon Region and Brussels to help children living in unacceptable conditions of poverty. In view of the pandemic, the organisers had to reinvent the design of the programme which, since it was first created in 2013, has been based partly on a high level of involvement and the huge presence of the public in the host town or city. The traditional glass cube – originally planned to feature on the Place de Tournai – was set up at the foot of the Reyers tower in Brussels, while the fundraising part of the programme was conducted virtually in the main.
At ORES, where members of staff were also able to demonstrate their support via a central crowdfunding platform, there was great involvement once again because, in the end, with the donations made as part of the ORES challenges issued to the performers and the audience, a record cheque of more than 29,000 € was presented to the organisers. The operation itself sent the needle off the scale in 2020, with over 7 million € raised, thanks to which 151 projects run by aid associations working on behalf of vulnerable families were funded in the Wallonia-Brussels Federation.
III MANAGEMENT REPORT
#ORES Assets BGAAP consolidated accounts 2020 p.71
1. Notestotheannualfinancialstatements 72
2. Annualfinancialstatements 85
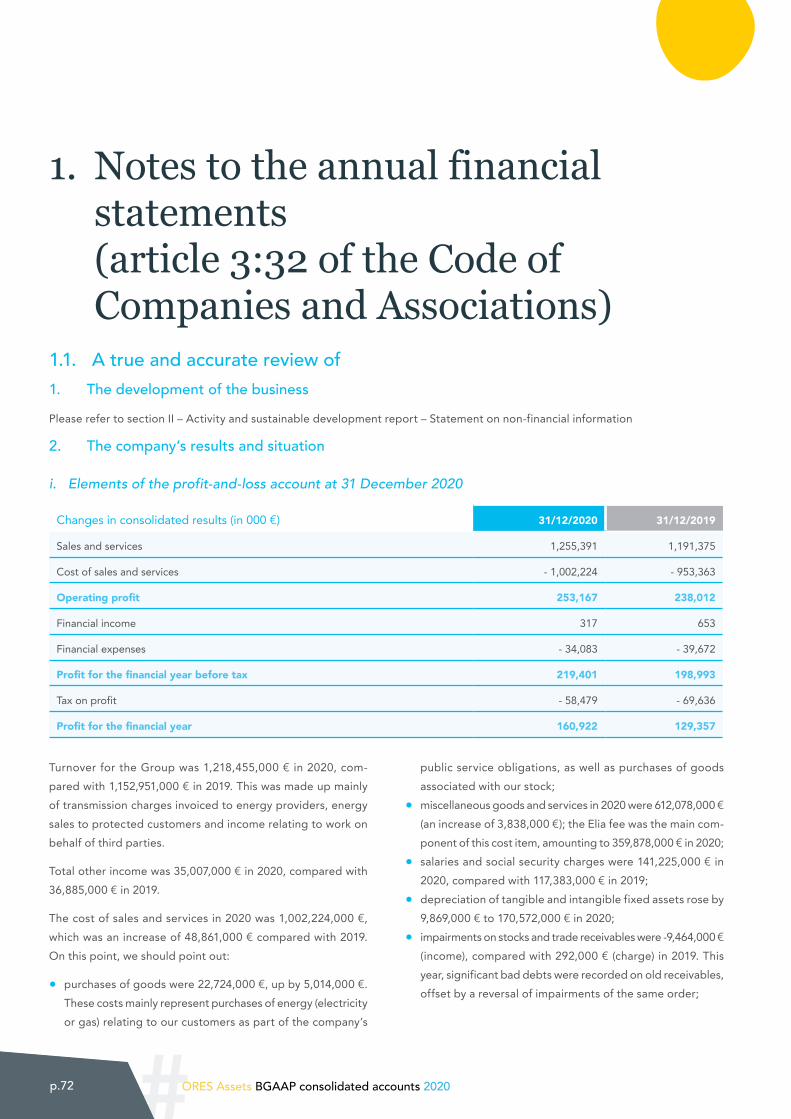
#p.72 ORES Assets BGAAP consolidated accounts 2020
1. Notes to the annual financial statements (article 3:32 of the Code of Companies and Associations)
1.1. A true and accurate review of 1. The development of the business
Please refer to section II – Activity and sustainable development report – Statement on non-financial information
2. The company’s results and situation
i. Elements of the profit-and-loss account at 31 December 2020
Changes in consolidated results (in 000 €) 31/12/2020 31/12/2019
Sales and services 1,255,391 1,191,375
Cost of sales and services - 1,002,224 - 953,363
Operating profit 253,167 238,012
Financial income 317 653
Financial expenses - 34,083 - 39,672
Profit for the financial year before tax 219,401 198,993
Tax on profit - 58,479 - 69,636
Profit for the financial year 160,922 129,357
Turnover for the Group was 1,218,455,000 € in 2020, com-pared with 1,152,951,000 € in 2019. This was made up mainly of transmission charges invoiced to energy providers, energy sales to protected customers and income relating to work on behalf of third parties.
Total other income was 35,007,000 € in 2020, compared with 36,885,000 € in 2019.
The cost of sales and services in 2020 was 1,002,224,000 €, which was an increase of 48,861,000 € compared with 2019. On this point, we should point out:
• purchases of goods were 22,724,000 €, up by 5,014,000 €. These costs mainly represent purchases of energy (electricity or gas) relating to our customers as part of the company’s
public service obligations, as well as purchases of goods associated with our stock;
• miscellaneous goods and services in 2020 were 612,078,000 € (an increase of 3,838,000 €); the Elia fee was the main com-ponent of this cost item, amounting to 359,878,000 € in 2020;
• salaries and social security charges were 141,225,000 € in 2020, compared with 117,383,000 € in 2019;
• depreciation of tangible and intangible fixed assets rose by 9,869,000 € to 170,572,000 € in 2020;
• impairments on stocks and trade receivables were -9,464,000 € (income), compared with 292,000 € (charge) in 2019. This year, significant bad debts were recorded on old receivables, offset by a reversal of impairments of the same order;
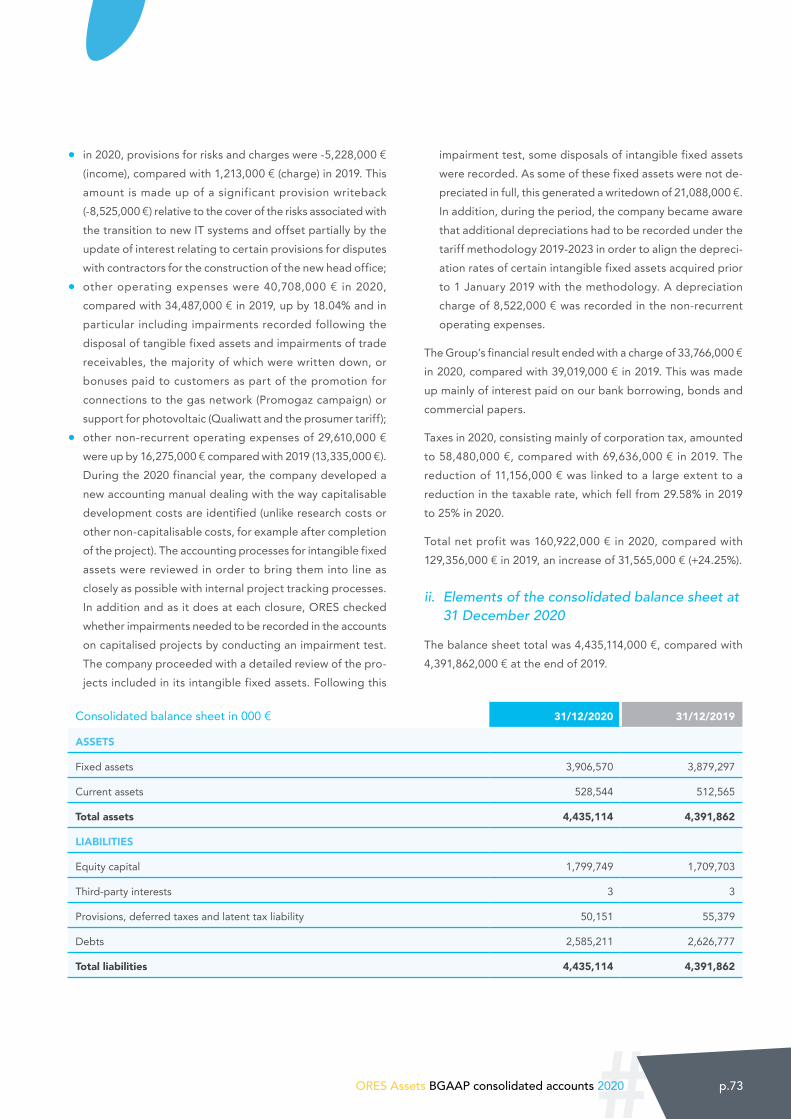
#ORES Assets BGAAP consolidated accounts 2020 p.73
• in 2020, provisions for risks and charges were -5,228,000 € (income), compared with 1,213,000 € (charge) in 2019. This amount is made up of a significant provision writeback (-8,525,000 €) relative to the cover of the risks associated with the transition to new IT systems and offset partially by the update of interest relating to certain provisions for disputes with contractors for the construction of the new head office;
• other operating expenses were 40,708,000 € in 2020, compared with 34,487,000 € in 2019, up by 18.04% and in particular including impairments recorded following the disposal of tangible fixed assets and impairments of trade receivables, the majority of which were written down, or bonuses paid to customers as part of the promotion for connections to the gas network (Promogaz campaign) or support for photovoltaic (Qualiwatt and the prosumer tariff);
• other non-recurrent operating expenses of 29,610,000 € were up by 16,275,000 € compared with 2019 (13,335,000 €). During the 2020 financial year, the company developed a new accounting manual dealing with the way capitalisable development costs are identified (unlike research costs or other non-capitalisable costs, for example after completion of the project). The accounting processes for intangible fixed assets were reviewed in order to bring them into line as closely as possible with internal project tracking processes. In addition and as it does at each closure, ORES checked whether impairments needed to be recorded in the accounts on capitalised projects by conducting an impairment test. The company proceeded with a detailed review of the pro-jects included in its intangible fixed assets. Following this
impairment test, some disposals of intangible fixed assets were recorded. As some of these fixed assets were not de-preciated in full, this generated a writedown of 21,088,000 €. In addition, during the period, the company became aware that additional depreciations had to be recorded under the tariff methodology 2019-2023 in order to align the depreci-ation rates of certain intangible fixed assets acquired prior to 1 January 2019 with the methodology. A depreciation charge of 8,522,000 € was recorded in the non-recurrent operating expenses.
The Group’s financial result ended with a charge of 33,766,000 € in 2020, compared with 39,019,000 € in 2019. This was made up mainly of interest paid on our bank borrowing, bonds and commercial papers.
Taxes in 2020, consisting mainly of corporation tax, amounted to 58,480,000 €, compared with 69,636,000 € in 2019. The reduction of 11,156,000 € was linked to a large extent to a reduction in the taxable rate, which fell from 29.58% in 2019 to 25% in 2020.
Total net profit was 160,922,000 € in 2020, compared with 129,356,000 € in 2019, an increase of 31,565,000 € (+24.25%).
ii. Elements of the consolidated balance sheet at 31 December 2020
The balance sheet total was 4,435,114,000 €, compared with 4,391,862,000 € at the end of 2019.
Consolidated balance sheet in 000 € 31/12/2020 31/12/2019
ASSETS
Fixed assets 3,906,570 3,879,297
Current assets 528,544 512,565
Total assets 4,435,114 4,391,862
LIABILITIES
Equity capital 1,799,749 1,709,703
Third-party interests 3 3
Provisions, deferred taxes and latent tax liability 50,151 55,379
Debts 2,585,211 2,626,777
Total liabilities 4,435,114 4,391,862
#p.74 ORES Assets BGAAP consolidated accounts 2020
ii.a. Assets
Intangible fixed assets were down by 25,233,000 € (net book value of 56,395,000 €, compared with 81,628,000 € in 2019). These were made up of expenses relating to IT projects. In-vestments during the 2020 financial year were mainly for the “Atrias” project and the “Smart” projects. This decrease is explained as follows:
• investments for the financial year: +25,958,000 €;
• depreciation for the financial year: -21,581 €;
• additional depreciations made by applying the tariff meth-odology (see the explanation of non-recurrent operating expenses, below): -8,522k€;
• disposals following the impairment test: -21,088,000 €.
Tangible fixed assets were 3,836,243,000 € in 2020, com-pared with 3,786,716,000 € in 2019, which was an increase of 49,527,000 €. This increase is explained as follows:
• investments for the financial year: +207,584,000 €;
• depreciations for the financial year: -149,016,000 € (this in-cludes the depreciation of the RAB (Regulated Asset Base) capital gain;
• the decommissioning of installations: -9,041,000 €.
Financial fixed assets worth 13,931,000 €, compared with 10,952,000 € in 2019, were made up mainly of an advance from ORES Assets to Atrias of 13,742,000 €, as well as the shares owned in Laborelec, Igretec and Atrias.
Receivables after more than one year fell by 250,000 €, com-pared with 2019 (6,479,000 € at 31 December 2020). These are receivables held on local authorities in the context, on the one hand, of the replacement of Hg/HP lamps for which the project was completed in 2019 and, on the other, following the Walloon Government EP Decree1 providing for the replacement in the next ten years of all municipal public lighting bulbs by LEDs.
Stocks and orders pending were 58,551,000 €. These were made up of goods (51,136,000 €) as well as works underway for private individuals and municipalities (7,415,000 €).
Trade receivables were 145,610,000 €, compared with 152,323,000 € in 2019 and were made up mainly of receivables from energy providers in the context of the invoicing of transit charges, receivables on protected and “Provider X” customers, as well as the amount of credit notes to be received.
1 The Walloon Government Decree of 14 September 2017 amending the Walloon Government Decree of 6 November 2008 relative to the public service obligation imposed on the distribution systems operator in terms of maintenance and the enhancement of the energy effi-ciency of public lighting installations.
“Other receivables” were 53,630,000 €, compared with 24,024,000 € in 2019 and included VAT to be recovered (1,615,000 €) and tax to be recovered (16,240,000 €), as well as receivables relatives to damage caused by third parties (1,917,000 €), the prosumer tariff to be recovered from the Walloon Region (27,462,000 €) and miscellaneous receivables (6,396,000 €).
Cash investments amounting to a total of 38,640,000 €, compared with 75,374,000 € in 2019, were made up of term investments on bank accounts of 35,640,000 €, as well as investments in commercial paper of 3,000,000 €.
Available assets (36,910,000 €) included cash held in current accounts and social funds.
Accruals (188,724,000 €, compared with 158,620,000 € in 2019) were made up mainly of the balance of pension capital yet to be covered at 22,556,000 €, fees for using public roads for gas of 17,761,000 €, regulated assets worth 114,908,000 €, charges carried forward relating to work to replace the lamps in the public lighting network of 11,568,000 €, as well as the RTNR (unmetered transmission fee) of 17,190,000 €.
ii.b. Liabilities
Following the change to the form of the company and its articles of association after the new Code of Companies and Associations came into effect, the capital of ORES Assets of 867,080,000 € is now accounted for as “Available Input” of 866,931,000 € and “Unavailable Input” of 533,000 €. It should be pointed out that the statutory reserve of 384,000 € was incorporated into the unavailable input in 2020.
The capital gain from the revaluation of tangible fixed assets amounted to 491,917,000 €, representing the as yet non-depre-ciated part of the initial difference between the RAB and the book value of these assets. This item went down by 20,770,000 € following the depreciation of the capital gains calculated at a rate of 2% per annum.
Consolidated reserves increased by 110.391,000 €, due mainly to:
• the transfer to unavailable reserves of a share of the revaluation surplus for the amount of the depreciation, i.e. 20,770,000 €;
• the incorporation into the share capital of all of the statutory reserves in the amount of 384,000 €;
#ORES Assets BGAAP consolidated accounts 2020 p.75
• the 88,749,000 € allocation to the available reserves, mainly in the context of the allocation of the 2020 results;
• the net movement to the untaxed reserves of 1,256,000 € relating to the “Tax Shelter”.
The capital subsidies account (108,000 €) represents the net book value of a subsidy received from the Walloon Region for a general interest industrial research project relating to smart meters (“Smart Users”).
Third-party interests represent the share of the subsidiaries, ORES and Comnexio, transferred by ORES Assets to the purely financing intermunicipal companies.
Provisions for risks and expenses fell by 5,228,000 €, from 55,379,000 € to 50,151,000 € as of 31 December 2020. These are made up of:
• environmental provisions of 3,789,000 €;
• provisions for disputes of 37,656,000 €, of which:
✓ provisions for the relocation of installations (8,288,000 €); ✓ the provision on the sale of land in Soignies (2,702,000 €); ✓ the provision for the “Atrias” project, of 18,000,000 €; ✓ the provision set aside following the termination of the
IT services contract to implement an information system for smart metering (5,039,000 €);
✓ the provision made for disputes with contractors for the construction of the new head office (3,627,000 €).
• provision in the context of vectorisation works on the distri-bution network plans of 8,705,000 €.
Debts after more than one year of 1,861,230,000 € were down by 153,946,000 €. These mainly represent:
• bank loans amounting to 1,574,600,000 €;
• bond loans in the form of private investments amounting to 280,000,000 €.
Debts after more than one year falling due within the year were up by 109,358,000 € (384,142,000 € at 31 December 2020) and were made up of the capital maturing from the bank loans and bond issues (Degroof).
Miscellaneous suppliers and invoices to be received make up the bulk of commercial debts (166,770,000 €, compared with 157,254,000 € in 2019).
Advances received on orders (39,179,000 €) include interim billings sent to protected customers and under “provider X”
(public service obligations, or PSO), As well as deposits received from customers for working to be carried out.
Tax, payroll and social debts of 48,165,000 € (compared with 44,220,000 € in 2019) covered:
• tax debts (2,298,000 €): the balance of the withholding tax to be paid, as well as the VAT to be paid on operations for December;
• payroll and social debts (45,867,000 €): provisions for sal-aries, bonuses to be paid and various annual subscriptions (Inami, NOSS).
“Other debts” (22,581,000 €) mainly included the balance of dividends to be paid after approval from the Ordinary General Meeting for the first half of 2021 (9,899,000 €), as well as debts to third parties and staff (corporate funds).
Accruals in the liability (63,145,000 € compared with 75,768,000 €) were made up mainly of:
• regulatory balances (31,730,000 €);
• an amount of 11,082,000 € of financial expenses mainly relating to our bond loans and bank borrowing;
• an amount invoiced to other companies to cover the annuities to be paid to their former staff, of 3,255,000 €;
• the unmetered transmission charge at the end of 2020 (13,622,000 €).
3. Description of the main risks and uncertainties facing the Group
The following paragraphs describe the measures taken to identify the main known risks and uncertainties which the ORES group may face and to remedy them. Risk management is a key pro-cess when it comes to helping ORES fulfil its strategic goals, as documented in the strategic plan. In 2018, ORES established a new methodology for managing risks. This was refined in 2019 on the basis of feedback, then in 2020, in particular to identify and monitor the most significant (major) risks with greater accuracy, as well as to reveal opportunities.
This process identifies, analyses and assesses the relevant risks according to their nature, the probability that they will occur and their potential impact on the fulfilment of the goals set by ORES. The methodology used in this process is described in this report and more specifically in the section entitled “Descrip-tion of the main characteristics of the internal auditing and risk management systems”. The main results for 2020 are explained in more detail below, focusing on the most significant risks,
#p.76 ORES Assets BGAAP consolidated accounts 2020
as highlighted by the risk analysis finalised in October 20202. Some unidentified risks could exist or, whereas they appear to be limited today, they could become more significant in the future. Nevertheless, the methodology put in place, by making all departments accountable and by expanding the sources of information as a result, makes it possible to greatly reduce the probability of ignoring a severe risk.
i. Risks associated with transformation and change
These are risks associated with the ability of ORES to implement its transformation and change (the transformation plan takes the form of practical programmes and projects).
These risks may produce difficulties associated with:
• the sustainability of the ORES transformation plan and the ability to deliver results within the deadlines set. These risks may impact the implementation of this plan and the efficiency that ORES wishes to establish;
• the differences between the amounts authorised by the reg-ulator to carry out this transformation and the costs actually incurred by the projects and programmes;
• the number of projects to be conducted simultaneously and the resulting dependency between the projects;
• human resources.
The ability of Atrias (new federal clearing house for managing the data and processes associated with the market for supplying electricity and gas) to be operational in line with the scheduled start date (September 2021) and the ability of the platform to incorporate new technologies and market requirements (mainly in terms of smart meters) also constitute a risk factor. Devel-opments in the Atrias project are monitored regularly by the Executive Board. Any dependence with other programmes and the transformation plan, as well as the financial impact and any other effects on the company’s legal obligations are constantly identified and monitored. The required resources have been put in place to ensure that the contribution made by ORES to this federal project is at the required level.
Reviewing project governance, strengthening the budget monitoring process, consulting with the regulator on strategic choices and close monitoring of the human resources involved
2 For operating, IT and HR risks not identified as part of the most significant risks, please refer to the to description stated in the 2019 annual report.
in the transformation (particularly with regard to the policy on commitment or in order to better spread and optimise the workload) are all actions designed to mitigate this risk. In the same way, implementing these actions opens up opportunities for ORES, such as getting staff involved in a new long-term vision, thoughts about efficiency, awareness of the budgeting process and complying with it, developing agility and adjusting the organisation and its processes, etc.
ii. Risks associated with pandemics
Due to the measures to stop normal operations that may be imposed by the government authorities should there be a pan-demic, as well as the effect of these measures on the availability of staff, pandemic may affect companies and require them to respond in the face of exceptional unforeseen and anticipated circumstances.
These risks may also constitute opportunities in terms of think-ing about a new way of working, as well as on accelerating the digitalisation of processes.
ORES has an internal emergency plan and, where applicable, takes exceptional and proportionate measures to:
• safeguard the health of it staff;
• maintain the essential public service tasks provided by the company;
• contribute to the national effort to combat the spread of pandemics.
As a result, practical measures are adopted by the company in order to reduce the risks associated with essential activities (i.e. the availability of engineers to take action in order to ensure the continuity of supplies, the preparation and shipment of orders to restock local stores, activities to monitor and operate the electricity and gas networks, as well as telecoms (radio and fibre optics), breakdown activities for the networks and telecoms, or the maintenance of IT tools and cashflow management).
KPIs to monitor the impact of the measures (human resources, energy passing through the networks, work on the networks, etc.) are established and analysed by the Executive Board. Where required, the frequency of Executive Board meetings is significantly increased to provide the necessary monitoring.
#ORES Assets BGAAP consolidated accounts 2020 p.77
Even though the company has succeeded in maintaining a good level of performance and guaranteeing continuity of service, ORES has conducted an initial “lessons learned” exercise into the effects of the health measures and the company’s ability to respond to them. A more in-depth audit is underway to identify any measures to take to improve management of this new risk in the future.
iii. Regulatory risk
The context of distributing electricity and gas is faced with in-creasingly rapid and uncertain changes. With this in mind, there is increasing probability that changes to the legislation and/or regulations may have a significant sudden and/or unexpected impact on the company’s strategy, with potential effects on the projects underway, the need to embark on new, very short-term projects and the mobilisation of the company’s human and budgetary resources. These repetitive uncertainties and changes make the development of effective operational strategies more complex. More specifically, the company’s ability to maintain consistency between its vision, strategy and transformation plan, as well as developments in the external context is the subject of special attention. An update of the strategic plan was approved at the end of 2020 and is monitored regularly.
In the same way as risks associated with transformation and change, the implementation of actions to mitigate regulatory risk opens up opportunities for ORES, such as thoughts about efficiency, awareness of the budgeting process and complying with it, developing agility and adjusting the organisation and its processes, etc.
More specifically with regard to tariff risk, please refer to section vii, “Economic and financial risks”, below.
iv. Risks associated with the volume of energy distributed
The ban on the use of fossil fuels by 2050, as well as the measures adopted by the European Union to encourage the gradual introduction of this ban (for example for financing), may have an effect on the Group’s gas-related business. This impact will depend on the agreed vision of where gas fits into the intended low-carbon society. It may involve a reduction in the penetration rate, an increase in associated costs (and hence tariffs), a problem with depreciations if certain assets can no longer be used at the end of their initial service life,
or an increase in financing costs. In addition, other sources of energy, such as heat networks, may come to compete directly with the gas-related business.
A reduction in consumption and hence in the volumes transiting through the networks as a result of the improvement in the energy efficiency of buildings and the development of forms of the self-production of energy (such as photovoltaic panels), could also have an impact on the gas business, as well as on electricity. This impact might take the form of a reduction in the base (kWh) for which the cost of activities could be passed on and hence an increase in tariffs. However, this reduction cold be offset by the introduction of new uses for energy (electric and CNG vehicles, heat pumps, etc.).
The Promogaz and CNG campaigns aimed at optimising the use of the gas distribution networks, facilitating the use of biomethane by accommodating new injection points, or the monitoring of the development of the injection of hydrogen into the gas distribution network are all actions that would enable this risk to be mitigated and could constitute an opportunity through the development of “green” gas being injected into the network.
Beyond the threats that this could have on the volume of energy (electricity and gas) drawn down from the distribution networks, energy transition also has the effect of placing the distribution networks at the heart of the technological and societal changes associated with this transition. By confirming its wish to be a facilitator of energy transition, ORES also aims to be an essential conduit working on behalf of these numerous developments: the production of renewable energy connected to the distri-bution network (photovoltaic panels, wind farms, injections of biomethane), new mobility solutions (electric recharging points, CNG or bio-CNG stations), energy communities, flexibility, storage, etc. There are many opportunities and these are being monitored by closely by ORES.
v. Risks associated with external service providers
ORES and ORES Assets are subject to the legislation on pub-lic procurement for their purchases of supplies, services and works. ORES is seeing an upward trend in the cost of the con-tractors on which it calls by public tenders. A procedure is to be launched to define a “vision of external service providers” in order to identify the main triggers behind these increases
#p.78 ORES Assets BGAAP consolidated accounts 2020
and hence to mitigate this risk. In the same way, the strategies for public procurement are currently the subject of changes, which specifications are being reviewed.
vi. Risks associated with organisation and governance
The environment in which ORES and ORES Assets operate is uncertain and complex. It is also changing quickly and constant-ly: energy transition, digitalisation, more sophisticated energy markets, the need for immediacy, speed of technological devel-opments, etc. This means that the processes and organisation must be adapted and simplified to enable ORES to be more efficient and to achieve the required level of agility. While the roles and responsibilities of the organisation of tomorrow are not yet clear, there may be tensions and losses of efficiency, etc. In order to mitigate these risks, procedures linked to the efficiency of the organisation have been introduced.
vii. Economic and financial risks (including tariff risks)
vii. a. Tariff risks
The activities of ORES and ORES Assets are governed by a major legislative and regulatory framework, the main two elements of which are the tariff decree and the tariff methodology, drawn up on the basis of this decree by the CWaPE. In particular, this framework defines the means available to the DSO to fund its activities (authorised income) or a collection of rules that may have a positive or negative impact on shareholders’ remuneration (incentive-driven regulation mechanism). In 2018, the regulator approved the authorised revenue available to the Group for the 2019-2023 period and in 2019 the rates for the 2019-2023 period. This is a positive element that gives the company a 5-year view of the means at its disposal. In 2018, the regulator had also approved special budgets for specific projects (no-tably for smart metering and the promotion of natural gas). Following the publication of the Walloon decree of 19 July 2018 relating to the deployment of smart meters, the assumptions used in the framework of the budget relating to the specific “smart metering” project as approved by the regulator had to be reviewed (in particular, change in metering technology and downward revision of the volumes deployed over the period 2019-2023). The CWaPE’s decision to refuse the envelope spe-cifically reviewed to take these new assumptions into account having been overturned by the Market Court following the
appeal by ORES, discussions about this envelope are currently continuing with the regulator. Elsewhere, discussions relating to the adoption of the tariff methodology 2024-2028 are due to begin. In particular, ORES will be careful to ensure during these discussions that this methodology assures the continuity and long-term vision of the activities of the DSOs, that a tariff structure is introduced that meets the needs of customers, as well as complies with the constraints and cost structure of the DSOs, etc. Although any modification of the tariff methodology could have an impact on the profitability of ORES, the regulator’s obligation to take account of the principles of the European directives of the third energy package and the tariff decree of 19 January 2017 will limit this risk.
Differences may appear between controllable costs and actual costs, both in terms of the authorised income and specific budgets. To mitigate this risk, the following actions are being taken in particular:
• monthly budget monitoring, refinement of budgets as and when required and the production of a “best estimate”;
• monitoring the indexation parameters, as well as the devel-opment of certain costs.
Finally, the company needs to ensure it complies with the fi-nancial covenants, which are monitored regularly.
vii. b. Credit risks
The Group conducts a financing policy that calls on a variety of sources in the capital markets. Since 2012, the Group’s fi-nancing has been carried out by ORES, with a guarantee from ORES Assets.
At 31 December 2020, the Group’s sources of financing con-sisted mainly of:
• a programme of commercial paper with an indefinite duration up to a maximum of 550 million €;
• funds raised via private investments (in 2012, 2014 and 2015 via bond markets);
• amounts raised through the issue of bank loans;
• significant finance raised from the European Investment Bank (550 million €);
• two short-term lines of credit, each for 50 million €, for respective terms of 1 year and 3 years.
#ORES Assets BGAAP consolidated accounts 2020 p.79
vii. c. Interest rate risks
Any change in interest rates has an impact on the level of financial expenses. In order to minimise this risk, the Group applies a financing and debt management policy designed to achieve an optimum balance between fixed and variable interest rates. As well as this, hedging instruments are used to protect against uncertainty. With a view to managing interest rate risks, the Group uses derivatives such as swaps (short-term rates to long-term rates), interest rate caps and collars (combination of buying a cap and selling a floor). No derivatives are used for the purposes of speculation. The financing policy also takes debt maturity into account. Debt management and market data are carefully monitored.
vii. d. Inflation risks
The inflation risk is the risk of a more or less sustainable and controllable price increase. The CWaPE tariff methodology provides for controllable costs to change annually on the ba-sis of an indexation factor (linked to the Belgian health index) of 1.575%, which is not revised during the tariff period. As a result, any price increase in excess of the inflation forecast in this methodology could impact the company’s earnings. To protect itself from this risk, ORES has acquired partial cover through an inflation swap.
vii. e. Tax risk
ORES Assets and ORES are subject to corporation tax. The tariff methodology stipulates that any fiscal charges for ORES Assets are incorporated into the tariffs as a non-controllable cost. As a result, the impact of changes to the tax legislation is limited essentially to ORES.
vii. f. Asset and liquidity risk
Within the context of managing these risks and billing fees to use the networks, which accounts for the bulk of the Group’s turnover, ORES Assets has financial guarantees from many of its energy suppliers active on the network. These guarantees are defined by the contract granting access to the network and may be reviewed annually.
ORES has short-term financing capacity thanks to its programme of commercial paper and credit lines, as outlined above; the liquidity risk can therefore be regarded as more than managea-ble. Cashflow management helps limit the risks associated with the market, the way assets and liabilities are structured and
liquidity. The management bodies have established a prudent investment management policy, based on diversification as well as the use of products with limited risks in terms of credit and rates. ORES is aware of the issue of negative interest rates when it comes to managing its cashflow.
vii. g. Macroeconomic and financial climate risks
The economic situation may have repercussions on the demand for electricity and natural gas, or on the Group’s financing con-ditions. With regard to the impact on the demand for electricity and natural gas, this risk and its effects are not normally borne by the Group. The 2019-2023 tariff methodology provides for the regulator to check the differences between the budget and the actual situation during the financial year following the year in question (N+1), including volume risk. The tariff for regula-tory balances shall, in principle, be adjusted to take account of these differences as from 1 January of the year following that of the check (N+2). With regard to the impact on the financing conditions for ORES, reference is made to the paragraph on interest rate risk (derivatives for hedging purposes, financing and debt management policy and monitoring of market data).
1.2. Data on significant post-closing events
Since mid-March 2020, as part of the measures taken in the fight against the COVID-19 virus adopted by the National Security Council, as well as by the Federal and Walloon authorities, as stated in the introduction and in the activity report in this report, ORES implemented a series of provisions designed, on the one hand, to safeguard the health of its staff and that of its customers and, on the other, to guarantee the implementation of its public service duties in these exceptional circumstances.
During the 2020 financial year, independent of its impact on the world economy and indicators, COVID-19 had no financial impact likely to jeopardise the continuity of the company. The impact of COVID-19 in 2021 is likely to be of the same kind and hence should not jeopardise the continuity of the company.
1.3. Information about circumstances likely to have a significant influence on the development of the consolidated whole
None

#p.80 ORES Assets BGAAP consolidated accounts 2020
1.4. Information about research and development activities
The development of techniques relating to running the net-works, smart metering and other developments (including computer applications for metering data management) show that significant development costs are generated and that it is highly probable that they will be spread over longer periods of time than in the past. With this in mind, ORES sc has chosen to capitalise staff expenditure relating to researchers, technicians and other support personnel, insofar as they are allocated to an “development” project.
These projects relate mainly to IT developments, such as the Atrias project or the Smart Metering and Smart Grid projects.
1.5. Presentation of the use of financial instruments by the company
Up until 2012, the 8 combined DSOs that merged to create ORES Assets were financed by bank loans (via public contracts) from leading Belgian financial institutions.
Since 2012, the Group’s funding has been carried out by ORES, which means that the group can benefit from a range of financing sources. Hence the financing taken out by ORES sc is guaranteed by ORES Assets.
Apart from bank financing (which has not been subject to a public contract since 30 June 2017), as of 31 December 2020, ORES:
• had a programme of commercial papers worth 550 million € with an indefinite term;
• had two short-term lines of credit, each for an overall amount of 50 million €, with respective terms of one year and three years;
• issued bonds in 2012 admitted to the official listing and to be traded on the regulated market of the Luxembourg stock exchange within the context of a private investment. Some of this loan was the subject of a buyback in 2018;
• issued bonds in 2014 and 2015 admitted to the listing and to be traded on the “Open market” segment of the Frankfurt stock exchange in the form of private investments;
• secured a financing programme from the EIB (European Investment Bank) in 2017 for a total of 550 million € to be drawn over 5 years.
In 2020, ORES took out new bank loans for 130 million € and drew down 100 million € from the EIB financing programme.
ORES will continue to pursue a financing policy that calls on a variety of sources in the capital markets.
The financing policy is based on three points (interest rate, loan term and use of hedging derivatives). These principles were the subject of decisions made by the competent bodies of ORES Assets and ORES. The financing policy also takes into account different lifetimes of loans and the lifespan of the assets.
Particular attention is paid to changes in interest rates. Indeed, any variation in interest rates has an impact on the level of financial expenses. In order to protect themselves against this risk, ORES and ORES Assets are careful, when it comes to debt management, to find the optimum balance for loans at variable and fixed interest rates in its portfolio.
In addition, hedging instruments are used to protect against increases in interest rates. This risk is managed thanks to the use of derivatives such as interest rate swaps (short-term rates to long-term rates), interest rate caps and collars (combination of buying a cap and selling a floor). No derivatives are used for the purposes of speculation.
1.6. Justification of independence and competence in terms of accounts and auditing of at least one member of the Audit Committee of the consolidating company
Since June 2018, the Audit Committee has been mirrored in ORES and ORES Assets, according to the rules of common governance and in accordance with the provisions of the CDLD – the Belgian Local Democracy and Decentralisation Code.
Ms Anne-Caroline Burnet was appointed Chair of the Audit Committee from 11 September 2019, following the total renewal of the Board of Directors by the general meeting of share-holders on 29 May 2019, in accordance with the CDLD and the articles of association. She justifies the required independence and competence. In this way, on the one hand she meets the independence criteria required by the legislation while, on the other, she has the required experience in accountancy, audit and financial matters in the sense of the Act of 7 December 2016. These two elements were confirmed in a certificate.
#ORES Assets BGAAP consolidated accounts 2020 p.81
1.7. Description of the main features of the internal audit and risk management systems of affiliated companies in relation to the process of preparing the consolidated accounts
With the operational and day-to-day management of activities at ORES Assets, including keeping the accounts being entrusted to ORES – as the operating company – this description sets out the main features of the internal audit and risk management systems in relation to the process of drawing up accounts in place at ORES in 2020.
At ORES, internal audit and risk management are part of the corporate governance implemented to enable the company to take decisions responsibly, efficiently and transparently.
a. Audit environment
i. Corporate governance
In accordance with the ORES articles of association, the Board of Directors has put various committees in place that assist the Board in the exercise of its responsibilities: the Audit Committee, the Executive Board, The Appointments and Remuneration Committee and the Ethics Committee. The Audit Committee has been entrusted in particular with the assignments of (i) assisting the Board to examine the financial information, (ii) monitoring the efficiency of the internal audit and risk management systems (iii) monitoring internal auditing and its efficiency, and (iv) monitoring the statutory audit of the accounts and recommendations made by the auditor. This Committee meets on a minimum of three occasions per year to discuss these various points.
The Board of Directors has delegated the day-to-day management of the company and the representation of the company with regard to this management to the person who is the Chairman of the Executive Board (delegated for day-to-day management). As the person delegated for day-to-day management, the Chairman of the Executive Board is permitted, in the context of this management, to sub-delegate special powers to members of ORES staff and particularly to the members of the Executive Board. In this instance, the Finances & Controlling department supports the Committee by making available, in good time, reliable and relevant financial information. This information
is essential for taking strategic decisions and conducting the operational management of the company, as well as for the efficient management of its financial tasks. This information is made up of financial and tax-related reports (statutory and consolidated accounts), as well as regulatory reports.
To meet the need to manage and audit the ORES business, the Executive Board has adopted a system of governance based on the IPMS (Integrated Performance Management System) methodology. IPMS sets the management rules which, applied to processes and activities – including those relating to financial, tax and regulatory reporting – enable ORES, among other things, to guide its objectives, control its activities, manage its risks and improve the efficiency of its operations through an assessment system and the optimum allocation of roles and responsibilities. This governance incorporates two levels: the first, corporate governance (the link between shareholders and management and hence the functioning of the company’s management bodies entre) and, the second, operational governance.
ii. Outline of objectives
The company’s strategy is set out in a strategic plan that incor-porates its vision, mission and values. This plan also contains an outline of the resources put in place and the actions identified to achieve those ambitions. The transformation plan is an important tool in reaching those goals. It provides a timeline for achiev-ing the main objectives, setting out the constraints (including financial constraints) and the contribution that projects make to ORES’s industrial aims. These objectives are then rolled out by department. ORES management assumes its responsibility in implementing effective control measures that ensure, among other things, that goals are achieved.
iii. Roles and responsibilities
In terms of corporate governance, the roles and responsibilities of the company’s various bodies are set out in the articles of association and the governance charter. The wording of these documents is available on the ORES website.
The key principal of operational governance is accountability. Decisions must be taken at the most appropriate level within the context of a specific mandate. For this to happen, the Ex-ecutive Board has defined and implemented an organisational structure that is formalised in an organisation chart. The Human Resources department keeps this chart up to date, along with its job descriptions. Each job description states the reason for
#p.82 ORES Assets BGAAP consolidated accounts 2020
the position, the qualifications required, the areas where results must be provided and key responsibilities. Allocating roles and responsibilities to each staff member makes it possible to distribute the operational tasks within ORES.
Within the Finances & Controlling department, “Group Ac-counting” is responsible for maintaining accounts, auditing financial year information and preparing financial and tax-related reports. The “Group Management Audit” department has the task of guiding the budget process through operational charge coordination, as well as budget control and drawing up financial and management reporting intended for the regulator.
In terms of the qualifications required, the capabilities needed to achieve the mission that ORES has set itself are encapsulated in the Capability Map. There is a policy of skills management in place to encourage training and, in doing so, to enable all staff to carry out their duties efficiently and reliably. The tasks, responsibilities and skills of each member of the “Group Ac-counting” and “Group Management Audit” departments are clearly identified in the policy. Training courses enabling them to maintain the necessary skills they acquire are available for-mations and are mandatory.
ERP software is used to keep the accounts and report on the companies consolidated overall into ORES Assets. This contains the IT tools needed to draw up these reports.
iv. Making governance operational
In terms of corporate governance, governance that applies to both ORES and ORES Assets in in place based on “mirror” manage-ment bodies. Readers will find more detailed information about this in the articles of association and the governance charter.
Operationally and in addition to the structure outlined in the organisation chart, governance is also based on two type of corporate body: committees and coordination groups. The Executive Board decides to establish a committee when a topic requires decisions to be taken jointly across more than two departments on a recurrent basis. This committee is a permanent operational body that takes strategic decisions on clearly defined topics and within the framework of a clear and formalised mandate with specific tolerances. The committee reports to the Executive Board. Des Coordination groups are set up in order to align functional or operational counterparts with one another for the purpose of consulting or informing this group.
v. Integrity and ethics
Integrity and ethics at ORES are essential in its internal control environment. The ORES ethical code of conduct, based on the company’s values, defines how ethics rules are applied via its values, and how they are experienced and respected. A code for applying the rules relating to market abuse also includes the rights and obligations of the directors and employees involved in terms of using privileged information and market manipulation. Management makes sure that employees comply with these codes, values and internal procedures and, if applicable, takes the necessary measures described in the company’s working regulations. Due to its legal status as electricity and gas dis-tribution system operator, ORES complies with a significant number of statutory and regulatory rules, which define various fundamental principles, such as confidentiality, transparency and non-discrimination.
b. Risk management and internal audit
i. Risk management
Risk management is a key process when it comes to helping ORES fulfil its strategic goals. This process identifies, analyses and assesses the relevant risks according to their nature, the probability that they will occur and their potential impact on the fulfilment of ORES’s goals. This leads to an annual mapping of risks and action plans to mitigate these risks. Each department (according to the principle of empowerment mentioned above) feeds into this, and the process is led by the Risk Manager, who provides the necessary methodology and tools in terms of risk management, then consolidates the results of the analyses of each department to produce the map mentioned above, on the basis of the different kinds of predefined risks. This map is then submitted to the Management Committee and the Audit Committee, identifying for each type of risk, its severity, the nature of the most severe risks and the associated action plans in place and/or to be planned. Changes in relation to previous years are also highlighted. This exercise, completed within the Finance department, takes into account, among other things, current and future risks associated with the financial, tax and regulatory reports. All of the risks identified in this way are classified in order of importance and the action plans drawn up are monitored.
#ORES Assets BGAAP consolidated accounts 2020 p.83
ii. Internal control
Internal control is another key process that helps provide rea-sonable assurance as to the fulfilment of ORES’s business, as well as its targets, by handling the associated risks appropri-ately. Internal control is everybody’s responsibility: the board, senior management and staff. It is a day-to-day process for management and continuous improvement. It is coordinated by the “Internal Control” department, under the authority of the Finances & Controlling department.
The general process in terms of the ORES internal control system involves systematic analyses designed to identify and assess the risks associated with operational activities, as well as to decide how to handle risks, implement control measures to contain them at an acceptable level for ORES and to monitor the audit system in place. For all the processes involved, including those related to financial, tax and regulatory reports, the analysis and audit process incorporates the protection of assets by separating tasks within processes, preventing one person alone from initiating, authorising and recording a transaction; using access policies for information systems; controlling how powers are delegated. This is in particular to help limit the risks of errors and fraud. The process of closing accounts is conducted according to a timetable defining everybody’s roles and responsibilities. It also includes control mechanisms to minimise the risk of errors as well as tests for certain transactions (for example, those carried out outside normal working hours). The aim is to achieve sufficient assurance about the reliability of the financial results.
The results of the internal control processes are the subject of an annual review by the Executive Board, as well as by the Audit Committee, which helps the Executive Board in its task.
iii. Audits
iii.a. Internal audit
Internal auditing also plays a key role by carrying out independ-ent reviews of operating processes in relation to regulations applicable to ORES. It is based on a systematic, rigorous approach to assess and improve the effectiveness of risk and process management. An annual audit plan is drawn up and then approved by the Audit Committee. The results of internal audits are the subject of a report submitted to the Executive Board and the Audit Committee, to help fulfil its role.
iii.b. External audit
ORES is also subject to an external audit by the company’s auditor. This audit generally includes an assessment of the internal control systems and comments on the statutory and consolidated financial results (annual and half-yearly). The au-ditor makes recommendations about how the internal control systems can be improved. These recommendations, action plans and their implementation are the subject of an annual report submitted to the Audit Committee. In addition, ORES is ISO9001-2015-certified for all of its activities.
Internal and external audits are conducted in order to monitor the quality of financial, tax-related and regulatory reports.
iv. Information and communication
The resources in place to ensure an effective internal control system and decent risk management include communicating relevant information to ORES employees so that they can ex-ercise their responsibilities and fulfil their goals. Financial infor-mation is necessary for budgeting and forecasts, as well as to ensure compliance with the regulatory framework. Operational information is also vital for preparing the different reports that are essential for the smooth running of the company. Multiple communication channels are used: manuals, memos, e-mails, Intranet applications, etc.
c. Monitoring and assessing results
Operational governance fits within a framework of ongoing performance assessments covering indicators, risk management, internal control and audits.
Monitoring activities include KPI reports for the Executive Board, on the one hand, and the Board of Directors on the other; there is also monitoring of the main operational indicators on a departmental level.
Financial results are the subject of internal reporting and are approved at various levels: the Executive Board and, once every six months, the Audit Committee, the Chairman of which reports back to the Board of Directors.
#p.84 ORES Assets BGAAP consolidated accounts 2020
1.8. Information that must be inserted pursuant to article 74, § 7, of the Act of 1 April 2007 relative to public takeover bids
Does not apply.
1.9. Additional informationThe intermunicipal company does not have its own staff.
“Mirror” bodies have been established. In addition to the (Ap-pointments and) Remuneration Committee, a “mirror” Board of Directors and Audit Committee have been established at ORES Assets sc and ORES, with unpaid mandates at ORES Assets and payment of emoluments at ORES.
These accounts are subject to an administrative supervision procedure.
This management report will be lodged in full with the National Bank of Belgium (notes to the accounts; annual accounts, the latter in the format of the full standardised template), accompanied by the non-financial information (introduction and activity and sustainable development report – statement on non-financial information) and the remuneration report.
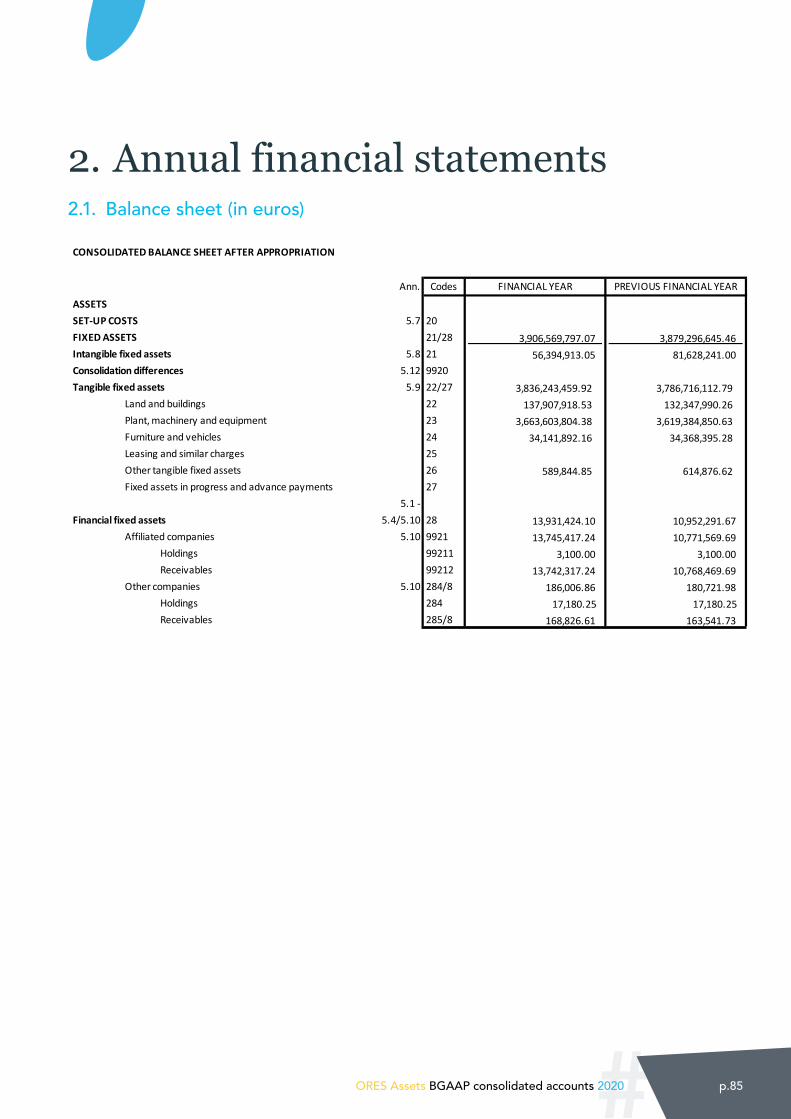
#ORES Assets BGAAP consolidated accounts 2020 p.85
2. Annual financial statements2.1. Balance sheet (in euros)
N° C 2.1 CONSO 3.1
CONSOLIDATED ACCOUNTS
CONSOLIDATED BALANCE SHEET AFTER APPROPRIATION
Ann. Codes FINANCIAL YEAR PREVIOUS FINANCIAL YEAR
ASSETSSET-UP COSTS 5.7 20FIXED ASSETS 21/28 3,906,569,797.07 3,879,296,645.46 Intangible fixed assets 5.8 21 56,394,913.05 81,628,241.00 Consolidation differences 5.12 9920Tangible fixed assets 5.9 22/27 3,836,243,459.92 3,786,716,112.79
Land and buildings 22 137,907,918.53 132,347,990.26 Plant, machinery and equipment 23 3,663,603,804.38 3,619,384,850.63 Furniture and vehicles 24 34,141,892.16 34,368,395.28 Leasing and similar charges 25Other tangible fixed assets 26 589,844.85 614,876.62 Fixed assets in progress and advance payments 27
5.1 -Financial fixed assets 5.4/5.10 28 13,931,424.10 10,952,291.67
Affiliated companies 5.10 9921 13,745,417.24 10,771,569.69 Holdings 99211 3,100.00 3,100.00 Receivables 99212 13,742,317.24 10,768,469.69
Other companies 5.10 284/8 186,006.86 180,721.98 Holdings 284 17,180.25 17,180.25 Receivables 285/8 168,826.61 163,541.73
CURRENT ASSETS 29/58 528,544,542.42 512,565,078.09 Amounts receivable after one year 29 6,479,370.57 6,729,288.58
Trade receivables 290 611,819.41 Other receivables 291 5,867,551.16 6,729,288.58 Deferred taxes 292
Stocks and orders in progress 3 58,551,443.71 50,345,454.53 Stocks (2) 30/36 51,135,769.73 42,935,027.76
Supplies 30/31 51,135,769.73 42,935,027.76 In manufacture 32Finished products 33Goods 34Real estate property intended for sale 35Advance payments 36
Orders in progress 37 7,415,673.98 7,410,426.77 Amounts receivable within one year 40/41 199,240,143.50 176,347,289.88
Trade receivables 40 145,609,915.87 152,322,950.04 Other receivables 41 53,630,227.63 24,024,339.84
Cash investments 50/53 38,639,630.89 75,373,802.84 Own shares 50Other investments 51/53 38,639,630.89 75,373,802.84
Disposable assets 54/58 36,910,226.77 45,149,662.35 Accruals 490/1 188,723,726.98 158,619,579.91 TOTAL ASSETS 20/58 4,435,114,339.49 4,391,861,723.55
BE 0543.696.579
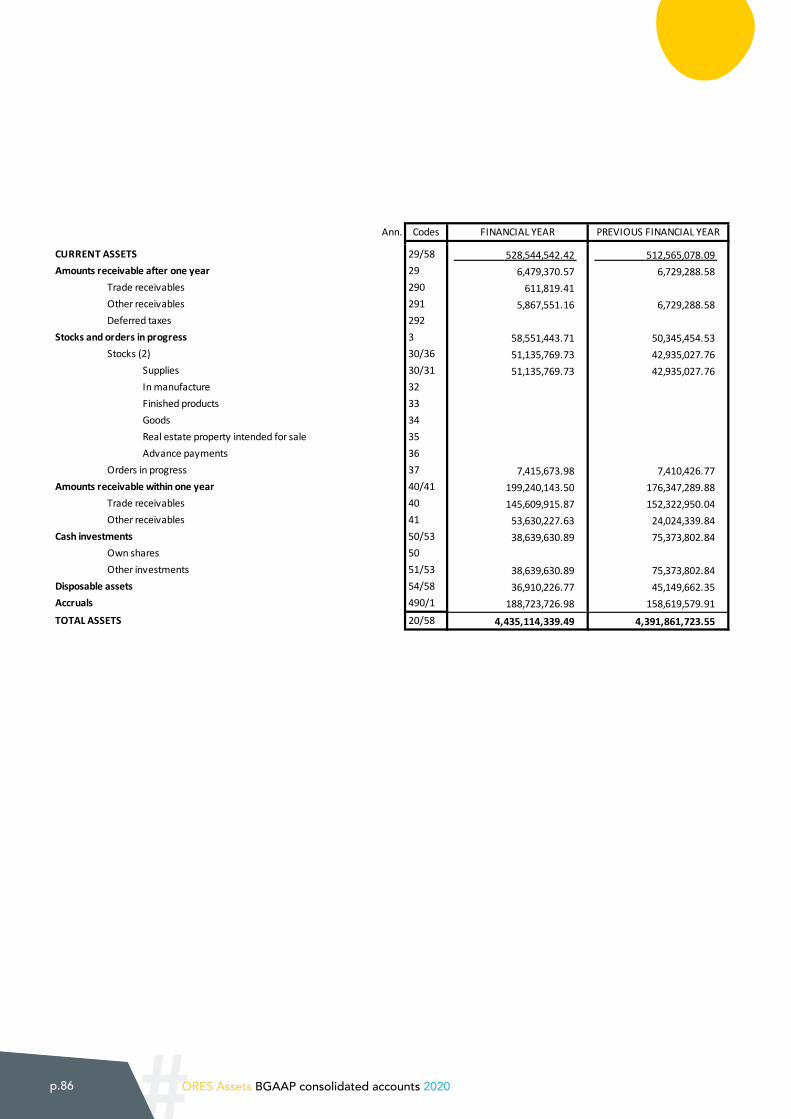
#p.86 ORES Assets BGAAP consolidated accounts 2020
N° C 2.1 CONSO 3.1
CONSOLIDATED ACCOUNTS
CONSOLIDATED BALANCE SHEET AFTER APPROPRIATION
Ann. Codes FINANCIAL YEAR PREVIOUS FINANCIAL YEAR
ASSETSSET-UP COSTS 5.7 20FIXED ASSETS 21/28 3,906,569,797.07 3,879,296,645.46 Intangible fixed assets 5.8 21 56,394,913.05 81,628,241.00 Consolidation differences 5.12 9920Tangible fixed assets 5.9 22/27 3,836,243,459.92 3,786,716,112.79
Land and buildings 22 137,907,918.53 132,347,990.26 Plant, machinery and equipment 23 3,663,603,804.38 3,619,384,850.63 Furniture and vehicles 24 34,141,892.16 34,368,395.28 Leasing and similar charges 25Other tangible fixed assets 26 589,844.85 614,876.62 Fixed assets in progress and advance payments 27
5.1 -Financial fixed assets 5.4/5.10 28 13,931,424.10 10,952,291.67
Affiliated companies 5.10 9921 13,745,417.24 10,771,569.69 Holdings 99211 3,100.00 3,100.00 Receivables 99212 13,742,317.24 10,768,469.69
Other companies 5.10 284/8 186,006.86 180,721.98 Holdings 284 17,180.25 17,180.25 Receivables 285/8 168,826.61 163,541.73
CURRENT ASSETS 29/58 528,544,542.42 512,565,078.09 Amounts receivable after one year 29 6,479,370.57 6,729,288.58
Trade receivables 290 611,819.41 Other receivables 291 5,867,551.16 6,729,288.58 Deferred taxes 292
Stocks and orders in progress 3 58,551,443.71 50,345,454.53 Stocks (2) 30/36 51,135,769.73 42,935,027.76
Supplies 30/31 51,135,769.73 42,935,027.76 In manufacture 32Finished products 33Goods 34Real estate property intended for sale 35Advance payments 36
Orders in progress 37 7,415,673.98 7,410,426.77 Amounts receivable within one year 40/41 199,240,143.50 176,347,289.88
Trade receivables 40 145,609,915.87 152,322,950.04 Other receivables 41 53,630,227.63 24,024,339.84
Cash investments 50/53 38,639,630.89 75,373,802.84 Own shares 50Other investments 51/53 38,639,630.89 75,373,802.84
Disposable assets 54/58 36,910,226.77 45,149,662.35 Accruals 490/1 188,723,726.98 158,619,579.91 TOTAL ASSETS 20/58 4,435,114,339.49 4,391,861,723.55
BE 0543.696.579
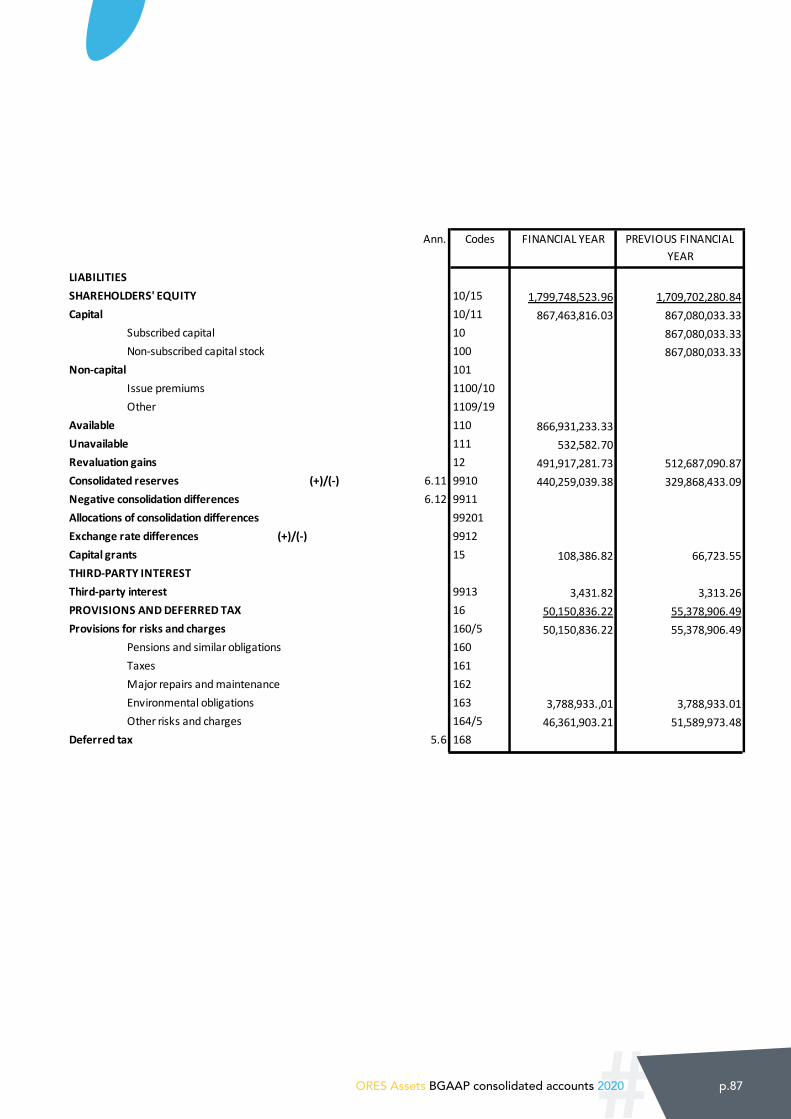
#ORES Assets BGAAP consolidated accounts 2020 p.87
C 2.1N° CONSO 3.2
Ann. Codes FINANCIAL YEAR PREVIOUS FINANCIAL YEAR
10/15 1,799,748,523.96 1,709,702,280.84
LIABILITIESSHAREHOLDERS' EQUITYCapital 10/11 867,463,816.03 867,080,033.33
10 867,080,033.33100
Non-capital 1011100/10
Subscribed capital Non-subscribed capital stock
Issue premiumsOther 1109/19
110 866,931,233.33111 532,582.7012 491,917,281.73 512,687,090.87
(+)/(-) 6.11 9910 440,259,039.38 329,868,433.096.12 9911
99201 (+)/(-) 9912
15 108,386.82 66,723.55
9913 3,431.82 3,313.2616 50,150,836.22 55,378,906.49
AvailableUnavailableRevaluation gainsConsolidated reserves Negative consolidation differencesAllocations of consolidation differencesExchange rate differences Capital grantsTHIRD-PARTY INTERESTThird-party interestPROVISIONS AND DEFERRED TAXProvisions for risks and charges 160/5 50,150,836.22 55,378,906.49
160161
Pensions and similar obligations TaxesMajor repairs and maintenance 162Environmental obligations 163 3,788,933.,01 3,788,933.01
164/5 46,361,903.21 51,589,973.48Other risks and chargesDeferred tax 5.6 168DEBTS 17/49 2,585,211,547.49 2,626,777,222.96Amounts payable after one year 5.13 17 1,861,229,740.29 2,015,176,360.84
Financial debts 170/4 1,861,188,740.29 2,014,713,360.84170171 280,000,000.00 570,600,000.00172173 1,574,599,936.85 1,437,570,503.69
Subordinated loansNon-subordinated bond issuesLeasing and other similar debts Credit institutions Other borrowing 174 6,588,803.44 577,142,857.15
17517501751
Trade debts SuppliersNotes payable
Pre-payments on orders 176178/9 41,000.00 4,630.00Other debts
Amounts payable within one year 5.13 42/48 660,836.775.77 535,833,036.3042 384,141,995.36 274,783,804.8043430/8439
Long-term debts falling due within the yearFinancial debts
Credit institutions Other borrowing
Trade debts 44 166,770,118.42 157,254,059.69440/4 166,770,118.42 157,254,059.69Suppliers
Notes payable 44146 39,178,558.38 34988472,0645 48,165,099.78 44,219,517.54450/3 2,298,203.06 2,076,921.56454/9 45,866,896.72 42,142,595.98
Pre-payments on ordersDebts for taxes, payroll and social contributions
TaxesRemuneration and social charges
Other amounts payable 47/48 22,581.003.83 24,587,182.21492/3 63,145,031.43 75,767,825.82Accruals
TOTAL LIABILITIES 10/49 4,435,114,339.49 4,391,861,723.55
BE 0543.696.579
867,080,033.33
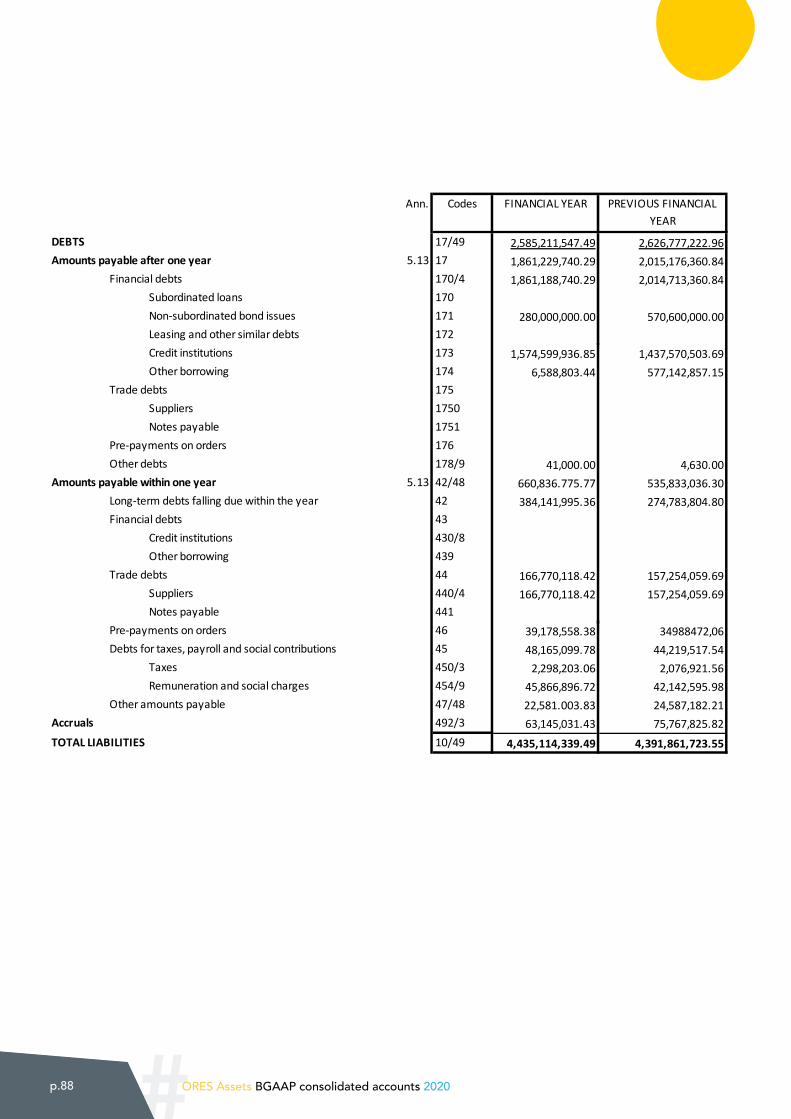
#p.88 ORES Assets BGAAP consolidated accounts 2020
C 2.1N° CONSO 3.2
Ann. Codes FINANCIAL YEAR PREVIOUS FINANCIAL YEAR
10/15 1,799,748,523.96 1,709,702,280.84
LIABILITIESSHAREHOLDERS' EQUITYCapital 10/11 867,463,816.03 867,080,033.33
10 867,080,033.33100
Non-capital 1011100/10
Subscribed capital Non-subscribed capital stock
Issue premiumsOther 1109/19
110 866,931,233.33111 532,582.7012 491,917,281.73 512,687,090.87
(+)/(-) 6.11 9910 440,259,039.38 329,868,433.096.12 9911
99201 (+)/(-) 9912
15 108,386.82 66,723.55
9913 3,431.82 3,313.2616 50,150,836.22 55,378,906.49
AvailableUnavailableRevaluation gainsConsolidated reserves Negative consolidation differencesAllocations of consolidation differencesExchange rate differences Capital grantsTHIRD-PARTY INTERESTThird-party interestPROVISIONS AND DEFERRED TAXProvisions for risks and charges 160/5 50,150,836.22 55,378,906.49
160161
Pensions and similar obligations TaxesMajor repairs and maintenance 162Environmental obligations 163 3,788,933.,01 3,788,933.01
164/5 46,361,903.21 51,589,973.48Other risks and chargesDeferred tax 5.6 168DEBTS 17/49 2,585,211,547.49 2,626,777,222.96Amounts payable after one year 5.13 17 1,861,229,740.29 2,015,176,360.84
Financial debts 170/4 1,861,188,740.29 2,014,713,360.84170171 280,000,000.00 570,600,000.00172173 1,574,599,936.85 1,437,570,503.69
Subordinated loansNon-subordinated bond issuesLeasing and other similar debts Credit institutions Other borrowing 174 6,588,803.44 577,142,857.15
17517501751
Trade debts SuppliersNotes payable
Pre-payments on orders 176178/9 41,000.00 4,630.00Other debts
Amounts payable within one year 5.13 42/48 660,836.775.77 535,833,036.3042 384,141,995.36 274,783,804.8043430/8439
Long-term debts falling due within the yearFinancial debts
Credit institutions Other borrowing
Trade debts 44 166,770,118.42 157,254,059.69440/4 166,770,118.42 157,254,059.69Suppliers
Notes payable 44146 39,178,558.38 34988472,0645 48,165,099.78 44,219,517.54450/3 2,298,203.06 2,076,921.56454/9 45,866,896.72 42,142,595.98
Pre-payments on ordersDebts for taxes, payroll and social contributions
TaxesRemuneration and social charges
Other amounts payable 47/48 22,581.003.83 24,587,182.21492/3 63,145,031.43 75,767,825.82Accruals
TOTAL LIABILITIES 10/49 4,435,114,339.49 4,391,861,723.55
BE 0543.696.579
867,080,033.33
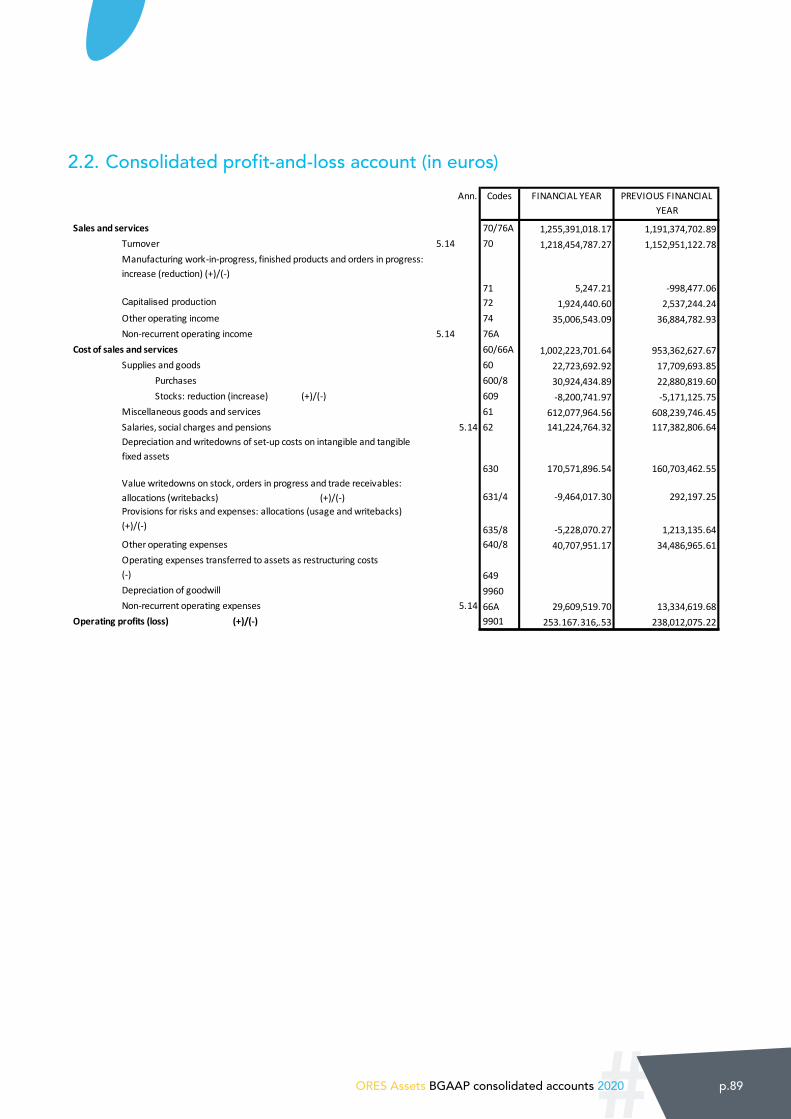
#ORES Assets BGAAP consolidated accounts 2020 p.89
2.2. Consolidated profit-and-loss account (in euros)N° C 2.1 CONSO 4
CONSOLIDATED PROFIT AND LOSS ACCOUNTbreakdown of operating results, based on their nature
Ann. Codes FINANCIAL YEAR PREVIOUS FINANCIAL YEAR
Sales and services 70/76A 1,255,391,018.17 1,191,374,702.89Turnover 5.14 70 1,218,454,787.27 1,152,951,122.78
71 5,247.21 -998,477.06Capitalised production 72 1,924,440.60 2,537,244.24Other operating income 74 35,006,543.09 36,884,782.93Non-recurrent operating income 5.14 76A
Cost of sales and services 60/66A 1,002,223,701.64 953,362,627.67Supplies and goods 60 22,723,692.92 17,709,693.85
Purchases 600/8 30,924,434.89 22,880,819.60Stocks: reduction (increase) (+)/(-) 609 -8,200,741.97 -5,171,125.75
Miscellaneous goods and services 61 612,077,964.56 608,239,746.45Salaries, social charges and pensions 5.14 62 141,224,764.32 117,382,806.64
630 170,571,896.54 160,703,462.55
631/4 -9,464,017.30 292,197.25
635/8 -5,228,070.27 1,213,135.64Other operating expenses 640/8 40,707,951.17 34,486,965.61
649Depreciation of goodwill 9960Non-recurrent operating expenses 5.14 66A 29,609,519.70 13,334,619.68
Operating profits (loss) (+)/(-) 9901 253.167.316,.53 238,012,075.22Financial income 75/76B 316,874.75 653,326.03
Recurrent financial income 75 316,874.75 653,326.03Income from financial fixed assets 750Income from current assets 751 186,935.03 272,832.62Other financial products 752/9 129,939.72 380,493.41Non-recurrent financial income 5.14 76B
Financial expenses 65/66B 34,083,056.71 39,672,427.70Recurrent financial expenses 65 34,083,056.71 39,672,357.70Debt charges 650 33,751,427.75 39,454,297.23Depreciation of goodwill 9961
651Other financial costs 652/9 331,628.96 218,060.47Non-recurrent financial expenses 5.14 66B 70.00
Profit (Loss) for the financial year before taxes (+)/(-) 9903 219,401,134.57 198,992,973.55Deductions on deferred taxes 780Transfer to deferred taxes 680Tax on the result (+)/(-) 67/77 58,479,597.59 69,635,990.50
Taxes 5.14 670/3 61,887,232.86 69,729,088.15Tax adjustments and writebacks of tax provisions 77 3,407,635.27 93,097.65
Profit (Loss) from the financial year (+)/(-) 9904 160,924,536.98 129,356,983.05Share in the result of companies accounted for using the equity method (+)/(-) 9975
Results in profit 99751Results in loss 99652
Consolidated profit (Consolidated loss) (+)/(-) 9976 160,921,536.98 129,356,983.05Share of third parties in the result (+)/(-) 99761
Share of the group in the results (+)/(-) 99762 160,921,536.98 129,356,983.05
Provisions for risks and expenses: allocations (usage and writebacks) (+)/(-)
Operating expenses transferred to assets as restructuring costs (-)
Writedowns of current assets other than stock, orders in progress and trade receivables: allocations (writebacks) (+)/(-)
BE 0543.696.579
Manufacturing work-in-progress, finished products and orders in progress: increase (reduction) (+)/(-)
Depreciation and writedowns of set-up costs on intangible and tangible fixed assets
Value writedowns on stock, orders in progress and trade receivables: allocations (writebacks) (+)/(-)
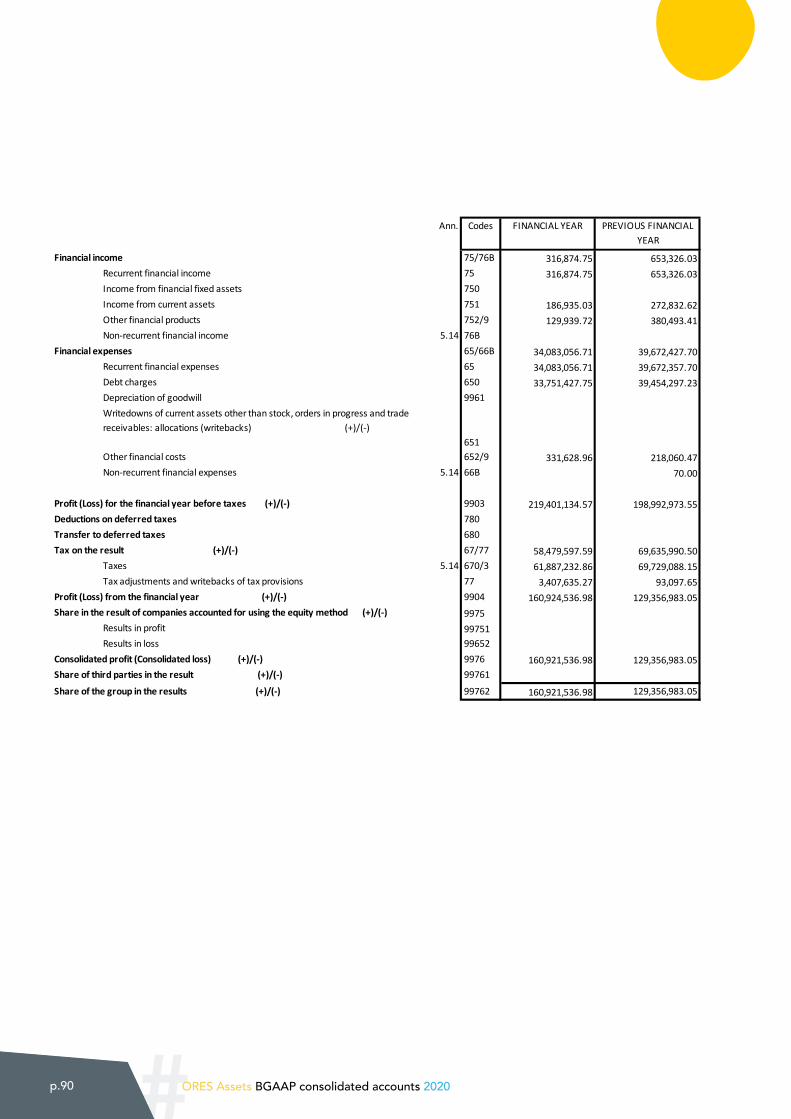
#p.90 ORES Assets BGAAP consolidated accounts 2020
N° C 2.1 CONSO 4
CONSOLIDATED PROFIT AND LOSS ACCOUNTbreakdown of operating results, based on their nature
Ann. Codes FINANCIAL YEAR PREVIOUS FINANCIAL YEAR
Sales and services 70/76A 1,255,391,018.17 1,191,374,702.89Turnover 5.14 70 1,218,454,787.27 1,152,951,122.78
71 5,247.21 -998,477.06Capitalised production 72 1,924,440.60 2,537,244.24Other operating income 74 35,006,543.09 36,884,782.93Non-recurrent operating income 5.14 76A
Cost of sales and services 60/66A 1,002,223,701.64 953,362,627.67Supplies and goods 60 22,723,692.92 17,709,693.85
Purchases 600/8 30,924,434.89 22,880,819.60Stocks: reduction (increase) (+)/(-) 609 -8,200,741.97 -5,171,125.75
Miscellaneous goods and services 61 612,077,964.56 608,239,746.45Salaries, social charges and pensions 5.14 62 141,224,764.32 117,382,806.64
630 170,571,896.54 160,703,462.55
631/4 -9,464,017.30 292,197.25
635/8 -5,228,070.27 1,213,135.64Other operating expenses 640/8 40,707,951.17 34,486,965.61
649Depreciation of goodwill 9960Non-recurrent operating expenses 5.14 66A 29,609,519.70 13,334,619.68
Operating profits (loss) (+)/(-) 9901 253.167.316,.53 238,012,075.22Financial income 75/76B 316,874.75 653,326.03
Recurrent financial income 75 316,874.75 653,326.03Income from financial fixed assets 750Income from current assets 751 186,935.03 272,832.62Other financial products 752/9 129,939.72 380,493.41Non-recurrent financial income 5.14 76B
Financial expenses 65/66B 34,083,056.71 39,672,427.70Recurrent financial expenses 65 34,083,056.71 39,672,357.70Debt charges 650 33,751,427.75 39,454,297.23Depreciation of goodwill 9961
651Other financial costs 652/9 331,628.96 218,060.47Non-recurrent financial expenses 5.14 66B 70.00
Profit (Loss) for the financial year before taxes (+)/(-) 9903 219,401,134.57 198,992,973.55Deductions on deferred taxes 780Transfer to deferred taxes 680Tax on the result (+)/(-) 67/77 58,479,597.59 69,635,990.50
Taxes 5.14 670/3 61,887,232.86 69,729,088.15Tax adjustments and writebacks of tax provisions 77 3,407,635.27 93,097.65
Profit (Loss) from the financial year (+)/(-) 9904 160,924,536.98 129,356,983.05Share in the result of companies accounted for using the equity method (+)/(-) 9975
Results in profit 99751Results in loss 99652
Consolidated profit (Consolidated loss) (+)/(-) 9976 160,921,536.98 129,356,983.05Share of third parties in the result (+)/(-) 99761
Share of the group in the results (+)/(-) 99762 160,921,536.98 129,356,983.05
Provisions for risks and expenses: allocations (usage and writebacks) (+)/(-)
Operating expenses transferred to assets as restructuring costs (-)
Writedowns of current assets other than stock, orders in progress and trade receivables: allocations (writebacks) (+)/(-)
BE 0543.696.579
Manufacturing work-in-progress, finished products and orders in progress: increase (reduction) (+)/(-)
Depreciation and writedowns of set-up costs on intangible and tangible fixed assets
Value writedowns on stock, orders in progress and trade receivables: allocations (writebacks) (+)/(-)
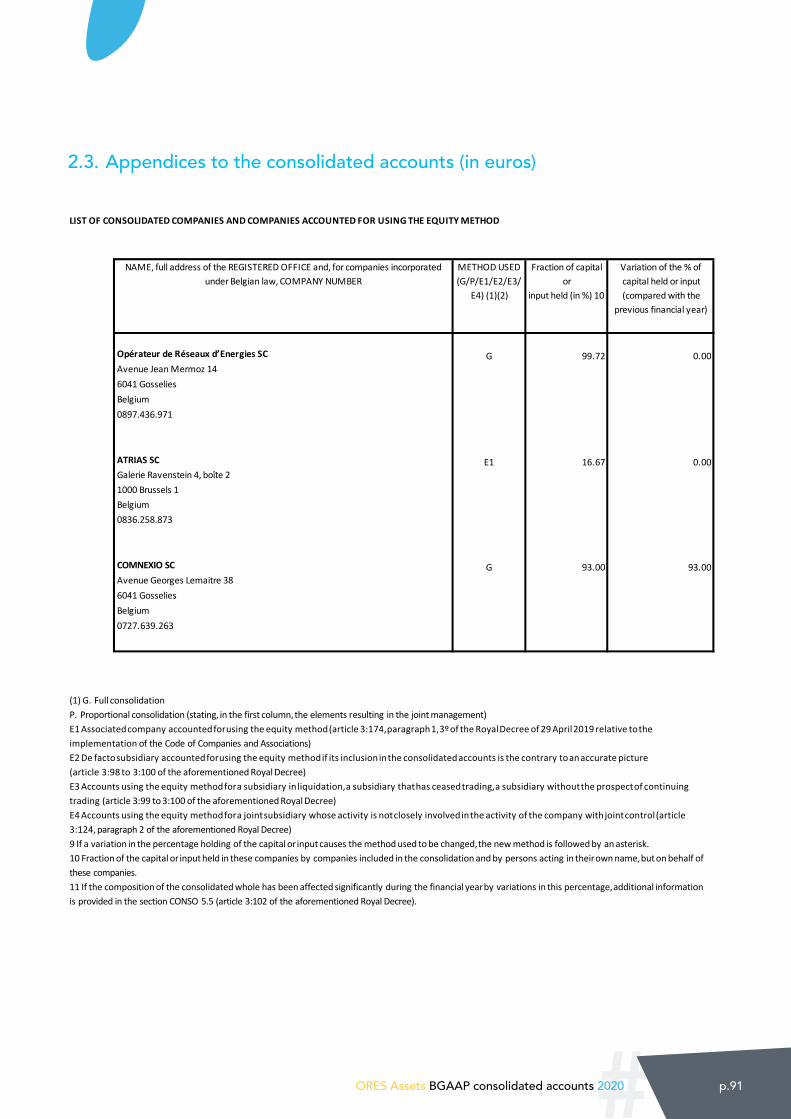
#ORES Assets BGAAP consolidated accounts 2020 p.91
2.3. Appendices to the consolidated accounts (in euros)N° C 2.1 CONSO 5.1
NOTES TO THE CONSOLIDATED FINANCIAL STATEMENTS
LIST OF CONSOLIDATED COMPANIES AND COMPANIES ACCOUNTED FOR USING THE EQUITY METHOD
METHOD USED (G/P/E1/E2/E3/
E4) (1)(2)
Fraction of capital or
input held (in %) 10
Variation of the % of capital held or input (compared with the
previous financial year)
G 99.72 0.00
E1 16.67 0.00
G 93.00 93.00
BE 0543.696.579
NAME, full address of the REGISTERED OFFICE and, for companies incorporated under Belgian law, COMPANY NUMBER
Opérateur de Réseaux d’Energies SC
Avenue Jean Mermoz 146041 GosseliesBelgium0897.436.971
ATRIAS SC
Galerie Ravenstein 4, boîte 21000 Brussels 1Belgium0836.258.873
COMNEXIO SC
Avenue Georges Lemaitre 386041 GosseliesBelgium0727.639.263
(1) G. Full consolidationP. Proportional consolidation (stating, in the first column, the elements resulting in the joint management)E1 Associated company accounted for using the equity method (article 3:174, paragraph 1, 3º of the Royal Decree of 29 April 2019 relative to the implementation of the Code of Companies and Associations)E2 De facto subsidiary accounted for using the equity method if its inclusion in the consolidated accounts is the contrary to an accurate picture (article 3:98 to 3:100 of the aforementioned Royal Decree)E3 Accounts using the equity method for a subsidiary in liquidation, a subsidiary that has ceased trading, a subsidiary without the prospect of continuing trading (article 3:99 to 3:100 of the aforementioned Royal Decree)E4 Accounts using the equity method for a joint subsidiary whose activity is not closely involved in the activity of the company with joint control (article 3:124, paragraph 2 of the aforementioned Royal Decree)9 If a variation in the percentage holding of the capital or input causes the method used to be changed, the new method is followed by an asterisk.10 Fraction of the capital or input held in these companies by companies included in the consolidation and by persons acting in their own name, but on behalf of these companies.11 If the composition of the consolidated whole has been affected significantly during the financial year by variations in this percentage, additional information is provided in the section CONSO 5.5 (article 3:102 of the aforementioned Royal Decree).
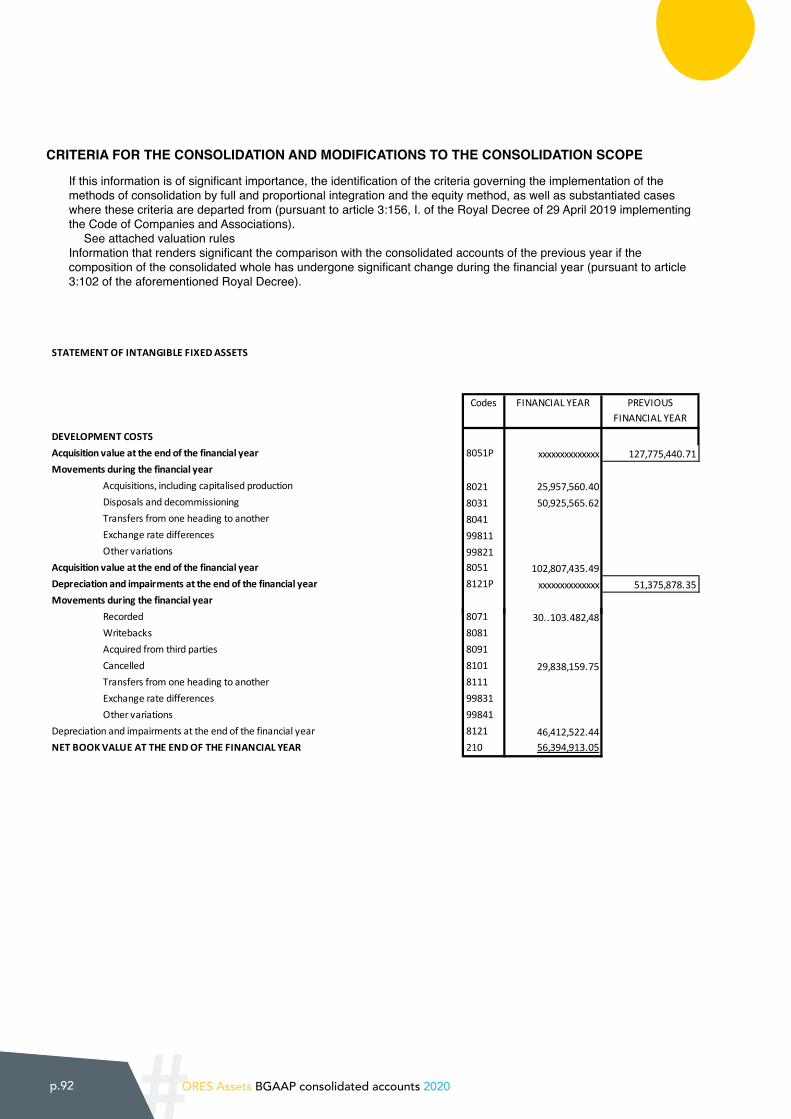
#p.92 ORES Assets BGAAP consolidated accounts 2020
CRITERIA FOR THE CONSOLIDATION AND MODIFICATIONS TO THE CONSOLIDATION SCOPE
If this information is of significant importance, the identification of the criteria governing the implementation of the methods of consolidation by full and proportional integration and the equity method, as well as substantiated cases where these criteria are departed from (pursuant to article 3:156, I. of the Royal Decree of 29 April 2019 implementing the Code of Companies and Associations).
See attached valuation rulesInformation that renders significant the comparison with the consolidated accounts of the previous year if the composition of the consolidated whole has undergone significant change during the financial year (pursuant to article 3:102 of the aforementioned Royal Decree).
N° C 2.1 CONSO 5.8.1
STATEMENT OF INTANGIBLE FIXED ASSETS
Codes FINANCIAL YEAR PREVIOUS FINANCIAL YEAR
DEVELOPMENT COSTSAcquisition value at the end of the financial year 8051P xxxxxxxxxxxxxx 127,775,440.71Movements during the financial year
Acquisitions, including capitalised production 8021 25,957,560.40Disposals and decommissioning 8031 50,925,565.62Transfers from one heading to another 8041Exchange rate differences 99811Other variations 99821
Acquisition value at the end of the financial year 8051 102,807,435.49Depreciation and impairments at the end of the financial year 8121P xxxxxxxxxxxxxx 51,375,878.35Movements during the financial year
Recorded 8071 30..103.482,48Writebacks 8081Acquired from third parties 8091Cancelled 8101 29,838,159.75Transfers from one heading to another 8111Exchange rate differences 99831Other variations 99841
Depreciation and impairments at the end of the financial year 8121 46,412,522.44NET BOOK VALUE AT THE END OF THE FINANCIAL YEAR 210 56,394,913.05
BE 0543.696.579
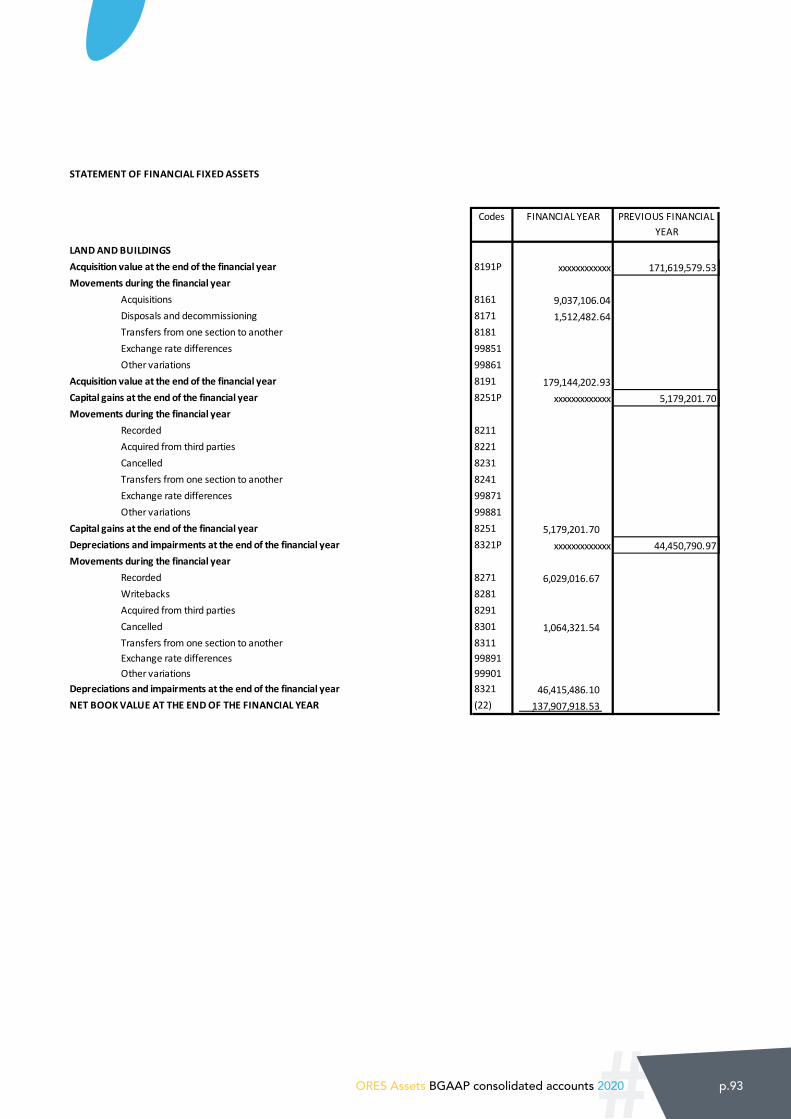
#ORES Assets BGAAP consolidated accounts 2020 p.93
N° C 2.1 CONSO 5.9.1
STATEMENT OF FINANCIAL FIXED ASSETS
Codes FINANCIAL YEAR PREVIOUS FINANCIAL YEAR
LAND AND BUILDINGSAcquisition value at the end of the financial year 8191P xxxxxxxxxxxx 171,619,579.53 Movements during the financial year
Acquisitions 8161 9,037,106.04 Disposals and decommissioning 8171 1,512,482.64 Transfers from one section to another 8181Exchange rate differences 99851Other variations 99861
Acquisition value at the end of the financial year 8191 179,144,202.93 Capital gains at the end of the financial year 8251P xxxxxxxxxxxxx 5,179,201.70 Movements during the financial year
Recorded 8211Acquired from third parties 8221Cancelled 8231Transfers from one section to another 8241Exchange rate differences 99871Other variations 99881
Capital gains at the end of the financial year 8251 5,179,201.70 Depreciations and impairments at the end of the financial year 8321P xxxxxxxxxxxxx 44,450,790.97 Movements during the financial year
Recorded 8271 6,029,016.67 Writebacks 8281Acquired from third parties 8291Cancelled 8301 1,064,321.54 Transfers from one section to another 8311Exchange rate differences 99891Other variations 99901
Depreciations and impairments at the end of the financial year 8321 46,415,486.10 NET BOOK VALUE AT THE END OF THE FINANCIAL YEAR (22) 137,907,918.53
BE 0543.696.579
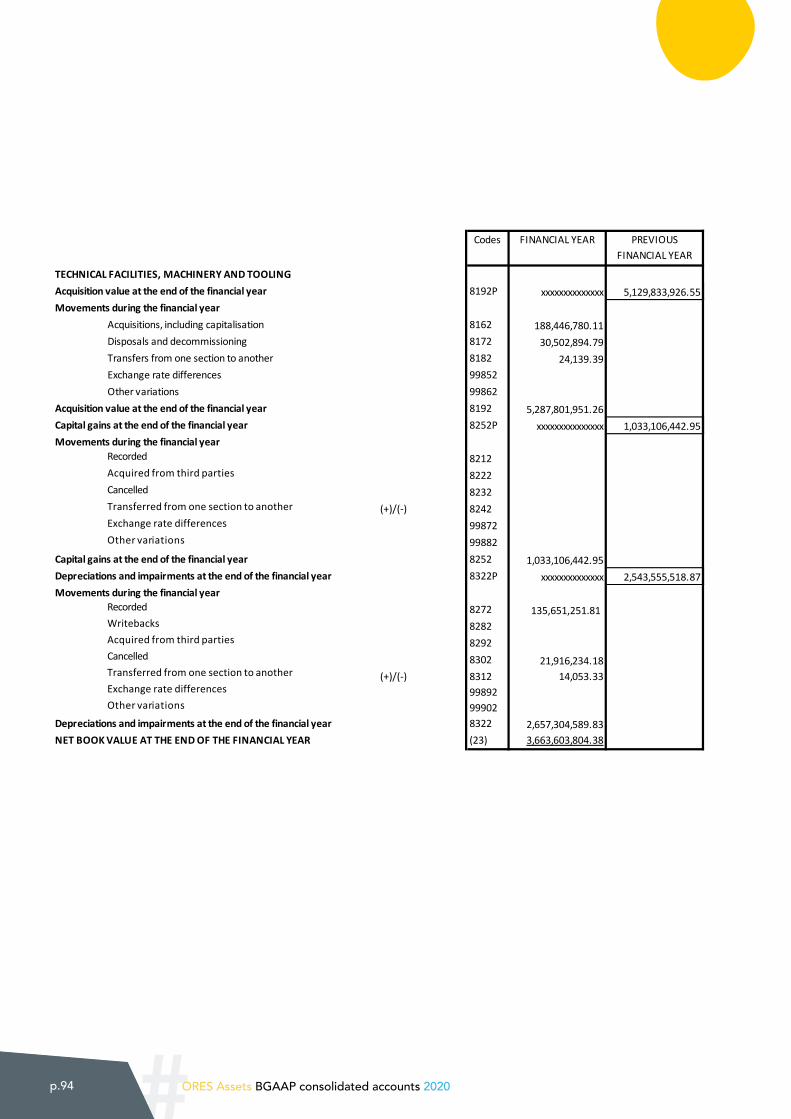
#p.94 ORES Assets BGAAP consolidated accounts 2020
N° C 2.1 CONSO 5.9.2
Codes FINANCIAL YEAR PREVIOUS FINANCIAL YEAR
TECHNICAL FACILITIES, MACHINERY AND TOOLINGAcquisition value at the end of the financial year 8192P xxxxxxxxxxxxxx 5,129,833,926.55Movements during the financial year
Acquisitions, including capitalisation 8162 188,446,780.11Disposals and decommissioning 8172 30,502,894.79Transfers from one section to another 8182 24,139.39Exchange rate differences 99852Other variations 99862
Acquisition value at the end of the financial year 8192 5,287,801,951.26Capital gains at the end of the financial year 8252P xxxxxxxxxxxxxxx 1,033,106,442.95Movements during the financial year
821282228232
(+)/(-) 824299872
RecordedAcquired from third partiesCancelledTransferred from one section to another Exchange rate differencesOther variations 99882
Capital gains at the end of the financial year 8252 1,033,106,442.95Depreciations and impairments at the end of the financial year 8322P xxxxxxxxxxxxxx 2,543,555,518.87Movements during the financial year
8272 135,651,251.81828282928302 21,916,234.18
(+)/(-) 8312 14,053.3399892
RecordedWritebacksAcquired from third partiesCancelledTransferred from one section to another Exchange rate differencesOther variations 99902
Depreciations and impairments at the end of the financial year 8322 2,657,304,589.83NET BOOK VALUE AT THE END OF THE FINANCIAL YEAR (23) 3,663,603,804.38
BE 0543.696.579

#ORES Assets BGAAP consolidated accounts 2020 p.95
N° C 2.1 CONSO 5.9.3
Codes FINANCIAL YEAR PREVIOUS FINANCIAL YEAR
FURNITURE AND VEHICLESAcquisition value at the end of the financial year 8193P xxxxxxxxxxxxx 162,433,137.70Movements during the financial year
Acquisitions, including capitalised production 8163 10,074,817.32Disposals and decommissioning 8173 2,524,524.08Transfers from one section to another 8183 -24,139.39Exchange rate differences 99853Other variations 99863 24,794.86
Acquisition value at the end of the financial year 8193 169,984,086.41Capital gains at the end of the financial year 8253P xxxxxxxxxxxxx 769,326.59Movements during the financial year
821382238233
(+)/(-) 824399873
RecordedAcquired from third partiesCancelledTransferred from one section to another Exchange rate differencesOther variations 99883
Capital gains at the end of the financial year 8253 769,326.59Depreciations and impairments at the end of the financial year 8323P xxxxxxxxxxxxx 128,834,069.01Movements during the financial year
8273 10,285,227.64828382938303 2,518,517.34
(+)/(-) 8313 -14,053.3399893
RecordedWritebacks Acquired from third partiesCancelledTransferred from one section to another Exchange rate differencesOther variations 99903 24,794.86
Depreciations and impairments at the end of the financial year 8323 136,611,520.84NET BOOK VALUE AT THE END OF THE FINANCIAL YEAR (24) 34,141,892.16
BE 0543.696.579
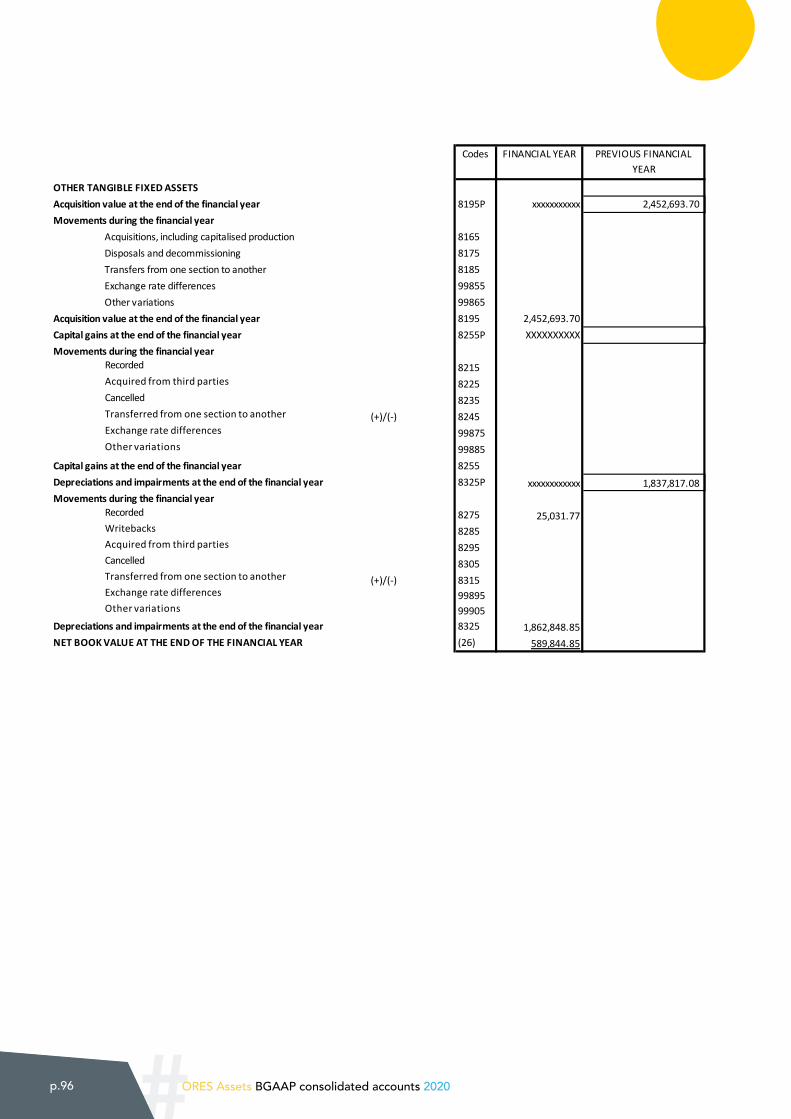
#p.96 ORES Assets BGAAP consolidated accounts 2020
N° C 2.1 CONSO 5.9.5
Codes FINANCIAL YEAR PREVIOUS FINANCIAL YEAR
OTHER TANGIBLE FIXED ASSETSAcquisition value at the end of the financial year 8195P xxxxxxxxxxx 2,452,693.70Movements during the financial year
Acquisitions, including capitalised production 8165Disposals and decommissioning 8175Transfers from one section to another 8185Exchange rate differences 99855Other variations 99865
Acquisition value at the end of the financial year 8195 2,452,693.70Capital gains at the end of the financial year 8255P XXXXXXXXXXMovements during the financial year
821582258235
(+)/(-) 824599875
RecordedAcquired from third partiesCancelledTransferred from one section to another Exchange rate differencesOther variations 99885
Capital gains at the end of the financial year 8255Depreciations and impairments at the end of the financial year 8325P xxxxxxxxxxxx 1,837,817.08Movements during the financial year
8275 25,031.77828582958305
(+)/(-) 831599895
RecordedWritebacks Acquired from third partiesCancelledTransferred from one section to another Exchange rate differencesOther variations 99905
Depreciations and impairments at the end of the financial year 8325 1,862,848.85NET BOOK VALUE AT THE END OF THE FINANCIAL YEAR (26) 589,844.85
BE 0543.696.579
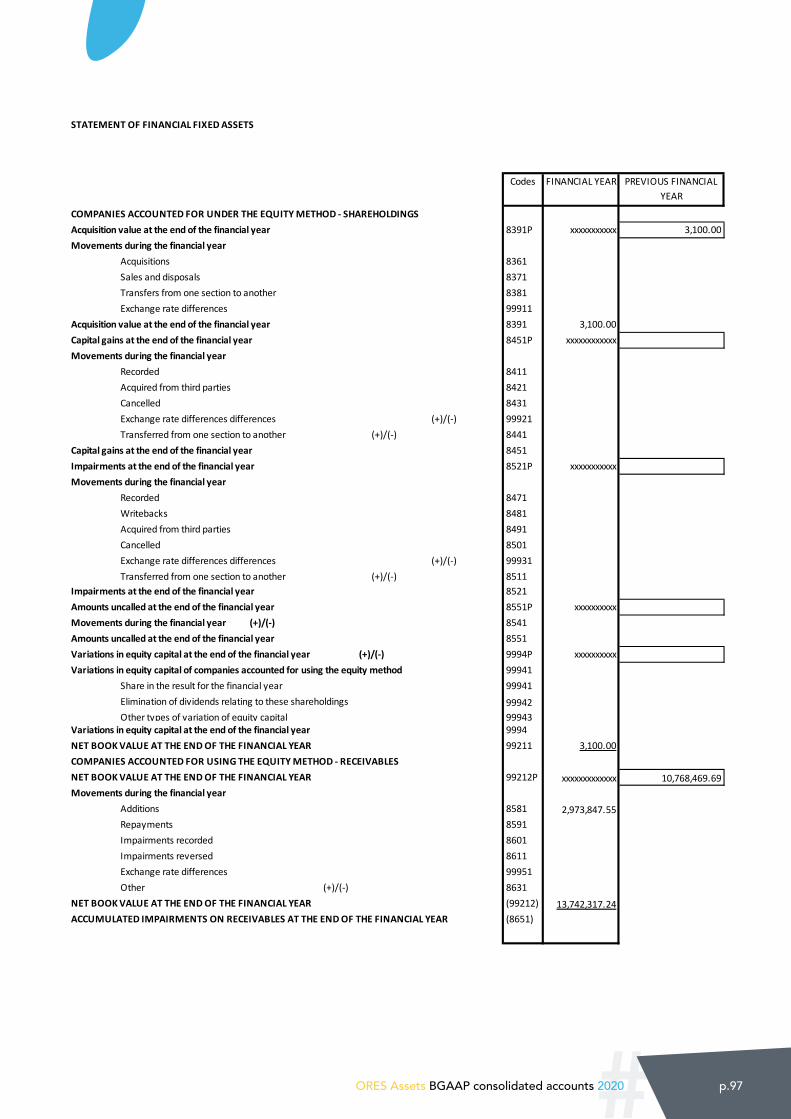
#ORES Assets BGAAP consolidated accounts 2020 p.97
N° C 2.1 CONSO 5.10.1
STATEMENT OF FINANCIAL FIXED ASSETS
Codes FINANCIAL YEAR PREVIOUS FINANCIAL YEAR
COMPANIES ACCOUNTED FOR UNDER THE EQUITY METHOD - SHAREHOLDINGSAcquisition value at the end of the financial year 8391P xxxxxxxxxxx 3,100.00Movements during the financial year
Acquisitions 8361Sales and disposals 8371Transfers from one section to another 8381Exchange rate differences 99911
Acquisition value at the end of the financial year 8391 3,100.00Capital gains at the end of the financial year 8451P xxxxxxxxxxxxMovements during the financial year
Recorded 8411Acquired from third parties 8421Cancelled 8431Exchange rate differences differences (+)/(-) 99921Transferred from one section to another (+)/(-) 8441
Capital gains at the end of the financial year 8451Impairments at the end of the financial year 8521P xxxxxxxxxxxMovements during the financial year
Recorded 8471Writebacks 8481Acquired from third parties 8491Cancelled 8501Exchange rate differences differences (+)/(-) 99931Transferred from one section to another (+)/(-) 8511
Impairments at the end of the financial year 8521Amounts uncalled at the end of the financial year 8551P xxxxxxxxxxMovements during the financial year (+)/(-) 8541Amounts uncalled at the end of the financial year 8551Variations in equity capital at the end of the financial year (+)/(-) 9994P xxxxxxxxxxVariations in equity capital of companies accounted for using the equity method 99941
Share in the result for the financial year 99941
99942Other types of variation of equity capital 99943
Variations in equity capital at the end of the financial year 9994NET BOOK VALUE AT THE END OF THE FINANCIAL YEAR 99211 3,100.00COMPANIES ACCOUNTED FOR USING THE EQUITY METHOD - RECEIVABLES NET BOOK VALUE AT THE END OF THE FINANCIAL YEAR 99212P xxxxxxxxxxxxx 10,768,469.69Movements during the financial year
Additions 8581 2,973,847.55Repayments 8591Impairments recorded 8601Impairments reversed 8611Exchange rate differences 99951Other (+)/(-) 8631
NET BOOK VALUE AT THE END OF THE FINANCIAL YEAR (99212) 13,742,317.24(8651)
BE 0543.696.579
Elimination of dividends relating to these shareholdings
ACCUMULATED IMPAIRMENTS ON RECEIVABLES AT THE END OF THE FINANCIAL YEAR
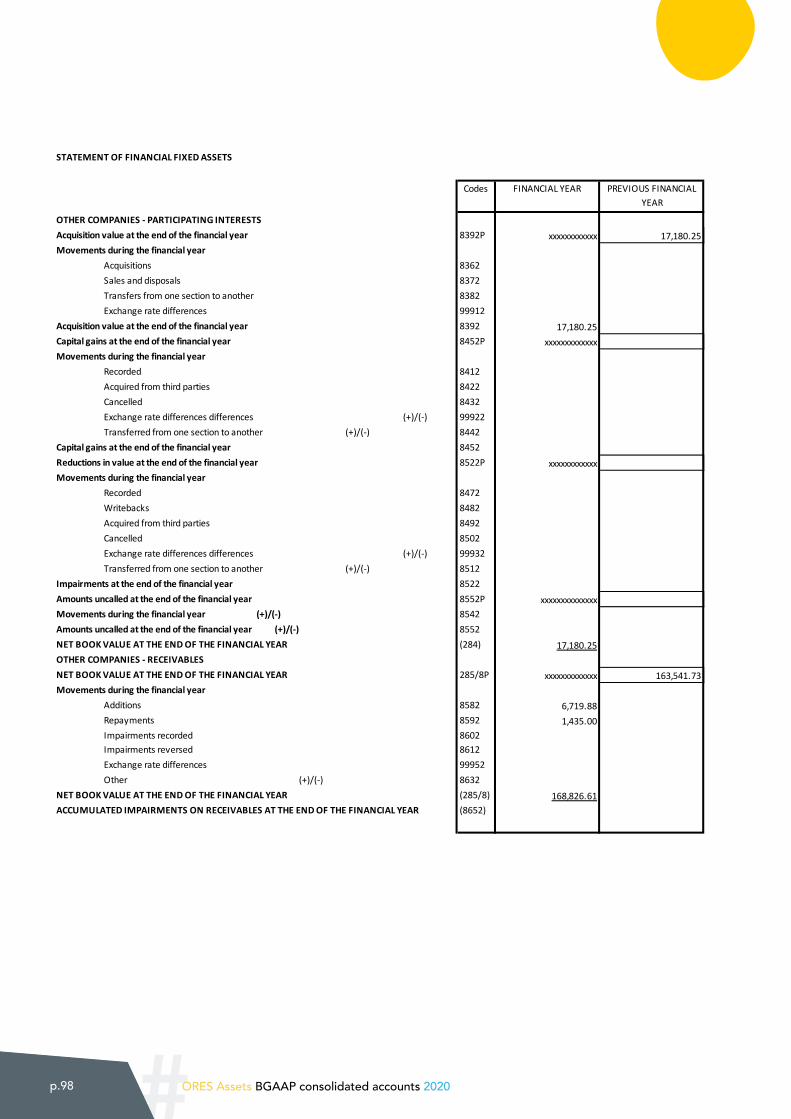
#p.98 ORES Assets BGAAP consolidated accounts 2020
N° C 2.1 CONSO 5.10.2
STATEMENT OF FINANCIAL FIXED ASSETS
Codes FINANCIAL YEAR PREVIOUS FINANCIAL YEAR
OTHER COMPANIES - PARTICIPATING INTERESTSAcquisition value at the end of the financial year 8392P xxxxxxxxxxxx 17,180.25Movements during the financial year
Acquisitions 8362Sales and disposals 8372Transfers from one section to another 8382Exchange rate differences 99912
Acquisition value at the end of the financial year 8392 17,180.25Capital gains at the end of the financial year 8452P xxxxxxxxxxxxxMovements during the financial year
Recorded 8412Acquired from third parties 8422Cancelled 8432Exchange rate differences differences (+)/(-) 99922Transferred from one section to another (+)/(-) 8442
Capital gains at the end of the financial year 8452Reductions in value at the end of the financial year 8522P xxxxxxxxxxxxMovements during the financial year
Recorded 8472Writebacks 8482Acquired from third parties 8492Cancelled 8502Exchange rate differences differences (+)/(-) 99932Transferred from one section to another (+)/(-) 8512
Impairments at the end of the financial year 8522Amounts uncalled at the end of the financial year 8552P xxxxxxxxxxxxxxMovements during the financial year (+)/(-) 8542Amounts uncalled at the end of the financial year (+)/(-) 8552NET BOOK VALUE AT THE END OF THE FINANCIAL YEAR (284) 17,180.25OTHER COMPANIES - RECEIVABLESNET BOOK VALUE AT THE END OF THE FINANCIAL YEAR 285/8P xxxxxxxxxxxxx 163,541.73Movements during the financial year
Additions 8582 6,719.88Repayments 8592 1,435.00Impairments recorded 8602Impairments reversed 8612Exchange rate differences 99952Other (+)/(-) 8632
NET BOOK VALUE AT THE END OF THE FINANCIAL YEAR (285/8) 168,826.61(8652)
BE 0543.696.579
ACCUMULATED IMPAIRMENTS ON RECEIVABLES AT THE END OF THE FINANCIAL YEAR
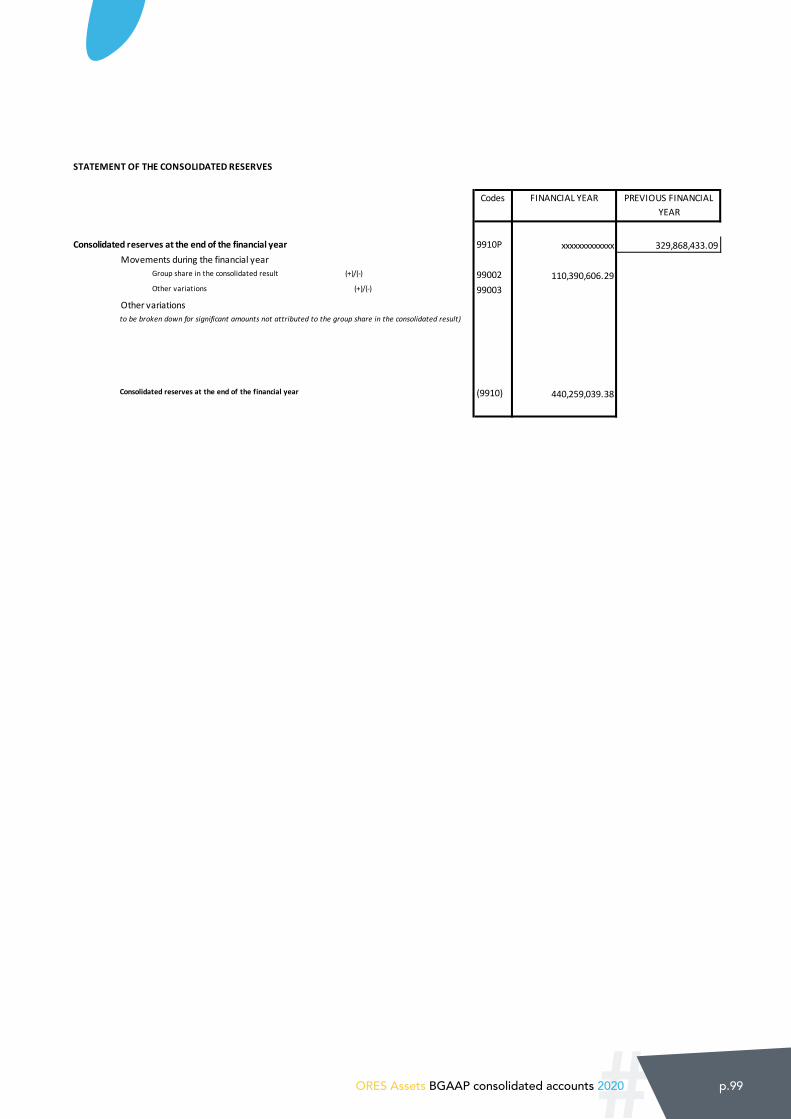
#ORES Assets BGAAP consolidated accounts 2020 p.99
N° C 2.1 CONSO 5.11
STATEMENT OF THE CONSOLIDATED RESERVES
Codes FINANCIAL YEAR PREVIOUS FINANCIAL YEAR
Consolidated reserves at the end of the financial year 9910P xxxxxxxxxxxxx 329,868,433.09Movements during the financial year
Group share in the consolidated result (+)/(-) 99002 110,390,606.29Other variations (+)/(-) 99003
Other variations
Consolidated reserves at the end of the financial year (9910) 440,259,039.38
BE 0543.696.579
to be broken down for significant amounts not attributed to the group share in the consolidated result)
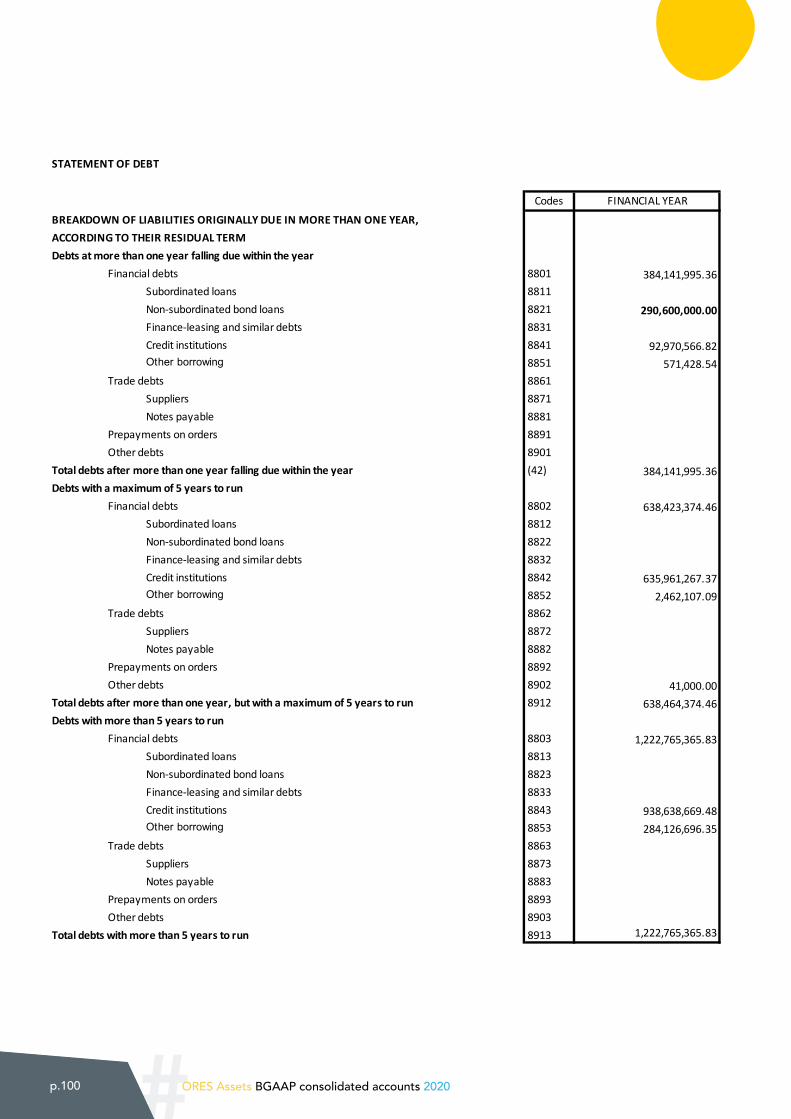
#p.100 ORES Assets BGAAP consolidated accounts 2020
N° C 2.1 CONSO 5.13
STATEMENT OF DEBT
Codes FINANCIAL YEAR
BREAKDOWN OF LIABILITIES ORIGINALLY DUE IN MORE THAN ONE YEAR, ACCORDING TO THEIR RESIDUAL TERMDebts at more than one year falling due within the year
Financial debts 8801 384,141,995.36Subordinated loans 8811Non-subordinated bond loans 8821 290,600,000.00Finance-leasing and similar debts 8831Credit institutions 8841 92,970,566.82Other borrowing 8851 571,428.54
Trade debts 8861Suppliers 8871Notes payable 8881
Prepayments on orders 8891Other debts 8901
Total debts after more than one year falling due within the year (42) 384,141,995.36Debts with a maximum of 5 years to run
Financial debts 8802 638,423,374.46Subordinated loans 8812Non-subordinated bond loans 8822Finance-leasing and similar debts 8832Credit institutions 8842 635,961,267.37Other borrowing 8852 2,462,107.09
Trade debts 8862Suppliers 8872Notes payable 8882
Prepayments on orders 8892Other debts 8902 41,000.00
8912 638,464,374.46Debts with more than 5 years to run
Financial debts 8803 1,222,765,365.83Subordinated loans 8813Non-subordinated bond loans 8823Finance-leasing and similar debts 8833Credit institutions 8843 938,638,669.48Other borrowing 8853 284,126,696.35
Trade debts 8863Suppliers 8873Notes payable 8883
Prepayments on orders 8893Other debts 8903
Total debts with more than 5 years to run 8913 1,222,765,365.83
BE 0543.696.579
Total debts after more than one year, but with a maximum of 5 years to run
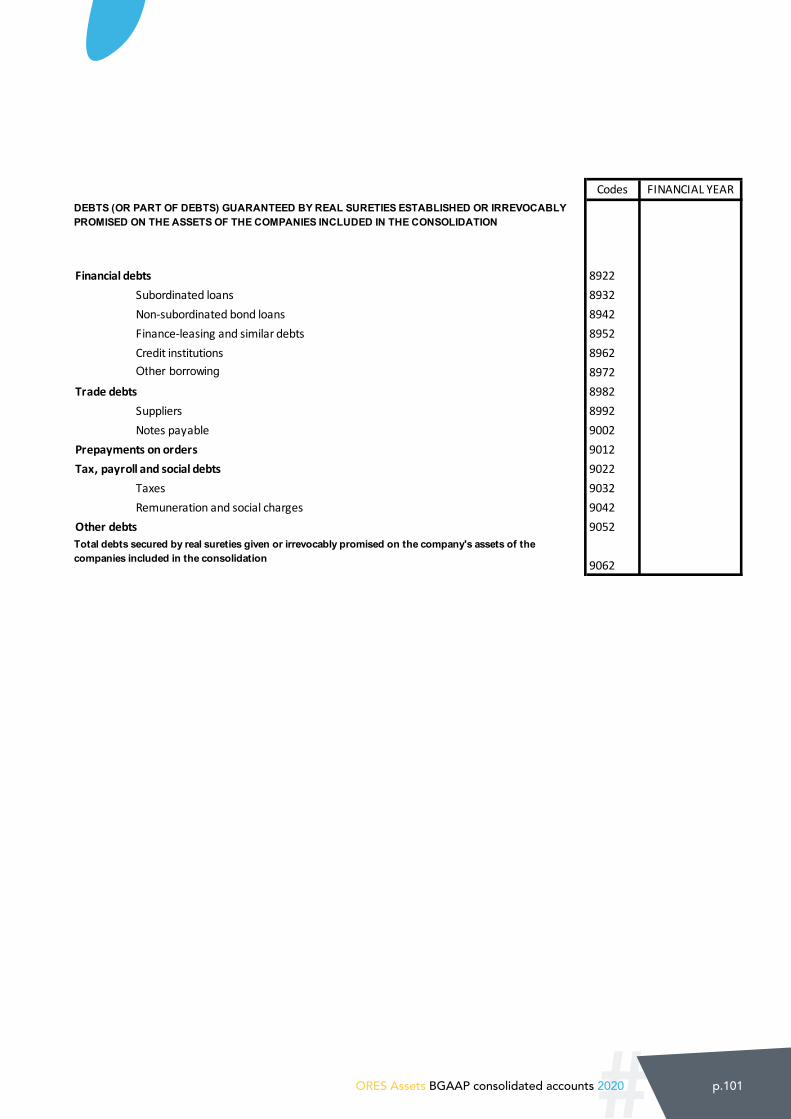
#ORES Assets BGAAP consolidated accounts 2020 p.101
N° C 2.1 CONSO 5.13
Codes FINANCIAL YEAR
Financial debts 8922Subordinated loans 8932Non-subordinated bond loans 8942Finance-leasing and similar debts 8952Credit institutions 8962Other borrowing 8972
Trade debts 8982Suppliers 8992Notes payable 9002
Prepayments on orders 9012Tax, payroll and social debts 9022
Taxes 9032Remuneration and social charges 9042
Other debts 9052
9062
BE 0543.696.579
DEBTS (OR PART OF DEBTS) GUARANTEED BY REAL SURETIES ESTABLISHED OR IRREVOCABLY PROMISED ON THE ASSETS OF THE COMPANIES INCLUDED IN THE CONSOLIDATION
Total debts secured by real sureties given or irrevocably promised on the company's assets of the companies included in the consolidation
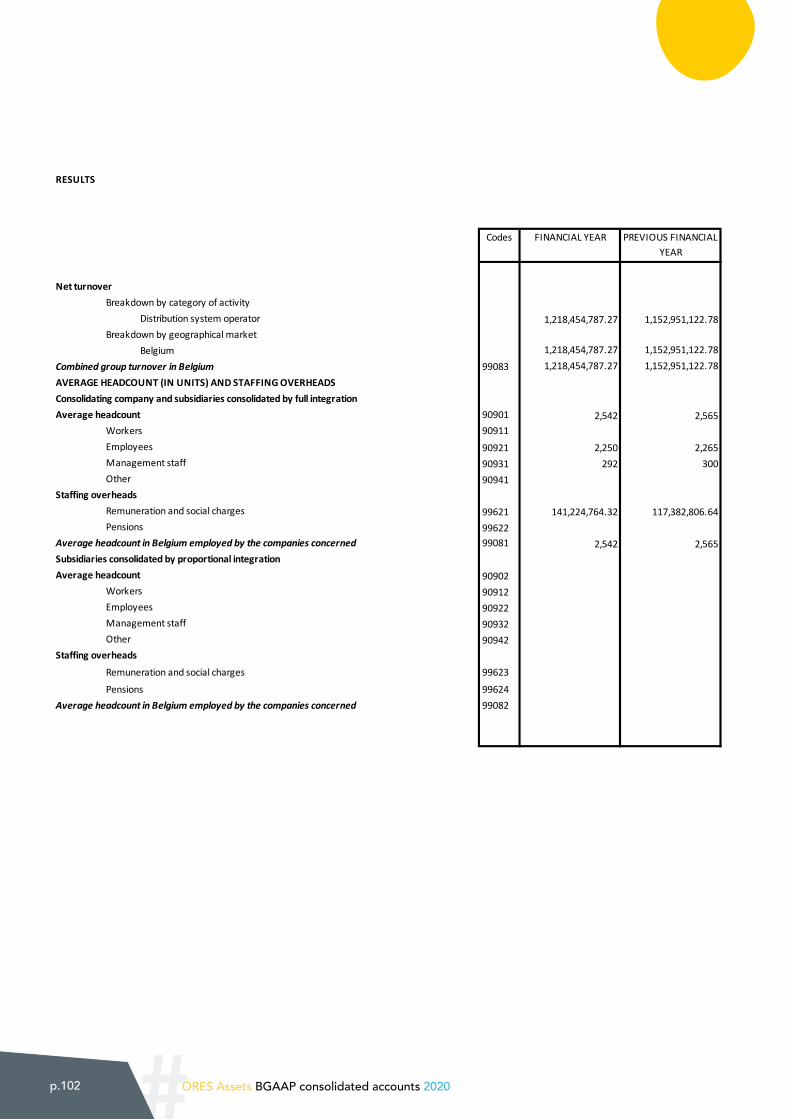
#p.102 ORES Assets BGAAP consolidated accounts 2020
N° C 2.1 CONSO 5.14
RESULTS
Codes FINANCIAL YEAR PREVIOUS FINANCIAL YEAR
Net turnoverBreakdown by category of activity
Distribution system operator 1,218,454,787.27 1,152,951,122.78Breakdown by geographical market
BelgiumCombined group turnover in Belgium 99083
1,218,454,787.27 1,152,951,122.78
AVERAGE HEADCOUNT (IN UNITS) AND STAFFING OVERHEADSConsolidating company and subsidiaries consolidated by full integrationAverage headcount 90901 2,542 2,565
Workers 90911Employees 90921 2,250 2,265Management staff 90931 292 300Other 90941
Staffing overheadsRemuneration and social charges 99621 141,224,764.32 117,382,806.64Pensions 99622
Average headcount in Belgium employed by the companies concerned 99081 2,542 2,565Subsidiaries consolidated by proportional integrationAverage headcount 90902
Workers 90912Employees 90922Management staff 90932Other 90942
Staffing overheads
Remuneration and social charges 99623
Pensions 99624Average headcount in Belgium employed by the companies concerned 99082
BE 0543.696.579
1,218,454,787.27 1,152,951,122.78
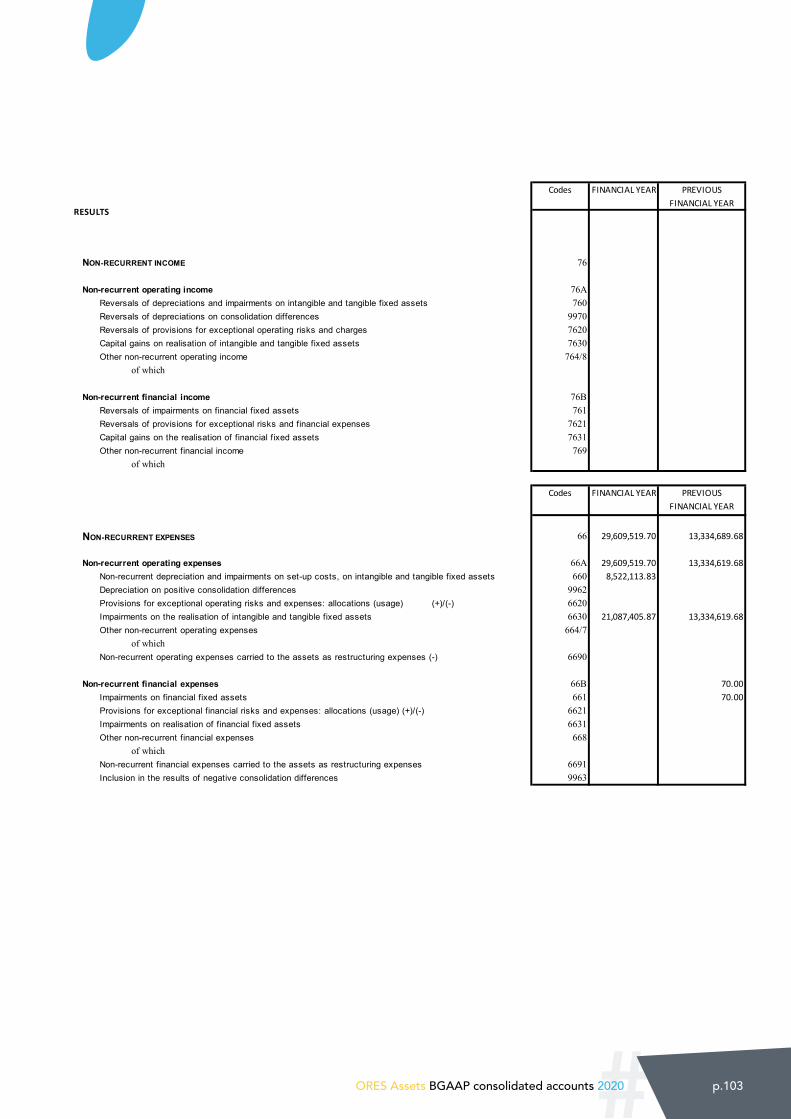
#ORES Assets BGAAP consolidated accounts 2020 p.103
N° C 2.1 CONSO 5.14
Codes FINANCIAL YEAR PREVIOUS
RESULTS
NON-RECURRENT INCOME 76
Non-recurrent operating income 76AReversals of depreciations and impairments on intangible and tangible fixed assets 760Reversals of depreciations on consolidation differences 9970Reversals of provisions for exceptional operating risks and charges 7620Capital gains on realisation of intangible and tangible fixed assets 7630Other non-recurrent operating income 764/8
of which
Non-recurrent financial income 76BReversals of impairments on financial fixed assets 761Reversals of provisions for exceptional risks and financial expenses 7621Capital gains on the realisation of financial fixed assets 7631Other non-recurrent financial income 769
of which
Codes FINANCIAL YEAR PREVIOUS FINANCIAL YEAR
NON-RECURRENT EXPENSES 66 29,609,519.70 13,334,689.68
Non-recurrent operating expenses 66A 29,609,519.70 13,334,619.68Non-recurrent depreciation and impairments on set-up costs, on intangible and tangible fixed assets 660 8,522,113.83Depreciation on positive consolidation differences 9962Provisions for exceptional operating risks and expenses: allocations (usage) (+)/(-) 6620Impairments on the realisation of intangible and tangible fixed assets 6630 21,087,405.87 13,334,619.68Other non-recurrent operating expenses 664/7
of whichNon-recurrent operating expenses carried to the assets as restructuring expenses (-) 6690
Non-recurrent financial expenses 66B 70.00Impairments on financial fixed assets 661 70.00Provisions for exceptional financial risks and expenses: allocations (usage) (+)/(-) 6621Impairments on realisation of financial fixed assets 6631Other non-recurrent financial expenses 668
of whichNon-recurrent financial expenses carried to the assets as restructuring expenses 6691Inclusion in the results of negative consolidation differences 9963
BE 0543.696.579
FINANCIAL YEAR
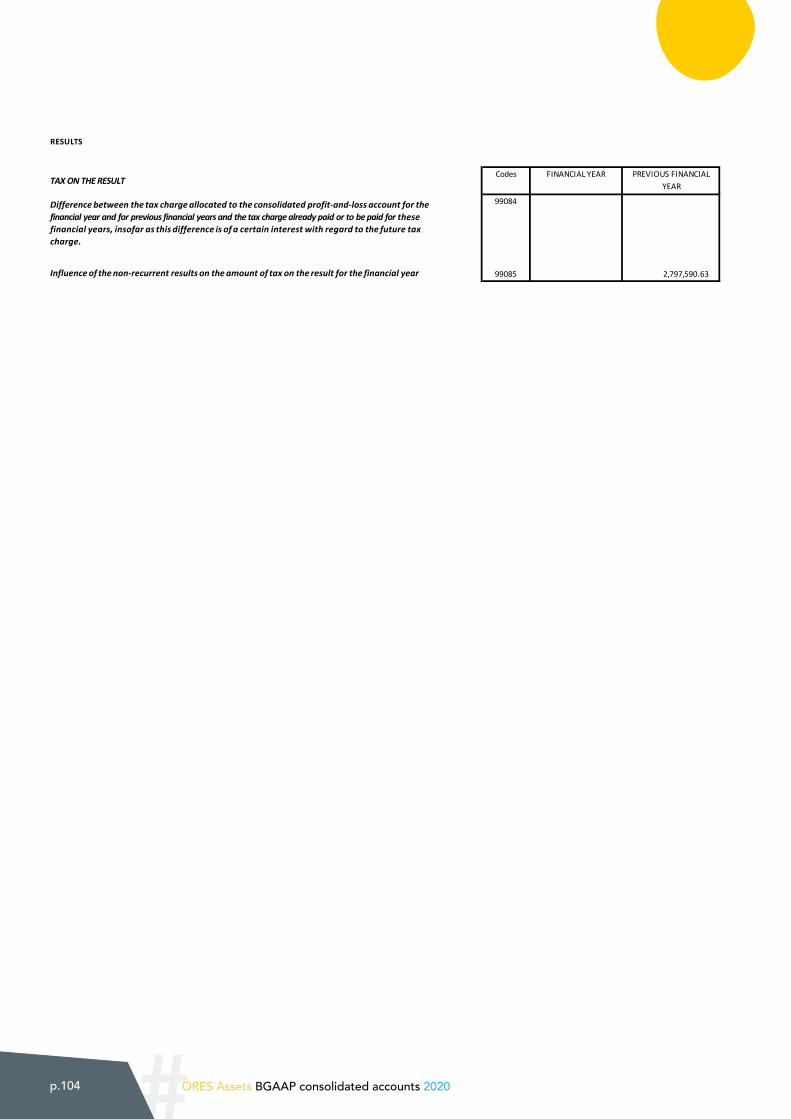
#p.104 ORES Assets BGAAP consolidated accounts 2020
N° C 2.1 CONSO 5.14
RESULTS
TAX ON THE RESULTCodes FINANCIAL YEAR PREVIOUS FINANCIAL
YEAR
99084
99085 2,797,590.63
BE 0543.696.579
Difference between the tax charge allocated to the consolidated profit-and-loss account for the financial year and for previous financial years and the tax charge already paid or to be paid for these financial years, insofar as this difference is of a certain interest with regard to the future tax charge.
Influence of the non-recurrent results on the amount of tax on the result for the financial year
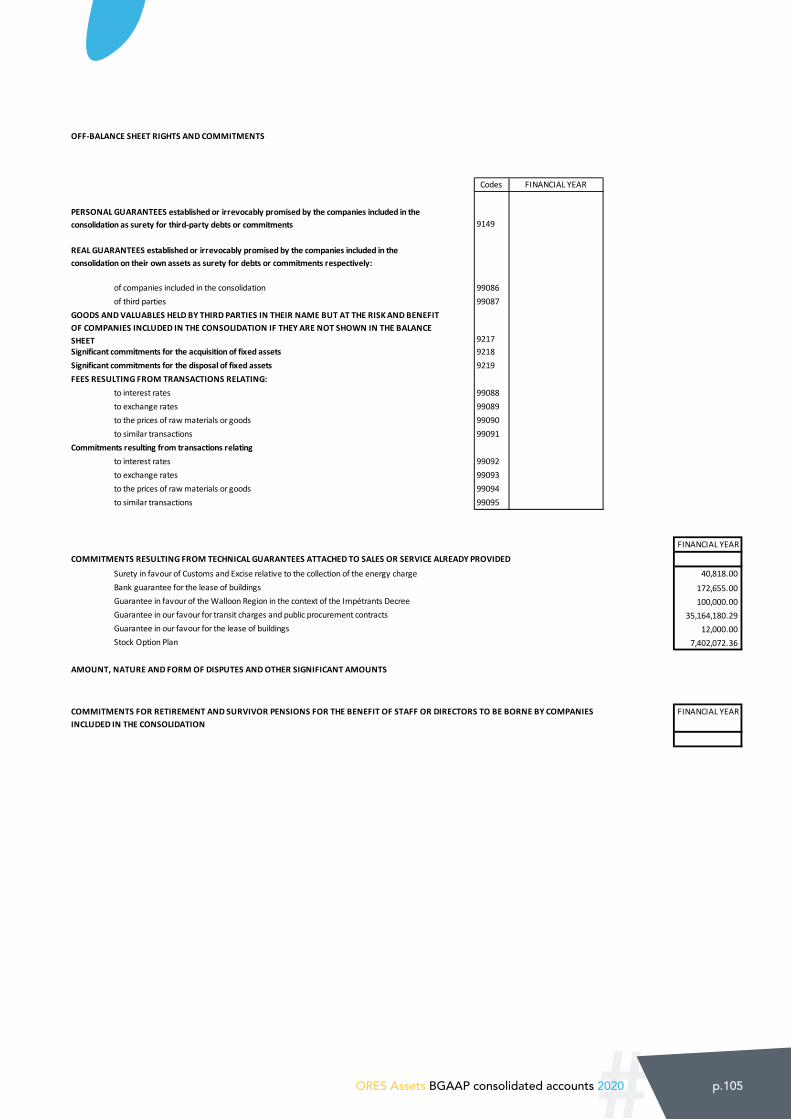
#ORES Assets BGAAP consolidated accounts 2020 p.105
N° C 2.1 CONSO 5.15
OFF-BALANCE SHEET RIGHTS AND COMMITMENTS
Codes FINANCIAL YEAR
9149
of companies included in the consolidation 99086of third parties 99087
9217Significant commitments for the acquisition of fixed assets 9218Significant commitments for the disposal of fixed assets 9219FEES RESULTING FROM TRANSACTIONS RELATING:
to interest rates 99088to exchange rates 99089to the prices of raw materials or goods 99090to similar transactions 99091
Commitments resulting from transactions relatingto interest rates 99092to exchange rates 99093to the prices of raw materials or goods 99094to similar transactions 99095
FINANCIAL YEAR
COMMITMENTS RESULTING FROM TECHNICAL GUARANTEES ATTACHED TO SALES OR SERVICE ALREADY PROVIDED
Surety in favour of Customs and Excise relative to the collection of the energy charge 40,818.00Bank guarantee for the lease of buildings 172,655.00Guarantee in favour of the Walloon Region in the context of the Impétrants Decree 100,000.00Guarantee in our favour for transit charges and public procurement contracts 35,164,180.29
12,000.007,402,072.36
AMOUNT, NATURE AND FORM OF DISPUTES AND OTHER SIGNIFICANT AMOUNTS
FINANCIAL YEAR
FINANCIAL YEAR
Guarantee in our favour for the lease of buildings
COMMITMENTS FOR RETIREMENT AND SURVIVOR PENSIONS FOR THE BENEFIT OF STAFF OR DIRECTORS TO BE BORNE BY COMPANIES INCLUDED IN THE CONSOLIDATION
BE 0543.696.579
PERSONAL GUARANTEES established or irrevocably promised by the companies included in the consolidation as surety for third-party debts or commitments
REAL GUARANTEES established or irrevocably promised by the companies included in the consolidation on their own assets as surety for debts or commitments respectively:
GOODS AND VALUABLES HELD BY THIRD PARTIES IN THEIR NAME BUT AT THE RISK AND BENEFIT OF COMPANIES INCLUDED IN THE CONSOLIDATION IF THEY ARE NOT SHOWN IN THE BALANCE SHEET
Stock Option Plan
NATURE, COMMERCIAL OBJECTIVE AND FINANCIAL CONSEQUENCES OF TRANSACTIONS NOT RECORDED ON THE BALANCE SHEETOn condition that the risks or benefits arising from such transactions are significant and insofar as the disclosure of risks or benefits is necessary to assess the financial situation of the companies included in the consolidation
RIGHTS AND OFF-BALANCE SHEET COMMITMENTS
NATURE AND FINANCIAL IMPACT OF SIGNIFICANT POST-CLOSING EVENTS, not included in the balance sheet or the profit-and-loss account
Since mid-March 2020, as part of the measures to fight the COVID-19 virus adopted by the National Security Council, as well as the federal and Walloon authorities, ORES has made a series of provisions designed, on the one hand, to safeguard the health of its staff and that of its customers and, on the other, to ensure its public service tasks can be carried out under these exceptional circumstances. We should note, among other things, the widespread application of homeworking for eligible employees; in spring 2020, there was the deferral of non-urgent works and technical activities, followed by the gradual and safe reopening of worksites; the maintenance of supervised face-to-face reception for customers with a budget meter, adjustments to the organisation of on-call services providing for the repair of breakdowns and gas leaks, the handling of incidents on the network and any works essential for guaranteeing access to energy 24 hours a day, 7 days a week. During the 2020 financial year, despite the impact it had on the global economy and its indicators, COVID-19 had no financial impact that might jeopardise the continuity of the company. The impact of COVID-19 in 2021 is likely to be similar and hence should also not jeopardise the continuity of the company.
FINANCIAL YEAR

#p.106 ORES Assets BGAAP consolidated accounts 2020
N° C 2.1 CONSO 5.15
OFF-BALANCE SHEET RIGHTS AND COMMITMENTS
Codes FINANCIAL YEAR
9149
of companies included in the consolidation 99086of third parties 99087
9217Significant commitments for the acquisition of fixed assets 9218Significant commitments for the disposal of fixed assets 9219FEES RESULTING FROM TRANSACTIONS RELATING:
to interest rates 99088to exchange rates 99089to the prices of raw materials or goods 99090to similar transactions 99091
Commitments resulting from transactions relatingto interest rates 99092to exchange rates 99093to the prices of raw materials or goods 99094to similar transactions 99095
FINANCIAL YEAR
COMMITMENTS RESULTING FROM TECHNICAL GUARANTEES ATTACHED TO SALES OR SERVICE ALREADY PROVIDED
Surety in favour of Customs and Excise relative to the collection of the energy charge 40,818.00Bank guarantee for the lease of buildings 172,655.00Guarantee in favour of the Walloon Region in the context of the Impétrants Decree 100,000.00Guarantee in our favour for transit charges and public procurement contracts 35,164,180.29
12,000.007,402,072.36
AMOUNT, NATURE AND FORM OF DISPUTES AND OTHER SIGNIFICANT AMOUNTS
FINANCIAL YEAR
FINANCIAL YEAR
Guarantee in our favour for the lease of buildings
COMMITMENTS FOR RETIREMENT AND SURVIVOR PENSIONS FOR THE BENEFIT OF STAFF OR DIRECTORS TO BE BORNE BY COMPANIES INCLUDED IN THE CONSOLIDATION
BE 0543.696.579
PERSONAL GUARANTEES established or irrevocably promised by the companies included in the consolidation as surety for third-party debts or commitments
REAL GUARANTEES established or irrevocably promised by the companies included in the consolidation on their own assets as surety for debts or commitments respectively:
GOODS AND VALUABLES HELD BY THIRD PARTIES IN THEIR NAME BUT AT THE RISK AND BENEFIT OF COMPANIES INCLUDED IN THE CONSOLIDATION IF THEY ARE NOT SHOWN IN THE BALANCE SHEET
Stock Option Plan
NATURE, COMMERCIAL OBJECTIVE AND FINANCIAL CONSEQUENCES OF TRANSACTIONS NOT RECORDED ON THE BALANCE SHEETOn condition that the risks or benefits arising from such transactions are significant and insofar as the disclosure of risks or benefits is necessary to assess the financial situation of the companies included in the consolidation
RIGHTS AND OFF-BALANCE SHEET COMMITMENTS
NATURE AND FINANCIAL IMPACT OF SIGNIFICANT POST-CLOSING EVENTS, not included in the balance sheet or the profit-and-loss account
Since mid-March 2020, as part of the measures to fight the COVID-19 virus adopted by the National Security Council, as well as the federal and Walloon authorities, ORES has made a series of provisions designed, on the one hand, to safeguard the health of its staff and that of its customers and, on the other, to ensure its public service tasks can be carried out under these exceptional circumstances. We should note, among other things, the widespread application of homeworking for eligible employees; in spring 2020, there was the deferral of non-urgent works and technical activities, followed by the gradual and safe reopening of worksites; the maintenance of supervised face-to-face reception for customers with a budget meter, adjustments to the organisation of on-call services providing for the repair of breakdowns and gas leaks, the handling of incidents on the network and any works essential for guaranteeing access to energy 24 hours a day, 7 days a week. During the 2020 financial year, despite the impact it had on the global economy and its indicators, COVID-19 had no financial impact that might jeopardise the continuity of the company. The impact of COVID-19 in 2021 is likely to be similar and hence should also not jeopardise the continuity of the company.
FINANCIAL YEAR
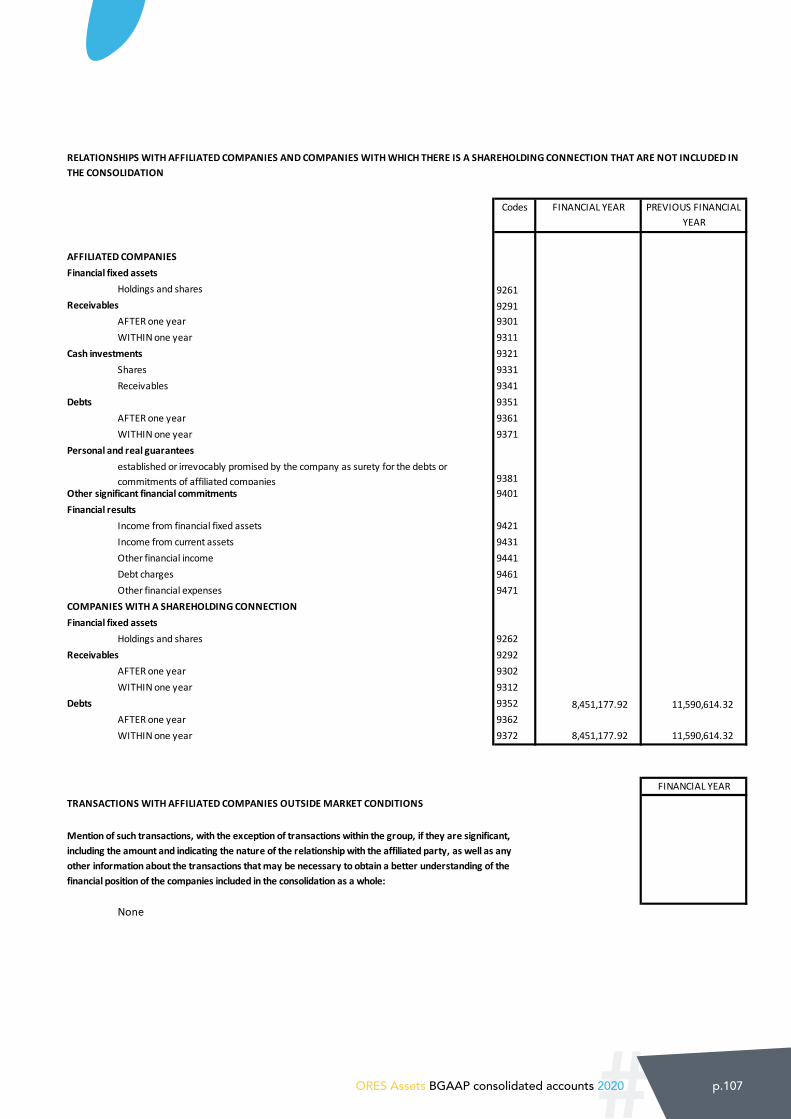
#ORES Assets BGAAP consolidated accounts 2020 p.107
N° C 2.1 CONSO 5.15
OFF-BALANCE SHEET RIGHTS AND COMMITMENTS
Codes FINANCIAL YEAR
9149
of companies included in the consolidation 99086of third parties 99087
9217Significant commitments for the acquisition of fixed assets 9218Significant commitments for the disposal of fixed assets 9219FEES RESULTING FROM TRANSACTIONS RELATING:
to interest rates 99088to exchange rates 99089to the prices of raw materials or goods 99090to similar transactions 99091
Commitments resulting from transactions relatingto interest rates 99092to exchange rates 99093to the prices of raw materials or goods 99094to similar transactions 99095
FINANCIAL YEAR
COMMITMENTS RESULTING FROM TECHNICAL GUARANTEES ATTACHED TO SALES OR SERVICE ALREADY PROVIDED
Surety in favour of Customs and Excise relative to the collection of the energy charge 40,818.00Bank guarantee for the lease of buildings 172,655.00Guarantee in favour of the Walloon Region in the context of the Impétrants Decree 100,000.00Guarantee in our favour for transit charges and public procurement contracts 35,164,180.29
12,000.007,402,072.36
AMOUNT, NATURE AND FORM OF DISPUTES AND OTHER SIGNIFICANT AMOUNTS
FINANCIAL YEAR
FINANCIAL YEAR
Guarantee in our favour for the lease of buildings
COMMITMENTS FOR RETIREMENT AND SURVIVOR PENSIONS FOR THE BENEFIT OF STAFF OR DIRECTORS TO BE BORNE BY COMPANIES INCLUDED IN THE CONSOLIDATION
BE 0543.696.579
PERSONAL GUARANTEES established or irrevocably promised by the companies included in the consolidation as surety for third-party debts or commitments
REAL GUARANTEES established or irrevocably promised by the companies included in the consolidation on their own assets as surety for debts or commitments respectively:
GOODS AND VALUABLES HELD BY THIRD PARTIES IN THEIR NAME BUT AT THE RISK AND BENEFIT OF COMPANIES INCLUDED IN THE CONSOLIDATION IF THEY ARE NOT SHOWN IN THE BALANCE SHEET
Stock Option Plan
NATURE, COMMERCIAL OBJECTIVE AND FINANCIAL CONSEQUENCES OF TRANSACTIONS NOT RECORDED ON THE BALANCE SHEETOn condition that the risks or benefits arising from such transactions are significant and insofar as the disclosure of risks or benefits is necessary to assess the financial situation of the companies included in the consolidation
RIGHTS AND OFF-BALANCE SHEET COMMITMENTS
NATURE AND FINANCIAL IMPACT OF SIGNIFICANT POST-CLOSING EVENTS, not included in the balance sheet or the profit-and-loss account
Since mid-March 2020, as part of the measures to fight the COVID-19 virus adopted by the National Security Council, as well as the federal and Walloon authorities, ORES has made a series of provisions designed, on the one hand, to safeguard the health of its staff and that of its customers and, on the other, to ensure its public service tasks can be carried out under these exceptional circumstances. We should note, among other things, the widespread application of homeworking for eligible employees; in spring 2020, there was the deferral of non-urgent works and technical activities, followed by the gradual and safe reopening of worksites; the maintenance of supervised face-to-face reception for customers with a budget meter, adjustments to the organisation of on-call services providing for the repair of breakdowns and gas leaks, the handling of incidents on the network and any works essential for guaranteeing access to energy 24 hours a day, 7 days a week. During the 2020 financial year, despite the impact it had on the global economy and its indicators, COVID-19 had no financial impact that might jeopardise the continuity of the company. The impact of COVID-19 in 2021 is likely to be similar and hence should also not jeopardise the continuity of the company.
FINANCIAL YEAR
N° C 2.1 CONSO 5.16
Codes FINANCIAL YEAR PREVIOUS FINANCIAL YEAR
AFFILIATED COMPANIESFinancial fixed assets
Holdings and shares 9261Receivables 9291
AFTER one year 9301WITHIN one year 9311
Cash investments 9321Shares 9331Receivables 9341
Debts 9351AFTER one year 9361WITHIN one year 9371
Personal and real guarantees
9381Other significant financial commitments 9401Financial results
Income from financial fixed assets 9421Income from current assets 9431Other financial income 9441Debt charges 9461Other financial expenses 9471
COMPANIES WITH A SHAREHOLDING CONNECTIONFinancial fixed assets
Holdings and shares 9262Receivables 9292
AFTER one year 9302WITHIN one year 9312
Debts 9352 8,451,177.92 11,590,614.32 AFTER one year 9362WITHIN one year 9372 8,451,177.92 11,590,614.32
FINANCIAL YEAR
None
BE 0543.696.579
established or irrevocably promised by the company as surety for the debts or commitments of affiliated companies
RELATIONSHIPS WITH AFFILIATED COMPANIES AND COMPANIES WITH WHICH THERE IS A SHAREHOLDING CONNECTION THAT ARE NOT INCLUDED IN THE CONSOLIDATION
TRANSACTIONS WITH AFFILIATED COMPANIES OUTSIDE MARKET CONDITIONS
Mention of such transactions, with the exception of transactions within the group, if they are significant, including the amount and indicating the nature of the relationship with the affiliated party, as well as any other information about the transactions that may be necessary to obtain a better understanding of the financial position of the companies included in the consolidation as a whole:
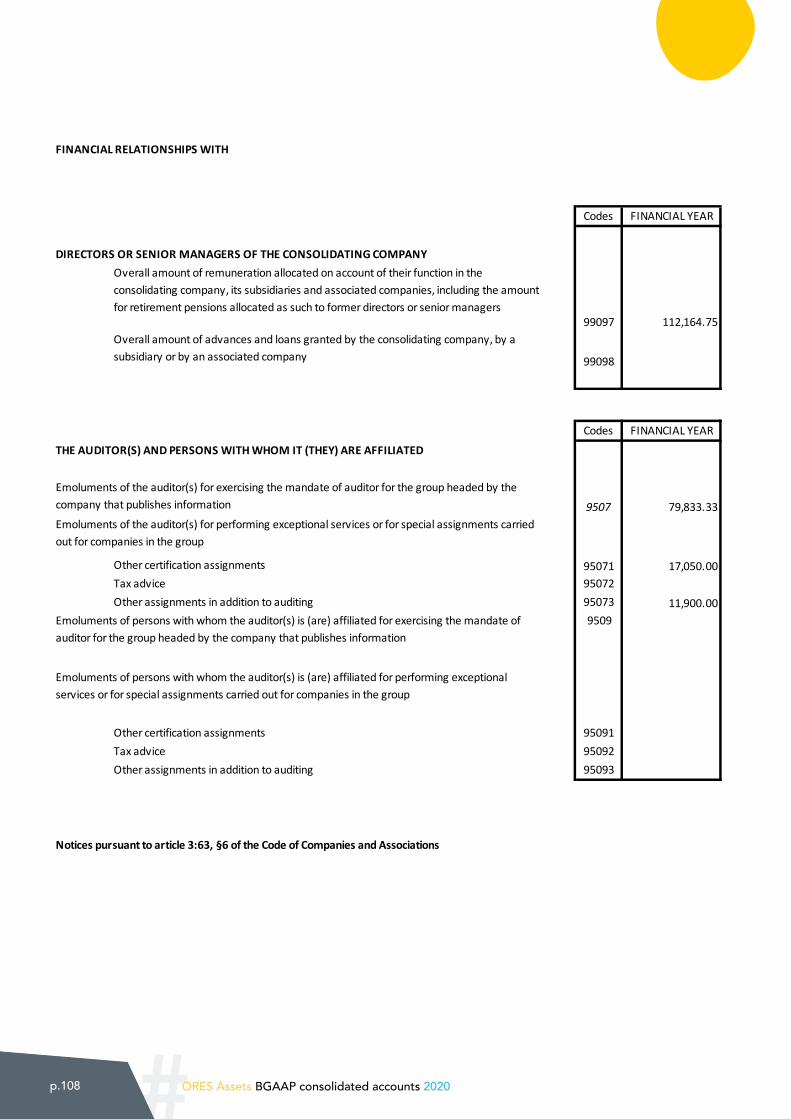
#p.108 ORES Assets BGAAP consolidated accounts 2020
N° C 2.1 CONSO 5.17
FINANCIAL RELATIONSHIPS WITH
Codes FINANCIAL YEAR
99097 112,164.75
99098
Codes FINANCIAL YEAR
THE AUDITOR(S) AND PERSONS WITH WHOM IT (THEY) ARE AFFILIATED
9507 79,833.33
Other certification assignments 95071 17,050.00 Tax advice 95072Other assignments in addition to auditing 95073 11,900.00
9509
Other certification assignments 95091Tax advice 95092Other assignments in addition to auditing 95093
Notices pursuant to article 3:63, §6 of the Code of Companies and Associations
BE 0543.696.579
DIRECTORS OR SENIOR MANAGERS OF THE CONSOLIDATING COMPANYOverall amount of remuneration allocated on account of their function in the consolidating company, its subsidiaries and associated companies, including the amount for retirement pensions allocated as such to former directors or senior managers
Overall amount of advances and loans granted by the consolidating company, by a subsidiary or by an associated company
Emoluments of the auditor(s) for performing exceptional services or for special assignments carried out for companies in the group
Emoluments of the auditor(s) for exercising the mandate of auditor for the group headed by the company that publishes information
Emoluments of persons with whom the auditor(s) is (are) affiliated for exercising the mandate of auditor for the group headed by the company that publishes information
Emoluments of persons with whom the auditor(s) is (are) affiliated for performing exceptional services or for special assignments carried out for companies in the group

#ORES Assets BGAAP consolidated accounts 2020 p.109
N° C 2.1 CONSO 5.17
FINANCIAL RELATIONSHIPS WITH
Codes FINANCIAL YEAR
99097 112,164.75
99098
Codes FINANCIAL YEAR
THE AUDITOR(S) AND PERSONS WITH WHOM IT (THEY) ARE AFFILIATED
9507 79,833.33
Other certification assignments 95071 17,050.00 Tax advice 95072Other assignments in addition to auditing 95073 11,900.00
9509
Other certification assignments 95091Tax advice 95092Other assignments in addition to auditing 95093
Notices pursuant to article 3:63, §6 of the Code of Companies and Associations
BE 0543.696.579
DIRECTORS OR SENIOR MANAGERS OF THE CONSOLIDATING COMPANYOverall amount of remuneration allocated on account of their function in the consolidating company, its subsidiaries and associated companies, including the amount for retirement pensions allocated as such to former directors or senior managers
Overall amount of advances and loans granted by the consolidating company, by a subsidiary or by an associated company
Emoluments of the auditor(s) for performing exceptional services or for special assignments carried out for companies in the group
Emoluments of the auditor(s) for exercising the mandate of auditor for the group headed by the company that publishes information
Emoluments of persons with whom the auditor(s) is (are) affiliated for exercising the mandate of auditor for the group headed by the company that publishes information
Emoluments of persons with whom the auditor(s) is (are) affiliated for performing exceptional services or for special assignments carried out for companies in the group
N° C 2.1 C 5.18
DERIVED FINANCIAL INSTRUMENTS NOT ASSESSED AT FAIR VALUEFOR EACH CATEGORY OF DERIVED FINANCIAL INSTRUMENTS NOT ASSESSED AS FAIR VALUE
SpeculationRisk covered / Volume Book
value Fair value Book value fair value
cover
Swaps (volumes expressed in 000 €)
Interest rates cover132,685 0.00 -6,008,585.59 0.00 -6,077,408.43
Collar (volumes expressed in 000 €)
Interest rates cover49,816 0.00 -1,020,955.53 0.00 -700,840.96
Collar (volumes expressed in 000 €)
Interest rates cover408,669 0.00 458,644.84 0.00 1,181,402.97
Swap (volumes expressed in 000 €) Inflation
cover100,000 0.00 1,828,081.52 0.00 2,238,326.84
Book value Right value
Financial fixed assets accounted for at an amount greater than the fair valueAmounts of assets taken in isolation or suitably grouped together
ATRIAS s.c.r.l. 3,100.00 3,100.00
Reasons for which the book value has not been reduced
Elements that allow it to be supposed that the book value will be recovered.
ATRIAS s.c.r.l.: ATRIAS works at cost for the Belgian DSOs (ORES share: 16.67%). In view of the above, ORES considers that the shareholding in its subsidiary (which corresponds to an amount equivalent to the percentage holding in equity capital) is assessed at its fair value and does not require depreciation.
BE 0543.696.579
Financial yearPrevious financial year
Category of derived financial instruments
FURTHER INFORMATIONREASON WHY THE ACCOUNTS ARE NOT COMPARABLEEmprunts obligatairesPursuant to the provisions of articles 3:60 and 3:63 of the Royal Decree implementing the Code of Companies and Associations (the RD), the administrative body has deemed in the past that the private issues (Degroof and ING conducted in 2012, 2014 and 2015) amounting to 630,000,000 € should be classified under the heading of “other loans” – item 174 of the annual accounts. However, in the context of the debt refinancing operations conducted in 2020, it can be seen that this issue has more of the features associated with a bond loan than with a private issue. Based on this, the administrative body has decided to present this issue in item 171 of the annual accounts – Unsubordinated bond loans.For the purpose of comparability required by article 3:63 of the same RD, the administrative body has decided to amend the presentation of the previous financial year and to transfer an amount of 570,600,000 € from item 174 to item 171. As an amount of 290,600,000 € matured during the year, it was transferred to item 42 on 31 December 2020. The Board of Directors points out that this amendment in no way modifies the company’s long-term debt and hence its structure.
#p.110 ORES Assets BGAAP consolidated accounts 2020
2.4. Valuation rules
CONSOLIDATION PRINCIPLES
ORES Assets is a gas and electricity distribution system operator (referred to hereinafter as DSO) in the Walloon Region, which, as of 31 December 2020, had exclusive control over its subsidiary, ORES, as well as its subsidiary, Comnexio. In order to prepare the Group’s consolidated financial statements, ORES Assets has fully consolidated its two subsidiaries.
The Group’s consolidated financial statements include all of the financial statements for the entities that it controls (its sub-sidiaries). ‘Control’ is defined as being the power to direct the financial and operational policies of an entity in order to enjoy the benefits of its activities. The type of control is assessed on a case-by-case basis pursuant to the Royal Decree of 29 April 2019 implementing the Code of Companies and Associations.
Subsidiaries are entities controlled by the Group and are fully consolidated from the moment that the existence of control has been established and until such time as this control comes to an end.
Intragroup balances and transactions, as well as any profit resulting from intragroup transactions, are totally eliminated during the consolidation process for preparing the consolidated financial statements.
1. CONSOLIDATION DIFFERENCE
When the consolidating company incorporates a subsidiary into its consolidated accounts for the first time, the subsidiary’s equity capital included in the consolidation is:
a) the proportion of its equity represented by its stocks and shares owned by the parent company and the subsidiaries included in the consolidation, offset by the book value of these stocks and shares in the accounts of the parent company and the subsidiaries that own it, and;
b) the proportion of its equity represented by its stocks and shares owned by persons and entities other than the consolidating company and the subsidiaries included in the consolidation, entered in the liabilities of the consolidated balance sheet under “third-party interests”.
The difference resulting from this offsetting is charged in the consolidated accounts, insofar as is possible, to the elements
of the assets and liabilities that have a value above or below their book value in the subsidiary’s account.
The difference that remains after this is included in the con-solidated balance sheet in “Consolidation differences”, under assets if it is positive, or under liabilities if negative.
Positive and negative consolidation differences cannot be offset unless they refer to the same subsidiary; in this case, they must be offset.
Negative consolidation differences cannot be recorded in the consolidated profit and loss statement. However, when a negative consolidation difference corresponds to a forecast, on the relevant date, of a weakness in the future results of the subsidiary in question, or costs that it will incur, it is included in the consolidated profit and loss statement insofar as and at the time that this forecast becomes a reality.
2. COMPANIES ACCOUNTED FOR USING THE EQUITY METHOD
Affiliated companies are companies over which the Group exercises significant influence, but that it does not control. They are consolidated according to the equity method from the date on which the significant influence is established and until this influence ends.
When a holding is based on the equity method, it is included on the consolidated balance sheet at the amount corresponding to the proportion of the equity of the company concerned, including the profit/loss for the financial year, represented by this holding.
ASSETS
SET-UP COSTS
Included under this heading are costs associated with the incorporation, development or restructuring of the company, such as the charges for incorporation of increase in capital and the fees for issuing loans. The depreciation of set-up costs must company with article 3:37 of the Royal Decree of 29 April 2019 stipulating that set-up costs are the subject of appropriate depreciation, in annual tranches of 20% of at least the actual sums disbursed. The fees for issuing loans are accounted for under this heading and depreciated within the year.
#ORES Assets BGAAP consolidated accounts 2020 p.111
INTANGIBLE FIXED ASSETS
Intangible fixed assets are intangible means of production. They represent fixed assets due to the fact that the company wishes to use them as operating resources. In other words, they imply an operating capability of limited or unlimited duration.
Pursuant to the Royal Decree of 29 April 2019 (article 3:89), a distinction must be made between:
• development costs;
• concessions, patents and licences, know-how, brands and other similar rights;
• goodwill;
• advances paid on intangible fixed assets.
Intangible fixed assets are recorded in the accounts if and only if it is probable that future economic benefits attributable to the asset will go to the company and if the cost of that asset can be valued in a reliable manner. Intangible fixed assets are valued initially at cost. The cost of an intangible fixed asset generated internally includes all costs attributable directly to it and is equal to the sum of the expenses incurred from the date on which this intangible fixed asset meets the accounting criteria in accordance with Belgian standards. After they have been recorded in the accounts initially, intangible fixed assets are entered at cost, minus accumulated depreciations and accumulated impairment losses.
The Group also invested, both in the development of IT projects and in research and development.
Costs likely to be capitalised as intangible fixed assets are the development and manufacturing costs of prototypes, products, inventions and know-how of value for the future activities of the company. In this context, the following costs have been activated:
• staffing expenditure for researchers, technicians and other support staff, insofar as they are allocated to a project that meets the definition given above;
• the cost of instruments and hardware to the extent that and for as long as they are used for the completion of the project. If they are not used throughout their service life for the completion of the project, only the depreciation costs corresponding to the lifespan of the project will then be admissible;
• the costs for the services of consultants and equivalent services used for the completion of the project;
• other operating costs, in particular the cost of materials, supplies and similar products incurred directly on account of the completion of the project;
• costs incurred for IT licences.
The intangible fixed asset from the development cost activity is then depreciated using the linear method during the period it is used (set at five years) and reduced by any impairment losses.
For intangible fixed assets relating to IT projects, the period of depreciation change to ten years for assets acquired from 2019 onwards; those predating 2019 continue to be depreciated over five years.
An adjustment was made in 2020 to align the depreciation rates of certain intangible fixed assets acquired prior to 1 January 2019 with those of the tariff methodology. This adjustment affected the 2020 accounts to the tune of 8,522,000 €.
TANGIBLE FIXED ASSETS
ACQUISITION VALUE
Tangible fixed assets are included under assets on the balance sheet at their purchase or cost price or their contribution value.
ANCILLARY COSTS
Ancillary costs are included in the purchase value of the tangible fixed assets concerned. Ancillary costs are depreciated at the same rate as the installations to which they relate.
THIRD-PARTY ACTIONS
Third-party actions in the funding of tangible fixed assets are de-ducted from the latter’s purchase values. They are also deducted from the basis for depreciating the facilities mentioned above.
DEPRECIATION
Depreciation is calculated using the linear method. Facilities acquired during the financial year have, since 1 January 2015 and following on from ORES Assets being subject to corporation tax, been depreciated pro rata temporis. A facility purchased during the month will be amortised from the 1st day of month n + 1.

#p.112 ORES Assets BGAAP consolidated accounts 2020
The depreciation rates to be taken into account are as follows:
Electricity facilities
Depreciation rates in %
Land 0
Industrial buildings 3
Administrative buildings 2
Cables 2
Lines 2
Fibre optic cable sheath signalling network 5
SMART equipment signalling network 10
Sets and cabins (high-voltage (HV) and low-voltage (LV) equipment) 3
Connections – transformers 3
Connections – lines and cables 2
Metering equipment 3
Electronic meters, budget meters, automatic meters 10
BT SMART electric meters 6.7
Remote control, lab and dispatching equipment 10
Teletransmission 10
Fibre optics 5
Tools and equipment 10
Vehicles (to carry people and goods) 20
Mobile equipment 10
IT hardware 33
Gas installations
Depreciation rates in %
Land 0
Industrial buildings 3
Administrative buildings 2
Pipes 2
Cabins - stations 3
Connections 3
Metering equipment 3
Lab, dispatching equipment 10
Budget meters, electronic meters, automatic meters 10
Low-pressure (LP) SMART gas meters 6.7
Remote control, dispatching equipment, lab equipment 10
Teletransmission 10
Fibre optics 5
Tools and equipment 10
Vehicles (to carry people and goods) 20
Mobile equipment 10
IT hardware 33
INITIAL DIFFERENCE BETWEEN THE RAB AND THE BOOK VALUE OF TANGIBLE FIXED ASSETS
Until the end of 2002, tangible fixed assets valued as assets on the balance sheet according to their book value (or the purchase value less sinking fund) were revalued in accordance with the exemption obtained from the Ministry of Economic Affairs on 22 November 1985.
Since 2003, at the same rate at which the electricity and natural gas markets have been deregulated, the intermunicipal com-panies operating in these areas have refocused their activities, essentially on the role of electricity and gas distribution system operator, a monopolistic activity for which there is a regulatory framework made up mainly of tariff methodologies.
#ORES Assets BGAAP consolidated accounts 2020 p.113
These provide for fair remuneration of the capital invested calculated on the basis of a rate of remuneration, a theoretical financing structure and the invested capital base to be remu-nerated (RAB) (a).
Combined electricity and gas distribution system operators with a technical inventory justifying the value of the tangible fixed assets could establish the initial value of the capital invested as of 31 December 2001 (electricity) / 31 December 2002 (natural gas), based on the economic value of this inventory.
The initial values were formally approved by the competent regulator and then confirmed in 2007 on the basis of the values as at 31 December 2005 for electricity and 31 December 2006 for natural gas.
The regulator requires the RAB to be taken into account to determine the basis for remunerating invested capital changes according to the following formula:
RAB n = iRAB + investments n – depreciations n – decommissioning n (b)
The regulator also needs to be able, at any time, to reconcile the RAB included in the tariff proposals with the DSOs’ accounting statements (c).
Meeting the restrictions (a), (b) and (c) would involve accounting for the RAB and that an initial difference is shown compared with the book value.
This initial difference which appears in the balance sheet of the DSO is, on the one hand, linked to the right to be the exclusive electricity and gas distributor for a defined period and over a fixed territory and, on the other hand, reflects the fact that the network in question has been valued.
In November 2007, agreements between the DSOs and CREG resulted in a transaction and the publication of the Royal Decrees of 2 September 2008 describing the CREG’s tariff methodology, the principles of which have been included in the CWaPE tariff methodology.
It is also indicated that the costs to be covered by the tariffs include in particular the proportion of the capital gain relating to equipment derecognised during the year concerned.
As a result, the tariff methodologies also stipulate that the value of economic reconstruction has changed every year since 1 January 2007, including in particular by deducting the proportion of the capital gain relating to equipment derecognised during
the year in question. This capital gain is deducted and carried over into costs at a rate of 2% per year.
These provisions came into force from the 2008 tariff year and still apply today.
FINANCIAL FIXED ASSETS
Financial fixed assets are included as assets on the balance sheet at their purchase value less the proportion not called up.
At the end of each financial year, an individual assessment of each security in the portfolio is carried out in order to reflect, in as satisfactory a manner as possible, the company’s situation, profitability and outlook in the holding where the stocks are held.
RECEIVABLES DUE AFTER ONE YEAR
Receivables due after one year are recorded at their book value.
STOCKS AND ORDERS IN PROGRESS
Stocks are valued at a weighted average price stocks. An im-pairment is recorded when the economic value of the stocks is lower than their book value.
Work in progress is included under assets on the balance sheet at its cost price. As far as work on behalf of third parties is con-cerned, the costs and billings are transferred to the profit and loss account when the work is considered completed.
RECEIVABLES DUE WITHIN ONE YEAR
Receivables due within one year are accounted for at their book value.
They include receivables from customers for energy supplies (mainly protected customers), transmission fees and miscella-neous work.
They are taken away from those regarded as unrecoverable bad debts, including those relating to known bankruptcies. These bad debts are covered in full by the debits in the profit-and-loss statement. If some of these are subsequently recovered, the amount recovered will be shown as a credit in the profit-and-loss statement.
Unpaid receivables are covered by impairments when there is a certain risk that they will not be recovered.

#p.114 ORES Assets BGAAP consolidated accounts 2020
In 2015, a public tendering process was launched so that re-ceivables could be recovered for the supply of energy to end customers as well as receivables for works. This public tender stipulates a collection rate for the successful bidder. The propor-tion of these receivables covered by a write-down is calculated net of the expected recovery percentage.
Following on from ORES Assets’ liability for corporation tax, write-downs apply in different stages, following a specific sched-ule, and after the amount guaranteed by debt collection firms has been deducted, which means they are covered gradually.
We should point out that there are no writedowns for liabilities related to “network damage” less than two years old, as well as for outstanding debts to municipalities, as the Board of Directors feels that these liabilities do not present any risk of not being recovered.
CASH INVESTMENTS
Investment securities are recorded in the assets on the balance sheet at their acquisition price, excluding ancillary costs, or at the input value.
At the end of the financial year, they are valued at the lowest of the following values: purchase price or input value or market value at the end of the financial year.
LIQUID ASSETS
Liquid assets are accounted for under balance sheet assets at their book value.
ACCRUALS
• Expenses incurred during the financial year, but chargeable in full or in part to one or more previous financial years, are valued using a proportional rule.
• Income or fractions of income which are only paid during one or more of the following financial years but which are to be associated with the financial year in question are evaluated at the amount of the proportion relating to the financial year in question.
Accruals mainly include the costs relating to the pension charg-es previously paid in the form of capital to the benefit of the operating company’s staff (ORES) previously allocated to the distribution activities on the intermunicipal company’s territory.
The inclusion of these costs by the intermunicipal company is staggered over a period not exceeding 20 years.
The estimated value of the transmission fees for energy trans-mitted but not metered at 31 December is also included in the asset adjustment accounts.
“Low-voltage” and “low-pressure” consumption for residential and business customers is only recorded once a year, so the quantities of energy transported for these customers between the date of the last meter reading and 31 December and the transmission fees relating to them have to be estimated (total quantities of energy transported during the calendar year - quantities transported and billed during the same financial year) (valuation of transmission fees based on the applicable rates during the course of the financial year concerned).
Asset accruals include any “regulated assets” accounted for by virtue of the principle of annuality for expenditure and income. These “regulatory assets” relating to the previous years are re-covered using tariffs in accordance with the recommendations issued by the regulator in its decisions. The impact of these regulatory assets on the results for the intermunicipal company will be neutralised annually and partially by setting aside part of the fair profit margin (pay-out ratio set at 70%).
LIABILITIES
UNTAXED RESERVES
This item includes capital gains and profits whose untaxed status is subject to them being kept as the company’s assets.
PROVISIONS AND DEFERRED TAXES
At the end of each financial year, acting with sincerity and in good faith, the Board of Directors looks at the provisions to be set aside to cover all the expected risks or any losses arising during this and previous years. The provisions relating to the previous financial years are regularly reviewed and the Board of Directors decides on their allocation or purpose.
DEBTS DUE IN MORE THAN ONE YEAR
Debts due in more than one year are recorded under liabilities in the balance sheet at their book value.
#ORES Assets BGAAP consolidated accounts 2020 p.115
DEBTS DUE WITHIN ONE YEAR
Debts due within one year are recorded under liabilities in the balance sheet at their book value.
ACCRUALS
• Expenses or fractions of the expenses relating to the finan-cial year but which will only be paid during a subsequent financial year are valued at the amount attributable to the financial year.
• Income received during the financial year, which is attribut-able in full or in part to a subsequent financial year, is also valued at the amount that must be regarded as income for subsequent financial years.
Liability accruals include any “regulatory liabilities” or “excess liabilities” accounted for by virtue of the principle of annuality for expenditure and income. These “regulatory liabilities” relating to the previous years are covered using tariffs in ac-cordance with the recommendations issued by the regulator in its decisions. The impact of these regulatory assets on the results for the intermunicipal company is fully covered during the year to which they relate.
The estimated value of the transmission fees for energy trans-ported but not raised as of 31 December is also included in the liability accruals. “Low-voltage” and “low-pressure” consump-tion for residential and business customers is only recorded once a year, so the quantities of energy transported for these customers between the date of the last meter reading and 31 December and the transmission fees relating to them have to be estimated (total quantities of energy transported during the calendar year - quantities transported and billed during the same financial year) (valuation of transmission fees based on the applicable rates during the course of the financial year concerned).
#p.116 ORES Assets BGAAP consolidated accounts 2020
IV AUDITORS’ REPORT
#ORES Assets BGAAP consolidated accounts 2020 p.117#ORES Assets BGAAP consolidated accounts 2020 p.117
#p.118 ORES Assets BGAAP consolidated accounts 2020
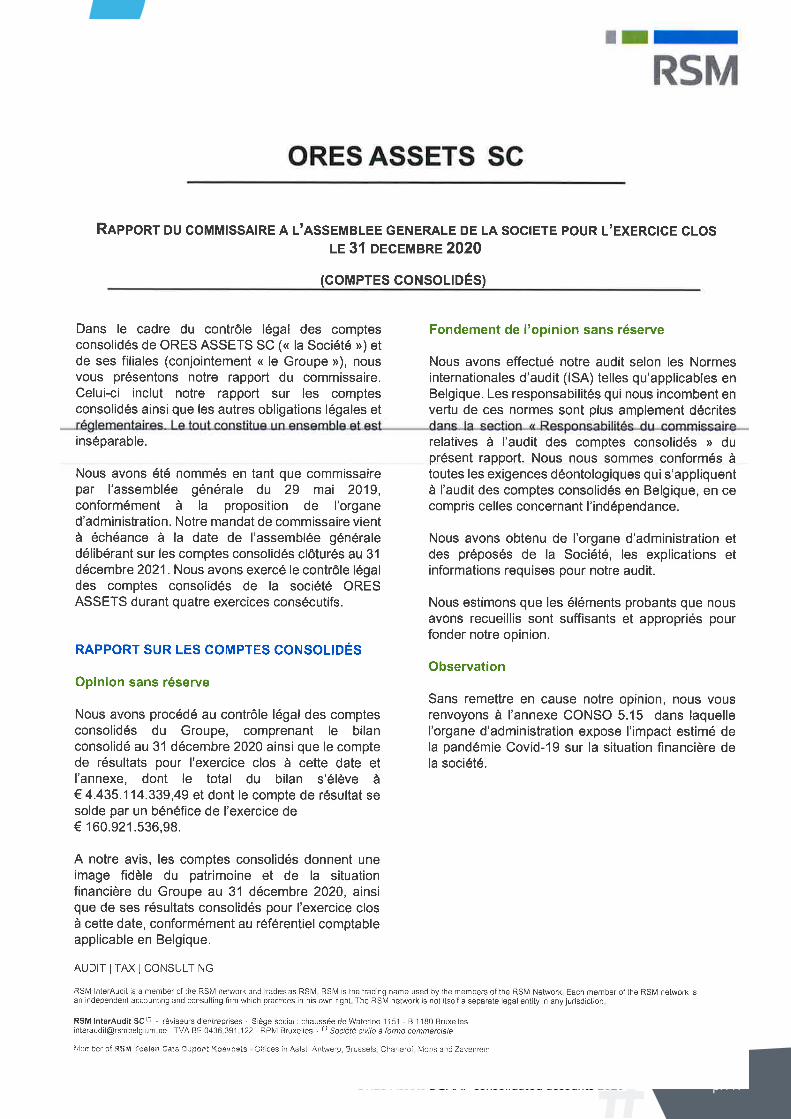
#ORES Assets BGAAP consolidated accounts 2020 p.119
#p.120 ORES Assets BGAAP consolidated accounts 2020
#ORES Assets BGAAP consolidated accounts 2020 p.121
#p.122 ORES Assets BGAAP consolidated accounts 2020

#ORES Assets BGAAP consolidated accounts 2020 p.123

#p.124 ORES Assets BGAAP consolidated accounts 2020
V REMUNERATION REPORTS
#ORES Assets BGAAP consolidated accounts 2020 p.125#ORES Assets BGAAP consolidated accounts 2020 p.125
DuetothecommongovernanceestablishedinORESAssetsandORESandforreasonsoftransparency,giventhatdirectorshipsareunpaidwithinORESAssetsandremuneratedwithinORES(incompliancewithCDLDregulations),thisAnnualReportpublishestheoverviewsofthemanagementbodiesandtheremunerationreportsofORESAssetsandORES.
GiventheequivalenceoftherequirementsstatedinL1523-17andL6421-1oftheCDLDwiththoseimposedbyarticle3:12§19°oftheCodeofCompaniesandAssociations,thisreporthasbeendrawnuptomeettheobligationsrequiredbothbytheCDLDandtheCodeofCompaniesandAssociations.
#p.126 ORES Assets BGAAP consolidated accounts 2020
1. Presentation of the management bodies
ORES Assets
Board of Directors
The Board of Directors is the company’s decision-making body, with the exception of matters reserved for the Annual General Meeting either by law, decree or the articles of association. Its main goal is to ensure the company’s long-term success, in ac-cordance on the one hand with the interests of all the third-party stakeholders essential for achieving this goal, namely shareholders, customers, suppliers and other creditors, and, on the other, with the public service obligations that it assumes. With this in mind, the Board of Directors identifies the strategic challenges and risks faced by the company, defines the company’s values, its strategy, the level of risks that it is comfortable taking as well as its key policies, along with monitoring the running of the business. The intermunicipal company ORES Assets and its subsidiary ORES have had a “mirror” Board of Directors.
In accordance with article L1523-15 of the CDLD, as set out in Article 14 of the ORES Assets Articles of Association, the Board of Directors is composed of twenty members of different sexes, of whom 13 members (2/3) represent the municipal sharehold-ers and must, as such, be municipal representatives. The other seven represent the IPFs and may (or may not) be municipal representatives. The members of the Board of Directors are distributed as follows:
• politically (on the basis of a double proportionality referred to in Article 14 of the ORES Assets Articles of Association, i.e. the d’Hondt method on nine directorships and the weighted d’Hondt method on the remaining eleven);
• geographically (in proportion to the supply points as available at the time of the municipal elections).
As well as this, in accordance with the CDLD, the members of the Board of Directors of ORES Assets sit on the company’s management and control committees – offshoots of the Board of Directors – namely the Remuneration Committee and the Audit
Committee. They are both constituted according to the principle of a “mirror” committee between ORES Assets and ORES.
Remuneration Committee
The Remuneration Committee’s role is to make recommendations about remunerating the directors to the Annual General Meeting and report on their relevance by carrying out an annual assess-ment of the justification for the remuneration arrangements. It is made up of five directors who provide this service free of charge.
Audit Committee
This committee is made up of five directors responsible for checking and overseeing the statutory and consolidated financial statements, as well as matters relating to financial information, internal control and risk management.
ORES
Board of Directors
The Board of Directors is the company’s decision-making body, with the exception of matters reserved for the Annual General Meeting either by law, decree or the articles of association. Its main goal is to ensure the company’s long-term success, in accordance with the interests of all the third-party stakeholders essential for achieving this goal, namely shareholders, staff, clients, suppliers and other creditors. With this in mind, the Board of Directors identifies the strategic challenges and risks faced by the company, defines the company’s values, its strategy, the level of risks that it is comfortable taking and its key policies, as well as monitoring the running of the company’s business.
Given the establishment of “mirror” Boards of Directors be-tween the inter-municipal company ORES Assets and ORES, in accordance with Article 13 of the ORES Articles of Association, the composition of this body is based on a proposal from ORES Assets. It must be carried out in accordance with Walloon legis-lation relating to intermunicipal companies and more particularly
#ORES Assets BGAAP consolidated accounts 2020 p.127
with Article L1523-15 of the CDLD, as set out in Article 14 of the ORES Assets Articles of Association, as mentioned above in the presentation of the management bodies of ORES Assets.
As well as this, members of the Board of Directors of ORES Assets sit on the company’s management and control commit-tees – offshoots of the Board of Directors – namely the Executive Bureau, the Appointment and Remuneration Committee, the Audit Committee and the Ethics Committee.
Executive Bureau
This Committee is responsible for preparing the decisions of the Board of Directors on all matters relating to the strategic and confidential tasks listed in the Walloon legislation relating to electricity and/or natural gas distribution systems operators. The Executive Bureau of ORES had five members as of 31 December 2020.
Appointments and Remuneration Committee
The principles and rules for remuneration granted to the com-pany’s directors, the members of the different Management and Control Committees, as well as the management roles within the company, are defined by the ORES Appointments and Remu-
neration Committee. Constituted according to the principle of the “mirror” committee between ORES Assets and ORES, this committee has five members.
Audit Committee
Its role is to support the Board of Directors by providing its views on the company’s accounts, as well as on the internal control system, the internal audit programme and the conclusions and recommendations formulated by this internal audit in the form of reports. The Audit Committee is composed of five directors. It has been established according to the principle of a “mirror” committee between ORES Assets and ORES.
Ethics Committee
This Committee is responsible for advising on compliance with the rules on the confidentiality of personal and commercial information. It is composed of five members.
Executive Board
The management of the company is entrusted to the Executive Board. It is composed of nine members, including its Chair.
2. Report from the ORES Assets Remuneration Committee
Preliminary note
This report has been prepared by the Remuneration Committee and is submitted to the Board of Directors of ORES Assets for approval in accordance with the provisions of Article 19.6 of the Articles of Association of the intermunicipal company and Arti-cle L 1523-17, §2 of the Local Democracy and Decentralisation Code (CDLD).
Its purpose is to assess the appropriateness of the remuneration paid to the directors of the intermunicipal company in 2020. The individual attendance record of the directors is an integral part of the report to be drawn up by the Board of Directors pursuant to Article L6421-1 of the CDLD – remuneration report consolidated with ORES.
Evaluation of the appropriateness of the non-remuneration of the directorships held within ORES Assets
The Remuneration Committee records that, as decided by the General Meeting on 22 June 2017 and confirmed by the delib-erations on 28 June 2018 and 29 May 2019, all the directorships for ORES Assets are unpaid, it being understood that the same individuals make up the Board of Directors for ORES and are remunerated within the context of this directorship, in accord-ance with CDLD (Local Democracy and Decentralisation Code) thresholds and requirements on this subject.
The same is true for directorships for Committees established within the Board.
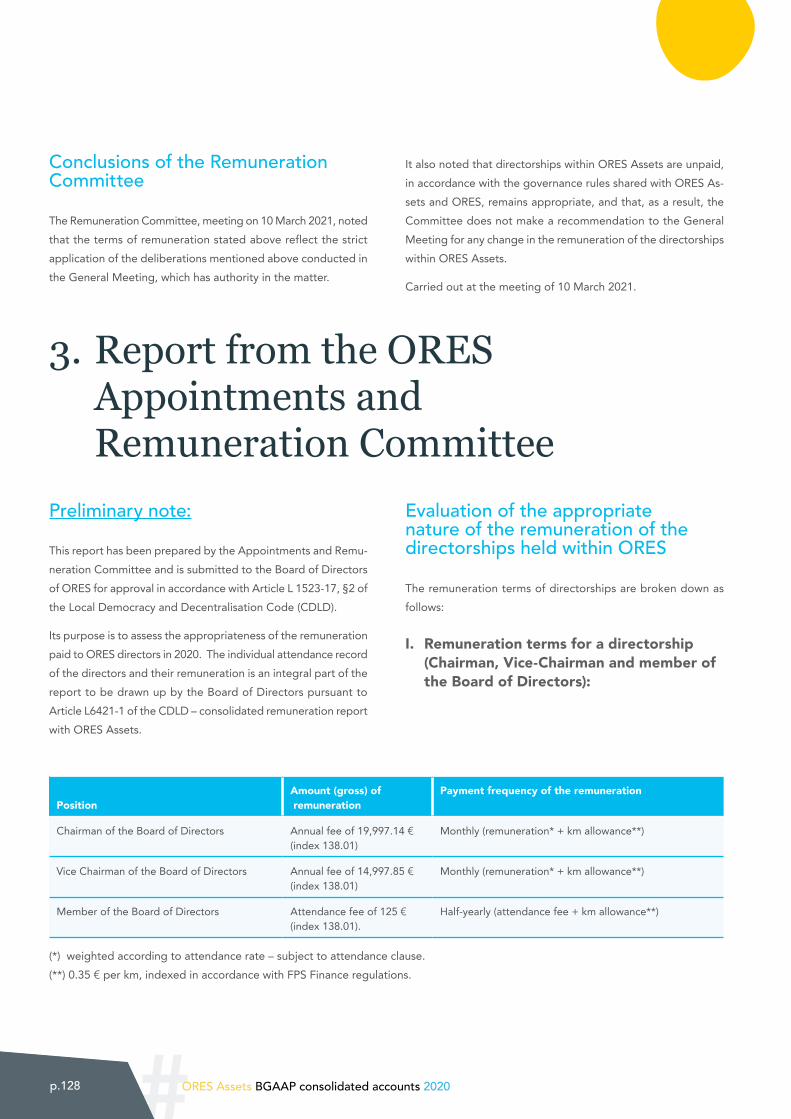
#p.128 ORES Assets BGAAP consolidated accounts 2020
Conclusions of the Remuneration Committee
The Remuneration Committee, meeting on 10 March 2021, noted that the terms of remuneration stated above reflect the strict application of the deliberations mentioned above conducted in the General Meeting, which has authority in the matter.
It also noted that directorships within ORES Assets are unpaid, in accordance with the governance rules shared with ORES As-sets and ORES, remains appropriate, and that, as a result, the Committee does not make a recommendation to the General Meeting for any change in the remuneration of the directorships within ORES Assets.
Carried out at the meeting of 10 March 2021.
3. Report from the ORES Appointments and Remuneration Committee
Preliminary note:
This report has been prepared by the Appointments and Remu-neration Committee and is submitted to the Board of Directors of ORES for approval in accordance with Article L 1523-17, §2 of the Local Democracy and Decentralisation Code (CDLD).
Its purpose is to assess the appropriateness of the remuneration paid to ORES directors in 2020. The individual attendance record of the directors and their remuneration is an integral part of the report to be drawn up by the Board of Directors pursuant to Article L6421-1 of the CDLD – consolidated remuneration report with ORES Assets.
Evaluation of the appropriate nature of the remuneration of the directorships held within ORES
The remuneration terms of directorships are broken down as follows:
I. Remuneration terms for a directorship (Chairman, Vice-Chairman and member of the Board of Directors):
PositionAmount (gross) of remuneration
Payment frequency of the remuneration
Chairman of the Board of Directors Annual fee of 19,997.14 € (index 138.01)
Monthly (remuneration* + km allowance**)
Vice Chairman of the Board of Directors Annual fee of 14,997.85 € (index 138.01)
Monthly (remuneration* + km allowance**)
Member of the Board of Directors Attendance fee of 125 € (index 138.01).
Half-yearly (attendance fee + km allowance**)
(*) weighted according to attendance rate – subject to attendance clause. (**) 0.35 € per km, indexed in accordance with FPS Finance regulations.
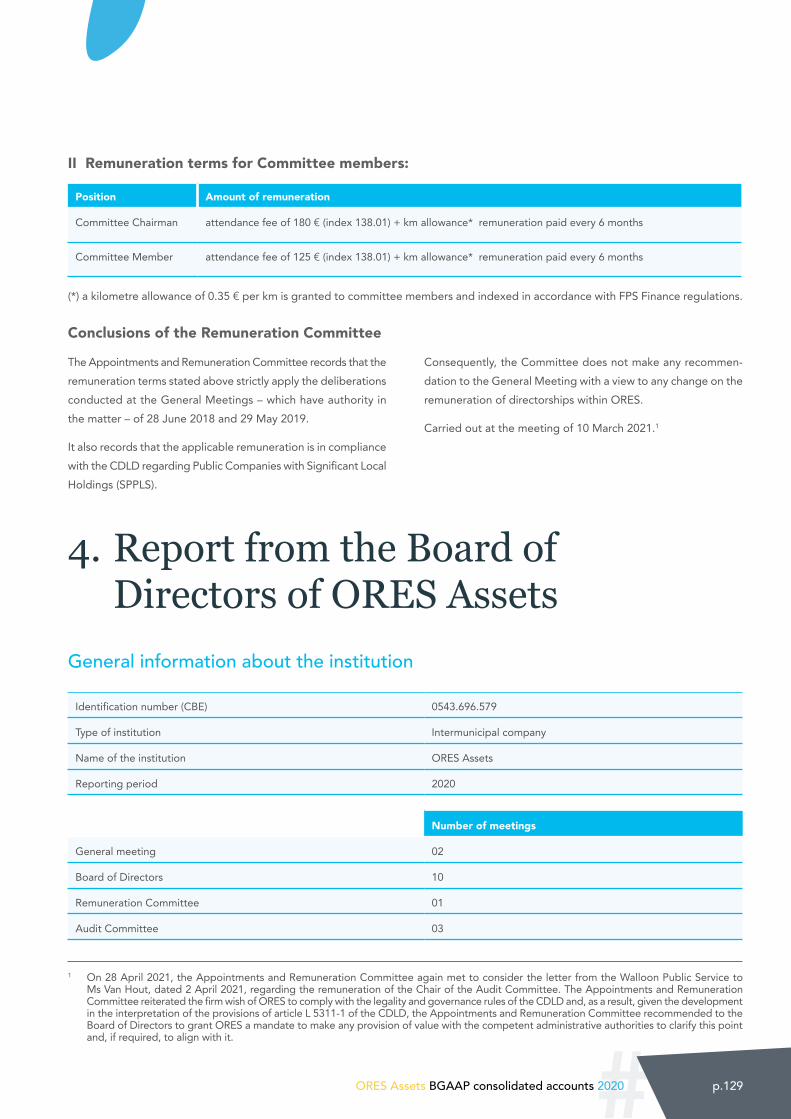
#ORES Assets BGAAP consolidated accounts 2020 p.129
II Remuneration terms for Committee members:
Position Amount of remuneration
Committee Chairman attendance fee of 180 € (index 138.01) + km allowance* remuneration paid every 6 months
Committee Member attendance fee of 125 € (index 138.01) + km allowance* remuneration paid every 6 months
(*) a kilometre allowance of 0.35 € per km is granted to committee members and indexed in accordance with FPS Finance regulations.
Conclusions of the Remuneration Committee
1 On 28 April 2021, the Appointments and Remuneration Committee again met to consider the letter from the Walloon Public Service to Ms Van Hout, dated 2 April 2021, regarding the remuneration of the Chair of the Audit Committee. The Appointments and Remuneration Committee reiterated the firm wish of ORES to comply with the legality and governance rules of the CDLD and, as a result, given the development in the interpretation of the provisions of article L 5311-1 of the CDLD, the Appointments and Remuneration Committee recommended to the Board of Directors to grant ORES a mandate to make any provision of value with the competent administrative authorities to clarify this point and, if required, to align with it.
The Appointments and Remuneration Committee records that the remuneration terms stated above strictly apply the deliberations conducted at the General Meetings – which have authority in the matter – of 28 June 2018 and 29 May 2019.
It also records that the applicable remuneration is in compliance with the CDLD regarding Public Companies with Significant Local Holdings (SPPLS).
Consequently, the Committee does not make any recommen-dation to the General Meeting with a view to any change on the remuneration of directorships within ORES.
Carried out at the meeting of 10 March 2021.1
4. Report from the Board of Directors of ORES Assets
General information about the institution
Identification number (CBE) 0543.696.579
Type of institution Intermunicipal company
Name of the institution ORES Assets
Reporting period 2020
Number of meetings
General meeting 02
Board of Directors 10
Remuneration Committee 01
Audit Committee 03
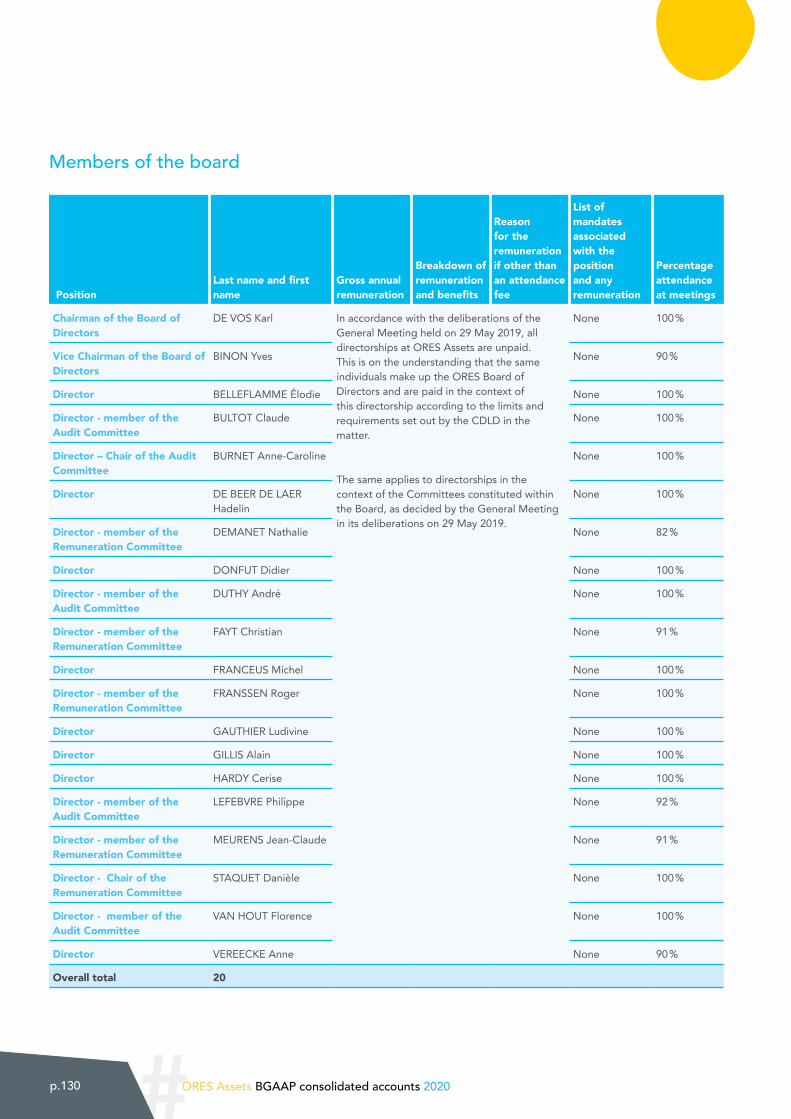
#p.130 ORES Assets BGAAP consolidated accounts 2020
Members of the board
Position Last name and first name
Gross annual remuneration
Breakdown of remuneration and benefits
Reason for the remuneration if other than an attendance fee
List of mandates associated with the position and any remuneration
Percentage attendance at meetings
Chairman of the Board of Directors
DE VOS Karl In accordance with the deliberations of the General Meeting held on 29 May 2019, all directorships at ORES Assets are unpaid. This is on the understanding that the same individuals make up the ORES Board of Directors and are paid in the context of this directorship according to the limits and requirements set out by the CDLD in the matter.
The same applies to directorships in the context of the Committees constituted within the Board, as decided by the General Meeting in its deliberations on 29 May 2019.
None 100 %
Vice Chairman of the Board of Directors
BINON Yves None 90 %
Director BELLEFLAMME Élodie None 100 %
Director - member of the Audit Committee
BULTOT Claude None 100 %
Director – Chair of the Audit Committee
BURNET Anne-Caroline None 100 %
Director DE BEER DE LAER Hadelin
None 100 %
Director - member of the Remuneration Committee
DEMANET Nathalie None 82 %
Director DONFUT Didier None 100 %
Director - member of the Audit Committee
DUTHY André None 100 %
Director - member of the Remuneration Committee
FAYT Christian None 91 %
Director FRANCEUS Michel None 100 %
Director - member of the Remuneration Committee
FRANSSEN Roger None 100 %
Director GAUTHIER Ludivine None 100 %
Director GILLIS Alain None 100 %
Director HARDY Cerise None 100 %
Director - member of the Audit Committee
LEFEBVRE Philippe None 92 %
Director - member of the Remuneration Committee
MEURENS Jean-Claude None 91 %
Director - Chair of the Remuneration Committee
STAQUET Danièle None 100 %
Director - member of the Audit Committee
VAN HOUT Florence None 100 %
Director VEREECKE Anne None 90 %
Overall total 20
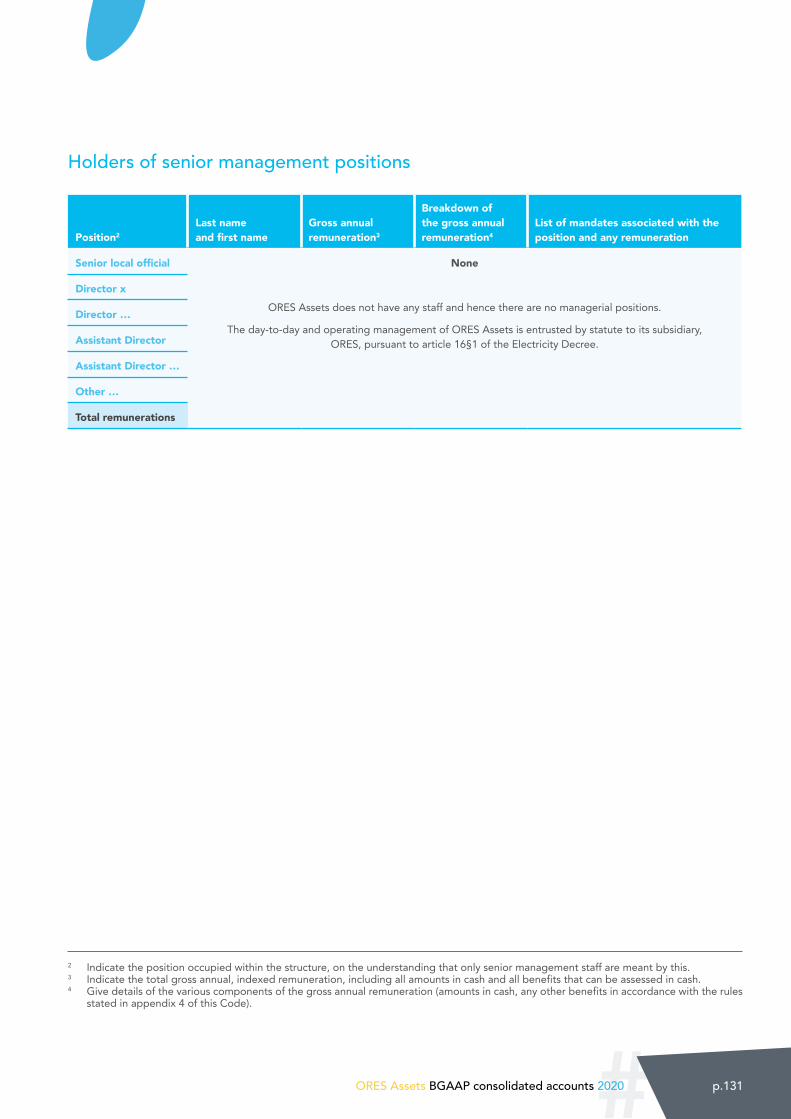
#ORES Assets BGAAP consolidated accounts 2020 p.131
Holders of senior management positions
Position2
Last name and first name
Gross annual remuneration3
Breakdown of the gross annual remuneration4
List of mandates associated with the position and any remuneration
Senior local official None
ORES Assets does not have any staff and hence there are no managerial positions.
The day-to-day and operating management of ORES Assets is entrusted by statute to its subsidiary, ORES, pursuant to article 16§1 of the Electricity Decree.
Director x
Director …
Assistant Director
Assistant Director …
Other …
Total remunerations
2 Indicate the position occupied within the structure, on the understanding that only senior management staff are meant by this.3 Indicate the total gross annual, indexed remuneration, including all amounts in cash and all benefits that can be assessed in cash.4 Give details of the various components of the gross annual remuneration (amounts in cash, any other benefits in accordance with the rules
stated in appendix 4 of this Code).

#p.132 ORES Assets BGAAP consolidated accounts 2020
Appendices
Appendix 1: Board of Directors – list of members’ names and their attendance rate
Position Last name and first nameEffective attendance
at meetingsNumber of
meetings Attendance in %
Chairman DE VOS Karl 10 10 100
Vice Chairman BINON Yves 9 10 90
Directors BELLEFLAMME Élodie 10 10 100
BULTOT Claude 10 10 100
BURNET Anne-Caroline 10 10 100
DE BEER DE LAER Hadelin 10 10 100
DEMANET Nathalie 8 10 80
DONFUT Didier 10 10 100
DUTHY André 10 10 100
FAYT Christian 9 10 90
FRANCEUS Michel 10 10 100
FRANSSEN Roger 10 10 100
GAUTHIER Ludivine 10 10 100
GILLIS Alain 10 10 100
HARDY Cerise * 9 9 100
LEFEBVRE Philippe 9 10 90
MEURENS Jean-Claude 9 10 90
STAQUET Danièle 10 10 100
VAN HOUT Florence 10 10 100
VEREECKE Anne 9 10 90
* Ms Cerise Hardy was co-opted by the Board of Directors on 22 January 2020 to fill in for the vacant Directorship following the resi-gnation of Mr Raphaël Durant
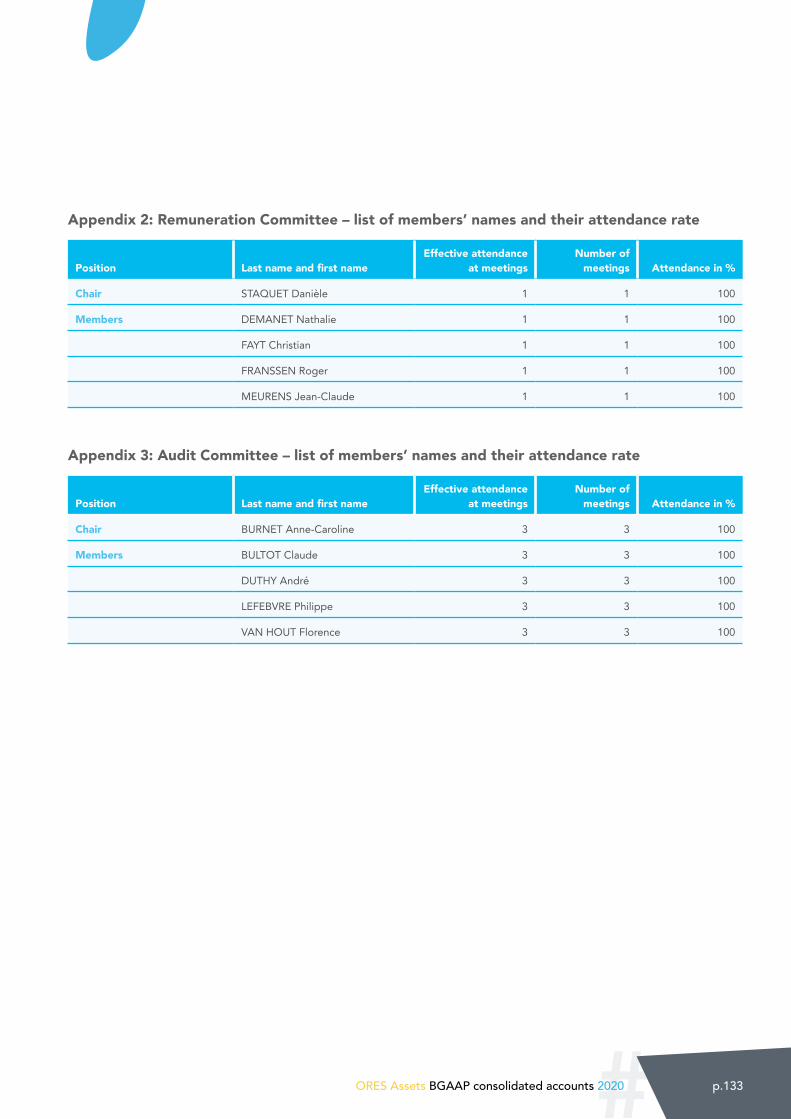
#ORES Assets BGAAP consolidated accounts 2020 p.133
Appendix 2: Remuneration Committee – list of members’ names and their attendance rate
Position Last name and first nameEffective attendance
at meetingsNumber of
meetings Attendance in %
Chair STAQUET Danièle 1 1 100
Members DEMANET Nathalie 1 1 100
FAYT Christian 1 1 100
FRANSSEN Roger 1 1 100
MEURENS Jean-Claude 1 1 100
Appendix 3: Audit Committee – list of members’ names and their attendance rate
Position Last name and first nameEffective attendance
at meetingsNumber of
meetings Attendance in %
Chair BURNET Anne-Caroline 3 3 100
Members BULTOT Claude 3 3 100
DUTHY André 3 3 100
LEFEBVRE Philippe 3 3 100
VAN HOUT Florence 3 3 100
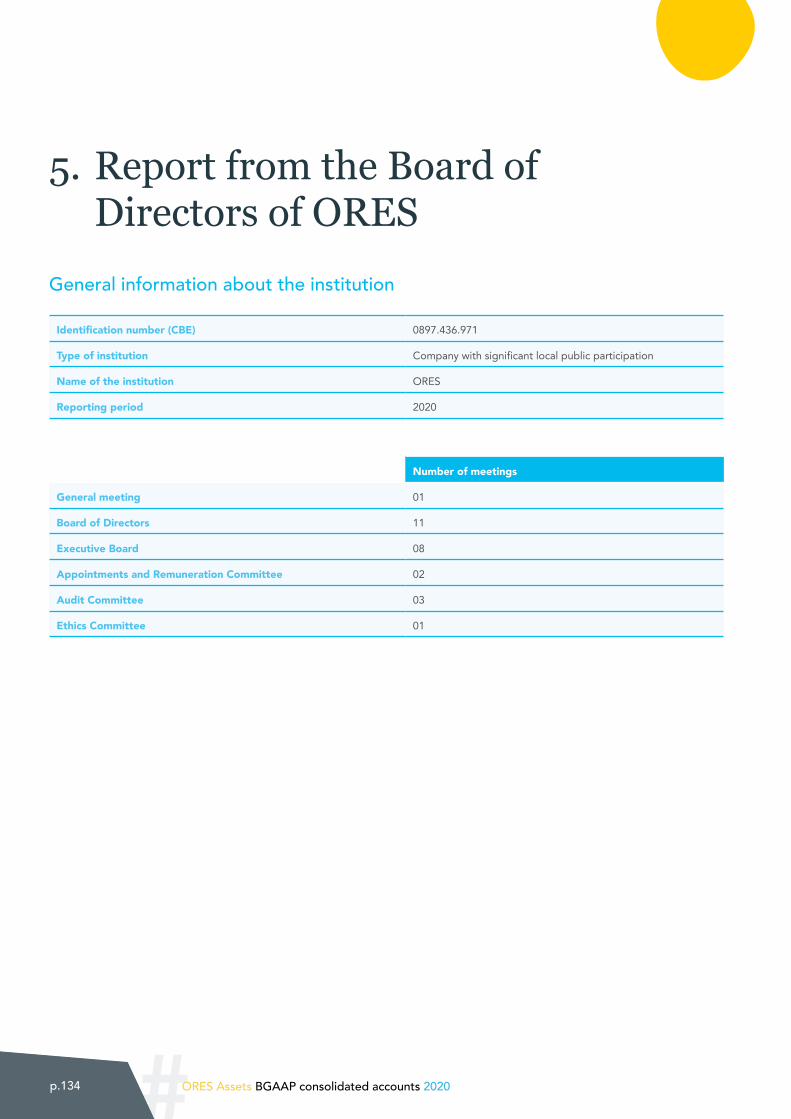
#p.134 ORES Assets BGAAP consolidated accounts 2020
5. Report from the Board of Directors of ORES
General information about the institution
Identification number (CBE) 0897.436.971
Type of institution Company with significant local public participation
Name of the institution ORES
Reporting period 2020
Number of meetings
General meeting 01
Board of Directors 11
Executive Board 08
Appointments and Remuneration Committee 02
Audit Committee 03
Ethics Committee 01

#ORES Assets BGAAP consolidated accounts 2020 p.135
1. Members of the Board of Directors
PositionLast name and first name
Gross annual remuneration
Breakdown of remuneration and benefits
Reason for the remuneration if other than an attendance fee
List of mandates associated with the position and any remuneration
Percentage attendance at meetings
Chairman of the Board of Directors
Member of the Executive Board
DE VOS Karl 35,008.02 € Remuneration as Chairman: Gross annual remuneration of 19,997.14 € (index 138.11) i.e. indexed to 34,133.12 € gross annual until 31/03/2020 and 34,815.02 € gross annual from 01/04/2020
Mileage allowance: 0.37 €/km until 30/06/2020 and 0.35 €/km from 01/07/2020
Remuneration as Chairman
None 95 %
Vice Chairman of the Board of Directors
Member of the Executive Board
BINON Yves 26,323.10 € Remuneration as Vice Chair-man: Gross annual remuneration of 14,997.85 € (index 138.11) i.e. indexed to 25,599.83 € gross annual until 31/03/2020 and 26,211.26 € gross annual from 01/04/2020
Mileage allowance: 0.37 €/km until 30/06/2020 and 0.35 €/km from 01/07/2020
Remuneration as Vice Chair-man
None 89 %
Director
Member of the Ethics Com-mittee
BELLEFLAMME Élodie
2,566.36 € Attendance fee as director/Committee member: 125 € (index 138.11) i.e. indexed to 213.36 € until 31/03/2020 and to 217.63 € from 01/04/2020
Mileage allowance: 0.37 €/km until 30/06/2020 and 0.35 €/km from 01/07/2020
None None 100 %
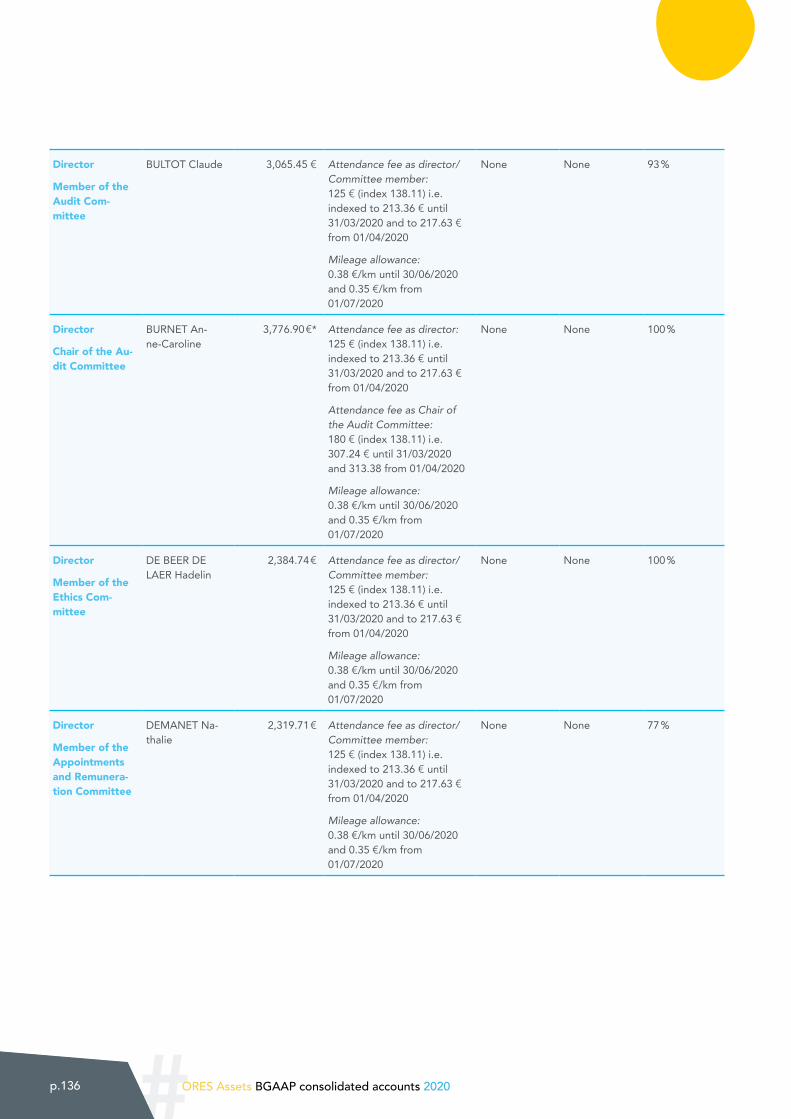
#p.136 ORES Assets BGAAP consolidated accounts 2020
Director
Member of the Audit Com-mittee
BULTOT Claude 3,065.45 € Attendance fee as director/Committee member: 125 € (index 138.11) i.e. indexed to 213.36 € until 31/03/2020 and to 217.63 € from 01/04/2020
Mileage allowance: 0.38 €/km until 30/06/2020 and 0.35 €/km from 01/07/2020
None None 93 %
Director
Chair of the Au-dit Committee
BURNET An-ne-Caroline
3,776.90 €* Attendance fee as director: 125 € (index 138.11) i.e. indexed to 213.36 € until 31/03/2020 and to 217.63 € from 01/04/2020
Attendance fee as Chair of the Audit Committee: 180 € (index 138.11) i.e. 307.24 € until 31/03/2020 and 313.38 from 01/04/2020
Mileage allowance: 0.38 €/km until 30/06/2020 and 0.35 €/km from 01/07/2020
None None 100 %
Director
Member of the Ethics Com-mittee
DE BEER DE LAER Hadelin
2,384.74 € Attendance fee as director/Committee member: 125 € (index 138.11) i.e. indexed to 213.36 € until 31/03/2020 and to 217.63 € from 01/04/2020
Mileage allowance: 0.38 €/km until 30/06/2020 and 0.35 €/km from 01/07/2020
None None 100 %
Director
Member of the Appointments and Remunera-tion Committee
DEMANET Na-thalie
2,319.71 € Attendance fee as director/Committee member: 125 € (index 138.11) i.e. indexed to 213.36 € until 31/03/2020 and to 217.63 € from 01/04/2020
Mileage allowance: 0.38 €/km until 30/06/2020 and 0.35 €/km from 01/07/2020
None None 77 %
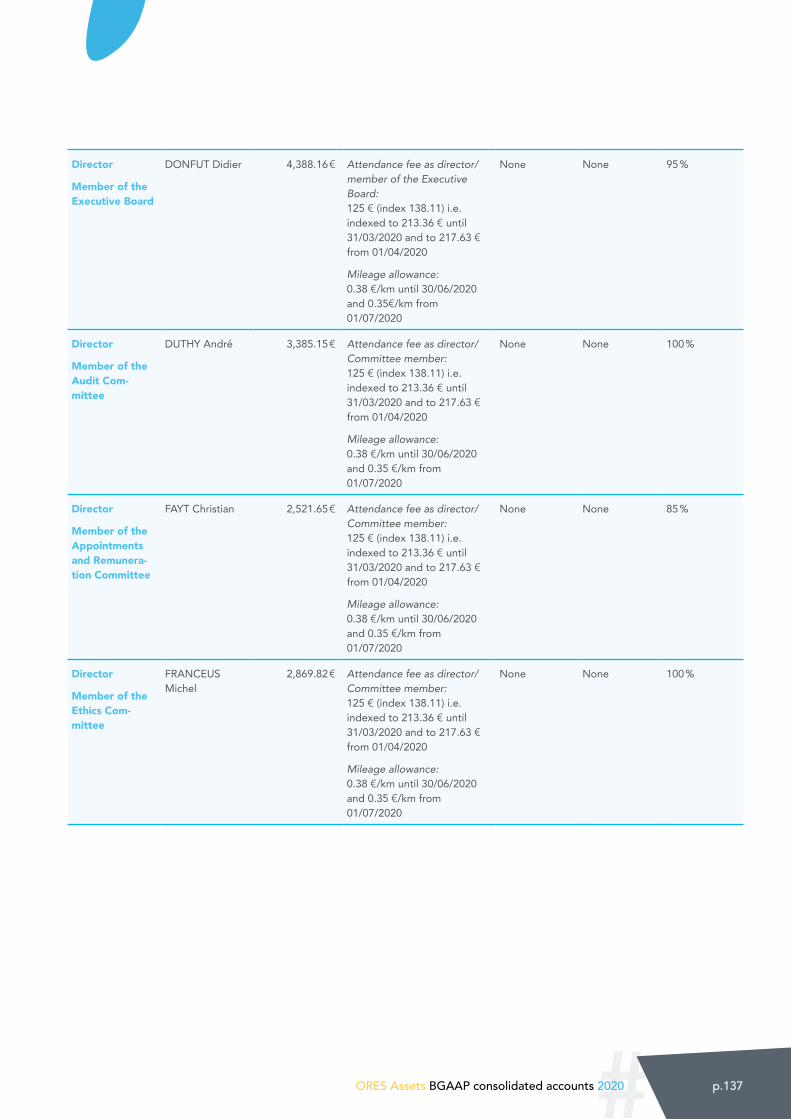
#ORES Assets BGAAP consolidated accounts 2020 p.137
Director
Member of the Executive Board
DONFUT Didier 4,388.16 € Attendance fee as director/member of the Executive Board: 125 € (index 138.11) i.e. indexed to 213.36 € until 31/03/2020 and to 217.63 € from 01/04/2020
Mileage allowance: 0.38 €/km until 30/06/2020 and 0.35€/km from 01/07/2020
None None 95 %
Director
Member of the Audit Com-mittee
DUTHY André 3,385.15 € Attendance fee as director/Committee member: 125 € (index 138.11) i.e. indexed to 213.36 € until 31/03/2020 and to 217.63 € from 01/04/2020
Mileage allowance: 0.38 €/km until 30/06/2020 and 0.35 €/km from 01/07/2020
None None 100 %
Director
Member of the Appointments and Remunera-tion Committee
FAYT Christian 2,521.65 € Attendance fee as director/Committee member: 125 € (index 138.11) i.e. indexed to 213.36 € until 31/03/2020 and to 217.63 € from 01/04/2020
Mileage allowance: 0.38 €/km until 30/06/2020 and 0.35 €/km from 01/07/2020
None None 85 %
Director
Member of the Ethics Com-mittee
FRANCEUS Michel
2,869.82 € Attendance fee as director/Committee member: 125 € (index 138.11) i.e. indexed to 213.36 € until 31/03/2020 and to 217.63 € from 01/04/2020
Mileage allowance: 0.38 €/km until 30/06/2020 and 0.35 €/km from 01/07/2020
None None 100 %
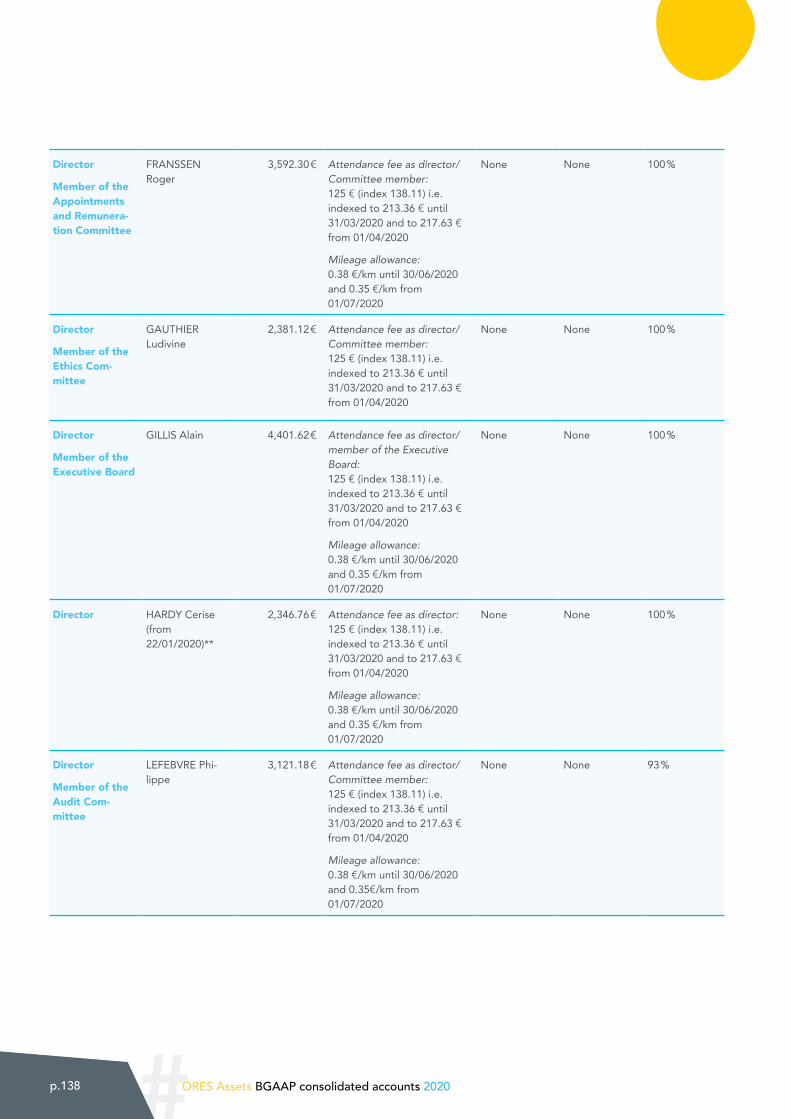
#p.138 ORES Assets BGAAP consolidated accounts 2020
Director
Member of the Appointments and Remunera-tion Committee
FRANSSEN Roger
3,592.30 € Attendance fee as director/Committee member: 125 € (index 138.11) i.e. indexed to 213.36 € until 31/03/2020 and to 217.63 € from 01/04/2020
Mileage allowance: 0.38 €/km until 30/06/2020 and 0.35 €/km from 01/07/2020
None None 100 %
Director
Member of the Ethics Com-mittee
GAUTHIER Ludivine
2,381.12 € Attendance fee as director/Committee member: 125 € (index 138.11) i.e. indexed to 213.36 € until 31/03/2020 and to 217.63 € from 01/04/2020
None None 100 %
Director
Member of the Executive Board
GILLIS Alain 4,401.62 € Attendance fee as director/member of the Executive Board: 125 € (index 138.11) i.e. indexed to 213.36 € until 31/03/2020 and to 217.63 € from 01/04/2020
Mileage allowance: 0.38 €/km until 30/06/2020 and 0.35 €/km from 01/07/2020
None None 100 %
Director HARDY Cerise (from 22/01/2020)**
2,346.76 € Attendance fee as director: 125 € (index 138.11) i.e. indexed to 213.36 € until 31/03/2020 and to 217.63 € from 01/04/2020
Mileage allowance: 0.38 €/km until 30/06/2020 and 0.35 €/km from 01/07/2020
None None 100 %
Director
Member of the Audit Com-mittee
LEFEBVRE Phi-lippe
3,121.18 € Attendance fee as director/Committee member: 125 € (index 138.11) i.e. indexed to 213.36 € until 31/03/2020 and to 217.63 € from 01/04/2020
Mileage allowance: 0.38 €/km until 30/06/2020 and 0.35€/km from 01/07/2020
None None 93 %
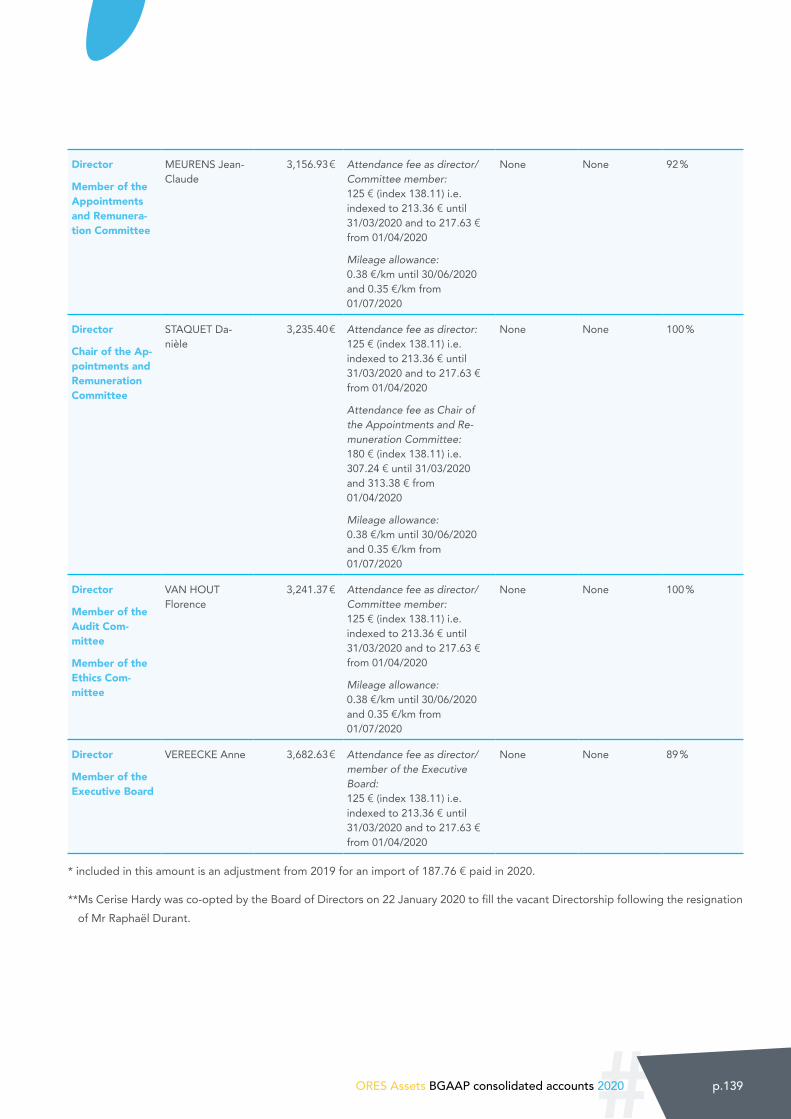
#ORES Assets BGAAP consolidated accounts 2020 p.139
Director
Member of the Appointments and Remunera-tion Committee
MEURENS Jean-Claude
3,156.93 € Attendance fee as director/Committee member: 125 € (index 138.11) i.e. indexed to 213.36 € until 31/03/2020 and to 217.63 € from 01/04/2020
Mileage allowance: 0.38 €/km until 30/06/2020 and 0.35 €/km from 01/07/2020
None None 92 %
Director
Chair of the Ap-pointments and Remuneration Committee
STAQUET Da-nièle
3,235.40 € Attendance fee as director: 125 € (index 138.11) i.e. indexed to 213.36 € until 31/03/2020 and to 217.63 € from 01/04/2020
Attendance fee as Chair of the Appointments and Re-muneration Committee: 180 € (index 138.11) i.e. 307.24 € until 31/03/2020 and 313.38 € from 01/04/2020
Mileage allowance: 0.38 €/km until 30/06/2020 and 0.35 €/km from 01/07/2020
None None 100 %
Director
Member of the Audit Com-mittee
Member of the Ethics Com-mittee
VAN HOUT Florence
3,241.37 € Attendance fee as director/Committee member: 125 € (index 138.11) i.e. indexed to 213.36 € until 31/03/2020 and to 217.63 € from 01/04/2020
Mileage allowance: 0.38 €/km until 30/06/2020 and 0.35 €/km from 01/07/2020
None None 100 %
Director
Member of the Executive Board
VEREECKE Anne 3,682.63 € Attendance fee as director/member of the Executive Board: 125 € (index 138.11) i.e. indexed to 213.36 € until 31/03/2020 and to 217.63 € from 01/04/2020
None None 89 %
* included in this amount is an adjustment from 2019 for an import of 187.76 € paid in 2020.
** Ms Cerise Hardy was co-opted by the Board of Directors on 22 January 2020 to fill the vacant Directorship following the resignation of Mr Raphaël Durant.
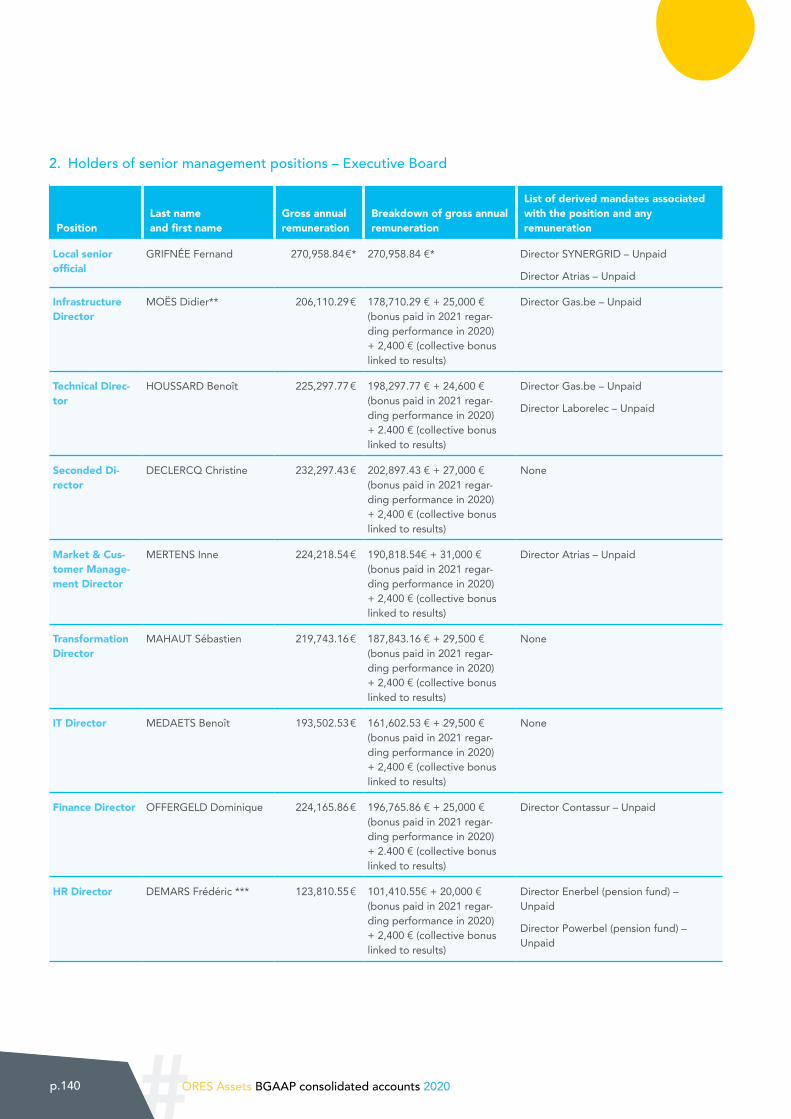
#p.140 ORES Assets BGAAP consolidated accounts 2020
2. Holders of senior management positions – Executive Board
PositionLast name and first name
Gross annual remuneration
Breakdown of gross annual remuneration
List of derived mandates associated with the position and any remuneration
Local senior official
GRIFNÉE Fernand 270,958.84 €* 270,958.84 €* Director SYNERGRID – Unpaid
Director Atrias – Unpaid
Infrastructure Director
MOËS Didier** 206,110.29 € 178,710.29 € + 25,000 € (bonus paid in 2021 regar-ding performance in 2020) + 2,400 € (collective bonus linked to results)
Director Gas.be – Unpaid
Technical Direc-tor
HOUSSARD Benoît 225,297.77 € 198,297.77 € + 24,600 € (bonus paid in 2021 regar-ding performance in 2020) + 2.400 € (collective bonus linked to results)
Director Gas.be – Unpaid
Director Laborelec – Unpaid
Seconded Di-rector
DECLERCQ Christine 232,297.43 € 202,897.43 € + 27,000 € (bonus paid in 2021 regar-ding performance in 2020) + 2,400 € (collective bonus linked to results)
None
Market & Cus-tomer Manage-ment Director
MERTENS Inne 224,218.54 € 190,818.54€ + 31,000 € (bonus paid in 2021 regar-ding performance in 2020) + 2,400 € (collective bonus linked to results)
Director Atrias – Unpaid
Transformation Director
MAHAUT Sébastien 219,743.16 € 187,843.16 € + 29,500 € (bonus paid in 2021 regar-ding performance in 2020) + 2,400 € (collective bonus linked to results)
None
IT Director MEDAETS Benoît 193,502.53 € 161,602.53 € + 29,500 € (bonus paid in 2021 regar-ding performance in 2020) + 2,400 € (collective bonus linked to results)
None
Finance Director OFFERGELD Dominique 224,165.86 € 196,765.86 € + 25,000 € (bonus paid in 2021 regar-ding performance in 2020) + 2.400 € (collective bonus linked to results)
Director Contassur – Unpaid
HR Director DEMARS Frédéric *** 123,810.55 € 101,410.55€ + 20,000 € (bonus paid in 2021 regar-ding performance in 2020) + 2,400 € (collective bonus linked to results)
Director Enerbel (pension fund) – Unpaid
Director Powerbel (pension fund) – Unpaid
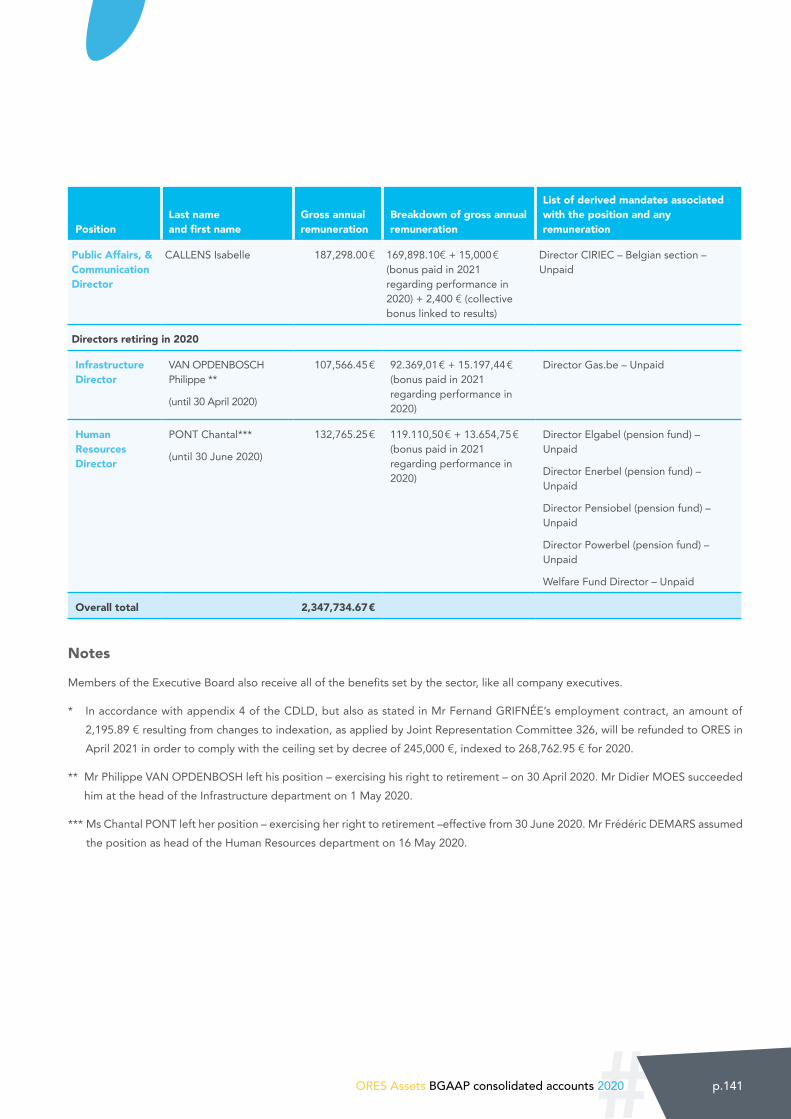
#ORES Assets BGAAP consolidated accounts 2020 p.141
PositionLast name and first name
Gross annual remuneration
Breakdown of gross annual remuneration
List of derived mandates associated with the position and any remuneration
Public Affairs, & Communication Director
CALLENS Isabelle 187,298.00 € 169,898.10€ + 15,000 € (bonus paid in 2021 regarding performance in 2020) + 2,400 € (collective bonus linked to results)
Director CIRIEC – Belgian section – Unpaid
Directors retiring in 2020
Infrastructure Director
VAN OPDENBOSCH Philippe **
(until 30 April 2020)
107,566.45 € 92.369,01 € + 15.197,44 € (bonus paid in 2021 regarding performance in 2020)
Director Gas.be – Unpaid
Human Resources Director
PONT Chantal***
(until 30 June 2020)
132,765.25 € 119.110,50 € + 13.654,75 € (bonus paid in 2021 regarding performance in 2020)
Director Elgabel (pension fund) – Unpaid
Director Enerbel (pension fund) – Unpaid
Director Pensiobel (pension fund) – Unpaid
Director Powerbel (pension fund) – Unpaid
Welfare Fund Director – Unpaid
Overall total 2,347,734.67 €
Notes
Members of the Executive Board also receive all of the benefits set by the sector, like all company executives.
* In accordance with appendix 4 of the CDLD, but also as stated in Mr Fernand GRIFNÉE’s employment contract, an amount of 2,195.89 € resulting from changes to indexation, as applied by Joint Representation Committee 326, will be refunded to ORES in April 2021 in order to comply with the ceiling set by decree of 245,000 €, indexed to 268,762.95 € for 2020.
** Mr Philippe VAN OPDENBOSH left his position – exercising his right to retirement – on 30 April 2020. Mr Didier MOES succeeded him at the head of the Infrastructure department on 1 May 2020.
*** Ms Chantal PONT left her position – exercising her right to retirement –effective from 30 June 2020. Mr Frédéric DEMARS assumed the position as head of the Human Resources department on 16 May 2020.
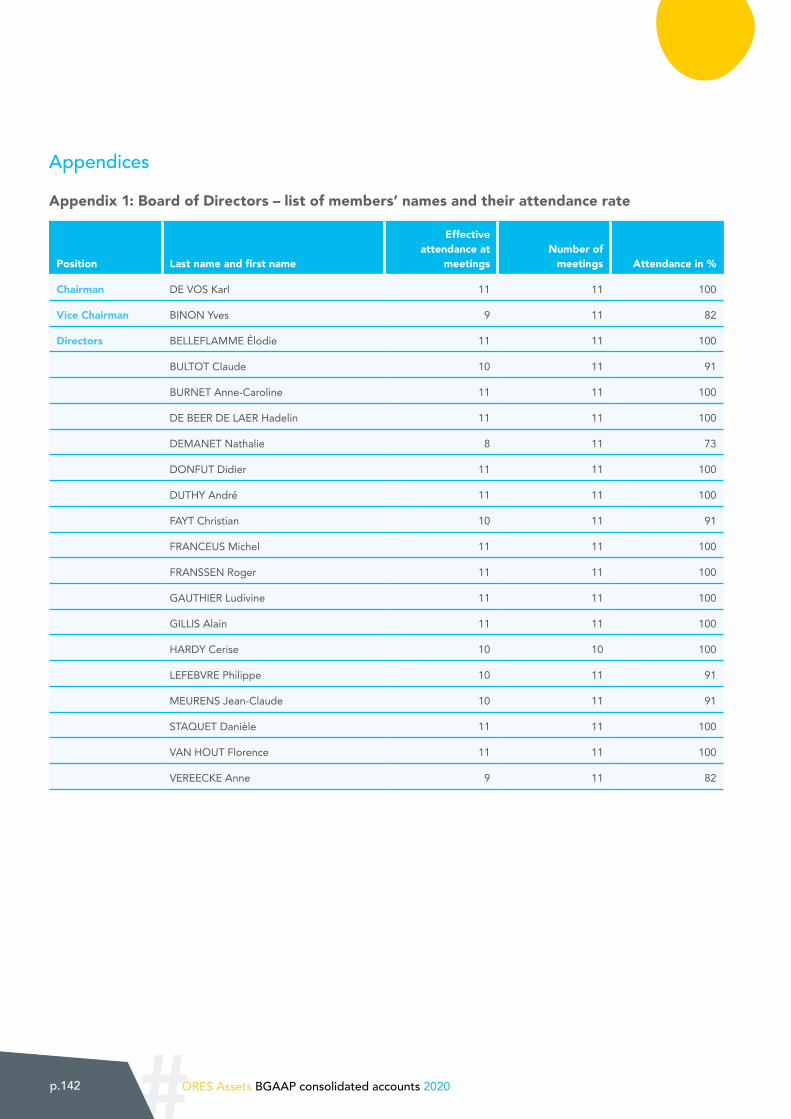
#p.142 ORES Assets BGAAP consolidated accounts 2020
Appendices
Appendix 1: Board of Directors – list of members’ names and their attendance rate
Position Last name and first name
Effective attendance at
meetingsNumber of
meetings Attendance in %
Chairman DE VOS Karl 11 11 100
Vice Chairman BINON Yves 9 11 82
Directors BELLEFLAMME Élodie 11 11 100
BULTOT Claude 10 11 91
BURNET Anne-Caroline 11 11 100
DE BEER DE LAER Hadelin 11 11 100
DEMANET Nathalie 8 11 73
DONFUT Didier 11 11 100
DUTHY André 11 11 100
FAYT Christian 10 11 91
FRANCEUS Michel 11 11 100
FRANSSEN Roger 11 11 100
GAUTHIER Ludivine 11 11 100
GILLIS Alain 11 11 100
HARDY Cerise 10 10 100
LEFEBVRE Philippe 10 11 91
MEURENS Jean-Claude 10 11 91
STAQUET Danièle 11 11 100
VAN HOUT Florence 11 11 100
VEREECKE Anne 9 11 82
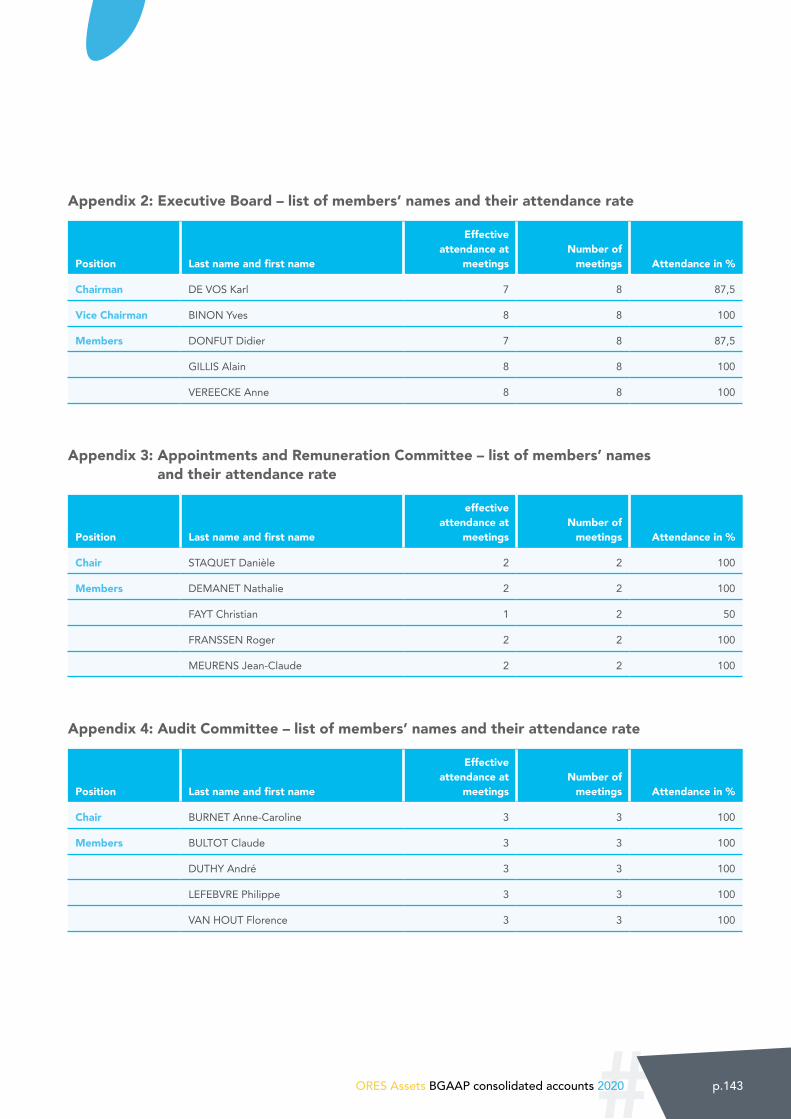
#ORES Assets BGAAP consolidated accounts 2020 p.143
Appendix 2: Executive Board – list of members’ names and their attendance rate
Position Last name and first name
Effective attendance at
meetingsNumber of
meetings Attendance in %
Chairman DE VOS Karl 7 8 87,5
Vice Chairman BINON Yves 8 8 100
Members DONFUT Didier 7 8 87,5
GILLIS Alain 8 8 100
VEREECKE Anne 8 8 100
Appendix 3: Appointments and Remuneration Committee – list of members’ names and their attendance rate
Position Last name and first name
effective attendance at
meetingsNumber of
meetings Attendance in %
Chair STAQUET Danièle 2 2 100
Members DEMANET Nathalie 2 2 100
FAYT Christian 1 2 50
FRANSSEN Roger 2 2 100
MEURENS Jean-Claude 2 2 100
Appendix 4: Audit Committee – list of members’ names and their attendance rate
Position Last name and first name
Effectiveattendance at
meetingsNumber of
meetings Attendance in %
Chair BURNET Anne-Caroline 3 3 100
Members BULTOT Claude 3 3 100
DUTHY André 3 3 100
LEFEBVRE Philippe 3 3 100
VAN HOUT Florence 3 3 100
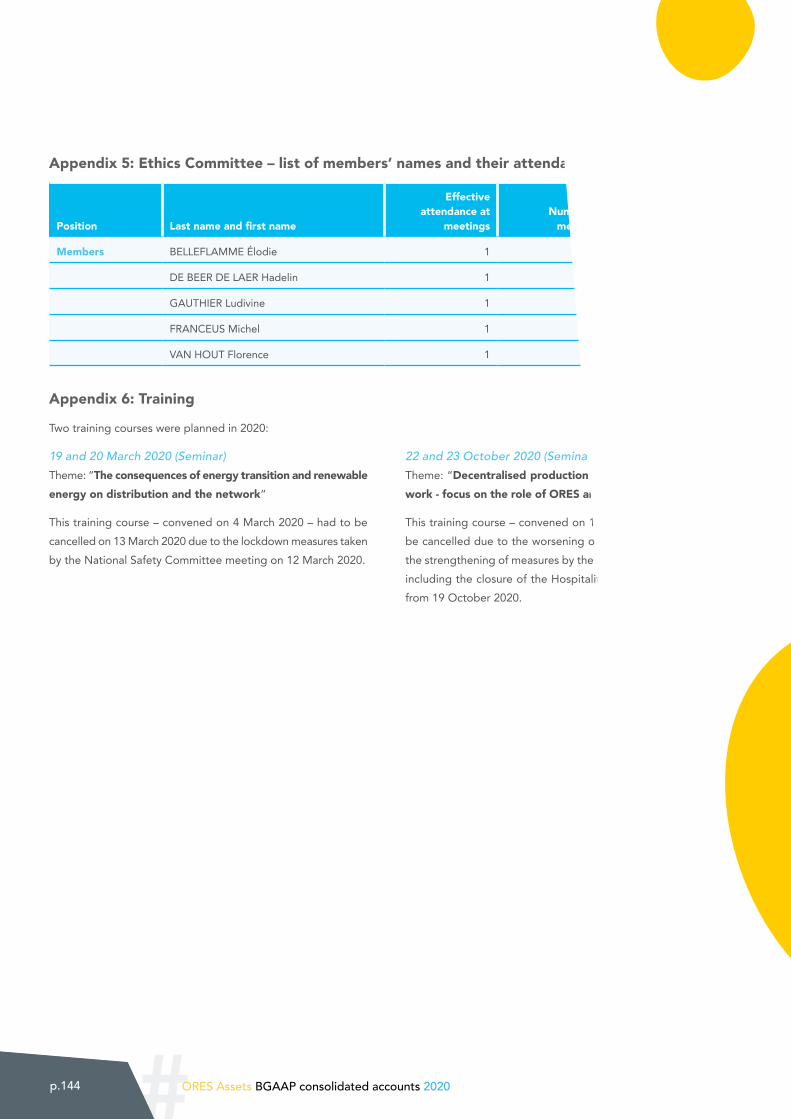
#p.144 ORES Assets BGAAP consolidated accounts 2020
Appendix 5: Ethics Committee – list of members’ names and their attendance rate
Position Last name and first name
Effectiveattendance at
meetingsNumber of
meetings Attendance in %
Members BELLEFLAMME Élodie 1 1 100
DE BEER DE LAER Hadelin 1 1 100
GAUTHIER Ludivine 1 1 100
FRANCEUS Michel 1 1 100
VAN HOUT Florence 1 1 100
Appendix 6: Training
Two training courses were planned in 2020:
19 and 20 March 2020 (Seminar)
Theme: “The consequences of energy transition and renewable energy on distribution and the network”
This training course – convened on 4 March 2020 – had to be cancelled on 13 March 2020 due to the lockdown measures taken by the National Safety Committee meeting on 12 March 2020.
22 and 23 October 2020 (Seminar)
Theme: “Decentralised production and the distribution net-work - focus on the role of ORES and focus on equalisation”
This training course – convened on 13 October 2020 – had to be cancelled due to the worsening of the health situation and the strengthening of measures by the Consultation Committee, including the closure of the Hospitality industry to take effect from 19 October 2020.

#ORES Assets BGAAP consolidated accounts 2020 p.145
VI SPECIFIC REPORT ON SHAREHOLDINGS
#ORES Assets BGAAP consolidated accounts 2020 p.147
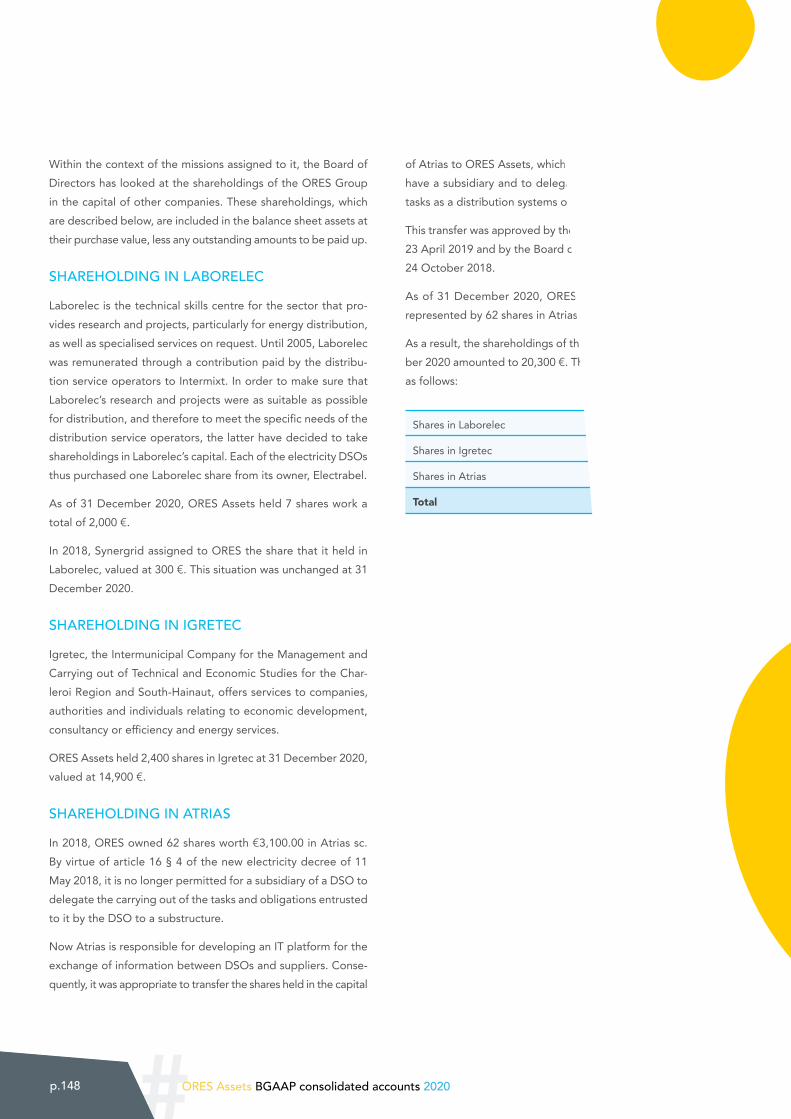
#p.148 ORES Assets BGAAP consolidated accounts 2020
Within the context of the missions assigned to it, the Board of Directors has looked at the shareholdings of the ORES Group in the capital of other companies. These shareholdings, which are described below, are included in the balance sheet assets at their purchase value, less any outstanding amounts to be paid up.
SHAREHOLDING IN LABORELEC
Laborelec is the technical skills centre for the sector that pro-vides research and projects, particularly for energy distribution, as well as specialised services on request. Until 2005, Laborelec was remunerated through a contribution paid by the distribu-tion service operators to Intermixt. In order to make sure that Laborelec’s research and projects were as suitable as possible for distribution, and therefore to meet the specific needs of the distribution service operators, the latter have decided to take shareholdings in Laborelec’s capital. Each of the electricity DSOs thus purchased one Laborelec share from its owner, Electrabel.
As of 31 December 2020, ORES Assets held 7 shares work a total of 2,000 €.
In 2018, Synergrid assigned to ORES the share that it held in Laborelec, valued at 300 €. This situation was unchanged at 31 December 2020.
SHAREHOLDING IN IGRETEC
Igretec, the Intermunicipal Company for the Management and Carrying out of Technical and Economic Studies for the Char-leroi Region and South-Hainaut, offers services to companies, authorities and individuals relating to economic development, consultancy or efficiency and energy services.
ORES Assets held 2,400 shares in Igretec at 31 December 2020, valued at 14,900 €.
SHAREHOLDING IN ATRIAS
In 2018, ORES owned 62 shares worth €3,100.00 in Atrias sc. By virtue of article 16 § 4 of the new electricity decree of 11 May 2018, it is no longer permitted for a subsidiary of a DSO to delegate the carrying out of the tasks and obligations entrusted to it by the DSO to a substructure.
Now Atrias is responsible for developing an IT platform for the exchange of information between DSOs and suppliers. Conse-quently, it was appropriate to transfer the shares held in the capital
of Atrias to ORES Assets, which is the only entity authorised to have a subsidiary and to delegate the activities relating to its tasks as a distribution systems operator.
This transfer was approved by the General Meeting of Atrias on 23 April 2019 and by the Board of Directors of ORES Assets on 24 October 2018.
As of 31 December 2020, ORES Assets held a €3,100 stake represented by 62 shares in Atrias.
As a result, the shareholdings of the ORES Group at 31 Decem-ber 2020 amounted to 20,300 €. This amount was broken down as follows:
Shares in Laborelec 2,300 €
Shares in Igretec 14,900 €
Shares in Atrias 3,100 €
Total 20,300 €

#ORES Assets BGAAP consolidated accounts 2020 p.149
#p.150 ORES Assets BGAAP consolidated accounts 2020
VII GRI INDEX
#ORES Assets BGAAP consolidated accounts 2020 p.151#ORES Assets BGAAP consolidated accounts 2020 p.151
#p.152 ORES Assets BGAAP consolidated accounts 2020
Organisation profile
GRI 102 General disclosures 102-1 Name of the organisation ORES and ORES Assets
GRI 102 General disclosures 102-2 Activities, brands, products and services
See section on “Presentation of the company”, pages 6 and 7.
GRI 102 General disclosures 102-3 Location of head office 14 Avenue Jean Mermoz, 6041 Gosselies – Belgium
GRI 102 General disclosures 102-4 Location of operational sites The company’s business territory is presented in the sec-tion on “Presentation of the company”, page 7 – the main sites are also stated in the section on “Energy transition and the environment”, page 16.
GRI 102 General disclosures 102-5 Capital and legal form See the section on “Governance and transparency”, page 59, as well as the Management Report – page 70. Further-more, in accordance with the Code of Companies and As-sociations, which came into effect on 1 January 2020 and which replaces the Companies’ Code, ORES and ORES Assets have opted for the form of a cooperative company instead of a limited liability cooperative company.
GRI 102 General disclosures 102-6 Markets served See the section on “Presentation of the company”, page 7.
GRI 102 General disclosures 102-7 Size of the organisation See the section on “Presentation of the company”, page 6.
GRI 102 General disclosures 102-8 Information about em-ployees and other workers
See the section on “Corporate Culture and wellbeing at work”, page 54.
GRI 102 General disclosures 102-9 Supply chain See the section on “Ethics and fair practices”, page 65.
GRI 102 General disclosures 102-10 Significant changes to the organisation and its supply chain
NA
GRI 102 General disclosures 102-11 Principle of precaution or preventative approach
See “Description of the main risks and uncertainties facing the company”, page 75.
GRI 102 General disclosures 102-12 External initiatives Walloon Public Lighting Charter – Internet of Energy
GRI 102 General disclosures 102-13 Membership of associations Ciriec – E.DSO - Gas.be - Synergrid - UVCW - UWE
Strategy
GRI 102 General disclosures 102-14 Statement from senior deci-sion-maker
See Introductory message, pages 4 and 5.
Ethics and integrity
GRI 102 General disclosures 102-16 Mechanism for advice and management of concerns about ethics
See the sections on “Ethics and Fair Practices”, page 65 and “Remuneration reports”, section on Presentation of the management bodies, page 126.
GRI 102 General disclosures 102-17 Mechanism for advice and management of concerns about ethics
Ethics charter for staff members – Ethics charter for sup-pliers – Market Abuse Enforcement Code
#ORES Assets BGAAP consolidated accounts 2020 p.153
Governance
GRI 102 General disclosures 102-18 Governance structure The Board of Directors has the broadest powers when it comes to achieving the corporate objects as well as managing the company. Everything that is not specifical-ly entrusted by law or the articles of association to the general meeting comes under its jurisdiction. The different committees and their respective roles are described in the Remuneration Report. Additional information available in the articles of association, the Corporate Governance Charter and the Internal Regulations.
GRI 102 General disclosures 102-19 Delegation of authority The Board of Directors may delegate - with the option of sub-delegation - the day-to-day management of the com-pany and the representation of the company with regard to this management to the person who is the Chairman of the ORES Executive Board. In the context of day-to-day management, the person delegated may sub-delegate special powers to company employees and particularly to members of the Executive Board. For ORES Assets, the delegation is made to the benefit of the Chairman of the Executive Board. Additional information available in the articles of association, the Corporate Governance Charter and the Internal Regulations.
GRI 102 General disclosures 102-20 Executive-level responsibi-lity for economic, environ-mental and social topics
By virtue of the company’s articles of association, the ORES Board of Directors can delegate all or some of its management powers to an Executive Board in accordance with the Code of Companies and Associations. In matters and for questions relating to the day-to-day management, as entrusted by the Board of Directors and sub-delegated by the person delegated to day-to-day management, the Board of Directors deliberates and issues recom-mendations each time one of its members (including the Chairman) so requests. The ORES Board of Directors appoints and dismisses the Chairman of the Executive Board after consulting the Appointments and Remune-ration Committee. The Chairman of the Executive Board submits proposals to the Board of Directors on appointing and dismissing members of this Board after consulting the Appointments and Remuneration Committee. The Board of Directors establishes the Internal Regulations of the Executive Board through an appendix to the Corporate Governance Charter.
#p.154 ORES Assets BGAAP consolidated accounts 2020
GRI 102 General disclosures 102-21 Consulting stakeholders on economic and social issues
The Board of Directors meets at regular intervals, and at least six times per year, under the leadership of its Chairman in order to, as far as ORES is concerned, after its various Committees have expressed their views regarding their respective areas of expertise, fulfil the different roles described in the corporate governance charter. Additional information is available in the Corporate Governance Charter and the Internal Regulations.
As part of the (re)definition of its major sustainable development issues and establishing its materiality matrix - see the “Corporate social responsibility and sustainable development” section, page 12 - the company invited 35 stakeholders, selected with regard to the place that ORES has in Walloon society, to take part in a discussion session on the issue. This meeting took place on 11 December 2020 and brought together, in addition to managers from ORES, 18 representatives of stakeholders, among various players from the energy sector, including the Belgian Federation of Electricity and Gas Companies, the Walloon market regulator (CWaPE), representatives of the public authorities (ministerial offices and the Walloon Public Services for energy and sustainable development, the Union of Walloon Cities and Municipalities, the Federation of Walloon PCSWs, Inter-Environment Wallonia, the City of Charleroi, the Walloon network combating energy poverty and the Walloon network for sustainable access to energy, representatives from the academic world (ULiège – Université Catholique de Louvain) and trade federations (road-building and construction companies). In addition, four other stakeholders who were unable to take part in the exercise submitted their input via the materiality questionnaire sent ahead of the round table to all of the stakeholders consulted.
GRI 102 General disclosures 102-22 Composition of the highest governance body and its committees
See the section on “Remuneration reports”, page 124.
GRI 102 General disclosures 102-23 Chair of the highest gover-nance body
See the section on “Remuneration reports”, page 124.
GRI 102 General disclosures 102-24 Appointing and selecting the highest governance body
Without prejudice to the areas that the law stipulates are the responsibility of the General Meeting, the Board of Di-rectors is made up exclusively of non-executive directors, with the exception of the Chair of the Executive Board. The Board of Directors makes sure that, overall, thanks to its diverse composition, it encompasses the skills and experience needed to fulfil its roles. The General Meeting appoints and dismisses the directors.
GRI 102 General disclosures 102-25 Conflicts of interest Directors pay close attention to their legal and ethical obligations in terms of conflicts of interests, particularly in accordance with article 6:64 of the Code of Companies and Associations, the provisions of decrees, including in particular those imposed by the Local Democracy and Decentralisation Code (CDLD) and by electricity and gas decrees. More information in the Corporate Governance Charter.
#ORES Assets BGAAP consolidated accounts 2020 p.155
GRI 102 General disclosures 102-26 Role of the highest gover-nance body in setting pur-pose, values and strategy
See the section on “Governance and transparency”, page 59 and Remuneration Report page 124.
GRI 102 General disclosures 102-27 Collective knowledge of the highest governance body
See the section on “Governance and Transparency”, page 59 and Remuneration Report, page 124.
GRI 102 General disclosures 102-28 Evaluation of the per-formance of the highest governance body
The Board of Directors reviews and evaluates:
1) its own effectiveness, as well as the effectiveness of the company’s governance structure, and the role and tasks of the various Committees and the Executive Bureau;
2) every year, the performance of the Chairman of the Executive Board and, at the proposal of the Chairman of the Executive Board, other members of the Executive Board, within the context of the procedure relating to determining the proportion of their remuneration linked to performance.
GRI 102 General disclosures 102-29 Identifying and managing economic, environmental and social impacts
See the section on “Governance and transparency”, page 12 and Management Report, page 70.
GRI 102 General disclosures 102-30 Effectiveness of risk mana-gement processes
The roles of the Board of Directors include examining and analysing the company’s financial targets, including in particular in terms of risk profiles and allocating resources and taking into account tariffs to be approved/already approved by the regulator. It is also stipulated that, once a year, a meeting of the Board of Directors addresses the company’s strategy. During the year, an update is given on its progress. The Audit Committee and the Executive Board carry out an annual evaluation.
GRI 102 General disclosures 102-31 Review of economic, envi-ronmental and social issues
This review is completed:
1) annually in the Management Report (risk report)
2) quarterly (summary report on main performance indica-tors)
GRI 102 General disclosures 102-32 Highest governance body’s role in reporting on sustai-nable development
The Board of Directors approves the policy for reporting on sustainable development, analyses all of the supporting documents for the annual report and submits them to the General Meeting for approval.
GRI 102 General disclosures 102-33 Communicating critical concerns
See Management Report – Description of key risks and uncertainties faced by the company, page 75.
GRI 102 General disclosures 102-34 Nature and total number of critical concerns
See Management Report – description of key risks and uncertainties faced by the company, page 75.
GRI 102 General disclosures 102-35 Remuneration Policies See the section on “Remuneration Report”, page 124.
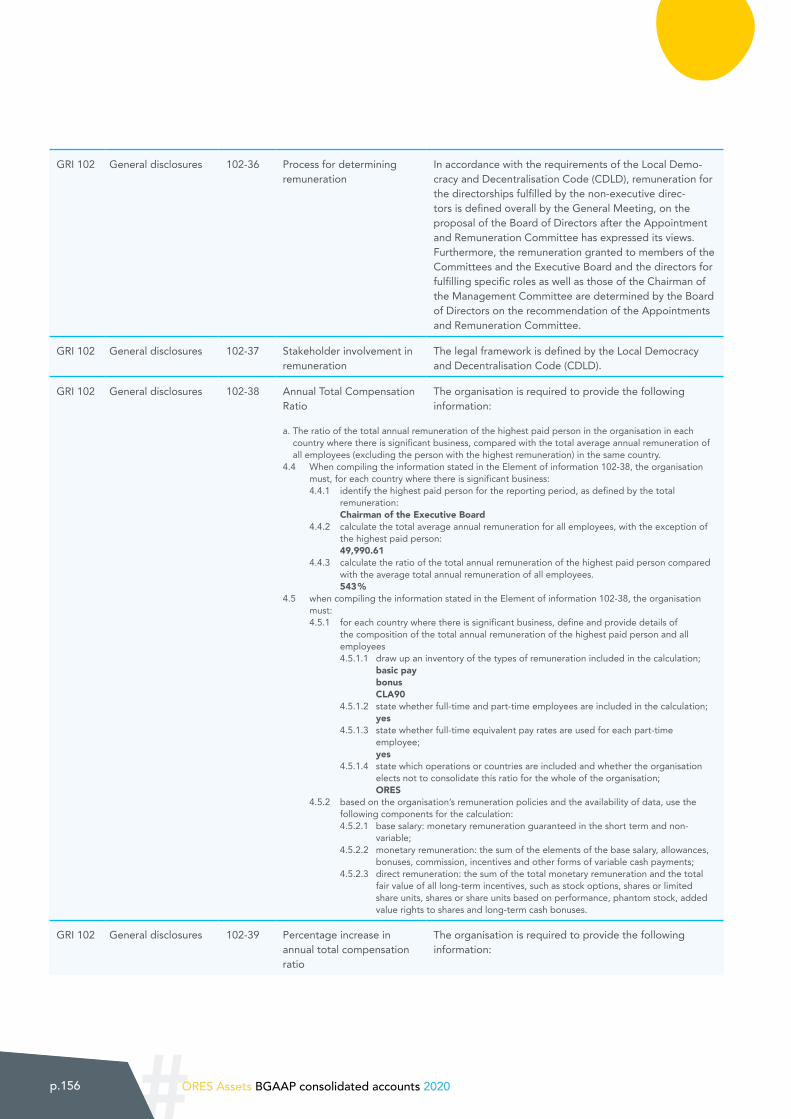
#p.156 ORES Assets BGAAP consolidated accounts 2020
GRI 102 General disclosures 102-36 Process for determining remuneration
In accordance with the requirements of the Local Demo-cracy and Decentralisation Code (CDLD), remuneration for the directorships fulfilled by the non-executive direc-tors is defined overall by the General Meeting, on the proposal of the Board of Directors after the Appointment and Remuneration Committee has expressed its views. Furthermore, the remuneration granted to members of the Committees and the Executive Board and the directors for fulfilling specific roles as well as those of the Chairman of the Management Committee are determined by the Board of Directors on the recommendation of the Appointments and Remuneration Committee.
GRI 102 General disclosures 102-37 Stakeholder involvement in remuneration
The legal framework is defined by the Local Democracy and Decentralisation Code (CDLD).
GRI 102 General disclosures 102-38 Annual Total Compensation Ratio
The organisation is required to provide the following information:
a. The ratio of the total annual remuneration of the highest paid person in the organisation in each country where there is significant business, compared with the total average annual remuneration of all employees (excluding the person with the highest remuneration) in the same country.
4.4 When compiling the information stated in the Element of information 102-38, the organisation must, for each country where there is significant business:
4.4.1 identify the highest paid person for the reporting period, as defined by the total remuneration:
Chairman of the Executive Board 4.4.2 calculate the total average annual remuneration for all employees, with the exception of
the highest paid person: 49,990.61 4.4.3 calculate the ratio of the total annual remuneration of the highest paid person compared
with the average total annual remuneration of all employees. 543 %4.5 when compiling the information stated in the Element of information 102-38, the organisation
must: 4.5.1 for each country where there is significant business, define and provide details of
the composition of the total annual remuneration of the highest paid person and all employees
4.5.1.1 draw up an inventory of the types of remuneration included in the calculation; basic pay bonus CLA90 4.5.1.2 state whether full-time and part-time employees are included in the calculation; yes 4.5.1.3 state whether full-time equivalent pay rates are used for each part-time
employee; yes 4.5.1.4 state which operations or countries are included and whether the organisation
elects not to consolidate this ratio for the whole of the organisation; ORES 4.5.2 based on the organisation’s remuneration policies and the availability of data, use the
following components for the calculation: 4.5.2.1 base salary: monetary remuneration guaranteed in the short term and non-
variable; 4.5.2.2 monetary remuneration: the sum of the elements of the base salary, allowances,
bonuses, commission, incentives and other forms of variable cash payments; 4.5.2.3 direct remuneration: the sum of the total monetary remuneration and the total
fair value of all long-term incentives, such as stock options, shares or limited share units, shares or share units based on performance, phantom stock, added value rights to shares and long-term cash bonuses.
GRI 102 General disclosures 102-39 Percentage increase in annual total compensation ratio
The organisation is required to provide the following information:
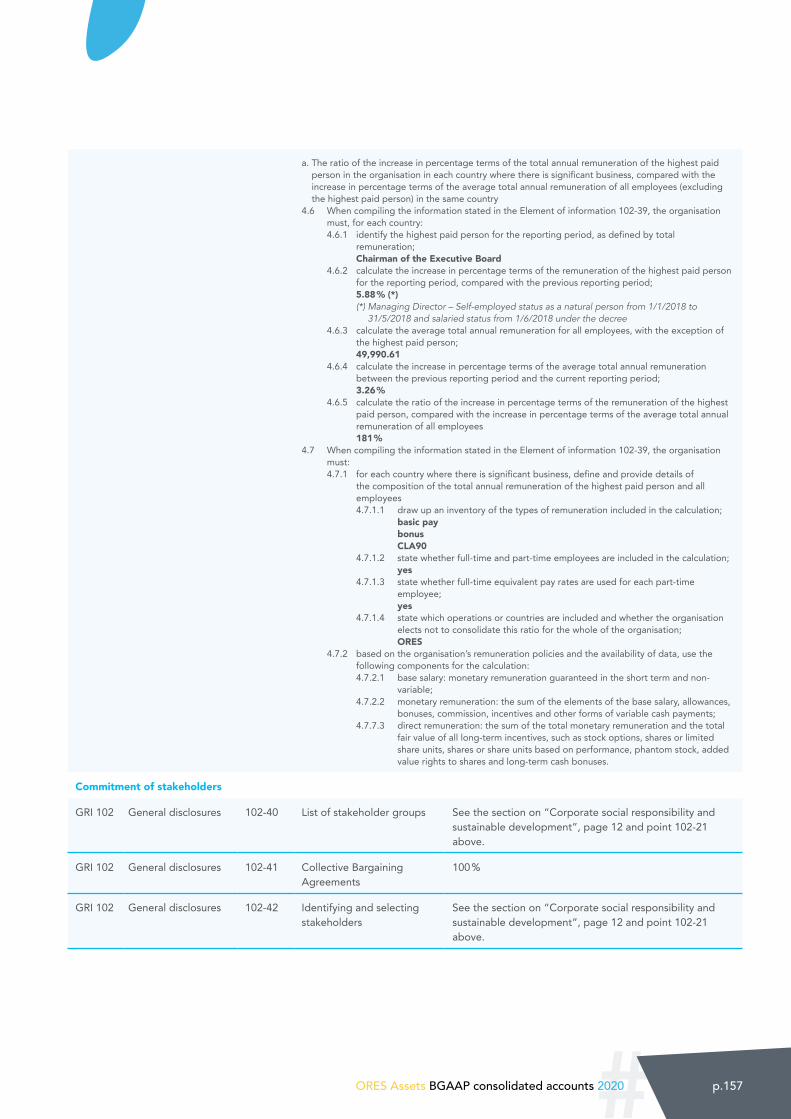
#ORES Assets BGAAP consolidated accounts 2020 p.157
a. The ratio of the increase in percentage terms of the total annual remuneration of the highest paid person in the organisation in each country where there is significant business, compared with the increase in percentage terms of the average total annual remuneration of all employees (excluding the highest paid person) in the same country
4.6 When compiling the information stated in the Element of information 102-39, the organisation must, for each country:
4.6.1 identify the highest paid person for the reporting period, as defined by total remuneration;
Chairman of the Executive Board 4.6.2 calculate the increase in percentage terms of the remuneration of the highest paid person
for the reporting period, compared with the previous reporting period; 5.88 % (*) (*) Managing Director – Self-employed status as a natural person from 1/1/2018 to
31/5/2018 and salaried status from 1/6/2018 under the decree 4.6.3 calculate the average total annual remuneration for all employees, with the exception of
the highest paid person; 49,990.61 4.6.4 calculate the increase in percentage terms of the average total annual remuneration
between the previous reporting period and the current reporting period; 3.26 % 4.6.5 calculate the ratio of the increase in percentage terms of the remuneration of the highest
paid person, compared with the increase in percentage terms of the average total annual remuneration of all employees
181 %4.7 When compiling the information stated in the Element of information 102-39, the organisation
must: 4.7.1 for each country where there is significant business, define and provide details of
the composition of the total annual remuneration of the highest paid person and all employees
4.7.1.1 draw up an inventory of the types of remuneration included in the calculation; basic pay bonus CLA90 4.7.1.2 state whether full-time and part-time employees are included in the calculation; yes 4.7.1.3 state whether full-time equivalent pay rates are used for each part-time
employee; yes 4.7.1.4 state which operations or countries are included and whether the organisation
elects not to consolidate this ratio for the whole of the organisation; ORES 4.7.2 based on the organisation’s remuneration policies and the availability of data, use the
following components for the calculation: 4.7.2.1 base salary: monetary remuneration guaranteed in the short term and non-
variable; 4.7.2.2 monetary remuneration: the sum of the elements of the base salary, allowances,
bonuses, commission, incentives and other forms of variable cash payments; 4.7.7.3 direct remuneration: the sum of the total monetary remuneration and the total
fair value of all long-term incentives, such as stock options, shares or limited share units, shares or share units based on performance, phantom stock, added value rights to shares and long-term cash bonuses.
Commitment of stakeholders
GRI 102 General disclosures 102-40 List of stakeholder groups See the section on “Corporate social responsibility and sustainable development”, page 12 and point 102-21 above.
GRI 102 General disclosures 102-41 Collective Bargaining Agreements
100 %
GRI 102 General disclosures 102-42 Identifying and selecting stakeholders
See the section on “Corporate social responsibility and sustainable development”, page 12 and point 102-21 above.
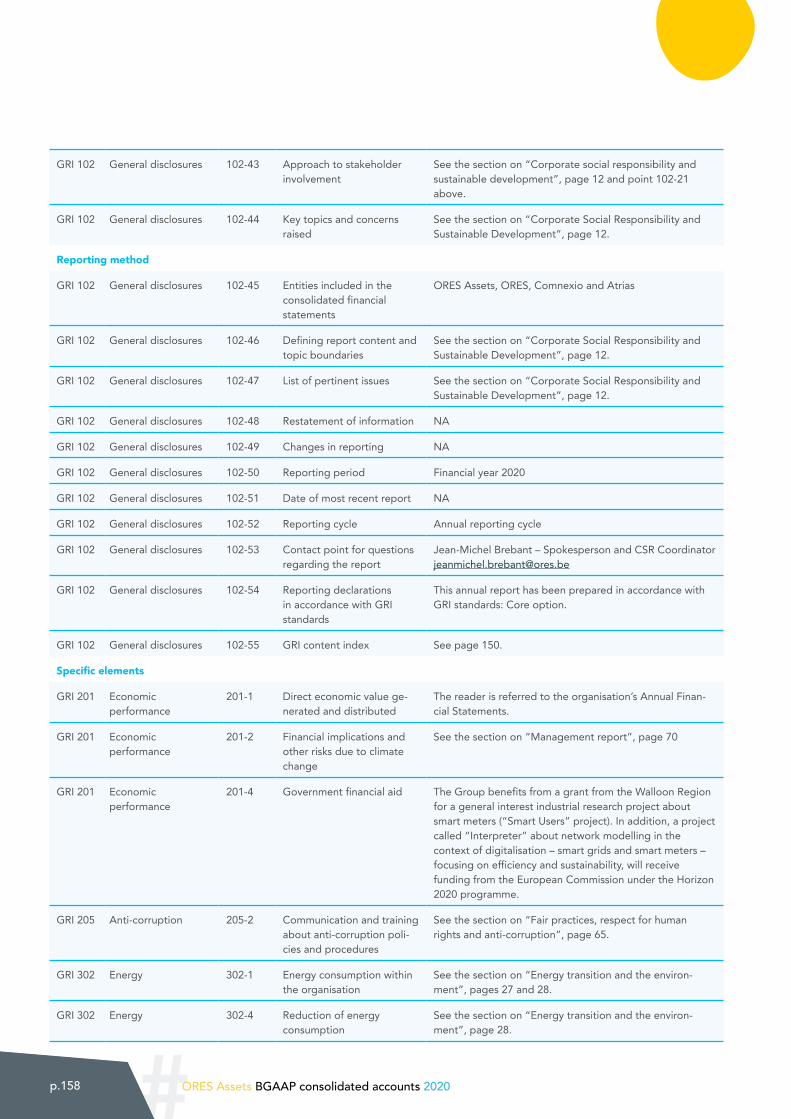
#p.158 ORES Assets BGAAP consolidated accounts 2020
GRI 102 General disclosures 102-43 Approach to stakeholder involvement
See the section on “Corporate social responsibility and sustainable development”, page 12 and point 102-21 above.
GRI 102 General disclosures 102-44 Key topics and concerns raised
See the section on “Corporate Social Responsibility and Sustainable Development”, page 12.
Reporting method
GRI 102 General disclosures 102-45 Entities included in the consolidated financial statements
ORES Assets, ORES, Comnexio and Atrias
GRI 102 General disclosures 102-46 Defining report content and topic boundaries
See the section on “Corporate Social Responsibility and Sustainable Development”, page 12.
GRI 102 General disclosures 102-47 List of pertinent issues See the section on “Corporate Social Responsibility and Sustainable Development”, page 12.
GRI 102 General disclosures 102-48 Restatement of information NA
GRI 102 General disclosures 102-49 Changes in reporting NA
GRI 102 General disclosures 102-50 Reporting period Financial year 2020
GRI 102 General disclosures 102-51 Date of most recent report NA
GRI 102 General disclosures 102-52 Reporting cycle Annual reporting cycle
GRI 102 General disclosures 102-53 Contact point for questions regarding the report
Jean-Michel Brebant – Spokesperson and CSR Coordinator [email protected]
GRI 102 General disclosures 102-54 Reporting declarations in accordance with GRI standards
This annual report has been prepared in accordance with GRI standards: Core option.
GRI 102 General disclosures 102-55 GRI content index See page 150.
Specific elements
GRI 201 Economic performance
201-1 Direct economic value ge-nerated and distributed
The reader is referred to the organisation’s Annual Finan-cial Statements.
GRI 201 Economic performance
201-2 Financial implications and other risks due to climate change
See the section on “Management report”, page 70
GRI 201 Economic performance
201-4 Government financial aid The Group benefits from a grant from the Walloon Region for a general interest industrial research project about smart meters (“Smart Users” project). In addition, a project called “Interpreter” about network modelling in the context of digitalisation – smart grids and smart meters – focusing on efficiency and sustainability, will receive funding from the European Commission under the Horizon 2020 programme.
GRI 205 Anti-corruption 205-2 Communication and training about anti-corruption poli-cies and procedures
See the section on “Fair practices, respect for human rights and anti-corruption”, page 65.
GRI 302 Energy 302-1 Energy consumption within the organisation
See the section on “Energy transition and the environ-ment”, pages 27 and 28.
GRI 302 Energy 302-4 Reduction of energy consumption
See the section on “Energy transition and the environ-ment”, page 28.
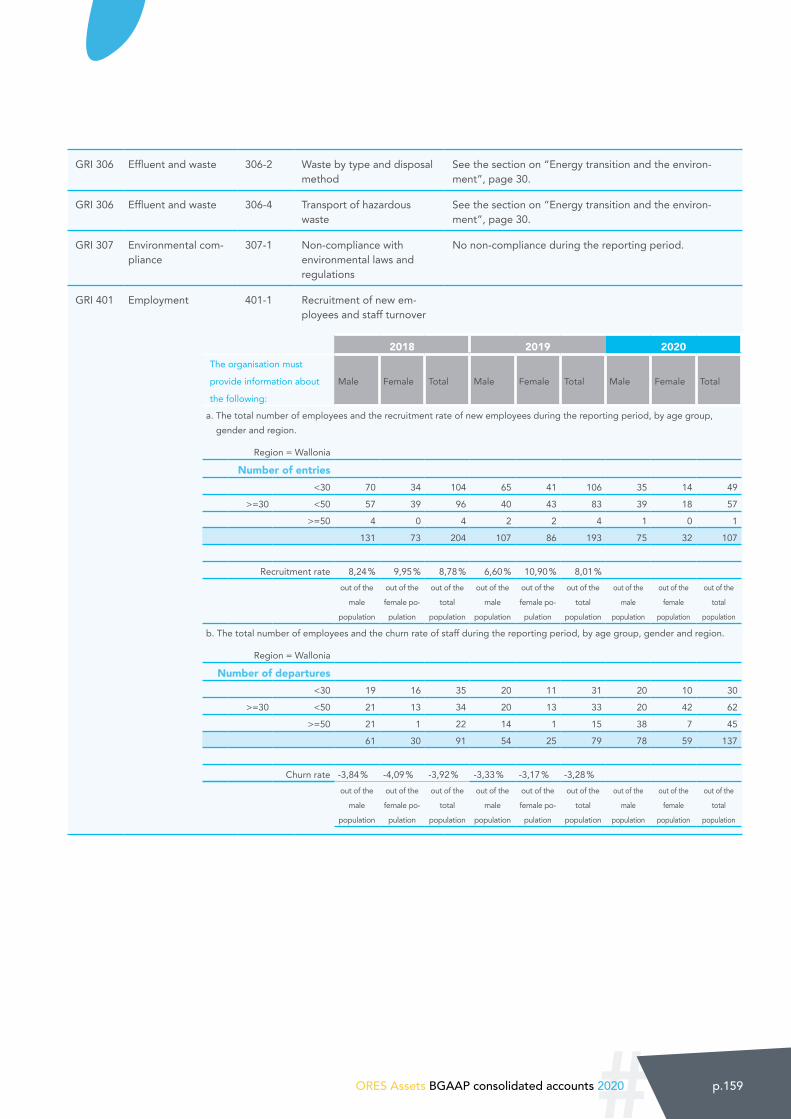
#ORES Assets BGAAP consolidated accounts 2020 p.159
GRI 306 Effluent and waste 306-2 Waste by type and disposal method
See the section on “Energy transition and the environ-ment”, page 30.
GRI 306 Effluent and waste 306-4 Transport of hazardous waste
See the section on “Energy transition and the environ-ment”, page 30.
GRI 307 Environmental com-pliance
307-1 Non-compliance with environmental laws and regulations
No non-compliance during the reporting period.
GRI 401 Employment 401-1 Recruitment of new em-ployees and staff turnover
2018 2019 2020The organisation must
provide information about
the following:
Male Female Total Male Female Total Male Female Total
a. The total number of employees and the recruitment rate of new employees during the reporting period, by age group, gender and region.
Region = Wallonia
Number of entries<30 70 34 104 65 41 106 35 14 49
>=30 <50 57 39 96 40 43 83 39 18 57
>=50 4 0 4 2 2 4 1 0 1
131 73 204 107 86 193 75 32 107
Recruitment rate 8,24 % 9,95 % 8,78 % 6,60 % 10,90 % 8,01 %out of the
male
population
out of the
female po-
pulation
out of the
total
population
out of the
male
population
out of the
female po-
pulation
out of the
total
population
out of the
male
population
out of the
female
population
out of the
total
population
b. The total number of employees and the churn rate of staff during the reporting period, by age group, gender and region.
Region = Wallonia
Number of departures<30 19 16 35 20 11 31 20 10 30
>=30 <50 21 13 34 20 13 33 20 42 62
>=50 21 1 22 14 1 15 38 7 45
61 30 91 54 25 79 78 59 137
Churn rate -3,84 % -4,09 % -3,92 % -3,33 % -3,17 % -3,28 %out of the
male
population
out of the
female po-
pulation
out of the
total
population
out of the
male
population
out of the
female po-
pulation
out of the
total
population
out of the
male
population
out of the
female
population
out of the
total
population
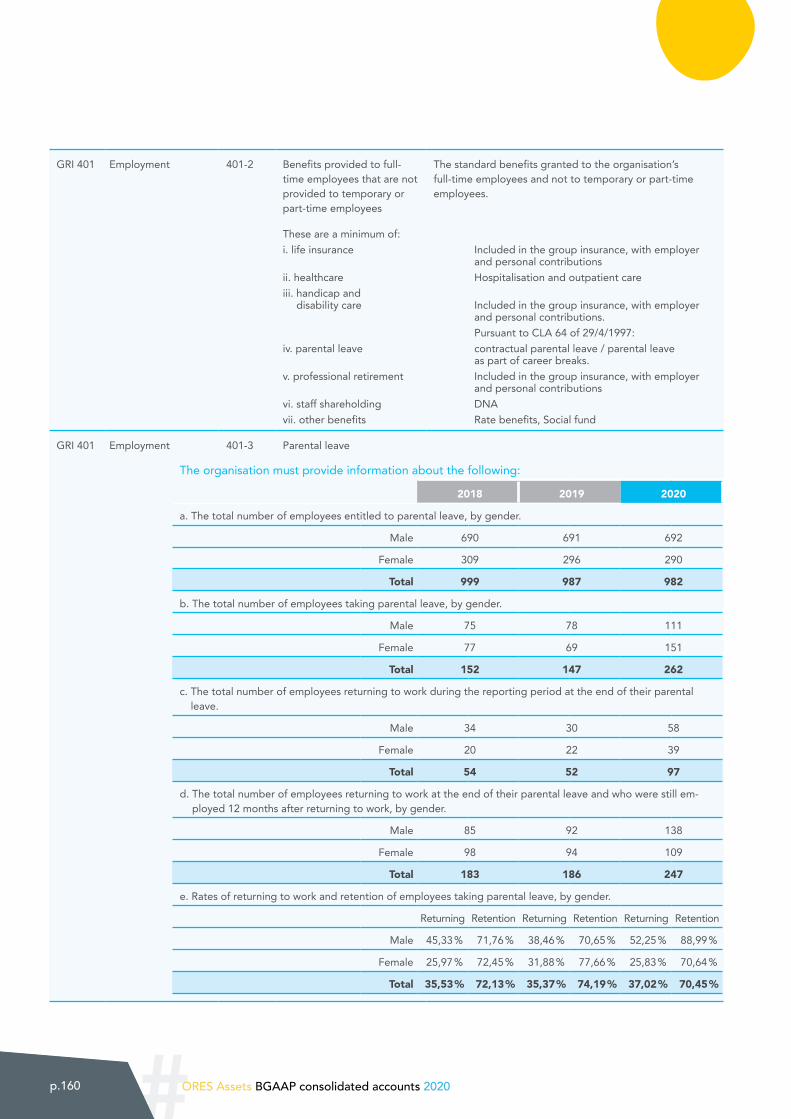
#p.160 ORES Assets BGAAP consolidated accounts 2020
GRI 401 Employment 401-2 Benefits provided to full-time employees that are not provided to temporary or part-time employees
The standard benefits granted to the organisation’s full-time employees and not to temporary or part-time employees.
These are a minimum of: i. life insurance Included in the group insurance, with employer
and personal contributionsii. healthcare Hospitalisation and outpatient careiii. handicap and
disability care Included in the group insurance, with employer and personal contributions.
Pursuant to CLA 64 of 29/4/1997: iv. parental leave contractual parental leave / parental leave
as part of career breaks.v. professional retirement Included in the group insurance, with employer
and personal contributionsvi. staff shareholding DNAvii. other benefits Rate benefits, Social fund
GRI 401 Employment 401-3 Parental leave
The organisation must provide information about the following:
2018 2019 2020
a. The total number of employees entitled to parental leave, by gender.
Male 690 691 692
Female 309 296 290
Total 999 987 982
b. The total number of employees taking parental leave, by gender.
Male 75 78 111
Female 77 69 151
Total 152 147 262
c. The total number of employees returning to work during the reporting period at the end of their parental leave.
Male 34 30 58
Female 20 22 39
Total 54 52 97
d. The total number of employees returning to work at the end of their parental leave and who were still em-ployed 12 months after returning to work, by gender.
Male 85 92 138
Female 98 94 109
Total 183 186 247
e. Rates of returning to work and retention of employees taking parental leave, by gender.
Returning Retention Returning Retention Returning Retention
Male 45,33 % 71,76 % 38,46 % 70,65 % 52,25 % 88,99 %
Female 25,97 % 72,45 % 31,88 % 77,66 % 25,83 % 70,64 %
Total 35,53 % 72,13 % 35,37 % 74,19 % 37,02 % 70,45 %
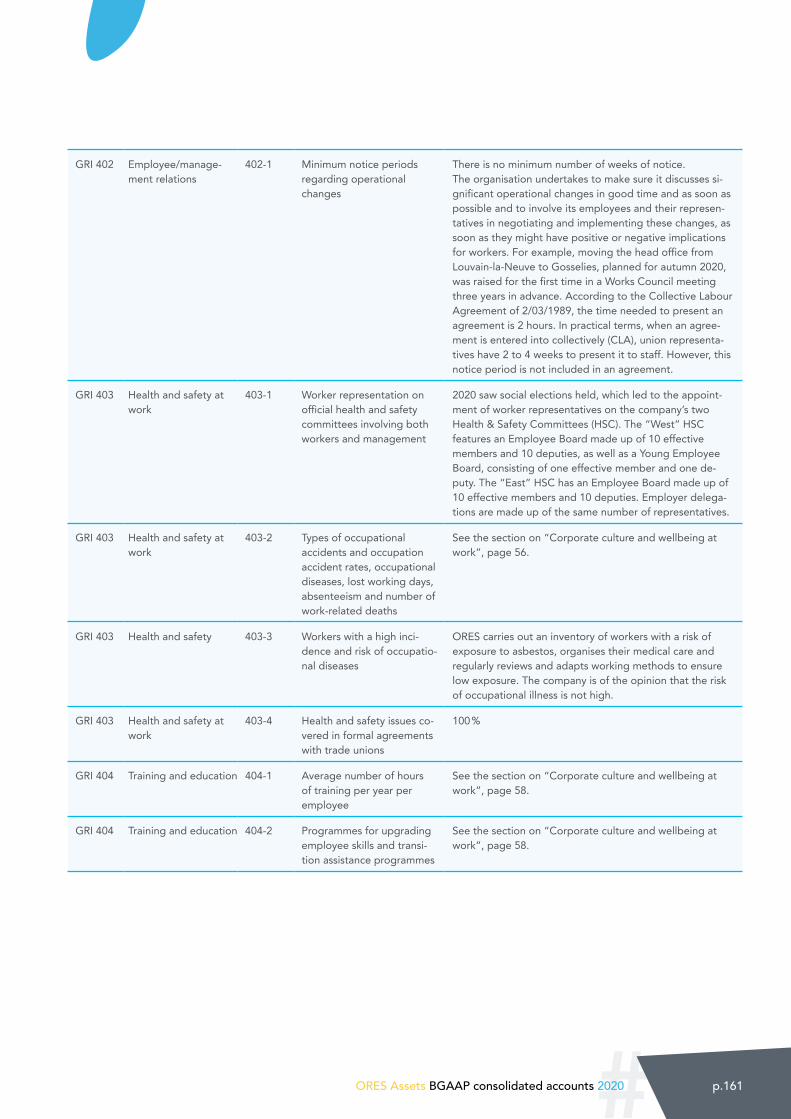
#ORES Assets BGAAP consolidated accounts 2020 p.161
GRI 402 Employee/manage-ment relations
402-1 Minimum notice periods regarding operational changes
There is no minimum number of weeks of notice. The organisation undertakes to make sure it discusses si-gnificant operational changes in good time and as soon as possible and to involve its employees and their represen-tatives in negotiating and implementing these changes, as soon as they might have positive or negative implications for workers. For example, moving the head office from Louvain-la-Neuve to Gosselies, planned for autumn 2020, was raised for the first time in a Works Council meeting three years in advance. According to the Collective Labour Agreement of 2/03/1989, the time needed to present an agreement is 2 hours. In practical terms, when an agree-ment is entered into collectively (CLA), union representa-tives have 2 to 4 weeks to present it to staff. However, this notice period is not included in an agreement.
GRI 403 Health and safety at work
403-1 Worker representation on official health and safety committees involving both workers and management
2020 saw social elections held, which led to the appoint-ment of worker representatives on the company’s two Health & Safety Committees (HSC). The “West” HSC features an Employee Board made up of 10 effective members and 10 deputies, as well as a Young Employee Board, consisting of one effective member and one de-puty. The “East” HSC has an Employee Board made up of 10 effective members and 10 deputies. Employer delega-tions are made up of the same number of representatives.
GRI 403 Health and safety at work
403-2 Types of occupational accidents and occupation accident rates, occupational diseases, lost working days, absenteeism and number of work-related deaths
See the section on “Corporate culture and wellbeing at work”, page 56.
GRI 403 Health and safety 403-3 Workers with a high inci-dence and risk of occupatio-nal diseases
ORES carries out an inventory of workers with a risk of exposure to asbestos, organises their medical care and regularly reviews and adapts working methods to ensure low exposure. The company is of the opinion that the risk of occupational illness is not high.
GRI 403 Health and safety at work
403-4 Health and safety issues co-vered in formal agreements with trade unions
100 %
GRI 404 Training and education 404-1 Average number of hours of training per year per employee
See the section on “Corporate culture and wellbeing at work”, page 58.
GRI 404 Training and education 404-2 Programmes for upgrading employee skills and transi-tion assistance programmes
See the section on “Corporate culture and wellbeing at work”, page 58.
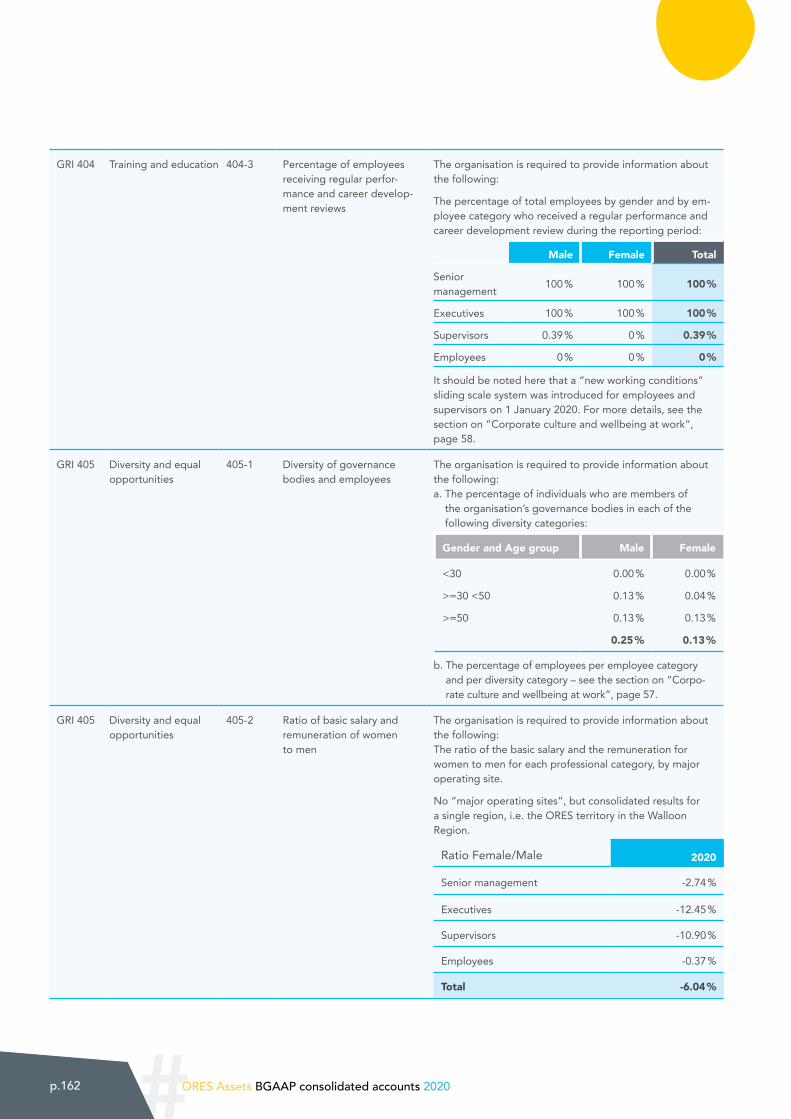
#p.162 ORES Assets BGAAP consolidated accounts 2020
GRI 404 Training and education 404-3 Percentage of employees receiving regular perfor-mance and career develop-ment reviews
The organisation is required to provide information about the following:
The percentage of total employees by gender and by em-ployee category who received a regular performance and career development review during the reporting period:
Male Female Total
Senior management 100 % 100 % 100 %
Executives 100 % 100 % 100 %
Supervisors 0.39 % 0 % 0.39 %
Employees 0 % 0 % 0 %
It should be noted here that a “new working conditions” sliding scale system was introduced for employees and supervisors on 1 January 2020. For more details, see the section on “Corporate culture and wellbeing at work”, page 58.
GRI 405 Diversity and equal opportunities
405-1 Diversity of governance bodies and employees
The organisation is required to provide information about the following: a. The percentage of individuals who are members of
the organisation’s governance bodies in each of the following diversity categories:
Gender and Age group Male Female
<30
>=30 <50
>=50
0.00 %
0.13 %
0.13 %
0.25 %
0.00 %
0.04 %
0.13 %
0.13 %
b. The percentage of employees per employee category and per diversity category – see the section on “Corpo-rate culture and wellbeing at work”, page 57.
GRI 405 Diversity and equal opportunities
405-2 Ratio of basic salary and remuneration of women to men
The organisation is required to provide information about the following: The ratio of the basic salary and the remuneration for women to men for each professional category, by major operating site.
No “major operating sites”, but consolidated results for a single region, i.e. the ORES territory in the Walloon Region.
Ratio Female/Male 2020
Senior management -2.74 %
Executives -12.45 %
Supervisors -10.90 %
Employees -0.37 %
Total -6.04 %
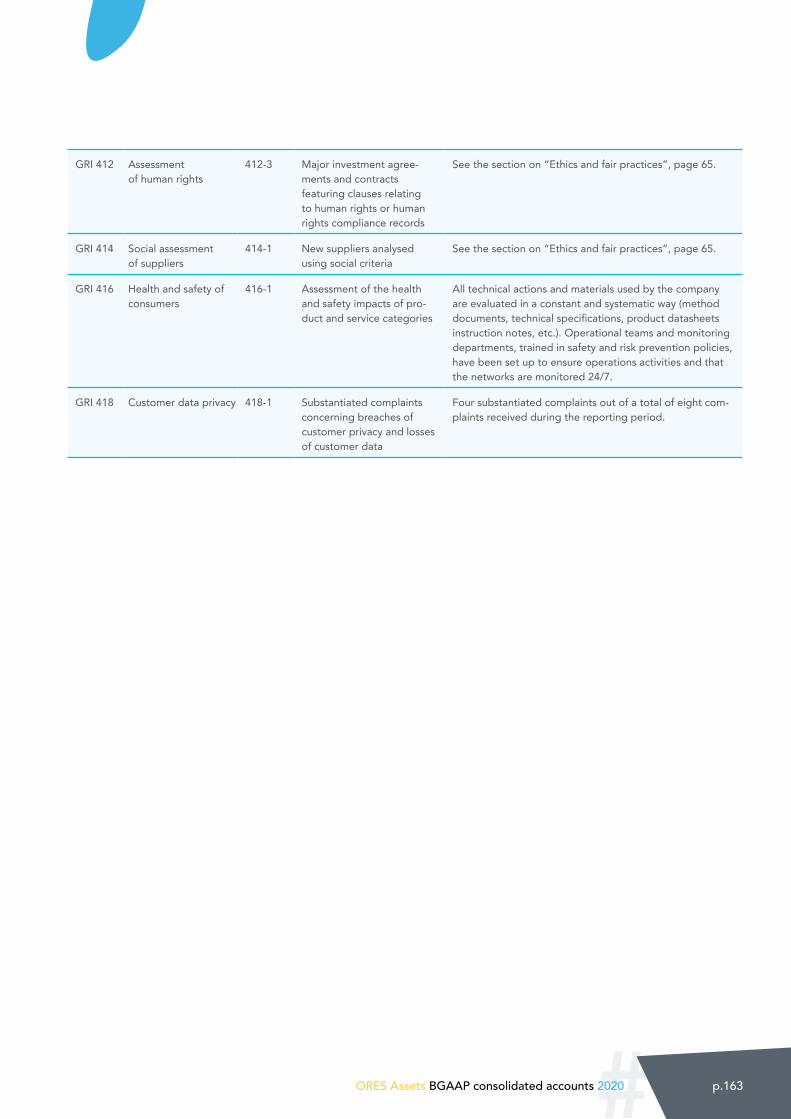
#ORES Assets BGAAP consolidated accounts 2020 p.163
GRI 412 Assessment of human rights
412-3 Major investment agree-ments and contracts featuring clauses relating to human rights or human rights compliance records
See the section on “Ethics and fair practices”, page 65.
GRI 414 Social assessment of suppliers
414-1 New suppliers analysed using social criteria
See the section on “Ethics and fair practices”, page 65.
GRI 416 Health and safety of consumers
416-1 Assessment of the health and safety impacts of pro-duct and service categories
All technical actions and materials used by the company are evaluated in a constant and systematic way (method documents, technical specifications, product datasheets instruction notes, etc.). Operational teams and monitoring departments, trained in safety and risk prevention policies, have been set up to ensure operations activities and that the networks are monitored 24/7.
GRI 418 Customer data privacy 418-1 Substantiated complaints concerning breaches of customer privacy and losses of customer data
Four substantiated complaints out of a total of eight com-plaints received during the reporting period.

ContactsORES - Avenue Jean Mermoz, 14
6041 Gosselies
www.ores.be
Customer service 078 15 78 01Breakdown service 078 78 78 00Emergency gas smell 0800 87 087