beyond where: modeling spatial relationships and …...modeling relationships when variables are...
TRANSCRIPT

Lauren Bennett, Flora Vale, Alberto Nieto
Beyond Where: Modeling Spatial Relationships and Making Predictions
esriurl.com/spatialstats

Modeling Relationships
when variables are related, information can be learned about one variable by observing the values of the related variable(s)

Explore correlations
Predict unknown values
Understand key factors

Correlation: 0.992558
Divorce Rate in Maine vs Per Capita Consumption of Margarine
tylervigen.com

Correlation: 0.666004
Number People Who Drowned by Falling into a Swimming-Pool vs Number of Nicolas Cage Films
tylervigen.com

http://xkcd.com/552/

GeneralizedLinearRegression
Modeling linear relationships

a statistical process for estimating
linear relationships between variables


Dependent Variable
What are you trying to predict or understand?

Explanatory Variables
Variables you believe to cause or explain the dependent variable

Coefficients
Represent the strength and type of relationship that X has to y

Coefficients
Positive relationship- as obesity rates rise, diabetes rates also rise

Coefficients
Negative relationship- as foreclosure rates rise, home values drop

Coefficients
No relationship- the value for X is not correlated with the value for y

Residual
Model over and under predictions

observed value
predicted value
Residual

} over prediction
Residual

}
Residual
difference between the observed value
and the predicted value = ε

Demo

Evaluating our model

Every variable should be statistically significant *

Each variable should tell a different part of the story

Residuals should not be clustered in location or in value

Residuals should not be clustered in location or in value

Model should have a strong R-Squared

When comparing models, lower AICc is better

Exploratory Regression

Demo

GeographicallyWeightedRegression
Exploring spatial variation

each feature gets a
separate equation


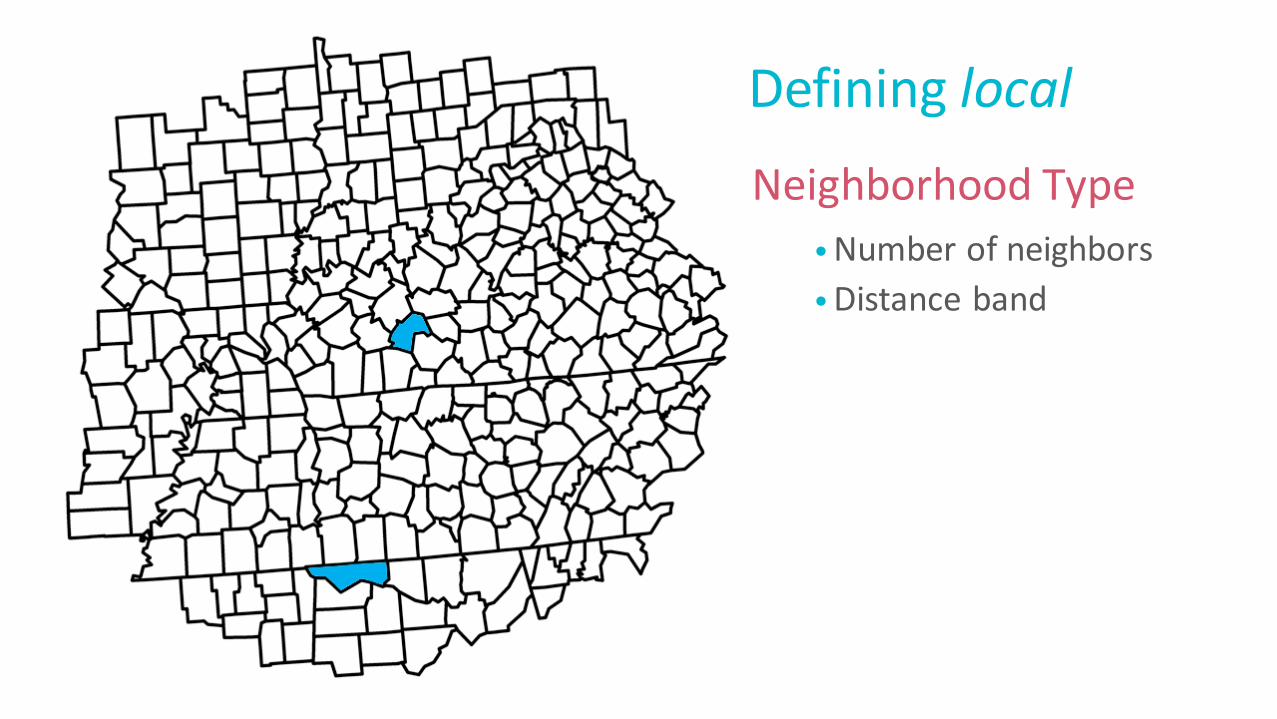
Defining local

Defining local
Neighborhood Type
• Number of neighbors

Defining local
Neighborhood Type
• Number of neighbors

Defining local
Neighborhood Type
• Number of neighbors
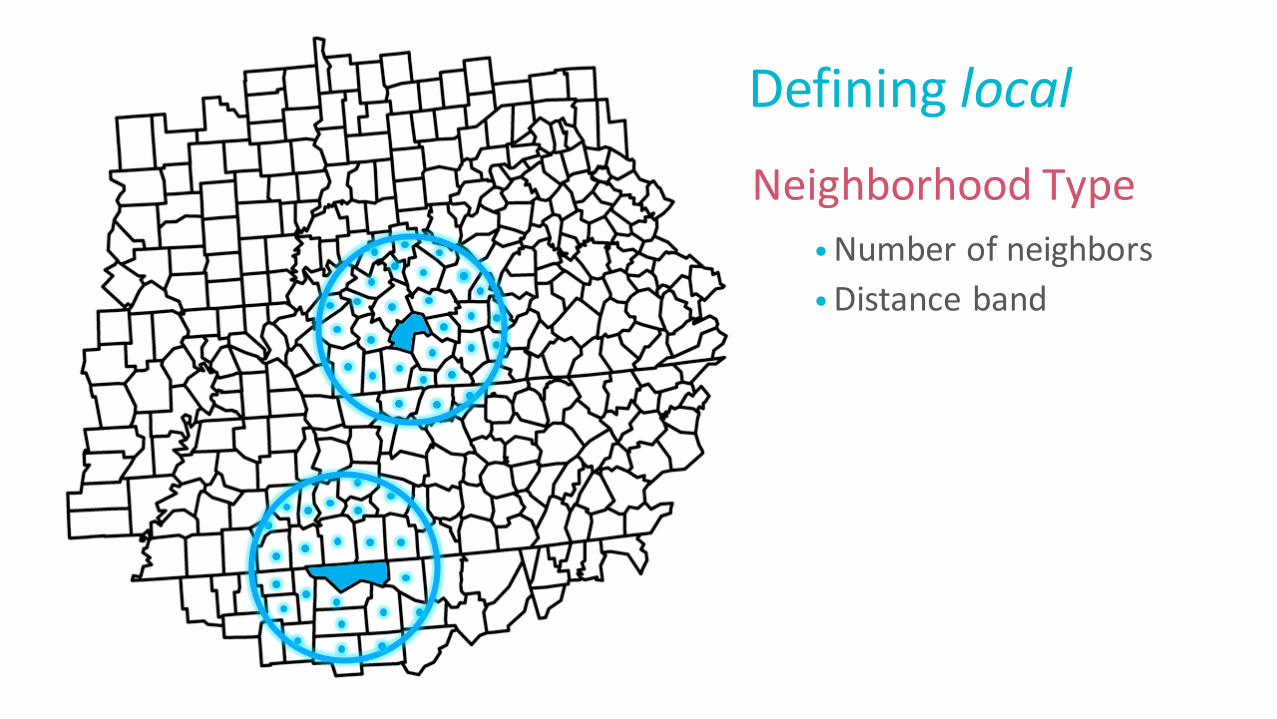
Defining local
Neighborhood Type
• Number of neighbors
• Distance band
Defining local
Neighborhood Type
• Number of neighbors
• Distance band

Defining local
Neighborhood Type
• Number of neighbors
• Distance band

Defining local
Neighborhood Type
• Number of neighbors
• Distance band
Neighborhood Selection Method
• Golden search
• Manual intervals
• User defined

Demo

Local R-Squared
Condition NumberResiduals Predictions
Coefficients

Three model types
• Gaussian – continuous
• Logistic – binary
• Poisson – count

Gaussian – model a continuous variable
Sales profits
Healthcare spending
Mortality rateTemperature

Poisson – model a count variable
0 1 2 3 4 5
Number of people with cancer per 10,000
Traffic accidents
Crime counts
Sales per month
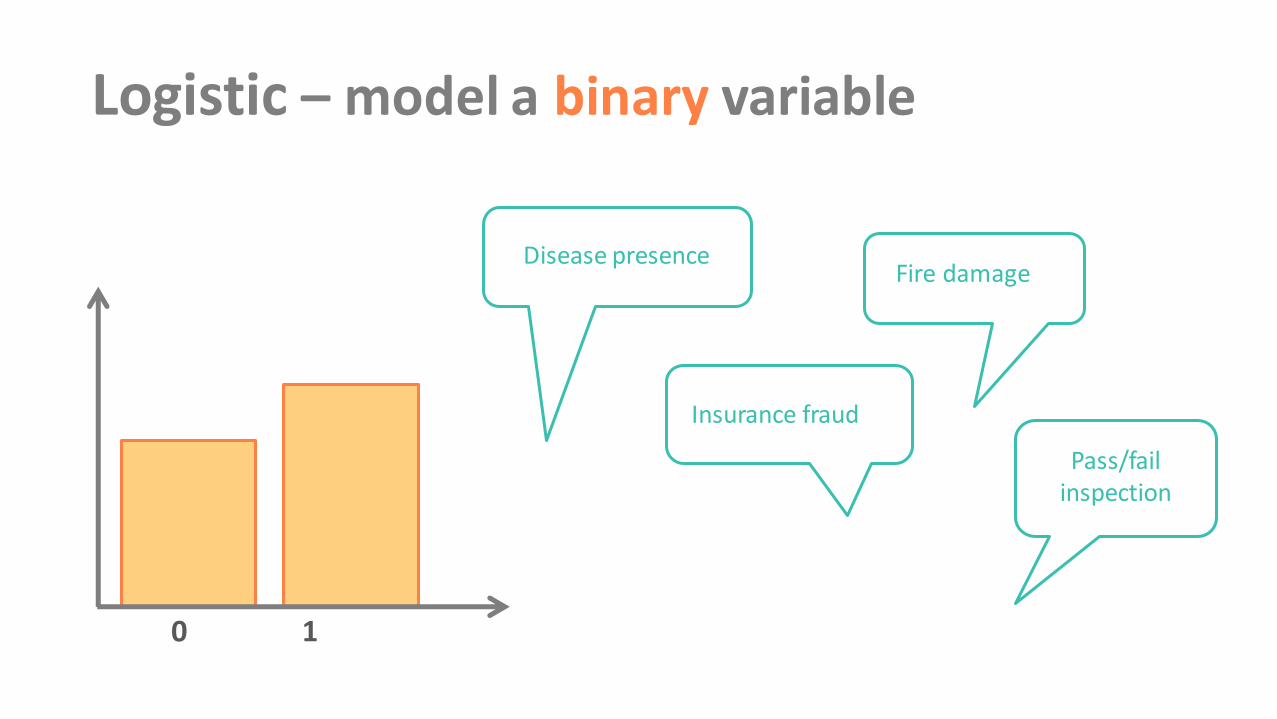
Logistic – model a binary variable
0 1
Fire damage
Pass/fail inspection
Disease presence
Insurance fraud

Demo

LocalBivariateRelationships
Examining relationships across space

“… the measurement of a relationship
the measurement
is taken.”
depends on where

Y
two variables
X
determine relationship significance and type
relationships across geography

… what does it mean for two variables to be related to
each other?

“good” relationships

“good” relationships
null relationships

low entropy
higher entropy
null relationships
“good” relationships

variable Y
low entropy
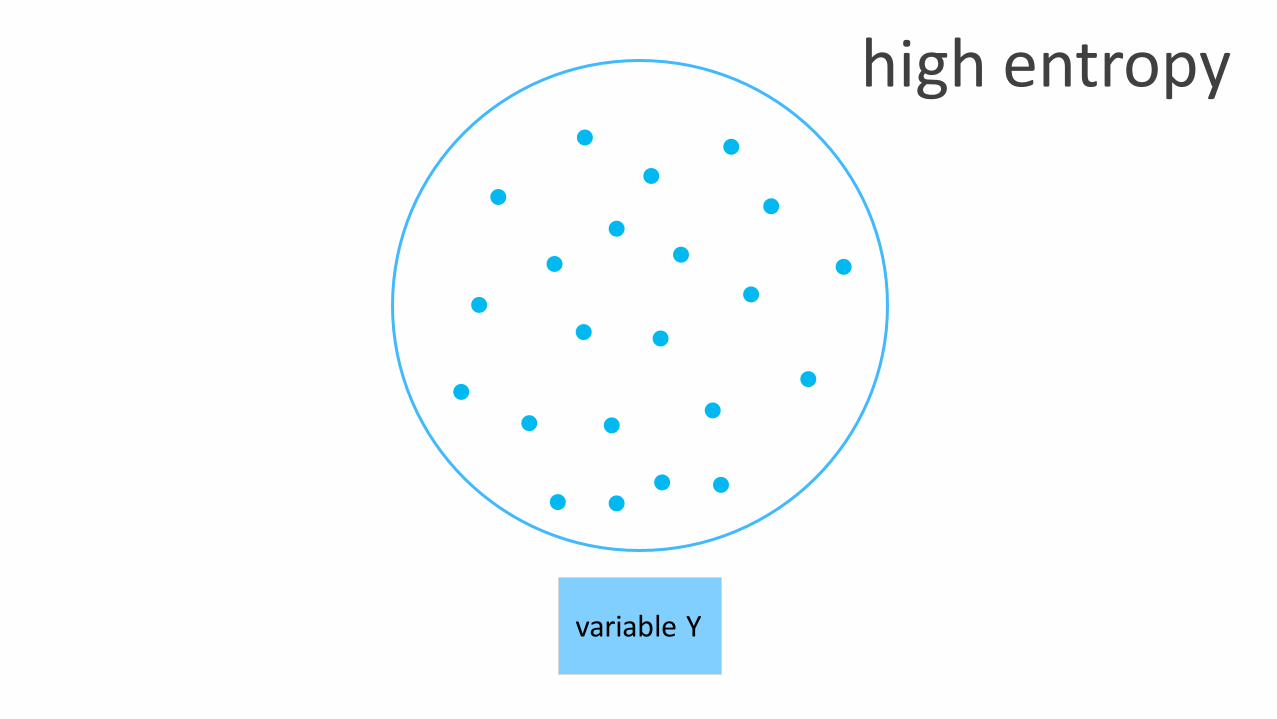
variable Y
high entropy

variable Y variable X

variable Y variable Xmutual
information

minimum spanning trees
low entropy
higher entropy

…how do we know if the
relationship is SIGNIFICANT???

Permutation-based distribution estimation

feature

each feature has two values
Y X
dependent explanatory

relationshipbetween and x
is evaluated for a neighborhood
Y X

relationshipbetween and x
is evaluated for a neighborhood
Y X

neighborhood distribution of variables minimum spanning tree
0.56
entropy value

what is the probability that the observed entropyexists while and are
actually independent from each other?
Y X

observed local entropy
0.56
Y
X

0.56
start a permutation
Y
X
Y
X

0.56
the dependent values are shuffled, while explanatory values are kept the same
Y
X
Y
X
XX
Y

0.56
minimum spanning trees and entropy are calculated for the permutation
Y
X
Y
X
Y
X

0.56
Y
X
Y
X
Y
X
0.64
minimum spanning trees and entropy are calculated for the permutation

permutations
Y
X
Y
X
0.61
Y
X
Y
X
0.64
Y
X
Y
X
0.57
0.56
Y
X
Y
X
………
neighborhood

permutations
permutation entropy distribution
neighborhoodY
X
Y
X
0.61
Y
X
Y
X
0.64
Y
X
Y
X
0.57
0.56
Y
X
Y
X
………

observed entropy is converted to a p-value
permutation entropies
0.55 0.65
p-value = 0.0012
observed entropy0.56

entropy helps determine if relationships are significant, but
it does not tell uswhat type of relationship exists

classifying the local relationships

Positive Linear Negative Linear Convex Concave
Undefined Complex Not Significant

X
Y
start with the distribution of the significant feature’s
neighborhood

X
Y
estimate an ordinary linear regression model and
calculate AICc

square of X
Y
estimate a second linear regression model
using the square of the explanatory variable

AICc values are compared, and a model is selected
X
Y Y
square of X
linear model quadratic model
AICc: -42.3 AICc: -51.4

is the R2 value greater
than 0.05?
Yes
No
which model was chosen?
linear
quadratic
sign of coefficient?
sign of coefficient?
positive
negative
positive
negative
Positive Linear
Negative Linear
Convex
ConcaveUndefined Complex

entropy
classify type

Positive Linear

Positive Linear


Convex

Convex


Negative Linear

Negative Linear

Positive Linear
Negative Linear
Concave
Convex
Undefined Complex
Not Significant

Demo

"Essentially, all models are wrong, but some are useful."
- George E. P. Box

Want to learn more???
esriurl.com/spatialstats
TUESDAY_________________________________________
1:45p Data Visualization for Spatial Analysis 146C
3:00p Machine Learning in ArcGIS 146C
4:15p From Means and Medians to Machine Learning: Spatial Statistics Basics and Innovations 146C
WEDNESDAY______________________________________
8:30a Machine Learning in ArcGIS 146C
11a Data Visualization for Spatial Analysis 146C
1:30p From Means and Medians to Machine Learning: Spatial Statistics Basics and Innovations 146C
2:45p Spatial Data Mining: Cluster Analysis and Space Time Analysis 146C
4:00p Beyond Where: Modeling Spatial Relationships and Making Predictions 146C
5:15p The Forest for the Trees: Making Predictions Using Forest-Based Classification and Regression 146C
Please fill out a course survey!!!

esriurl.com/spatialstats