beyond the top 10 - combining profiling and mobile behavioral data for easy insights into web and...
TRANSCRIPT

May 27-30, 2014 Congress Plaza Hotel & Convention Center #MRMW
Organized by
Title Sponsor Gold Sponsors
Silver Sponsors
MRMW Chicago May 27-30, 2014 #MRMW

Workshop Sponsors
Association & Education Partners
Networking Reception
Sponsor
Event App
Partner
Media Partners
MRMW Chicago May 27-30, 2014 #MRMW

Combining Profiling and Mobile Behavioral Data for “Easy” Insights into Web and App Usage
Beyond the Top 10
Roddy Knowles Director of Mobile Research @roddyknowles

2
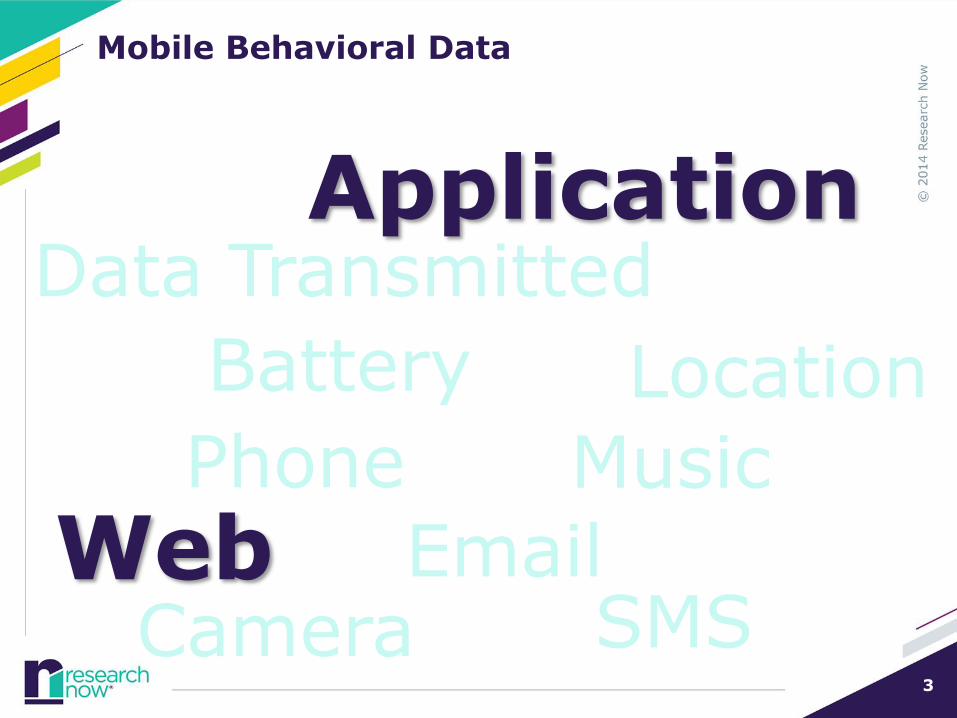
Mobile Behavioral Data
Part of the Research Toolkit
3
Mobile Behavioral Data
Web Camera SMS
Location
Phone Music
Data Transmitted
Battery
Application
4
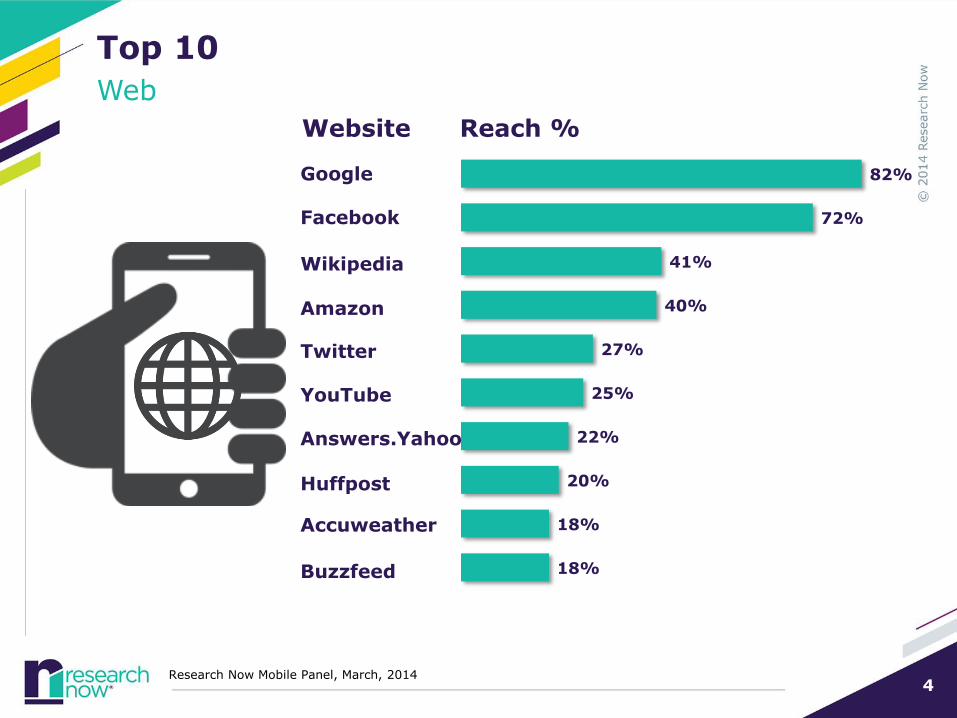
Top 10
Web
82%
72%
41%
40%
27%
25%
22%
20%
18%
18%
Wikipedia
Amazon
YouTube
Answers.Yahoo
Huffpost
Accuweather
Buzzfeed
Website Reach %
Research Now Mobile Panel, March, 2014
5
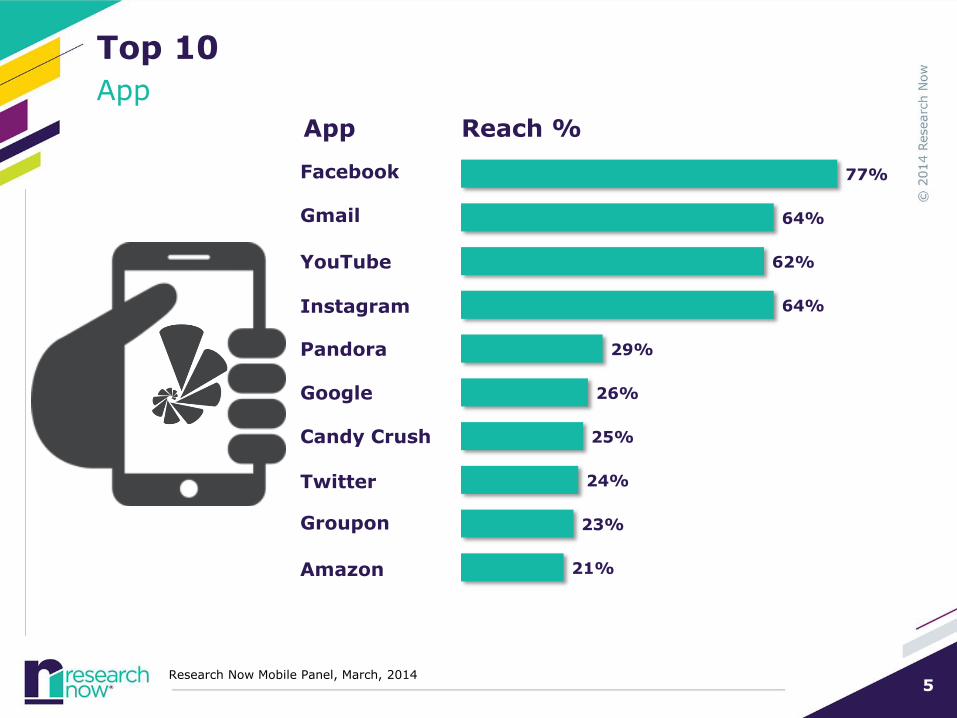
Top 10
App
77%
64%
62%
64%
29%
26%
25%
24%
23%
21%
App Reach %
Gmail
YouTube
Pandora
Candy Crush
Groupon
Amazon
Research Now Mobile Panel, March, 2014

6
App and Web
Amazon
Groupon
Ebay
Yelp
Target
Gamestop
Walmart
LivingSocial
CVS
App Only App and Web Web Only
1,000 2,000 3,000
Research Now Mobile Panel, March, 2013

7
Parsing The Data
Demographics
OS
Engagement Scoring
Segment Profiles

8
Brand
Gender Income
M F > $25K $25K - $49K
$50K - $74K
$75K - $99K
$100K - $149K
$150K - $199K
$200 +
Android 57% 39% 53% 56% 48% 37% 44% 23% 24%
iPhone 33% 50% 32% 37% 43% 50% 44% 63% 70%
Blackberry 3% 3% 1% 3% 4% 4% 4% 8% 4%
Windows Phone 3% 2% 2% 3% 1% 4% 4% 2% -
Other 5% 7% 12% 3% 4% 5% 4% 4% 3%
Brand
Age Ethnicity
18-24 25-34 35-44 45-54 55+ Hispa-
nic Cauca-
sian Black Asian Other
Android 51% 54% 54% 45% 40% 59% 42% 57% 53% 74%
iPhone 43% 42% 36% 39% 45% 28% 47% 30% 35% 19%
Blackberry 2% 1% 2% 5% 5% 5% 3% 8% - 2%
Windows Phone 2% 2% 4% 4% 0% 3% 2% 2% 8% 2%
Other 2% 1% 5% 7% 9% 6% 7% 4% 4% 3%
Does OS Matter?
Demographics
9
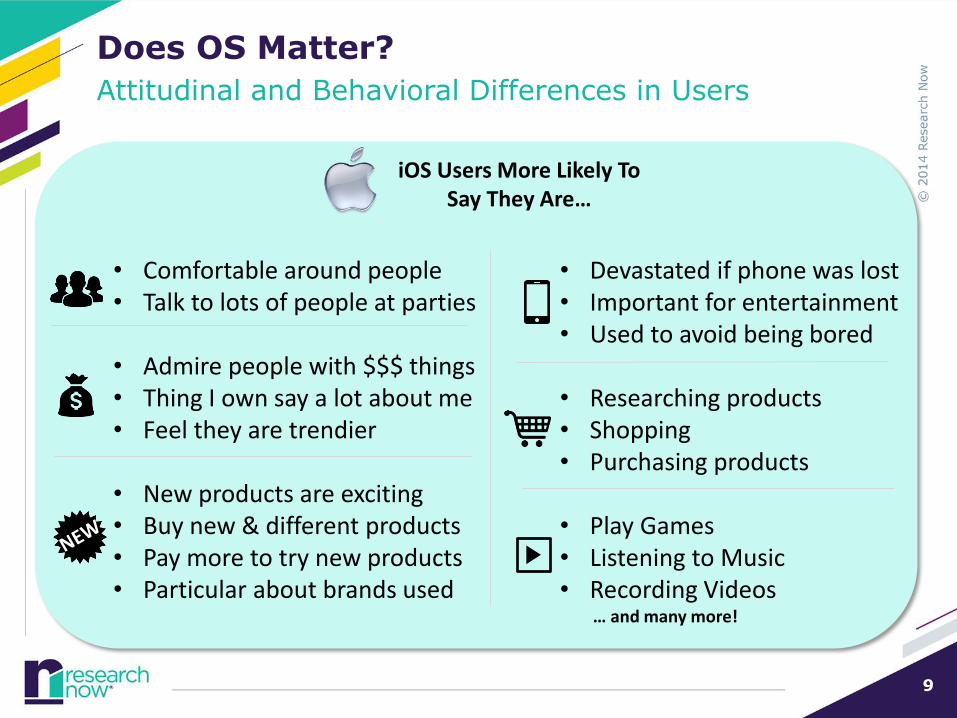
• Devastated if phone was lost • Important for entertainment • Used to avoid being bored
• Researching products • Shopping • Purchasing products
• Play Games • Listening to Music • Recording Videos … and many more!
• Comfortable around people • Talk to lots of people at parties
• Admire people with $$$ things • Thing I own say a lot about me • Feel they are trendier
• New products are exciting • Buy new & different products • Pay more to try new products • Particular about brands used
iOS Users More Likely To Say They Are…
Does OS Matter?
Attitudinal and Behavioral Differences in Users

10
Android Users More Likely To Say They Are…
• Not care about brand names • Try to keep their life simple as far as
possessions are concerned • To watch shows or movies on TV • Talk on their phone • Use navigation on their phone
Differences do indeed exist between & users –
demographically, attitudinally, and
behaviorally.
These differences are highly relevant for researchers.
Does OS Matter?
Attitudinal and Behavioral Differences in Users
11
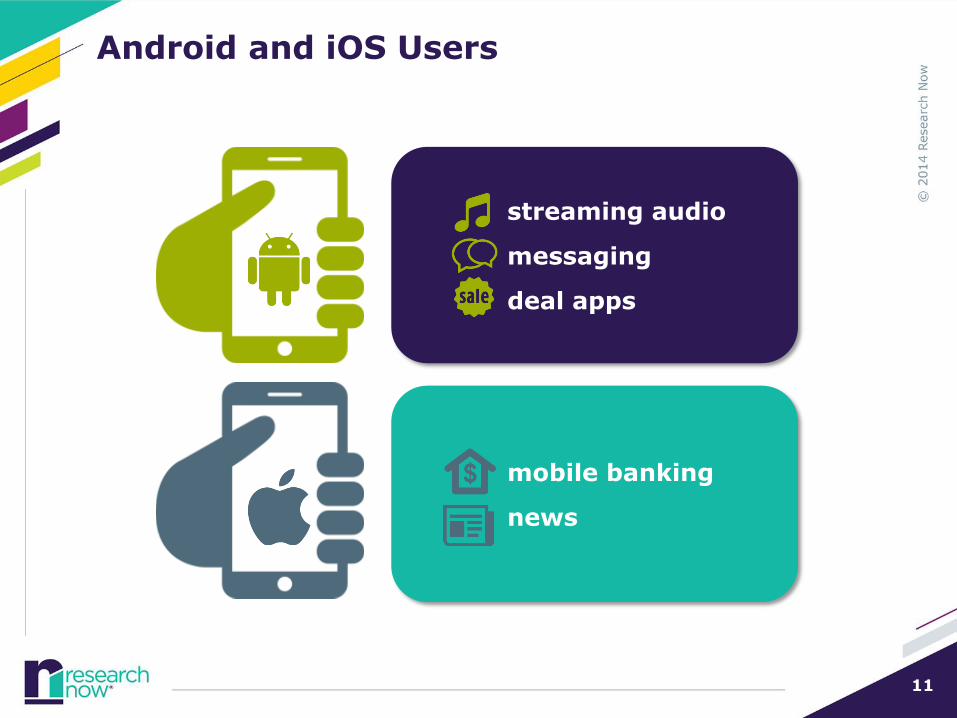
Android and iOS Users
streaming audio
messaging
deal apps
mobile banking
news

12
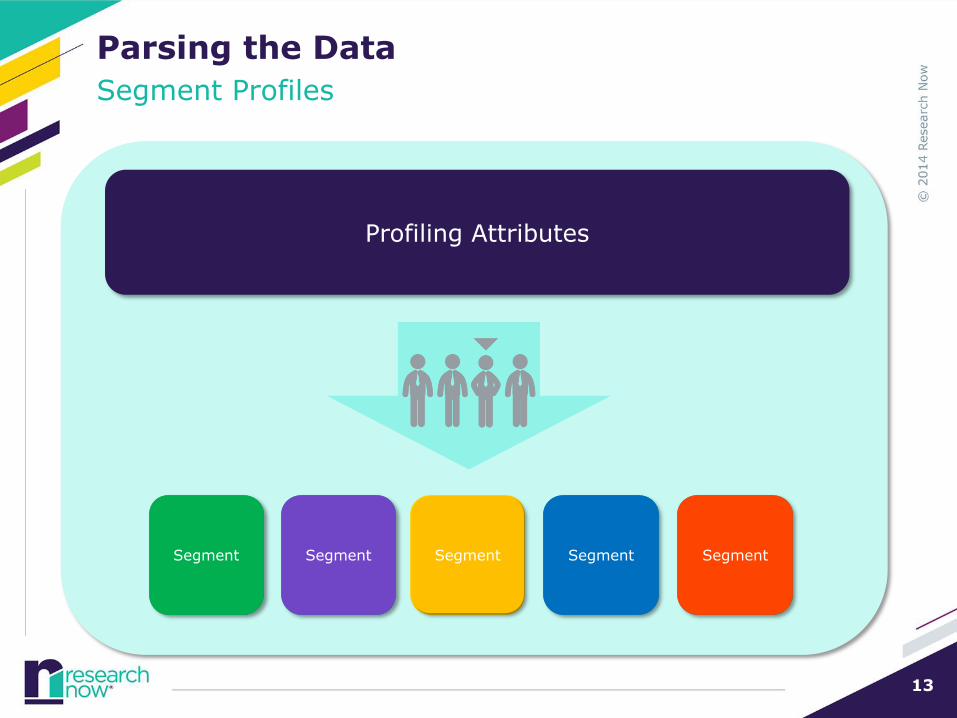
Parsing the Data
Engagement Scoring
Application and URL Metrics
Moderately High
Moderately Low
Low Very High High Very Low
13
Parsing the Data
Segment Profiles
Segment Segment Segment Segment Segment
Profiling Attributes
Segment Segment Segment Segment Segment

14
Interested in Fashion, Food, Entertainment Skews female High engagement
Broad range of hobbies and interests Moderate engagement
Involved in home improvement and home-related activities High engagement
Likes travelling, concerts, outdoor activities Moderate engagement
Focused on finance & investing Skews male, higher education, affluent Low engagement
Parsing the Data Segment Profiles
Enthusiasts Homebodies Culture Club
Interested in Fashion, Food, Entertainment Skews female High engagement
Broad range of hobbies and interests Moderate engagement
Involved in home improvement and home-related activities High engagement
Likes travelling, concerts, outdoor activities Moderate engagement
Focused on finance & investing Skews male, higher education, affluent Low engagement
Money Minders
Out and About
Enthusiasts Homebodies Culture Club

15
Segment Profiles
Heavier users of social sites such as Facebook, Instagram, Buzzfeed Average users of retail sites/apps
Heavier users of Facebook, entertainment sites like Netflix Average users of shopping sites/apps but heavier users of Ebay
Heavier users of email, sports, LinkedIn Lighter users of social and deal sites/apps
Money Minders Out and About Culture Club

16
Top 10 Tips
1. Know what is collected.
2. Determine which data points are important.
3. Understand the makeup of the panel/sample.
4. Define what you want to find, and then…
5. Dig deeper.
6. Acknowledge OS as a consideration.
7. Look at App and Web data in parallel.
8. Understand levels of engagement.
9. Creatively parse the data with profiling or segmentation.
10. Integrate with other types of research.

Title Sponsor Gold Sponsors
Silver Sponsors
MRMW Chicago May 27-30, 2014 #MRMW

Workshop Sponsors
Association & Education Partners
Networking Reception
Sponsor
Event App
Partner
Media Partners
MRMW Chicago May 27-30, 2014 #MRMW

May 27-30, 2014 Congress Plaza Hotel & Convention Center #MRMW
Organized by