beyond the beltway order to avoid cluttering this report with footnotes or links, specific citations...
TRANSCRIPT

BEYOND THE BELTWAY A REPORT ON STATE ENERGY AND CLIMATE POLICIES
Daniel A. Farber
F E B R U A R Y 2 0 1 8
POLICY BRIEF

Beyond the Beltway:
A Report on State Energy and Climate Policies
Summary
Federal policy receives the bulk of the nation’s attention to energy and climate matters, from President Obama’s Clean Power Plan to President Trump’s withdrawal from the Paris Agreement. Yet much of our nation’s energy and climate policy is made by governors, state legislatures and agencies across the country. However, it can be very difficult to track these disparate actions to understand where progress is being made and which states are falling behind. Beyond the Beltway provides insight into the range of factors – political, geographical, economic and more – that determine the immensely varied state energy and climate policies across the nation.
About this Report This Report is a compilation of a series of Legal Planet blog posts written in late 2017 and early 2018. Legal Planet is a collaborative effort of the UC Berkeley and UCLA Schools of Law and is accessible at www.legal-planet.org. The original posts were compiled here and edited for consistency.
About the Author Daniel A. Farber is the Sho Sato Professor of Law and Co-Faculty Director of the Center for Law, Energy & the Environment at the University of California, Berkeley, School of Law. He is an internationally recognized environmental law and constitutional law expert. He would like to thank Erica Sun and Alyssa Wu for their research assistance and Ted Lamm for his invaluable editing and feedback.
Cover photo credits (l-r): Flickr’s Warren Rohner, s pants and BFS Man.

BEYOND THE BELTWAY: A REVIEW OF STATE ENERGY AND CLIMATE POLICES
i
Table of Contents
Executive Summary 1
I. Introduction 2
II. The Pacific 4
Hawaii. 4
Alaska. 4
California. 6
Washington. 8
Oregon. 9
III. From the Plains to the Mountains 10
From Oklahoma to North Dakota. 10
Nevada. 12
Arizona. 13
Texas. 14
Colorado. 16
Wyoming. 17
Montana. 18
A Final Slice of the West: Idaho, Utah, and New Mexico. 19
IV. Mid-America 20
Illinois. 20
Indiana. 21
Michigan. 21
Minnesota. 22
Ohio. 24
Wisconsin. 25
Kentucky and West Virginia. 25
The Lower Mississippi. 26

BEYOND THE BELTWAY: A REVIEW OF STATE ENERGY AND CLIMATE POLICES
ii
V. The Northeast 27
Massachusetts. 28
New Jersey. 29
New England. 30
New York. 32
Pennsylvania. 33
Delaware. 34
VI. The Southeast 35
Maryland. 35
Florida. 36
Georgia. 37
North Carolina. 39
South Carolina. 40
Virginia. 41
Appendix A: Wind Power Maps 42
Appendix B: Solar Energy Maps 43
Appendix C: States with Renewable Portfolio Standards 44
Appendix D: Additional Data on Selected States 45
Arizona. 45
Georgia. 47
Nevada. 50
New Mexico. 53
North Carolina. 54
Pennsylvania. 57
South Carolina. 62
Appendix E: Glossary of Commonly Used Terminology 65

BEYOND THE BELTWAY: A REVIEW OF STATE ENERGY AND CLIMATE POLICES
1
Executive Summary
There is increasing awareness today of the importance of state level policies regarding renewable energy and climate change. The focus, however, has generally been on states such as California that are considered to be on the forefront of addressing these issues, and not on states where progress has been slower or stalled. This report attempts to present a fuller picture, taking into account policy developments in all fifty states.
Geography and politics are obvious factors in explaining differences between states’ renewable energy and climate policies. States with strong wind resources are naturally more likely to develop wind; major coal producing states are less likely to pursue renewables. On the whole, Democrats are much more likely than Republicans to be concerned about climate change, and this necessarily impacts policy.
Nevertheless, geography and politics do not provide complete explanations. A national survey reveals that a shift toward renewable energy is underway in many states as coal gives ground to newer technologies. The states that explicitly connect renewables with broader climate policies are concentrated on the coasts, as expected, but there are significant efforts in some inland states as well.
More strikingly, renewable energy has gained considerable ground in some states such as Texas and Kansas, where government is in the hands of conservative Republicans. Republican governors in other states, both conservatives and moderates, have provided support for expanding renewable energy or resisted legislative rollbacks. Even states like South Carolina have begun to see some early signs of change. In these states, energy economics and user preferences, rather than the environment, are driving forces.
Finally, this research reveals the extent of the diversity of state energy mixes. States have different renewable-energy potentials due to geography, transmission and other factors; and even adjoining states sometimes have very different electricity-generation mixes for geographic and economic reasons. Expanding interstate markets – for electricity, renewable energy credits, and for carbon – have an important role to play. Where there is diversity, there are also potential gains from trade and integrated planning.

BEYOND THE BELTWAY: A REVIEW OF STATE ENERGY AND CLIMATE POLICES
2
I. Introduction
What happens in Washington, D.C. gets a lot of attention. Yet states have a great deal of authority under our system of federalism to follow their own paths in energy and climate policy. In fact, much of our nation’s energy and climate policy is made by disparate state legislatures and agencies across the country – but it can be very hard to know all that is happening at the state level.
In an effort to get a better sense of these nationwide developments, this report surveys state activity on climate change and energy.1 Some states are covered in much more depth than others. Although it does not provide encyclopedic coverage, the report does cover developments in all fifty states, Republican- and Democratic-led, on the coasts and in the heartland. While there are several invaluable databases that gather information about state activities,2 this report captures in narrative form what the states are doing and the economic and political forces behind recent changes.
The overall picture is very encouraging. Renewable energy is on the rise across the nation. Coal is rapidly being supplanted by natural gas and, to a lesser extent, wind and solar power. There is a trend toward strengthening renewable portfolio standards, and a number of states have made a point of reaffirming their commitment to climate action in response to the Trump Administration’s regressive policy agenda.
Two general points are noteworthy. First, not only blue states, but also states with mixed party control, are taking serious progressive steps in energy and climate policy. California’s climate programs get a lot of publicity, but places like Hawaii and Massachusetts have also been very active, and there has been significant progress in Virginia and Illinois.
Second, there are some important developments even in states under firm Republican control. Some arch-conservative states like Oklahoma and Kansas nevertheless have gone all-in on-wind power. And Republican governors in Ohio and Michigan have helped block conservative rollbacks of renewable energy laws by their legislatures.
What is driving developments in those states seems to be economics, including a desire to attract firms that want access to clean energy. Corporate pressure has begun to make a difference: in 2016, corporate customers and utilities are entering agreements known as “green tariffs” that guarantee provision of a set minimum
1 This report had its origins in a series of blog posts on Legal-Planet.org.
2 Three useful additional sources of information about state programs can be found at the Georgetown Climate Center site, http://www.georgetownclimate.org/clean-energy/state-energy-profiles-and-data-maps.html. (energy mix and trends in states, drawn in part from the EIA site below); the American Council on Renewable Energy (ACORE) website, http://www.acore.org/state-local (full listing of state incentive programs but currently several years out of date); and the Energy Information Administration site, https://www.eia.gov/electricity/state/ (compendium of energy data for each state, usually about two years behind). Georgetown’s triennial report on state energy leadership is also a useful source: http://www.georgetownclimate.org/reports/state-leadership-driving-the-shift-to-clean-energy-2016-update.html. In order to avoid cluttering this report with footnotes or links, specific citations are not always provided to public information collected in these reports. Unless otherwise noted, state energy mix data are drawn from these reports.

BEYOND THE BELTWAY: A REVIEW OF STATE ENERGY AND CLIMATE POLICES
3
amount of renewable power, with over 1,000 megawatts (MW) worth of such agreements committed or under negotiation in 2016 and 2017 alone.3It is hard to turn away industry that could bring billions of dollars of investment into a state. In at least one Southern state, demand from the U.S. military seems to have played this role. But there are probably other factors at work, such as general public support for renewables.
The Trump Administration is making an effort to shift these economics, with a tariff on imported solar panels and possible subsidized rates for fossil fuel and nuclear power.4 These may have a temporary impact, but they seem unlikely to shift the economics very much. They also face significant hurdles within the federal government,5 and are likely to get pushback even from staunchly Republican states, especially given the role of wind generation in states like Iowa and Texas. Moreover, states may respond by upping their own incentives for renewables. The 2018 elections may well increase the strength of pro-renewable forces in a number of state capitals, further accelerating current trends.6
This is not to downplay the degree of diversity among states. If California has come to epitomize one extreme, Florida, with no renewable energy requirements or targets and little deployment, represents the other. Even if all states shared the same goals, they begin with very different energy mixes and renewable energy potentials. Furthermore, interstate markets play an important role, so a state’s neighbors can limit or drive progress.
The core of this article (parts II-VI) consists of overviews of state energy and climate policies, either as individual jurisdictions or part of regional clusters. These overviews are varied in both length and focus, to offer a picture of the wide range of approaches (or lack thereof) that different states have been taking to energy and climate policy. Appendices A-C provide useful maps of the solar and wind potential across the nation and of states with renewable portfolio standards. Appendix D provides more detailed information on some of the states,7 while Appendix E is a glossary of terms.
3 Diane Cardwell and Clifford Krauss, “Coal Country’s Power Plants are Turning Away from Coal,” New York Times (May 26, 2017), https://www.nytimes.com/2017/05/26/business/energy-environment/coal-power- renewable-energy.html.
4 Ana Swanson and Brad Plumer, “Trump Slaps Steep Tariffs on Foreign Washing Machines and Solar Panels,” New York Times (January 22, 2018), https://www.nytimes.com/2018/01/22/business/trump-tariffs-washing-machines-solar-panels.html.
5 Brad Plumer, “Rick Perry’s Plan to Rescue Struggling Coal and Nuclear Plants is Rejected,” New York Times (January 8, 2018), https://www.nytimes.com/2018/01/08/climate/trump-coal-nuclear.html.
6 By now, there is an extensive menu of policy options that have been used in one more states, ready for adoption by others. See Vicki Arroyo, Kathryn A. Zyla, Gave Pacyniak, and Melissa Deas, State Innovation on Climate Change: Reducing Emissions from Key Sectors While Preparing for a “New Normal,” 10 Harv. L. & Pol’y Rev. 385 (2016).
7 This information is a product of research assistance by Erica Sun and Alyssa Wu.

BEYOND THE BELTWAY: A REVIEW OF STATE ENERGY AND CLIMATE POLICES
4
II. The Pacific
Hawaii.
In June 2017, Hawaii adopted Senate Bill 559, endorsing the goals of the Paris Agreement and reinforcing its efforts to deal with climate change. Hawaii has an impressive record in this area.
Hawaii has passed the most aggressive renewable portfolio standard in the country, requiring 100% of the state’s power to be generated by renewable sources by 2045.8 Hawaii counts a wide range of energy sources as renewable: solar, wind, hydroelectric, biofuels, geothermal, rooftop solar, biomass crops, agricultural and animal residues and wastes, and municipal solid waste.9 In addition, it counts combined heat and power, allowing utilities to deem “renewable” the usable heat that is created by a commercial enterprise’s on-site natural gas generator, for example.
Hawaii has its work cut out for it. As of 2016 it got over 75% of its electricity from fossil fuel sources (with nearly 25% renewable, including rooftop distributed generation). The good news is that use of renewable energy has increased rapidly, from 950 gigawatt-hours (GWhs) to about 2500 GWhs between 2010 and 2016. According to the Energy Information Administration, Hawaii has the highest electricity production from distributed solar, and solar energy generated 35% of Hawaii’s renewable electricity. It also has the fourth-lowest per capita energy use in the nation. But obviously, there is a lot more work to do.
Hawaii has good reason to be concerned about climate change. Hawaii is facing a series of climate impacts, including increases in air temperature, especially at high altitudes; decreased stream base flow; decreases in rainfall and rain intensity, with longer periods of days without rain; rising sea levels; ocean acidification; and increased sea surface temperature, leading to more frequent and severe coral bleaching events.10
One interesting approach to adaptation has been taken by Kauai County. It established a building setback based on the average annual erosion rate and a planning period of 70 to 100 years, plus a buffer of 40 feet. With some exceptions, development within the setback line is prohibited.
Hawaii’s total contribution to global carbon emissions is small. But if it succeeds in moving away from its heavy dependence, it will be forging a path for others to follow.
Alaska.
Alaska is a Republican state, but at various times one branch of the legislature or the Governorship has been Democratic. The current Governor lost the Republican primary, ran as an independent, and then joined forces with the Democratic 8 Anne C. Mulkern, “How to hit 100% clean? Hawaii, Calif. offer different answers,” E&E News (September 5, 2017), https://www.eenews.net/climatewire/2017/09/05/stories/1060059627.
9 Ibid.
10 University of Hawaii at Manoa Sea Grant College Program, “Climate Change Impacts in Hawaii” (2014), http://seagrant.soest.hawaii.edu/sites/default/files/publications/smfinal-hawaiiclimatechange.pdf.
BEYOND THE BELTWAY: A REVIEW OF STATE ENERGY AND CLIMATE POLICES
5
candidate, who became his Lieutenant Governor. The Republicans control both legislative chambers. This political backdrop, together with Alaska’s unique geography and resources among U.S. states, presents a mixed energy and climate policy scenario.
The good news is that Alaska gets 20% of its energy from hydro, as well as another 2.5% from wind, which did not really make an appearance at all until 2013. Half of its energy comes from natural gas. The bad news is that coal and oil burning account for more than 10% each.
Solar development is hampered by the shortness of winter days, although there is some distributed rooftop solar. Wind, however, has great potential. Alaska Power and Telephone has announced plans to build a 1.8MW wind farm near Tok, Alaska.11 In many rural areas of Alaska, electricity is extremely expensive due to the difficulty of importing fossil fuels, so renewables are welcome cost-cutters.12
Alaska has experienced about twice as much warming as the rest of the United States. According to the pre-Trump Administration U.S. Environmental Protection Agency (EPA), “average annual temperatures in Alaska are projected to increase an additional 2 to 4°F by the middle of this century.”13 There are some obvious energy-related benefits to this warming, such as lower heating costs. But there are even greater negatives:
“Higher temperatures and drier conditions increase the risks of drought, wildfire, and insect infestation. Large wildfires have consumed more boreal forest in Alaska in the last ten years than in any other decade recorded, and the area burned annually is projected to double by 2050.”14
Coastal communities in Alaska face particularly urgent risks due to climate change, with some already forced to consider wholesale abandonment due to sea level rise and increasingly dangerous storms.15 In 2007, Governor Sarah Palin appointed a sub-cabinet group to advise the governor’s office on climate policy. That group in turn appointed a task force on adaptation, which issued a 2010 report with
11 Robin Whitlock, “Alaska Power & Telephone to construct 1.8MW wind farm near Tok,” Renewable Energy Magazine (July 4, 2016), https://www.renewableenergymagazine.com/wind/alaska-power-amp-telephone-to-construct-1-20160704.
12 David W. Shaw, “What Rural Alaska Can Teach the World about Renewable Energy," Scientific American (March 26, 2017), https://www.scientificamerican.com/article/what-rural-alaska-can-teach-the-world- about-renewable-energy/.
13 U.S. Environmental Protection Agency (January 19, 2017 Snapshot), “Climate Impacts in Alaska,” https://19january2017snapshot.epa.gov/climate-impacts/climate-impacts-alaska_.html.
14 Ibid.
15 Erica Goode, “A Wrenching Choice for Alaska Towns in the Path of Climate Change,” New York Times (November 29, 2016), https://www.nytimes.com/interactive/2016/11/29/science/alaska-global-warming.html.

BEYOND THE BELTWAY: A REVIEW OF STATE ENERGY AND CLIMATE POLICES
6
recommendations for the state, although it does not appear much progress has been made on these goals.16
California.
California has led the charge in state climate action.17 California legislation focusing specifically on climate change dates back to a 1988 law mandating an inventory of California greenhouse gas emissions. There have been a host of legislative initiatives since then designed to encourage energy efficiency and renewable energy while limiting carbon emissions.
California’s current suite of efforts began in 2006 when Governor Schwarzenegger signed the California Global Warming Solutions Act, usually referred to as Assembly Bill (AB) 32, which required California to reduce emissions to the 1990 level by 2020 (the law has since been updated to require a reduction to 40% below 1990 levels by 2030).18 This law generated worldwide attention, including enthusiastic approval by the British Prime Minister at the time it was passed.19 The California effort undoubtedly received additional attention because the Governor was an international celebrity and because it was such a stark contrast with the Bush Administration’s recalcitrance. But there were also more tangible international steps involving California, including an agreement between California and the United Kingdom to share best practices on market-based systems and to cooperate to investigate new technologies. California has also pursued discussion with government authorities in China.20
California has implemented AB 32 aggressively. The law itself is notably brief and gives the government enormous discretion about how to achieve its goals, though it does rule out a carbon tax. The California Air Resources Board (CARB) first developed nine “early action” measures, some of which focus on reducing emissions of non-carbon dioxide (CO2) greenhouse gases. One important early action was a low-carbon fuel standard, which requires a reduction in the carbon intensity of transportation fuels by 10% by 2020. But CARB’s most notable action was to establish an emissions trading system, with a declining, statewide cap on greenhouse gas emission.21 The
16 Adaptation Clearinghouse, "Alaska's Climate Change Strategy: Addressing Impacts in Alaska," http://www.adaptationclearinghouse.org/resources/alaska-s-climate-change-strategy-addressing-impacts-in-alaska.html.
17 California’s climate change mitigation policies are documented on the website of the California Air Resources Board. https://www.arb.ca.gov/cc/cc.htm. A useful recent overview has been provided by the California Legislative Analyst’s Office, http://www.lao.ca.gov/handouts/resources/2017/Overview- California-Climate-Goals-Policies-061417.pdf.
18 California Air Resources Board, “Assembly Bill 32 Overview,” https://www.arb.ca.gov/cc/ab32/ab32.htm.
19 Mark Martin, “State’s War on Warming / Governor Signs Measure to Cap Greenhouse Gas Emissions—Sweeping Changes Predicted in Industries and Life in Cities,” SF Gate (September 28, 2006), http://www.sfgate.com/green/article/State-s-war-on-warming-Governor-signs-measure-2487887.php.
20 Javier C. Hernandez and Adam Nagourney, “As Trump Steps Back, Jerry Brown Talks Climate Change in China,” New York Times (June 6, 2017), https://www.nytimes.com/2017/06/06/world/asia/xi-jinping-china-jerry-brown-california-climate.html.
21 California Air Resources Board, “Cap-and-Trade Program,” https://www.arb.ca.gov/cc/capandtrade/capandtrade.htm.

BEYOND THE BELTWAY: A REVIEW OF STATE ENERGY AND CLIMATE POLICES
7
cap-and-trade program originally covered about 600 electricity generation and industrial facilities, with other sources such as fuel distributors having been added to the program more recently.22 Many allowances have been distributed free to firms, but an increasing percentage are auctioned each year. The auctions have already begun to generate significant amounts of revenue for the state’s Greenhouse Gas Reduction Fund, which has provided hundreds of millions of dollars for transportation, energy and sustainability programs.23 In 2017, the state extended the life of the trading system through 2030.24
California has adopted other important policies unrelated to AB 32 or emissions trading. In 2006, Governor Schwarzenegger also signed Senate Bill 107, requiring California’s three major utilities to deliver at least 20% of their electricity from renewable sources by 2010 (creating the state’s Renewables Portfolio Standard, or RPS). Then, in 2009, Governor Schwarzenegger directed CARB to adopt regulations increasing California’s RPS to 33% by 2020 and expand the RPS to apply not just to the three major utilities to include all power suppliers.25 Governor Jerry Brown codified the 33% target in 2011, before the state set an even more aggressive goal in 2015 to require retail sellers and publicly owned utilities to procure 50% of their electricity from eligible renewables by 2030.26
A final, crucial component of California’s strategy stems from a quirk of federal pollution law. Under the Clean Air Act, states have broad latitude to go beyond federal law in controlling pollution from stationary sources like factories. But the federal government directly regulates vehicles and vehicle fuels, preempting state regulation on the subject. There is one exception to this preemption rule, however: California alone has the power to write its own regulations in this area by getting a federal preemption waiver.27 When the Clean Air Act was passed, the California exemption was included partly due to the political power of the state’s congressional delegation and partly due to the fact that southern California would clearly require especially strict vehicle rules to address smog. A later amendment allowed other states to piggyback on California’s vehicle rules by adopting them without modification. Then-Assemblymember Fran Pavley’s 2002 legislation, Assembly Bill 1493, directed CARB to regulate carbon emissions from vehicles, and after some struggle California succeeded in getting a federal preemption waiver.28 As a result, states that want to go beyond federal regulations in cutting carbon emissions from trucks and cars can copy the California standard. The state is now considering a new proposal, Assembly Bill
22 Center for Climate and Energy Solutions, “California Cap and Trade,” https://www.c2es.org/content/california-cap-and-trade/.
23 California Air Resources Board, “Auction Proceeds Funded Programs and Events,” https://www.arb.ca.gov/cc/capandtrade/auctionproceeds/ggrfprogrampage.htm.
24 Assembly Bill 398 (E. Garcia, 2017).
25 Executive Order S-21-09 (Schwarzenegger, 2009).
26 Senate Bill 350 (De Leon, 2015); see California Energy Commission, “California Renewable Energy Overview and Programs,” http://www.energy.ca.gov/renewables/.
27 42 U.S.C. § 7453(b).
28 California Air Resources Board, “Clean Car Standards - Pavley, Assembly Bill 1493,” https://www.arb.ca.gov/cc/ccms/ccms.htm.
BEYOND THE BELTWAY: A REVIEW OF STATE ENERGY AND CLIMATE POLICES
8
1745, that would ban the sale of new gasoline- and diesel-powered cars after 2040, though its prospects for becoming law are unclear.29
A natural question is what prompted California’s exceptional history of action on climate change. There are various possible explanations, all of which may be true to some extent. California is especially vulnerable to climate change because it combines a large coastline with an arid climate. Also, California has a long history of activism on environmental issues. One rationale for exempting California vehicle regulations from preemption was that, alone among the states, California had started regulation car emissions even prior to the federal Clean Air Act. Some additional contributing factors could be that CARB has accumulated a high level of regulatory expertise and public trust, and that California hopes to capture the economic benefits of pioneering new energy technologies. And finally, continuing to lead the effort on climate change may have been a politically appealing way for a solidly Democratic state to push back against George W. Bush, and now Donald Trump.
Obviously, it would be a mistake to give California all the credit for fighting climate change, when many states have undertaken renewable energy programs and a number have their own emissions trading programs. There are many dysfunctions in California’s governance, but this is one instance where it seems to have lived up to its self-image as a place where “the future happens first.”
Washington.
Two-thirds of Washington’s energy comes from hydropower. Wind is another 6.5%. There’s a small amount of biomass and almost no use of solar. The state also gets5% from coal, 12% from natural gas, and 7% from nuclear. The state’s renewable portfolio standard calls for 15% renewables by 2020. The state has adopted specific targets for future years up to 2050.
Rather than using cap-and-trade, Washington thus far has adopted the “trade” but not the “cap,” in a distinctive hybrid of conventional regulation and emissions trading. The state’s Clean Air Rule went into effect in January 2017.30 The rule requires major emitters of greenhouse gases to limit and reduce carbon pollution and incentivizes investments to reduce fossil fuel use and accelerate use of clean energy. Unlike California, Washington did not set a statewide cap on emissions. Instead, each facility is assigned its own emission reduction pathway, using its average emissions in 2012-2016 as a baseline. Thereafter, emissions must decrease at a rate of 1.7% per year. Every three years, a facility must demonstrate that it met its reduction goals or face penalties. There is also a reserve of emission reduction units (ERUs) to accommodate new facilities. (In effect, the sum of the targets for all individual plants still in
29 Erin Baldassari, “Proposed bill would ban new gas, diesel-powered cars in California by 2040,” San Jose Mercury News (January 10, 2018), https://www.mercurynews.com/2018/01/10/proposed-bill-would-ban-new-gas-diesel-powered-cars-in-california-by-2040/.
30 Washington State Department of Ecology, "Overview of the Clean Air Rule," https://ecology.wa.gov/Regulations-Permits/Laws-rules/Closed-rulemaking/WAC-173-442,-441-Overview. The rule has been challenged by several generators and utilities. https://www.usnews.com/news/best-states/washington/articles/2017-05-28/carbon-cap-rule-in-washington-faces-legal-challenge.

BEYOND THE BELTWAY: A REVIEW OF STATE ENERGY AND CLIMATE POLICES
9
operation plus the ERUs used from the reserve fund is equivalent to a statewide emissions cap, but the state itself never sets an explicit target for statewide emissions.) The state allows trading of ERUs and says that trading will also be allowed with out-of-state programs when those are approved.
The Washington scheme imposes lower costs on laggard firms that had high emissions in the baseline period, correspondingly penalizing those that had already started cutting emissions. On the other hand, because it is more focused on cuts at individual facilities, the Washington approach may be more appealing to environmental justice advocates than California’s more conventional cap-and-trade system (which critics argue can allow harmful pollutants to concentrate in disadvantaged areas).
Washington has the advantage that it only gets about 15% of its electricity from fossil fuels, while two-thirds comes from non-emitting hydro and almost all the rest from nuclear and biomass. Wind and solar are minor factors but the state has a goal of raising them to 15% by 2020. But emissions from industry and transportation are bigger issues.
As a result of an off-year 2017 election, the Democrats now have unified control of state government. It remains to be seen whether this results in further climate legislation, but that is certainly a possibility. There has even been some talk about a carbon tax.
Oregon.
Oregon, like its neighbor Washington, obtains over half its electricity from hydropower. As in Washington, there is almost no solar, but wind constitutes over 10% of total generation. Coal is a minor factor at about 4%, but natural gas accounts for 28% of electricity generation, providing some room for cuts. The governor’s mansion and the state legislature are held by the Democrats.
Oregon law mandates an end to the use of coal-fired electricity no later than 2035. The law also sets a renewable portfolio standard that requires that at least half of the electricity supplied by the state’s largest utilities, Pacific Power and Portland General Electric, come from new renewable sources such as solar and wind power by 2040.31 (The state has interim 2025 targets of 25% renewable generation for large utilities and 10% for small ones.) Oregon has also been very progressive in terms of energy efficiency, ranking 4th out of 50 states according to Georgetown’s analysis of programs adopted.
The state plans to add transportation measures to reduce carbon emissions by 75% below 1990 levels. The Oregon Department of Transportation has a strategic plan to achieve this goal, but it is not clear what metrics apply and how stringent carbon reduction measures will be. In addition, the state has adopted California’s tailpipe standard for carbon emissions from new vehicles.
31 Oregon Department of Energy, “Renewable Portfolio Standard,” http://www.oregon.gov/energy/energy-oregon/Pages/Renewable-Portfolio-Standard.aspx.

BEYOND THE BELTWAY: A REVIEW OF STATE ENERGY AND CLIMATE POLICES
10
Carbon pricing is under active consideration by Oregon lawmakers, with both carbon tax and cap-and-trade bills having been introduced in 2017 (although passage of any of the proposals remains uncertain)32
In 2009, Oregon adopted legislation mandating a state adaptation plan, which was completed in 2012.33 There has been some progress in implementing the plan, particularly in terms of upgrading emergency response capabilities, but many of the infrastructure- and public health-related goals remain unmet.
III. From the Plains to the Mountains
From Oklahoma to North Dakota.
This may seem a bit surprising, but wind power has a solid political base in many solidly Republican states. It’s a case of economics outweighing politics. Here are the top five states for wind power34:
Rank State Installed Capacity (MW) 1 Texas 20,320 2 Iowa 6,911 3 Oklahoma 6,645 4 California 5,656 5 Kansas 4,451
You might not have expected to see the four red states on this list. But there is a geographic reason they’re on the list: the wind belt that runs north from Oklahoma, through Kansas and Nebraska, and all the way up the Dakotas, where winds are strongest. (While Iowa is immediately to the east of this column of states, it shares the same geographical and political currents) It is no wonder that wind power is a big deal in the states along the corridor.
Wind power generation is continuing to grow in those high-wind states. Midwest Energy News reports:
“Wind power represents more than 80 percent of the new electricity generating capacity built in the Midwest and Great Plains states over the past five years as the industry continues to grow. . .
32 Joshua Linn and Kristin Hayes, “Cap-and-Trade Policy Potential in Oregon: Addressing Emissions Leakage,” Resources for the Future (November 29, 2017), http://www.rff.org/blog/2017/cap-and-trade-policy-potential-oregon-addressing-emissions-leakage.
33 Georgetown Climate Center, “Overview of Oregon’s Climate Change Preparations,” http://www.georgetownclimate.org/adaptation/state-information/overview-of-oregons-climate-change-preparations/adaptation-plan-status.html.
34 Official Nebraska Government Website, “Wind Facilities’ Installed Capacity by State,” http://www.neo.ne.gov/statshtml/205.htm.

BEYOND THE BELTWAY: A REVIEW OF STATE ENERGY AND CLIMATE POLICES
11
“The American Wind Energy Association’s annual 2016 report notes that two states in the region generate more than 30 percent of their electricity needs from wind – Iowa (35 percent) and South Dakota (30 percent). North Dakota, Oklahoma and Kansas produce more than 20 percent of their electricity demand from wind.
“Not surprising, the Midwest/Great Plains nexus—combined with Texas—captured 89 percent of all investment in wind last year.
“For instance, in July, two corporations announced ‘they’re building a 2,000-megawatt wind project in the Oklahoma panhandle, which, upon completion, could hold the title of second-largest wind farm in the world.’”35
The availability of wind is reflected by the energy mix of wind versus fossil fuels in the tier of states from Oklahoma northward (2015 figures):
State Wind Coal Gas Oklahoma 18% 32% 45% Kansas 24% 54% 3% Nebraska 12% 60% 1% Iowa 31% 52% 4% South Dakota 26% 15% 8% North Dakota 17% 75% 2%
The other thing that leaps out of this table is the very low use of natural gas in most of these states. A look at a map of gas pipelines indicates that South Dakota and a large part of Nebraska are not served, but Kansas is a puzzle because of a dense pipeline network and low in-state use.36 The appeal of coal in some of these states may be explained by proximity to the Wyoming coalfields.
Unless you’re in the industry or live in or near these states, the importance of wind power on the Great Plains and Midwest may not seem to have much to do with your life. But it makes a real difference in terms of energy politics. No less an advocate of fossil fuels than Senator James Inhofe has advocated for policies to support investment in transmission infrastructure and further development of wind resources in his home state of Oklahoma37Or consider Senator Chuck Grassley of Iowa. During the 2016 presidential campaign, he said that if President Trump wanted to do away with wind power, “he’ll have to get a bill through Congress, and he’ll do it
35 Frank Jossi, “Industry Report: Midwest and Great Plains Lead Wind Energy Expansion,” Midwest Energy News (April 19, 2017), http://midwestenergynews.com/2017/04/19/industry-report-midwest-and-great-plains-lead-wind-energy-expansion/.
36 US Energy Information Administration, “Natural Gas Pipelines in Central Region,” https://www.eia.gov/naturalgas/archive/analysis_publications/ngpipeline/central.html.
37 “Inhofe Praises Pickens’ Call for Increasing Use of Natural Gas, Wind Power,” U.S. Senate Committee on Environment and Public Works (July 9, 2008), https://www.epw.senate.gov/public/index.cfm/press-releases-republican?ID=092B5F5E-802A-23AD-4F38-1AD8834F2C9F.

BEYOND THE BELTWAY: A REVIEW OF STATE ENERGY AND CLIMATE POLICES
12
over my dead body.”38 Grassley sponsored the original tax credit law for wind power, and he came out hard against a draft report by Trump’s Department of Energy that was allegedly anti-wind. Not to mention Sam Brownback, who led Kansas in its failed experiment with right-wing governance:
“Speaking at the American Council on Renewable Energy’s (ACORE) recent Renewable Energy Finance Forum, Gov. Brownback said he believes generating half of Kansas’s electricity using wind is ‘doable’ and he expects it to happen. He noted that Kansas is ‘going to be aggressively recruiting and working with [wind] companies,’ and working on transmission build-out to better enable the wind industry to grow even faster.”39
These are important, mostly hardline conservative politicians. If you’re Mitch McConnell or Paul Ryan – or for that matter, the Secretary of Energy – you can’t afford to ignore the views of Republicans like these. That’s why, despite Trump’s personal antipathy toward wind power, it will likely not only survive his administration but continue to grow.
Nevada.
Nevada produces three-quarters of its power from natural gas. Renewables are another 20% (6% hydro, 5% solar, 8% geothermal, with a small amount of wind), while coal provides the remainder. In 2005, coal was about half the power mix, with a steep decline starting in 2006. Nevada has also begun to ensure the availability of electric recharge stations along its highways.40 Recent developments regarding renewables are favorable, with 129 MW approved in 2016 by the state to service Apple and Switch.41
The Republicans control the governor’s mansion, but the state legislature is controlled by the Democrats (though by only a narrow margin in the Senate). Divided government in Nevada has not been uncommon in the past three decades, but the state government had been under united GOP control until the 2016 elections.
There has been a lot of recent political action in the energy sphere. A proposed constitutional amendment to deregulate electricity markets was approved by 72% of voters in 2016 and will require a second vote on the 2018 ballot, when it is considered
38 Devin Henry, “Grassley: Trump Will Attack Wind Energy ‘Over My Dead Body,’” The Hill (August 31, 2016), http://thehill.com/policy/energy-environment/293924-grassley-trump-will-attack-wind-energy-over-my-dead-body.
39 Paul Dvorak, “Gov. Brownback: Wind Power Could Supply 50% of Kansas Electricity,” Windpower Engineering & Development (July 6, 2016), http://www.windpowerengineering.com/projects/ gov-brownback-wind-power-supply-50-kansas-electricity/.
40 Nevada Governor’s Office of Energy, “Nevada Electric Highway,” http://energy.nv.gov/Programs/Nevada_Electric_Highway/.
41 Renewables Now, “Nevada PUC Clears PPAs for 129 MW of Solar Power” (January 28, 2016) https://renewablesnow.com/news/nevada-puc-clears-ppas-for-129-mw-of-solar-power-510751/.
BEYOND THE BELTWAY: A REVIEW OF STATE ENERGY AND CLIMATE POLICES
13
very likely to pass. If passed, deregulation will take effect in 2023, and the state government is already beginning planning.42
In June 2017, the legislature sent three key energy bills to the Governor Brian Sandoval’s desk. Assembly Bill 206 called for an increase in renewables generation to 40% by 2030 and 80% by 2040. Sandoval vetoed the bill, on grounds that it usurped the energy policy role of the state public utilities commission, but said he would consider the issue in connection with the planning for eventual deregulation.43
The second bill was Senate Bill 392, which authorized community solar systems. Although the community-solar bill was supported by 70% of state population, Sandoval vetoed it on the grounds that it potentially conflicted with the third bill, Assembly Bill 405, which the Governor did sign.44 AB 405 reinstated net metering (allowing generators of excess renewable energy to “sell” that excess back to the grid) for rooftop solar customers. The bill provides for reimbursement up to 95% of retail electricity rate, and guarantees consumers the right to self-generate and store electricity, and utilities cannot curtail excess energy sent to the grid. The previous net metering policy had been eliminated in December 2015, followed by a 32% decline in solar jobs.45
Governor Sandoval is term-limited, so control of the Nevada government will be up for grabs in the 2018 off-year election. As the recent pattern of legislation passed and then vetoed indicates, a shift to unified Democratic control could result in rapid changes in energy policy. Although much of the national attention will be on the U.S. Senate race, the state elections will also have significant policy implications.
Arizona.
Arizona gets 10% of its power from renewables (primarily solar and hydro), with the remainder of its power split among nuclear, gas, and coal. Palo Verde Nuclear Generating Station is the nation’s largest nuclear plant, with the second-highest generating capacity of any power plant. Arizona had a Democratic governor from 2002 to 2008, but has been under unified GOP control for the past ten years. Nevertheless, solar, and particularly utility-scale solar, has been growing rapidly, and in 2015, Arizona was among top five states for installation of new solar facilities (and second after California in terms of installed solar capacity).46
42 Nevada Governor Brian Sandoval, “Governor Sandoval Announces Committee on Energy Choice Membership” (April 3, 2017), http://gov.nv.gov/News-and-Media/Press/2017/Governor-Sandoval-Announces-Committee-on-Energy-Choice-Membership/.
43 Yvonne Gonzalez, “Sandoval Vetoes Community Solar, Higher Clean-Energy Standard,” Las Vegas Sun (June 16, 2017), https://lasvegassun.com/news/2017/jun/16/sandoval-veto-community-solar-higher-clean-energy/.
44 Ibid.
45 Julia Pyper, “Nevada’s New Solar Law is About Much More than Net Metering,” Green Tech Media (June 16, 2017), https://www.greentechmedia.com/articles/read/nevadas-new-solar-law-is-about-much-more-than-net-metering.
46 “Arizona’s Residential Solar Energy Market Expected to Drive Growth,” AZ Big Media (October 24, 2017), https://azbigmedia.com/arizonas-residential-solar-energy-market-expected-to-drive-growth/.
BEYOND THE BELTWAY: A REVIEW OF STATE ENERGY AND CLIMATE POLICES
14
Arizona is home to two massive hydro projects, Glenn Canyon Dam and Hoover Dam (on the border with Nevada). Hoover has a capacity of over 2000 MW, serving millions of people in Nevada, Arizona, and Southern California. The increasingly arid climate of the Southwest poses a long-term threat to its generation capacity, which has already materialized during drought years.47 Glenn Canyon has a capacity of 1320 MW, making it the second biggest hydro source in the Southwest. It, too, is sensitive to drought.48
The state does have a renewable portfolio standard, although it is relatively meager compared to those enacted and proposed in neighboring California and Nevada, respectively. In 1996, regulators mandated 0.2% from solar energy by 1999 and 1% by 2003. In 2002, the Environmental Portfolio Standard was set at 0.4% from renewables in 2002 and 1% in 2007, which was ramped up in 2006. The current mandate, the 2006 Renewable Energy Standard & Tariff, requires 15% renewables by 2025.49
Geothermal has grown steadily since 2008. The 25 MW Cove Fort facility that opened in 2016 uses a novel combination of hydro and thermal generation: water is heated by geothermal energy and a generator captures that energy. Then it is returned to the well, and a second generator harvests the energy created by its gravitational fall.50
While, Arizona has substantial solar generation potential and plenty of room to reduce its current coal and natural gas reliance, a more favorable political environment may be necessary to lead the state toward more progressive energy policies.
Texas.
Market trends are pushing Republican-stronghold Texas toward a cleaner electrical grid. The Electric Reliability Council of Texas (ERCOT), which operates most of the state’s grid,51 recently projected that in the next fifteen years, Texas will add almost 20 gigawatts (GW) of solar, equivalent to 15-20 new nuclear reactors. In fact, under virtually every scenario ERCOT considered, the only new capacity is solar, with no new fossil fuel plants expected. ERCOT also expects to retire about a third of that amount in coal generation together with some older, inefficient natural gas plants. Regulatory changes could nudge these numbers upward or downward. Both the use of renewables and the fossil fuel retirements would increase with stronger
47 Annie Snider, “Drought Forces First-Ever Cutbacks in Lake Mead Water Deliveries,” Greenwire (August 16, 2013), https://www.eenews.net/greenwire/stories/1059986117/.
48 Emily Guerin, “Glen Canyon Dam’s Evaporating Hydropower,” High Country News (July 7, 2013), http://www.hcn.org/blogs/goat/glen-canyons-evaporating-hydropower.
49 Arizona Corporation Commission, “Proposed Renewable Energy Standard and Tariff Rules,” http://www.azcc.gov/divisions/utilities/electric/res.pdf.
50 Julie Applegate, “Power Plant is First to Combine Geothermal, Hydroelectric Technology,” St. George News (December 9, 2016), https://www.stgeorgeutah.com/news/archive/2016/12/09/jla-power-plant-is- first-to-combine-geothermal-hydroelectric-technology/.
51 Electric Reliability Council of Texas, Inc., “2016 Long-Term System Assessment for the ERCOT Region,” http://www.ercot.com/content/wcm/lists/89476/2016_Long_Term_System_Assessment_for_the_ERCOT_Region.pdf.

BEYOND THE BELTWAY: A REVIEW OF STATE ENERGY AND CLIMATE POLICES
15
environmental mandates in place. On the other hand, coal retirements would slow in the absence of the federal haze limits that are now in litigation.
The reason wind power does not play a greater role in these projections is probably that Texas is already #1 in the nation in terms of wind; in fact, if it were a country, it would be #6 in the world. So there is more potential for growth in the state’s comparatively small solar sector.
Another modeling effort provides a reality check on ERCOT’s projections, reaching comparable conclusions. The Brattle Group, an independent economic consultancy, has done its own projections, with somewhat different assumptions.52 It assumes that the cost of solar continues to decline as predicted and that natural gas remains under $4 per million British thermal units (Btus) (the current price is about $3.25). On these assumptions, Brattle found that over the next 20 years, even without new regulations, the economics will favor cleaner power: natural gas, wind and solar could constitute 85% of ERCOT generation by 2035 (with new additions of 9 GW of wind by 2019 and 13 GW of solar by 2021) and CO2 emissions reductions could drop 28% below 2005 levels. And as a result of these trends, Brattle projects, Texas would hit its target under President Obama’s Clean Power Plan even if the regulation itself is eliminated.
It is crucial to note that all of these projections are inherently uncertain. Energy forecasts are notoriously imprecise, with all manner of unexpected developments intervening. One critical assumption is that natural gas prices continue to be low, making coal less appealing. That may be too optimistic, although President Trump’s apparent enthusiasm about fracking should if anything push gas prices lower.
Even if these market projections prove out, they by no means disprove the importance of regulations. A rollback from current air pollution regulations would slow the trends favoring natural gas and renewables, while more aggressive regulation would accelerate them. So, too, could technological advances in renewables or energy efficiency. That said, even if Trump is able to boost coal production temporarily, it would take a very bold company to invest in a plant with a 30- to 50-year lifespan based on a short-term easing of regulations.53 So it seems unlikely that Texas coal use will increase much in any event; the real question is how much it will take for it to come down.
Texas is the state with the highest carbon emissions today, with about twice California’s emissions. Given the gloomy scenario for federal climate policy in the next few years, it’s some consolation that market forces are working to lower emissions there. Better yet, the same market forces are also operating elsewhere in the nation.54
52 The Brattle Group, “Market Forces Primary Driver of Transition in the ERCOT Grid, According to Report by Brattle Economics,” http://www.brattle.com/news-and-knowledge/news/market-forces-primary- driver-of-transition-in-the-ercot-grid-according-to-report-by-brattle-economists.
53 See Clifford Krauss, “Coal’s Decline Seems Impervious to Trump’s Promises,” New York Times (January 24, 2018), https://www.nytimes.com/2018/01/24/business/energy-environment/coal-miners.html.
54 David Ignatius, “Trump Can’t Easily Undo Progress on Climate Change: David Ignatius,” The Oregonian (January 17, 2017), www.oregonlive.com/opinion/index.ssf/2017/01/trump_cant_easily_undo_progres.html.

BEYOND THE BELTWAY: A REVIEW OF STATE ENERGY AND CLIMATE POLICES
16
Moreover, although the state government has zero interest in addressing climate change, that is not true at the city level. For instance, Dallas – which used to be a conservative Republican stronghold – has worked hard to cut its own carbon footprint and is trying to promote green building and use of public transportation.55 And state-level politics may also shift. Hispanics are predicted to become the largest demographic group sometime in the next seven years, which will impact the political balance of power. So, even in Texas, change is coming – regardless of what happens in D.C.
Colorado.
Colorado has an aggressive renewable energy goal: its 2020 RPS is set at 30% for investor-owned utilities, 20% for cooperative utilities, and 10% for large municipal utilities.56 The state got 18% of its energy from renewables in 2015, but hit 24% by March 2017. The rest of the power in 2017 came from coal (50%) and natural gas (22%). The City of Aspen, in what it says is a demonstration of the potential for renewables, gets all of its energy from wind and hydro.
The state has already experienced the onset of climate change. According to the pre-Trump EPA, average temperatures in the state are up 2 degrees Fahrenheit, and April snowpack is down 20-60% in most locations.57 Moreover, according to EPA, “[i]n the decades to come, rainfall during summer is more likely to decrease than increase in Colorado, and periods without rain are likely to become longer.”
These changes could have a big impact on the Colorado River – the source of water throughout much of the Southwest. According to a recent study, “continued business-as-usual warming will drive temperature-induced declines in river flow” of 20% to 30% by midcentury, and 35% to 55% by 2100.58
Fire is an additional problem:
“Higher temperatures and drought are likely to increase the severity, frequency, and extent of wildfires in Colorado, which could harm property, livelihoods, and human health. In 2013, the Black Forest Fire burned 14,000 acres and destroyed over 500 homes. Wildfire smoke can reduce air quality and increase medical visits for chest pains, respiratory problems, and heart problems. The size and number of western forest fires have increased substantially since 1985.”59
55 Green Dallas, “What is the City Doing?” http://greendallas.net/climate-change/city-climate-change/.
56 Jesse Paul, “Extra-Windy March Boosts Wind, Solar Power’s Share of Colorado’s Energy to 24 Percent,” Denver Post (June 16, 2017), http://www.denverpost.com/2017/06/16/colorado-renewable-energy-improvement-march/.
57 U.S. Environmental Protection Agency (January 19, 2017 Snapshot), “What Climate Change Means for Colorado” (August 2016), https://19january2017snapshot.epa.gov/sites/production/files/2016-09/documents/climate-change-co.pdf.
58 Bradley Udall, “The Twenty-First Century Colorado River Hot Drought and Implications for the Future,” Water Resources Research (March 24, 2017), http://onlinelibrary.wiley.com/doi/10.1002/2016WR019638/full.
59 Ibid.

BEYOND THE BELTWAY: A REVIEW OF STATE ENERGY AND CLIMATE POLICES
17
Given these impacts, perhaps it is not surprising that the state is planning to ramp up its efforts. In July 2017, Governor John Hickenlooper announced that the state was joining the U.S. Climate Alliance, a coalition of governors seeking to commit their states to reduce greenhouse gas emissions in accordance with the 2015 Paris Agreement. He also set some new targets for the state, seeking a statewide emissions reduction of 26% below 2005 levels by 2025 and electricity sector reductions of 35% by 2030, in addition to increased energy efficiency and new electric car charging infrastructure.60 These do not seem to be enforceable goals absent actual legislation, but they may help accelerate the state’s carbon transition. Colorado has 2000 clean tech firms, which does not hurt either.
Colorado has divided government, with a Republican Senate (by a narrow majority), Democratic House, and Democratic Governor. Over the past 20 years, the state has shifted from strong Republican control to a strong Democratic lean. The state is the poster child for the New West Economy, with extractive industries playing a smaller role while technology and tourism are growing. Its renewable energy policies appear to be following these trends.
Wyoming.
Wyoming is one of the nation’s leading coal producers. Yet surprisingly, the Cowboy State leads the nation in wind power per capita, and all of its new generation capacity from 2016 to 2019 will be wind.61 According to a University of Wyoming study, these new facilities will bring substantial financial benefits to the state, including “more than $700 million in tax revenue to local governments, more than $400 million to the state and more than $700 million to Wyoming schools, all over a 20-year period.”62
The politics surrounding renewables in Wyoming are quite interesting. As the Casper Star Tribune explains: “Though [renewable] industry interest in Wyoming has flourished, the state, through its policies, has maintained a fierce loyalty to fossil fuel industries, which contribute billions of dollars in tax revenue to state and local coffers.”63
As a measure of the strength of the fossil fuel lobby (and, perhaps, of Tea Party ideology), Wyoming has actually been considering legislation to raise taxes on renewables and perhaps ban the sale of wind power in the state. In the end, the
60 Kurt Sevits, “Colorado Governor John Hickenlooper Announces New Climate Executive Order,” The Denver Channel (July 11, 2017), http://www.thedenverchannel.com/news/local-news/colorado- governor-john-hickenlooper-announces-new-climate-executive-order.
61 Heather Richards, “New Wind Puts Wyoming Top of the List for Renewables, but the Reality is More Complicated,” Casper Star Tribune (April 24, 2017), http://trib.com/business/energy/new-wind-puts- wyoming-top-of-the-list-for-renewables/article_e52050d0-73f6-5a53-b5f6-946d8107aee4.html.
62 Robert Godby et al., “An Assessment of Wyoming’s Competitiveness to Attract New Wind Development,” University of Wyoming Center for Energy Economics and Public Policy (September 2016), http://www.uwyo.edu/cee/_files/docs/201609_wyoming-wind-competitiveness.pdf.
63 Heather Richards, “New Wind Puts Wyoming Top of the List for Renewables, but the Reality is More Complicated,” Casper Star Tribune (April 24, 2017), http://trib.com/business/energy/new-wind-puts- wyoming-top-of-the-list-for-renewables/article_e52050d0-73f6-5a53-b5f6-946d8107aee4.html.

BEYOND THE BELTWAY: A REVIEW OF STATE ENERGY AND CLIMATE POLICES
18
legislative push seems to have fizzled, at least for now.64 At the same time, Microsoft recently made a deal to supply its new data center in Cheyenne with up to 50% renewable energy. In fact, according to the Energy Information Administration, Wyoming gets nearly 10% of its power from wind, making it 15th in the nation.
The Republican Party has overwhelming control of the state legislature, and President Trump carried the state the state by a whopping 50% margin. Still, in the end, it looks like economics may trump Trump.
Montana.
Montana gets 34% of its energy from hydro and 55% from coal. (The state holds vast coal reserves). Wind grew steadily starting in 2005 and by 2015 was at 6.7%. The state set a renewable portfolio standard of 15% by 2015, which utilities are presumably meeting by purchasing renewable energy credits from other states.
Montana has had Democratic governors since 2009, but the legislature is currently under firm Republican control. The current Governor’s energy plan balances support for coal with several other goals, such as reducing overall energy use by 10% and continuing to grow the economy and doubling solar by 2025.65 He commented that the plan would advance Montana’s interests “by moving us toward more renewable energy, and encouraging innovation and energy efficiency. Because really, the only constant here is change. And as the saying goes, you’re either driving the bus or you’re under it."66 In May 2017 he vetoed Senate Bill 154, which would have eliminated tax credits and other incentives for renewables.
The Governor also condemned Trump’s withdrawal from the Paris Climate Accord:
“Ask any Montana farmer, rancher, hunter, angler, or skier – climate change is real and poses a threat to our economy and our way of life . . . . To not acknowledge that or deal with it in a responsible way is short-sighted and dangerous. In Montana, and in America, we face our challenges head on and work together to find solutions. We do not run away from them or pretend they don’t exist.”67
The state issued its first climate assessment in 2017. The report concluded that the state would experience temperature increases of 4.5-6.0 degrees Fahrenheit by midcentury and 5.6-9.8 degrees by 2100; multi-year and decade-long droughts; and significant changes in snowpack and runoff.68
64 “The Largest Wind Farm in the U.S. is Being Built in Wyoming, and Lawmakers Want to Raise Wind Tax,” Clean Technica (July 15, 2017), https://cleantechnica.com/2017/07/15/largest-wind-farm-us-built-wyoming-lawmakers-want-raise-wind-tax/.
65 Montana Office of the Governor, “Governor Bullock Releases Blueprint for Montana’s Energy Future” (June 21, 2016), http://governor.mt.gov/newsroom/governor-bullock-releases-blueprint-for-montanas-energy-future.
66 Corin Cates Carney, “Bullock’s Energy Plan to Develop All Montana’s Energy Resources,” Montana Public Radio (June 21, 2016), http://mtpr.org/post/bullocks-energy-plan-develop-all-montanas-energy-resources.
67 Montana Office of the Governor, “Governor Bullock Weighs in on Decision to Withdraw from the Paris Agreement” (undated), https://governor.mt.gov/Newsroom/governor-bullock-weighs-in-on-decision-to-withdraw-from-the-paris-agreement.
68 Cathy Whitlock et al., “2017 Montana Climate Assessment,” Montana State University and University of Montana (2017), http://montanaclimate.org/chapter/executive-summary.

BEYOND THE BELTWAY: A REVIEW OF STATE ENERGY AND CLIMATE POLICES
19
While the state is similar to its mountain west neighbors in terms of resources and demographics, Montana’s leadership from the governor’s office may be helping to develop policies that address some of these risks.
A Final Slice of the West: Idaho, Utah, and New Mexico.
These three states lie on a diagonal slash, with Idaho at the Northwest and New Mexico in the Southeast. They’re in the small population range: 3 million for Utah, 2 million for New Mexico, and 1.6 million for Idaho. (That still makes them population giants compared to Wyoming, for example.) But they are all very different when it comes to energy mix and renewables policies. These states illustrate the roles of geography and politics: New Mexico, a Democratic leaning state, makes the most use of renewables and has adopted a renewable portfolio standard, but still makes significant use of coal. Idaho and Utah are very different, probably because of geography: there is a lot of hydro in Idaho, not much in Utah. Meanwhile, Utah and New Mexico have high, but largely untapped, solar potential.
Idaho. Idaho gets 56% of its power from hydro, 25% from natural gas, and most of the rest from wind (14.5%, with another 4% from biomass). It has no renewable energy standard or target. Wind power grew quickly between 2010 and 2014, and natural gas doubled from 2010 to 2015. The state is also a major importer of electricity, which these figures do not reflect. Idaho has decent solar potential but has not developed significant solar generation. However, Idaho Power entered into an agreement in 2014 for two plants producing 120 MW, which went into service in late 2016.69 Several small additional projects were initiated in 2016.70
Idaho politics are pretty simple. The GOP has overwhelming majorities in both houses of the legislature, which it has controlled for at least 25 years. No Democrat has been elected governor during that time either.
Utah. Utah gets three-quarters of its power from coal and most of the rest from natural gas. Hydro, solar, and wind account for about 5%, although the state has a goal of 20% renewables by 2025. Since much of the state is desert, solar potential is high. Until 2015, however, solar seems to have been nonexistent in the state. The government boasts, however, that the “solar resource in Utah is simply world class” and established three solar zones in the hope of streamlining permitting.71 In contrast to Idaho, Utah is a significant exporter of electricity.
If anything, Utah is even more solidly Republican than Idaho, with only a few Democrats in the state legislature Climate change is probably a taboo term in Utah politics, but the state does have reason to be concerned. According to the pre-Trump EPA, “In the coming decades, the changing climate is likely to decrease the flow of
69 Glen Beeby, “Two Large Solar Plants to be Built in Boise, Elmore Counties,” Idaho News (July 30, 2014), http://idahonews.com/news/local/two-large-solar-plants-to-be-built-in-boise-elmore-counties.
70 Cynthia Sewell, “A New Crop is Now Growing in Idaho: Solar Energy,” Idaho Statesman (July 25, 2016), http://www.idahostatesman.com/news/business/article91855892.html.
71 Governor’s Office of Energy Development, “Renewable Energy,” http://energy.utah.gov/category/renewable-energy/.

BEYOND THE BELTWAY: A REVIEW OF STATE ENERGY AND CLIMATE POLICES
20
water in Utah’s rivers, increase the frequency and intensity of wildfires, and decrease the productivity of ranches and farms.”72
New Mexico. New Mexico makes more use of renewables (10% solar and wind combined), but fossil fuels are the mainstay: 62% coal and 28% gas. Wind power grew rapidly from 2003 to 2011, but then leveled off. The state has a renewable portfolio standard of 20% by 2020 for investor-owned utilities (but only 10% for co-ops). Solar potential is high (due to lots of southern desert) but barely exploited. New Mexico exports electricity, but the amount fell by half from 2010 to 2015.
New Mexico had unified Democratic government from 2003 to 2010. The Democrats still control the state legislature, but Governor Susana Martinez is a Republican. Democratic legislators recently introduced a bill to make the state’s renewable energy targets much more rigorous,73 but it is unclear if that effort will become law.
IV. Mid-America
Illinois.
It went pretty much unheralded by the national media, but in December 2017 Illinois adopted a major new energy law — and with strong bipartisan support. Each side had some things to celebrate.
Governor Bruce Rauner, a Republican, touted the impact of the law on utility bills, claiming that it would cap average electricity price increases at 25 cents for the average home and 1.3% for commercial and industrial users, with rates projected to decrease in early years due to energy efficiency measures.74 The Governor also expressed satisfaction that the bill would allow two nuclear plants to stay open by crediting them for their zero carbon emissions.
Environmentalists also saw much to celebrate. According to the Sierra Club, the new law will “open the door for more clean energy development across the state, create tens of thousands of jobs, and provide Illinois with a strong path forward in moving beyond dirty and expensive fossil fuels.”75 The Environmental Defense Fund also praised the law, noting that it will require the state’s largest utilities to significantly increase energy efficiency by 2030.76 It also improves Illinois’s renewable portfolio
72 US Environmental Protection Agency (January 19, 2017 Snapshot), “What Climate Change Means for Utah” (August 2016), https://19january2017snapshot.epa.gov/sites/production/files/2016-09/documents/climate-change-ut.pdf.
73 Morgan Lee, “New Mexico Considers More Aggressive Renewable Energy Goals,” Las Cruces Sun-News (Feb. 1, 2017), http://www.lcsun-news.com/story/news/2017/02/01/new-mexico-considers-more-aggressive-renewable-energy-goals/97370544/.
74 “Governor Signs Legislation to Protect Jobs, Ratepayers and Taxpayers,” Illinois News (December 7, 2016), http://www3.illinois.gov/PressReleases/ShowPressRelease.cfm?SubjectID=3&RecNum=13923.
75 “Sierra Club Statement on Illinois Energy Bill SB2814,” eNews Park Forest (December 2, 2016), http://enewspf.com/2016/12/02/sierra-club-statement-illinois-energy-bill-sb-2814/.
76 Andrew Barbeau, “Illinois’ Future Energy Jobs Bill Shows States are Taking the Lead to Build the Clean Energy Economy,” Environmental Defense Fund (December 7, 2016), http://blogs.edf.org/energyexchange/2016/12/ 07/illinois-future-energy-jobs-bill-shows-states-are-taking-the-lead-to-build-the-clean-energy-economy/.

BEYOND THE BELTWAY: A REVIEW OF STATE ENERGY AND CLIMATE POLICES
21
standard, directly leading to the development of – at a minimum – 3,000 MW of solar and 1,300 MW of wind power, or enough to power almost 1 million homes. In addition, the law creates a community solar program, allowing “those who can’t or don’t want to install solar panels on their roof – like home renters or apartment dwellers – to ‘subscribe’ to a solar project at a local church, school, or business.” Finally, the bill allocates $25 million per year for low-income home energy efficiency, solar deployment and job training.77
Bipartisanship seems to be an endangered species in Washington, D.C. But what happened in Illinois may give us hope that things could change in Washington.
Indiana.
Coal accounts for about 70% of Indiana’s power generation, with about 20% coming from natural gas and 10% from renewables (primarily wind). Indiana gets about 1900 MW from large-scale wind farms. It also gets 4.5 MW from small-scale wind, which receives some preferential state tax treatment. Solar gets similar tax treatment. In addition, five of the state’s utilities offer net metering. 143 MW of solar are connected to the grid. In 2015, about 870 Indiana customers used net metering. The state has a 10% renewable portfolio standard.
In May 2017, Governor Eric Holcombe signed Senate Bill 309, which phases down support for solar by eliminating net metering so that after 2022 new solar installations will receive the lower, wholesale rate for power they sell back into the grid (rather than the higher retail rate they currently receive).78
Why is Indiana so much less receptive to renewables than Ohio and Michigan (each discussed in subsequent sections)? No doubt there are more complicated explanations, but raw politics must have something to do with it. President Trump won relatively close victories in Michigan and Ohio with margins below 10%, but he carried Indiana, long a far more Republican state than its neighbors, by nearly 20%. Thus, the Republican grasp on Indiana is stronger, and there is correspondingly less need for conservatives to compromise with Democrats or moderate Republicans. The result is a set of policies that are somewhat at odds with regional resources and economics.
Michigan.
Rick Snyder, the Governor of Michigan, has been evasive regarding his views on climate change. But in February, 2016, he joined a group of 16 other governors (including Jerry Brown) to endorse renewable energy, energy efficiency, vehicle options such as biofuels and electric cars, and grid improvements.79 Michigan’s reliance on coal has dropped quickly in recent years. According to the EIA, coal
77 Ibid.
78 Scott L. Miley, “Some Hoosiers Seek Energy Policy Amid Solar Battle,” Tribune-Star (May 7, 2017), http://www.tribstar.com/news/local_news/some-hoosiers-seek-energy-policy-amid-solar-battle/article_cd64bc3b-331f-5256-92b6-c604980a1d85.html.
79 "Governors' Accord for a New Energy Future" (February 16, 2017), https://www.eenews.net/assets/2016/02/16/document_pm_02.pdf.

BEYOND THE BELTWAY: A REVIEW OF STATE ENERGY AND CLIMATE POLICES
22
provided half of the state’s electricity in 2014, but by 2016 coal’s share was down to about a third.
At the end of 2016, Snyder brokered a deal to raise Michigan’s renewable portfolio standard from 10% to 15%. Snyder applauded the plan as “a statewide energy policy that will save Michigan residents millions of dollars on their electricity bills, alleviate concerns about having enough capacity to power the daily activities of 10 million and find new ways to use our existing energy grid more effectively.”80 This may appear to be a minor shift when compared to the aggressive standards being set and achieved in other parts of the country, but it is a welcome development for the region and for a state under Republican leadership.
Minnesota.
Minnesota has had climate change legislation on the books since 2007, when the Next Generation Energy Act was signed by Republican Governor Tim Pawlenty. The law called for the state to reduce its emissions 15% by 2015 and 80% by 2050. At the time, Pawlenty saluted the bill, saying, “[t]he nation has been asleep at the switch, but here in Minnesota we are kick-starting the future by increasing our nation-leading per capita renewable fuel use, boosting cost-saving measures and tackling greenhouse gas emissions.”81 Pawlenty dropped that position quickly when he started to have national political ambitions, but his willingness to sign the bill in the first place was noteworthy. Of course, this was before GOP backlash to the Obama presidency made it unthinkable for most Republicans to acknowledge the need to address climate change.
The 2007 statute sets ambitious goals for reducing greenhouse gases, but its operative provisions focus almost entirely on increasing energy efficiency and the use of renewable energy in the electricity sector, including the use of a carbon price in resource planning decisions.82 Provisions dealing more generally with climate change are limited. The statute calls for creation of a state climate change plan, mandates cooperation with other states to the extent possible, and directs the government to explore interest in a regional cap-and-trade system with other states. It also banned construction of new coal-fired plants in the state and attempted to limit purchases of electricity from such plants outside the state. The provisions dealing with out-of-state sources were struck down in a poorly reasoned opinion by the Eighth Circuit, which was based in large part on an interpretation that the law regulated transactions taking place outside of Minnesota, in violation of the Constitution’s Commerce Clause.83 But none of the provisions about new coal plants turned out to have much
80 Robert Walton, “Down to the Wire, Michigan Passes Sweeping Renewable Energy, Retail Choice Reforms,” Utility Dive (December 16, 2016), https://www.utilitydive.com/news/down-to-the-wire-michigan-passes- sweeping-renewable-energy-retail-choice/432528/.
81 Catharine Ricert, “Pawlenty Changes Course on Cap-and-Trade,” PolitiFact (September 24, 2009), http://www.politifact.com/truth-o-meter/statements/2009/sep/24/tim-pawlenty/pawlenty-changes-coursse-cap-and-trade/.
82 Reviser of Statutes, State of Minnesota, "Laws of Minnesota for 2007 — Chapter 136" https://www.revisor.mn.gov/data/revisor/slaws/2007/0/136.pdf.
83 North Dakota v. Heydinger, 825 F.3d 912 (8th Cir. 2016).

BEYOND THE BELTWAY: A REVIEW OF STATE ENERGY AND CLIMATE POLICES
23
significance since none have been built or seem likely to be built anyway, due to the falling prices of natural gas and renewable energy.
The state has been fairly successful in dealing with the electricity sector, with renewable energy accounting for over 20% of electricity generated in the state (approximately 80% of which comes from wind).84Emissions have plateaued a bit below their 2005 level. But this is less progress than the state was hoping for. It recently reported that it had badly missed its 2015 goal for greenhouse gases, cutting emissions by only 4% below 2005 levels, rather than the 15% target.85
Further progress does seem likely, even without a big push from regulators. According to Minnesota Public Radio, the changing economics of the energy industry are pushing utilities away from coal and toward natural gas and wind power:
“The plans of Minnesota Power, Otter Tail Power and Xcel Energy — the state’s three investor-owned utilities — to embrace more wind energy will mean less coal arriving on trains from Wyoming and Montana . . . . Minnesota Power aims to generate a third of its energy from coal, a third from renewables and a third from natural gas by 2030. As recently as two years ago, coal was generating 75 percent of the utility’s power.”86
As a result, MPR says, the state will meet its targets under the Clean Power Plan even if the Plan itself is rescinded by President Trump.
Transportation emissions seem to be a more difficult problem than power plant emissions. The 2007 Act does not provide tools for dealing with transportation emissions, so perhaps it is not surprising that so little progress has been made. The Twin Cities are great places to live in part because it has so much high-quality, single-family housing. But this also translates into a lot of sprawl, because the low density in the core cities pushes development out farther, which inflates vehicle emissions. As a result, the state’s greatest need may be to bring down its transportation emissions. The government is looking to the same regulatory toolkit as other states: policies to increase housing density, expand mass transit, and promote electric vehicles. The state might also do well to consider adopting the California standards for tailpipe emissions, as have around a dozen other states. But existing legislation does not mandate these policies, so agencies would have to use existing discretionary authority.
As always, politics will have a major impact on future climate policy. Governor Mark Dayton is a Democrat. Republicans have only a one-vote margin in the state Senate, but they control the state House 77-57. Minnesota has been a Democratic stronghold
84 Amanda Jarrett Smith, “Climate Solutions and Economic Opportunities,” Minnesota Environmental Quality Board (undated), https://www.eqb.state.mn.us/sites/default/files/documents/CSEO_EQB.pdf.
85 Minnesota Pollution Control Agency, “Greenhouse gas emissions data,” https://www.pca.state.mn.us/greenhouse-gas-emissions-data.
86 Elizabeth Dunbar, “Economics, Not EPA, Drive Down Power Plant Emissions in Minnesota,” Minnesota Public Radio News (March 28, 2017), https://www.mprnews.org/story/2017/03/28/economics-not-epa-drive-down-power-plant-emissions-in-minnesota.
BEYOND THE BELTWAY: A REVIEW OF STATE ENERGY AND CLIMATE POLICES
24
in presidential elections, but Hillary Clinton carried it by less than 2%. Governor Dayton is not running for reelection, but his high approval ratings may be a good sign for the party. If Democrats do take control of state government, there may be a chance for further legislation on climate change.
The state does have some strong motivations to take further action. According to a state report:
“We have experienced four 1,000-year rainfalls since 2002. We have watched our spruce, fir, aspen, and birch forests retreat northward. And air pollution related to greenhouse gas emissions annually costs us more than $800 million in increased health care costs.”87
It remains to be seen, as with so many things, which direction politics drives climate policy in Minnesota in the next few years.
Ohio.
Governor John Kasich’s support for renewable energy may seem unsurprising, since he is about as close as the Republican Party comes to having a moderate these days. Kasich issued a strong statement condemning President Trump’s withdrawal from the Paris agreement.88 He admitted to having some problems with the treaty as currently drafted. “But,” he continued, “I know that climate change is real. It is a global issue and will need a global agreement to address. And we could have negotiated that agreement in ways that would not needlessly destroy jobs.” He added:
“A properly negotiated agreement could actually have ended up driving innovation and creating jobs. By withdrawing from the agreement, the Administration has passed up an opportunity both to expand U.S leadership in clean energy technology and to create well-paid American jobs with a future.”
Ohio’s grid is heavily dependent on fossil fuels, according to the EIA, with almost 60% coming from coal, 24% from natural gas, and 14% from nuclear. That leaves about 2% for renewables. Ohio has a weak renewable portfolio standard. Utilities are required to obtain a percentage of their energy from renewable sources, with amounts rising steadily from less than 1% when the law was passed to 12.5% in 2026. Apparently, these percentages were still too high to suit the Ohio legislature, which passed a bill to freeze the standards.
Kasich vetoed the bill. He stated that Ohio’s “wide range of energy generation options” had helped to increase employment in the state during his term,” adding that to eliminate the RPS would risk “undermining this progress by taking away some of those energy generation options, particularly the very options most prized by the companies poised to create many jobs in Ohio in the coming years, such as high
87 Amanda Jarrett Smith, “Climate Solutions and Economic Opportunities,” Minnesota Environmental Quality Board (undated), https://www.eqb.state.mn.us/sites/default/files/documents/CSEO_EQB.pdf.
88 Chris Mosby, “Governor Kasich Blasts Paris Climate Accord Withdrawal,” Cleveland Patch (June 2, 2017), https://patch.com/ohio/cleveland/governor-kasich-blasts-paris-climate-accord-withdrawal.

BEYOND THE BELTWAY: A REVIEW OF STATE ENERGY AND CLIMATE POLICES
25
technology firms.”89 As in many other Midwestern states, the economics of renewable energy may be starting to push back against less favorable politics.
Wisconsin.
Wisconsin’s electricity mix is very old-fashioned. In 2016, coal provided 52% of the state's net electricity generation; as compared with only 8% is from renewables. That is a mix of biomass, hydro, and wind. No solar. Fifteen percent is from nuclear, and the rest is natural gas. It has a 10% renewable portfolio standard.
The state could do better. Neighboring Minnesota, which has about three times as much wind potential, generates 17% of its energy from wind, about six times as much as Wisconsin, so Wisconsin could probably double its generation of wind power with no greater effort than Minnesota has made.
There seems to be a lot of variation between utilities, with some getting as much as 20% of their power from renewables.90 Madison, the state capital, has pledged to achieve 100% renewables, though it has not set a deadline.91 Milwaukee has joined with other cities and states in expressing its support for the Paris Agreement and pledging to take action against climate change.92 But the state government is hostile to renewables, with the public utility commission taking a number of steps to discourage solar (one of which was rejected by the courts).93 The state’s Department of Natural Resources has scrubbed all references to climate change from its website.94 Still, economics have some effect. As in other states, coal plants are beginning to close, including a ninety-year-old plant in Green Bay.95 It remains unclear, however, why Wisconsin seems to be lagging Michigan and Ohio, two rather similar states.
Kentucky and West Virginia.
You cannot question the dedication of these two states to coal. Kentucky gets 87% of its energy from coal, about 6% from natural gas, and 4% from hydro. West Virginia stands at 94% coal, 2% each of wind and hydro, and 1% natural gas. In both cases, electricity generation is down somewhat since the turn of the century. In West
89 Peter Krouse, “Ohio Gov. John Kasich Vetoes Renewable Energy Freeze,” Cleveland.com (December 27, 2016), http://www.cleveland.com/metro/index.ssf/2016/12/ohio_gov_john_kasich_vetoes_re.html.
90 Thomas Content, Report Cites Mixed Results for Wisconsin's Renewable Energy Progress, Milwaukee Journal Sentinel (May 28, 2016), available at http://archive.jsonline.com/business/report-cites-mixed-results-for-wisconsins-renewable-energy-progress-b99732648z1-381205601.html/.
91 Kari Lydersen, Wisconsin’s Capital City Sets a High Bar with Ambitious Renewable Energy Goal (March 24, 2017), available at http://midwestenergynews.com/2017/03/24/wisconsins-capital-city-sets-a-high-bar-with-ambitious-renewable-energy-goal/.
92 City of Milwaukee, “We Are Still In,” http://city.milwaukee.gov/Climate-Action.htm#.Wnuzn5M-cdV
93 Thomas Content, Judge Rejects We Energies Plan to Assess Solar Panel Owners Extra Fees, Milwaukee Sentinel (October 30, 2015), available at http://archive.jsonline.com/business/judge-rejects-we-energies-plan-to-assess-solar-panel-owners-extra-fees-b99606784z1-338962302.html.
94 James Rowan, DNR Censors All Climate Change Info, Urban Milwaukee, Urbana (December 26, 2016), https://urbanmilwaukee.com/2016/12/26/op-ed-dnr-censors-all-climate-change-info/.
95 Darrell Proctor, Another Coal-fired Plant Will Close in Wisconsin, Power Magazine (December 3, 2017), http://www.powermag.com/another-coal-fired-plant-will-close-in-wisconsin/.
BEYOND THE BELTWAY: A REVIEW OF STATE ENERGY AND CLIMATE POLICES
26
Virginia, the Republicans have commanding majorities in both houses of the legislature, and Governor Jim Jordan recently switched his affiliation to the GOP. The Republicans gained unified control in Kentucky in 2016 by taking a majority in the General Assembly.
Yet there are glimmers of change even in these two states. A sign of the times: Fox News has reported, without comment, that the Kentucky Coal Museum is installing solar panels to save money.96 This is part of a substantive trend of shifts in power production in traditional coal states. For instance, in West Virginia, Appalachian Power has closed three coal plants and converted two to natural gas, reducing its coal-fired generation from 74% in 2012 to 61% in 2017. In response to an inquiry from the Governor, the company said it has no plans to build another coal plant. In Kentucky, the Public Service Commission has advised companies about offering renewable energy packages in order to attract large corporations, many of which have strong green energy programs.97
These coal-producing states are still heavily dependent on coal for power. And the political pressure to stick with coal is strong. Nonetheless, coal is slowly losing ground, even in the places where it is most prized.
The Lower Mississippi.
The states in the lower Mississippi River basin have a lot in common. From Missouri down to Louisiana and Alabama, they all voted for President Trump. None of these states – Alabama, Arkansas, Louisiana, Mississippi, Missouri and Tennessee – has deregulated their electricity or natural gas markets. (It is a bit of a geographical stretch to include Alabama in the Mississippi basin, since only the top of the state drains into the Mississippi, but it is a natural pairing with Mississippi.) And, as it turns out, none of them are home to any significant solar or wind. Nevertheless, there are interesting differences between their energy mixes, which can be found easily on Georgetown’s state climate database.
To begin with, the use of coal varies widely. Coal is 10% of the energy mix in Mississippi, 27% in Alabama (about the same share as nuclear there), 40% in Arkansas, 14% in Louisiana, 40% in Tennessee, and a whopping 78% in Missouri. Recent trends also vary widely. For instance, in Alabama, coal use fell by half from 2005 to2015, replaced by natural gas, but the decline in Louisiana was much smaller.
Use of natural gas varies similarly: 70% in Mississippi, 37% in Alabama, 27% in Arkansas (about the same as nuclear there), 60% in Louisiana, 12% in Tennessee (with nuclear at about 30%), and 12% in Missouri.
As pointed out earlier, none of these states makes significant use of solar or wind, with many below 1% of total generation. But in 2014, distributed solar rose steeply
96 “Kentucky Coal Mining Museum Switches to Solar Power,” Fox News (April 6, 2017), http://www.foxnews.com/us/2017/04/06/kentucky-coal-mining-museum-switches-to-solar-power.html.
97 Diane Cardwell and Clifford Krauss, “Coal Country’s Power Plants are Turning Away from Coal,” NY Times (May 26, 2017), https://www.nytimes.com/2017/05/26/business/energy-environment/coal-power- renewable-energy.html.
BEYOND THE BELTWAY: A REVIEW OF STATE ENERGY AND CLIMATE POLICES
27
in Mississippi, Alabama, Arkansas. Louisiana saw some increase that year but a bigger one the following year. Since the baselines were miniscule, however, the overall percentages still remained low. Tennessee also saw distributed solar rise in 2014, but unlike the other states, utility-scale solar was also a presence and more or less doubled.
Missouri stands out because 1.2% of its power comes from wind – not much, but well above the other states in this group. Missouri is also a standout because it is the only one of these states with a renewable portfolio standard, adopted by the voters in 2008. The RPS requires 10% renewables by 2018. According to the Energy Information Administration, renewables “accounted for 3.4% of Missouri's net electricity generation in 2016; most of that generation came from conventional hydroelectric power, solar, and wind.” However, things may be changing: local utility Ameren has announced intentions to introduce at least 700 MW of wind power to the state by 2020, and 100 MW of solar by 2027.98
Things could also be starting to change in the other states in the region. In the last couple of years, for instance, utility-scale solar has begun to make an appearance in Mississippi.99 Energy efficiency is an especially appealing option in the South. Arkansas has taken the lead in the region in this regard.100
Despite minimal use of renewables in this region, the huge diversity in energy mixes shows the importance of factors other than state policy. There seem to be some geographic trends. Within the region, natural gas use rises closer to the Gulf of Mexico, while coal use rises as you go north. That might be due to transportation costs, but that cannot be the whole story. For instance, Illinois on the opposite side of the river from Missouri, but relies half as heavily on coal (and very heavily on nuclear.) Alabama and Mississippi are neighbors, but Mississippi relies twice as much on natural gas. It is reasonable to think that politics and the business strategies of particular utilities have something to do with the variation, not just geography.
It is heartening to see that renewables are beginning to get a small foothold in these states. But so far there has been little indication of a rapid transformation. It seems likely that any real changes will have to come from a combination of economic pressures and federal intervention.
V. The Northeast
98 Anmar Frangoul, “Ameren Missouri Set to Invest $1 Billion in Renewables, Adding 700 Megawatts of Wind Power,” CNBC (Sept. 26, 2017), https://www.cnbc.com/2017/09/26/ameren-missouri-to-invest-1-billion-in-renewables-wind-power-solar.html.
99 Louie Miller, “As Another Coal Plant Closes, Solar Energy Keeps Shining in Mississippi,” Sierra Club (Sept. 25, 2017), https://www.sierraclub.org/press-releases/2017/09/another-coal-plant-closes-solar-energy-keeps-shining-mississippi.
100 Jim Pierobon, “As Arkansas Leads on Efficiency, Two States Poised to Follow,” Southeast Energy News (June 26, 2017), http://southeastenergynews.com/2017/06/26/as-arkansas-leads-on-efficiency-two-states-poised-to-follow/.

BEYOND THE BELTWAY: A REVIEW OF STATE ENERGY AND CLIMATE POLICES
28
Massachusetts.
Even a decade ago, it was clear that climate change is a serious threat to Massachusetts. In 2007, in its path-breaking decision on climate change, the U.S. Supreme Court gave Massachusetts standing to challenge the Bush Administration’s refusal to regulate greenhouse gases.101 The basis for standing was the impact of sea level rise on the state. It now seems that the estimates back then may have been too cautious. According to a report by the state five years later:
“Assuming that sea level continues to increase at its current rate, because land in Massachusetts is naturally subsiding, by the end of the century, it is expected to rise by another one foot . . . . By the end of this century, under the IPCC high emissions scenario with ice melt, it has been suggested that sea level rise resulting from all these factors could reach six feet.”102
The report added that, “[s]ince a large percentage of the state‘s population, development, and infrastructure is located along the coast, the impact of this change will be significant, putting the Massachusetts economy, health, natural resources, and way of life at risk.” Of course, there will be other impacts, too. The City of Boston warns that “[c]ompared to the period from 1971 to 2000, when an average of 11 days per year were over 90 degrees, there may be as many as 40 days over 90 degrees by 2030 and 90 days by 2070—nearly the entire summer.”103
In the aftermath of President Trump’s announcement that he intended to withdraw from the Paris Agreement, Republican Governor Charlie Baker pushed back: “As the Commonwealth reiterates its commitment to exceed the emission reduction targets of the Paris Climate Agreement, today we join the U.S. Climate Alliance to expand on our efforts while partnering with other states to combat climate change.”104
In August 2017, the Massachusetts Department of Environmental Protection (MassDEP), issued regulations establishing an allowance trading program for CO2 emissions from electricity.105 The regulation “sets a sector-wide, annually declining limit on aggregate CO2 emissions from 21 large fossil fuel-fired power plants in Massachusetts, from 8.96 million metric tons of CO2 in 2018 down to 1.8 million metric tons in 2050.” Other new rules “require metropolitan planning organizations and the Massachusetts Department of Transportation to incorporate greenhouse gas emissions evaluation, tracking and reduction into regional transit plans and mass
101 Massachusetts v. EPA, 549 U.S. 497 (2007).
102 Massachusetts Executive Office of Energy and Environmental Affairs, “Massachusetts Climate Change Adaptation Report” (September 2011), http://www.mass.gov/eea/docs/eea/energy/cca/eea-climate-adaptation-report.pdf.
103 City of Boston, “Climate Ready Boston: Climate Consensus Projections” (May 2016), https://www.boston.gov/sites/default/files/document-file-12-2016/brag_report_summary.pdf.
104 Matt Murphy, “Gov. Baker Enters Mass. Into Multi-State Climate Alliance After U.S. Withdraws from Paris Agreement,” WBUR (June 2, 2017), http://www.wbur.org/news/2017/06/02/baker-massachusetts-joins-climate-alliance.
105 Massachusetts Department of Environmental Protection, “Electricity Sector Regulations Fact Sheet,” http://www.mass.gov/eea/docs/dep/air/climate/3dfs-electricity.pdf.

BEYOND THE BELTWAY: A REVIEW OF STATE ENERGY AND CLIMATE POLICES
29
transit improvement projects.”106 The Sierra Club rightly says that much more needs to be done regarding transportation and heating emissions.107 But Massachusetts does seem to be heading in the right direction, even under a GOP Governor.
That’s not entirely the doing of the Governor and legislature. In 2016, the state’s highest court ruled that the state was failing to meet the emission reduction targets established in a 2008 statute.108 The court turned up the heat on the state government, holding that the law required MassDEP to:
“[P]romulgate regulations that address multiple sources or categories of sources of greenhouse gas emissions, impose a limit on emissions that may be released, limit the aggregate emissions released from each group of regulated sources or categories of sources, set emission limits for each year, and set limits that decline on an annual basis.”109
As more states establish and reach deadlines under emission reduction and renewable generation targets, more litigation like this may help drive policy forward.
New Jersey.
Despite a Republican Governor, Chris Christie, who took the state out of the regional emissions trading program (the Regional Greenhouse Gas Initiative, or RGGI), New Jersey has started to do quite a bit on renewable energy in recent years. According to the Energy Information Administration, by 2016 New Jersey got almost all of its energy from natural gas (56%) and nuclear (39%). But the state has an aggressive renewable portfolio standard that will require about one-fourth of the state’s power to come from renewables by 2021. That would be timely, if only because one of its nuclear reactors at Oyster Creek is scheduled to close in 2019. The renewable portfolio standard is quite complicated, with special provisions for solar and for offshore wind.110 The main source of renewables is solar (about two-thirds of which is distributed solar).
There are also several state incentive programs for energy efficiency, and a demand response program (which compensates users for reducing their own power use during periods of peak demand) run by the interstate grid operator for the region, PJM.
Christie spent much of his time in office planning to become President or at the least Vice President, which meant cultivating the Koch brothers and later Donald Trump. While he often stood as a barrier against progress, he left office as an extremely unpopular governor and Democratic leaders in the state wasted no time making plans for the post-Chris Christie era, preparing an energy policy
106 Massachusetts Department of Environmental Protection, “Climate Action,” http://www.mass.gov/eea/agencies/massdep/climate-energy/climate/.
107 Ibid.
108 Kain v. Dept. of Env. Protection, 474 Mass. 278, 49 N.E.3d 1124 (2016).
109 Ibid.
110 Department of Energy, “Tax Credits, Rebates & Savings,” https://energy.gov/savings/renewables-portfolio-standard-0.

BEYOND THE BELTWAY: A REVIEW OF STATE ENERGY AND CLIMATE POLICES
30
overhaul that could significantly increase use of renewables. Under its new leadership, the state has already rejoined RGGI.111
Newly elected Democratic Governor Phil Murphy, who handily won the election, promised vigorous action during the campaign including rejoining RGGI, adding 3,500 MW of offshore wind and 2,000 MW of energy storage by 2030, and increasing solar production.
Thus, there is every reason to expect New Jersey to move forward aggressively now that it is under unified Democratic control. A lengthy new joint policy paper from Rutgers and Georgetown Universities provides a lot of suggestions for how the state could go about this.112 And the Washington Post reports that one big area of expansion may be offshore wind.113
New England.
The New England states include Massachusetts, Connecticut, Rhode Island, New Hampshire, Vermont, and Maine, with a total population of around 15 million (approximately half of which resides in Massachusetts). These states are mostly small in acreage but many western states have smaller populations – for instance, tiny Rhode Island has a larger population than the Dakotas, Wyoming, Montana, or Alaska.
In terms of energy policy, probably the most important thing to know about all these states is that they belong to RGGI, the Northeast/mid-Atlantic carbon trading system. That system has recently become more ambitious in its efforts to cut carbon. But each of these states has its own distinctive features.
The data from these states is really striking. There are enormous differences between the energy mixes within this confined cluster of smallish states. Vermont and New Hampshire, for instance, are completely different in their energy mixes. It is hard to believe that these differences are due to geography. This diversity creates large opportunities for gains from trade in electricity, renewable credit, and carbon markets. Massachusetts was discussed separately above. Here are the basics about the others.114
Connecticut. Connecticut produces almost no renewable energy; its generation is more or less evenly split between nuclear and gas. Since 2010, coal has been nearly pushed out of the market. The state has a renewable portfolio standard of 27% by
111 Tom Johnson, “Planning a Clean-Energy Agenda for When Christie is Former Governor,” NJ Spotlight (Jan. 4, 2017), http://www.njspotlight.com/stories/17/01/03/planning-a-clean-energy-agenda-for-when-christie-is-former-governor/.
112 Gabriel Pacyniak et al., “An Examination of Policy Options for Achieving Greenhouse Gas Emissions Reductions in New Jersey,” (September 2017), http://www.georgetownclimate.org/files/report/Achieving%20Greenhouse%20Gas%20Emissions%20Reductions%20in%20NJ.pdf.
113 Dino Grandoni, “The Energy 202: With Chris Christie Gone, Wind Energy May Pick Up Speed in New Jersey,” Wash. Post (Nov. 13, 2017), https://www.washingtonpost.com/news/powerpost/paloma/the- energy-202/2017/11/13/the-energy-202-with-chris-christie-gone-wind-energy-may-pick-up-speed-in-new-jersey/5a091e0630fb045a2e002fb5.
114 Data in this section is primarily drawn from the Georgetown Climate Center State Energy Analysis Tool.

BEYOND THE BELTWAY: A REVIEW OF STATE ENERGY AND CLIMATE POLICES
31
2020. The state also encourages long-term procurement contracts for renewables, which eases financing, and has established a green finance bank. In 2013, the state was ranked in the top five for energy efficiency.
Connecticut had a long run of Republican governors until 2010, when it elected Democrat Dannell Malloy. Both houses of the legislature have been in Democratic hands almost continuously for the past fifteen years.
In June 2017, Governor Malloy announced that the state was joining the U.S. Climate Alliance. He said, “[w]e remain committed to meeting the standards set forth in the Paris Climate Agreement because it is the right thing to do for not only the future of our state, but for the future of our planet.”115
Maine. Maine’s power mix is dramatically different from Connecticut, primarily composed of 11% wind, 25% natural gas, 29% hydro, and 27% biomass. Like Connecticut, it has virtually no solar. Maine has easily met its renewable portfolio standard, which required 40% renewable generation by 2017, including 30% from pre-2005 sources (mainly existing hydro and biomass) and 10% from sources built after 2005 (primarily wind, which was almost nonexistent in the state when the RPS was enacted in 2007). Interestingly, total energy use seems to be down significantly from its peak. As in other parts of the country, Maine’s ability to sell its renewable power to other states (especially Massachusetts) is hampered by lack of transmission capacity.116
Maine’s legislature is narrowly divided, with a small Democratic majority in one house and a one-vote GOP majority in the other. Governor Paul LePage is as outspoken a conservative as you could find anywhere, whom the Washington Post has called “unhinged.” He does not seem to have dented the state’s commitment to renewable energy.117
New Hampshire. New Hampshire generates half of its energy from nuclear and a third from natural gas, with renewables accounting for most of the rest along with a dash of coal power. There is bit of wind power (2%), but most of the renewables are biomass (8%) and hydro (6%). The renewable portfolio standard is just below 25% by 2025. The Republicans control both houses of the legislature by decent margins (but not like the margins the GOP has in parts of the South and West). The governor’s office was held by the Democrats for over a dozen years until Republican Chris Sununu was elected in 2016.
Rhode Island. The smallest state in the Union has a renewable portfolio standard of 16% by 2019, but it currently gets only about 4% of its power from renewables.
115 “Gov. Malloy Adds Connecticut to Coalition of States Committed to Upholding the Paris Climate Agreement,” The Office of Governor Dannel P. Malloy (June 2, 2017), http://portal.ct.gov/Office-of-the-Governor/Press-Room/Press-Releases/2017/06-2017/Gov-Malloy-Adds-CT-to-Coalition-of-States-Committed-to-Upholding-the-Paris-Climate-Agreement.
116 Tux Turkel, “Why Maine’s Renewable Power Remains a Pipe Dream,” Portland Press Herald (December 19, 2016), http://www.pressherald.com/2016/12/19/why-maines-renewable-power-remains-a-pipe-dream/.
117 Editorial Board, “Maine’s Governor is Completely Unhinged,” Washington Post (September 27, 2016), https://www.washingtonpost.com/opinions/maines-governor-is-completely-unhinged/2016/09/27/5c318a30-84eb-11e6-a3ef-f35afb41797f_story.html.

BEYOND THE BELTWAY: A REVIEW OF STATE ENERGY AND CLIMATE POLICES
32
Renewables have rapidly expanded since 2012, so the state may actually close in on its target by the end of 2019. The striking aspect of Rhode Island’s energy mix is that virtually all of its other energy (94%) comes from natural gas. In 2015, Governor Gina Raimondo signed an executive order calling for the state government to reduce energy use and get all of its energy from renewables by 2025. She also favors a state carbon tax.118 In 2017, according to news reports, the state legislature enacted bills providing a “10-year extension on the state’s renewable energy growth program, streamlined processes for statewide solar permitting applications and connecting renewable energy installations to the power grid, and allows farmers to install a renewable energy system on [up to] 20 percent of their total farm land acreage.”119 Rhode Island has invested heavily in energy efficiency programs, with notable success.
Vermont. Vermont had a renewable portfolio standard of 20% by 2017. The target is virtually irrelevant, however, because Vermont generates nearly all of its power from renewables: 16% wind, 5% solar (far more than any of its neighbors), 56% hydro, and 23% biomass. But there is a caveat here. Vermont used to generate a substantial amount of nuclear power, for both in-state use (approximately one third of the state’s power) and export, before its only nuclear facility was retired in 2014.120 Governor Phil Scott is a Republican but seems enthusiastic about renewable energy and urged President Trump to stay in the Paris Accord. Vermont has also adopted California’s tailpipe standards for carbon emissions from new vehicles.121
New York.
New York is a member of RGGI. As of 2012, New York got about 50% of its power from hydro and nuclear, 44% from natural gas, and the remaining 6% from coal, wind, and biomass.122 By 2015, however, the state was reporting 11% of its power from renewables. In 2014, the state adopted a new energy plan, with 2030 targets including:
● 40% reduction in greenhouse gas emissions from 1990 levels,
● 50% electricity will come from renewable energy resources, and
118 Sue AnderBois, “RI Governor Raimondo Takes Bold Steps on Climate and Clean Energy,” NECEC (December. 9, 2015), http://www.necec.org/blog-details/ri-governor-raimondo-takes-bold-steps-on-climate-and-clean- energy.html.
119 Bill Tomison, “Raimondo: New Laws Help Foster ‘Clean Energy Economy’ for RI,” WPRI (August. 9, 2017), http://wpri.com/2017/08/09/raimondo-new-laws-help-foster-clean-energy-economy-for-ri/.
120 Mike Donoghue, “Vermont Yankee winds down operations,” Burlington Free Press (December 29, 2014), http://www.burlingtonfreepress.com/story/news/2014/12/29/vermont-yankee-plant-prepares-shut-down/20992137/.
121 “Governor Phil Scott Signs Letter Urging U.S. to Maintain Its Commitment to Paris Climate Agreement,” Office of Governor Phil Scott (May 17, 2017), http://governor.vermont.gov/press-release/governor-phil-scott-signs-letter-urging-us-maintain-its-commitment-paris-climate.
122 Institute for Energy Research, “New York: An Energy and Economic Analysis” (July 19, 2013), http://instituteforenergyresearch.org/analysis/new-york-an-energy-and-economic-analysis/.

BEYOND THE BELTWAY: A REVIEW OF STATE ENERGY AND CLIMATE POLICES
33
● 600 trillion Btu increase in statewide energy efficiency.123
The state projects CO2 emission reductions of up to 7.7 million tons (equivalent to taking 1.5 million cars off the road) per year as a result of its renewable portfolio standard, energy efficiency programs, RGGI membership and other policies that constitute this plan.124
In May 2017, Governor Andrew Cuomo also announced a plan to cut methane emissions. In June, he announced that New York was joining the U.S. Climate Alliance. He had this to say on that occasion:
“New York State is committed to meeting the standards set forth in the Paris Accord regardless of Washington's irresponsible actions. We will not ignore the science and reality of climate change, which is why I am also signing an Executive Order confirming New York's leadership role in protecting our citizens, our environment, and our planet."125
New York City has been a leader on climate change adaptation. In 2013, the city announced a $20 billion adaptation plan, which includes both infrastructure such as dune and seawalls to protect against the sea as well as funding to help property owners adapt to higher risks.126 Guidelines adopted in 2017 require greater elevation: For sea level rise, the guidelines advise adding 16 inches to what current code requires for structures expected to be in use beyond 2040, and three feet for those expected to last the century.127 The guidelines also point to an interactive map created by the city that projects flood hazards into the future and overlays them on city streets.
While its geography and renewable resources differ greatly from those of California, similarly favorable politics and potentially high exposure to climate change risks have led New York to a position of policy leadership on the East Coast.
Pennsylvania.
Pennsylvania has a fairly pitiful profile in terms of renewable energy. As of 2015, it got about 4% of its power from renewables, and only about half of that from wind and solar. Nearly all of the remainder was from nuclear (37%), coal (30%) and natural gas (28%). Perhaps not coincidentally, the state was the nation’s third-largest coal producer and the second largest natural gas producer in 2016, largely due to fracking. Things do seem to be shifting a bit away from coal: by 2017, natural gas had become
123 New York State, "2015 New York State Energy Plan Overview," https://energyplan.ny.gov/Plans/2015.
124 New York State, "2015 New York State Energy Plan Volume 1," https://energyplan.ny.gov/Plans/2015.
125 “Governor Andrew M. Cuomo Signs Executive Order and Commits New York to Uphold the Standards Set Forth in the Paris Accord,” Governor Andrew M. Cuomo (June 1, 2017), https://www.governor.ny.gov/news /governor-andrew-m-cuomo-signs-executive-order-and-commits-new-york-uphold-standards-set-forth.
126 Hilary Russ, “New York Lays Out $20 Billion Plan to Adapt to Climate Change,” Reuters (June 11, 2013), http://www.reuters.com/article/us-climate-newyork-plan/new-york-lays-out-20-billion-plan-to-adapt-to-climate-change-idUSBRE95A10120130611.
127 Nicholas Kusnetz, “NYC Creates Climate Change Roadmap for Builders: Plan for Rising Seas,” Inside Climate News (May 3, 2017), https://insideclimatenews.org/news/02052017/nyc-publishes-building-design-guidelines-adapting-climate-change.

BEYOND THE BELTWAY: A REVIEW OF STATE ENERGY AND CLIMATE POLICES
34
a significantly greater source of electric power. The state exports a great deal of electricity to the mid-Atlantic region. Renewables have been expanding significantly, but from a very low baseline.
Pennsylvania politics is complicated because the state is broken into three regions: the east, which aligns with neighbors New York and New Jersey; the west, which aligns with the Midwest; and the middle, which is strongly conservative. The governorship has flipped back and forth between parties recently. The state legislature is under firm GOP control, as it has been for twenty-five years apart from Democratic control of the House from 2006-2010.
Given the state’s political situation, it may not be surprising that Pennsylvania’s energy picture looks more like Virginia or the Carolinas than like New York or New Jersey. However, as with those Southern states, some degree of change does some to be underway. In 2004, the state adopted a renewable portfolio standard of 18% for 2020, but only 8% must come from solar, wind and similar sources. The solar target was very low, and it was further undercut because utilities preferred to buy solar credits from out-of-state companies. Recently passed legislation does begin to address the latter problem, but the state has a long way to go.
Delaware.
Delaware gets 85% of its power from natural gas. There is a bit of coal and a smidgen of solar and biomass use as well, but the state has a renewable portfolio standard of 25% by 2025.128 The big news is that the use of coal has dropped by a factor of ten in the past decade. The state imports a great deal of electricity, so its overall contribution to carbon emissions is harder to calculate.
In an unusual move for a state government, Delaware commissioned its own climate modeling effort to examine future impacts.129 The 2013 report used nine climate models to study a high-emissions scenario and a low-emissions one, downscaling the global results to Delaware. Among the results were projected average temperature increases of 1.5-2.5 degrees Fahrenheit by 2020-2039, 2.5-4.5 degrees by 2040-2059, and 3.5-9.5 degrees by 2080-2099.
When President Trump announced his intention to withdraw from the Paris Agreement, Governor John Carney announced that the state was joining the U.S. climate alliance. He highlighted climate impacts on Delaware:
“Delaware is the country’s lowest-lying state and with 381 miles of coastline, climate change is a very real threat to our future . . . . As sea levels rise, more than 17,000 Delaware homes, nearly 500 miles of roadway and thousands of acres of wildlife habitat including our critical wetlands are at risk of permanent inundation. Rising average
128 Delaware Department of Natural Resources and Environmental Control, “Renewable Energy Portfolio Standards,” http://dnrec.alpha.delaware.gov/energy-climate/renewable/portfolio-standards/.
129 Katharine Hayhoe et al., “Climate Change Projections and Indicators for Delaware,” ATMOS Research & Consulting (Dec. 2013), http://www.dnrec.delaware.gov/energy/Documents/Climate%20Change%202013-2014/ARC_Final_Climate_Report_Dec2013.pdf.
BEYOND THE BELTWAY: A REVIEW OF STATE ENERGY AND CLIMATE POLICES
35
temperatures and an increase in extreme weather events also pose health risks to Delawareans, and threaten our economy. The U.S. should lead in the global fight against climate change. Delaware is proud to join this coalition of states providing that necessary leadership.”130
Like many other coastal, blue states, Delaware’s politics and its long coastline are providing strong incentives to take climate change seriously.
VI. The Southeast
Maryland.
Maryland uses 40% nuclear and 38% coal. Renewables are 8%, with half of that from hydro, and the rest split evenly between solar, wind, and biomass. The state has a renewable portfolio standard requiring 25% by 2026. Apparently, the utilities have been satisfying renewable requirements through out-of-state purchases. The state also has a strong energy efficiency law, the EmPOWER Maryland program.131 The state had been under unified Democratic control since 2009, but in 2016 a Republican was elected governor for the first time in 50 years. In 2017, overriding a veto by the Governor Larry Hogan, the legislature accelerated the RPS requirement to 2020. According to the Baltimore Sun:
“Democrats argued that the requirement will boost the renewable energy industry, create high-paying jobs, reduce air pollution and combat climate change at a small cost to consumers.
“‘There's an economic argument, we've got an environmental argument, and then there are some health benefits as well,’ said Sen. Brian Feldman, a Montgomery County Democrat. ‘All three of these put together far, far exceed whatever possible small incremental residential rate impacts we have.’”132
Even under a Republican Governor, the government does not shy away from a candid discussion of climate change:
“Maryland is among the states most vulnerable to climate change. Rising sea levels, along with increased storm intensity, have devastating and far-reaching environmental and economic impacts on Chesapeake Bay and the quality of life Marylanders enjoy. Maryland’s sizable farming community could suffer costly losses during extreme droughts and heat waves. Marylanders everywhere will face increased
130 “Delaware Joins U.S. Climate Alliance to Uphold Goals of Paris Agreement,” State of Delaware News (June 5, 2017), https://news.delaware.gov/2017/06/05/delaware-joins-u-s-climate-alliance-to-uphold-goals-of-paris-agreement/.
131 Maryland Energy Administration, “EmPOWER Maryland,” http://energy.maryland.gov/pages/facts/empower.aspx.
132 Pamela Wood, “After veto override, renewable energy sourcing accelerates in Maryland,” Baltimore Sun (Feb. 2, 2017), http://www.baltimoresun.com/news/maryland/politics/bs-md-senate-renewable-veto-20170202-story.html.
BEYOND THE BELTWAY: A REVIEW OF STATE ENERGY AND CLIMATE POLICES
36
risk of flooding and significant property damage as a result of more precipitation and other extreme weather events. Children, the elderly, and other sensitive populations are vulnerable to the effects of heat waves and increased air pollution. For these reasons, addressing climate change must be among the state’s highest priorities.”133
Hogan declined, however, to join the U.S. Climate Alliance. A state legislator has announced an intention to introduce legislation in the 2018 session requiring the state to join the alliance, pointing out that “the county executives of Baltimore County and Prince George's County, the mayor of Baltimore, and several Maryland university presidents have committed to achieving the goals of the Paris accord.”134
Florida.
Florida is the paradigm of the ostrich with its head in the sand. It may be the state most vulnerable to climate change, yet the state government is assiduously ignoring the problem even though some cities and counties and South Florida are keenly aware of the risks. Even after Hurricane Irma, Governor Rick Scott still professed complete uncertainty on the subject: “Clearly our environment changes all the time, and whether that’s cycles we’re going through or whether that’s man-made, I wouldn’t be able to tell you which one it is.”135
Here is what we know about the risks, from the pre-Trump EPA:
“The Florida peninsula has warmed more than one degree (F) during the last century. The sea is rising about one inch every decade, and heavy rainstorms are becoming more severe. In the coming decades, rising temperatures are likely to increase storm damages, harm coral reefs, increase the frequency of unpleasantly hot days, and reduce the risk of freezing to Florida’s agriculture.
“Changing climate is also likely to increase inland flooding. Since 1958, the amount of precipitation during heavy rainstorms has increased by 27 percent in the Southeast, and the trend toward increasingly heavy rainstorms is likely to continue. More intense rainstorms can increase flooding because rivers overtop their banks more frequently, and more water accumulates in low-lying areas that drain slowly.”136
There is also the likely increase in hurricane intensity, due to warmer waters and higher evaporation rates.
133 Climate Change Maryland, “Science,” http://climatechange.maryland.gov/science/.
134 Dana M. Stein, “Md. Should Stand with Paris on Climate Accord,” The Baltimore Sun (Nov. 22, 2017), www.baltimoresun.com/news/opinion/oped/bs-ed-op-1123-climate-alliance-20171119-story.html.
135 Marc Caputo, “Florida Governor Remains Unsure About Climate Change After Hurricane Irma,” Politico (Sept. 13, 2017,) http://www.politico.com/states/florida/story/2017/09/14/florida-governor-remains-unsure-about-climate-change-after-hurricane-irma-114498.
136 U.S. Environmental Protection Agency, “What Climate Change Means for Florida” (Aug. 2016), https://www.epa.gov/sites/production/files/2016-08/documents/climate-change-fl.pdf.
BEYOND THE BELTWAY: A REVIEW OF STATE ENERGY AND CLIMATE POLICES
37
What is the state doing in response to these threats? Basically, nothing. Florida does not have a renewable portfolio standard or even voluntary targets. It does not provide any subsidies for renewables. About all that the state has done is to adopt a net metering policy and energy efficiency standards for new buildings. Not surprisingly, renewables are not a major part of the energy picture. According to the a consortium of state universities, “Florida was second only to Texas in 2014 in net electricity generation from natural gas, which accounted for 61% of Florida’s net generation; coal accounted for almost 23%, the state’s nuclear power plants accounted for 12%, and other resources, including renewable energy, supplied the remaining electricity generation.”137 If you do the math, that leaves renewables with a 4% share, minus whatever energy the state gets from miscellaneous sources like fuel oil.
As Professor Holly Doremus observes, real ostriches do not stick their heads in the sand to avoid danger. If any of them ever had that behavior, they were eliminated from the gene pool long ago. In reality, as she says, “ostriches are not that stupid.”138 But the state of Florida seems to think that the same strategy will work for it.
Georgia.
Georgia is a bit of a surprise. It is a leader in solar energy in a region that generally has not been very friendly to renewables. It currently ranks 9th nationally in total solar installations (and even more surprisingly, ranked 3rd in 2016 in newly added solar).139 What is also surprising is that Georgia has done this with only a voluntary renewable portfolio standard. Both houses of the state legislature have roughly 2-to-1 GOP margins. But despite the lack of a legislative mandate, Georgia Power’s integrated resource plan with the state public utility commission commits the utility to developing or acquiring 1600 MW of renewable energy, mostly through a competitive bid process. The company claims to have the most ambitious voluntary renewable portfolio in the country.
How did this come about? The military may have played a role in Georgia’s recent foray into solar energy: Georgia Power has signed an agreement with the Pentagon to supply 30 MW to each of five military bases, a $400 million project in total.
Still, the overall energy mix is not that great, at least not yet. According to the Energy Information Agency, “Georgia’s four existing nuclear reactor units accounted for 26% of the state’s net electricity generation in 2016, coal accounted for 28%, natural gas accounted for 40%, and renewable energy, including hydroelectric power, contributed more than 6%.” The 28% share of coal could go down even more, given that Georgia has two new nuclear reactors under construction, although those plants could be canceled due to massive cost overruns.140
137 Florida Energy Systems Consortium, “Florida Energy Facts,” http://floridaenergy.ufl.edu/florida-energy-facts/.
138 Holly Doremus, “The Ostrich Administration,” Legal Planet (Aug. 23, 2017), http://legal-planet.org/2017/08/23/the-ostrich-administration/.
139 Solar Energy Industries Association, “Georgia Solar,” https://www.seia.org/state-solar-policy/georgia-solar.
140 Steven Mufson, “Georgia Regulatory Staff Calls the Last U.S. Nuclear Construction Project Uneconomic,” Wash. Post (December 5, 2017), https://www.washingtonpost.com/business/economy/georgia-regulatory- staff-calls-
BEYOND THE BELTWAY: A REVIEW OF STATE ENERGY AND CLIMATE POLICES
38
According to the pre-Trump EPA, Georgia will begin to feel the effects of climate change in upcoming years:
“Like other southeastern states, Georgia has warmed less than most of the nation during the last century. But during the next few decades, the changing climate is likely to harm livestock, increase the number of unpleasantly hot days, and increase the risk of heat stroke and other heat-related illnesses.”141
In addition,
“Whether or not storms become more intense, coastal homes and infrastructure will flood more often as sea level rises, because storm surges will become higher as well. Rising sea level is likely to increase flood insurance rates, while more frequent storms could increase the deductible for wind damage in homeowner insurance policies. Parts of Savannah and Brunswick are vulnerable to coastal flooding, which is likely to become more severe as sea level rises.”
Of course, it would be unlikely for this highly conservative state government to make any actual plans to deal with these issues in the near future.
As in many states, city government is ahead of the state as a whole on energy issues. Atlanta’s city council adopted a resolution in May 2017 giving the city’s Office of Sustainability until the end of the year to “develop a plan for City of Atlanta operations to achieve 100% clean energy by 2025 and community-wide 100% clean energy by 2035.”142 The plan must include “interim milestones, budget estimates, equity metrics, estimated financial impacts, financing mechanisms, and the percentage of clean energy that shall be locally and distributively generated.” In addition, the city has a plan to create a modern streetcar system.
Atlanta’s Mayor, Kasim Reed, also denounced President Trump’s decision to withdraw from the Paris Agreement:
“The President has made a disappointing decision today to withdraw the United States from the Paris climate agreement, and by extension, global leadership. This decision isolates our country from international partners in shared, global efforts to curb climate change, and at its core is an assault on our future stability and prosperity.”143
Reed promised that the city would “intensify our efforts to reduce CO2 emissions, work to cool the planet by two degrees, ramp up clean energy solutions, and seek the-last-us-nuclear-construction-project-uneconomic/2017/12/05/84086788-d9d4-11e7-b1a8-62589434a581_story.html.
141 “What Climate Change Means for Georgia,” U.S. Environmental Protection Agency (August 2016), 19january2017snapshot.epa.gov/sites/production/files/2016-09/documents/climate-change-ga.pdf.
142 City of Atlanta Georgia, “Resolution to Adopt 100% Clean Energy,” http://atlantacityga.iqm2.com/Citizens/Detail_LegiFile.aspx?ID=12113&highlightTerms=3510.
143 Thomas Wheatley, “Kasim Reed Says Atlanta Will Honor the Paris Climate Agreement. What Will the City’s Next Leader Do?” Atlanta Magazine (June 2, 2017), http://www.atlantamagazine.com/news-culture-articles/kasim-reed-atlanta-honor-paris-climate-agreement-what-will-citys-next-leader-do/.
BEYOND THE BELTWAY: A REVIEW OF STATE ENERGY AND CLIMATE POLICES
39
every opportunity to assert our leadership on this urgent issue.” Hopefully, the state as a whole will move further in that direction.
North Carolina.
North Carolina has a modest renewable portfolio standard (10-12% by 2018 or 2021, depending on the utility).144 Right now, the state is at only about 7%, with the remainder split more or less equally between coal, gas and nuclear. It has old-fashioned utility regulation, with Duke Power as the main power supplier. Duke’s goal, of course, is to protect its monopoly position in its service area and the rates made possible by its cozy relationship with regulators.
Solar power has been a major bone of contention in North Carolina. For instance, Duke went to war against a company that installed five kilowatts of solar on the roof of an African American church. North Carolina law allowed installation of solar, but only if the panels were purchased rather than leased by the property owner. It was one of a handful states to ban third-party ownership. Companies that wanted to go entirely renewable, like Google, have also faced barriers. In Google’s case, the utility was able to work out a complicated arrangement whereby a solar farm sold energy to Duke under a long-term contract which Duke then contracted to resell to Google.
The big news in North Carolina was the passage of House Bill 589 in 2017. It is a complicated bill, reflecting over a year of negotiation in the North Carolina House and then further tweaks in the Senate. Overall, HB 589 seems to be a win for solar, providing Duke some concessions while moving the ball marginally forward for solar. The bill allows homeowners to lease panels under certain conditions and allows companies to expand solar use up to about 50% of total energy use, but may make it harder for intensive energy users like Google to fill their renewables needs and may allow Duke to pay less for energy it buys back from customers via net metering rule changes.
There is another feature of HB 589 worth mentioning. A last-minute Senate amendment put an 18-month moratorium on wind facilities. The senator who offered the bill said that he was concerned that the growth of wind facilities might make the military base-closing commission more likely to close bases in the state. This is a completely baffling claim.
On top of Duke’s resistance to renewable energy (especially distributed renewables), the state legislature is firmly in the hands of arch-conservatives. Since 2010, the Republican Party has had an iron grip on the legislature. It has used voting restrictions and gerrymandering to perpetuate itself (though the gerrymandering has been the subject of litigation). It has also strengthened its power at the expense of the governor, now a Democrat, and the state judiciary.
It is a little surprising, then, that the state has been willing to do anything at all to further renewable energy. Part of the reason seems to have been pressure from businesses like Google, big box stores, and other major companies. A 1978 federal law
144 Links providing support for the discussion of North Carolina can be found in Appendix D.

BEYOND THE BELTWAY: A REVIEW OF STATE ENERGY AND CLIMATE POLICES
40
called the Public Utility Regulatory Policies Act seems to have been instrumental in giving the renewable industry a toehold, which has begun to come up with some political power in the state. The 2018 election may shift the political balance further, which may give an impetus to more liberalization of rules for renewables.
South Carolina.
Solar energy is poised to make an appearance in South Carolina, in good part to the efforts of a single Republican state legislator.145 That will be a big change: the state has had essentially no wind or solar power, although nuclear accounts for half of its electricity.
The state senator, Chauncey (“Greg”) Gregory, runs a building supply company in Lancaster, an urban area of about 20,000, located inland by the North Carolina border. He was visiting a sister in Portland, Oregon, where he was struck by the amount of rooftop solar in a place best known for its overcast and clouds. He wondered: “Why couldn’t sunny South Carolina have solar power?”
He was the sponsor of Senate Bill 1189, which became law in the summer of 2014. It made South Carolina law far more open to solar power. For the first time, homeowners could lease solar systems rather than having to buy them outright. It also authorized utilities to build solar farms and include them in their rate base. It also introduced net metering to South Carolina. And it set the first renewable energy requirement for utilities, requiring them to have solar capacity equal to 2% of their average peak demand by 2021.
Solar energy was not going to get anywhere in South Carolina without Republican support. The GOP has about 60% of the seats in both houses of the legislature. Hillary Clinton got only 40% of the vote. So obviously, talking about climate change would have been counterproductive.
An important part of Gregory’s message was that South Carolina was behind its neighbors to the north and south, and it needed to catch up to attract investment. But a major factor in his success was due to something beyond his control: Duke Power switched positions to support the bill. He attributes this to shareholder pressure, but it would be really interesting to know more.
SB 1189 has given solar a much-needed boost in South Carolina. Investment went from $11 million in 2015 to $109 million in 2016. The state’s two major utilities both filed plans to add over 100 MW each in solar. Utility scale generation has also taken off, with $163 million in utility-scale projects announced just in 2017 for Orangeburg County.
South Carolina also gives households a 25% tax credit for solar installation. Gregory sponsored legislation to provide a property tax exemption for solar, but was only able to get it through the Senate, not the House. He says he will try again.
145 Links providing support for the discussion of South Carolina can be found in Appendix D.

BEYOND THE BELTWAY: A REVIEW OF STATE ENERGY AND CLIMATE POLICES
41
Virginia.
Virginia gets a third of its power from nuclear and almost 40% from natural gas. Coal is still a significant factor, at 20%, and the remaining 6% is from hydro and biomass. Use of coal has dropped 50% since 2007. The state has set a voluntary renewable portfolio standard of 15% by 2025.
Former Governor Terry McAuliffe ordered the state’s environmental agency in 2017 to come up with a plan to limit power plant emissions that “includes provisions to ensure that Virginia’s regulation is ‘trading-ready’ to allow for the use of market-based mechanisms and the trading of carbon dioxide allowances through a multi-state trading program.”146 Previous orders by governors have set renewables targets for state government, promoting energy efficiency, and establishing a grant program for funding clean energy. Roughly half a billion dollars have been invested in the state’s clean energy industry by the private sector.
Virginia has been actively engaging in climate adaptation planning since 2007, when then-Governor Tim Kaine appointed a commission to investigate adaptation needs. That commission reported back in 2008. Things came to a standstill under the next governor, but his successor appointed a follow-up commission in 2014, which issued a report the following year.147
Under newly elected Democratic Governor Ralph Northam, this increasingly blue state may be poised to become an energy and climate leader among the Southeastern states.
146 “Reducing Carbon Dioxide Emissions from Electric Power Facilities and Growing Virginia’s Clean Energy Economy,” Virginia Executive Department (May 16, 2017), https://governor.virginia.gov/media/9155/ed-11-reducing-carbon-dioxide-emissions-from-electric-power-facilities-and-growing-virginias-clean-energy-economy.pdf.
147 John Watkins and Jim Redick, “Recommendations to the Secure Commonwealth Panel on the Issue of Sea Level Rise and Recurrent Flooding in Coastal Virginia,” Recurrent Flooding Sub-Panel (September. 5, 2014), http://ccrm.vims.edu/SCPRecommendationsReport_Sept2014.pdf.
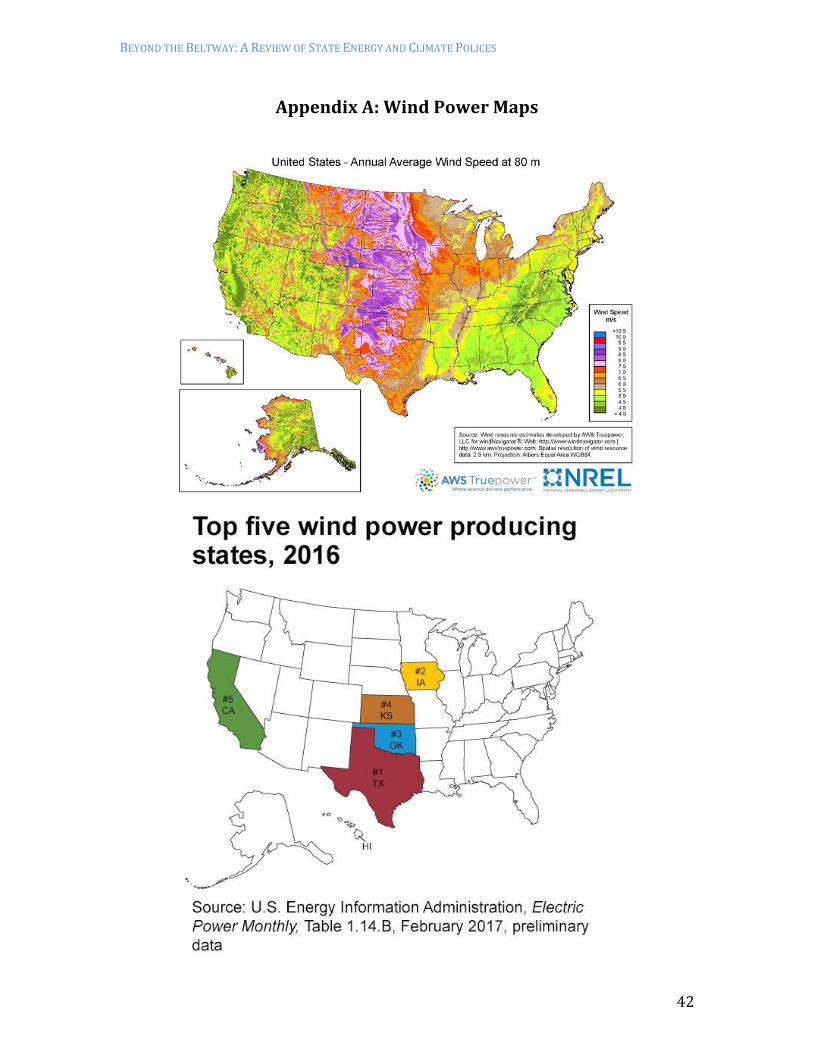
BEYOND THE BELTWAY: A REVIEW OF STATE ENERGY AND CLIMATE POLICES
42
Appendix A: Wind Power Maps

BEYOND THE BELTWAY: A REVIEW OF STATE ENERGY AND CLIMATE POLICES
43
Appendix B: Solar Energy Maps

BEYOND THE BELTWAY: A REVIEW OF STATE ENERGY AND CLIMATE POLICES
44
Appendix C: States with Renewable Portfolio Standards
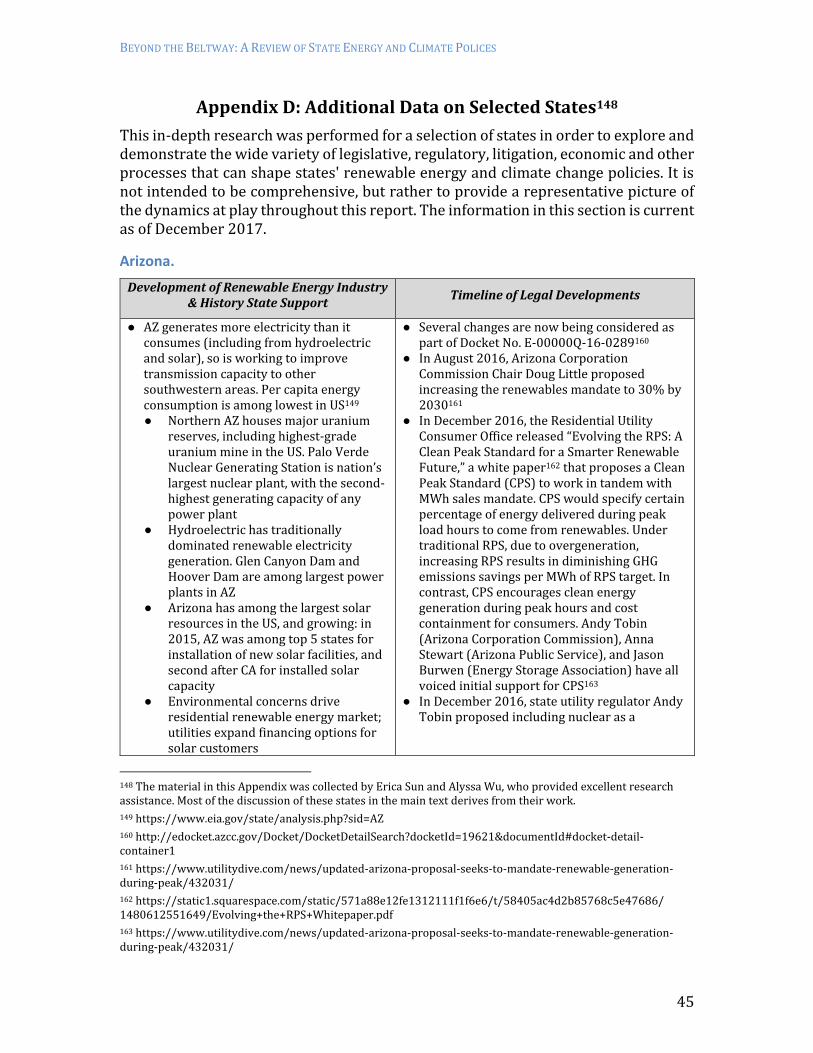
BEYOND THE BELTWAY: A REVIEW OF STATE ENERGY AND CLIMATE POLICES
45
Appendix D: Additional Data on Selected States148
This in-depth research was performed for a selection of states in order to explore and demonstrate the wide variety of legislative, regulatory, litigation, economic and other processes that can shape states' renewable energy and climate change policies. It is not intended to be comprehensive, but rather to provide a representative picture of the dynamics at play throughout this report. The information in this section is current as of December 2017.
Arizona.
Development of Renewable Energy Industry & History State Support
Timeline of Legal Developments
● AZ generates more electricity than it consumes (including from hydroelectric and solar), so is working to improve transmission capacity to other southwestern areas. Per capita energy consumption is among lowest in US149
● Northern AZ houses major uranium reserves, including highest-grade uranium mine in the US. Palo Verde Nuclear Generating Station is nation’s largest nuclear plant, with the second-highest generating capacity of any power plant
● Hydroelectric has traditionally dominated renewable electricity generation. Glen Canyon Dam and Hoover Dam are among largest power plants in AZ
● Arizona has among the largest solar resources in the US, and growing: in 2015, AZ was among top 5 states for installation of new solar facilities, and second after CA for installed solar capacity
● Environmental concerns drive residential renewable energy market; utilities expand financing options for solar customers
● Several changes are now being considered as part of Docket No. E-00000Q-16-0289160
● In August 2016, Arizona Corporation Commission Chair Doug Little proposed increasing the renewables mandate to 30% by 2030161
● In December 2016, the Residential Utility Consumer Office released “Evolving the RPS: A Clean Peak Standard for a Smarter Renewable Future,” a white paper162 that proposes a Clean Peak Standard (CPS) to work in tandem with MWh sales mandate. CPS would specify certain percentage of energy delivered during peak load hours to come from renewables. Under traditional RPS, due to overgeneration, increasing RPS results in diminishing GHG emissions savings per MWh of RPS target. In contrast, CPS encourages clean energy generation during peak hours and cost containment for consumers. Andy Tobin (Arizona Corporation Commission), Anna Stewart (Arizona Public Service), and Jason Burwen (Energy Storage Association) have all voiced initial support for CPS163
● In December 2016, state utility regulator Andy Tobin proposed including nuclear as a
148 The material in this Appendix was collected by Erica Sun and Alyssa Wu, who provided excellent research assistance. Most of the discussion of these states in the main text derives from their work.
149 https://www.eia.gov/state/analysis.php?sid=AZ
160 http://edocket.azcc.gov/Docket/DocketDetailSearch?docketId=19621&documentId#docket-detail-container1
161 https://www.utilitydive.com/news/updated-arizona-proposal-seeks-to-mandate-renewable-generation- during-peak/432031/
162 https://static1.squarespace.com/static/571a88e12fe1312111f1f6e6/t/58405ac4d2b85768c5e47686/ 1480612551649/Evolving+the+RPS+Whitepaper.pdf
163 https://www.utilitydive.com/news/updated-arizona-proposal-seeks-to-mandate-renewable-generation- during-peak/432031/
BEYOND THE BELTWAY: A REVIEW OF STATE ENERGY AND CLIMATE POLICES
46
● Potential for wind (0.5% of net generation in 2015) and geothermal (but no utility-scale plants yet)
● The Arizona Corporation Commission originally implemented a solar portfolio standard in 1996: 0.2% from solar energy by 1999 and 1% by 2003
● In 2002, the new Environmental Portfolio Standard (EPS) required 0.4% from renewables in 2002 and 1.1% in 2007
● In 2004, the review process began for the Renewable Energy Standard & Tariff (REST)150151, which was approved in November 2006 and required 25% of megawatts sold by to come from renewable sources by 2025. “Renewable Energy Resource” defined as: an energy resource that is replaced rapidly by a natural, ongoing process and that is not nuclear or fossil fuel.152 REST also stipulated several incentives153, including: ● Non-Residential Solar Tax Credit
Program154, Administered by Arizona Commerce Authority, established under A.R.S. § 41-1510.01155 for commercial and industrial entities in June 2006; expanded to all non-residential entities in May 2007. It credits 10% of installed cost of solar installations in non-residential facilities, including solar space heat, water heat, thermal electric, photovoltaics, pool heating, and daylighting, and all wind
● Residential Solar Energy Credit156, started in 1995. It credits 25% of cost of new solar devices, up to $1000 per residence, including solar heating, cooling, electrical power, mechanical power, and daylighting, and wind generators
renewable energy source164. AZ already gets enough nuclear power that this rule change would effectively nullify the current standards for other sources. Huber notes that if nuclear is included, the standard will need to be set higher
150 http://programs.dsireusa.org/system/program/detail/268
151 http://www.azcc.gov/divisions/utilities/electric/Res%20Final%20rulemaking%2010-06.doc
152 http://www.azcc.gov/divisions/utilities/electric/res.pdf
153 https://energy.gov/eere/femp/energy-incentive-programs-arizona
154 http://programs.dsireusa.org/system/program/detail/1682
155 https://www.azleg.gov/viewdocument/?docName=http://www.azleg.gov/ars/41/01510-01.htm
156 https://www.azdor.gov/Portals/0/Brochure/543.pdf
164 https://www.azcentral.com/story/money/business/energy/2016/12/12/arizona-regulator-proposes-adding- nuclear-power-renewable-energy-rules/95343412/

BEYOND THE BELTWAY: A REVIEW OF STATE ENERGY AND CLIMATE POLICES
47
● Corporate Renewable Energy Production Tax Credit (SB1254)157, which pays $0.01/kWh from wind and biomass, paid for 10 years, and $0.04-0.01/kWh (decreasing pay schedule) from solar, paid for 10 years
● Renewable Energy Business Tax Incentives (SB1403)158159, which started 1/1/2010, and will be repealed by HB 2528 beginning 1/1/2018. It credits up to 10% of new investment for companies in renewable energy industries expanding or locating in AZ, in order to incentivize renewable energy production and job creation in renewable energy industries. To be eligible, businesses must: Pay at least 51% of the net new full-time employment positions 125% or more of the state’s annual median wage AND pay at least 80% of the employee’s health insurance costs for all net new full-time employment positions at the facility
Georgia.
Development of Renewable Energy Industry & History State Support
Timeline of Legal Developments
● GA, according to the Solar Energy Industries Association, is the 8th leading state in the USA for cumulative solar capacity installations through 2016.165
● Unlike states such as PA, it does not appear that GA has a mandate that a certain percentage of its electricity needs to be derived from solar.166 One reason why utility-scale solar has developed in GA may be because Georgia Power, GA’s largest utility, made a deal with the U.S. Department of
● [PENDING DECISION] – President Trump has to decide by January 13, 2018, if tariffs should be imposed on solar panel imports in a case involving two U.S. solar panel manufacturers, Suniva (based in Georgia) and Solar World.173
● In April 2017, the two manufacturers asked the U.S. International Trade Commission (“ITC”) for import relief under the
157 http://programs.dsireusa.org/system/program/detail/4159
158 http://programs.dsireusa.org/system/program/detail/3570
159 http://www.azcommerce.com/incentives/renewable-energy-tax-incentive
165 http://www.macon.com/news/local/news-columns-blogs/political-notebook/article183517196.html; https://www.seia.org/state-solar-policy/georgia-solar
166 http://www.climatecentral.org/news/north-carolina-georgia-new-solar-farms-19858; https://www.greenbiz.com/blog/2013/07/24/georgia-next-frontier-solar-development-0
173 https://www.wabe.org/one-few-bright-spots-rural-ga-s-economy-risk-solar/; https://www.utilitydive.com/news/60-day-clock-starts-for-trump-to-decide-on-solar-panel-tariffs/510851/; https://www.utilitydive.com/news/itc-proposes-3-solar-trade-case-remedies-with-tariffs-quotas-and-capped-im/508596/

BEYOND THE BELTWAY: A REVIEW OF STATE ENERGY AND CLIMATE POLICES
48
Defense to place 13 solar farm installations on GA military bases to reach a total of 607 megawatts by the end of 2016.167
● In 1978, GA introduced the Solar Easements Act, which is a state incentive that permits citizens to guarantee, in writing, direct access to sunlight.168
● In 2017, Central Georgia EMC, a utility, enacted changes to its policies and removed a tariff in order to decrease costs for consumers who utilize solar energy. The new policy included doing away with a $7/kilowatt cost on installing solar.169
● In 2017, Mercedes-Benz Stadium, a building with +4,000 solar panel installations from Georgia Power, commenced operations. Georgia Power started work on this solar project in 2014 and the project had the approval of the Georgia Public Service Commission (“PSC”). The stadium seeks to utilize the Renewable Energy Credits (“REC”) from the solar installations to obtain LEED Platinum certification while the energy produced from the installations will be given to Georgia Power consumers. 170
● Georgia Power has one of the biggest voluntary renewable portfolios in GA, having a solar capacity of around 900 megawatts. Other components of Georgia Powers’ renewable development plan are customer programs, such as the Advanced Solar Initiative and Renewable Energy Development Initiative (“REDI”), which seeks to introduce increased renewable energy in GA.171
● In 2017, Georgia Power also introduced Community Solar, a program that will launch in 2018, in which customers can support
1974 Trade Act for foreign crystalline silicon photovoltaic (“CSPV”) modules.
● The ITC came up with three recommendations, “rang[ing] from a licensing fee to as much as a 35% tariff on CSPV modules.”174
● According to a representative from GTM Research, an advisory firm on the global electricity industry, the impact of increased solar panel prices would greatly affect GA given that (1) solar farms in GA are large-scale and (2) GA does not have a mandate that a certain percentage of its electricity needs to be derived from renewable energy sources.175
● [PASSED BILL] – In 2017, current Governor John Nathan Deal (R) approved House Bill 238, which was signed into law as Act 16. This Act involves the ad valorem taxation of property, essentially “to provide an exception to a breach of the covenants for the use of the property for solar power generation.” Essentially, this Act exempts individuals who install solar panels on protected land from paying a fee for breaking a covenant.176
● [PENDING BILL] – In 2017, House Bill 431 was introduced in GA. The bill aims to provide for greater transparency in solar utility fees, in which smaller utilities, like electric membership corporations (“EMCs”) would need to “advertise, invite
167 http://www.climatecentral.org/news/north-carolina-georgia-new-solar-farms-19858
168 http://coastalsolar.com/georgia-state-senator-touts-tax-incentives-solar-energy/
169 http://www.macon.com/news/local/news-columns-blogs/political-notebook/article183517196.html
170 https://www.prnewswire.com/news-releases/4000-georgia-power-solar-panels-in-place-at-new-mercedes-benz-stadium-300538042.html
171 https://www.prnewswire.com/news-releases/4000-georgia-power-solar-panels-in-place-at-new-mercedes-benz-stadium-300538042.html; https://georgiapower.com/about-energy/energy-sources/solar/redi.cshtml; https://www.prnewswire.com/news-releases/georgia-power-introduces-renewable-energy-program-for-commercial-and-industrial-customers-300522165.html
174 https://www.utilitydive.com/news/itc-proposes-3-solar-trade-case-remedies-with-tariffs-quotas-and-capped-im/508596/
175 https://www.greentechmedia.com/research; https://www.wabe.org/one-few-bright-spots-rural-ga-s-economy-risk-solar/
176 http://www.legis.ga.gov/legislation/en-US/Display/20172018/HB/238; http://www.macon.com/news/local/article137812858.html; www.legis.ga.gov/Legislation/20172018/169648.pdf

BEYOND THE BELTWAY: A REVIEW OF STATE ENERGY AND CLIMATE POLICES
49
solar, particularly those who cannot have a photovoltaic (“PV”) system at their place of residence. The program, which costs $24.99/1 kW to join, allows customers to have a monthly credit that can be applied to their electricity usage during that month. 172
public comment and justify any solar fees.”177
● NOTE: GA’s Public Service Commission (“PSC”) does not regulate the rates of EMC’s. Unlike EMCs, Georgia Power’s fees are governed by the GA Public Service Commission.
● This bill has been criticized by EMCs, who argue that (1) meetings are accessible to members and (2) this bill goes against a 2015 negotiation of electric regulation.
● [PASSED BILL] – In 2015, current Governor John Nathan Deal (R) approved House Bill 57 (known as the Solar Power Free Market Financing Act), which was signed into law as Act 300. Act 300, which details how homeowners can obtain outside financing for installations of solar, includes the following provisions:178
● Permits third party ownership (“TPO”) of solar, which allows homeowners and business owners to generate solar without steep costs for the solar panels by permitting these owners to enter into power purchasing agreements with solar utilities or companies to own and finance the solar systems. [In short, this is a financing program in which the solar panels will initially be financed to homeowners and then ownership will later be transferred to the homeowner from the solar utility or company].
● Caps TPO financing to no more than 10 kilowatts for residential solar systems and no more than 125% of the solar system’s host’s generation of
172 https://www.prnewswire.com/news-releases/georgia-power-introduces-new-community-solar-program-300539892.html; https://solarindustrymag.com/georgia-power-announces-new-community-solar-program
177 http://www.legis.ga.gov/legislation/en-US/Display/20172018/HB/431; www.legis.ga.gov/Legislation/20172018/165831.pdf; http://www.macon.com/news/local/article137812858.html; https://pv-magazine-usa.com/2017/03/13/stage-set-for-solar-battle-royal-in-georgia/
178 http://www.theus50.com/georgia/governors.php; http://www.legis.ga.gov/legislation/en-US/Display/20152016/HB/57; http://www.ajc.com/news/state--regional-govt--politics/georgia-house-passes-solar-energy-legislation-sends-senate/e9oZAWtDh1xR7AfFEcgW0N/; https://www.utilitydive.com/news/georgia-gov-deal-signs-solar-third-party-ownership-bill-into-law/397173/; http://www.ajc.com/news/state--regional-govt--politics/georgia-solar-bill-headed-governor/wrNNB96s6iwBtEs7sBNorL/; www.legis.ga.gov/Legislation/20152016/153399.pdf; https://www.pri.org/stories/2015-04-03/georgia-legislature-passes-solar-friendly-legislation; https://cleantechnica.com/2015/04/01/georgia-legislature-passes-landmark-solar-bill/

BEYOND THE BELTWAY: A REVIEW OF STATE ENERGY AND CLIMATE POLICES
50
solar for commercial industrial systems.
● [CITY LEVEL] – In 2017, the mayor of Atlanta announced the city of Atlanta’s commitment to clean energy in response to President Trump’s declaration in October 2017 to repeal former President Obama’s Clean Power Plan. Specifically, the mayor stated that Atlanta has undertaken 2 measures to make Atlanta more sustainable:179
● Better Buildings Challenge – this program was created by the U.S. Department of Energy in 2011 and its goal is to increase energy efficiency. For instance, Atlanta property developers who participate in the program make a commitment to decrease by 20% their water and energy use in buildings by 2020.
● New city legislation [PASSED] – this legislation mandates that renewable energy will be used to meet all municipal buildings and city electricity demands by 2025 and 2035, respectively.
Nevada.
Development of Renewable Energy Industry & History State Support
Timeline of Legal Developments
● Nevada's per capita energy consumption is below the national average, and per capita electricity consumption is near national average. Most energy comes from out of state.
● Utility-scale geothermal resources account for almost half of renewable power generation. Nevada has the second-highest geothermal production in US (after CA) and the greatest untapped geothermal resources in US. This energy can be
● Energy Choice Initiative (constitutional amendment)185 shifts from regulated monopoly to competitive energy market. It was approved by 72% of voters in 2016, will reappear on 2018 General Election Ballot, and will take effect by 7/1/2023186. An executive order created the Committee on Energy Choice in anticipation of second passage of ECI (April 2017)187
179 http://georgiastatesignal.com/mayor-reed-responds-trump-pledging-100-percent-renewable-energy-atlanta/
185 https://thenevadaindependent.com/article/what-nevada-can-learn-from-its-attempt-and-failure-to- deregulate-its-energy-market-in-the-1990s
186 http://energy.nv.gov/uploadedFiles/energynvgov/content/Programs/TaskForces/2017/Agenda%20Item% 206%20-%20Ballot%20Initiative(2).pdf
187 http://gov.nv.gov/News-and-Media/Press/2017/Governor-Sandoval-Announces-Committee-on-Energy- Choice-Membership/

BEYOND THE BELTWAY: A REVIEW OF STATE ENERGY AND CLIMATE POLICES
51
dispatched at any time, complementing solar180
● The primary hydroelectric plant is the Hoover Dam
● A rapidly increasing share of renewable energy comes from solar thermal and PV. NV has the greatest solar potential in US, was one of the top 5 states for installed solar electric capacity in 2015, and doubled its solar PV electricity generation 2014-2015.
● Nevada also has wind power potential along mountain ridges. However, there is only one utility-scale commercial wind farm (opened in 2012), with no new projects currently under construction
● There is some biomass potential from forests along mountain ridges. NV's installed capacity comprises 4008 MW from 66 approved renewable energy projects181 and 3049 MW from 21 new/proposed projects182
● Nevada's Renewable Portfolio Standard183 was first passed in 2001, when it required 15% by 2013. ● AB3 (2005) mandated that efficiency
measures eligible for up to 25% of standard, and utilities must reduce energy demand (rather than shifting to off-peak hours)
● SB252 (2013) instated new, lower caps on the percentage of the standard that could be met with energy efficiency measures
● SB358 (2009—most recent standard) requires 25% renewables by 2025, of which 6% of must come from solar in 2016-2025. Renewables include biomass, geothermal, solar, waterpower, and wind; exclude coal,
● [FAILED BILL]—AB206 (vetoed June 2017)188189, would have increased renewables generation to 40% by 2030 and 80% by 2040. Sandoval will consider higher standard in his executive order creating the Committee on Energy Choice: “Although the promise of AB206 is commendable, its adoption is premature in the face of evolving energy policy in Nevada. AB206 usurps the role of the (Public Utilities Commission of Nevada) and specifically prohibits it from considering the ‘uncertainty’ of energy choice.”
● [FAILED BILL]—SB392 (vetoed June 2017)190 would have allowed neighborhoods to establish community solar systems and gain utility credits. It was supported by 70% of state population, but according to Sandoval, potentially conflicts with AB405: “SB392 attempts to link itself to AB405 by requiring the solar energy credits to be the same for both rooftop solar and community solar gardens. Although I am confident that the system set up by AB405 will be beneficial to Nevada and its solar energy economy, it is unclear whether these bills are compatible or conflicting.”
● [PASSED BILL]—AB405 (signed June 2017)191 was approved 38-2 by the Assembly (May 2017), 21-0 by Senate (June 2017) and reinstates net metering for rooftop solar customers. New solar customers will be reimbursed for excess generation up to 95% of retail electricity rate. Consumers are guaranteed right to self-generate and store electricity, and excess energy sent to grid cannot be curtailed. The policy was previously eliminated in December 2015, followed by a 32% decline in solar jobs.
● Other bills192 signed June 2017 include: ● SB65: requires utilities to meet with PUC
and Bureau of Consumer Protection staff
180 http://www.thinkgeoenergy.com/ceo-of-nv-energy-highlights-great-role-of-geothermal-for-state-of- nevada/
181 http://puc.nv.gov/Renewable_Energy/ApprovedREFacilities/
182 http://puc.nv.gov/Utilities/Electric/Generation/
183 http://programs.dsireusa.org/system/program/detail/373
188 https://www.pv-tech.org/news/nevada-passes-bill-to-increase-state-rps-to-80-by-2040
189 https://lasvegassun.com/news/2017/jun/16/sandoval-veto-community-solar-higher-clean-energy/
190 Ibid.
191 https://www.greentechmedia.com/articles/read/nevadas-new-solar-law-is-about-much-more-than-net- metering
192 https://thenevadaindependent.com/article/despite-major-vetoes-lawmakers-advanced-pro-renewable- energy-agenda

BEYOND THE BELTWAY: A REVIEW OF STATE ENERGY AND CLIMATE POLICES
52
natural gas, oil, propane and other fossil fuels, and nuclear
● SB123 (2013) requires NV Energy to retire 800 MW of coal-fired electric generating plants by 2019184 and purchase, construct, or acquire 900 MW from cleaner facilities, including 350 MW from renewable generators
at least four months before filing an Integrated Resource Plan (IRP), and requires the PUC to give preference to IRPs with the greatest economic and environmental benefits
● SB146: requires electric utilities to include a distributed resources plan — benefits and costs of distributed energy resources, such as storage or rooftop solar — when filing regular future planning with energy regulators
● Energy Choice (AB452): requires the Legislative Commission on Energy to conduct a study on the effects of an energy deregulation ballot initiative up again for a vote in 2018, working alongside Committee on Energy Choice
● SB145: combines several pots of renewable energy incentive money into a single source, and creates new programs for qualified energy storage and electric vehicle projects and programs, while providing a yearly $1 million incentive fund for solar energy systems benefiting low-income customers
● SB407: creates the “Nevada Clean Energy Fund” designed to assist in funding qualified clean energy projects in the state
● SB204: requires the PUC to investigate the cost-effectiveness of energy storage, and potentially set non-binding targets for utility adoption
● SB150: requires PUC to set annual energy saving goals for utilities and require them to come up with energy efficiency plans that allocate at least 5 percent on funds to low-income customers
● AB5: authorizes local governments to create a local improvement district within its boundaries that would include a renewable energy or energy efficiency project on commercial or industrial land
● SB314: removes height restrictions on windmill installation, and instead allows local governments to stop construction if the turbine’s size or location prevents a danger to the public or if it’s not compatible with the “character” of the area
184 https://www.reuters.com/article/utilities-nvenergy-coal/nv-energy-proposes-to-shut-nevada-coal-fired- power-plants-idUSL2N0CR1LO20130404

BEYOND THE BELTWAY: A REVIEW OF STATE ENERGY AND CLIMATE POLICES
53
New Mexico.
Development of Renewable Energy Industry & History State Support
Timeline of Legal Developments
● New Mexico's per capita energy consumption is above national average, but residential per capita energy consumption is among lowest in US.
● NM has no nuclear plants, but the second-largest uranium reserves in US.
● There is currently more than 1100 MW of installed wind capacity. 6% of electricity generation in 2015 came from over 700 turbines.
● NM has among largest solar potential in US and is increasing both utility-scale and distributed solar generation. In 2015, NM had 406 MW of installed solar capacity (13th in US) and was among top 10 states for solar electric capacity per capita.
● Geothermal power is used for greenhouse agriculture, space heating, district heating, and pool heating. The first utility-scale geothermal power plant began operating in 2013, with capacity up to 4 MW; a planned expansion will add 6 MW capacity
● There are small amounts of utility-scale hydropower and biomass generation
● Utilities in NM are developing transmission projects to sell electricity to other markets in Southwest
● Renewable Portfolio Standard (SB43) was passed in 2004. It requires 20% by 2020 for investor-owned utilities, of which 30% must come from wind, 20% from solar, 5% from other renewable energy technologies, and 1.5% from distributed generation renewable energy technologies in 2011-2014 and 3% in 2015 and beyond. For rural electric cooperatives, the requirement is 10% by 2020. “Renewable energy” is defined as electric energy generated by low- or zero-emissions
● The Efficient Use of Energy Act passed in 2005.193 To meet this requirement, NM adopted the Integrated Resource Plans for Electric Utilities (“IRP Rule”) in 2007, which requires investor-owned electric and natural gas utilities to engage in a resource planning process that evaluates all feasible energy resources. In 2017, the Public Regulation Commission (NMPRC) voted unanimously to amend IRP Rule to include energy storage as a resource for utility planning. The amendment takes into account increasing renewables penetration and aims to meet sudden changes in demand.194
● [PASSED BILL]—HB199 (signed Feb. 2017) 195was approved 56-6 by House (Jan. 2017) and 31-5 by Senate (Feb. 2017) and requires solar energy companies to provide more information to potential customers about costs and savings of residential solar systems
● [FAILED BILL]—SB227 (vetoed April 2017)196 was approved 36-4 by Senate (Feb. 2017) and 44-19 by House (March 2017). It would have required state government to solicit proposals for powering 700 state facilities with renewable energy, provided the proposals reduce net costs and have no upfront costs. According to Martinez: “It would be impractical and irresponsible to begin issuing requests for proposals before a plan for these renewable energy services is completed. Additionally, this process would require additional staff for the General Services Department to effectively establish a plan to provide renewable energy improvements to nearly 750 facilities statewide. This bill does not provide the resources necessary for the successful development and implementation of such a plan.”197
193 http://www.nmprc.state.nm.us/rssfeedfiles/pressreleases/2017-8-8CommissionUnanimouslyApproves AmendingRuleToIncludeEnergyStorage.pdf
194 https://www.utilitydive.com/news/energy-storage-gets-a-bigger-seat-at-the-utility-planning-table/510216/
195 https://legiscan.com/NM/text/HB199/2017
196 https://legiscan.com/NM/research/SB227/2017
197 http://www.santafenewmexican.com/news/legislature/gov-shoots-down-renewable-energy-measures- other-bills/article_ca49e638-83a2-54dc-9f6a-bc74c1218a58.html

BEYOND THE BELTWAY: A REVIEW OF STATE ENERGY AND CLIMATE POLICES
54
generation technology with substantial long-term production potential, including solar, wind, geothermal, hydropower, fuel cells, and biomass. It does not include fossil fuels or nuclear.
● [FAILED BILL]—HB440 & SB432 (introduced January 2017)198 were identical bills to extend eligibility for renewable energy tax credits (currently set to expire in 2018) to 2023 and raise current caps on solar and wind energy production eligibility for tax credits. This was intended to leverage NM’s large solar and wind potential to provide low-cost electricity: 7 wind facilities and 37 solar facilities are currently on the waiting list for tax credits, but most of the planned production relies on tax credits to be realized199. Supporters also hoped it would imulate renewables industry and generate an additional 7,000 jobs and $1 billion
● [FAILED BILL]—SB312 (introduced Jan. 2017)200 would have expanded RPS to 80% for IOUs and 70% for rural co-ops by 2040. It fell short of full Senate vote in March 2017201, but advocates continue to press for stronger RPS202
North Carolina.
Development of Renewable Energy Industry & History State Support
Timeline of Legal Developments
● Solar energy growth in NC “driven largely by generous state policies for enforcing the federal Public Utility Regulatory Policy Act.”203
● In 2014, Strata Solar, a solar farm based in Chapel Hill, made around a $1B investment in solar energy in NC by installing 60+ solar farms in 40 rural counties in NC.204
● NC was originally one of four states (FL, KY, OK) that banned the sale of third-party solar sales.206
● [PASSED BILL] – In 2007, NC legislators passed Senate Bill 3, otherwise known as the Renewable Energy Portfolio Standard, which mandated that electric utilities sell power from renewables like solar energy.207 This
198 http://www.santafenewmexican.com/news/legislature/as-lawmakers-mull-renewable-energy-tax-credits- study-touts-economic/article_613739be-cfdc-5cac-b257-8d89f44d1606.html
199 http://familybusinessesforaffordableenergy.org/wp-content/uploads/2017/03/EconImpactStudy-022817-1.pdf
200 https://blog.ucsusa.org/jeff-deyette/will-new-mexico-next-generation-clean-energy-leaders
201 https://www.cvnm.org/press-releases/proposal-to-create-jobs-in-new-mexicos-growing-renewable-energy- sector-dies-one-stop-away-from-a-full-senate-vote/
202 http://www.daily-times.com/story/money/industries/oil-gas/2017/11/26/new-mexicos-renewable-energy- standard-up-debate/872218001/
203 https://www.bizjournals.com/charlotte/news/2017/04/12/georgia-south-carolina-solar-nc-policy.html
204 https://www.bizjournals.com/triangle/news/2015/02/20/nc-ranks-no-1-in-south-for-solar-energy-capacity.html
206 http://thefreethoughtproject.com/state-fines-shuts-rooftop-solar-energy-initiative-behalf-corporate-energy-giant/; http://www.ncwarn.org/solarfreedom/; https://www.greentechmedia.com/articles/read/regulators-reject-third-party-ownership-petition-in-north-carolina#gs.y9O8vLw
207 http://www.newsobserver.com/news/business/article154689159.html

BEYOND THE BELTWAY: A REVIEW OF STATE ENERGY AND CLIMATE POLICES
55
● On July 27, 2017, Governor Cooper signed House Bill 589 (see next column for more details). This bill reformed how the state interprets PURPA. According to a rep. from Strata Solar, this reform shifts solar energy in NC to a competitive bidding market, which increases certainty in the market. PURPA was created in 1978 to advance producers of small power in regulated utility markets. Duke Energy and the rest of the solar industry were engaged in a standoff regarding PURPA because while “two-thirds of [solar energy] is in [Duke]’s service area – most of it because of the state’s PURPA rules [,]” there had been a “gold rush” of out-of-state solar companies that Duke alleges overcharged customers. The bill ends this deadlock by moving almost all but the smallest renewable energy projects from PURPA’s control “into an independently-administered bidding process that gives Duke more say over where solar is built and at what price.” In addition, the bill gives solar companies “a robust market, up to 2,660 MW through the middle of 2021.”205
renewable-portfolio standard (“RPS”) developed avenues for investment tax credits and solar developers.208
● [FAILED BILL] – In 2015, NC legislators attempted to pass House Bill 245, “The Energy Freedom Act.”209 This bill had similarities to a bill that passed in GA, namely that a utility giant would have to give affordable and reliable electricity to people in exchange for its market monopoly. The utility giant could also recoup costs by changing rates for customers for making infrastructure construction. This bill would also have permitted third-party sales of renewable energy in the following situations210: ● If the amount of energy was > 125% of
the avg. annual electricity consumption by the customer and
● before construction, the Utilities Commission is notified by the third-party owner.
● [PASSED BILL] – On July 27, 2017, Governor Cooper signed House Bill 589, titled “Competitive Energy Solutions for NC,” a clean-energy bill aimed at boosting the solar energy industry but also created a moratorium on wind energy (the moratorium was a last-minute amendment). The bill “is the first comprehensive overhaul of North Carolina’s energy laws since 2007, when the legislature passed Senate Bill 3.”211 The bill includes the following provisions212:
● Allows residents to install rooftop solar panels through leasing from third-party solar installers rather than having to own them. Doing so would do away with a down payment ($10K-$20K) for
205 http://southeastenergynews.com/2017/06/12/north-carolina-bill-promises-short-term-jolt-to-solar-but-critics-worry-about-long-term/; https://www.bizjournals.com/charlotte/news/2017/04/25/viewpoint-solar-policies-need-to-change-to-benefit.html
208 http://www.charlotteobserver.com/latest-news/article10426937.html
209 http://www.ncpolicywatch.com/2017/03/09/duke-energy-nc-warn-power-struggle-right-sell-solar-energy/
210 http://www.ncpolicywatch.com/2017/03/09/duke-energy-nc-warn-power-struggle-right-sell-solar-energy/
211 http://www.newsobserver.com/news/business/article154689159.html
212 http://www.newsobserver.com/news/business/article154689159.html; http://southeastenergynews.com/2017/07/17/energy-bill-could-see-north-carolina-join-national-fight-over-net-metering/; https://www.solarpowerworldonline.com/2017/07/north-carolina-hb589/; https://www.bloomberg.com/news/articles/2017-07-28/north-carolina-bill-spurring-new-solar-halts-wind-for-18-months; http://www.utilitydive.com/news/north-carolina-passes-solar-reform-bill-with-18-month-wind-moratorium/446253/; http://www.newsobserver.com/news/business/article154689159.html; http://southeastenergynews.com/2017/06/22/north-carolina-solar-bill-may-help-breweries-go-solar-but-not-google/

BEYOND THE BELTWAY: A REVIEW OF STATE ENERGY AND CLIMATE POLICES
56
residents → less prohibitive financially. Permits a maximum of 250 megawatts of third-party leasing of solar panels.
● Leasing of solar panels from solar developers to businesses or homeowners for a monthly charge is permitted, provided the charge is not directly related to the amount of electricity coming from the solar panels. In obtaining electricity from these panels, the business owner or homeowner will have a reduced power bill from Duke Energy. Duke benefits from this bill because in exchange for compromising on leases, it can pay less for power it buys from industrial-scale solar farms as opposed to paying the standard wholesale rate created by the N.C. Utilities Commission (“could save [Duke] as much as $850 million over 10 years in payments to solar farms”). ● A Duke Energy spokesman
stated that Duke Energy supports this bill because the proposal is a financing arrangement, not a direct electricity sale from a third party to a Duke Energy customer. This type of leasing arrangement has been available to Duke Energy customers in South Carolina beginning from 2015.
● Contains a net metering clause (net metering = “system by which solar owners are compensated for excess electricity they send to the grid, typically at the retail rate”213), in which Duke Energy has to propose new net metering rates to be approved by the N.C. Utilities Commission. (Duke Energy had originally stated in 2014 that it would propose lowered net metering rates but never actually filed a formal proposal with regulators).
● NC currently permits solar projects of one megawatt or less to be
213 http://southeastenergynews.com/2017/07/17/energy-bill-could-see-north-carolina-join-national-fight-over-net-metering/

BEYOND THE BELTWAY: A REVIEW OF STATE ENERGY AND CLIMATE POLICES
57
connected to the grid through net metering.
● Decreases the amount of money Duke Energy has to provide industrial solar farms to obtain electricity.
● Requires electric utilities to permit residents to take part in a community solar program, in which residents can buy stakes in solar farms not on residents’ own land. In doing so, residents can still get credit for whatever power their shares generate even if the solar panels are not on their roof.
● Creates a competitive bidding process to bring in new solar utility by requiring Duke Energy to accept bids from solar farms and tender longer-term contracts, which would decrease Duke Energy’s costs in paying for solar power.
● Requires Duke Energy to create a solar rebate program for small customers and homes that totals up to 100 megawatts by 2022.
● Restricts the amount of renewable energy companies or universities can buy to a capacity of 125%. This amount is limited based on the size and number of power plants necessary to satisfy customer demand → probably limits customers to > 50% renewable energy based on how much electricity solar and wind power can generate.
Pennsylvania.
Development of Renewable Energy Industry & History State Support
Timeline of Legal Developments
● PA has two main ways to facilitate residential solar development: net metering and solar renewable energy certificates (“SRECs”).214
● Net Metering: permits one to sell solar electricity back to the utility for the same price one bought it
● [PASSED BILL] – In 2004, the Governor of Pennsylvania (Edward Rendell (D)) signed Act 213, known as the Alternative Energy Portfolio Standards Act of 2004. The Act included the following provisions228: ● Required distributors and suppliers of
electric energy to provide 18% of their
214 https://www.energysage.com/solar-rebates-incentives/pa/
228 https://www.pennaeps.com/aboutaeps/; http://www.puc.pa.gov/consumer_info/electricity/alternative_energy.aspx; http://www.legis.state.pa.us/cfdocs/legis/li/uconsCheck.cfm?yr=2004&sessInd=0&act=213; https://www.greentechmedia.com/articles/read/whats-wrong-with-pennsylvania-solar;

BEYOND THE BELTWAY: A REVIEW OF STATE ENERGY AND CLIMATE POLICES
58
● SRECs: permits one to sell SRECs that one’s solar panels create
● [The federal Investment Tax Credit (“ITC”) program, available only to people who purchase their solar energy system through cash or loan, allows a consumer to decrease their solar panels’ cost by 30%].
● A 2015 Annual Report by the Pennsylvania Public Utility Commission found that while solar energy accounted for less than 1% of PA’s net electricity generation, the amount of solar photovoltaic (“PV”) installations were rising.215
● In 2016, more than 75% of PA’s net solar generation resulted from distributed generating facilities (small-scale, customer-sited), like rooftop solar PV.216
● In 2012, PA’s residential market experienced a decrease in solar energy development, having 7 megawatts in 2012 from a previous 17 megawatts in 2011.217 There are a few reasons why solar energy development in PA was not doing well:218
● While PA’s 2004 Alternative Energy Portfolio Standard required state utilities to attain 18% of their electric power from alternative and renewable sources by 2021, with 0.5% of electricity generation from solar sources, it (1) allowed out-of-state solar electricity generation to meet its mandate (any area in the PJM region
electric power from alternative and renewable sources by 2021 (technically for June 1, 2020 and beyond). Of this 18%, 8% must come from Tier I energy sources and 10% must come from Tier II energy sources. ● Tier I sources include: “new and
existing facilities that produce electricity from solar PV, solar thermal, wind, low-impact hydro, geothermal, biomass, biologically derived methane gas, coal-mine methane and fuel cell resources”229
● Tier II sources include: “new and existing waste coal, distributed generation (DG), demand-side management, large-scale hydro, municipal solid waste, wood pulping and manufacturing byproducts, and integrated gasification combined cycle (IGCC) coal facilities”230
● [CURRENTLY, 13% of electric energy in PA is derived from renewable sources and 26% of solar renewable energy in PA comes from out-of-state sources].231
● For the Tier I requirement, 0.5% of electricity generation in PA had to be derived from solar sources by 2021.
http://www.philly.com/philly/business/energy/governor-restricts-srec-market-to-pa-producers-20171113.html
215 https://www.eia.gov/state/analysis.php?sid=PA#106
216 https://www.eia.gov/state/analysis.php?sid=PA#107
217 https://www.greentechmedia.com/articles/read/whats-wrong-with-pennsylvania-solar
218 https://www.greentechmedia.com/articles/read/whats-wrong-with-pennsylvania-solar; http://www.power-eng.com/articles/2017/11/pennsylvania-blocks-credits-for-out-of-state-solar-power.html; http://www.puc.pa.gov/consumer_info/electricity/alternative_energy.aspx; http://www.legis.state.pa.us/cfdocs/legis/li/uconsCheck.cfm?yr=2004&sessInd=0&act=213; http://www.philly.com/philly/business/energy/governor-restricts-srec-market-to-pa-producers-20171113.html; http://www.philly.com/philly/business/20110605_Solar_energy_output_is_outpacing_Pa__mandate.html; http://www.cpbj.com/article/20171114/CPBJ01/171119943/law-expected-to-boost-pa-solar-projects; http://www.post-gazette.com/powersource/policy-powersource/2017/10/26/Solar-borders-Pennsylvania-energy-credits-Wolf-bill/stories/201710260180; https://www.lexology.com/library/detail.aspx?g=d5786a26-260f-4b8f-bf1c-0da92f8fd951
229 https://www.pennaeps.com/aboutaeps/
230 Ibid.
231 http://lancasteronline.com/news/local/gov-wolf-uses-elizabethtown-college-s-solar-field-to-tout/article_b9e57296-c8aa-11e7-91a7-573a386937ab.html; https://www.utilitydive.com/news/new-pennsylvania-bill-requires-solar-credits-to-come-from-in-state/510494/

BEYOND THE BELTWAY: A REVIEW OF STATE ENERGY AND CLIMATE POLICES
59
qualified, which includes 13 states that spans from North Carolina to Illinois) and (2) was too small. ● The idea was that states outside of
PA participating in PA’s credit market would have their own reciprocal markets. However, this was not the case as while some states like North Carolina, Virginia, and Illinois had incentives for utility solar development, they did not create in-state credit markets.219
● Here is more information on the JPM electricity regions.220
● Permitting out-of-state solar power to qualify for renewable energy credits then had the effect of (1) decreasing the motivation for solar utilities to have solar installations in PA, (2) leading to a decrease in prices (e.g., the price of SRECs fell drastically, such as from $300/MWh to $5/MWh), and (3) creating an overabundance of solar credits.
● The Pennsylvania Sunshine Solar Rebate Program – a $180M financial incentive program created in 2009 and funded by state bonds to drive solar electricity growth in PA for 5 years – fell apart as its funds were largely used up in 3 years. ● This led to solar developers
looking to neighboring states that had better-funded programs.
● A 2017 bill signed in the House and Senate and approved by Governor Tom Wolf (D) in October 2017, House Bill 118, (see next column) may be the
● [PASSED BILL] – In October 2017, Governor Tom Wolf (D) approved House Bill 118232, which was signed into law as Act 40 (as part of an omnibus bill). With respect to solar energy, the law provides for the following: 233
● Prevents out-of-state solar energy generation to qualify for renewable energy credits → if a renewable facility wants to generate credits, the electricity the facility generates has to (1) directly deliver the energy to a consumer or distributor of electric energy in PA, OR (2) directly connect to an electric municipal or cooperative system in PA OR (3) directly connect to a system transmitting electricity located in the serve region of an electricity distribution system in PA.234
● This change will hopefully help the market for SRECs in PA, in which SRECs currently trade for around $5/credit (compared to +$300/MWh in 2010). For instance, in New Jersey and Washington, D.C., in which both states have restricted markets, solar credits trade for around $190 and $350, respectively. ● Credits expire 2-3 years after their generation. ● Goal of this in-state solar
requirement is to bridge the difference between PA’s current bandwidth for in-state solar systems and PA’s solar PV requirements.
● However, one solar industry executive in Central PA has stated that the impact of this bill is dependent on how the PA Public Utility Commission (“PUC”)
219 http://www.post-gazette.com/powersource/policy-powersource/2017/10/26/Solar-borders-Pennsylvania-energy-credits-Wolf-bill/stories/201710260180
220 https://www.ferc.gov/market-oversight/mkt-electric/pjm.asp
232 http://www.legis.state.pa.us/cfdocs/legis/pn/public/btCheck.cfm?txtType=HTM&sessYr=2017&sessInd=0&billBody=H&billTyp=B&billnbr=0118&pn=2256
233 http://www.legis.state.pa.us/cfdocs/billInfo/bill_history.cfm?syear=2017&sind=0&body=H&type=B&bn=118; http://www.power-eng.com/articles/2017/11/pennsylvania-blocks-credits-for-out-of-state-solar-power.html; http://www.post-gazette.com/powersource/policy-powersource/2017/10/26/Solar-borders-Pennsylvania-energy-credits-Wolf-bill/stories/201710260180; http://www.philly.com/philly/business/energy/governor-restricts-srec-market-to-pa-producers-20171113.html; https://www.governor.pa.gov/governor-wolf-announces-new-effort-bolster-solar-energy-pennsylvania/
234 https://www.lexology.com/library/detail.aspx?g=d5786a26-260f-4b8f-bf1c-0da92f8fd951

BEYOND THE BELTWAY: A REVIEW OF STATE ENERGY AND CLIMATE POLICES
60
solution to PA’s solar energy problem.221 ● A 2013 article stated that although
there had been a bill attempting to address the issue of out-of-state energy production, which had garnered bipartisan support, it was prevented from obtaining a vote by then Governor Tom Corbett (R) and other players with interests in the nuclear and fossil industry.222
● It seems that the bill in question was most likely House Bill 1580, “which would extend the financial credits businesses and homeowners get for the electricity their solar assemblies send back into the grid.”223
● In 2016, the U.S. Department of Energy granted the Pennsylvania Department of Environmental Protection (“DEP”) $550,000 for the DEP’s 2017-2019 statewide planning project, “Finding Pennsylvania’s Solar Future.” The project aims to provide more solar energy and raise solar-generated in-state electricity sales in 2030 to at least 10%.224
interprets it. A PUC spokesperson stated that “[t]he commission will work to implement this legislation.”235
● Moreover, it may take a period of time for this law to raise prices given that contracts with solar utilities outside of PA are grandfathered in.236
● [NOTE] – Senate Bill 446 includes similar language with respect to solar energy as House Bill 118.237
● [INTRODUCED BILL] – In the 2017-2018 legislative session, Senate Bill 291 was introduced. The bill amends the Alternative Energy Portfolio Standards Act by increasing the percentage of electricity in PA that needs to be derived from renewable or alternative energy sources. For instance, regarding the requirement for Tier I energy sources, the bill mandates that 1.0653% of electricity generation in PA has to be derived from solar sources for June 1, 2020 through May 31, 2021.238
● [FAILED BILL] – In the 2011-2012 legislative session, legislators attempted to pass House Bill 1580, which aimed to amend the Alternative Energy Portfolio Standards Act. Specifically, the bill would have addressed the issue of out-of-state energy production by “extend[ing] the financial credits businesses and homeowners get for the electricity their
221 https://www.greentechmedia.com/articles/read/whats-wrong-with-pennsylvania-solar; https://www.utilitydive.com/news/new-pennsylvania-bill-requires-solar-credits-to-come-from-in-state/510494/; http://www.legis.state.pa.us/cfdocs/billInfo/bill_history.cfm?syear=2017&sind=0&body=H&type=B&bn=118
222 https://www.greentechmedia.com/articles/read/whats-wrong-with-pennsylvania-solar#gs.Wku5CQw
223 http://www.timesherald.com/article/JR/20120607/FINANCE01/120609657
224 https://www.governor.pa.gov/governor-wolf-announces-statewide-planning-project-to-boost-pennsylvanias-solar-energy-development-begins-in-january-2017/; http://www.dep.pa.gov/Business/Energy/OfficeofPollutionPrevention/SolarFuture/Pages/Finding-Pennsylvania%E2%80%99s-Solar-Future.aspx; https://energy.gov/eere/solar/solar-energy-evolution-and-diffusion-studies-2-state-energy-strategies-seeds2-ses#SES;
235 http://www.cpbj.com/article/20171114/CPBJ01/171119943/law-expected-to-boost-pa-solar-projects
236 Ibid.
237 http://www.legis.state.pa.us/cfdocs/legis/pn/public/btCheck.cfm?txtType=HTM&sessYr=2017&sessInd=0&billBody=S&billTyp=B&billnbr=0446&pn=1088; http://www.legis.state.pa.us/cfdocs/billinfo/BillInfo.cfm?syear=2017&sind=0&body=S&type=B&bn=446
238 http://www.legis.state.pa.us/cfdocs/legis/pn/public/btCheck.cfm?txtType=HTM&sessYr=2017&sessInd=0&billBody=S&billTyp=B&billnbr=0291&pn=0286; http://www.legis.state.pa.us/cfdocs/billinfo/bill_history.cfm?syear=2017&sind=0&body=S&type=B&bn=291; https://www.sierraclub.org/pennsylvania/legislation/2017/sb-291-expanding-pennsylvania-s-requirements-for-renewable-energy

BEYOND THE BELTWAY: A REVIEW OF STATE ENERGY AND CLIMATE POLICES
61
● The project started in 2017 and there are 3 main issues that working groups on the project seek to address: 1. Regulation – method to change
PA’s Alternative Energy Portfolio Standards (based on Act 213, which was signed in 2004) to achieve future objectives. A current objective is that by 2021, solar photovoltaic energy will have given 0.5% of PA’s net electricity generation
2. Operations and Systems – method to integrate solar into the current grid in a cost-effective manner
3. Market Transformations Via Incentives + Business Models – method to make sure that underrepresented groups + low-income consumers are not prevented from partaking in solar benefits
● In 2015, Governor Wolf (D) proposed a $675M bond program to facilitate energy, technology, infrastructure investment, etc. This $675M program included allocating $30M to the Pennsylvania Energy Development Authority to increase the market for fuels, services, and clean energy.225
● In 2014, then Governor Corbett (R) and the PA DEP declared that the Pennsylvania Energy Development Authority would give $12.5M for alternative and renewable energy projects.226
Note: In 2017, former PA Governors Corbett (R) and Rendell (D) penned an article stating their belief that changes to the federal Renewable Fuel Standard (“RFS”) would prevent the loss of PA refinery jobs.227
solar assemblies send back into the grid.” However, the bill was not supported by then Governor Corbett (R). Some of the amendments in the bill included (1) listing nuclear energy and waste as energy facilities and (2) classifying natural gas as a renewable or alternative source.239
225 http://lehighvalley.org/gov-tom-wolf-unveils-budget-outlines-extensive-economic-development-agenda/
226 https://stateimpact.npr.org/pennsylvania/2014/06/12/corbett-announces-12-5-million-in-renewable-energy-grants/; https://www.prnewswire.com/news-releases/pennsylvania-governor-corbett-announces-125-million-available-for-energy-development-authority-grants-and-loans-262882851.html
227 http://www.philly.com/philly/opinion/commentary/rendell-corbett-renewable-fuel-standard-refinery-jobs-20170914.html
239 http://www.legis.state.pa.us/cfdocs/billinfo/BillInfo.cfm?syear=2011&sind=0&body=H&type=B&bn=1580; https://www.greentechmedia.com/articles/read/whats-wrong-with-pennsylvania-solar#gs.Wku5CQw; http://www.timesherald.com/article/JR/20120607/FINANCE01/120609657; http://www.erg-partners.com/blog/2012/01/20/house-committee-holds-solar-share-aeps-hearing/

BEYOND THE BELTWAY: A REVIEW OF STATE ENERGY AND CLIMATE POLICES
62
South Carolina.
Development of Renewable Energy Industry & History State Support
Timeline of Legal Developments
● Solar energy growth in SC “promoted by legislative changes that pushed utilities at Duke and SCANA Corp. . . . to seek more solar power.”240
● The amount of solar investment in SC pales in comparison to that in NC. For instance, in 2016, solar companies invested $5.4B in NC and $1.9B in GA but only $199M in SC (although this number does reflect an increase from $11M in 2015 in SC).241 ● This 2012 article highlighted several
reasons why solar energy in SC cannot compare to that in NC: “[c]omplicated laws, resistance from power companies, poor tax incentives and an emphasis on nuclear energy.” 242
● This 2015 article discussed two reasons why SC lags behind NC in solar energy243: ● 1. Unlike NC, SC never had a RPS
as of 2015. NC’s 2007 renewable-portfolio standard (“RPS”) developed avenues for investment tax credits and solar developers. As of February 2017, SC still does not have a RPS.244
● [PASSED BILL] – On June 2, 2014, the Governor signed Bill 1189, the Distributed Energy Resource Program Act, which expands solar power in SC by providing for the following things246:
● Lets homeowners lease solar systems from companies;
● Permits utilities to construct solar farms and recover costs as they are able to for traditional power plants;
● Requires utility companies to either acquire 2% of or invest in their average peak demand in solar power by 2021; and
● Introduces net metering, in which residential or business owners can sell back their additional solar energy to utilities.
● Due to Bill 1189, there was a growth of investments in solar energy in SC (from $11M in 2015 to $199M in 2016).247 Although Duke Energy had resisted third-party solar sales in NC, it supported this bill aimed at increasing residential solar in SC.248 (Duke’s support for the bill likely came from stockholder pressure).249
● In response to Bill 1189, Duke Energy and S.C. E&G filed proposals seeking for
240 https://www.bizjournals.com/charlotte/news/2017/04/12/georgia-south-carolina-solar-nc-policy.html
241 http://www.thestate.com/news/politics-government/article134990214.html
242 http://www.thestate.com/latest-news/article14412350.html
243 http://www.charlotteobserver.com/latest-news/article10426937.html
244 https://ballotpedia.org/Energy_policy_in_South_Carolina#Renewable_Portfolio_Standard
246 http://www.scstatehouse.gov/sess120_2013-2014/bills/1189.htm; http://www.charlotteobserver.com/latest-news/article10426937.html; http://southeastenergynews.com/2017/06/22/north-carolina-solar-bill-may-help-breweries-go-solar-but-not-google/; http://southeastenergynews.com/2016/08/18/qa-a-republican-lawmaker-seeks-solar-momentum-for-south-carolina/; http://www.scstatehouse.gov/sess120_2013-2014/bills/1189.htmhttps://www.greentechmedia.com/articles/read/the-carolinas-have-become-hotspots-for-solar-market-expansion#gs.48TQr=M
247 http://www.thestate.com/news/politics-government/article134990214.html
248 https://www.ecowatch.com/solar-war-continues-in-north-carolina-nonprofit-vs-duke-energy-1891168741.html; http://www.charlotteobserver.com/latest-news/article10426937.html; http://southeastenergynews.com/2016/08/18/qa-a-republican-lawmaker-seeks-solar-momentum-for-south-carolina/
249 http://southeastenergynews.com/2016/08/18/qa-a-republican-lawmaker-seeks-solar-momentum-for-south-carolina/

BEYOND THE BELTWAY: A REVIEW OF STATE ENERGY AND CLIMATE POLICES
63
● 2. SC has a smaller size compared to that of NC (for instance, in 2015, Duke had around 2,000 customers with rooftop solar systems while it only had 200 such customers in SC).
● SC gives households a 25% tax-credit for costs associated with installing solar. In 2016, BlueWave, a solar projects developer based in Boston, developed a solar loan financing product in SC (and NC) that gives homeowners a 12 month interest only period, up to $100K, at a 5.99% fixed rate for a period of 10 years. BlueWave stated that the solar loan payment in addition to a homeowner’s solar electric bill could potentially amount to 20-50% less than an ordinary electric bill. Moreover, once a homeowner pays off the debt in 10 years, energy generated through the rooftop panels comes at no cost.245
approval to add 111 and 100 megawatts of solar energy in SC by 2021, respectively.250
● Duke’s Plan: customer rebates up to $5K to install rooftop solar arrays; helps customers get into community solar projects.251
● S.C. E&G’s Plan: incentivizes customers to install solar systems by paying premium rates for energy generated and adding 45 megawatts at solar farms; helps customers get into community solar projects.252
● [STALLED BILL] – There is currently another bill in SC legislature (S.44 – passed in the Senate), fashioned after a NC solar tax exemption, that would allow solar companies to have an 80% tax break on their solar panels and other equipment used in maintaining solar farms as well as make sure that residential homes containing rooftop solar installations are not determined under property tax laws.253 Senator Gregory, who helped to pass Bill 1189, introduced this bill to stop property, or ad valorem, taxes on solar farms as well as business and residential solar. The bill had initially passed the senate but broke down in the House as House members took out tax for solar farms but kept it in for businesses and individuals. Gregory stated that “[t]here are some people in the house who see tax rebates as an unnecessary subsidy for solar over other forms of power.”254
● House Rep. Brian White voted to stop debate on this legislation, arguing that should solar projects increase because of property tax incentives, then SC residents would not have sufficient land for timber and farming purposes. Moreover, he stated that it was not fair to provide distributed and solar energy sources with tax breaks but
245 https://www.pv-tech.org/news/bluewave-launches-premier-solar-loan-in-north-and-south-carolina
250 http://www.charlotteobserver.com/latest-news/article10426937.html
251 Ibid.
252 Ibid.
253 http://www.thestate.com/news/politics-government/article134990214.html
254 http://southeastenergynews.com/2016/08/18/qa-a-republican-lawmaker-seeks-solar-momentum-for-south-carolina/; http://www.postandcourier.com/news/south-carolina-house-stalls-renewable-energy-tax-breaks-that-solar/article_da05b1b0-2f3c-11e7-b78f-8f7b1a6c2359.html

BEYOND THE BELTWAY: A REVIEW OF STATE ENERGY AND CLIMATE POLICES
64
not give such tax breaks to large utility companies like S.C. E&G and Duke.255
● This bill also exempts residential rooftop solar panels from raising the costs of a homeowner’s property tax bill.256
● Should this property tax cut become law, that could mean the construction of 91 possible solar farm projects in SC.257 This could lead to ~$217M in new property tax from the use of solar equipment in solar farms. However, there is opposition to this bill from county leaders as they see this bill as preventing them from negotiating with solar companies about tax-breaks.258
255 http://www.postandcourier.com/news/south-carolina-house-stalls-renewable-energy-tax-breaks-that-solar/article_da05b1b0-2f3c-11e7-b78f-8f7b1a6c2359.html
256 http://www.thestate.com/news/politics-government/article134990214.html; https://pv-magazine-usa.com/2017/03/09/south-carolina-snags-another-utility-scale-solar-farm/
257 http://www.thestate.com/news/politics-government/article134990214.html
258 Ibid.

BEYOND THE BELTWAY: A REVIEW OF STATE ENERGY AND CLIMATE POLICES
65
Appendix E: Glossary of Commonly Used Terminology
Blue state/red state. By convention, states voting Democratic in an election are shown as blue on maps; states voting Republican are shown as red. States with inconsistent voting records are shown as purple.
Clean Air Act. The federal statute regulating air pollution.
Clean Power Plan. A regulation issued by the Environmental Protection Agency during the Obama Administration. It requires states to create and implement plans reducing CO2 emissions from power plants. The regulation is mired in litigation, and at this point it is unclear whether it will ever go into effect.
Climate change adaptation. Preparation for the local impacts of climate change, such as building seawalls to deal with sea-level rise.
Demand response. A system whereby some sources are paid to reduce their electricity demand during peak electricity use.
Deregulation. In the electricity context, this term is used in contrast to traditional regulation, in which utility rates are controlled to ensure that they yield a fair return on investment (but no more than a fair return). Deregulation involves substituting markets for at least some regulation. This generally involves opening power supply markets to independent generators (not owned by utilities).
Distributed solar. Basically, this means rooftop solar.
Dormant Commerce Clause. A judicial doctrine that invalidates state laws which discriminate with or excessively burden interstate commerce.
Emissions trading (or “cap and trade”). A system whereby the government issues allowances for set amounts of pollution (often 1 ton). The allowances are either distributed free to emitters or auctioned. In either event, the original holder can sell the allowances to other emitters or sometimes non-emitting entities. After a fixed period, each emitter must show that it holds enough allowances to cover all of its emissions during the period in question.
Energy Information Administration (EIA). An agency within the Department of Energy charged with collecting, disclosing, and analyzing national energy data.
Federal Energy Regulatory Commission (FERC). A federal agency that regulates whole energy sales on portions of the grid that serve interstate commerce – which is essentially the entire United States except Alaska, Hawaii, and a large portion of Texas.
Federal preemption. A state law is invalid if it conflicts with a federal statute or regulation and is said to be “preempted’ by federal law.
Greenhouse gases. Gases that cause the planet to radiate less heat into space, resulting in climate change. The dominant greenhouse gas is carbon dioxide (CO2).
MW. Megawatt (one million watts).

BEYOND THE BELTWAY: A REVIEW OF STATE ENERGY AND CLIMATE POLICES
66
Net metering. An arrangement under which electricity fees can be offset by power generated by the consumer and sold back to the utility.
Paris Agreement. The Paris Agreement is a non-binding global agreement on climate change, entered into under the auspices of a prior binding treaty, the United Nations Framework Convention on Climate Change. President Trump announced in 2017 that he intended to withdraw the United States from the Agreement in November 2020, the earliest time allowed for withdrawal under the Agreement.
Public utility. An entity that supplies power, natural gas, water, or telecommunications to the general public. Such entities may either be publicly owned (often by cities) or privately owned (also known as IOUs or Investor Owned Utilities).
Public utility commission. A state agency that regulates public utility commissions, generally with this name but sometimes with other titles such as Corporation Commission.
The Public Utility Regulatory Policies Act (PURPA). A federal statute that requires utilities to purchase power from small generators, often used by smaller solar or wind generators.
Renewable portfolio standard (RPS). A mandate that utilities obtain a specified percentage of their power from specified sources. They commonly have the option of fulfilling all or part of this requirement by purchasing credits from generators or utilities who do not sell to them directly.
Regional Greenhouse Gas Initiative (RGGI). An emissions trading scheme for carbon dioxide in the Eastern United States. Includes New England and the mid-Atlantic states. Some states, like New Jersey, have moved in and out of the agreement.
Tailpipe regulations. Regulations of combustion emissions from vehicles.
Thermal generators. Electricity generators that are driven by heat sources. This category includes natural gas, coal, and nuclear generators.
Utility-scale solar. Often, solar-panel farms, as opposed to rooftop solar. Also include concentrated solar, where mirrors are used to concentrate the sun and the heat is used to run turbines for electricity.