beyond statistical significance- clinical interpretation of rehabilitation research literature.pdf
TRANSCRIPT

The International Journal of Sports Physical Therapy | Volume 9, Number 5 | October 2014 | Page 726
ABSTRACTEvidence-based practice requires clinicians to stay current with the scientific literature. Unfortunately, rehabilitation professionals are often faced with research literature that is difficult to interpret clinically. Clinical research data is often analyzed with traditional statistical probability (p-values), which may not give rehabilitation professionals enough information to make clinical decisions. Statistically significant dif-ferences or outcomes simply address whether to accept or reject a null or directional hypothesis, without providing information on the magnitude or direction of the difference (treatment effect). To improve the interpretation of clinical significance in the rehabilitation literature, researchers commonly include more clinically-relevant information such as confidence intervals and effect sizes. It is important for clinicians to be able to interpret confidence intervals using effect sizes, minimal clinically important differences, and magnitude-based inferences. The purpose of this commentary is to discuss the different aspects of statisti-cal analysis and determinations of clinical relevance in the literature, including validity, significance, effect, and confidence. Understanding these aspects of research will help practitioners better utilize the evidence to improve their clinical decision-making skills.
Key words: Clinical significance, evidence based practice, statistical significance
Level of evidence: 5
IJSP
T CLINICAL COMMENTARYBEYOND STATISTICAL SIGNIFICANCE: CLINICAL INTERPRETATION OF REHABILITATION RESEARCH LITERATUREPhil Page, PT, PhD, ATC, CSCS, FACSM1
1 Louisiana State University, Baton Rouge, Louisiana, USA
CORRESPONDING AUTHORPhil PageE-mail: [email protected]
The International Journal of Sports Physical Therapy | Volume 9, Number 5 | October 2014 | Page 727
INTRODUCTIONEvidence-based practice is supposed to affect clinical decision-making, but interpreting research is often difficult for some clinicians. Clinical interpretation of research on treatment outcomes is important because of its influence on clinical decision-making including patient safety and efficacy. Publication in a peer-reviewed journal does not automatically imply proper study design or statistics were used, or that the author’s interpretation of the data was appropriate. Furthermore, statistically significant differences between data sets (or lack thereof) may not always result in an appropriate change in clini-cal practice. Clinical research is only of value if it is properly interpreted.
From a clinical perspective, the presence (or absence) of statistically significant differences is of limited value. In fact, a non-significant outcome does not automatically imply the treatment was not clinically effective because small sample sizes and measure-ment variability can influence statistical results.1 Other factors, such as treatment effect calculations and confidence intervals offer much more informa-tion for clinicians to assess regarding the application of research finding, including both the magnitude and direction of a treatment outcome.
The purpose of this clinical commentary is to dis-cuss the different aspects of statistical analysis and determinations of clinical relevance in the litera-ture, including validity, significance, effect, and con-fidence. Understanding these aspects of research will help practitioners better utilize the evidence to improve their clinical decision-making skills.
VALIDITYClinicians should be able to critically evaluate research for both internal and external validity in order to determine if a study is clinically applicable. Internal validity reflects the amount of bias within a study that may influence the research results. Proper study design and statistical analysis are important factors for internal validity. For additional information on proper research design, the reader is referred to the article “Research Designs in Sports Physical Therapy”.2
The research question drives the research design and statistical analysis. General clinical research designs include clinical trials, cohort studies, and case reports;
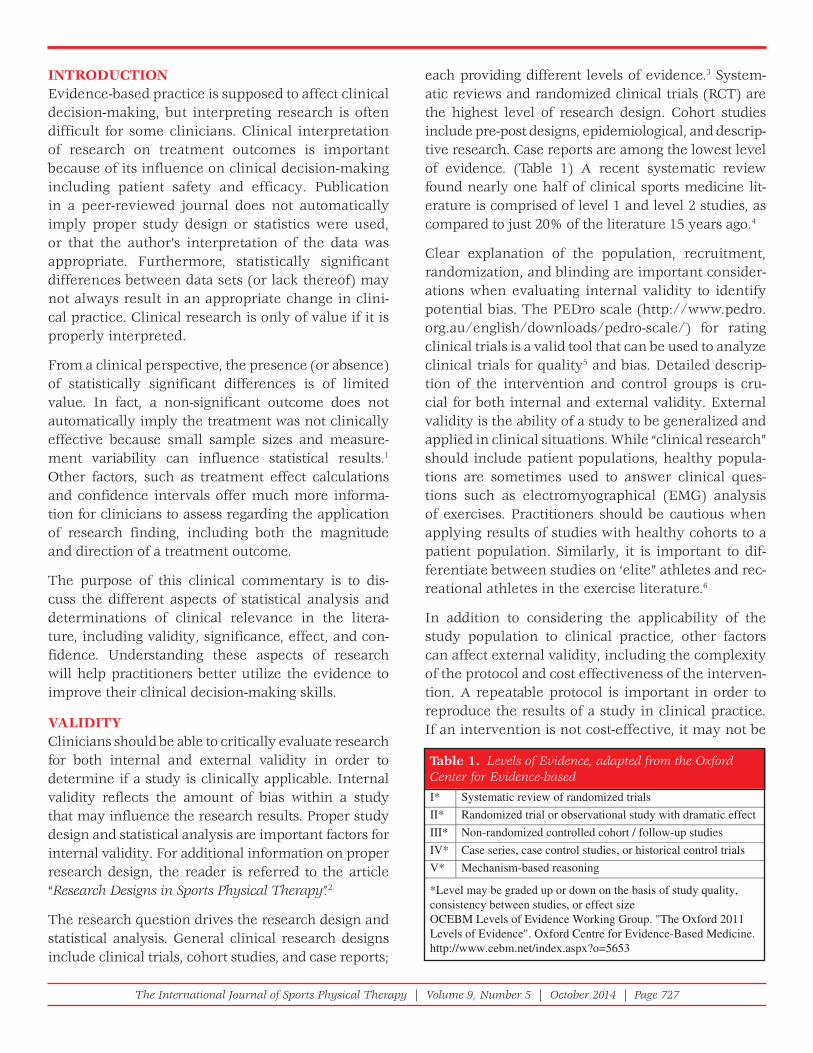
each providing different levels of evidence.3 System-atic reviews and randomized clinical trials (RCT) are the highest level of research design. Cohort studies include pre-post designs, epidemiological, and descrip-tive research. Case reports are among the lowest level of evidence. (Table 1) A recent systematic review found nearly one half of clinical sports medicine lit-erature is comprised of level 1 and level 2 studies, as compared to just 20% of the literature 15 years ago.4
Clear explanation of the population, recruitment, randomization, and blinding are important consider-ations when evaluating internal validity to identify potential bias. The PEDro scale (http://www.pedro.org.au/english/downloads/pedro-scale/) for rating clinical trials is a valid tool that can be used to analyze clinical trials for quality5 and bias. Detailed descrip-tion of the intervention and control groups is cru-cial for both internal and external validity. External validity is the ability of a study to be generalized and applied in clinical situations. While “clinical research” should include patient populations, healthy popula-tions are sometimes used to answer clinical ques-tions such as electromyographical (EMG) analysis of exercises. Practitioners should be cautious when applying results of studies with healthy cohorts to a patient population. Similarly, it is important to dif-ferentiate between studies on ‘elite” athletes and rec-reational athletes in the exercise literature.6
In addition to considering the applicability of the study population to clinical practice, other factors can affect external validity, including the complexity of the protocol and cost effectiveness of the interven-tion. A repeatable protocol is important in order to reproduce the results of a study in clinical practice. If an intervention is not cost-effective, it may not be
Table 1. Levels of Evidence, adapted from the Oxford Center for Evidence-basedI* Systematic review of randomized trials II* Randomized trial or observational study with dramatic effect III* Non-randomized controlled cohort / follow-up studies IV* Case series, case control studies, or historical control trials V* Mechanism-based reasoning
*Level may be graded up or down on the basis of study quality,consistency between studies, or effect sizeOCEBM Levels of Evidence Working Group. "The Oxford 2011Levels of Evidence". Oxford Centre for Evidence-Based Medicine.http://www.cebm.net/index.aspx?o=5653

The International Journal of Sports Physical Therapy | Volume 9, Number 5 | October 2014 | Page 728
feasible in practice. Studies with the highest level of design and high internal validity may still lack exter-nal validity, thereby limiting their clinical use.
STATISTICAL SIGNIFICANCETraditional research uses statistical hypothesis test-ing in order to infer something about a population using a representative sample. Statistics are used to answer questions of probability, generally using the scientific method, in order to determine if a hypoth-esis can be accepted or rejected. Statistical signifi-cance only addresses a hypothesis about whether or not differences exist, statistically, between groups. As stated previously, the statistical analysis of a study is driven by the research design, which is determined by the research question.
Statistical significance is based on several assump-tions. The sample tested should be representative of the entire clinical population. Inferential statis-tics assume a normal distribution, represented by a bell-shaped curve (Figure 1). A normal distribution is represented by standard deviation (!) from the mean (!) value. One standard deviation (SD) rep-resents 68% of the population (in both directions from the mean) while 95% of the population is rep-resented by +2 SDs.
Determination of whether statistically significant differences exist or not is centered on accepting or rejecting a “null” or “alternative” hypothesis. A null hypothesis (represented by H0) assumes no differ-ence between groups (or no effect of treatment). An alternative hypothesis (represented by H1) is what the researcher expects to find from the study, and can be directional or non-directional. A non-directional hypothesis, based on rejecting the null
hypothesis, provides a reference value for the out-come parameter. A directional hypothesis provides a minimal value for the expected outcome parameter. For example, a directional hypothesis for an inter-vention that decreases pain by a minimal clinical value may be represented by H1 > 2.
Statistically significant differences are determined using a certain level of probability (the “p-level”, or ") that the researcher chooses, to ensure that one does not incorrectly reject the null hypothesis due to chance, when the null hypothesis is in fact accepted (Type I error). The generally accepted p-level of " =0.05 sug-gests there is a 95% probability that the researchers correctly rejects the null hypothesis when there is no difference between groups. Therefore, the p-value is only the chance that the researcher makes the correct “yes” or “no” decision regarding a hypothesis.
Statistically significant differences alone should not be the primary influence for clinical interpretation of a study’s outcome for application to patient care. Sta-tistically significant differences do not provide clini-cal insight into important variables such as treatment effect size, magnitude of change, or direction of the outcome. In addition, whether results achieve statis-tically significant differences is influenced by factors such as the number and variability of subjects, as well as the magnitude of effect. Therefore, p-values should be considered along with effect size, sample size, and study design.7 Evidence based practitioners should examine research outcomes for their clinical signifi-cance rather than just statistical significance. Several measures can be used to determine clinical relevance, including clinical significance, effect sizes, confidence intervals, and magnitude-based inferences.
CLINICAL SIGNIFICANCE While most research focus on statistical significance, clinicians and clinical researchers should focus on clinically significant changes. A study outcome can be statistically significant, but not be clinically signifi-cant, and vice-versa. Unfortunately, clinical signifi-cance is not well defined or understood, and many research consumers mistakenly relate statistically significant outcomes with clinical relevance. Clini-cally relevant changes in outcomes are identified (sometimes interchangeably) by several similar terms including “minimal clinically important differences
Figure 1. Normal distribution bell-shaped curve with stan-dard deviations (From http://en.wikipedia.org/wiki/File:Standard_deviation_diagram.svg)
The International Journal of Sports Physical Therapy | Volume 9, Number 5 | October 2014 | Page 729
(MCID)”, “clinically meaningful differences (CMD)”, and “minimally important changes (MIC)”.
In general, these terms all refer to the smallest change in an outcome score that is considered “important” or “worthwhile” by the practitioner or the patient8 and/or would result in a change in patient management9,10. Changes in outcomes exceeding these minimal val-ues are considered clinically relevant. It is important to consider that both harmful changes and beneficial changes may be outcomes of treatment; therefore, the term “clinically-important changes” should be used to identify both minimal and beneficial differ-ences, but also to recognize harmful changes.
Unfortunately, there are no standards for calculating clinically important changes in outcomes. Clinicians and researchers sometimes have different values for clinically important changes, and minimal changes may be specific to the individual patient. There is some subjectivity in determining clinical significance because of the paucity of research determining clini-cally significant values, and variations in patient status and goals and clinician experience. Minimal clinically important differences are generally calculated by comparing the difference in an outcome score before and after treatment with an “anchor” score such as global perceived effect score or another measure of the patients perceived change in an outcome.
Some researchers have identified MIC, MCID, and CMD with various outcome measures. It is impor-tant to determine clinical significance in a patient population with similar diagnoses and pain levels. For example, a clinically important change in pain in shoulder pain patients varies between patients with intact rotator cuffs and those with a ruptured rotator cuff.11 Patients with acute pain or higher lev-els of pain intensity may require less change in pain than chronic pain patients for their changes to be considered clinically important.12
Some researchers have suggested that clinically sig-nificant changes can be determined using the stan-dard deviation or standard error of the mean (SEM) within a study. Minimal important changes must be beyond the error of the measuring device to ensure clinical changes were not due to measurement error. Wyrwich13 reported that the MIC in musculoskeletal disorders was 2.3 or 2.6 times the SEM. To calculate
the MCID, Lemieux et al.14 suggested multiplying the pooled baseline standard deviation scores by 0.2, which corresponds to the smallest effect size. For example, if the pooled baseline standard devia-tion is +/- 10, then the MCID is (0.2 x 10) equal to 2. Therefore, a mean difference between groups that is higher than the MCID of 2 is clinically relevant. However, more research is needed on the method of calculating clinically important changes and on quantifying these changes in patient populations.
EFFECTThe most fundamental question of clinical signifi-cance is usually, “Is the treatment effective, and will it or should it change my practice?” Some studies use the terms “efficacy” and “effectiveness” interchange-ably; however, these terms should be differentiated. Efficacy is the benefit of an intervention compared to control or standard treatment under ideal condi-tions, including compliant subjects only. Effective-ness is the benefit of an intervention in a “real-world” defined population, including non-compliant sub-jects. Treatment efficacy is evaluated using compliant subjects,15,16 while treatment effectiveness includes an ‘intent-to-treat’ analysis of all patients enrolled in the trial, by including subjects who dropped out in the final analysis, thus providing more clinically-relevant outcomes.
The effect size is one of the most important indicators of clinical significance. It reflects the magnitude of the difference in outcomes between groups; a greater effect size indicates a larger difference between experimental and control groups. Standardized effect sizes (or standardized mean differences) are impor-tant when comparing treatment effects between dif-ferent studies, as commonly seen in the performance of meta-analyses. Clinical researchers should include standardized effect sizes in their results.
Cohen17 established traditional calculation of effect values based on group differences (change score), divided by the pooled standard deviation in the fol-lowing equation:
Change in Experimental Group vs. controlStanndard Deviation of both groups
= 610
=0.6 Cohen

The International Journal of Sports Physical Therapy | Volume 9, Number 5 | October 2014 | Page 730
Cohen quantified effect sizes that have been opera-tionally described in ranges: <0.2= trivial effect; 0.2-0.5 = small effect; 0.5-0.8 = moderate effect; > 0.8= large effect. Cohen’s effect sizes may be posi-tive or negative, indicating the direction of the effect. For example, the effect size of 0.6 above would be a “moderate positive effect.” If the effect size were negative (-0.6), the resulting effect would be “mod-erately negative”.
Treatment effect may also be determined by using “relative risk” or “odds ratio” analysis. The relative risk or “risk ratio” (RR) is the probability of an out-come occurring in a treatment group divided by the probability of an outcome occurring in a comparison group. The odds ratio (OR) is the proportion of sub-jects in the treatment group with an outcome divided by the proportion of subjects in a comparison group with the outcome. A RR or OR of 1 indicates no differ-ence between the treatment and comparison groups. Values greater than 1 favor the treatment group, while values less than 1 favor the comparison group.
Relative risk (RR) can also be used to identify clini-cal effectiveness of an intervention. If a clinician assumes that a 10% improvement in a patient is clinically meaningful, then the number of subjects with at least 10% improvement can be compared to those not reaching the minimal (10%) improvement. Therefore, the relative clinical effectiveness (assum-ing an intent-to-treat analysis) would be defined using the following equation:
If 20% of subjects receiving the intervention reach a 10% improvement, while 80% of subjects receiving the intervention don’t, the relative clinical effective-ness of the intervention is 25%.
The number needed to treat (NNT) provides the num-ber of patients who need to be treated before seeing one patient improve who would not have improved without the intervention. The NNT can infer clini-cal effectiveness: a high NNT indicates a less effec-tive treatment, and may render the intervention prohibitive. For more information on the NNT and
how to calculate it, the reader is referred to: http://en.wikipedia.org/wiki/Number_needed_to_treat
Effect size, statistical power, and sample size are inter-related. The power analysis determines the number of subjects needed in a study to detect a statistically significant difference with an appropriate effect size. Statistical power of 80% (0.8) is generally accepted, meaning that 80% of the time, the researcher will avoid Type 2 error (#), where the researcher fails to reject the null hypothesis when there is a difference between groups. Power analysis is usually based on the results of previous studies when the mean differ-ences and SDs are known. In some cases, statistical power can be determined after conclusion of a study in a “post hoc” manner, although determining statisti-cal power before a study begins in an “a priori” man-ner to estimate sample size is preferred and expected.
A small sample size may demonstrate a lack of sta-tistically significant different results, but still pro-vide results with clinical significance. Even a study powered at 80% still has a 1 in 5 chance of creating a Type 2 error (false negative).7 A small sample size limits statistical power; while larger sample sizes provide more power to detect statistically significant differences. While larger sample sizes are obviously preferred in a clinical study to capture a true rep-resentation of the clinical population being studied, larger samples sizes can lead to statistically signifi-cant differences that remain clinically insignificant.
CONFIDENCE INTERVALSOne of the most meaningful, yet misunderstood and underutilized statistics in interpreting clinical research may be the confidence interval (CI). The CI is the certainty that a range (interval) of values contains the true, accurate value of a population that would be obtained if the experiment were repeated. Fortunately, more researchers and reviewers are using CIs to report results of clinical trials in the lit-erature; however, clinicians need to understand the clinical interpretation and value of reporting the CI.
Confidence intervals are appropriate for reporting the results of clinical trials because they focus on confidence of an outcome occurring, rather than accepting or rejecting a hypothesis.18 In addition, the CI provides information about the magnitude and direction of an effect, offering more clinical value
Relative clinical effectiveness=
%subjectss with clinically meaningful outcome%subjeects without clinically meaningful outcome

The International Journal of Sports Physical Therapy | Volume 9, Number 5 | October 2014 | Page 731
than answering a hypothesis-based question. Green-field et al19 noted that CIs “are statements about belief in the statistical process and do not have probability implications.” Rather, probability would be deter-mined by interpretations of statistical significance. In contrast, CIs offer more precision of the estimate of the true value of an unknown because it includes the range of uncertainty.
The CI represents the researchers level of confidence that the true value in a representative population is contained within the interval. From a clinical perspec-tive, the CI is the likely range containing the value of a true effect of treatment in an average subject.6 A CI is reported as a range or interval describing the lower and upper values (“boundaries”) of uncertainty, also known as the “margin of error.” While some clinicians assume that the CI represents the range of scores (i.e., subjects improved by up to the value of the upper boundary or declined by the value of the lower bound-ary), this is not correct. Furthermore, the CI should not be confused with standard deviation, which is used to describe the variability of a mean score within a sample. CIs are reported with a “point estimate” (PE) from the sample tested from the population. The PE is a specific value (which may be a sample mean, dif-ference score, effect size, etc), but does NOT represent a “true” value; rather, it represents the “best estimate” of the true value from the average of the sample20 and should be viewed in consideration of the range of the CI. CIs are based on a specific level of confi-dence. Most CIs are calculated using 95% confidence, meaning if the experiment were repeated 100 times, the true value would be obtained within that interval 95 times. However, Hopkins6 recommends using a CI of 90%, which provides a wider interval and greater margin of error.
In the literature, researchers report the PE and inter-val, and a range of uncertainty (CI) with a confidence level, which may be reported by, “mean value = 0.3 (95% CI, -0.1 to 0.7)”. A CI may also be reported as a “+/-” value, such as 0.3 +/- 0.4. Clinically interpreted, these notations would infer: The between group dif-ference in this study sample was 0.3, with the true value represented in a range of -0.1 to 0.7 in the pop-ulation. Subsequent notations within a manuscript may simply report the point estimate and CI, as in, “0.3(-0.1,0.7).” Clinical researchers are encouraged to
clearly report descriptive means and standard devia-tions along with mean differences, effect sizes, and CIs, as suggested in Table 2.
Graphical representation of CIs often helps demon-strate their clinical value and interpretation. Figure 2 provides and example of several types of graphs representing point estimates and CIs. A line graph (Figure 2b) is typically recommended because of its ease of interpretation and comparison.
Unfortunately, some authors do not report CIs; how-ever, several free calculators are available online, including one from PEDro (http://www.pedro.org.au/english/downloads/confidence-interval-calcula-tor/). The CI is calculated from the representative sample value (PE), the standard error of the mean, and the “confidence coefficient,” which is deter-mined from the z-value corresponding to sample size and a specific confidence level (for example, a 95% CI generally has a 1.96 confidence coefficient value). The CI is determined by using the formula:
CI = Point estimate +/- confidence coefficient * standard error.
Therefore, the upper and lower bounds of the CI represent the equivalent “+/-” of the confidence val-ues. The standard error is calculated by the standard deviation divided by the square root of the sample size. The smaller the standard error of the mean, the narrower the confidence interval, and the more accurate the estimate.
Table 2. Suggested format for reporting data in clinical studies Mean + SD
Pre Post Mean Diff + SD % Diff Effect Size CI (95%) p-value
Experimental Control
Figure 2. Confi dence intervals presented as a curve graph (a), line graph (b), and bar graph (c), each representing a point estimate and CI of 0.3(-0.1,0.7).

The International Journal of Sports Physical Therapy | Volume 9, Number 5 | October 2014 | Page 732
There are several things to consider when evalu-ating a CI for assessments of clinical significance, including the type of point estimate; value and loca-tion of the point estimate and CI relative to zero; harm/benefit potential; the width and symmetry of the CI; and the MCID.
Type of point estimate. Point estimates and CIs can be used to demonstrate several types of out-come values, including sample means, group differ-ences, effect sizes, and odds/risk ratios (Figure 3). It’s important to note what the PE represents when interpreting a CI. Evaluating a mean difference within a CI is different than evaluating an effect size with a CI.
For example, interpreting the CI of a mean value of a sample is relatively straight-forward; the CI rep-resents the range of possible values containing the true value of the population. For CIs representing effect sizes and differences between groups, inter-pretation requires more considerations. The PE of an effect size provides the context to help determine if the result is strong or weak, as well as whether it is clinically useful19. The location and size of the CI also are important to consider.
Point estimate and CI relative to 0. The relation-ship of the point estimate and CI to zero provides valu-able information in CIs representing effects or group differences. Obviously, point estimates further from 0 represent more effect or difference, either positive
or negative. Similarly, the closer to 0, the less group difference or effect. Interestingly, CIs can be used with hypothesis testing and are therefore related to statistical significance. If the CI of a mean difference, effect size, OR, or RR does not contain a value of 0, the results are significant. Other types of point esti-mates, such as sample means, may contain 0 and still be significant statistically. It’s important to note that studies with large effect sizes and small CIs that do not cross zero have the most clinical significance.
Harm/Benefit potential. Using Cohen’s d-value (discussed earlier) or standardized effect sizes, the PE and CI can provide information on the magni-tude and direction of the effect as well as potentially beneficial or harmful effects. The location of the point estimate determines if the outcome is con-sidered harmful, beneficial, or trivial1 (Figure 4). A positive effect size greater than 0.2 is considered beneficial, while a negative effect size less than -0.2 is considered harmful. Effect sizes between -0.2 and 0.2 are trivial in size.
Width and symmetry of the CI. The width of the CI provides clarity regarding the magnitude of the treatment effect or group differences. A wide CI (usually representing a small sample size) has more uncertainty and may suggest that study findings are unclear if it spans all 3 levels of magnitude (harmful,
Figure 3. Graphical representation of different types of CI: point estimate (a); effect size (b); odds ratio (c).
Figure 4. Harmful, trivial, and benefi cial ranges within a CI representing effect sizes. Adapted from Batterham & Hop-kins2.

The International Journal of Sports Physical Therapy | Volume 9, Number 5 | October 2014 | Page 733
trivial and beneficial). With small sample sizes, CIs are more important than examination for statistically significant differences, which are affected by sample size. In contrast, large samples yield narrow CIs, which help clinicians determine the smallest amount of benefit to justify therapy within a smaller margin of error. When interpreting a study result with CIs, an outcome may be statistically insignificant and yet clinically significant in a wide CI. For example, con-sider a between group difference CI of 0.8(-3,19) in a small population. While the CI contains 0 (statisti-cally insignificant), the CI remains relatively large, particularly in the positive range; therefore, the con-clusion should be that the intervention might be ben-eficial, but larger sample sizes are needed.
While the difference between the point estimate and the upper and lower boundaries is usually equal (the “+/-” value), the CI may not be symmetrical. For exam-ple, when the CI of odds ratios are reported, there is a natural skew in the interval because the CI is calculated on a natural log value. In this case, the actual upper and lower boundaries of the CI would be reported, rather than using a “+/-” value with the point estimate.
MCID. It’s helpful to know the MCID when inter-preting the CI. By comparing the treatment outcome with the MCID, clinicians can determine if the treat-ment will be beneficial or harmful to their patients. Combining the MCID with the CI is a very valuable strategy to be utilized for clinical interpretation, especially when hypothesis testing reveals no statis-tically significant differences.
If the MCID falls within the CI, the treatment may be clinically effective regardless of the PE. Recall that the CI represents the range of values in which the true value exists within a population if the study were repeated. Obviously, if the PE exceeds the MCID, the treatment was effective. In the between group differ-ences CI example described previously, 0.3(-0.1, 0.7), if the MCID is known to be 0.2, the treatment may be clinically effective since it exceeds the point estimate. If the MCID falls within the CI, yet remains below the point estimate, the clinician needs to decide if the treatment is appropriate or not. In an example of a clinical trial, two groups of patients with shoul-der pain were compared: one received traditional therapy (control group) for 6 weeks, while another group (experimental) received a different therapy
for 6 weeks. A primary outcome of shoulder exter-nal rotation range of motion (ROM) was measured before and after the treatment and compared within and between groups (Repeated-Measures ANOVA for statistically significant differences). The experimen-tal group increased in their external rotation ROM on average from 60 to 68 degrees (a difference of 8 degrees), while the control group increased from 60 to 64 degrees (a difference of 4 degrees); therefore, the mean difference between groups is 4 degrees. The statistical analysis revealed no significant differ-ence between groups; however, clinical interpreta-tion of the results may lead to a different conclusion.
Assume an increase of 10 degrees of external rota-tion ROM would be the MCID to convince a clinician to change their treatment. In the clinical example above, the mean increase in external rotation ROM in the experimental group was 8 degrees, falling below the MCID, which may not be enough for a clinician to change their treatment. However, if the CI was (4,12), note that the MCID (10 degrees) still falls within the CI; thus it is possible for some patients to reach and even exceed the MCID to 12 degrees (the upper bound of the CI) (Figure 5). If the confidence interval is not harmful and beyond trivial, clinicians might consider the treatment in some patients. The clinician may consider that while the point estimate of the sample did not reach minimal clinical importance, the CI still contains the MCID within the true population, and further research with larger samples are warranted.
Figure 5. Line graph of CI 8(4,12) and MCID of 10. Note that the CI still contains the MCID; therefore, the treatment may be benefi cial but a larger sample is needed.

The International Journal of Sports Physical Therapy | Volume 9, Number 5 | October 2014 | Page 734
MAGNITUDE-BASED INFERENCESBecause of the aforementioned limitations of hypoth-esis testing in clinical research, researchers are slowly moving away from relying solely on hypoth-esis testing to interpretation of other outcomes in clinical studies. Magnitude-based inferences (MBI) are now being used to avoid limitations of traditional statistical analysis (null and directional hypothesis testing) in relation to clinical significance.6
Magnitude-based inferences use qualitative rather than statistical descriptions of study outcomes. Confidence intervals can provide magnitude of dif-ferences or effect through MBI. As stated earlier, Batterham and Hopkins1 suggest three levels of magnitude of change: harmful, trivial, and benefi-cial. Obviously, these three levels are important for clinicians to consider when making evidence-based decisions; the location and width of the CI on an out-come continuum can be clinically interpreted using these three levels. The outcome continuum should include the threshold value for beneficial (MCID, MIC, etc) as well as harmful outcomes.
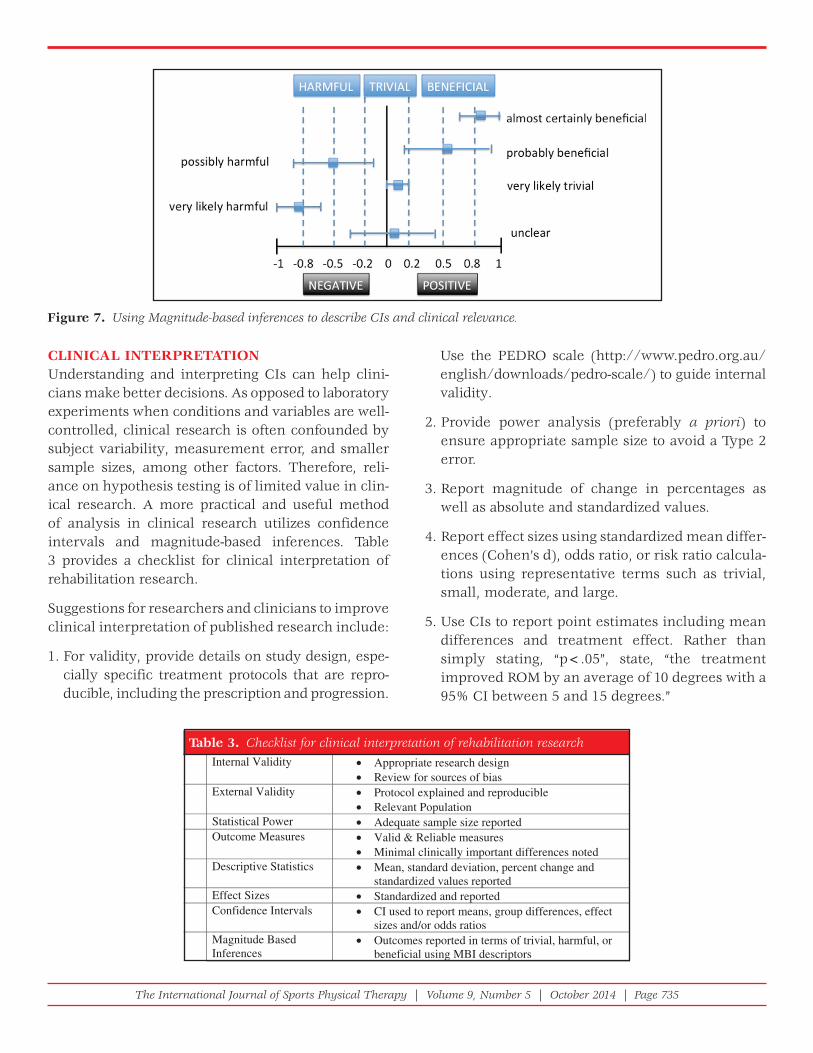
Hopkins et al6 recommend more qualitative state-ments (such as “probably,” “possibly,” and “likely”) to reflect the uncertainty of the true value, while avoid-ing the use of “statistical jargon.” These qualitative terms can be combined with the three levels of mag-nitude (beneficial, harmful, trivial) in order to fur-ther refine the possible outcome value represented by the CI (Figure 7). Traditional statistical packages do not provide magnitude-based inferences; instead a spreadsheet can be used to assess and infer the clini-cal magnitude.22 Obviously, the MBI that represent harmful or beneficial outcomes provide more clinical information for decision-making than simply stating, “There was no statistically significant difference.”
In their article, Batterham and Hopkins1 summarize the value of MBI in clinical interpretation of research:
“A final decision about acting on an outcome should be made on the basis of the quantitative chances of benefit, triviality, and harm, taking into account the cost of implementing a treatment or other strategy, the cost of making the wrong decision, the possibility of individual response to the treatment, and the possibility of harmful side effects.”
It is important to consider the population being studied when interpreting CIs. For example, Hop-kins et al21 discussed how competitive elite athletes value very small percentages of improvement for performance enhancement: a 1% increase in speed during a 100 meter sprint may be the difference between first and second place. They suggested that laboratory-based studies or studies on non-elite ath-lete cohorts cannot be generalized for performance enhancement of elite athletes, and recommended reporting percent changes as well as confidence intervals for utilization in performance enhance-ment outcomes. For example, if a 1% improvement is meaningful, and a RCT shows no significant dif-ference between two groups of elite athletes, but the CI contains the meaningful improvement (eg, 0.5 to 1.5%), there exists a possibility that an athlete would benefit from the intervention. In contrast, a CI that does not contain the meaningful difference (eg, 0.1 to 0.9%) may not be worthy of using even if the results were statistically significant.
Meta-analyses use CIs to describe the effectiveness of treatments by pooling data from several homog-enous studies in an effort to pool standardize effect sizes, often using Cohen’s d-value or other standard-ized difference. Most meta analyses use a “forest plot” rather than a bell-shaped curve to graphically represent the effects of various studies. Forest plots use lines or bars to represent various CIs of different studies and a “summary point estimate,” represent-ing the overall effect of the pooled studies. This type of graphical representation (Figure 6) is often useful to get the “total picture” of the multiple studies con-tained within in a meta-analysis.
Figure 6. Forest plot used in meta-analysis studies to sum-marize the effects of different studies.
The International Journal of Sports Physical Therapy | Volume 9, Number 5 | October 2014 | Page 735
Use the PEDRO scale (http://www.pedro.org.au/english/downloads/pedro-scale/) to guide internal validity.
2. Provide power analysis (preferably a priori) to ensure appropriate sample size to avoid a Type 2 error.
3. Report magnitude of change in percentages as well as absolute and standardized values.
4. Report effect sizes using standardized mean differ-ences (Cohen’s d), odds ratio, or risk ratio calcula-tions using representative terms such as trivial, small, moderate, and large.
5. Use CIs to report point estimates including mean differences and treatment effect. Rather than simply stating, “p<.05”, state, “the treatment improved ROM by an average of 10 degrees with a 95% CI between 5 and 15 degrees.”
CLINICAL INTERPRETATIONUnderstanding and interpreting CIs can help clini-cians make better decisions. As opposed to laboratory experiments when conditions and variables are well-controlled, clinical research is often confounded by subject variability, measurement error, and smaller sample sizes, among other factors. Therefore, reli-ance on hypothesis testing is of limited value in clin-ical research. A more practical and useful method of analysis in clinical research utilizes confidence intervals and magnitude-based inferences. Table 3 provides a checklist for clinical interpretation of rehabilitation research.
Suggestions for researchers and clinicians to improve clinical interpretation of published research include:
1. For validity, provide details on study design, espe-cially specific treatment protocols that are repro-ducible, including the prescription and progression.
Figure 7. Using Magnitude-based inferences to describe CIs and clinical relevance.
Table 3. Checklist for clinical interpretation of rehabilitation research Internal Validity • Appropriate research design
• Review for sources of bias External Validity • Protocol explained and reproducible
• Relevant Population Statistical Power • Adequate sample size reported Outcome Measures • Valid & Reliable measures
• Minimal clinically important differences noted Descriptive Statistics • Mean, standard deviation, percent change and
standardized values reported Effect Sizes • Standardized and reported Confidence Intervals • CI used to report means, group differences, effect
sizes and/or odds ratios Magnitude Based
Inferences • Outcomes reported in terms of trivial, harmful, or
beneficial using MBI descriptors

The International Journal of Sports Physical Therapy | Volume 9, Number 5 | October 2014 | Page 736
8. Copay AG, Subach BR, Glassman SD, Polly DW, Jr., Schuler TC. Understanding the minimum clinically important difference: a review of concepts and methods. Spine J. Sep-Oct 2007;7(5):541-546.
9. Jaeschke R, Singer J, Guyatt GH. Measurement of health status. Ascertaining the minimal clinically important difference. Control Clin Trials. Dec 1989;10(4):407-415.
10. Guyatt GH, Osoba D, Wu AW, Wyrwich KW, Norman GR, Clinical Signifi cance Consensus Meeting G. Methods to explain the clinical signifi cance of health status measures. Mayo Clin Proc. Apr 2002;77(4):371-383.
11. Holmgren T, Oberg B, Adolfsson L, Bjornsson Hallgren H, Johansson K. Minimal important changes in the Constant-Murley score in patients with subacromial pain. J Shoulder Elbow Surg. Apr 13 2014.
12. Ostelo RW, de Vet HC. Clinically important outcomes in low back pain. Best practice & research. Clinical rheumatology. Aug 2005;19(4):593-607.
13. Wyrwich KW. Minimal important difference thresholds and the standard error of measurement: is there a connection? Journal of biopharmaceutical statistics. Feb 2004;14(1):97-110.
14. Lemieux J, Beaton DE, Hogg-Johnson S, Bordeleau LJ, Goodwin PJ. Three methods for minimally important difference: no relationship was found with the net proportion of patients improving. Journal of clinical epidemiology. May 2007;60(5):448-455.
15. Helewa AW, J. M. Critical evaluation fo research in physical therapy. Philadelphia: Saunders; 2000.
16. Portney LG, Watkins MP. Foundations of clinical research: applications to practcie. 3rd ed. New Jersey: Pearson Prentice Hall; 2009.
17. Cohen J. Statistical power analysis for the behavioral sciences. 2nd ed. New Jersey: Lawrence Eribaum; 1988.
18. Borenstein M. The case for confi dence intervals in controlled clinical trials. Control Clin Trials. Oct 1994;15(5):411-428.
19. Greenfi eld ML, Kuhn JE, Wojtys EM. A statistics primer. Confi dence intervals. Am J Sports Med. Jan-Feb 1998;26(1):145-149.
20. Drinkwater E. Applications of confi dence limits and effect sizes in sport research. Open Sports Sciences J. 2008;1:3-4.
21. Hopkins WG, Hawley JA, Burke LM. Design and analysis of research on sport performance enhancement. Med Sci Sports Exerc. Mar 1999;31(3):472-485.
22. Hopkins WG. A spreadsheet for deriving a confi dence interval, mechanistic inference and clinical inference from a p value. Sportscience. 2007;11:16-20.
6. Provide clinical interpretation of the CI with regards to the point estimate and width. For exam-ple, “While statistically insignificant, the findings are unclear and larger study samples are needed.”
7. Provide results relative to clinically meaningful dif-ferences or minimal clinically important changes.
8. Provide results in terms of magnitude-based infer-ences where possible, using terms relative to harmful, beneficial, or trivial, including qualitative terms such as “probably” and “almost certainly.”
CONCLUSIONClinical researchers need to present clinically mean-ingful results, and clinicians need to know how to interpret and implement those results in their evi-dence-based approach to clinical decision making. Interpretation of clinical research outcomes should not be based solely on the presence or absence of sta-tistically significant differences. Because of the het-erogeneity of patient samples, small sample sizes, and limitations on hypothesis testing, clinicians should consider other clinically-relevant measures such as effect size, clinically meaningful differences, confi-dence intervals, and magnitude-based inferences.
REFERENCES 1. Batterham AM, Hopkins WG. Making meaningful
inferences about magnitudes. Int J Sports Physiol Perform. Mar 2006;1(1):50-57.
2. Page P. Research designs in sports physical therapy. International journal of sports physical therapy. Oct 2012;7(5):482-492.
3. Group OLoEW. The Oxford 2011 Levels of Evidence. 2011; http://www.cebm.net/index.aspx?o=5653. Accessed August 29, 2014.
4. Grant HM, Tjoumakaris FP, Maltenfort MG, Freedman KB. Levels of Evidence in the Clinical Sports Medicine Literature: Are We Getting Better Over Time? Am J Sports Med. Apr 23 2014;42(7):1738-1742.
5. de Morton NA. The PEDro scale is a valid measure of the methodological quality of clinical trials: a demographic study. Aust J Physiother. 2009;55(2):129-133.
6. Hopkins WG, Marshall SW, Batterham AM, Hanin J. Progressive statistics for studies in sports medicine and exercise science. Med Sci Sports Exerc. Jan 2009;41(1):3-13.
7. Sainani KL. Putting P values in perspective. PM & R : the journal of injury, function, and rehabilitation. Sep 2009;1(9):873-877.