beyond routine forecast services, gregory waller
TRANSCRIPT
Beyond Routine Forecast Services – NWS West Gulf River Forecast Center’s Approach to Impact
Decision Support
Gregory WallerService Coordination Hydrologist
NWS – West Gulf River Forecast Center
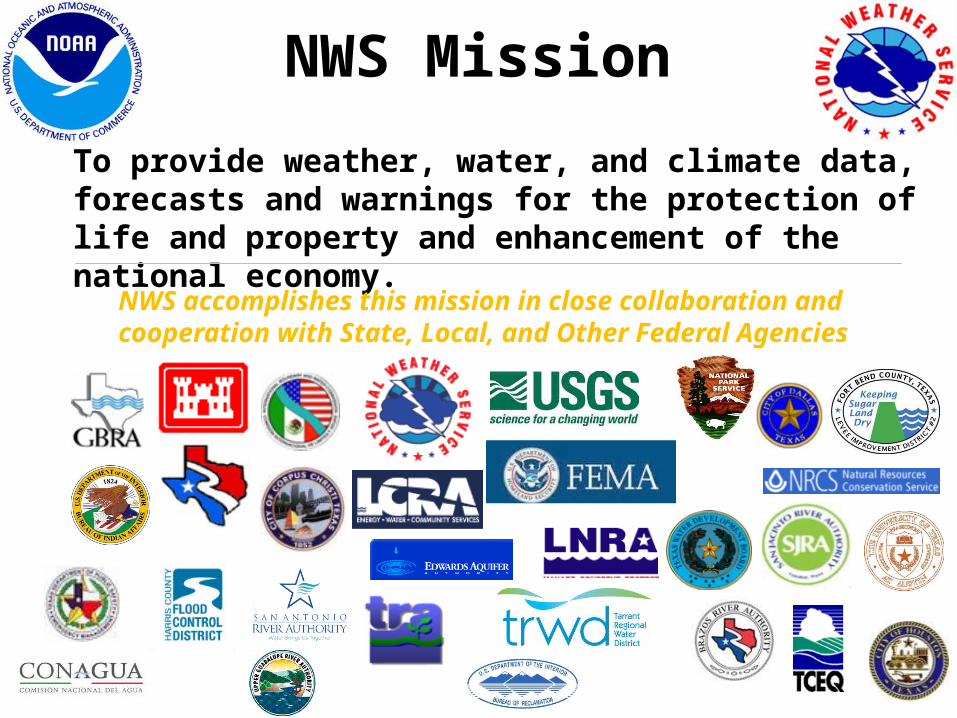
NWS Mission
To provide weather, water, and climate data, forecasts and warnings for the protection of life and property and enhancement of the national economy.
NWS accomplishes this mission in close collaboration and cooperation with State, Local, and Other Federal Agencies
NWS River Forecast Centers
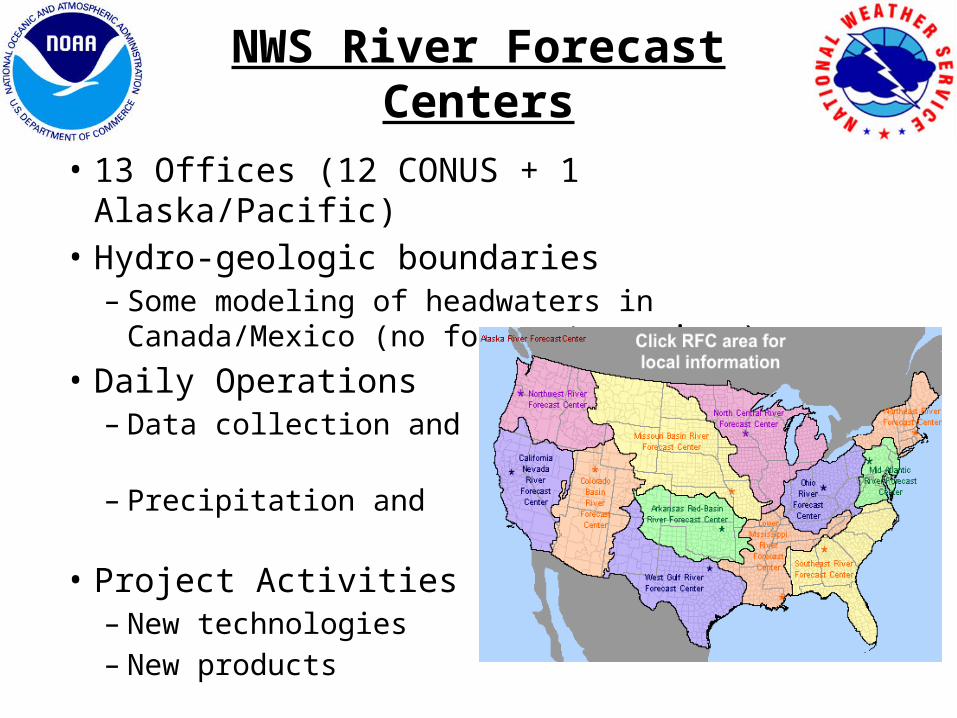
• 13 Offices (12 CONUS + 1 Alaska/Pacific)• Hydro-geologic boundaries
– Some modeling of headwaters in Canada/Mexico (no forecast services)
• Daily Operations– Data collection and quality
control– Precipitation and Hydrologic
Forecasts• Project Activities
– New technologies– New products
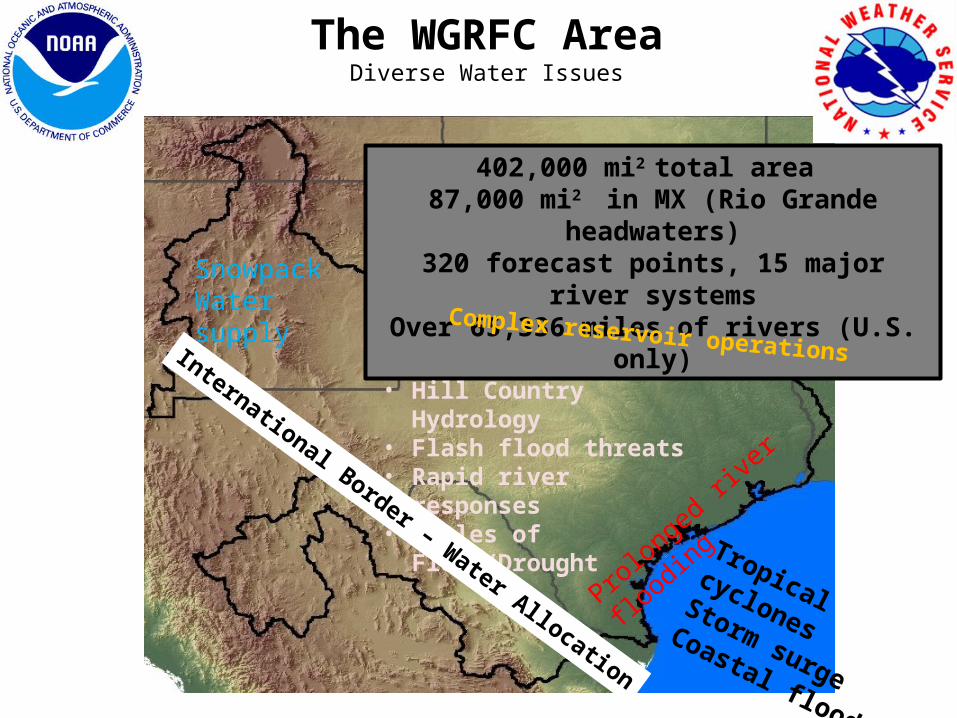
The WGRFC AreaDiverse Water Issues
402,000 mi2 total area 87,000 mi2 in MX (Rio Grande headwaters)320 forecast points, 15 major river systems
Over 65,336 miles of rivers (U.S. only)Snowpack Water supply
• Hill Country Hydrology• Flash flood threats• Rapid river responses• Cycles of Flood/Drought
Tropical cyclones
Storm surge Coastal flooding
Prolonged river fl
oodingInternational Border – Water Allocation
Complex reservoir operations
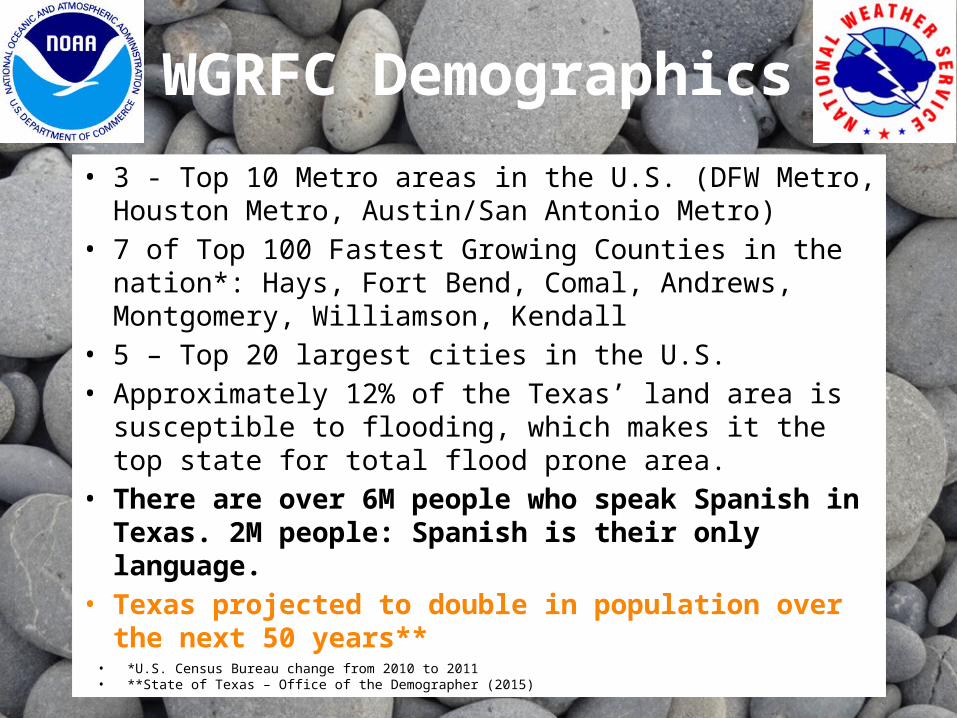
WGRFC Demographics• 3 - Top 10 Metro areas in the U.S. (DFW Metro, Houston
Metro, Austin/San Antonio Metro)• 7 of Top 100 Fastest Growing Counties in the nation*:
Hays, Fort Bend, Comal, Andrews, Montgomery, Williamson, Kendall
• 5 – Top 20 largest cities in the U.S.• Approximately 12% of the Texas’ land area is susceptible
to flooding, which makes it the top state for total flood prone area.
• There are over 6M people who speak Spanish in Texas. 2M people: Spanish is their only language.
• Texas projected to double in population over the next 50 years**• *U.S. Census Bureau change from 2010 to 2011
• **State of Texas – Office of the Demographer (2015)
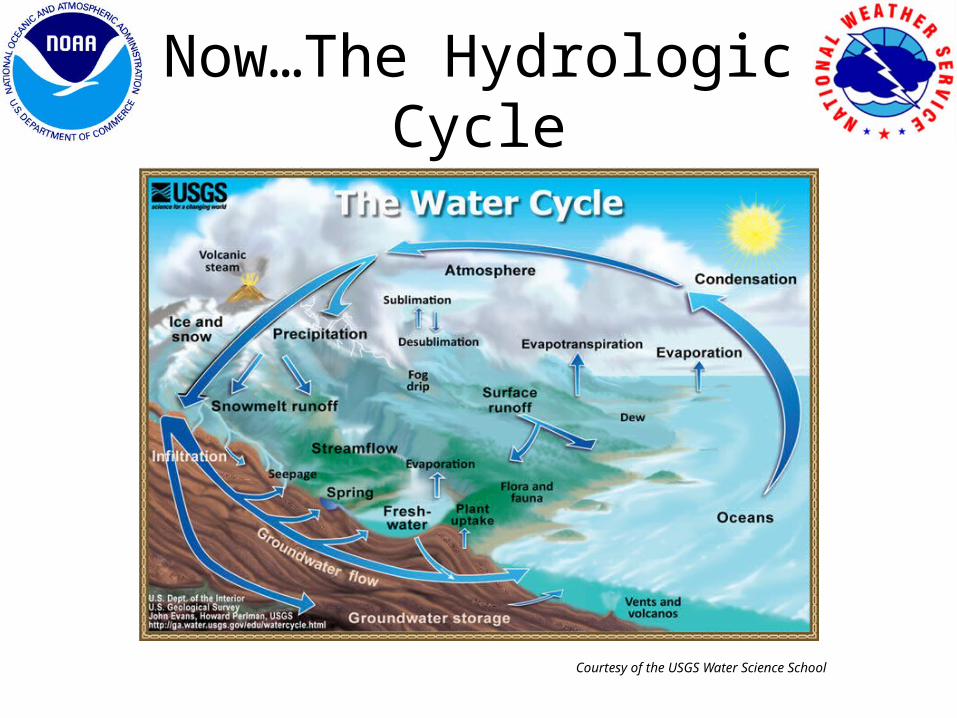
Now…The Hydrologic Cycle
Courtesy of the USGS Water Science School
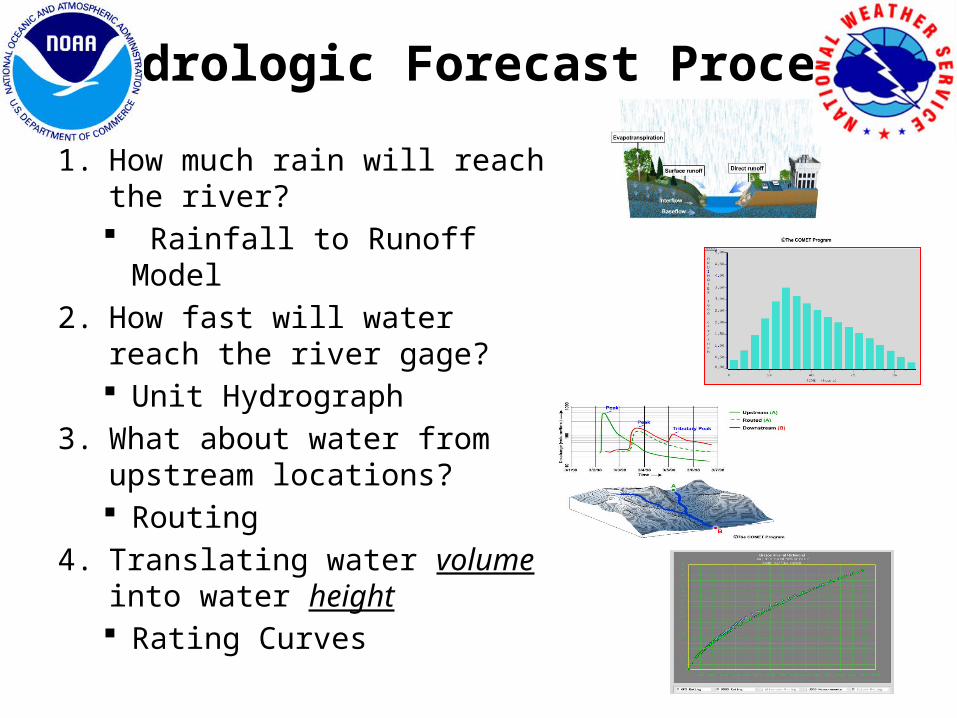
Hydrologic Forecast Process
1. How much rain will reach the river? Rainfall to Runoff Model
2. How fast will water reach the river gage? Unit Hydrograph
3. What about water from upstream locations? Routing
4. Translating water volume into water height Rating Curves
The Meteorology
• Past rainfall– Hourly– 4km grid
• Future rainfall– 6 hourly– Blend of model and human– At West Gulf RFC, we routinely use 12 hours of
future rainfall in our hydrologic forecasts (can extend on rare occasions)
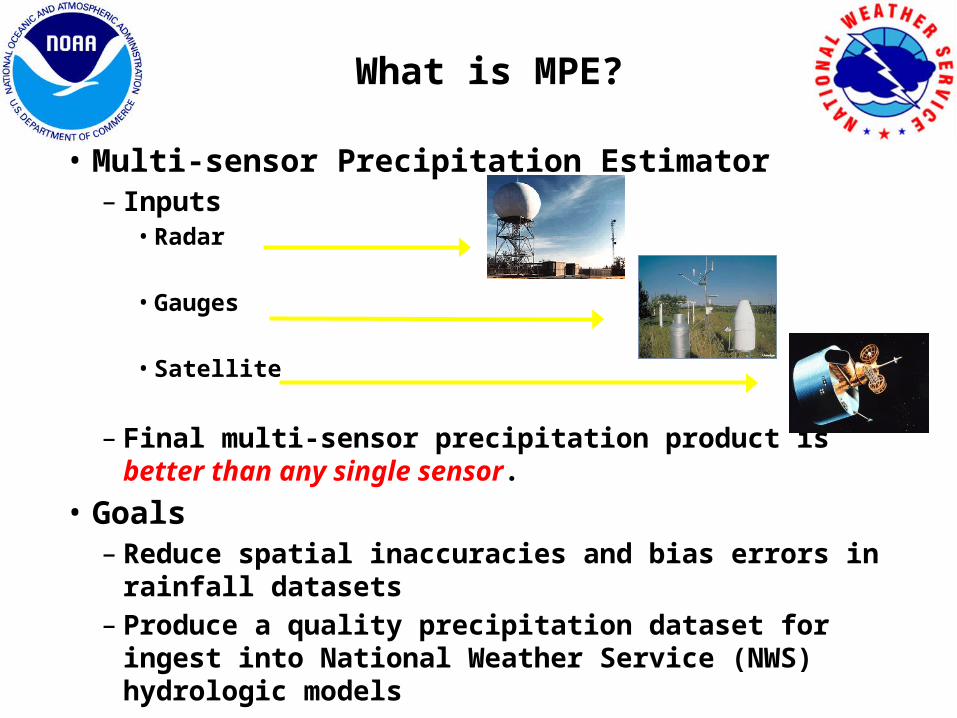
What is MPE?
• Multi-sensor Precipitation Estimator – Inputs
• Radar
• Gauges • Satellite
– Final multi-sensor precipitation product is better than any single sensor.
• Goals– Reduce spatial inaccuracies and bias errors in rainfall datasets– Produce a quality precipitation dataset for ingest into
National Weather Service (NWS) hydrologic models
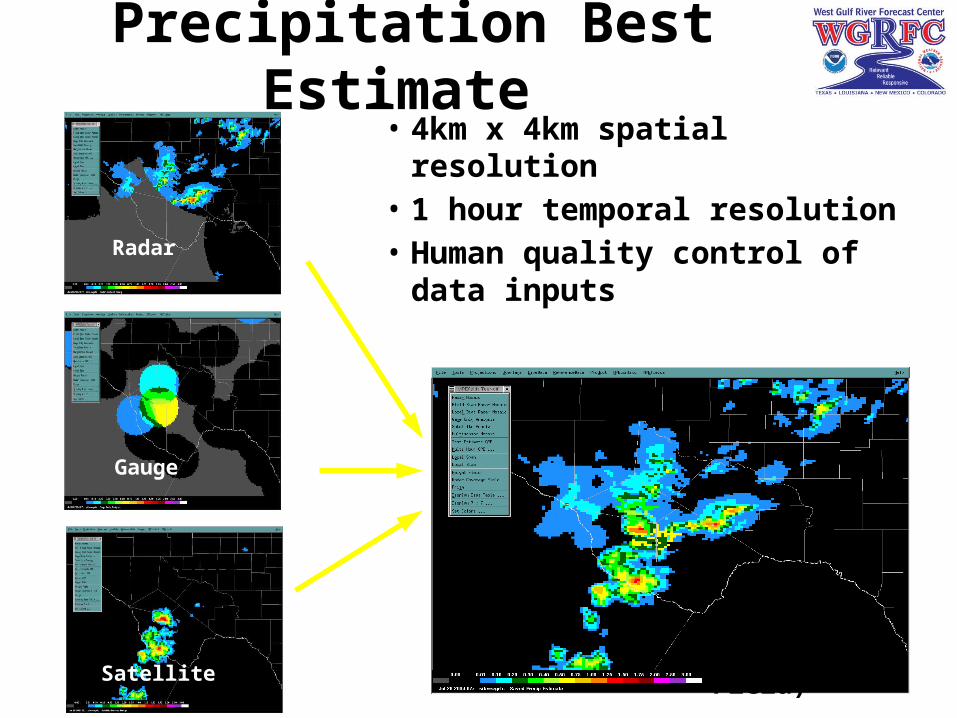
Precipitation Best Estimate • 4km x 4km spatial resolution• 1 hour temporal resolution• Human quality control of
data inputs
Gauge
Radar
Satellite
Best Estimate (Multi-sensor Field)
Satellite
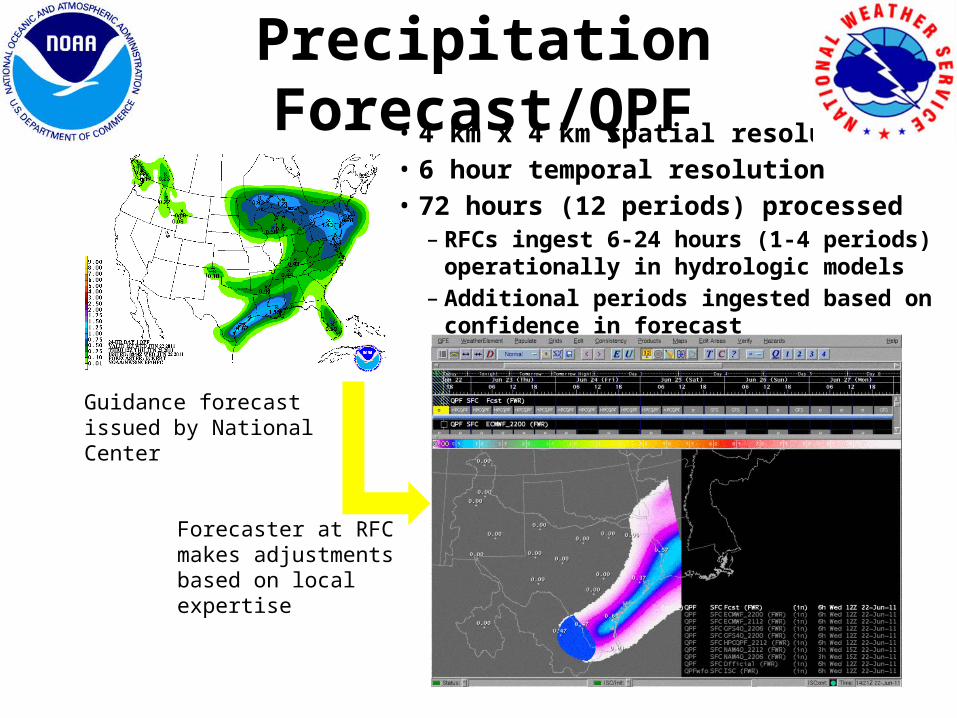
Precipitation Forecast/QPF• 4 km x 4 km spatial resolution• 6 hour temporal resolution• 72 hours (12 periods) processed
– RFCs ingest 6-24 hours (1-4 periods) operationally in hydrologic models
– Additional periods ingested based on confidence in forecast
Guidance forecast issued by National Center
Forecaster at RFC makes adjustments based on local expertise
The Hydro Model
• Community Hydrologic Prediction System• Hydrologic Model
– Think “more math, less physics”– Has capability of “plugging in” other models
Hydrologic Forecast Process
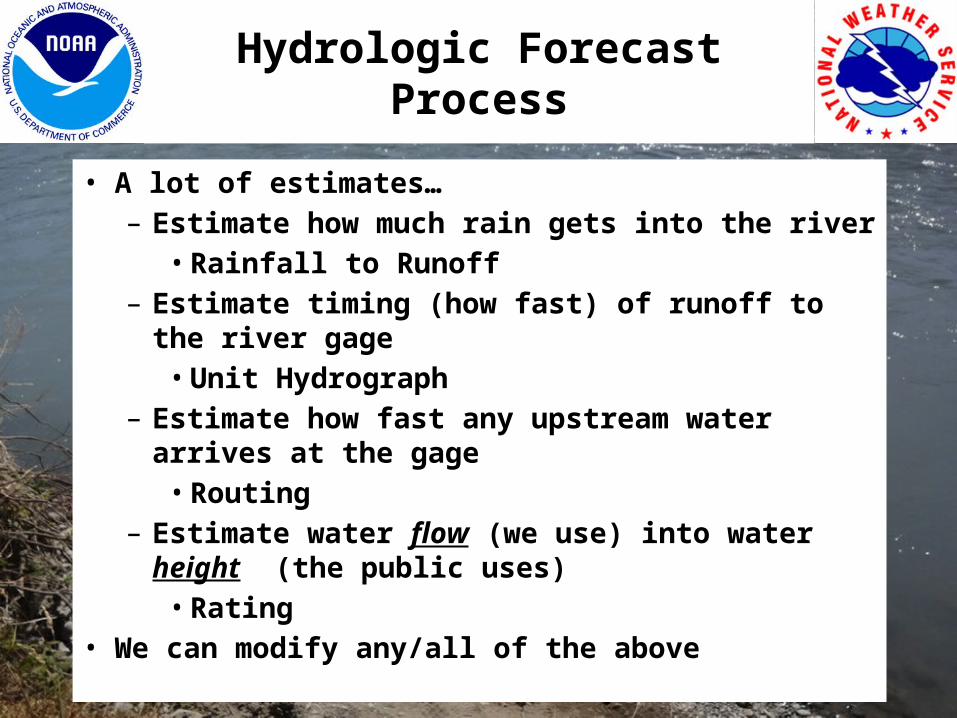
• A lot of estimates…– Estimate how much rain gets into the river
• Rainfall to Runoff– Estimate timing (how fast) of runoff to the river gage
• Unit Hydrograph– Estimate how fast any upstream water arrives at the
gage • Routing
– Estimate water flow (we use) into water height (the public uses)
• Rating• We can modify any/all of the above
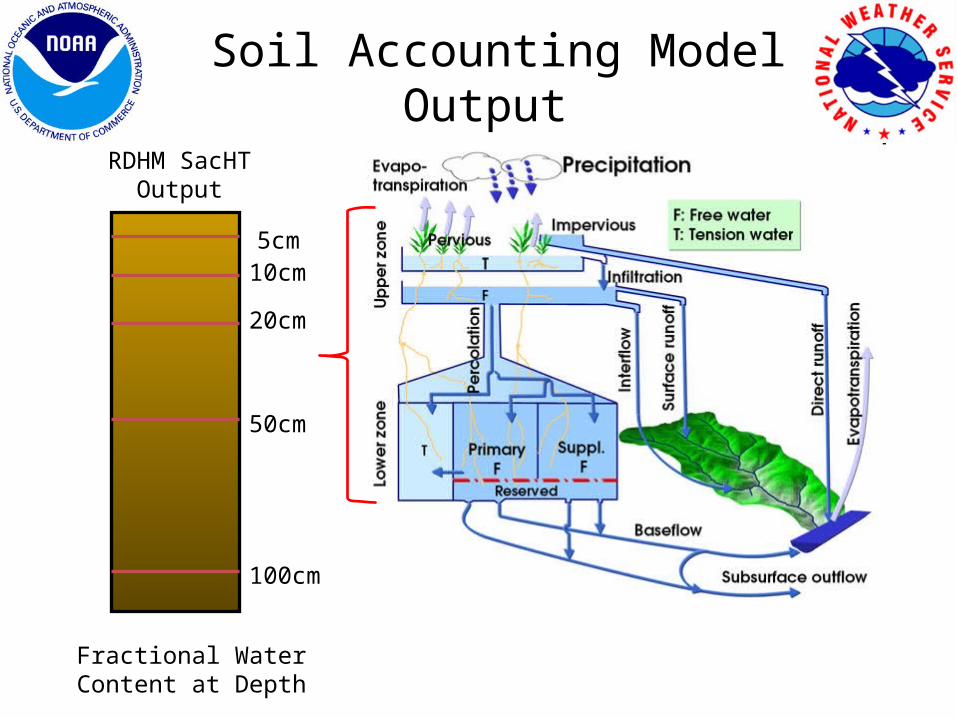
Soil Accounting Model Output
5cm10cm
20cm
50cm
100cm
Fractional Water Content at Depth
RDHM SacHT Output
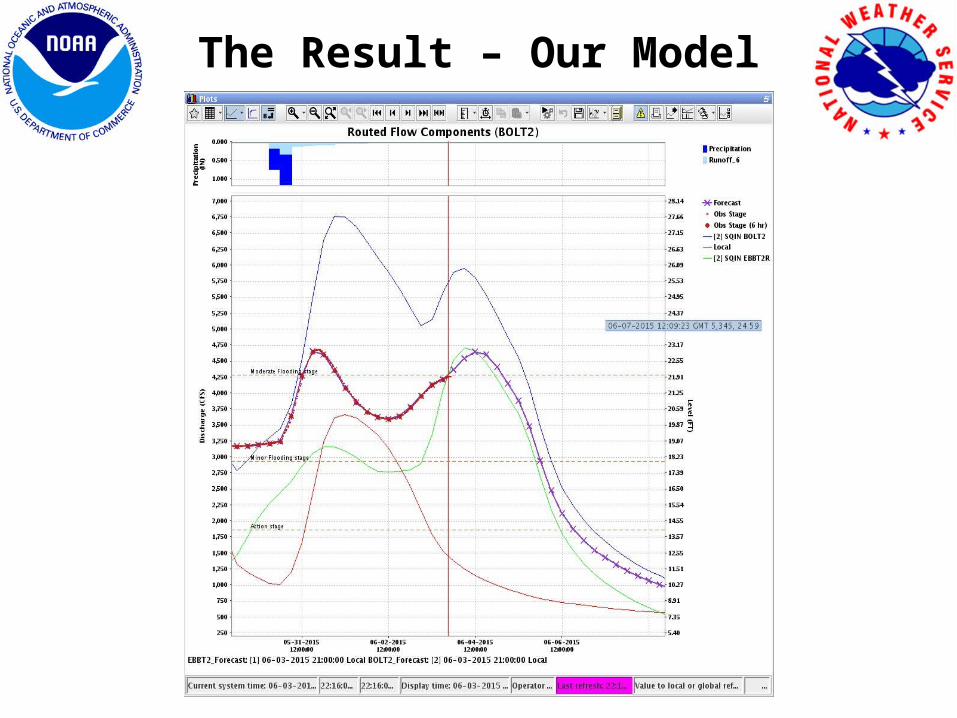
The Result – Our Model
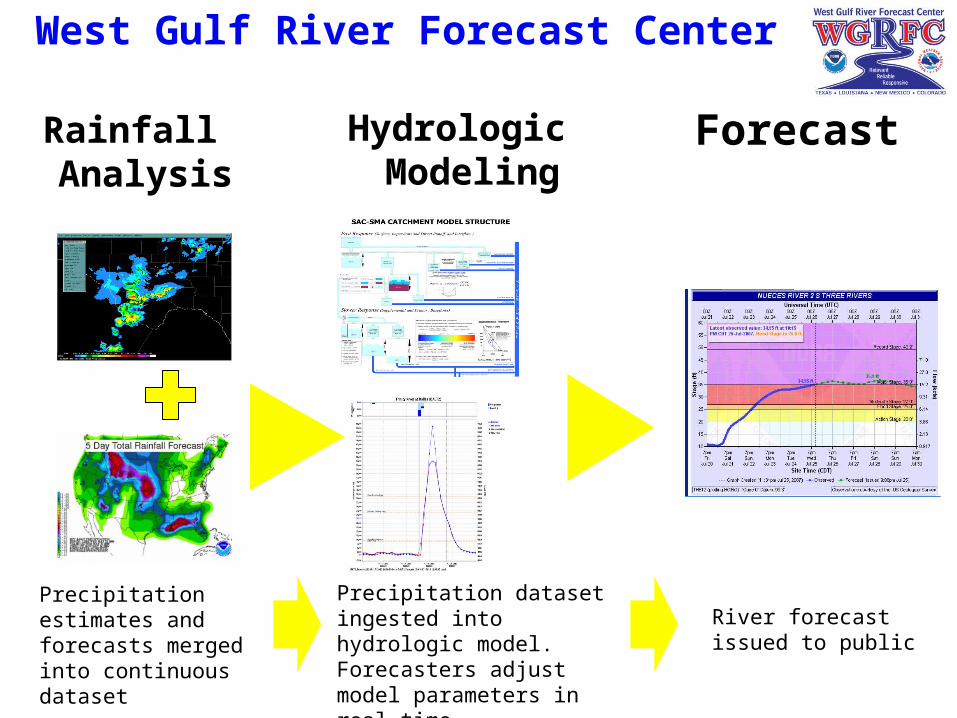
Precipitation estimates and forecasts merged into continuous dataset
Precipitation dataset ingested into hydrologic model. Forecasters adjust model parameters in real time
River forecast issued to public
Rainfall Analysis
Hydrologic Modeling
Forecast
West Gulf River Forecast Center

http://www.srh.noaa.gov/wgrfc/
River Forecast Center Website Features
HEADER: Shows worst current forecasted flood occurring in the area – Tabs cycle through rainfall and a quick briefing written daily by hydrologist and meteorologist
THE MAP: Squares represent points which forecasts are available for, triangles are reservoirs
HYDROGRAPH: Click on any site to see 3 days of observed levels and 5 days of forecasted levels (if a forecast is available)
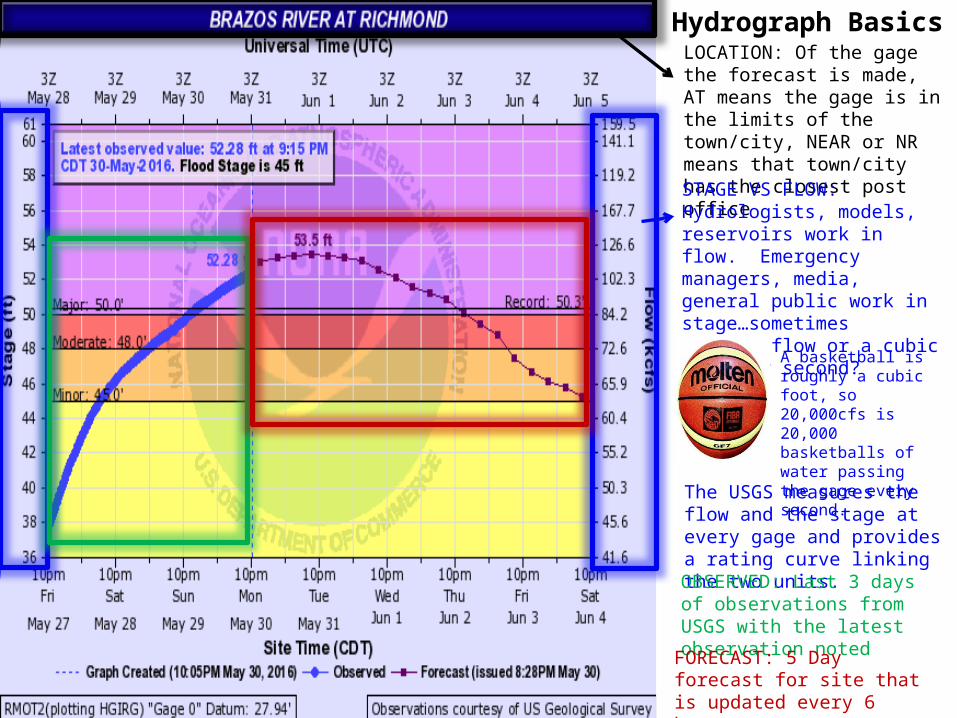
Hydrograph BasicsLOCATION: Of the gage the forecast is made, AT means the gage is in the limits of the town/city, NEAR or NR means that town/city has the closest post officeSTAGE VS FLOW: Hydrologists, models, reservoirs work in flow. Emergency managers, media, general public work in stage…sometimesWhat is flow or a cubic foot per second?
A basketball is roughly a cubic foot, so 20,000cfs is 20,000 basketballs of water passing the gage every second.
The USGS measures the flow and the stage at every gage and provides a rating curve linking the two units.OBSERVED: Last 3 days of observations from USGS with the latest observation noted
FORECAST: 5 Day forecast for site that is updated every 6 hours
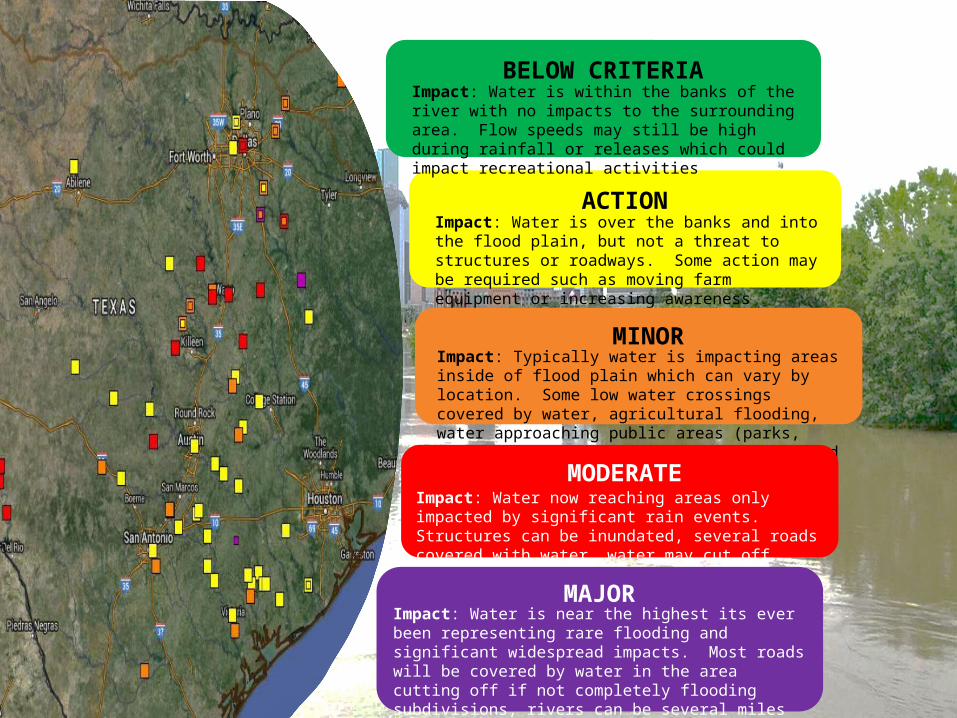
ACTIONImpact: Water is over the banks and into the flood plain, but not a threat to structures or roadways. Some action may be required such as moving farm equipment or increasing awareness
MINORImpact: Typically water is impacting areas inside of flood plain which can vary by location. Some low water crossings covered by water, agricultural flooding, water approaching public areas (parks, sidewalks etc.). Areas frequently flooded can expect to be impacted
MODERATEImpact: Water now reaching areas only impacted by significant rain events. Structures can be inundated, several roads covered with water, water may cut off certain areas, widespread agricultural flooding
MAJORImpact: Water is near the highest its ever been representing rare flooding and significant widespread impacts. Most roads will be covered by water in the area cutting off if not completely flooding subdivisions, rivers can be several miles wide in areas. Homes and structures underwater, bridges inundated and in danger of being hit by debris. Impacts may be greater than ever experienced.
BELOW CRITERIAImpact: Water is within the banks of the river with no impacts to the surrounding area. Flow speeds may still be high during rainfall or releases which could impact recreational activities
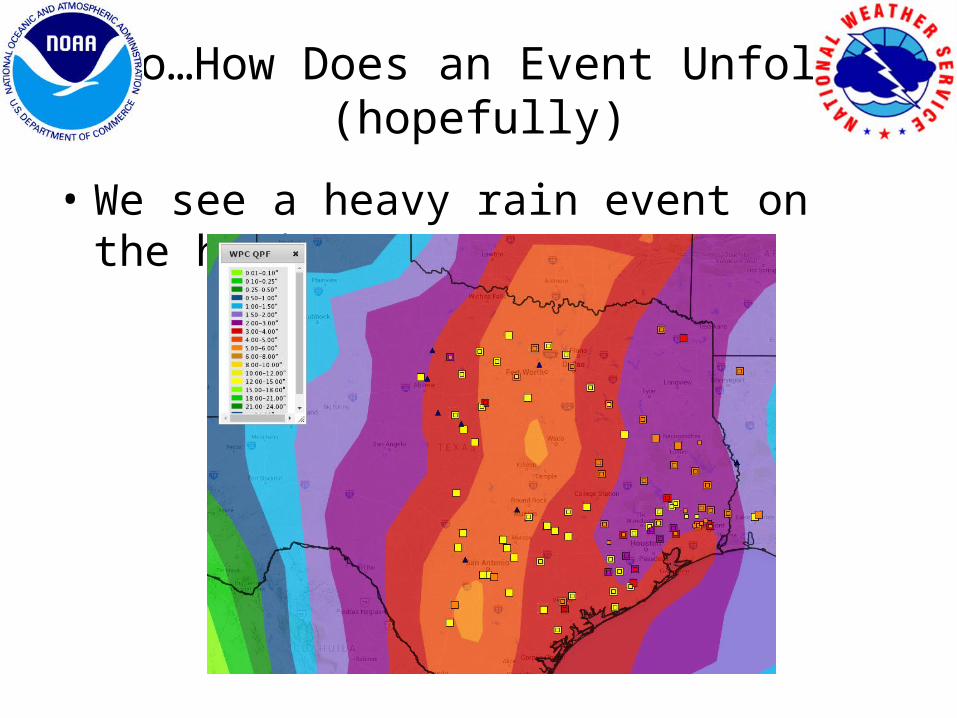
So…How Does an Event Unfold(hopefully)
• We see a heavy rain event on the horizon…
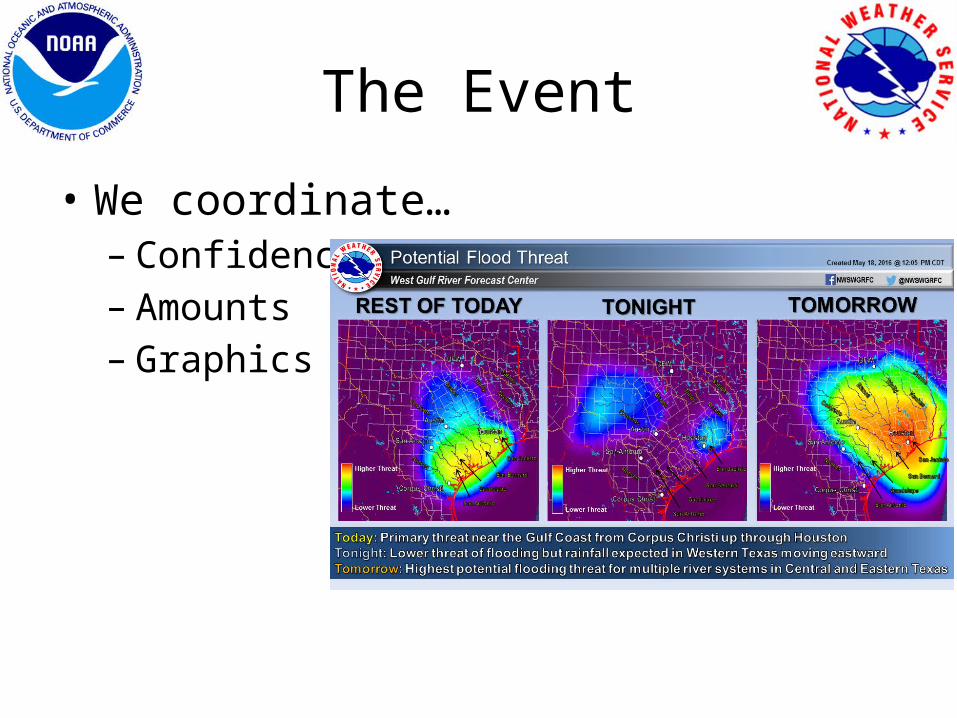
The Event
• We coordinate…– Confidence– Amounts– Graphics
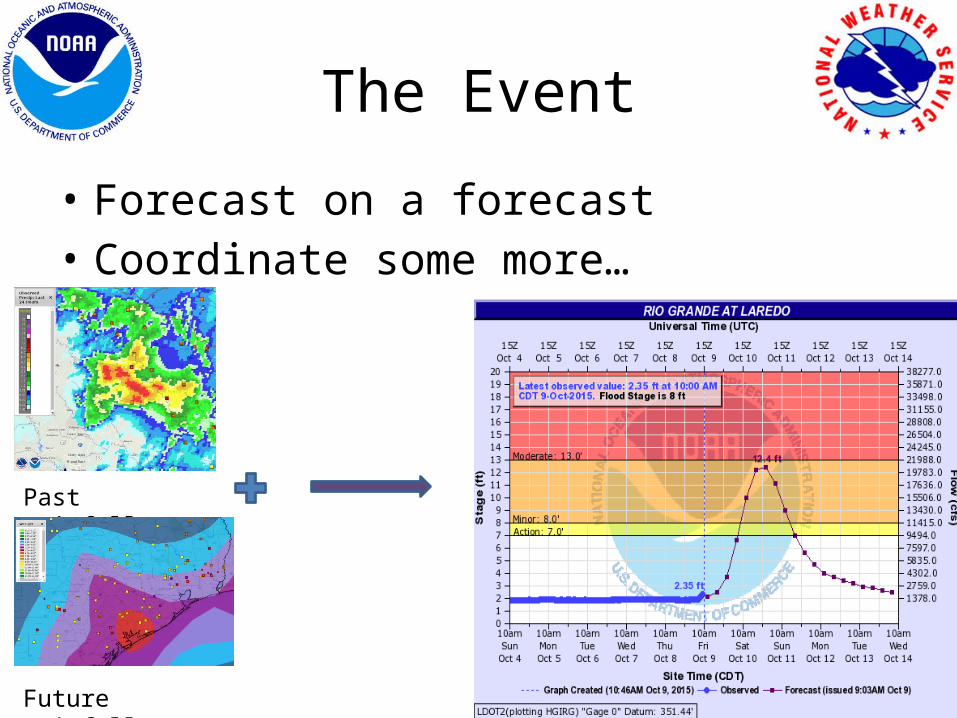
The Event
• Forecast on a forecast• Coordinate some more…
Past Rainfall
Future Rainfall
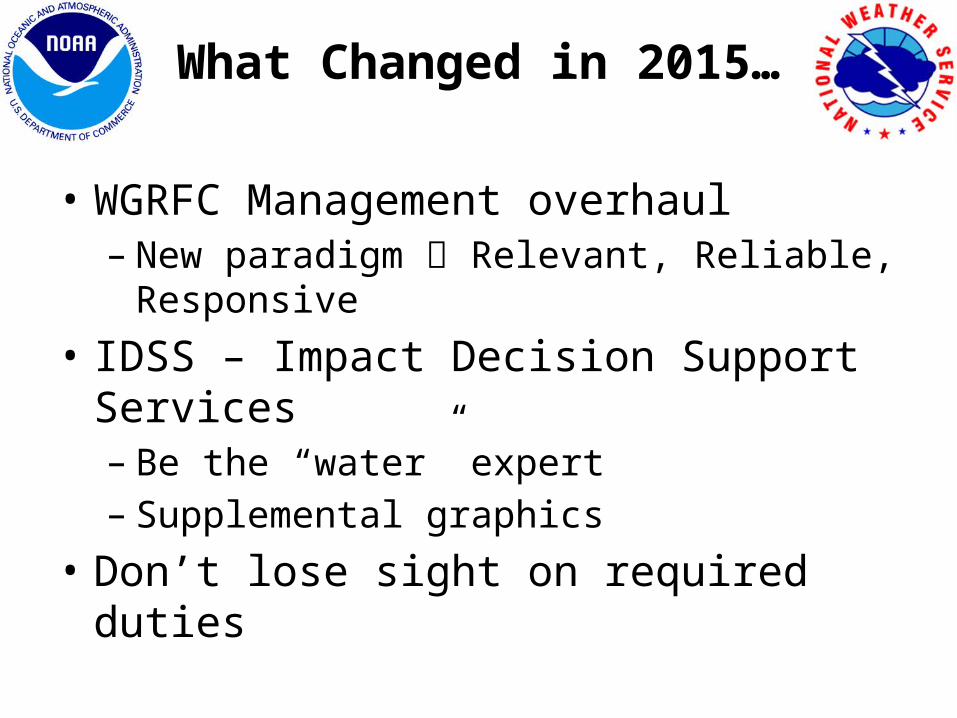
What Changed in 2015…
• WGRFC Management overhaul– New paradigm Relevant, Reliable, Responsive
• IDSS – Impact Decision Support Services– Be the “water” expert– Supplemental graphics
• Don’t lose sight on required duties
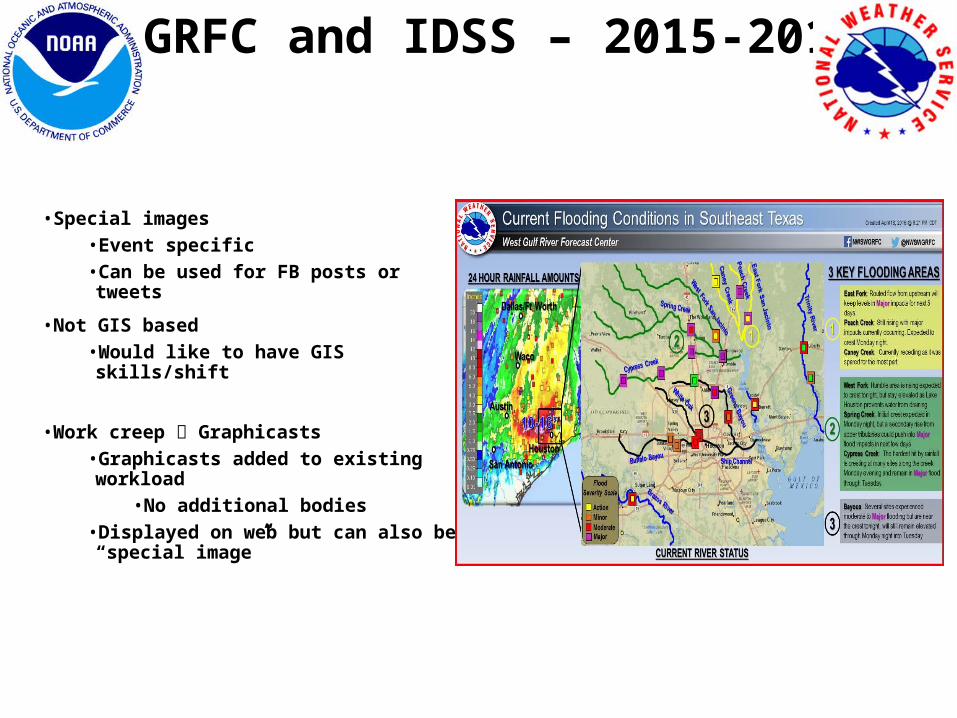
WGRFC and IDSS – 2015-2016
•Special images•Event specific•Can be used for FB posts or tweets
•Not GIS based•Would like to have GIS skills/shift
•Work creep Graphicasts•Graphicasts added to existing workload
• No additional bodies•Displayed on web but can also be “special image”
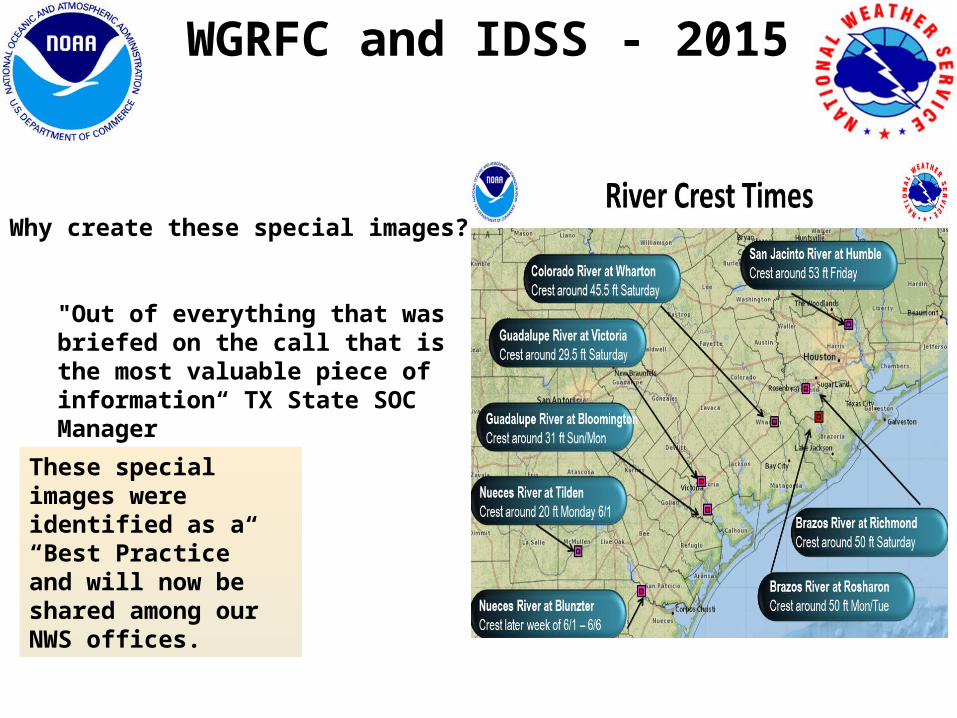
WGRFC and IDSS - 2015
Why create these special images?
"Out of everything that was briefed on the call that is the most valuable piece of information“ TX State SOC Manager
These special images were identified as a “Best Practice” and will now be shared among our NWS offices.
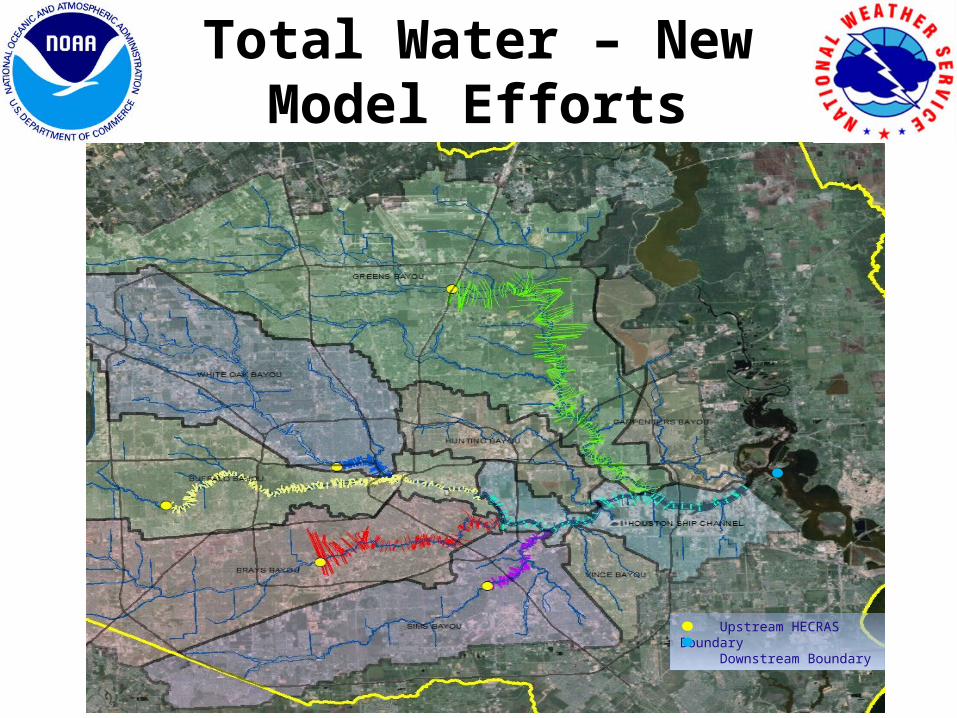
Upstream HECRAS Boundary Downstream Boundary
Total Water – New Model Efforts
The Future
• The National Water Center• University of Alabama• Bring federal water partners together…
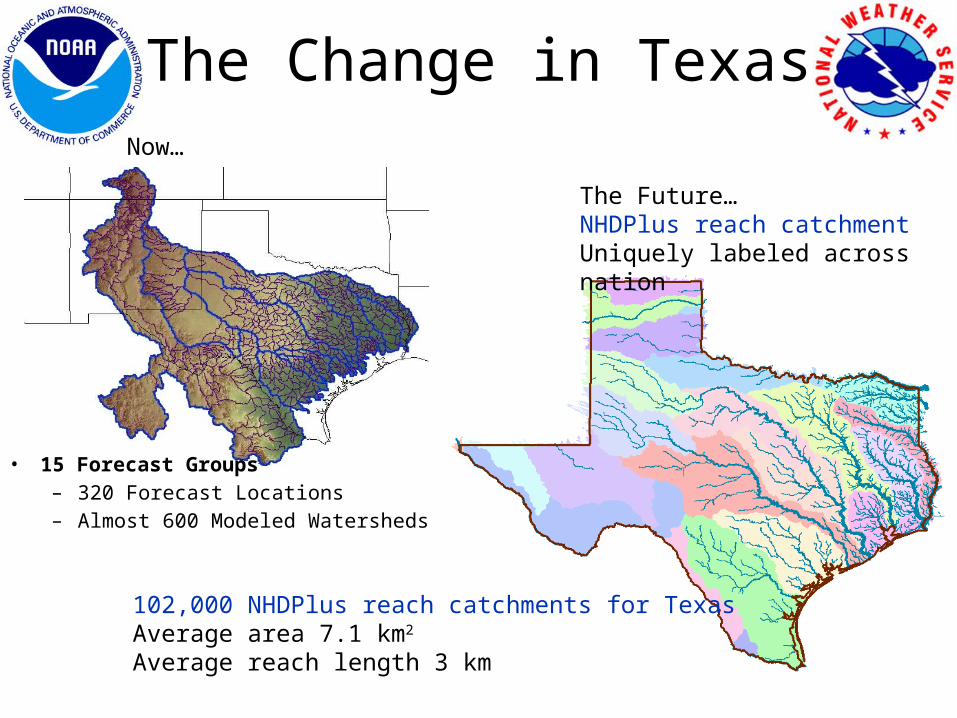
The Change in Texas
102,000 NHDPlus reach catchments for TexasAverage area 7.1 km2
Average reach length 3 km
The Future…NHDPlus reach catchmentUniquely labeled across nation
• 15 Forecast Groups– 320 Forecast Locations– Almost 600 Modeled Watersheds
Now…

Another Tool in the Toolbox
• Will be able to provide streamflow information at “intermediate” points
• Higher resolution grids• Expansion of flood inundation• Requires verification and validation• Operational this year (2016)
• http://water.noaa.gov/map• Expect full capability with 5 to 10 years
Questions/Comments?
Gregory WallerService Coordination HydrologistNWS West Gulf River Forecast [email protected]