beyond productivity: effects of extreme weather … · beyond productivity: effects of extreme...
TRANSCRIPT
Beyond productivity: Effects of extreme weather events on ecosystem processes
and biotic interactions
Dissertation
zur Erlangung des akademischen Grades
Dr. rer. nat.
vorgelegt der
Fakultät für Biologie, Chemie und Geowissenschaften
der Universität Bayreuth
von
Frau Julia Walter (M.A.)
geboren am 01.09.1981 in Memmingen
Die vorliegende Arbeit wurde unter der Betreuung von Prof. Anke Jentsch in der Zeit von
Mai 2008 bis Februar 2011 am Helmholtz Zentrum für Umweltforschung-UFZ in Leipzig,
und von Januar 2012 bis April 2012 am Lehrstuhl für Störungsökologie an der Universität
Bayreuth angefertigt.
Vollständiger Abdruck der von der Fakultät für Biologie, Chemie und Geowissenschaften der
Universität Bayreuth genehmigten Dissertation zur Erlangung des akademischen Grades eines
Doktors der Naturwissenschaften (Dr. rer. nat.).
Dissertation eingereicht am: 11.04. 2012
Zulassung durch die Prüfungskommission: 11.09.2012
Wissenschaftliches Kolloquium: 25.10.2012
Amtierende Dekanin: Prof. Dr. Beate Lohnert
Prüfungsausschuss:
Prof. Anke Jentsch (Erstgutachterin)
Prof. Christiane Werner Pinto (Zweitgutachterin)
Prof. Michael Hauhs (Vorsitzender)
Prof. Thomas Foken
Prof. John Tenhunen
Table of Contents
1. Short summary of the thesis/ Kurze Zusammenfassung der Doktorarbeit .......................................... 1
2. Background of the thesis ..................................................................................................................... 6
2.1. Climate change and extreme weather events ............................................................................... 6 2.1.1. Temperature extremes .......................................................................................................... 8 2.1.2. Precipitation extremes .......................................................................................................... 8
2.2. Plant and ecosystem response towards extreme weather events................................................ 10 2.2.1. Morphological and physiological response of single plants to various climatic stress types . 11
Plant response to heat ............................................................................................................... 11 Plant response to frost .............................................................................................................. 11 Plant response to drought ......................................................................................................... 12 Plant response to heavy rainfall................................................................................................ 12
2.2.2. Impact of extreme weather events on plant communities and ecosystems......................... 13 Observational studies ............................................................................................................... 13 Experimental evidence on extreme weather events and plant communities ............................ 14
3. On this thesis ..................................................................................................................................... 18
3.1. Objectives of this thesis ............................................................................................................. 18 3.2. Outline of manuscripts ............................................................................................................... 19 3.3. Emerging research questions ..................................................................................................... 21
3.3.1. Resilience and stress memory............................................................................................. 21 3.3.2. Extreme weather events and ecosystem processes at multiple levels................................. 22 3.3.3. Climate change and land use .............................................................................................. 23
List of manuscripts and declaration of own contribution...................................................................... 24
Presentations of my work at conferences .............................................................................................. 28
Curriculum for the postgraduate school HIGRADE ............................................................................. 29
Acknowledgements ............................................................................................................................... 30
References of the Introduction .............................................................................................................. 31
Manuscript 1: Climate extremes initiate ecosystem regulating functions while maintaining ..................
productivity.................................................................................................................... 37
Manuscript 2: How do extreme drought and plant community composition affect host plant
metabolites and herbivore performance? ....................................................................... 71
Manuscript 3: Ecological stress memory and cross stress tolerance in plants in the face of climate
extremes......................................................................................................................... 90
Manuscript 4: Do plants remember drought? Hints towards a drought-memory in grasses ............... 105
Manuscript 5: Cold hardiness of Pinus nigra Arnold as influenced by geographic origin, warming,
and extreme summer drought ...................................................................................... 121
Manuscript 6: Increased rainfall variability reduces biomass and forage quality of temperate grassland
largely independent of mowing frequency .................................................................. 145
Manuscript 7: Combined effects of multifactor climate change and land-use on decomposition in
temperate grassland ..................................................................................................... 167
Synopsis .............................................................................................................................................. 191
Short summary of the thesis
1
1. Short summary of the thesis/ Kurze Zusammenfassung der Doktorarbeit
Under global climate change, extreme weather events, such as heat waves, drought or
heavy rain spells, are projected to increase in magnitude and frequency. As these may affect
vegetation and ecosystems more than gradual shifts in mean climatic parameters,
investigating the consequences of extreme weather events recently became an important issue
in climate change research. The main focus of most experiments investigating effects of
extreme weather events on vegetation is on primary productivity. In our experiment in
artificially planted communities, even an extreme drought of 1000-year recurrence did not
have effects on above- or below-ground biomass production from 2005-2010 (manuscript 1).
Thus, the main objectives of this thesis were (1) to investigate if extreme weather
events have an effect on ecosystem functions1 beyond productivity, (2) to test if such a high
resistance or resilience2 in response to drought regarding productivity also exists in more
naturally grown plant communities and (3) to further elucidate possible mechanisms of the
surprisingly large stability of the plant communities.
To investigate these objectives, several experimental studies were conducted in
artificially planted, as well as in naturally grown grassland communities and consequences of
extreme weather events for ecosystem processes, such as decomposition and herbivory were
investigated. In a pot experiment, it was studied, if grass plants react improved towards
repeated drought when compared to a first drought and thus reveal a kind of drought memory.
Such a memory might be one possible, but up until now widely neglected mechanism of
resilience.
Even though biomass production remained stable in our experiment in artificially
planted communities (manuscript 1), biomass quality was severely affected by extreme
drought, thereby strongly affecting the development of a herbivore caterpillar feeding on
drought-exposed leaves (manuscript 2). Further, plant compounds of the host plant depended
on the composition of the plant community it was grown in. This in turn resulted in strong
effects on the larval mortality of herbivores feeding on such plants.
In contrast to the study in artificially planted communities (manuscript 1),
aboveground net primary productivity (ANPP) was reduced in naturally composed grassland
in response to extreme rainfall variability, including an extreme drought followed by heavy
1 Ecosystem functions: Processes that involve more than one ecosystem or trophic level and are important for the maintenance of the whole ecosystem (e.g. decomposition, which is important for nutrient turnover, or providing food of good quality to sustain food webs) 2 Resilience is understood here as the time required to return to a steady-state following disturbance (Holling (1973); Gunderson (2000))
Short summary of the thesis
2
rainfall (manuscript 6). Forage quality was altered by drought. Furthermore, mowing
frequency strongly altered forage quality and biomass production, but did not interact with
rainfall variability and thus did neither buffer, nor amplify effects of extreme rainfall
variability. Despite effects of rainfall variability on ANPP, grassland showed high resilience
after drought followed by heavy rain, as effects were large shortly after the extreme event, but
did not persist until a second harvest later in the year.
In natural grassland, rainfall variability and drought also affected ecosystem processes,
here litter decomposition, beyond productivity (manuscript 7). Drought followed by heavy
rain pulses decreased decomposition rates. Decomposition in more frequently mown
meadows was more vulnerable towards drought exposure. Winter warming and additional
winter rain had no long-term effect on decomposition. To conclude, projected increases in
drought frequency under climate change may inhibit decomposition and alter nutrient and
carbon cycling along with soil quality in temperate grassland, whereas a reduction of snow
cover leading to more variable soil surface temperatures may counteract increased
decomposition under winter warming.
In this thesis, an ecological stress memory as one possible mechanism of resilience is
defined as any response of a single plant after a stress experience that improves the reaction of
the plant towards future stress experience and which is assessed on a whole plant level
(manuscript 3). This thesis further provides evidence of a drought memory in grass plants
(manuscript 4): Plants repeatedly subjected to drought showed improved photo-protection and
a higher rate of living biomass when compared to plants faced with their first drought.
Similarly, tree seedlings exposed to drought in summer revealed higher frost resistance during
winter, providing evidence of a long-lasting “cross-stress-memory” (manuscript 5).
To sum up, the thesis shows that extreme weather events, even though neither severely
affecting biomass production in artificially composed, nor in naturally growing communities
in the long-term, exert strong influence on physiological or biogeochemical parameters, such
as plant compounds or soil biotic activity. These changes in turn modify ecosystem functions
beyond productivity, for example herbivory or decomposition, possibly altering biotic
interations and nutrient cycling. Furthermore, the findings imply that plants exhibit a stress
memory after stress exposure, which may be one mechanisms leading to a high stability and
resilience upon frequent stress.
Kurze Zusammenfassung der Doktorarbeit
3
Kurze Zusammenfassung der Doktorarbeit Im Zuge des globalen Klimawandels werden extreme Wetterereignisse, wie
Hitzewellen, Dürren oder Starkregenereignisse sehr wahrscheinlich häufiger und auch
intensiver werden. Da diese Vegetation und Ökosysteme stärker beeinflussen können als
graduelle Änderungen in klimatischen Durchschnittsparametern, ist die Untersuchung der
Konsequenzen extremer Wetterereignisse in letzter Zeit verstärkt in den Fokus der
Klimawandelforschung getreten. Das Hauptaugenmerk der meisten Experimente, die Folgen
extremer Wetterereignisse für die Vegetation untersuchen, liegt auf der Primärproduktivität.
Innerhalb unseres Experiments in künstlich zusammengesetzten Gemeinschaften wurde die
ober- und unterirdische Biomasseproduktion durch eine extreme Dürre nicht beeinflusst
(Manuskript 1).
Daher sind die Ziele dieser Arbeit, zu untersuchen, (1) ob extreme Wetterereignisse
einen Effekt auf Ökosystemfunktionen1, außer der reinen quantitativen Produktion von
Biomasse haben, (2) ob die Ergebnisse der hohen Stabilität in den künstlich
zusammengesetzten Artengemeinschaften auch für die natürlich gewachsenen
Gründlandbeständen gelten und (3) mögliche Mechanismen der erstaunlichen Stabilität der
Pflanzengemeinschaften näher zu beleuchten.
Dafür wurden mehrere Experimente in künstlichen und natürlichen
Pflanzengemeinschaften durchgeführt, in denen Folgen extremer Wetterereignisse für
Ökosystemprozesse, wie z. B. Streuabbau oder Herbivorie, untersucht wurden. In einem
Topfexperiment wurde außerdem untersucht, ob Graspflanzen besser mit einer wiederholten
Dürre im Vergleich zu einer ersten Dürre umgehen können, und damit eine Art
Dürregedächtnis aufweisen. Ein solches Gedächtnis könnte ein möglicher, aber bisher wenig
erforschter Mechanismus von Resilienz2 sein.
Obwohl die Biomasseproduktion künstlich zusammengesetzter Gemeinschaften stabil
blieb (Manuskript 1), änderte sich die Biomassequalität stark durch extreme Dürre. Dadurch
veränderte sich die Entwicklung einer phytophagen Raupe, wenn sie Blätter fraß, die einer
Dürre ausgesetzt worden waren (Manuskript 2). Außerdem beeinflusste die
Artenzusammensetzung der Gemeinschaft, in der die Futterpflanze wuchs, die
Pflanzeninhaltsstoffe, was die Sterberate der Larven veränderte.
1 Prozesse, die mehr als eine Ökosystemebene betreffen und die für die Aufrechterhaltung des gesamten Systems notwendig sind 2 Benötigte Zeit, um nach einer Störung wieder einen stabilen Zustand zu erreichen (Holling (1973); Gunderson (2000))
Kurze Zusammenfassung der Doktorarbeit
4
Im Gegensatz zur Studie in künstlich zusammengesetzten Gemeinschaften
(Manuskript 1) wurde die oberirdische Nettoprimärproduktion (NPP) durch den Einfluss von
extremer Niederschlagsvariabilität, also extremer Dürre gefolgt von starkem Regen, reduziert
(Manuskript 6). Auch die Futterqualität wurde durch die Dürre modifiziert. Des Weiteren
beeinflusste die Mahdfrequenz Futterqualität und Biomasseproduktion. Allerdings konnte die
Mahdfrequenz die Effekte der extremen Niederschlagsvariabilität weder abpuffern, noch
verstärken; es gab keine Interaktion zwischen den beiden Faktoren. Trotz der Effekte der
Niederschlagsvariabilität auf die NPP zeigte sich wieder eine hohe Resilienz von Grünland
nach Dürre und Starkregen, da die negativen Effekte direkt nach dem extremen
Wetterereignis sehr stark waren, aber nicht bis zur zweiten Ernte Ende des Jahres anhielten.
Auch im natürlichen Grünland wurden Ökosystemprozesse, hier Streuabbau, neben
der Produktivität beeinflusst: Dürre, gefolgt von Starkregen, verringerte Streuabbauraten.
Streuabbau in öfter gemähten Wiesen wurde durch die Dürre stärker beeinträchtigt.
Wintererwärmung und zusätzlich applizierter Winterniederschlag hatten keine langfristigen
Effekte auf den Abbau. Zusammenfassend lässt sich sagen, dass die vorhergesagte Zunahme
von Dürren den Streuabbau behindern und dadurch in Nährstoff- und Kohlenstoffkreislauf
eingreifen könnte. Das Tauen der Schneedecke bei Wintererwärmung führte zu einer erhöhten
Variabilität der Bodenoberflächentemperatur und könnte damit erhöhten Abbauraten durch
Wintererwärmung entgegen wirken.
Die vorliegende Arbeit definiert ökologisches Stressgedächtnis als die Stressantwort
einer Einzelpflanze, die die Reaktion dieser gegenüber wiederholtem Stress verbessert. Ein
solches Stressgedächtnis könnte ein möglicher Mechanismus von Resilienz sein (Manuskript
3). Die Arbeit zeigt erste Hinweise auf ein Dürregedächtnis bei Grasspflanzen. Pflanzen, die
wiederholter Dürre ausgesetzt waren wiesen einen besseren Schutz vor oxidativem Stress und
dadurch mehr lebende Biomasse auf als Pflanzen, die das erste Mal einer Dürre ausgesetzt
wurden. Auch waren Baumkeimlinge, die im Sommer eine Dürre erfuhren, im Winter
frostresistenter, was auf ein „Cross-Stressgedächtnis“ hinweist (Manuskript 5).
So zeigt diese Arbeit, dass extreme Wetterereignisse, selbst wenn sie die
Biomasseproduktion nicht stark oder langfristig beeinflussen, physiologische oder
biogeochemische Parameter, wie z. B. Pflanzeninhaltsstoffe oder die Aktivität der
Bodenfauna, verändern. Diese Änderungen modifizieren wiederum Ökosystemfunktionen,
wie Herbivorie oder Streuabbau, wodurch möglicherweise langfristig in biotische
Interaktionen oder Stoffkreisläufe eingegriffen wird. Weiterhin legt diese Arbeit nahe, dass

Kurze Zusammenfassung der Doktorarbeit
5
Pflanzen, nachdem sie Stress ausgesetzt waren, ein Stressgedächtnis entwickeln können, das
zu erhöhter Stabilität und Resilienz unter häufigen Stressereignissen führt.
Background of the thesis
6
2. Background of the thesis
2.1. Climate change and extreme weather events
Instrumental temperature records show that a warming of the climate system over the
last century is unequivocal (Hulme, 2005; Blenkinsop and Fowler, 2007; Trenberth et al.,
2007). The global mean surface temperatures have risen by 0.74 ° C (±0.18 ° C) on average
from 1905-2006 (Hulme, 2005; Blenkinsop and Fowler, 2007; Trenberth et al., 2007).
Warming was most pronounced over land regions, especially over the northern hemisphere
during winter and spring (Trenberth et al., 2007). In Germany temperatures have risen by 1° C
from 1901-2000, with a more pronounced warming during winter (Schönwiese et al., 2005;
Zebisch et al., 2012). Other temperature indices, such as the global sea level rise of around 17
cm in the last century, the reduction of snow cover in the northern hemisphere or the
widespread glacier retreat are consistent with the record showing rising temperatures
(Trenberth et al., 2007). Furthermore, global warming is accelerating quickly: the warming
rate of 0.13° C per decade from 1955-2005 is almost double the warming rate of 0.07 ° C per
decade for 1906-2005 (Beierkuhnlein and Foken, 2008; Trenberth et al., 2007). It is now
widely acknowledged, that anthropogenic green house gas emissions account for the largest
part of observed warming since preindustrial times and that the observed warming can not be
explained by internal forcing or natural external radiative forcing only (Hegerl et al., 2007;
Trenberth et al., 2007).
Future projections indicate a further warming of between 1.1° C and 6.4 ° C until
2100, depending on the emission scenario used in the model. Even if CO2 emissions were
held constant on the level of the year 2000 (which is already not fulfilled), temperatures
continued to rise for at least the first third of the 21st century (Meehl et al., 2007).
Along with rising temperatures, other components of the climate system, for example
precipitation, are observed and projected to change.
Modifications in the magnitude, as well as in the frequency and duration of extreme
weather events are of increasing concern: Such changes may occur both through changes in
the mean or in the variability of the distribution of a climate variable, causing
disproportionally large changes in the frequency or intensity of weather extremes, compared
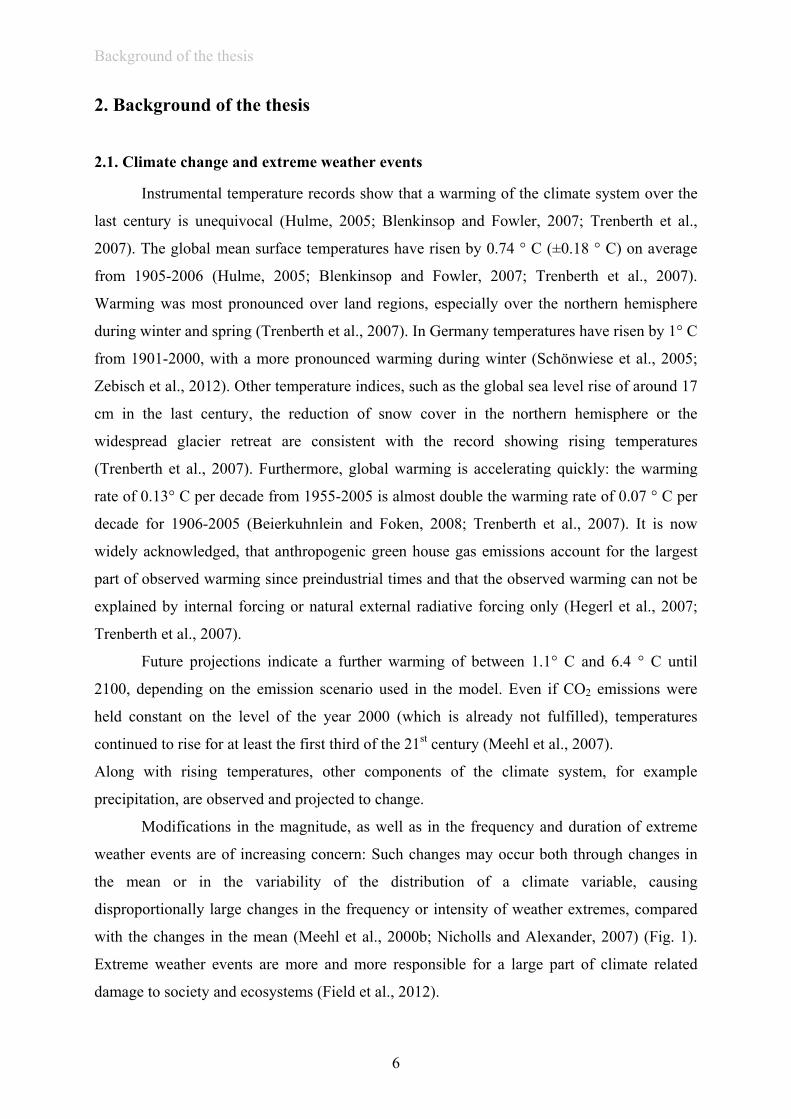
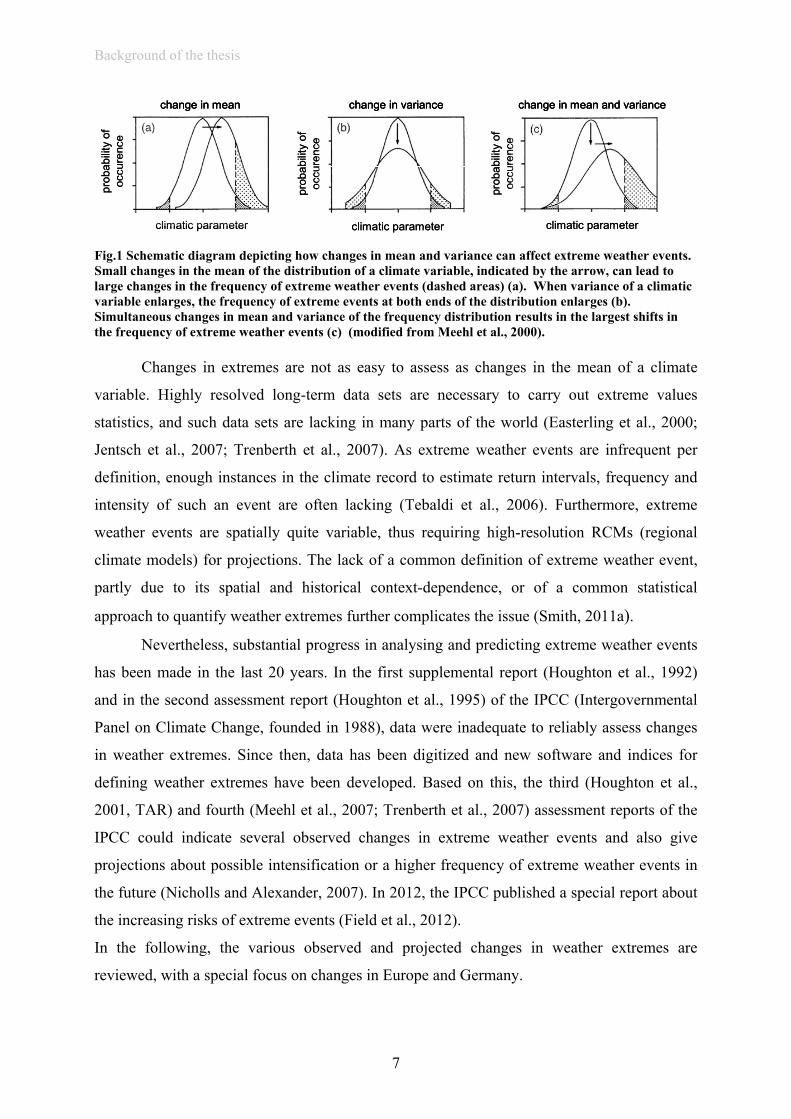
with the changes in the mean (Meehl et al., 2000b; Nicholls and Alexander, 2007) (Fig. 1).
Extreme weather events are more and more responsible for a large part of climate related
damage to society and ecosystems (Field et al., 2012).
Background of the thesis
7
change in mean change in variance change in mean and variance
climatic parameter
prob
abilit
yof
oc
cure
nce
prob
abilit
yof
oc
cure
nce
prob
abilit
yof
oc
cure
nce
climatic parameter climatic parameter
change in mean change in variance change in mean and variancechange in mean change in variance change in mean and variance
climatic parameter
prob
abilit
yof
oc
cure
nce
prob
abilit
yof
oc
cure
nce
prob
abilit
yof
oc
cure
nce
climatic parameter climatic parameter Fig.1 Schematic diagram depicting how changes in mean and variance can affect extreme weather events. Small changes in the mean of the distribution of a climate variable, indicated by the arrow, can lead to large changes in the frequency of extreme weather events (dashed areas) (a). When variance of a climatic variable enlarges, the frequency of extreme events at both ends of the distribution enlarges (b). Simultaneous changes in mean and variance of the frequency distribution results in the largest shifts in the frequency of extreme weather events (c) (modified from Meehl et al., 2000).
Changes in extremes are not as easy to assess as changes in the mean of a climate
variable. Highly resolved long-term data sets are necessary to carry out extreme values
statistics, and such data sets are lacking in many parts of the world (Easterling et al., 2000;
Jentsch et al., 2007; Trenberth et al., 2007). As extreme weather events are infrequent per
definition, enough instances in the climate record to estimate return intervals, frequency and
intensity of such an event are often lacking (Tebaldi et al., 2006). Furthermore, extreme
weather events are spatially quite variable, thus requiring high-resolution RCMs (regional
climate models) for projections. The lack of a common definition of extreme weather event,
partly due to its spatial and historical context-dependence, or of a common statistical
approach to quantify weather extremes further complicates the issue (Smith, 2011a).
Nevertheless, substantial progress in analysing and predicting extreme weather events
has been made in the last 20 years. In the first supplemental report (Houghton et al., 1992)
and in the second assessment report (Houghton et al., 1995) of the IPCC (Intergovernmental
Panel on Climate Change, founded in 1988), data were inadequate to reliably assess changes
in weather extremes. Since then, data has been digitized and new software and indices for
defining weather extremes have been developed. Based on this, the third (Houghton et al.,
2001, TAR) and fourth (Meehl et al., 2007; Trenberth et al., 2007) assessment reports of the
IPCC could indicate several observed changes in extreme weather events and also give
projections about possible intensification or a higher frequency of extreme weather events in
the future (Nicholls and Alexander, 2007). In 2012, the IPCC published a special report about
the increasing risks of extreme events (Field et al., 2012).
In the following, the various observed and projected changes in weather extremes are
reviewed, with a special focus on changes in Europe and Germany.
Background of the thesis
8
2.1.1. Temperature extremes
Under rising mean temperatures the occurrence probability of extremely warm
temperatures increases, while the occurrence probability of extremely cold temperatures
decreases (Meehl et al., 2000a; Fig.1). Conclusions about changes in temperature extremes
were among the earliest results related to changes of extreme weather events, as data records
monitoring temperature are globally well developed and spatially quite coherent. A decrease
in frost days and an increase in the number of extremely hot days had been observed world-
wide in the 20th century (Easterling et al., 2000; Salinger, 2005; Nicholls and Alexander,
2007; Trenberth et al., 2007). The magnitude of changes in extremes varies spatially, along
with unevenly distributed changes in mean temperature. Across Europe, an increasing
frequency in the number of heat waves has been observed in the 20th century and especially
the Mediterranean was faced with more extremely hot days (Klein Tank and Können, 2003;
Schaer and Jendritzky, 2004; Alexander et al., 2006; Beniston et al., 2007; Trenberth et al.,
2007; Bartholy et al., 2008; Kioutsioukis et al., 2010). At the same time the number of frost
days decreased and the start of the growing season advanced (Alexander et al., 2006; Beniston
et al., 2007; Bartholy et al., 2008). These changes will exacerbate in the 21st century world-
wide and might even be larger than widely expected, as not only mean temperature, but also
the variability in temperature might increase (Schaer and Jendritzky, 2004; Beniston et al.,
2007; Meehl et al., 2007; Jacob, 2009; Field et al., 2012).
Although the number of frost days is further projected to decrease, an increase in the
minimum temperature reached during winter is regarded unlikely (Kodra et al., 2011) and the
fewer frost days are predicted to be more scattered over time (Jylhä et al., 2008).
2.1.2. Precipitation extremes
In general, observations and model predictions for precipitation changes are spatially
and temporally more variable and show a larger inter-model variability than those for
temperature trends and extremes (Blenkinsop and Fowler, 2007).Theory predicts that global
warming will be accompanied by an intensification of the hydrological cycle: Along with
rising temperatures, surface evaporation as well as the water holding capacity of the
atmosphere rise, the latter by almost 7% per degree K, according to the Clausius-Clapeyron
relation (Allen and Ingram, 2002; Trenberth et al., 2003; Christensen and Christensen, 2004;
Huntington, 2006; Allan and Soden, 2008; O‘Gorman and Schneider, 2009 ). Data records
since 1973 have shown that atmospheric moisture amounts have been rising since then, which
resulted in a 10% increase of precipitable water in all regions where reliable data were
Background of the thesis
9
available (Trenberth et al., 2003; Huntington, 2006). Warming and increased moisture
holding capacity also lead to increased lateral convergence of low level moisture and this in
turn causes an intensification of rainfall variability, leading to fewer, but more intense rainfall
events (Allen and Ingram, 2002; Trenberth et al., 2003; Christensen and Christensen, 2004;
Groisman et al., 2005; O‘Gorman and Schneider, 2009; Min et al., 2011).
An increase in the frequency of heavy rainfall events has been observed in many
regions, even in areas with declining mean annual precipitation (Karl and Knight, 1998;
Easterling et al., 2000; Trenberth et al., 2003; Groisman et al., 2005; Tebaldi et al., 2006;
Marengo et al., 2010). Already in the TAR (Houghton et al., 2001), a significant increase in
the frequency of heavy rainfall events by 2-4% over mid and high latitudes has been stated.
Within Europe, seasonal and regional differences exist for trends in heavy rainfall events.
During winter, heavy rainfall has become more frequent in Northern Europe and less frequent
in southern Europe, according to changes in mean precipitation (Klein Tank and Können,
2003; Haylock and Goodess, 2004; Groisman et al., 2005; Beniston et al., 2007). During
summer, more extremes occurred again in Northern Europe and for Central- and Eastern
Europe, although for the latter, total precipitation declined during summer in many parts
(Raisanen and Joelsson, 2001; Klein Tank and Können, 2003; Christensen and Christensen,
2004; Beniston et al., 2007).
Over the 21st century, the frequency of heavy rainfall events is likely to increase
further in many regions (Field et al., 2012). European models predict an increase in
magnitude and frequency of extreme precipitation events in northern, central and eastern
Europe (Raisanen and Joelsson, 2001; Beniston et al., 2007; Bartholy et al., 2008; Boberg et
al., 2010), but also for some parts of southern Europe (Coppola and Giorgi, 2010;
Kioutsioukis et al., 2010) and the UK (Fowler and Ekstroem, 2009). Germany is also
projected to further experience more intense heavy rainfall events, especially during winter
(Jacob, 2009).
As variability of rainfall is projected to increase, leading to more intense, but less
frequent events and as warming accelerates surface drying, the risk for droughts rises under
global warming (Blenkinsop and Fowler, 2007; Allan and Soden, 2008). Assessment and
quantification of droughts is complicated by several issues (Field et al., 2012): “Drought” can
be defined in numerous ways and each drought type can be assessed using various drought
indices (e.g. the prominent Palmer drought severity index PDSI)( Keyantash and Dracup,
2002; Dai et al., 2004). Historical datasets to directly quantify and determine drought, like soil
moisture data, are relatively sparse (Robock et al., 2000; Dai et al., 2004).
Background of the thesis
10
Nevertheless, numerous studies and modelling approaches in recent years investigated
whether drought frequency and severity increased due to global climate change and how
droughts are projected to change in the future. Since the 1970s, areas affected by drought have
markedly amplified by up to 50%, especially in the tropics and subtropics (Dai et al., 2004;
Huntington, 2006; Wang et al., 2010; Trenberth et al., 2007), and droughts are projected to
intensify further in many parts of the world, including central North America, Central
America and Mexico, northeast Brazil, and southern Africa (Allan and Soden, 2008; Li et al.,
2009; Wang et al., 2010; Field et al., 2012). Many regions in Europe have been faced with
severe summer droughts in the last decades, especially the Mediterranean and parts of Central
Europe (Lopez-Moreno et al., 2010; Dai et al., 2004; Beniston et al., 2007; Briffa et al.,
2009), and an exacerbation of this situation is predicted as mean summer precipitation is
projected to decrease in these areas by up to 30 % (Beniston et al., 2007; Blenkinsop and
Fowler, 2007; Meehl et al., 2007; Jacob, 2009; Coppola and Giorgi, 2010; Iglesias et al.,
2010; Moriondo et al., 2010; Field et al., 2012).
This will likely affect Germany, where summer precipitation already decreased over
the last decades and is projected to decrease further, especially in Southern, South-Western
and North-Eastern Germany (Schönwiese et al., 2005; Jacob, 2009).
2.2. Plant and ecosystem response to extreme weather events
The abruptness of extreme events gives only little time for acclimation and their novel
magnitude might push single plants, plant communities or whole ecosystems beyond their
thresholds of survival and equilibrium (Easterling et al., 2000; Jentsch et al., 2007; Smith,
2011b). Thus, extreme weather events may exert stronger effects on plants and plant
communities than gradual shifts in means (e.g. warming or rising CO2-levels) and their
ecological consequences are expected to be out of proportion to their relatively short duration
(Jentsch et al., 2007). In the following, the response of single plants as well as of plant
communities towards extreme weather events will be shortly summarized, including
observational and experimental evidence.
Background of the thesis
11
2.2.1. Morphological and physiological response of single plants to various climatic stress3
types
Plant response to heat
Extreme heat (for mesophil plants this often means temperature above 35 ° C (Schulze
et al., 2005)) causes metabolic imbalances, due to the temperature dependence of biochemical
reactions, as well as protein denaturation. Plants growing in heat-prone environments often
avoid heat by morphological adaptations, such as pubescent or splitted leaves. Short-term
morphological avoidance mechanisms include changing the leaf orientation or cooling via
transpiration, which, however, may additionally cause water stress. An acclimation
mechanism to increase heat tolerance is the heat-shock reaction of cells. It begins with a
down-regulation of housekeeping-gene-expression and an up-regulation of heat-shock
proteins (Schulze et al., 2005; Lambers et al., 2008). These prevent damage of the
photosynthetic apparatus, repair denatured proteins or break down irreversible damaged
proteins (Parcellier et al., 2003; Schulze et al., 2005).
Plant response to frost
Despite the general decrease of frost days under global warming, the projected
increase in the variability of air temperature along with a reduction in snow cover, acting as
an insulation for many plants (Marchand, 1996), could increase the impact of frost in many
regions of the northern hemisphere (Groffman et al., 2001; Kreyling, 2010). Along with an
earlier onset of the growing season under global warming, the risk of late frost damage might
also increase (Rigby and Porporato, 2008; Woldendorp et al., 2008). Exposure to cold
temperatures causes changes in membrane fluidity, damage to biomembranes, metabolic
imbalances and oxidative stress due to formation of reactive oxygen species (ROS)4 (Schulze
et al., 2005; Lambers et al., 2008). Frost stress leads to the additional problem of cell
dehydration caused by apoplastic ice formation and to cell death by symplastic ice crystal
formation (Janska et al., 2010; Thomashow, 1999; Schulze et al., 2005). Many plants avoid
frost stress by dormancy or by completing their life cycle within the frost-free period. Plants
adapted to frost show frost hardening that enables them to survive frost without cell damage
and which is triggered by low temperatures and the photoperiod, (Janska et al., 2010;
3 Stress is understood here as deviation from the optimum environmental conditions of plants 4 ROS accumulate under various stressors, when the light reaction of the photosynthesis produces reduction equivalents (NADPH) via the electron transport chain that cannot be used in the calvin cycle, e.g. caused by a lack of CO2 due to stomata closure or by low temperatures and thus slow biochemical reactions. The resulting over-reduction or over-energetization causes reduction of O2 to the very reactive superoxide. This can convert rapidly into other ROS, that lead to cell and membrane damages.
Background of the thesis
12
Thomashow, 1999). Frost hardening involves an enhancement of membrane fluidity, e.g. by
increasing desaturation of fatty acids, the upregulation of cold-related proteins (COR), which
often serve to stabilize membranes, an upregulation of substances to detoxify ROS (e.g.
superoxiddismutase, xanthophyll) and mechanisms to avoid dehydration (accumulation of
cryoprotectives, such as compatible solutes or dehydrins, see next section) (Janska et al.,
2010; Schulze et al., 2005). While hardening of perennial plants in autumn takes several
weeks, dehardening may occur within hours to days (Strimbeck et al., 1995; Rapacz et al.,
2000; Sakai and Larcher, 1987), leaving the plants vulnerable to short-term late frost events in
the early growing season or after winter warming events.
Plant response to drought
Drought is one of the major limitations for plant growth world wide (Chaves et al.,
2002). Plants in drought-prone environments show adaptations to avoid drought stress by
dormancy or morphological modifications such as an enlargement of the root system
(Lambers et al., 2008; Newman et al., 2006). Many mesic plants are able to acclimate to
drought stress to a certain extent, thereby increasing their drought tolerance. The
phytohormone abscisic acid (ABA) plays a key role in drought perception and reaction
(Wasilewska et al., 2008). A rapid ABA-mediated response to water shortage is the closure of
stomata to prevent further transpiration. Morphological mechanisms of drought acclimation
include the diminishment of the leaf area by leaf rolling or even leaf shedding. The depletion
of CO2 in the cells when stomata are closed can lead to a formation of ROS, especially under
high light conditions when the plants ability to dissipate excess energy is exceeded. To avoid
oxidative damage, enzymes and substances to detoxify or scavenge ROS are increasingly
synthesized (Munne-Bosch and Alegre, 2000). Furthermore, compatible solutes, e.g. soluble
carbohydrates, proline and betaines are synthesized to prevent further cell dehydration and to
protect biomembranes from damage by charged ions (Bohnert, 2000; Schulze et al., 2005).
Another mechanism to protect biomembranes is the synthesis of dehydrins, which are often
amphiphil and serve to stabilize other proteins (Bohnert, 2000; Schulze et al., 2005).
Plant response to heavy rainfall
Single plant response to heavy rainfall has rarely been studied. Plants do not suffer
from an increased water supply in the soil, as long as the soil is not waterlogged. In
waterlogged soils, air in soil pores is replaced by water, limiting oxygen supply to the roots,
as oxygen diffuses and dissolves slowly in water. Plants adapted to flooding-prone
environments (mangroves, for instance) have evolved mechanisms to supply their roots with
Background of the thesis
13
oxygen, for example by developing air roots. Plants not adapted to flooding can sometimes
acclimate by histological modifications, like aerenchymes. Otherwise, they experience
hypoxia or even anoxia. This causes fermentation instead of respiration in the root cells,
which restricts growth by a fast depletion of stored carbohydrates. Lactate and ethanol
accumulate and might cause cell damage by increasing acidity. After re-aeration plants might
suffer oxidative damage by formation of ROS (Schulze et al., 2005; Lambers et al., 2008).
Often mykorrhiza are damaged in hypoxic soils, which impairs the plants nutrient supply.
2.2.2. Impact of extreme weather events on plant communities and ecosystems
Observational studies
Besides physiological and morphological alterations in single plants, climatic variables affect
species distribution and ranges, phenological life cycle events, community composition and
species interactions (Hughes, 2000; Visser and Holleman, 2001; Walther et al., 2002).
Many observational studies document the effect of the gradual warming on vegetation:
Polewards or upwards range shifts in response to warming have been observed for various
species, e.g. an upward shift of the treeline and of alpine plants in Europe in the last decades
(Hughes, 2000; Walther et al., 2002; Parmesan and Yohe, 2003; Thuiller, 2007). The rising
temperatures also led to phenological shifts in many plant species, for instance to an earlier
onset of bud burst or flowering (Walther et al., 2002). Warmer conditions often match the
needs of invasive plants, that can possibly establish more rapidly and more widespread under
new conditions. An increase of thermophilic invasive species has been documented in several
ecosystems (Walther et al., 2002). Climate change may also lead to species extinctions, with
species in mountain habitats or the Mediterranean especially endangered (McCarty, 2001;
Thomas et al., 2004; Thuiller et al., 2005; Schröter et al., 2005).
Compared to observations of the effects of gradual warming for plant communities,
populations and species distribution, observational studies investigating the consequences of
extreme weather events are rare, as the occurrence of extreme climatic events is also rare
(Meehl et al., 2000a; Gutschick and BassiriRad, 2003; Jentsch et al., 2007). Rapid
catastrophic shifts in community composition often follow disturbances caused by extreme
climatic events (e.g. storms)(Scheffer et al., 2001). Even less dramatic events may cause
changes in species competitive and facilitative interactions (Bertness and Callaway, 1994;
Jentsch et al., 2007). For instance, competition intensifies in plant-plant interactions under
extreme drought (Tielborger and Kadmon, 2000; Ludwig et al., 2004; Maestre and Cortina,
2004). Thus, naturally occurring droughts cause long-lasting shifts in plant community
Background of the thesis
14
composition (Allen and Breshears, 1998; Breshears et al., 2005; Mueller et al., 2005).
Drought further reduces forest resilience and productivity and is projected to increase tree
mortality (Thompson et al., 2009; Lloret et al., 2004; Noormets et al., 2008; Allen et al.,
2010). Many tree-species in the Mediterranean are projected to decrease their distribution due
to more severe droughts (Schröter et al., 2005). In mesic grassland, however, increased
precipitation variability, leading to longer dry periods followed by more extreme rainfall
events, promoted plant coexistence and thus stabilized diversity (Adler et al., 2006).
The extreme summer heat waves in Central- and Western Europe in 2003 and in
Eastern Europe in 2010, accompanied by severe drought, caused crop failure and Europe-
wide reductions in primary productivity (Ciais et al., 2005; Barriopedro et al., 2011).
Warm spells during winter have also been observed to cause damage, as they may lead
to a loss of frost acclimation and thus increased damage upon recurring frost. A winter “heat
wave” in 2007 in northern Scandinavia, accompanied by thawing, led to extensive damage of
the dominant dwarf-shrubs (Bokhorst et al., 2009). Strimbeck et al. (1995) found that a
natural thaw during midwinter caused dehardening of montane red spruce. As global warming
advances the beginning of the growing season, increasing damage caused by late frost events
has been observed (Gu et al., 2008).
Experimental evidence on extreme weather events and plant communities
As observational evidence on the impacts of extreme weather events is limited, several
controlled field-experiments assessed effects of extreme climatic events on natural or
artificially composed vegetation. The advantages of well-conducted experiments5 are the
possibility to incorporate control treatments and to minimize the influence of confounding
factors. However, as such a reductionist approach implies rather artificial conditions rarely
found in reality, the transfer of experimental evidence on complex, natural systems might be
limited.
In the beginning of experimental climate change research (1990s), studies testing
effects of extreme weather events on plant communities were scarce (Jentsch et al., 2007;
manuscript 1) and the majority of the experiments implemented changes in weather trends,
such as warming or increased CO2. Until 2006, research investigating the effects of extreme
events accounted for only one fifth of the experimental climate change studies published
5 Well-conducted experiments should include proper control treatments varying only the factor studied, should work with enough replicates to ensure statistical power and should randomly assign treatments and replicates. Further, treatment artifacts and biases caused by the experiment conductors have to be avoided (Hurlbert, 1984)
Background of the thesis
15
(Jentsch et al., 2007). Most experiments assessed aboveground productivity as main response
parameter and investigated effects of drought (manuscript 1).
Precipitation manipulations:
Experimentally applied drought decreased grassland productivity in some studies
(Morecroft et al., 2004; van Ruijven and Berendse, 2010; de Boeck et al., 2011). However,
productivity was often only affected in response to drought in arid habitats (Gilgen and
Buchmann, 2009; Miranda et al., 2009) or in generally dry years (Bloor et al., 2010). The
VULCAN experiments assessing data at shrubland sites across Europe, also found a trend to
reduced biomass production after drought only at the drier sites (Penuelas et al., 2004;
Penuelas et al., 2007). In mesic grassland, drought often had no long-term effects on
productivity (Naudtsa et al., 2011), which was also found for the EVENT I experiment
(manuscript 1). Despite often not having large effects on productivity, drought alters
belowground processes, e.g. by reducing soil respiration (EVENT I and CLIMOOR
experiment: Emmett et al., 2004; Kreyling et al., 2008; Sowerby et al., 2008; Toberman et al.,
2008; manuscript 1).
Several studies did not test the direct effects of drought, but the effects of increased
rainfall variability (fewer, but larger events, including long dry intervals and heavy rain
spells) on grassland parameters. Some studies showed a larger effect of mean annual
precipitation on productivity (Barrett et al., 2002; Chou et al., 2008), while others found
rainfall variability to be a more important driver for ANPP (Knapp et al., 2002; Fay et al.,
2003). In the Rain Manipulation Plots (RaMPs) experiment at Konza Prairie Biological
Station in Kansas, USA, a reduction in soil respiration, plant CO2 uptake (Harper et al., 2005)
soil water content (Fay et al., 2003) and productivity (Fay et al., 2003; Knapp et al., 2002) and
an increase in soil nitrogen availability and in plant diversity (Knapp et al., 2002) was found
in temperate continental grassland under increased rainfall variability (larger but fewer
rainfall events with a constant overall rainfall amount (Heisler and Weltzin, 2006). Heisler-
White et al. (2008, 2009) found a decrease in productivity at the temperate part of a transect
and an increase in the semi-arid end under fewer, but larger rainfall events. In a Californian
grassland, changes in precipitation patterns caused changes in trophic interactions, e.g. a
reduction in consumer abundance on a longer time scale that overrode direct, autecological
short-term effects (Suttle et al., 2007).
The drought studies not applying compensating rain pulses show that arid systems or
mesic systems in dry years are more vulnerable towards drought. Thus, a sufficient overall
rainfall amount seems to be important for grassland recovery, which was also found in our
Background of the thesis
16
study within the EVENT II experiment (manuscript 6). The impact of drought in arid
ecosystems seems to depend largely on overall rainfall amount or the occurrence of several
larger rain pulses.
Experiments testing effects of heavy rainfall events on vegetation are rare. In the
EVENT I experiment heavy rainfall events had only minor effects on productivity (Kreyling
et al., 2008).
Temperature manipulations:
Experiments applying not only gradual warming, but extreme heat pulses, are scarce.
Arnone et al. (2011) found only short-termed effects of an experimental heat wave on the
productivity of the dominant grass species in tallgrass-prairie of Oklahoma, but no changes in
most of the studied species. In cold biomes plants performed better during a warming pulse,
but worse afterwards, possibly due to a loss of cold resistance and subsequent higher stress
levels under the recurring cold (Marchand et al., 2005; Marchand et al., 2006; Bokhorst et al.,
2009), whereas fresh litter decomposition was unaffected by warming pulses (Bokhorst et al.,
2010). In the EVENT I experiment, repeated soil freeze-thaw cycles caused an increase in
productivity of temperate grassland (Kreyling et al., 2010). However, lagged stress effects in
heath communities diminished biomass two vegetation periods after applying warming pulses
(Kreyling et al., 2010).
Combined manipulations of multiple climatic variables:
Few experiments apply multiple, combined climatic stressors on vegetation:
The CLIMAITE project (Mikkelsen et al., 2008) applying elevated CO2, drought and
warming as single factors and in combination on shrubland systems in Denmark found mostly
smaller responses of nutrient cycling to the combined treatments than to the single treatments.
Nevertheless, the future climate scenario combining all factors led to reduced N turnover
(Larsen et al., 2011). Grime et al. (2008) found a large long-term resistance of infertile,
established grassland in response to warming, droughts and water additions over 13 years. A
mesocosm experiment including herbaceous species in Belgium also applied heat waves and
drought as single and combined factors (de Boeck et al., 2011; van Peer et al., 2004). They
found that negative effects of drought on CO2 exchange, growth, survival and biomass
production were exacerbated by heat waves, whereas heat waves alone had no effect, due to
transpirative cooling.
The summarized results demonstrate that intensifying droughts might reduce
productivity and also agricultural yield, especially under already dry conditions, with smaller

Background of the thesis
17
to no effects in mesic grassland. Furthermore, some studies show that extreme events alter net
carbon balance and soil processes, thereby altering nutritional pathways and soil quality.
There is an urgent need to further combine multiple climatic stressors, as effects of such
multifactor experiments might point in totally different directions as expected out of the
response towards single factors (Mikkelsen et al., 2008). Studies investigating parameters
other than productivity and soil respiration are needed to elucidate effects on biotic
interactions and ecosystem processes on multiple levels.
On this thesis
18
3. On this thesis
3.1. Objectives of this thesis
The prevailing response parameter of most experiments investigating effects of
extreme weather events on vegetation is primary productivity. In the EVENT I experiment, in
which statistically extreme weather events were applied on artificially planted communities of
varying species- and functional diversity, the extreme weather events did surprisingly not
cause large and detrimental changes in grassland productivity (Kreyling et al., 2010). The
applied treatments could consequently not be called “extreme climatic events” sensu Smith
(Smith, 2011a), as, although being extreme in their magnitude and length relative to the
reference period, they did not cause an extreme response of plant communities, such as
widespread species mortality or community breakdown.
However, although not severely affecting productivity, the weather treatments caused
more subtle changes on a physiological and biogeochemical level that are summarized in
manuscript 1. Slight changes, for example in plant metabolic compounds can affect multiple
ecosystem processes and levels, for instance by decreasing palatability for herbivores or by
changing decomposition rates, which in turn alters trophic interactions and nutrient cycling.
Thus, one objective of this thesis was to elucidate how extreme weather events affect
ecosystem functions beyond productivity, such as plant-herbivore interactions or
decomposition.
Especially mesic grassland communities are often very stable when faced with
extreme drought (see section 2.2.2.), which was also shown in the EVENT I experiment. Yet,
the underlying mechanisms of such a high stability are not well understood. Another objective
of this thesis is to further elucidate possible mechanisms of the surprisingly large resistance or
resilience of plants and plant communities when faced with extreme weather events. Here, the
focus is on a possible stress memory, as up until now it is unclear, how plants and plant
communities react when stress is applied repeatedly over a relatively short time span. On the
one hand, this might lead to a step-wise reduction in the ability to recover, until a total
breakdown of the system (Scheffer et al., 2001). On the other hand, stress acclimation may
lead to a persisting increase in stress resistance, a mechanisms that could be regarded as kind
of stress memory. The consideration of not only an increased event magnitude, but also of an
increased frequency of events is urgently needed in studying climatic extremes (Smith,
2011b).
On this thesis
19
The EVENT I experiment is highly controlled in terms of species composition, as the
planted community compositions were kept constant over the years by periodically weeding.
To investigate if the findings of high stability in the artificially composed plant communities
can be conferred to more natural systems, the EVENT II experiment was established on a
semi-natural meadow in 2008. Here, not only rainfall was manipulated, but also different
land-use scenarios were implemented. This experiment was also designed to answer the
question whether the effects of drought or heavy rain are caused by an overall alteration in
mean annual rainfall amount, or by increased rainfall variability (larger, but fewer rainfall
events) under constant annual rainfall amount. For this reason, in EVENT II rainfall amount
was kept constant from 2009 onwards and only the size of and the intervals between the
rainfall events were varied.
To sum up, the main objectives of this thesis were (1) to investigate if extreme weather
events have an effect on ecosystem functions beyond productivity, (2) to test if the high
stability or resilience in response to drought regarding productivity also exists in more
naturally grown plant communities and (3) to further elucidate possible mechanisms of the
surprisingly large resistance or resilience of the plant communities.
3.2. Outline of manuscripts
The first manuscript summarizes 5 years of drought research in the artificially planted
grassland communities of EVENT I. Extreme drought had no effect on aboveground- or
belowground productivity. Nevertheless, several other physiological and biogeochemical
parameters were affected. If physiological changes on a leaf level influence other ecosystem
levels and processes in the long-term had thus to be investigated.
The second manuscript therefore deals with changes in leaf compounds caused by
extreme drought and resulting effects on herbivores feeding on such leaves. A second focus of
this study was to elucidate effects of plant community composition on leaf compounds and, as
a consequence, herbivore development. The study showed that changes in grass compounds
caused by severe drought affected herbivores feeding on such grass: Caterpillars fed with
drought-subjected leaves showed significantly higher survival, a longer duration of larval
development and higher pupal weight. Further, plant compounds of our target grass depended
on the composition of the plant community it was grown in, which in turn affected herbivore
development: Larvae feeding on species-richest communities without legumes showed the
highest mortality, which was closely linked to low protein content in these leaves. This study
provides evidence that even quite subtle changes in plants caused by drought or community
composition are able to influence biotic interactions and may even lead to desynchronisation
On this thesis
20
of trophic and phenological adjustments under climate change. Furthermore, as climate
change is likely to affect plant community composition, this will further affect leaf quality
and thus plant-herbivore interactions.
The second objective of this thesis was to elucidate possible mechanisms of the high
stability of grassland productivity under climatic extremes. In the first three years of the
EVENT I experiment, a drought of 100-year recurrence was applied (leading to 32 days of
consecutive drought), and in the next years, a drought of 1000 year recurrence was applied. In
every year, the same plots were subjected to drought. One possible mechanisms of resilience
might be that the communities built up an ecological memory that helped them to cope with
drought in the following years. As ecological memory on a community level is difficult to
assess, we focused on an ecological stress memory on a single plant level. Surprisingly few
studies investigated if whole plants are able to remember stress and to react improved towards
a recurrent stress event. This issue is especially important as frequency of extreme weather
events is projected to increase under climate change (Smith, 2011b). Further, a common
definition of stress memory for ecologists is missing. The third manuscript thus first defines
the concept of an ecological stress memory on a whole plant level, reviews the few existing
studies indicating stress memory after climatic stress (drought, frost, heat) and discusses
possible mechanisms of an ecological stress memory, including epigenetic ones.
A drought memory in grass plants was investigated within a pot-experiment in which
one group of plants was subjected to a single drought and the other to recurrent drought
(manuscript 4). This study provided evidence that grass plants are able to remember drought
even after a harvest and resprouting and to show a higher percentage of living biomass, due to
improved photoprotection, when compared to plants subjected to their first drought. Similarly,
the experiment pertaining to manuscript 5 tested frost hardiness of Pinus nigra juveniles and
showed that plants exposed to drought during summer revealed higher frost hardiness in
winter (manuscript 5). As both, frost and drought stress, involve dehydration stress, it might
well be that an ecological cross-stress memory was involved here. Plant frost hardiness in this
study was related to a higher concentration of carbohydrates. Content of carbohydrates is also
often increased under drought (e.g. manuscript 2). Thus, the cross-stress memory indicated in
manuscript 5 might be related to the faster synthesis of soluble carbohydrates.
To test if the findings of the artificially composed plant communities also hold under
more realistic conditions, an extreme drought was also applied on naturally grown grassland
communities in the EVENT II experiment. Here, effects of increased rainfall variability
(changes in timing and distribution of rainfall, but not in overall rainfall sum) on the
On this thesis
21
productivity and some aspects of forage quality of established grassland were investigated. In
contrast to the findings in artificially planted communities (manuscript 1), ANPP and forage
quality were reduced in naturally composed grassland in response to extreme drought
followed by heavy rainfall events (manuscript 6). Mowing frequency strongly altered forage
quality and biomass production, but did did neither buffer, nor amplify effects of extreme
rainfall variability on productiviy, as it did not interact with rainfall variability manipulations.
Despite effects of rainfall variability on ANPP, grassland showed high resilience after
extreme spring drought followed by heavy irrigation, as effects were large shortly after the
extreme event, but did not persist until a second harvest later in the year, when no differences
between the rainfall variability manipulations appeared. In the preceding year, when the
extreme spring drought was not followed by irrigations and thus also received the smallest
overall amount of water, negative effects on productivity were larger and remained until the
second harvest in late summer. Then, formerly drought exposed communities still showed
reduced biomass production. This highlights the important role of a sufficient overall amount
of rainfall for recovery processes in temperate grassland and is in accordance with the drought
studies mentioned in section 2.2.2., showing severely adverse effects of drought primarily in
dry years or in arid biomes. As this thesis investigates effects of extreme weather events on
ecosystems beyond productivity, manuscript 7 reports findings of a long-term decomposition
experiment conducted within EVENT II. Extreme drought reduced litter decomposition when
litter bags were exposed to drought for six weeks within an 11 month period. Surprisingly,
low rainfall variability with regular irrigation decreased decomposition. Additional winter
rain accelerated decomposition, whereas winter warming had no effect on decomposition, but
reduced snow cover and increased variability of surface temperatures. More frequent mowing
strongly stimulated decomposition, which could be attributed to changes in litter quality.
However, the stimulating effect of frequent mowing was absent under extreme rainfall
variability including drought. Projected increases in drought frequency under climate change
may inhibit decomposition and alter nutrient and carbon cycling along with soil quality.
Especially decomposition in intensively managed grassland appears vulnerable towards
drought.
3.3. Emerging research questions
3.3.1. Resilience and stress memory
Often, and also in our study (manuscript 1) grassland shows a surprisingly large
resistance or resilience towards drought. Mechanisms of resilience remain to be elucidated.
On this thesis
22
One likely mechanism is a stress memory of plants that renders them less vulnerable to
repeated stress events (manuscripts 3, 4, 5). However, if such a mechanisms exists also under
natural conditions and also on larger scales, e.g. on a community level, is yet to be
investigated, especially as findings of manuscript 6 imply that grassland resilience under more
natural conditions might be diminished under generally dry conditions. Possible mechanisms
of a stress memory are largely unknown. Joint research of ecologists and molecular biologist
is needed to elucidate possible epigenetic mechanisms. First studies already showed the
heritability of acquired stress tolerance (see manuscript 3). Besides ecological stress memory,
other underlying physiological and biogeochemical processes that serve to maintain
productivity and might thus be mechanisms of community stability and recovery have to be
identified and addressed in future research. Maintaining ecosystem resilience is of major
importance to mitigate and prevent catastrophic consequences of global climate change.
3.3.2. Extreme weather events and ecosystem processes at multiple levels
Up until now, the main response parameter studied in research on extreme climatic
events is primary production (manuscript 1). However, even if primary production remains
stable, other physiological and biogeochemical parameters are changed under extreme
weather events (manuscripts 1, 2, 7). Such changes, e.g. food plant quality might seriously
interfere in ecosystem synchronisation and ecosystem functioning. Further work to study
long-term effects of extreme weather events on, e.g. biotic interactions or biodiversity is
needed to estimate consequences of weather extremes and to enable policy makers to prevent
destabilization of established food-webs and to seize measures for adaptation. How herbivores
might react to changes in their host plant in more natural conditions than the ones described in
manuscript 2 and whether specialists might react differently compared to generalist
herbivores also needs further research. We showed that winter warming did not increase
decomposition, due to loss of snow insulation and increased surface temperature variability.
How decomposition might be affected by summer warming, also in combination with drought
conditions, needs further study. Long-term changes in soil biotic activity under more frequent
mowing needs to be addressed, to find explanations for the higher vulnerability of
decomposition towards drought in more frequently mown communities. Preliminary results of
the EVENT experiments also indicate strong effects of heavy rainfall on biotic interactions,
such as mycorrhiza or decomposer fauna. As heavy rain events are expected to increase in the
future, but are rarely studies yet, more investigations are needed to look at effects of heavy
rain on ecosystem functions.
On this thesis
23
3.3.3. Climate change and land use
Although mowing strongly influences primary productivity in grassland (manuscript 6) it did
neither buffer, nor amplify effects of extreme weather events on productivity in our
experiment. However, increased mowing frequency generally increased N concentration of
leaves and made them more susceptible to altered rainfall variability. The decreased C/N ratio
in more frequently mown plants also led to higher decomposition rates of such litter.
However, this stimulating effect was strongly reduced under drought, which indicates a higher
vulnerability of decomposition towards extreme rainfall variability in more frequently mown
communities. Further research is needed to investigate combined effects of mowing and
rainfall variability on the nutritional value of hay meadows more in detail, including other
parameters, such as fibre content. Management strategies other than mowing frequency that
might be able to buffer adverse effects of increased rainfall variability on productivity and
forage quality of grassland have to be identified.
List of manuscripts and declaration of own contribution
24
List of manuscripts and declaration of own contribution Concept: Idea for the study and development of experimental design or development of an
outline for reviews
Data acquisition: being responsible for organization and execution of data acquisition and
doing the measurements together with the help of students and interns
Data analysis: statistical analysis of data and their illustration in tables and figures
Writing: writing the manuscripts, including literature research
Editing: Proof-reading and grammar editing, including comments and inputs from co-authors
and their integration in the manuscript and preparation for resubmissions after the manuscript
was reviewed by the journals referees
Manuscript 1:
Climate extremes initiate ecosystem-regulating functions while maintaining
productivity
Anke Jentsch, Juergen Kreyling, Michael Elmer, Ellen Gellesch, Bruno Glaser, Kerstin Grant,
Roman Hein, Marco Lara, Heydar Mirzae, Stefanie E. Nadler, Laura Nagy, Denis Otieno,
Karin Pritsch, Uwe Rascher, Martin Schädler, Michael Schloter, Brajesh K. Singh, Jutta
Stadler, Julia Walter, Camilla Wellstein, Jens Wöllecke and Carl Beierkuhnlein
Journal of Ecology, 2011, 99: 689–702.
Concept: 0 %
Data acquisition: 5 %
Data analysis: 5 %
Writing: 5 %
Editing: 5 %
List of manuscripts and declaration of own contribution
25
Manuscript 2:
How do extreme drought and plant community composition affect host plant
metabolites and herbivore performance?
Julia Walter, Roman Hein, Harald Auge, Carl Beierkuhnlein, Sonja Löffler, Kerstin
Reifenrath, Martin Schädler, Michael Weber, Anke Jentsch
Arthropod-Plant Interactions, 2012, 6: 15-25.
Concept: 80 %
Data acquisition: 70 %
Data analysis: 100 %
Writing: 90 %
Editing: 50 %
Corresponding author
Manuscript 3:
Ecological stress memory and cross stress tolerance in plants in the face of climate
extremes
Julia Walter, Anke Jentsch, Carl Beierkuhnlein, Juergen Kreyling
Environmental and Experimental Botany, 2012, in press.
http://dx.doi.org/10.1016/j.envexpbot.2012.02.009
Concept: 60 % (invited review)
Preparation of figures: 90 %
Writing: 70 %
Editing: 70 %
Corresponding author
List of manuscripts and declaration of own contribution
26
Manuscript 4:
Do plants remember drought? Hints towards a drought-memory in grasses
Julia Walter, Laura Nagy, Roman Hein, Uwe Rascher, Carl Beierkuhnlein,
Evelin Willner, Anke Jentsch
Environmental and Experimental Botany, 2011, 71: 34–40.
Concept: 100 %
Data acquisition: 90 %
Data analysis: 100 %
Writing: 90 %
Editing: 50 %
Corresponding author
Manuscript 5:
Cold hardiness of Pinus nigra Arnold as influenced by geographic origin, warming,
and extreme summer drought
Environmental and Experimental Botany, 2012, 78: 99-108.
Concept: 0 %
Data acquisition: 5 %
Data analysis: 0 %
Writing: 5 %
Editing: 15 %
Manuscript 6:
Increased rainfall variability reduces biomass and forage quality of temperate
grassland largely independent of mowing frequency
Julia Walter, Kerstin Grant, Carl Beierkuhnlein, Jürgen Kreyling, Michael Weber, Anke
Jentsch
Agriculture, Ecosystems and Environment, 2012, 148: 1-10.
Concept: 30 %
Data acquisition: 30 %
Data analysis: 90 %
Writing: 90 %
Editing: 30 %
Corresponding author
List of manuscripts and declaration of own contribution
27
Manuscript 7:
Combined effects of multifactor climate change and land-use on decomposition in
temperate grassland
Julia Walter, Roman Hein, Carl Beierkuhnlein, Verena Hammerl, Anke Jentsch, Martin
Schädler, Jan Schuerings, Juergen Kreyling
Submitted to Soil Biology and Biochemistry on July 27th
Concept: 90 %
Data acquisition: 60 %
Data analysis: 100 %
Writing: 90 %
Editing: 30 %
Corresponding author
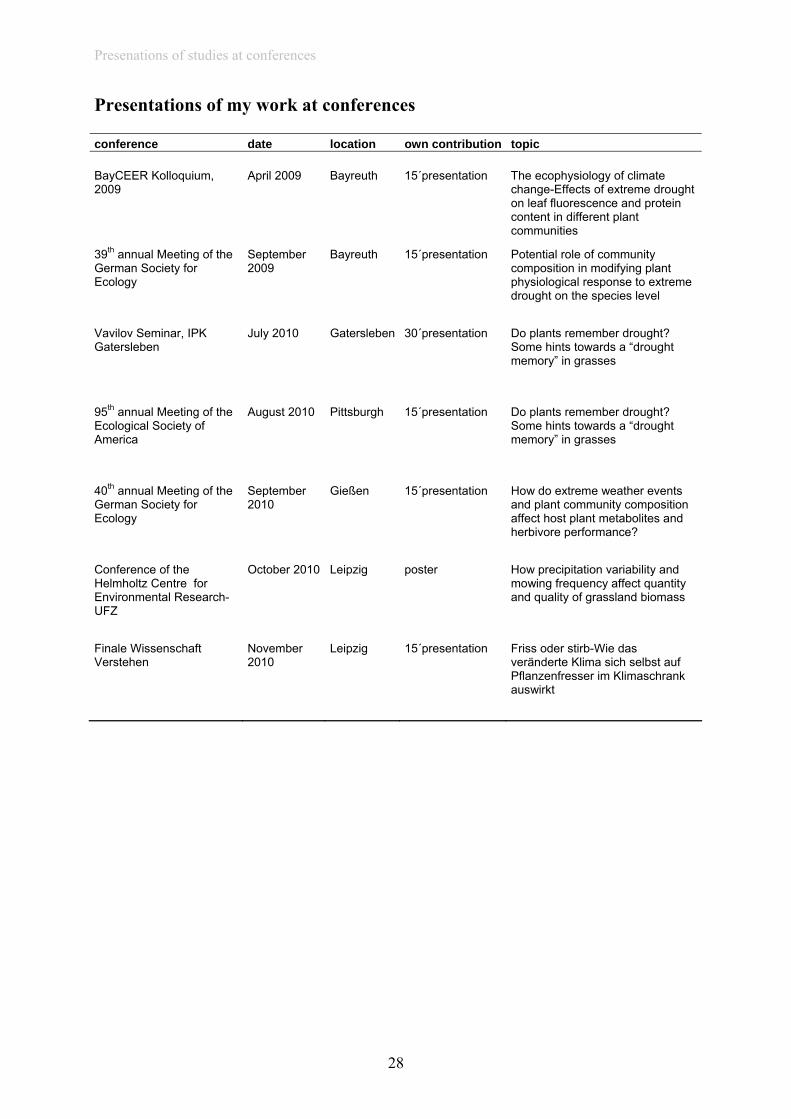
Presenations of studies at conferences
28
Presentations of my work at conferences conference date location own contribution topic BayCEER Kolloquium, 2009
April 2009- Bayreuth 15´presentation The ecophysiology of climate change-Effects of extreme drought on leaf fluorescence and protein content in different plant communities
39th annual Meeting of the German Society for Ecology
September 2009-
Bayreuth 15´presentation Potential role of community composition in modifying plant physiological response to extreme drought on the species level
Vavilov Seminar, IPK Gatersleben
July 2010 Gatersleben 30´presentation Do plants remember drought? Some hints towards a “drought memory” in grasses
95th annual Meeting of the Ecological Society of America
August 2010- Pittsburgh 15´presentation Do plants remember drought? Some hints towards a “drought memory” in grasses
40th annual Meeting of the German Society for Ecology
September 2010-
Gießen 15´presentation How do extreme weather events and plant community composition affect host plant metabolites and herbivore performance?
Conference of the Helmholtz Centre for Environmental Research-UFZ
October 2010 Leipzig poster How precipitation variability and mowing frequency affect quantity and quality of grassland biomass
Finale Wissenschaft Verstehen
November 2010-
Leipzig 15´presentation Friss oder stirb-Wie das veränderte Klima sich selbst auf Pflanzenfresser im Klimaschrank auswirkt
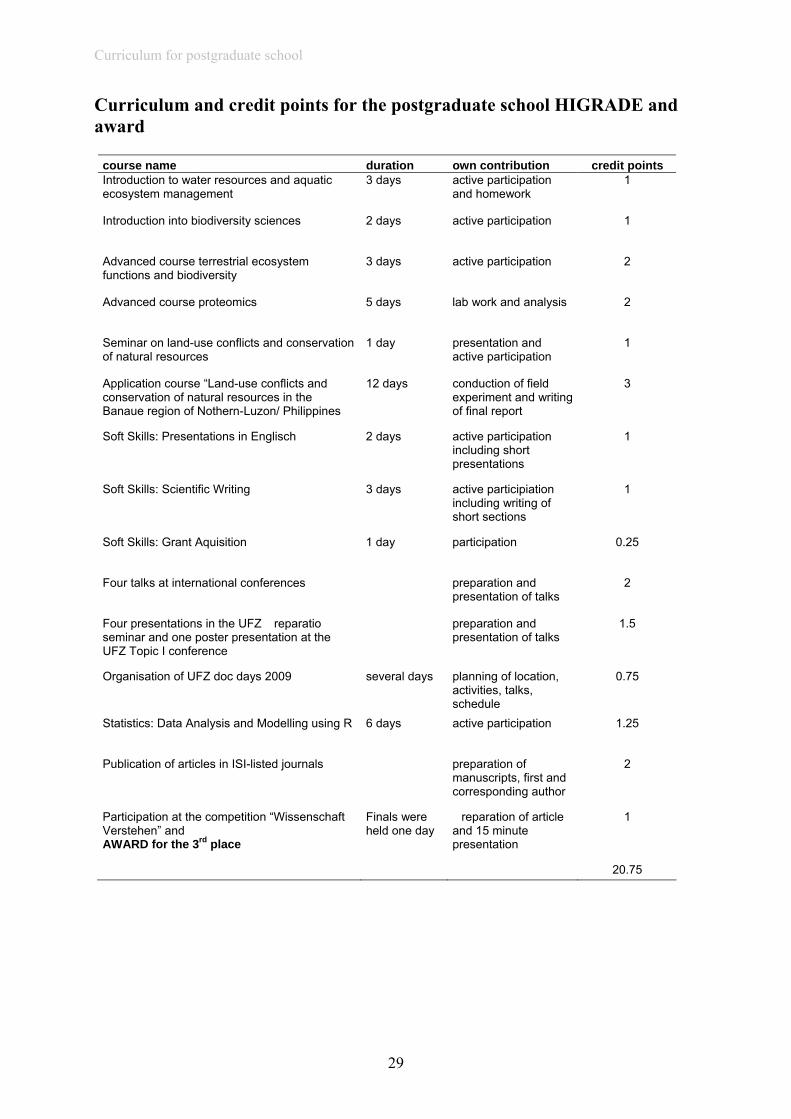
Curriculum for postgraduate school
29
Curriculum and credit points for the postgraduate school HIGRADE and award
course name duration own contribution credit points Introduction to water resources and aquatic ecosystem management
3 days active participation and homework
1
Introduction into biodiversity sciences 2 days active participation 1
Advanced course terrestrial ecosystem functions and biodiversity
3 days active participation 2
Advanced course proteomics 5 days lab work and analysis 2
Seminar on land-use conflicts and conservation of natural resources
1 day presentation and active participation
1
Application course “Land-use conflicts and conservation of natural resources in the Banaue region of Nothern-Luzon/ Philippines
12 days conduction of field experiment and writing of final report
3
Soft Skills: Presentations in Englisch 2 days active participation including short presentations
1
Soft Skills: Scientific Writing 3 days active participiation including writing of short sections
1
Soft Skills: Grant Aquisition 1 day participation 0.25
Four talks at international conferences preparation and presentation of talks
2
Four presentations in the UFZ �reparatio seminar and one poster presentation at the UFZ Topic I conference
preparation and presentation of talks
1.5
Organisation of UFZ doc days 2009 several days planning of location, activities, talks, schedule
0.75
Statistics: Data Analysis and Modelling using R 6 days active participation 1.25
Publication of articles in ISI-listed journals preparation of manuscripts, first and corresponding author
2
Participation at the competition “Wissenschaft Verstehen” and AWARD for the 3rd place
Finals were held one day
�reparation of article and 15 minute presentation
1
20.75
Acknowledgements
30
Acknowledgements: I thank
- Prof. Anke Jentsch for giving me the opportunity to do my phD within her group, for giving
me space to develop own interests and ideas, for providing a working atmosphere that makes
hard work easier, for giving me the chance to present my work at conferences and for being
the family-friendliest supervisor
- my second supervisor, Dr. Harald Auge, for many fruitful discussions and ideas for my
research
- the department of Conservation Biology at the Helmholtz-Centre for Environmental
Research for my nice “winter-home”, Dr. Klaus Henle for giving me the opportunity to work
in Bayreuth during summer and the graduate school HIGRADE for a lot of interesting courses
and trainings and for funding some research stays
- Prof. Carl Beierkuhnlein for giving me the possibility to use (wo)man-power and technical
resources of his group and for fast and helpful editing of my manuscripts
- Dr. Gregor Aas and the staff of the Ecological Botanical Garden of the University of
Bayreuth for their support of the whole experiment
- Prof. Wolfram Beyschlag (University of Bielefeld), Jun.Prof. Christiane Werner-Pinto
(University of Bielefeld), Prof. John Tenhunen (University of Bayreuth), Dr. Uwe Rascher
(FZ Jülich) and Harald Auge (UFZ Halle) for providing us their technical equipment and Dr.
Sonja Löffler (LFE Eberswalde) for her help and support with the leaf chemical analysis
- numerous student workers and interns within the EVENT- experiments for their help in
maintenance, treatment execution and for doing measurements with me, even “pre-dawn”,
especially to Roman Hein, Laura Nagy, Inés Pastor, Julia Gommola, Jan Taucha, Julia Smith,
David Eichenberg and Clesio Gomes da Silva
- all the technicians for their general help in the experiment, and especially Christian Schemm
and Christine Pilsl for their help in the lab and Reinhold Stahlmann for his help with
“computer-stuff”
- all my co-phDs (Kerstin, Laura, David, Roman, Daniel, Jan) and our post-doc, Jürgen
Kreyling, for making field work fun, for physical and psychological support and for many
useful discussions
- my parents, sisters friends and Roman and Smilla (I hope they all know what for)
References
31
References of the Introduction: Adler, P.B., HilleRisLambers, J., Kyriakidis, P.C., Guan, Q., Levine, J.M., 2006. Climate variability has a
stabilizing effect on the coexistence of prairie grasses. Proceedings of the National Academy of Sciences of the United States of America 103, 12793–12798.
Alexander, L., Zhang, X., Peterson, T., Caesar, J., Gleason, B., Klein Tank A.M.G., Haylock, M., Collins, D., Trewin, B., Rahimzadeh, F., Tagipour, A., Rupa Kumar, K., Revadekar, J., Griffiths, G., Vincent, L., Stephenson, D.B., Burn, J., Aguilar, E., Brunet, M., Taylor, M., New, M., Zhai, P., Rusticucci, M., Vazquez-Aguirre, J., 2006. Global observed changes in daily climate extremes of temperature and precipitation. Journal of Geophysical Research- Atmospheres 111, 1–22.
Allan, R., Soden, B., 2008. Atmospheric warming and the amplification of precipitation extremes. Science 321, 1481–1484.
Allen, C.D., Breshears, D.D., 1998. Drought-induced shift of a forest-woodland ecotone: Rapid landscape response to climate variation. Proceedings of the National Academy of Sciences of the United States of America 95, 14839–14842.
Allen, C.D., Macalady, A.K., Chenchouni, H., Bachelet, D., McDowell, N., Vennetier, M., Kitzberger, T., Rigling, A., Breshears, D.D., Hogg, E.H., Gonzalez, P., Fensham, R., Zhang, Z., Castro, J., Demidova, N., Lim, J.-H., Allard, G., Running, S.W., Semerci, A., Cobb, N., 2010. A global overview of drought and heat-induced tree mortality reveals emerging climate change risks for forests. Forest Ecology and Management 259, 660–684.
Allen, M., Ingram, W., 2002. Constraints on future changes in climate and the hydrological cycle. Nature 419, 224–232.
Arnone, J.A., Jasoni, R.L., Lucchesi, A.J., Larsen, J.D., Leger, E.A., Sherry, R.A., Luo, Y., Schimel, D.S., Verburg, P.S., 2011. A climatically extreme year has large impacts on C4 species in tallgrass prairie ecosystems but only minor effects on species richness and other plant functional groups. Journal of Ecology 99, 678–688.
Barrett, J.E., McCulley, R.L., Lane, Burke, I.C., Lauenroth, W.K., 2002. Influence of climate variability on plant production and N-mineralization in Central US grasslands. Journal of Vegetation Science 13, 383–394.
Barriopedro, D., Fischer, E.M., Luterbacher, J., Trigo, R., Garcia-Herrera, R., 2011. The Hot Summer of 2010: Redrawing the Temperature Record Map of Europe. Science 332, 220–224.
Bartholy, J., Pongracz, R., Gelybo, G., Szabo, P., 2008. Analysis of expected climate change in the Carpathian Basin using the PRUDENCE results. Idojaras 112, 249–264.
Beier, C., Emmett, B., Gundersen, P., Tietema, A., Penuelas, J., Estiarte, M., Gordon, C., Gorissen, A., Llorens, L., Roda, F., Williams, D., 2004. Novel approaches to study climate change effects on terrestrial ecosystems in the field: drought and passive nighttime warming. Ecosystems 7, 583–597.
Beierkuhnlein, C., Foken, T., 2008. Klimawandel in Bayern. Auswirkungen und Anpassungsmöglichkeiten. Bayreuther Forum Ökologie 113, Bayreuth.
Beniston, M., Stephenson, D.B., Christensen, O.B., Ferro, C.A.T., Frei, C., Goyette, S., Halsnaes, K., Holt, T., Jylha, K., Koffi, B., Palutikof, J., Schoell, R., Semmler, T., Woth, K., 2007. Future extreme events in European climate: an exploration of regional climate model projections. Climatic Change 81, 71–95.
Bertness, M.D., Callaway, R., 1994. Positive Interactions in Communities. Trends in Ecology and Evolution 9, 191–193.
Blenkinsop, S., Fowler, H.J., 2007. Changes in European drought characteristics projected by the PRUDENCE regional climate models. International Journal of Climatology 27, 1595–1610.
Bloor, J., Pichon, P., Falcimagne, R., Leadley, P., Soussana, J.F., 2010. Effects of warming, summer drought, and CO2 enrichment on aboveground biomass production, flowering phenology, and community structure in an upland grassland ecosystem. Ecosystems 13, 888–900.
Boberg, F., Berg, P., Thejll, P., Gutowski, W.J., Christensen, J.H., 2010. Improved confidence in climate change projections of precipitation further evaluated using daily statistics from ENSEMBLES models. Climate Dynamics 35, 1509–1520.
Boeck, H.J. de, Dreesen, F.E., Janssens, I.A., Nijs, I., 2011. Whole-system responses of experimental plant communities to climate extremes imposed in different seasons. New Phytologist 189, 806-817.
Bohnert, H.J., 2000. What makes desiccation tolerable? Genome biology 1, 1–4. Bokhorst, S., Bjerke, J., Melillo, J., Callaghan, T., Phoenix, G., 2010. Impacts of extreme winter warming events
on litter decomposition in a sub-Arctic heathland. Soil Biology and Biochemistry 42, 611–617. Bokhorst, S.F., Bjerke, J.W., Tommervik, H., Callaghan, T.V., Phoenix, G.K., 2009. Winter warming events
damage sub-Arctic vegetation: consistent evidence from an experimental manipulation and a natural event. Journal of Ecology 97, 1408–1415.
Breshears, D., Cobb, N., Rich, P., Price, K., 2005. Regional vegetation die-off in response to global-change-type drought. Proceedings of the National Academy of Sciences of the United States of America 102, 15144–15148.
References
32
Briffa, K.R., van der Schrier, G., Jones, P.D., 2009. Wet and dry summers in Europe since 1750: evidence of increasing drought. International Journal of Climatology 29, 1894–1905.
Chaves, M.M., Pereira, J.S., Maroco, J., Rodrigues, M.L., Ricardo, C.P., Osorio, M.L., Carvalho, I., Faria, T., Pinheiro, C., 2002. How plants cope with water stress in the field. Photosynthesis and growth. Annals of Botany 89, 907–916.
Chou, W.W., Silver, W.L., Jackson, R.D., Thompson, A.W., Allen-Diaz, B., 2008. The sensitivity of annual grassland carbon cycling to the quantity and timing of rainfall. Global Change Biology 14, 1382–1394.
Christensen, O., Christensen, J., 2004. Intensification of extreme European summer precipitation in a warmer climate. Global and Planetary Change 44, 107–117.
Ciais, P., Reichstein, M., Viovy, N., Granier, A., Ogée, J., Allard, V., Aubinet, M., Buchmann, N., Bernhofer, C., Carrara, A., Chevallier, F., Noblet, N. de, Friend, A.D., Friedlingstein, P., Grünwald, T., Heinesch, B., Keronen, P., Knohl, A., Krinner, G., Loustau, D., Manca, G., Matteucci, G., Miglietta, F., Ourcival, J.M., Papale, D., Pilegaard, K., Rambal, S., Seufert, G., Soussana, J.F., Sanz, M.J., Schulze, E.D., Vesala, T., Valentini, R., 2005. Europe-wide reduction in primary productivity caused by the heat and drought in 2003. Nature 437, 529–533.
Coppola, E., Giorgi, F., 2010. An assessment of temperature and precipitation change projections over Italy from recent global and regional climate model simulations. International Journal of Climatology 30, 11–32.
Dai, A., Trenberth, K.E., Qian, T., 2004. A global dataset of Palmer Drought Severity Index for 1870-2002: Relationship with soil moisture and effects of surface warming. Journal of Hydrometeorology 5, 1117–1130.
Easterling, D.R., Evans, J., Groisman, P., Karl, T.R., Kunkel, K., Ambenje, P., 2000. Observed Variability and Trends in Extreme Climate Events: A Brief Review. Bulletin of the American Meteorological Society 81, 417–425.
Emmett, B.A., Beier, C., Estiarte, M., Tietema, A., Kristensen, H.L., Williams, D., Penuelas, J., Schmidt, I., Sowerby, A., 2004. The response of soil processes to climate change: Results from manipulation studies of shrublands across an environmental gradient. Ecosystems 7, 625–637.
Fay, P.A., Carlisle, J.D., Knapp, A.K., Blair, J.M., Collins, S.L., 2003. Productivity responses to altered rainfall patterns in a C-4-dominated grassland. Oecologia 137, 245–251.
Field, C., Barros, V., Stocker, T., Qin, D., Dokken, D., Ebi, K., Mastrandrea, M., Mach, K., Plattner, G.-K., Allen, S., Tignor, M., Midgley, P. (Eds.), 2012. Managing the Risks of Extreme Events and disasters to Advance Climate Change Adaptation. A Special Report of Working Groups I and II of the Intergovernmental Panel on Climate Change. Cambridge University Press, Cambridge, UK and New York, USA.
Fowler, H.J., Ekstroem, M., 2009. Multi-model ensemble estimates of climate change impacts on UK seasonal precipitation extremes. International Journal of Climatology 29, 385–416.
Gilgen, A.K., Buchmann, N., 2009. Response of temperate grasslands at different altitudes to simulated summer drought differed but scaled with annual precipitation. Biogeosciences 6, 2525–2539.
Grime, J.P., Fridley, J.D., Askew, A.P., Thompson, K., Hodgson, J.G., Bennett, C.R., 2008. Long-term resistance to simulated climate change in an infertile grassland. Proceedings of the National Academy of Sciences of the United States of America 105, 10028–10032.
Groffman, P., Driscoll, C., Fahey, T., Hardy, J., Fitzhug, R., Tierney, G., 2001. Colder soils in a warmer world: a snow manipulation study in a northern hardwood forest ecosystem. Biogeochemistry 56, 135–150.
Groisman, P., Knight, R., Easterling, D.R., Karl, T.R., Hegerl, G., Razuvaev, V., 2005. Trends in intense precipitation in the climate record. Journal of Climate 18, 1326–1350.
Gu, L.P.J., Hanson, W.M., Post, D.P., Kaiser, B., Yang, R., 2008. The 2007 eastern US spring freeze: increased cold damage in a warming world? BioScience 58, 253–262.
Gunderson, L.H., 2000. Ecological resilience - in theory and application. Annual Review of Ecology and Systematics 31, 425–439.
Gutschick, V.P., BassiriRad, H., 2003. Extreme events as shaping physiology, ecology, and evolution of plants: toward a unified definition and evaluation of their consequences. New Phytologist 160, 21–42.
Harper, C.W., Blair, J.M., Fay, P.A., Knapp, A.K., Carlisle, J.D., 2005. Increased rainfall variability and reduced rainfall amount decreases soil CO2 flux in a grassland ecosystem. Global Change Biology 11, 322–334.
Haylock, M., Goodess, C., 2004. Interannual variability of European extreme winter rainfall and links with mean large-scale circulation. International Journal of Climatology 24, 759–776.
Hegerl, G., Zwiers, F., Braconnot, P., Gillett, N., Luo, Y., Marengo, J., Orsini, A., Nicholls, N., Penner, J., Stott, P., 2007. Understanding and Attributing Climate Change. In: Solomon, S., Qin, D., Manning, M., Chen, Z., Marquis, M., Averyt, K., Tignor, M., Miller, H. (Eds.), Climate change 2007: the physical science basis. Contribution of working group I to the fourth assessment report of the intergovernmental panel on climate change. Cambridge University Press, Cambridge, UK and New York, USA, pp. 663–745.
Heisler, J., Weltzin, J., 2006. Variability matters: towards a perspective on the influence of precipitation on terrestrial ecosystems. New Phytologist 172, 189–192.
References
33
Heisler-White, J.L., Blair, J.M., Kelly, E.F., Harmoney, K., Knapp, A.K., 2009. Contingent productivity responses to more extreme rainfall regimes across a grassland biome. Global Change Biology 15, 2894–2904.
Heisler-White, J.L., Knapp, A.K., Kelly, E.F., 2008. Increasing precipitation event size increases aboveground net primary productivity in a semi-arid grassland. Oecologia 158, 129–140.
Holling, C., 1973. Resilience and stability of ecological systems. Annual Review of Ecological Systems 4, 1–23. Houghton, J., Ding, Y., Griggs, D., Noguer, M., van der Linden, P., Dai, X., Maskell, K., Johnson, C., 2001.
Climate Change 2001: The Scientific Basis. Contribution of Working Group I to the Third Assessment Report of the Intergovernmental Panel on Climate Change. Cambridge University Press, Cambridge, UK and New York, USA.
Houghton, J., Meira Filho, L., Callander, B., Harris, N., Kattenberg, A., Maskell, K., 1995. Climate Change 1995- The science of climate change.Contribution of WGI to the Second Assessment Report of the Intergovernmental Panel on Climate Change. Cambridge University Press, Cambridge, UK and New York, USA.
Houghton, J., Callander, B., Varney, S., 1992. Climate Change 1992: The Supplementary Report to the IPCC Scientific Assessment. Cambridge University Press, Cambridge, UK, New York, USA and Victoria, Australia.
Hughes, L., 2000. Biological consequences of global warming: is the signal already apparent? Trends in Ecology and Evolution 15, 56–61.
Hulme, M., 2005. Recent climate trends. In: Lovejoy, T., Hannah, L. (Eds.), Climate change and biodiversity. Yale University Press, Yale, pp. 31–40.
Huntington, T., 2006. Evidence for intensification of the global water cycle: Review and synthesis. Journal of Hydrology 319, 83–95.
Hurlbert, S., 1984. Pseudoreplication and the design of ecological experiments. Ecological monographs 54, 187–211.
Iglesias, A., Quiroga, S., Schlickenrieder, J., 2010. Climate change and agricultural adaptation: assessing management uncertainty for four crop types in Spain. Climate Research 44, 83–94.
Jacob, D., 2009. Regionalisierte Szenarien des Klimawandels-Regional climate change scenarios. Raumforschung und Raumordnung 69, 89–96.
Janska, A., Marsik, P., Zelenkova, S., Ovesna, J., 2010. Cold stress and acclimation - what is important for metabolic adjustment? Plant Biology 12, 395–405.
Jentsch, A., Kreyling, J., Beierkuhnlein, C., 2007. A new generation of climate-change experiments: events, not trends. Frontiers in Ecology and the Environment 5, 365–374.
Jylhä, K., Fronzek, S., Tuomenvirta, H., Carter, T.R., Ruosteenoja, K., 2008. Changes in frost, snow and Baltic sea ice by the end of the twenty-first century based on climate model projections for Europe. Climatic Change 86, 441–462.
Karl, T.R., Knight, R.W., 1998. Secular trends of precipitation amount, frequency, and intensity in the United States. Bulletin of the American Meteorological Society 79, 231–241.
Keyantash, J., Dracup, J., 2002. The quantification of drought: An evaluation of drought indices. Bulletin of the American Meteorological Society 83, 1167–1180.
Kioutsioukis, I., Melas, D., Zerefos, C., 2010. Statistical assessment of changes in climate extremes over Greece (1955-2002). International Journal of Climatology 30, 1723–1737.
Klein Tank, A., Können, G., 2003. Trends in indices of daily temperature and precipitation extremes in Europe, 1946-99. Journal of Climate, 3665–3680.
Knapp, A.K., Fay, P.A., Blair, J.M., Collins, S.L., Smith, M.D., Carlisle, J.D., Harper, C.W., Danner, B.T., Lett, M.S., McCarron, J.K., 2002. Rainfall variability, carbon cycling, and plant species diversity in a mesic grassland. Science 298, 2202–2205.
Knapp, A.K., Beier, C., Briske, D.D., Classen, A.T., Luo, Y., Reichstein, M., Smith, M.D., Smith, S.D., Bell, J.E., Fay, P.A., Heisler, J.L., Leavitt, S.W., Sherry, R., Smith, B., Weng, E., 2008. Consequences of more extreme precipitation regimes for terrestrial ecosystems. BioScience 58, 811–821.
Kodra, E., Steinhaeuser, K., Ganguly, A., 2011. Persisting cold extremes under 21st -century warming scenarios. Geophysical Research Letters 38, doi:10.1029/2011GL047103.
Kreyling, J., 2010. Winter climate change: a critical factor for temperate vegetation performance. Ecology 91, 1939–1948.
Kreyling, J., Beierkuhnlein, C., Jentsch, A., 2010. Effects of soil freeze-thaw cycles differ between experimental plant communities. Basic and applied Ecology 11, 65–75.
Kreyling, J., Wenigmann, M., Beierkuhnlein, C., Jentsch, A., 2008. Effects of extreme weather events on plant productivity and tissue die-back are modified by community composition. Ecosystems 11, 752–763.
Lambers, H., Chapin III, F., Pons, T., 2008. Plant Physiological Ecology. Springer, New York. Larsen, K.S., Andresen, L.C., Beier, C., Jonasson, S., Albert, K.R., Ambus, P.E., Arndal, M.F., Carter, M.S.,
Christensen, S., Holmstrup, M., Ibrom, A., Kongstad, J., van der Linden, L., Maraldo, K., Michelsen, A., Mikkelsen, T.N., Pilegaard, K.I., Priemé, A., Ro-Poulsen, H., Schmidt, I.K., Selstedt, M.B., Stevnbak, K.,
References
34
2011. Reduced N cycling in response to elevated CO2, warming, and drought in a Danish heathland: Synthesizing results of the CLIMAITE project after two years of treatments. Global Change Biology 17, 1884–1899.
Li, Y., Ye, W., Wang, M., Yan, X., 2009. Climate change and drought: a risk assessment of crop-yield impacts. Climate Research 39, 31–46.
Lloret, F., Siscart, D., Dalmases, C., 2004. Canopy recovery after drought dieback in holm-oak Mediterranean forests of Catalonia (NE Spain). Global Change Biology 10, 2092-2099.
Lopez-Moreno, J.I., Vicente-Serrano, S.M., Angulo-Martinez, M., Begueria, S., Kenawy, A., 2010. Trends in daily precipitation on the northeastern Iberian Peninsula, 1955-2006. International Journal of Climatology 30, 1026–1041.
Ludwig, F., Dawson, T.E., Prins, H.H., Berendse, F., Kroon, H. de, 2004. Below-ground competition between trees and grasses may overwhelm the facilitative effects of hydraulic lift. Ecology Letters 7, 623–631.
Maestre, F.T., Cortina, J., 2004. Do positive interactions increase with abiotic stress? - A test from a semi-arid steppe. Proceedings of the Royal Society of Series B- Biological Sciences 271, S331-S333.
Marchand, F.L., Kockelbergh, F., van de Vijver, B., Beyens, L., Nijs, I., 2006. Are heat and cold resistance of arctic species affected by successive extreme temperature events? New Phytologist 170, 291–300.
Marchand, F.L., Mertens, S., Kockelbergh, F., Beyens, L., Nijs, I., 2005. Performance of High Arctic tundra plants improved during but deteriorated after exposure to a simulated extreme temperature event.Global Change Biology 11, 2078-2089.
Marchand, P., 1996. Life in the cold. An introduction to winter ecology. University Press of New England, Hanover, New Hampshire, USA.
Marengo, J.A., Rusticucci, M., Penalba, O., Renom, M., 2010. An intercomparison of observed and simulated extreme rainfall and temperature events during the last half of the twentieth century: part 2: historical trends. Climatic Change 98, 509–529.
McCarty, J., 2001. Ecological consequences of recent climate change. Conservation Biology 15, 320–331. Meehl, C., Zwiers, F., Evans, J., Knutson, T., Mearns, L., Whetton, P., 2000a. Trends in extreme weather and
climate events: issues related to modeling extremes in projections of future climate change. Bulletin of the American Meteorological Society 81, 427–436.
Meehl, C., Karl, T., Easterling, D.R., Changnon, S., Pielke Jr., R., Changnon, D., Evans, J., Groisman, P., Knutson, T., Kunkel, K., Mearns, L., Parmesan, C., Pulwarty, R., Root, T., Sylves, R., Whetton, P., Zwiers, F., 2000b. An introduction to trends in extreme weather and climate events: observations, socioeconomic impacts, terrestrial ecological impacts, and model Projections. Bulletin of the American Meteorological Society 81, 413–416.
Meehl, G.A., Stocker ,T.F., Collins, W.D., Friedlingstein, P., Gaye, A.T., Gregory, J.M., Kitoh, A., Knutti, R., Murphy, J.M., Noda, A., Raper, S.C.B., Watterson, I.G., Weaver, A.J., Zhao, Z.-C, 2007. Global climate projections. In: Solomon, S., Qin, D., Manning, M., Chen, Z., Marquis, M., Averyt, K., Tignor, M., Miller, H. (Eds.), Climate change 2007: the physical science basis. Contribution of working group I to the fourth assessment report of the intergovernmental panel on climate change. Cambridge University Press, Cambridge, UK and New York, USA, pp. 748–845.
Mikkelsen, T.N., Beier, C., Jonasson, S., Holmstrup, M., Schmidt, I.K., Ambus, P., Pilegaard, K., Michelsen, A., Albert, K., Andresen, L.C., Arndal, M.F., Bruun, N., Christensen, S., Danbaek, S., Gundersen, P., Jorgensen, P., Linden, L.G., Kongstad, J., Maraldo, K., Prieme, A., Riis-Nielsen, T., Ro-Poulsen, H., Stevnbak, K., Selsted, M.B., Sorensen, P., Larsen, K.S., Carter, M.S., Ibrom, A., Martinussen, T., Miglietta, F., Sverdrup, H., 2008. Experimental design of multifactor climate change experiments with elevated CO2, warming and drought: the CLIMAITE project. Functional Ecology 22, 185–195.
Min, S.-K., Zhang, X., Zwiers, F.W., Hegerl, G.C., 2011. Human contribution to more-intense precipitation extremes. Nature 470, 378–381.
Miranda, J.D. de, Padilla, F.M., Lazaro, R., Pugnaire, I.F., 2009. Do changes in rainfall patterns affect semiarid annual plant communities? Journal of Vegetation Science 20, 269–276.
Morecroft, M., Masters, G., Brown, V., Clarke, I., Taylor, M., Whitehouse, A., 2004. Changing precipitation patterns alter plant community dynamics and succession in an ex-arable grassland. Functional Ecology 18. 648-655.
Moriondo, M., Bindi, M., Kundzewicz, Z.W., Szwed, M., Chorynski, A., Matczak, P., Radziejewski, M., McEvoy, D., Wreford, A., 2010. Impact and adaptation opportunities for European agriculture in response to climatic change and variability. Mitigation and Adaptation Strategies for Global Change 15, 657-679.
Mueller, R.C., Scudder, C.M., Porter, M.E., Talbot Trotter, R., Gehring, C.A., Whitham, T.G., 2005. Differential tree mortality in response to severe drought: evidence for long-term vegetation shifts. Journal of Ecology 93, 1085–1093.
Munne-Bosch, S., Alegre, L., 2000. Changes in carotenoids, tocopherols and diterpenes during drought and recovery, and the biological significance of chlorophyll loss in Rosmarinus officinalis plants. Planta 210, 925–931.
References
35
Naudtsa, K., van den Bergen, j., Janssens, I., Nijs, I., Ceulemans, A., 2011. Does an extreme drought event alter the response of grassland communities to a changing climate? Environmental and Experimental Botany 70, 151–157.
Newman, G.S., Arthur, M.A., Muller, R.N., 2006. Above- and belowground net primary production in a temperate mixed deciduous forest. Ecosystems 9, 317–329.
Nicholls, N., Alexander, L., 2007. Has the climate become more variable or extreme? Progress 1992-2006. Progress in Physical Geography 31, 77-87.
Noormets, A., McNulty, S.G., DeForest, J.L., Sun, G., Li, Q., Chen, J., 2008. Drought during canopy development has lasting effect on annual carbon balance in a deciduous temperate forest. New Phytologist 179, 818–828.
O‘Gorman, P.A., Schneider, T., 2009. The physical basis for increases in precipitation extremes in simulations of 21st-century climate change. Proceedings of the National Academy of Sciences of the United States of America 106, 14773–14777.
Parcellier, A., Gurbuxani, S., Schmitt, E., Solary, E., Garrido, C., 2003. Heat shock proteins, cellular chaperones that modulate mitochondrial cell death pathways. Biochemical and Biophysical Research Communications 304, 505–512.
Parmesan, C., Yohe, G., 2003. A globally coherent fingerprint of climate change impacts across natural systems. Nature 421, 37–42.
Penuelas, J., Gordon, C., Llorens, L., Nielsen, T., Tietema, A., Beier, C., Bruna, P., Emmett, B., Estiarte, M., Gorissen, A., 2004. Nonintrusive field experiments show different plant responses to warming and drought among sites, seasons, and species in a north-south European gradient. Ecosystems 7, 598–612.
Penuelas, J., Prieto, P., Beier, C., Cesaraccio, C., Angelis, P. de, Dato, G. de, Emmett, B.A., Estiarte, M., Garadnai, J., Gorissen, A., Lang, E.K., Kroeel-Dulay, G., Llorens, L., Pellizzaro, G., Riis-Nielsen, T., Schmidt, I.K., Sirca, C., Sowerby, A., Spano, D., Tietema, A., 2007. Response of plant species richness and primary productivity in shrublands along a north-south gradient in Europe to seven years of experimental warming and drought: reductions in primary productivity in the heat and drought year of 2003. Global Change Biology 13, 2563–2581.
Raisanen, J., Joelsson, R., 2001. Changes in average and extreme precipitation in two regional climate model experiments. Tellus Series A-Dynamic Meteorology and Oceanography 53, 547–566.
Rapacz, M., Plazek, A., Niemczyk, E., 2000. Frost de-acclimation of barley (Hordeum vulgare L.) and meadow fescue (Festuca pratensis Huds.). Relationship between soluble carbohydrate content and resistance to frost and the fungal pathogen Bipolaris sorokiniana (Sacc.) Shoem. Annals of Botany 86, 539–545.
Rigby, J.R., Porporato, A., 2008. Spring frost risk in a changing climate. Geophysical Research Letters 35. Robock, A., Vinnikow, K., Srinivasan, G., Entin, J., Hollinger, S., Spreranskaya, N., Liu, S., Namkhai, A., 2000.
The global soil moisture data bank. Bulletin of the American Meteorological Society 81, 1281–1299. Sakai, A., Larcher, W., 1987. Frost survival of plants. Springer, Berlin, London. Salinger, M., 2005. Trends in extreme weather and climate events: issues related to modeling extremes in
projections of future climate change. Climatic Change 70, 9–29. Schaer, C., Jendritzky, G., 2004. Climate change: Hot news from summer 2003. Nature 432, 559–560. Scheffer, M., Carpenter, S., Foley, J.A., Folke, C., Walker, B., 2001. Catastrophic shifts in ecosystems. Nature
413, 591–596. Schönwiese, C.-D., Staeger, T., S. Trömel, S., 2005. Klimawandel und Extremereignisse in Deutschland.
Klimastatusbericht 2005, Deutscher Wetterdienst. http://www.geo.uni-frankfurt.de/iau/klima/PDF_Dateien/Sw_et_al-Klimawandel_Extrem-KSB2005.pdf
Schröter, D., Cramer, W., Leemans, R., Prentice, I., Araujo, M., Arnell, N., Bondeau, A., Bugmann, H., Carter, T., Gracia, C.A., La Vega-Leinert, A. de, Erhard, M., Ewert, F., Glendining, M., House, J., Kankaanpää, S., Klein, R., Lavorel, S., Lindner, M., Metzger, M., Meyer, J., Mitchell, T., Reginster, I., Rounsevell, M., Sabaté, S., Sitch, S., Smith, B., Smith, J., Smith, P., Sykes, M., Thonicke, K., Thuiller, W., Tuck, G., Zaehle, S., Zierl, B., 2005. Ecosystem service supply and vulnerability to global change in Europe. Science 310, 1333–1337.
Schulze, E., Beck, E., Müller-Hohenstein, K., 2005. Plant Ecology. Springer, Berlin, London. Smith, M.D., 2011a. An ecological perspective on extreme climatic events: a synthetic definition and framework
to guide future research. Journal of Ecology 99, 656–663. Smith, M.D., 2011b. The ecological role of climate extremes: current understanding and future prospects.
Journal of Ecology 99, 651–655. Sowerby, A., Emmett, B., Tietema, A., Beier, C., 2008. Contrasting effects of repeated summer drought on soil
carbon efflux in hydric and mesic heathland soils. Global Change Biology 14, 2388–2404. Strimbeck, G., Schaberg, P., Hayes, D., Shane, J., Hawley, G., 1995. Midwinter dehardening of montane red
spruce during a natural thaw. Canadian Journal of Forest Research 25, 2040–2044. Suttle, K.B., Thomsen, M.A., Power, M.E., 2007. Species interactions reverse grassland responses to changing
climate. Science 315, 640–642.
References
36
Tebaldi, C., Hayhoe, K., Arblaster, J.M., Meehl, G.A., 2006. Going to the extremes. Climatic Change 79, 185–211.
Thomas, C., Cameron, A., Green, E., Bakkenes, M., Beaumont, L., Collingham, Y., Erasmus, B., Ferreira Siquiere, M. de, Grainger, A., Hannah, L., Hughes, L., Huntley, B., van Jaarsveld, A., Midgley, G., Miles, L., Ortega-Huerta, M., Peterson, T., Philipps, O., Williams, S., 2004. Extinction risk from climate change. Nature 427, 145–148.
Thomashow, M., 1999. Plant cold acclimation: Freezing Tolerance Genes and Regulatory Mechanisms. Annual Reviews in Plant Physiology and Plant Molecular Biolology 50, 571–599.
Thompson, I., Mackey, B., McNulty, S., Mosseler, A., 2009. Forest resilience, biodiversity, and climate change. A synthesis of the biodiversity/resilience/stability relationsship in forest ecosystems. Secretariat of the convention on biodiversity. CBD Technical Seriex no. 43, Montreal.
Thuiller, W., 2007. Climate change and the ecologist. Nature 448. 550-552 Thuiller, W., Lavorel, S., Araujo, M., Sykes, M., Prentice, I., 2005. Climate change threats to plant diversity in
Europe. Proceedings of the National Academy of Sciences of the United States of America 102, 8245–8250. Tielborger, K., Kadmon, R., 2000. Temporal environmental variation tips the balance between facilitation and
interference in desert plants. Ecology 81, 1544–1553. Toberman, H., Evans, C.D., Freeman, C., Fenner, N., White, M., Emmett, B.A., Artz, R.R.E., 2008. Summer
drought effects upon soil and litter extracellular phenol oxidase activity and soluble carbon release in an upland Calluna heathland. Soil Biology and Biochemistry 40, 1519–1532.
Trenberth, K., Jones P.D, Ambenje P., Bojariu, R., Easterling, D., Klein Tank, A., Parker, D., Rahimzadeh, F., Renwick, J., Rusticucci, M., Soden, B., Zhai, P., 2007. Observations: Surface and Atmospheric Climate Change. In: Solomon, S., Qin, D., Manning, M., Chen, Z., Marquis, M., Averyt, K., Tignor, M., Miller, H. (Eds.), Climate change 2007: the physical science basis. Contribution of working group I to the fourth assessment report of the intergovernmental panel on climate change. Cambridge University Press, Cambridge, UK and New York, USA, pp. 235–336.
Trenberth, K.E., Dai, A., Rasmussen, R.M., Parsons, D.B., 2003. The changing character of precipitation. Bulletin of the American Meteorological Society 84, 1205–1217.
van Peer, L., Nijs, I., Reheul, D., Cauwer, B. de, 2004. Species richness and susceptibility to heat and drought extremes in synthesized grassland ecosystems: compositional vs physiological effects. Functional Ecology 18, 769–778.
van Ruijven, J., Berendse, F., 2010. Diversity enhances community recovery, but not resistance, after drought. Journal of Ecology 98, 81–86.
Visser, M., Holleman, L., 2001. Warmer springs disrupt the synchrony of oak and winter moth phenology. Proceedings of the Royal Society of Series B- Biological Sciences 268, 289–294.
Walther, G., Post, E., Convey, P., Menzel, A., Parmesan, C., Beebee, T., Fromentin, J.-C., Hoegh-Guldberg, O., Bairlein, F., 2002. Ecological response to recent climate change. Nature 416, 389–395.
Wang, H., Fu, R., Kumar, A., Li, W., 2010. Intensification of summer rainfall variability in the Southeastern United States during recent decades. Journal of Hydrometeorology 11, 1007–1018.
Wasilewska, A., Vlad, F., Sirichandra, C., Redko, Y., Jammes, F., Valon, C., Frey, N.F.d., Leung, J., 2008. An update on abscisic acid signaling in plants and more … Molecular Plant 1, 198–217.
Woldendorp, G., Hill, M., Doran, R., Ball, M., 2008. Frost in a future climate: modelling interactive effects of warmer temperatures and rising atmospheric CO2 on the incidence and severity of frost damage in a temperate evergreen (Eucalyptus pauciflora). Global Change Biology 14, 294–308.
Zebisch, M., Grothmann, T., Schröter, D., Hasse, C., Fritsch, U., Cramer, W., 2012. Climate Change-Klimawandel in Deutschland. Vulnerabilität und Anpassungsstrategienklimasensitiver Systeme-UBA Forschungsbericht, www.umweltdaten.de/publikationen/fpdf-l/2947.pdf.
Manuscript 1: Climate extremes initiate ecosystem regulating functions while maintaining productivity
37
Manuscript 1: Climate extremes initiate ecosystem regulating functions
while maintaining productivity Journal of Ecology, 2011, 99: 689–702.
Anke Jentsch1*, Juergen Kreyling2, Michael Elmer3, Ellen Gellesch2, Bruno Glaser4, Kerstin
Grant2, Roman Hein2, Marco Lara4, Heydar Mirzae6, Stefanie E. Nadler2, Laura Nagy1, Denis
Otieno6, Karin Pritsch7, Uwe Rascher8, Martin Schädler9, Michael Schloter7, Brajesh K.
Singh10, Jutta Stadler9, Julia Walter11, Camilla Wellstein2, Jens Wöllecke3 and Carl
Beierkuhnlein2
1 Disturbance Ecology, University of Bayreuth, D-95440 Bayreuth, Germany. E-mail: [email protected] 2 Biogeography, University of Bayreuth, 95440 Bayreuth, Germany. 3 Soil Protection and Recultivation, BTU Cottbus, Konrad-Wachsmann-Allee 6, 03046 Cottbus, Germany. 4 Soilphysics, University of Bayreuth, 95449 Bayreuth, Germany 5 Soil Biogeochemistry, Martin-Luther University of Halle-Wittenberg, von Seckendorfplatz 3, 06120 Halle, Germany. 6 Plant Ecology, University of Bayreuth, 95440 Bayreuth, Germany. 7 Terrestrial Ecogenetics, Helmholtz Zentrum Muenchen, German Research Center for Environmental Health, Ingolstaedter Landstraβe 1, 85764 Neuherberg, Germany. 8 Institute of Chemistry and Dynamics of the Geosphere, ICG-3, Phytosphere, Research Centre Jülich, Leo-Brandt-Str., D-52425 Jülich, Germany. 9 Community Ecology, Helmholtz-Centre for Environmental Research – UFZ, Theodor-Lieser-Str. 4, 06110 Halle, Germany. 10 Centre for Plants and Environment, University of Western Sydney, Penrith South DC, NSW, Australia. 11 Conservation Biology, UFZ-Helmholtz, Centre für Environmental Research, Permoserstr. 15, 04318 Leipzig, Germany. Corresponding author: Prof. Dr. Anke Jentsch, E-mail: [email protected]
Running title: Drought effect on multiple ecosystem services
Summary
1. Studying the effects of extreme climatic or weather events such as drought and heat waves
on biodiversity and ecosystem functions is one of the most important facets of climate change
research. In particular, primary production is amounting to the common currency in field
experiments worldwide. Rarely, however, are multiple ecosystem functions measured in a
single study in order to address general patterns across different categories of responses and to
analyse effects of climate extremes on various ecosystem functions.
2. We set up a long-term field experiment, where we applied recurrent severe drought events
annually for five consecutive years to constructed grassland communities in central Europe.
Manuscript 1: Climate extremes initiate ecosystem regulating functions while maintaining productivity
38
The 32 response parameters studied were closely related to ecosystem functions such as
primary production, nutrient cycling, carbon fixation, water regulation and community
stability.
3. Surprisingly, in the face of severe drought, above- and below-ground primary production of
plants remained stable across all years of the drought manipulation.
4. Yet, severe drought significantly reduced below-ground performance of microbes in soil
indicated by reduced soil respiration, microbial biomass and cellulose decomposition rates as
well as mycorrhization rates. Furthermore, drought reduced leaf water potential, leaf gas
exchange and leaf protein content, while increasing maximum uptake capacity, leaf carbon
isotope signature and leaf carbohydrate content. With regard to community stability, drought
induced complementary plant–plant interactions and shifts in flower phenology, and
decreased invasibility of plant communities and primary consumer abundance.
5. Synthesis. Our results provide the first field-based experimental evidence that climate
extremes initiate plant physiological processes, which may serve to regulate ecosystem
productivity. A potential reason for different dynamics in various ecosystem services facing
extreme climatic events may lie in the temporal hierarchy of patterns of fast versus slow
response Such data on multiple response parameters within climate change experiments foster
the understanding of mechanisms of resilience, of synergisms or decoupling of
biogeochemical processes, and of fundamental response dynamics to drought at the ecosystem
level including potential tipping points and thresholds of regime shift. Future work is needed
to elucidate the role of biodiversity and of biotic interactions in modulating ecosystem
response to extreme climatic events.
Keywords: below-ground, competition, decomposition, invasion, leaf chemistry, microbial,
phenology, plant–climate interactions, precipitation change, productivity
Introduction
Currently, knowledge about ecological responses to climate change is based largely on
effects of climatic trends such as gradual warming, precipitation change and CO2 enrichment.
However, the magnitude and frequency of extreme climatic or weather events such as severe
drought, heat waves, heavy rain and late frost events are expected to increase in the near
future (IPCC 2007; O’Gorman & Schneider 2009). Thus, predictions of effects of climate
Manuscript 1: Climate extremes initiate ecosystem regulating functions while maintaining productivity
39
extremes on species, communities and ecosystems have become critical to science and
society. Yet, consequences of future extreme climate events for ecosystem functions and
services are largely unknown and have only recently been addressed by ecological research
(Gutschick & BassiriRad 2003; Schröter et al. 2005; Jentsch 2006; Suttle, Thomsen & Power
2007; Jentsch, Kreyling & Beierkuhnlein 2007; Knapp et al. 2008; Fisher et al. 2009; Jentsch
& Beierkuhnlein 2010).
There is growing concern that climatic extremes such as severe drought could
negatively affect ecosystem functioning and stability. A review of the literature revealed that
the focus over the last decade has been primarily on primary productivity (Figure S1a-d and
Table S1 in Supporting Information), one of the major common currencies in global ecology.
The findings from existing climate change studies on drought effects are highly controversial.
While some field experiments showed that natural and simulated drought led to decreases of
primary productivity (Olesen & Bindi 2002; Morecroft et al. 2004; Penuelas et al. 2004; Ciais
et al. 2005), others did not find any significant effects of locally severe drought manipulations
(Fay et al. 2000; Kreyling et al. 2008c). Generally, evidence suggests that an elongation of
inter-rainfall intervals as well as changes in seasonal timing are more likely to cause a
reduction of above-ground net primary productivity (ANPP) than reduced total rainfall
quantity per se (Fay et al. 2000; Swemmer, Knapp & Snyman 2007).
However, further aspects confound the debate on ecosystem functioning in the light of
climate change. First, the role of biodiversity in ensuring the performance of ecosystem
functioning (Balvanera 2006; Worm et al. 2006; Hector & Bagchi 2007; Suttle, Thomsen &
Power 2007) and in enhancing resistance or resilience to drought has been proven to be
fundamental (Pfisterer & Schmid 2002; Kahmen, Perner & Buchmann 2005; De Boeck et al.
2008; van Ruijven & Brendse 2010). Second, multiple ecosystem functions in the face of
climate extremes have rarely been addressed simultaneously in experiments (Jentsch,
Kreyling & Beierkuhnlein 2007; Jentsch & Beierkuhnlein 2008; 2010). Prevailing response
parameters in climate change experiments are above-ground production, soil C:N ratio and
soil respiration (Figure S1d). However, the interrelationships between above-ground primary
production and below-ground nutrient cycling, carbon fixation or water regulation are rarely
addressed.
Here, we analyse the effects of recurrent severe drought (local 100-year or1000-year
extreme events) on multiple ecosystem properties of a planted grassland in Central Europe in
a long-term field experiment (EVENT-I) located in Bayreuth, Germany. Semi-natural
European grasslands are widespread, of economic value, provide many ecological services
Manuscript 1: Climate extremes initiate ecosystem regulating functions while maintaining productivity
40
and are important for nature conservation. They have been managed either as hay meadows or
pastures in Europe for thousands of years.
Our goal was to assess whether there are general patterns across these different
categories of important ecosystem functions including primary productivity, water regulation,
carbon fixation, nutrient cycling and compositional stability to climate extremes.
We expected the grassland ecosystem to react sensitively to extreme recurrent drought events,
and specifically hypothesized that (i) above-ground productivity would be decreased and that
(ii) other ecosystem functions, such as water regulation, carbon fixation, nutrient cycling and
compositional stability, would be negatively impacted.
Materials and methods
Experimental Design
The EVENT-I experiment (Jentsch, Kreyling & Beierkuhnlein 2007) is established in
the Ecological Botanical Garden of the University of Bayreuth, Germany (49˚55’19”N,
11˚34’55”E, 365 m a.s.l.) with a mean annual temperature of 8.2 ˚C and a mean annual
precipitation of 724 mm (1971 - 2000). Precipitation is distributed bi-modally with a major
peak in June/July and a second peak in December/January (data: German Weather Service).
The experiment was carried out with two fully crossed factors: (1) extreme climatic event
(severe drought, ambient control), (2) community diversity (two species of one functional
group, four species of two functional groups, and four species of three functional groups,
monocultures of particular species), representing key species combinations of grassland. The
total setup consisted of 5 replicates of each factorial combination, 60 plots in total of 2 × 2 m
in size. The factors were applied in a split-plot design with the vegetation types and diversity
levels blocked and randomly assigned within each drought manipulation (Jentsch, Kreyling &
Beierkuhnlein 2007). The originally installed species composition was maintained by
periodical weeding. The texture of the previously homogenized and constantly drained soil
consisted of loamy sand (82 % sand, 13 % silt, 5 % clay) with pH = 4.5 in the upper and pH =
6.2 in the lower soil layer (measured in 1M KCl). Data acquisition was carried out in the
central square metre of each plot only, in order to circumvent edge effects.
Climatic extremes
The climate manipulations consisted of extreme drought and ambient conditions for
control. Extremeness of events was determined by statistical extremity with respect to a
Manuscript 1: Climate extremes initiate ecosystem regulating functions while maintaining productivity
41
historical reference period (extreme value theory) independent of its effects on organisms
(Jentsch 2006). In particular, intensity of the treatments was based on the local 100-year
extreme event in 2005, 2006 and 2007, and on the local 1000-year extreme event for 2008 and
2009. Vegetation periods (March to September) of 1961-2000 were used as the reference
period (data: German Weather Service). Gumbel I distributions were fitted to the annual
extremes, and 100-year and 1000-year recurrence events were calculated.
Drought was defined as the number of consecutive days with less than 1 mm daily
precipitation. Accordingly, a drought period of 32 days (2005 - 2007) and of 42 days (2008
and 2009) was applied in the experiment during the peak growing season in June. Maximum
values in the historical data set were 33 days without rain during June and July 1976. Drought
was induced with the support of rain-out shelters that permitted nearly 90 % penetration of
photosynthetically active radiation.
Unwanted greenhouse effects were avoided by starting the roof from a height of 80
cm, allowing for near-surface air exchange. After the experimental drought period, the roofs
were removed. A lateral surface flow was avoided by plastic sheet pilings around treated plots
reaching down to a depth of 10 cm.
The ambient control plots (C) remained without manipulation throughout the entire
period. A roof artefact control with five replicates of the rain-out shelters was in place in
2006. Adding the same amount of water as occurred naturally in daily resolution below intact
shelters during the drought manipulation period did not result in any significant differences in
response parameters, indicating no significant effect from the slightly increased temperature
caused by the rain-out shelters.
Experimental plant communities
Overall, grasslands are spatially important ecosystems in Central Europe. Five
widespread plant species were chosen from the regional flora, i.e. Arrhenatherum elatius (L.)
P. Beauv. ex J. Presl & C. Presl, Holcus lanatus L., Geranium pratense L., Lotus corniculatus
L. and Plantago lanceolata L. Species were selected with respect to their affiliation to defined
functional groups (grasses, forbs, leguminous forbs), to life-span (perennials), to overall
importance in nearby and Central European grassland systems, and to the fact that they do
naturally grow on substrate similar to the one used in this experiment. One hundred plant
individuals per plot in defined quantitative composition were planted in a systematic
hexagonal grid with 20 cm distance between individuals in early April 2005. Grass and forb
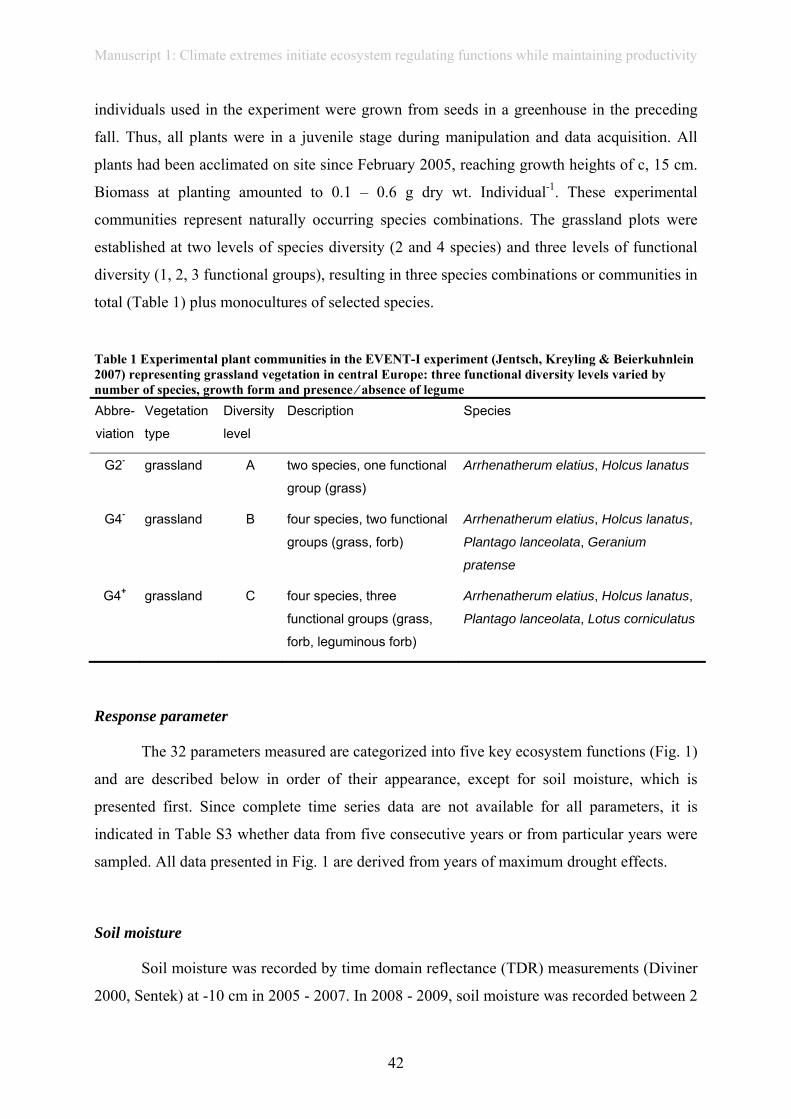
Manuscript 1: Climate extremes initiate ecosystem regulating functions while maintaining productivity
42
individuals used in the experiment were grown from seeds in a greenhouse in the preceding
fall. Thus, all plants were in a juvenile stage during manipulation and data acquisition. All
plants had been acclimated on site since February 2005, reaching growth heights of c, 15 cm.
Biomass at planting amounted to 0.1 – 0.6 g dry wt. Individual-1. These experimental
communities represent naturally occurring species combinations. The grassland plots were
established at two levels of species diversity (2 and 4 species) and three levels of functional
diversity (1, 2, 3 functional groups), resulting in three species combinations or communities in
total (Table 1) plus monocultures of selected species.
Table 1 Experimental plant communities in the EVENT-I experiment (Jentsch, Kreyling & Beierkuhnlein 2007) representing grassland vegetation in central Europe: three functional diversity levels varied by number of species, growth form and presence ⁄ absence of legume Abbre-
viation
Vegetation
type
Diversity
level
Description Species
G2- grassland A two species, one functional
group (grass)
Arrhenatherum elatius, Holcus lanatus
G4- grassland B four species, two functional
groups (grass, forb)
Arrhenatherum elatius, Holcus lanatus,
Plantago lanceolata, Geranium
pratense
G4+ grassland C four species, three
functional groups (grass,
forb, leguminous forb)
Arrhenatherum elatius, Holcus lanatus,
Plantago lanceolata, Lotus corniculatus
Response parameter
The 32 parameters measured are categorized into five key ecosystem functions (Fig. 1)
and are described below in order of their appearance, except for soil moisture, which is
presented first. Since complete time series data are not available for all parameters, it is
indicated in Table S3 whether data from five consecutive years or from particular years were
sampled. All data presented in Fig. 1 are derived from years of maximum drought effects.
Soil moisture
Soil moisture was recorded by time domain reflectance (TDR) measurements (Diviner
2000, Sentek) at -10 cm in 2005 - 2007. In 2008 - 2009, soil moisture was recorded between 2
Manuscript 1: Climate extremes initiate ecosystem regulating functions while maintaining productivity
43
and 7 cm in one grassland plot per treatment block in 1-h intervals by FD-sensors (Echo.EC-
5/k, Decagon).
Primary production
Above-ground net primary production
Above-ground biomass harvests (ANPP) of all standing plant material (dead and alive)
in all communities were conducted twice a year (early in July and mid September) in 2005 -
2009, resembling local agricultural routines. All biomass was taken out of the central square
metre of each grassland plot in order to circumvent edge effects. The harvested biomass was
sorted to species and dried to constant weight at 75 °C and weighed (Ohaus NavigatorTM,
Ohaus Corporation, accuracy ± 0.01 g).
Nitrogen fixing legumes
According to the above-mentioned routines, harvested biomass of the legume species
Lotus corniculatus was used to determine the performance of nitrogen-fixing plants.
Plant cover
Species-specific above-ground cover was quantified using a pin-point method, by
recording the presence of plant organs in general and the presence of each species separately
at 100 vertically inserted steel needles. These values were then treated as the percentage of
cover. The measurement was repeated three times in each vegetation period (May, July and
September).
Below-ground biomass
Root length was used as proxy for below-ground productivity. Root length was
acquired by the minirhizotron technique three times a year. One clear plastic tube (5 cm
diameter) was installed at a 45° angle in each plot prior to planting. Tubes were installed to a
depth of 45 cm. Portions of the tubes exposed at the surface were covered with adhesive
aluminium foil and the ends were capped to prevent entry of water, light and heat. Images of
4 cm² were collected in the main rooting zone at 15 cm in each tube by a digital camera
mounted on an endoscope. Images were analysed for root length using the line intersection
method (Tennant 1975) within a systematic grid (10 × 10, with a grid unit of 0.2 × 0.2 cm).
Five replicates per sampling date were analysed.
Manuscript 1: Climate extremes initiate ecosystem regulating functions while maintaining productivity
44
Shoot-to-root ratio
Shoot-to-root ratio was evaluated using the ratio between above-ground cover and
below-ground root length at 5 cm soil depth (Kreyling et al. 2008b). Both parameters were a
priori standardized to the same mean and standard deviation.
Water regulation
Leaf water potential
Predawn (Ψpd) and midday (Ψmd) leaf water potential were measured on one leaf of
Holcus lanatus per plot using a portable pressure chamber (PMS Instruments Co. Corvallis,
OR, USA). During measurements, the leaves were cut while enclosed in a plastic bag to
reduce further moisture loss during transfer and fixing into the chamber. Moist tissue paper
was introduced into the chamber to reduce water loss during the measurements.
Measurements were confined to the period between 04:00 and 05:00 h.
Leaf carbon isotope signal
At the end of drought, a set of three fully matured leaves of Arrhenatherum elatius
from every plot was selected. In each plot, two sun-exposed leaves of five individual plants
were sampled and combined. The samples were oven-dried for 48 h at 80 °C. The dry leaves
were ball-milled and sub samples of 1 mg analysed for δ13C with an elemental analyser
attached to an isotope ratio mass spectrometer using ConFlo III interface. The carbon isotope
composition (δ13C) of a sample was calculated as: δ13C = [(Rsample/Rstandard) - 1] x 1000,
expressed in units of per thousand (‰). 13C:12C ratios were calculated against the P.D.
Belemite Standard (precision of 0.2 ‰). The results were compared with other measurements
to determine changes associated with shifts in 13C. Every measurement was replicated twice
and the accuracy in δ-values was better than 0.1 ‰.
Carbon fixation
Efficiency of photosynthetic light conversion
Chlorophyll a fluorescence in the grass species H. lanatus was recorded using a pulse-
amplitude-modulated photosynthesis yield analyser (PAM 2000 and Mini-PAM) (WALZ,
Effeltrich, Germany) with a leaf clip holder. The second or third fully-expanded leaves were
measured on four different tillers of one individual. Four measurements per plant were
averaged for further analysis. We obtained predawn fluorescence values at the end of the first
drought treatment in May/June and throughout the early recovery period after the second
Manuscript 1: Climate extremes initiate ecosystem regulating functions while maintaining productivity
45
drought. The maximum quantum efficiency of photosystem II was calculated as Fv/Fm.
Variable fluorescence (Fv) and maximum fluorescence (Fm) were measured before dawn.
Variable fluorescence was calculated as Fm-F0, Fm being the maximum fluorescence of the
dark-adapted leaf after applying a saturating light pulse and F0 being the steady-state
fluorescence yield of the dark-adapted leaf (Maxwell & Johnson 2000). To enable a
comparison between absolute fluorescence values, a fluorescence standard material was
measured before dawn and calculated as Fv/Fm (Fv = Fm – F0) (Maxwell & Johnson 2000).
Absolute F0 and Fm values were taken to separate the effects of photodamage, becoming
apparent with an increase of F0, from the effects of photoprotection related to enhanced non-
photochemical quenching, becoming apparent with a decrease in Fm (Walter et al., 2011).
Leaf gas exchange
Carbon dioxide assimilation (A) at the leaf was monitored in A. elatius in all the
grassland communities. (No data could be obtained from H. lanatus in the particular year of
data mining due to its leave status.) A series of weekly measurements were carried out using a
portable gas exchange system (LI-6400, LI-Cor, Lincoln, NE, USA). A set of 3 grass tufts on
each plot were identified and marked for measurements. On any measurement day, 2-3
suitable leaf blades selected from each of the tufts per plot were set parallel in the cuvette,
with their upper surfaces well exposed so that they were fully illuminated during
measurements. Every turn of measurements lasted one to two minutes, when a steady state
was attained and a set of 10 readings per measurement logged at 10-s intervals. The selected
leaves were marked and similar leaves were monitored either during midday (12:00 to 14:00
h) or throughout the day (from sunrise to sunset), when diurnal course measurements were
conducted. The measured leaves were then excised at the end of the measurement period and
the leaf area (LA) of the section of leaf enclosed in the cuvette determined using leaf area
meter CI-202 CID, Camas, WA, USA. Leaf area information was then used to standardize the
leaf gas exchange data.
Soil respiration
In situ rates of soil respiration were measured using a portable CO2 infrared gas
analyser (EGM-4, PP Systems, Amesbury, USA) linked to a soil respiration chamber (SRC-1,
PP System, Amesbury, USA). At the beginning of the vegetation period, permanent PVC
collars (10 cm diameter, 5 cm height, light grey colour) were installed in every plot with a 1-
cm edge above soil surface to realize a closed system when the soil respiration chamber was
placed on the collar during measurement. The day before each measurement, all above-
ground vegetation was removed from the collar using scissors. During the timeframe of 8:00
Manuscript 1: Climate extremes initiate ecosystem regulating functions while maintaining productivity
46
to 12:00, the soil respiration chamber was placed for 240 seconds on the collar of every plot.
An internal fan realized the even distribution of air and the infrared gas analyser monitored
the build-up of CO2 within the system. The rates of soil respiration were determined from this
by fitting a quadratic equation to the change in CO2 concentration with time. For this study,
we analysed the soil respiration rates at second 240 of each high-diversity grassland plot
including A. elatius, H. lanatus, P. lanceolata and G. pratense on the last day of drought
manipulation.
Maximum leaf and canopy uptake rates
Net ecosystem CO2 exchange was measured with chambers on 40 × 40 cm frames
established on each of the treatment plots. Daily course of net ecosystem CO2 exchange
(NEE) was measured using manually operated, closed gas exchange canopy chambers. Light-
response curves depicting the net photosynthetic CO2 uptake rate (A) of plants at any
measuring time were obtained from leaf-level gas-exchange measurements by fitting an
empirical rectangular hyperbola model (Gilmanov et al. 2005): NEE = (α+Q / αQ-β) - γ,
where α is the initial slope of the light-response curve and an approximation of the canopy
light utilization efficiency (mol CO2/ mol PAR), β is the maximum CO2 uptake capacity
(µmol m–2 s–1), Q is the photosynthetically active radiation (PAR, in µmol m–2 s–1), and γ is an
approximation of the average daytime ecosystem respiration (lmol m–2 s–1). An
approximation of maximum canopy uptake capacity was extrapolated from leaf-level
measurements. Canopy net ecosystem exchange rate (NEE) was estimated from leaf
photosynthetic rate at saturating light intensities (it was shown that A at PAR = 2000 µmol m–
2 s–1 correlates well with canopy NEE). Maximum gross primary productivity (GPPmax) was
calculated as: GPPmax = NEE2000 – Reco, where A2000 is the maximum leaf photosynthetic rate
at a saturating level of light intensity andReco is the corrected respiration term (γ) obtained
from the model.
Nutrient cycling
In situ decomposition rate of cellulose
Biological activity of soil fauna and microorganisms was determined indirectly from
the decay of cellulose using mini-container tubes (Kreyling et al. 2008a). In total, 864 mini-
containers were filled with 0.2 g of cellulose (poor in phosphorus, Schleicher & Schüll,
Dassel, Germany) each, closed with a 2-mm mesh, and put into container tubes, consisting of
12 mini-containers each. Two tubes were buried horizontally 1 cm below soil surface in each
grassland plot. After 94 days, one tube per plot was harvested, whereas the others were
Manuscript 1: Climate extremes initiate ecosystem regulating functions while maintaining productivity
47
harvested after 186 days. After careful cleaning and drying, the decay of cellulose was
determined by subtracting final ashes-free dry mass from initial dry mass (105 °C).
Mycorrhizal colonization
One complete plant individual of P.lanceolata was taken from each plot on the last
day of drought using a soil core sampler with 5 cm diameter (Eijkelkamp; Netherlands). This
particular species was chosen, because pre-analysis revealed higher effects of drought on
mycorrhizaal colonization of P. lanceolata than on that of other species tested. Roots were cut
off and fixed in formalin-alcoholic-acid (50 % Ethanol, 40 % H2O, 7.5 % formalin, 2.5 %
acidic acid), and stained with 5 % blue ink vinegar solution after boiling in 10 % KOH.
Afterwards, mycorrhization ratios were determined by scanning 15 cm fine roots of each
sample for arbuscules and vesicules under a microscope (400×) using the “magnified
intersection method” (McGonigle et al. 1990).
Soil microbial nitrogen pool
Soil microbial nitrogen was extracted from fresh soil according to a modified
chloroform fumigation–extraction method (Brookes et al. 1985). After chloroform fumigation
(24 h at room temperature), dissolved organic and microbial N was extracted with 50 mL
0.5 M K2SO4 and quantified (DIMA TOC-100, Dimatec, Essen, Germany). Microbial
biomass and relative abundance of microbial groups were measured using phospholipid fatty
acid (PLFA) analysis as described (Singh et al. 2006).
Potential soil enzyme activities
For soil enzyme activity measurements, enzymes involved in carbon, nitrogen and
phosphorus cycling were selected, thus addressing important microbial soil functions
(Waldrop & Firestone 2006). The enzyme activities tested were acid phosphatase cleaving
organically bound phosphate, cellobiohydrolase, β-xylosidase and β-glucosidase related to the
degradation of plant cell wall components and N-acetylglucosaminidase representing
chitinases that degrade chitin from fungal or arthropod origin. Soil samples for determining
soil enzyme activities were collected immediately after finishing the drought manipulations
(Kreyling et al. 2008a). Four samples per plot (depth 0 – 5 cm) were combined, mixed and
kept at 4 °C until further processing within 4 weeks after sampling. Soil suspensions (0.4 g
fresh soil in 40 mL H2O) were prepared from each sample. The assay is based on the
enzymatic cleavage of the below-detailed methylumbelliferone (MU) coupled substrates and
the subsequent detection of MU released during incubation. In brief, 50 μL per well of soil
suspensions (three replicates each sample) were dispersed in microplates and 100 μL of
substrate solutions were added to start the reactions. After stopping the reaction with 100 μL
Manuscript 1: Climate extremes initiate ecosystem regulating functions while maintaining productivity
48
of 2.5 M Tris buffer and centrifugation, MU concentrations were determined on a
fluorescence spectrometer at excitation/emission wavelengths of 365/450 nm, respectively.
The following enzyme substrates were used with the incubation times given: MUF-phosphate,
20 min; MUF-xyloside, 1 h; MUF-cellobiohydrofurane, 1 h; MUF-N-acetyl-β-glucosaminide,
40 min; MUF-β-glucoside, 1 h. Substrate concentrations in the incubation mix were 500 μM
except for MUF-cellobiohydrofurane with 400 μM. To account for quenching and to calculate
the amount of MUF released, calibration curves were included with 50 μL of soil samples as
in the incubation wells and MUF-solutions to give a final amount of 0 - 500 pmol per well.
Negative controls for autofluorescence of substrates were also included. Enzyme activities are
expressed as MUF-release per gram soil dry weight per hour.
Plant-available soil nitrate and ammonium
Plant-available nitrogen was extracted from four homogenized, sieved (< 2 mm),
mixed samples of the upper soil layer (0-10 cm) of each plot sampled in July using a 1 M KCl
solution after filtration (Roth, Karlsruhe Germany, Typ 15 A Blauband) (Kreyling et al.
2010). Nitrate and ammonium were quantified using flow injection analysis (FIA, MLE
Dresden FIA-LAB).
Leaf carbon to nitrogen ratio
Leaf carbon (C), leaf nitrogen (N) and C:N ratios were measured from mixed samples
of two sun-exposed leaves of five individual plants per species and plot, sampled in July
(Kreyling, Beierkuhnlein & Jentsch 2010). The samples were oven-dried for 48 h at 75 °C.
The dry leaves were ball-milled and subsamples of 1 mg analysed with an elemental analyser
in a mass spectrometer using ConFlo III interface. Plant-available nitrogen was extracted
from four homogenized, sieved (2 mm) and filtered (Roth, Germany, Typ 15A Blauband)
mixed samples of the upper soil layer (0–10 cm) of each plot using a 1 M KCl solution.
Leaf protein content
Total protein content in µg per mg fresh weight was determined as a proxy for
nutritive value of the legume key species H. lanatus, which was growing in all plots. One leaf
sample per plot was taken on the last day of drought treatment, frozen in liquid nitrogen and
freeze-dried to determine protein-bound amino acids. Amino acids of the protein fraction
were extracted. Amino acid concentrations were measured with an ion exchange
chromatograph (Biotronik, amino acid analyser LC 3000) and protein content was calculated
by pooling the content of each amino acid in the protein fraction.
Manuscript 1: Climate extremes initiate ecosystem regulating functions while maintaining productivity
49
Leaf nitrogen isotope signal
Equally aged, south-facing leaves of A. elatius were collected and oven-dried at 60 °C
for 48 h, and then fine-milled. Natural abundance of δ15N and total nitrogen concentration
were analysed using an elemental analyser (EA 3000, EuroVector, Italy) coupled online to a
ConFlo III interface (Thermo Electron, Bremen, Germany) connected to an isotope-ratio mass
spectrometer (MAT 253, Thermo Electron, Bremen, Germany) . The δ15N values were
calculated as: δ15N [‰] = ( Rsample/Rstandard ) -1)*1000, where R represents the ratio of
15N:14N isotopes. As standard, (nitrogen in) air was used.
Community responses
Invasibility
Invasibility of the experimental communities was recorded three times per year: before
and after the drought manipulations in early summer, and in fall (Kreyling et al. 2008c).
Invading plant individuals were collected from the inner square metre of each plot and
subsequently separated by species. Removal took place only after the first true leaves (after
the cotyledons) emerged, but most specimens were considerably older than this and clearly
established in the stand. At this point in development, we expected that number of individuals
give a measure of established invaders rather than chance germinations. For each plot, the
number of individuals was determined. The planted target species of the experiment were
removed from the subsequent analysis. Tests confirmed that germination from the soil seed
bank was negligible after one year. Thus, invasibility was only based on species invading
from the matrix vegetation.
Plant compositional change
The measurements of above-ground species-specific cover (s. above) were used to
evaluate shifts in the species abundance distributions of the artificial plant assemblages.
Compositional change of each individual plot was evaluated by comparing the species
abundance distribution at each time step to the initial species abundance distribution (five
weeks after planting) by the Bray–Curtis index.
Competitive effect / facilitative effect
The Relative Neighbour Effect calculates the effect of neighbours relative to the plant
with the greatest performance: RNE = Pcontr-Pmix/x with x = Pcontr if Pcontr > Pmix and x = Pmix if
Pmix> Pcontr , where RNE = Relative neighbour effect (-1 ≤ RNE ≤ +1), Pcontr = performance
Manuscript 1: Climate extremes initiate ecosystem regulating functions while maintaining productivity
50
per plant for a plant growing alone ,Pmix = performance per plant for a plant growing in
mixture. Negative values indicate facilitation, and positive values indicate competition
(Markham & Chanway 1996).
Senescence
Tissue die-back was quantified by cover measurements of standing-dead plant organs
(Kreyling et al. 2008d). A pin-point method was applied, recording the presence of plant
organs in general and the presence for each species separately at 100 vertically inserted steel
needles. These values were treated as percentage cover. The measurement was repeated four
times over the course of the vegetation period.
Variability in length of flowering
For each species, weekly observations of the flowering status of four individuals per
plot and species were carried out (Jentsch et al. 2009). Individuals were counted as
‘flowering’ when the anthers were visible in at least one flower. Flowering length was
calculated as the difference between the dates of the 25 and 75 percentile of the flowering
curve over time. Variability in length of flowering was obtained as the standard deviation
between all species for each treatment (drought and control) separately. Statistical
significance of difference in variability was evaluated by the Levene test.
Variability in flower phenology
Flower phenology was obtained from the same data as length of flowering (see above).
As a surrogate, the mid-flowering date was calculated for each species and plot, i.e. the date
of the 50 percentile of the flowering curve over time. Variability in flower phenology was
expressed as the standard deviation between all species for each treatment (drought and
control) separately. Statistical significance of difference in variability was evaluated by the
Levene test.
Resistance to herbivory (phenol content)
For analysis of total soluble carbohydrates and total phenolics, three mixed samples of
at least two plants per plot were taken at the end of the drought period, immediately frozen in
liquid nitrogen and lyophilized (n=15). Thirty miligrams were extracted in 50 % methanol.
Total soluble carbohydrates were analysed using the anthrone method with glucose as a
standard. Extinction was measured at 620 nm. Total phenols were analysed using
FolinCiocalteu’s reagent and catechin as a standard and measuring extinction at 750 nm.
Manuscript 1: Climate extremes initiate ecosystem regulating functions while maintaining productivity
51
Primary consumer abundance
Richness was sampled in June in one circular area (40 cm diameter) in each grassland
plot using a D-Vac suction sampler (ecotech GmbH, Bonn, Germany). For each plot, the
sampling bag was removed and all sampled material was stored in ethanol. Arthropod
samples were quantified as the total number of individuals and identified at least to order
level. However, some taxa were identified to the family level (families within the Coleoptera,
Hemiptera, most Hymenoptera) and in one case to genus level (Psylliodes [Chrysomelidae].
The use of higher taxonomic levels has been shown to produce a good approximation of total
species richness (Biaggini et al. 2007).
Statistical Analyses
Linear Models combined with analysis of variance (ANOVA) were applied to test for
significant differences between groups at single points of time, while taking the split-plot
design into account. Homogeneous groups of factor combinations (drought manipulation,
vegetation type, diversity level) were identified by Tukey HSD post hoc comparisons. Level
of significance was set to p<0.05. Statistical significance of difference in variability of length
in flowering was evaluated by the Levene test.
For time series, Linear Mixed-Effects Models were employed to test for effects of
drought manipulation and diversity and their respective interactions while taking the split-plot
design and the repeated measures into account (time used as random factor). When no
significant interaction was found, the model was simplified by using only the drought
manipulations as fixed effects and time as random effect. Significance of differences (p <
0.05) was evaluated by Markov Chain Monte Carlo sampling of 1000 permutations. Linear
Mixed-Effects Models were conducted with the function ‘lmer’ (Bates & Sarkar 2007).
Prior to statistical analysis, data was log- or square-root-transformed, if conditions of
normality were not met, or to improve homogeneity of variances. Both characteristics were
tested by examining the residuals versus fitted plots and the normal qq-plots of the linear
models. All statistical analyses were performed using R.
Results
The effects of drought on all measured ecosystem properties are summarized in Fig. 1 using
response ratios to standardize the effect size of the severe drought treatment.
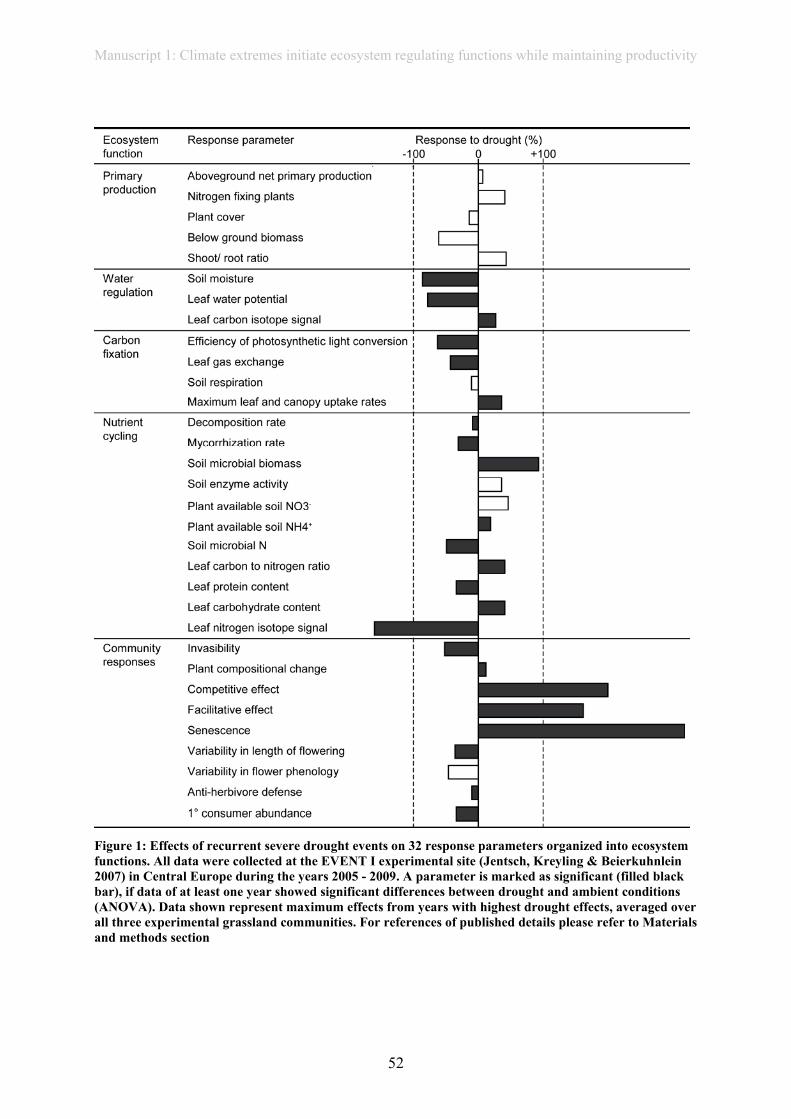
Manuscript 1: Climate extremes initiate ecosystem regulating functions while maintaining productivity
52
Figure 1: Effects of recurrent severe drought events on 32 response parameters organized into ecosystem functions. All data were collected at the EVENT I experimental site (Jentsch, Kreyling & Beierkuhnlein 2007) in Central Europe during the years 2005 - 2009. A parameter is marked as significant (filled black bar), if data of at least one year showed significant differences between drought and ambient conditions (ANOVA). Data shown represent maximum effects from years with highest drought effects, averaged over all three experimental grassland communities. For references of published details please refer to Materials and methods section
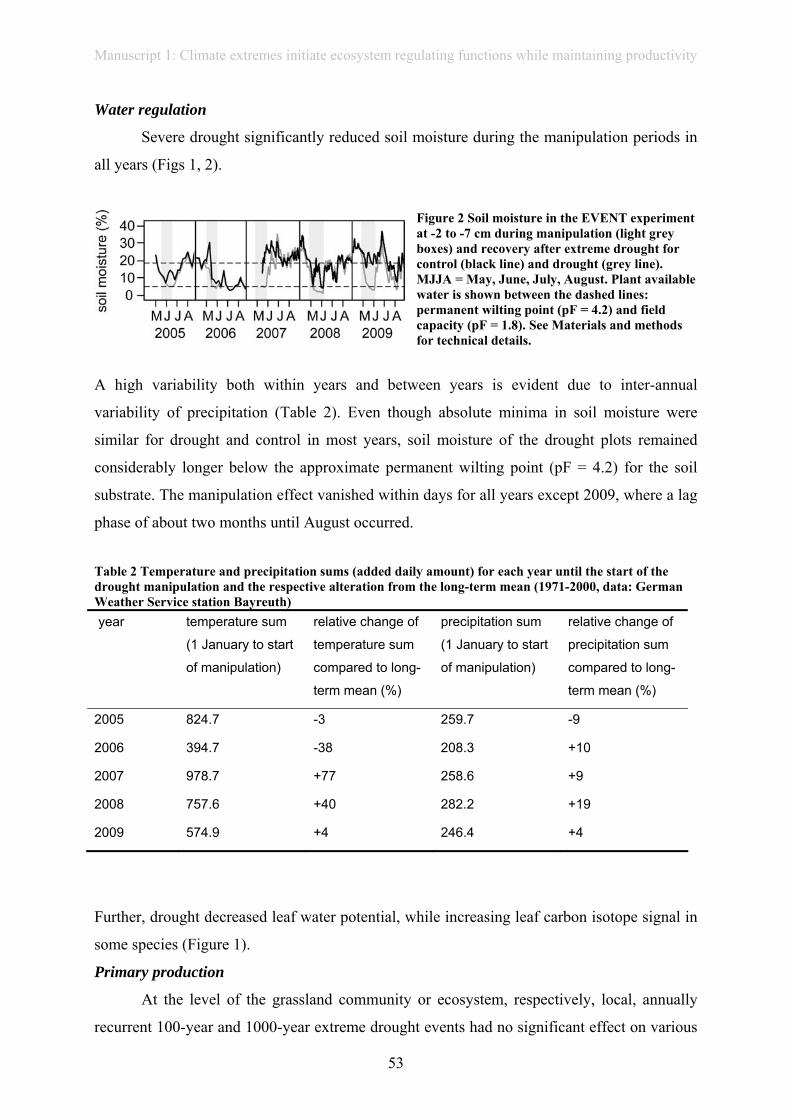
Manuscript 1: Climate extremes initiate ecosystem regulating functions while maintaining productivity
53
Water regulation
Severe drought significantly reduced soil moisture during the manipulation periods in
all years (Figs 1, 2).
Figure 2 Soil moisture in the EVENT experiment at -2 to -7 cm during manipulation (light grey boxes) and recovery after extreme drought for control (black line) and drought (grey line). MJJA = May, June, July, August. Plant available water is shown between the dashed lines: permanent wilting point (pF = 4.2) and field capacity (pF = 1.8). See Materials and methods for technical details.
A high variability both within years and between years is evident due to inter-annual
variability of precipitation (Table 2). Even though absolute minima in soil moisture were
similar for drought and control in most years, soil moisture of the drought plots remained
considerably longer below the approximate permanent wilting point (pF = 4.2) for the soil
substrate. The manipulation effect vanished within days for all years except 2009, where a lag
phase of about two months until August occurred.
Table 2 Temperature and precipitation sums (added daily amount) for each year until the start of the drought manipulation and the respective alteration from the long-term mean (1971-2000, data: German Weather Service station Bayreuth) year temperature sum
(1 January to start
of manipulation)
relative change of
temperature sum
compared to long-
term mean (%)
precipitation sum
(1 January to start
of manipulation)
relative change of
precipitation sum
compared to long-
term mean (%)
2005 824.7 -3 259.7 -9
2006 394.7 -38 208.3 +10
2007 978.7 +77 258.6 +9
2008 757.6 +40 282.2 +19
2009 574.9 +4 246.4 +4
Further, drought decreased leaf water potential, while increasing leaf carbon isotope signal in
some species (Figure 1).
Primary production
At the level of the grassland community or ecosystem, respectively, local, annually
recurrent 100-year and 1000-year extreme drought events had no significant effect on various
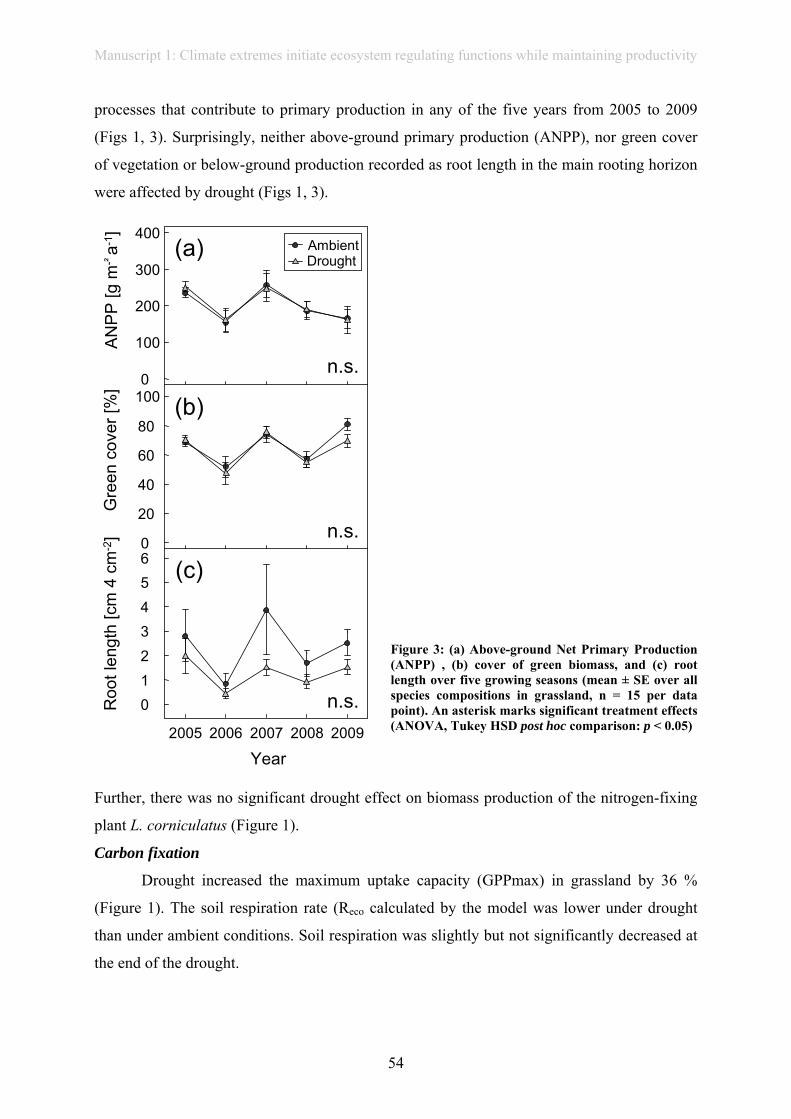
Manuscript 1: Climate extremes initiate ecosystem regulating functions while maintaining productivity
54
processes that contribute to primary production in any of the five years from 2005 to 2009
(Figs 1, 3). Surprisingly, neither above-ground primary production (ANPP), nor green cover
of vegetation or below-ground production recorded as root length in the main rooting horizon
were affected by drought (Figs 1, 3).
Figure 3: (a) Above-ground Net Primary Production (ANPP) , (b) cover of green biomass, and (c) root length over five growing seasons (mean ± SE over all species compositions in grassland, n = 15 per data point). An asterisk marks significant treatment effects (ANOVA, Tukey HSD post hoc comparison: p < 0.05)
Further, there was no significant drought effect on biomass production of the nitrogen-fixing
plant L. corniculatus (Figure 1).
Carbon fixation
Drought increased the maximum uptake capacity (GPPmax) in grassland by 36 %
(Figure 1). The soil respiration rate (Reco calculated by the model was lower under drought
than under ambient conditions. Soil respiration was slightly but not significantly decreased at
the end of the drought.
2005 2006 2007 2008 2009
0
100
200
300
400
Year
AN
PP
[g m
-² a-
1 ]
0
20
40
60
80
100
Gre
en c
over
[%]
AmbientDrought
Roo
t len
gth
[cm
4 c
m-2
]
n.s.
n.s.
(a)
(b)
0123456 (c)
n.s.
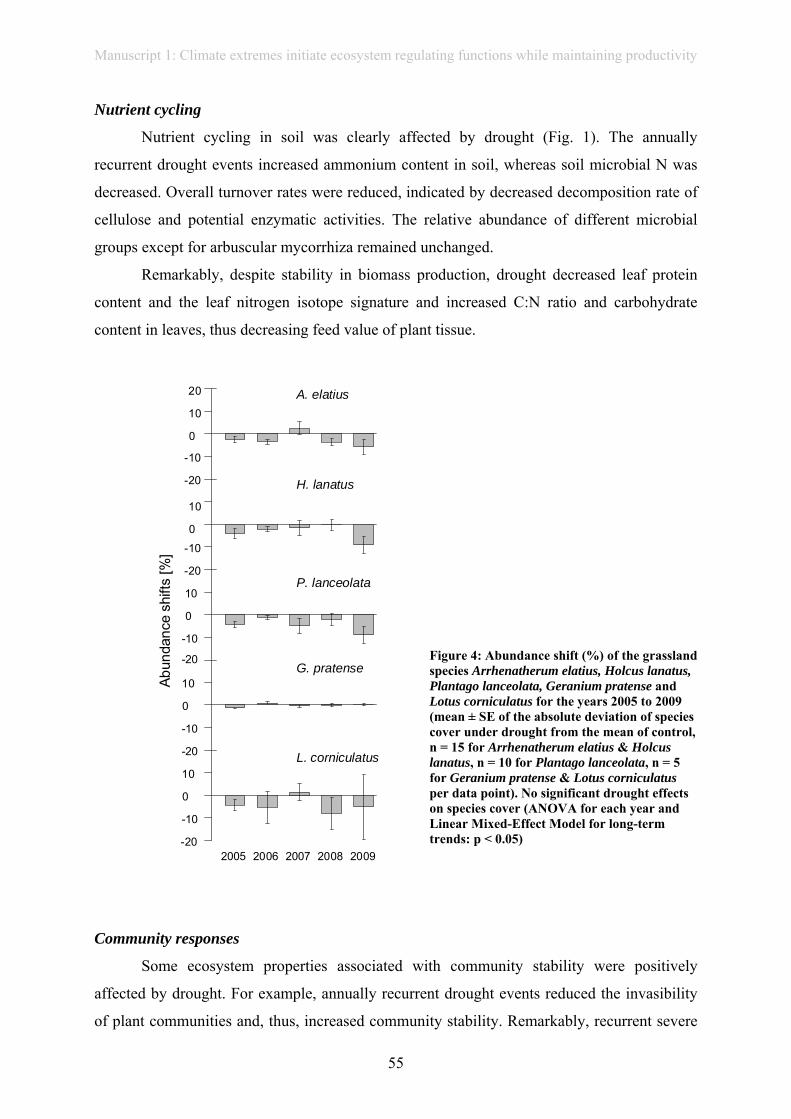
Manuscript 1: Climate extremes initiate ecosystem regulating functions while maintaining productivity
55
Nutrient cycling
Nutrient cycling in soil was clearly affected by drought (Fig. 1). The annually
recurrent drought events increased ammonium content in soil, whereas soil microbial N was
decreased. Overall turnover rates were reduced, indicated by decreased decomposition rate of
cellulose and potential enzymatic activities. The relative abundance of different microbial
groups except for arbuscular mycorrhiza remained unchanged.
Remarkably, despite stability in biomass production, drought decreased leaf protein
content and the leaf nitrogen isotope signature and increased C:N ratio and carbohydrate
content in leaves, thus decreasing feed value of plant tissue.
Figure 4: Abundance shift (%) of the grassland species Arrhenatherum elatius, Holcus lanatus, Plantago lanceolata, Geranium pratense and Lotus corniculatus for the years 2005 to 2009 (mean ± SE of the absolute deviation of species cover under drought from the mean of control, n = 15 for Arrhenatherum elatius & Holcus lanatus, n = 10 for Plantago lanceolata, n = 5 for Geranium pratense & Lotus corniculatus per data point). No significant drought effects on species cover (ANOVA for each year and Linear Mixed-Effect Model for long-term trends: p < 0.05)
Community responses
Some ecosystem properties associated with community stability were positively
affected by drought. For example, annually recurrent drought events reduced the invasibility
of plant communities and, thus, increased community stability. Remarkably, recurrent severe
-20
-10
0
10
20
-20
-10
0
10
-20
-10
0
10
0
10
A. elatius
H. lanatus
G. pratense
-20
-10
-20
-10
0
10L. corniculatus
2005 2006 2007 2008 2009
Abun
danc
esh
ifts
[%]
P. lanceolata
Manuscript 1: Climate extremes initiate ecosystem regulating functions while maintaining productivity
56
drought did not cause any shift in the absolute abundance of species, thus, it did not cause any
compositional change within five years (Figure 4), although it induced complementary,
species-specific plant–plant interactions resulting in shifts in species-specific biomass
contribution to overall community production. For example, the competitive effect of
neighbouring plants on L. corniculatus was increased by drought as well as the facilitative
effect of neighbouring plants on A. elatius.
Still, a significant difference between drought and control was found in community
composition when comparing the species abundance distribution at each time step to the
initial species abundance distribution by a similarity index. Further, drought increased leaf
senescence and caused shifts in flower phenology with regards to variability in length of
flowering and mid-flowering day of particular species in some years (for detailed results on
shifts in phenology see Jentsch et al. 2009). According to the decreased feed value of plant
tissue, primary consumer abundance was decreased by drought.
Discussion
Our experimental approach has the ambitious goal to search for a synthesis of the wide
range of drought responses collected in a single study. Our goal is to see whether general
patterns about different categories of responses can be drawn within a single temperate
grassland study system. In the following, we first discuss particular drought responses, and
then suggest potential reasons why the responses may differ among the five major ecosystem
functions.
Water regulation
Soil moisture dynamics and other soil-related parameters integrate how biological
systems respond to climate change (Emmett et al. 2004). Soil water content was significantly
reduced by drought in our experiment, but there were strong differences between years
(Figure 3). Natural precipitation during the manipulation periods is of importance here, as the
years 2005 to 2008 all included some natural dry spells and effect size of the drought
manipulation therefore was bigger in 2009 when no such natural event occurred. Still, it is not
completely clear how precipitation regimes translate into variation of the soil moisture regime
(Weltzin et al. 2003; Potts et al. 2006; Dermody et al. 2007). There is a growing number of
Manuscript 1: Climate extremes initiate ecosystem regulating functions while maintaining productivity
57
studies explicitly addressing time lags between precipitation manipulation and the soil
moisture regime (Dermody et al. 2007; Sherry et al. 2008), soil moisture storage (Potts et al.
2006) or soil hydrological properties as affected by interacting climatic drivers (Bell et al.
2010). However, re-wetting dynamics (Xiang et al. 2008), soil drying (St Clair et al. 2008)
and potential carry-over effects between recurrent heavy rainfall or drought events have not
been analysed in much detail. The transformation of precipitation pulses to increased soil
water contents available to plant roots and soil biota for uptake can be complex: soil depth,
soil texture, parent material, organic matter content, vegetation type, presence of plant
functional types, leaf area index and soil surface characteristics all affect the partitioning
between interception, run-off, infiltration and subsequent hydraulic re-distribution, soil
evaporation, plant water uptake and seepage (Loik et al. 2004; Bell et al. 2010).
Amount, frequency and seasonal timing of soil water available for plants, soil fauna and soil
microbes will basically determine much of the ecosystem response to more extreme
precipitation regimes. While in this experiment we only manipulated the amount of soil water
available to plants, seasonality issues appear to be an emerging research frontier. Yet, the
major remaining challenge is to assess how future precipitation regimes with more extreme
precipitation events affect—due to alterations in soil moisture—biogeochemical cycles, biotic
interactions and ecosystem functions.
Primary production
We found that drought has resulted in pronounced effects in the functional
performance such as carbon fixation and nutrient cycling of plant communities and of
individual species as well as in fluxes and pools. However, all ecosystem properties related to
primary production remained stable throughout all five years of the experiment, despite
recurrent severe drought events and despite different pre-experimental soil water status
between years. In temperate grasslands, experimental drought events tend to reduce biomass
productivity (Sternberg et al. 1999; Grime et al. 2000; Kahmen et al. 2005). Fay et al. (2003),
however, showed that the magnitude of reduction in above-ground net primary productivity
(ANPP) is the same if rainfall quantity is reduced by 30 % or if inter-rainfall-intervals are
increased by 50 % without a change in the annual amount of precipitation. Presumably,
complementary responses in species interactions contributed to buffering primary production
at the community level without changing community composition in our experiment (Wang et
al. 2007, Kreyling et al. 2008). For example, the competitive effect of neighbouring plants on
Manuscript 1: Climate extremes initiate ecosystem regulating functions while maintaining productivity
58
L. corniculatus was increased by drought as well as the facilitative effect of neighbouring
plants on A. elatius. This is in accordance with a long-term study of 207 grassland plots,
which demonstrated that biodiversity stabilizes community and ecosystem processes, but not
population processes (Tilman 1996). Here, primary production was one of the key parameters
studied. The persistence of this general ecosystem function was stronger than expected.
Concerning below-ground production, several studies (Newman et al. 2006; Trillo &
Fernandez 2005) report increased root biomass in response to chronically decreased water
supply, while a complete water withdrawal over defined periods of time result in stable or
decreased below-ground biomass (Kreyling et al. 2008a).
Carbon fixation
Results from ecosystem CO2 measurements showed a 36% increase in GPP during
drought in the grassland, but a reduction in the assimilatory capacity of the leaves (Figure 1).
During water stress, there was an increase in tillering, leading to increased photosynthetic
area of particular species, yet not an increase in absolute cover or green cover of the
community. Thus, even though CO2 assimilation was reduced at leaf level as a result of water
stress, the overall effect of the large leaf area presented by the tillers lead to an increase in the
contribution of particular species to ecosystem productivity, compensating for reduced
photosynthetic rates at leaf level. Declining stomatal conductance as a result of stomatal
closure was responsible for the observed low leaf-level CO2 assimilation rates during stress.
Zavalloni et al. (2009) reported a reduction in leaf assimilation, but increased biomass
production in grassland subjected to extreme drought. In contrast, Stitt & Schulze (1994)
point out that changes in photosynthesis not necessarily lead to changes in growth or biomass.
Nutrient cycling
Nutrient cycling was clearly affected by drought. The annually recurrent drought
events increased leaf C:N and plant available soil ammonium, whereas they decreased the
decomposition rate and mycorrhization rate. Obviously, water stress has an impact on the
activity and abundance of ammonium oxidizing prokaryotes, resulting in increased
ammonium in the soil, which, however, can hardly be taken up by plants (Gleason et al.
2010). The microbial community seems generally irresponsive to drought treatment where the
only significant effect was an increase in microbial biomass, however the relative abundance
Manuscript 1: Climate extremes initiate ecosystem regulating functions while maintaining productivity
59
of different microbial groups remained unchanged except for arbuscular mycorrhizal fungi.
This is in accordance with other findings showing that drought changes community structure
in arbuscular mycorrhizal fungi including their carbohydrate and nitrogen storage bodies, so
that they take up less nitrogen (Shi et al. 2002). Our results suggested that composition of
microbial groups in soils is generally resistant to drought treatment. This observation is in
agreement with previous reports (Andersen et al. 2010, Williams 2007, Williams and Xia
2009). Both leaf C:N ratio and microbial data suggest that there was an increase in C:N ratio
which may explain lower soil respiration under drought conditions. This may suggest lower
activity of microbial communities which is reflected by the decreased rate of decomposition.
In this study, leaf and microbial C:N ratio and litter decomposition responded to drought
treatment, but biological and geochemical responses of climate treatment are complex
(Andersen et al. 2010), and future work should include multi-factorial experiments taking into
account environmental factors such as soil type, soil water and land use (Singh et al. 2010).
Additionally, our results show that extreme climatic events further affect the
abundance of herbivores associated with the plant community. For instance, we suggest that
the reduction of abundances of athropods by drought events may translate to changes in the
top-down control of vegetation by herbivores and slowed decomposition dynamics due to a
lower activity of decomposers.
Community responses
Relative importance of each species in a community context was affected by the
drought treatments as measured by the similarity of species abundances to the starting
conditions for each plot. The effect size, however, was comparably small, presumably
because species compositions were held constant over the course of the experiment by
weeding out non-target species. Furthermore, competitive balance, based on species-specific
biomass production, was altered and variability in flowering was affected. Particularly,
averaged over all species, drought advanced the mid-flowering day within the season and
expanded the length of the flowering period. On the other hand, no significant shifts in
relative abundance of single species were observed (Figure 4). Generally, however, shifts in
species composition might require substantial lag phases (Grime et al. 2000; Buckland et al.
2001), especially as non-target species were not allowed to immigrate into our plots.
Manuscript 1: Climate extremes initiate ecosystem regulating functions while maintaining productivity
60
Limitations of the EVENT experiment
All the results discussed above stem from one site, i.e. one particular climate, one soil
type, one form of experimental manipulations and a limited set of species. Certainly, an array
of factors such as the investigated ecosystem type, time scales, level of nutrient availability,
water holding capacity of soils, level of biodiversity, or particular design and execution of the
experimental treatments will modify the effects of drought on ecosystem properties.
Therefore, similar approaches from other sites and climatic conditions are clearly needed in
order to test the generality of the observed findings. In particular, experiments with strongly
controlled species compositions need to be compared to natural or semi-natural communities.
Another important gap of knowledge that cannot be answered by our experiment is the
importance of interactions between the climatic drivers, as there is clear evidence that effects
of drivers such as warming, drought, N-deposition and CO2-increase are not additive (Shaw et
al. 2000; Andresen et al. 2010).
Generally, manipulation artefacts or hidden treatments are a concern for global change
field experiments. Rain-out shelters are the usual device to simulate drought even though they
are known to cause artefacts in the microclimate (Fay et al. 2000). Our artefact control
treatment showed that the slight temperature increase and the alterations in irradiance or wind
speed due to our shelters caused no effect on the measured response parameters, presumably
because the shelters were active only during the short manipulation periods. Other artefacts,
however, might be more important, yet less investigated, such as preferential site selection by
animals due to the close proximity of different climatic conditions between the treatments
blocks (Moise & Henry 2010). Such spatial patterns at small distances clearly differ strongly
from drought effects at landscape levels.
We set the magnitude of the drought manipulation based on statistical recurrence of
dry spells in the local climate data series (1961-2000). Recurrence of extreme events itself,
however, is subject to climate change, leading to an amplification of precipitation extremes
with ongoing climate change (Allan & Soden 2008). For the ambient conditions in our
experiment, though, the statistical recurrence of the different manipulation years fell well
within those of the long-term averages for air temperature, precipitation sum or length of rain-
free periods (data not shown). This may be among the reasons, why we did not observe large
effects on biomass production.
Manuscript 1: Climate extremes initiate ecosystem regulating functions while maintaining productivity
61
Conclusion
Our experimental data demonstrate that weather extremes initiate ecosystem-
regulating functions such as water and nutrient cycling, gas exchange and compositional
dynamics while maintaining primary production. They indicate an important contribution of
ecological complexity to the maintenance of productivity in the face of increased temporal
climate variability and extraordinary weather events. However, single species reactions can
not be translated directly to the community and ecosystem level. A potential reason for
different drought impacts on various ecosystem properties may lie in the temporal hierarchy
of fast versus slow response patterns. In our temperate grassland, we observed the following
response dynamics within half a decade of recurrent drought events: very fast alteration of
soil moisture status, subsequent fast change in nutrient cycling and gas exchange, slow
species-specific response in primary production, inertia in community productivity.
Such data on multiple response parameters within climate change experiments foster
the understanding of mechanisms of resilience, of synergisms or decoupling in
biogeochemical processes, and of fundamental response dynamics to drought at the ecosystem
level.
As it was the case with the open questions on the consequences of the crisis of biodiversity,
we see this complexity in studying impacts of climate extremes as a new chance for a boost in
ecological theory. Additionally, comprehensive studies on the complex responses will help
developing coping strategies for the adapted management of these ecosystems.
Future challenges consist of analysing responses for multiple ecosystem functions and
at multiple levels of organization with the goal of assessing how they interact to influence
emergent ecosystem properties, such as ecosystem function and stability. The observed
stability in primary production in the face of recurrent severe drought does not mean that the
responses at the ecosystem level are null. On the contrary, the observed changes in ecosystem
regulating functions in terms of gas exchange, nutrient cycling, water regulation and
community stability suggest a prominent role of extreme weather events in ecosystem
response to climate change. However, modelling the behaviour of ecosystems during and after
extreme climatic events at larger spatial scales and over longer periods of time requires more
in-depth knowledge on possible response mechanisms at the level of plant communities.
Potential epigenetic, physiological or trophic responses need to be rigorously further explored
experimentally. Laboratory studies on molecular mechanisms have to be related to studies
Manuscript 1: Climate extremes initiate ecosystem regulating functions while maintaining productivity
62
with the same species in the field. Field studies must integrate various levels of functional
diversity (Beierkuhnlein et al. in press). Phenotypical diversity of populations has to be
considered. Life cycles of plant species and cohorts can be of crucial importance. Gradients in
soil types have to be integrated. Then, we can reach a better understanding of the mechanisms
that are initiated in plant communities by extreme events.
Future work is needed to elucidate the role of biodiversity and of biotic interactions in
modulating ecosystem response to extreme weather events. Further, we need more data on
impacts of climate extremes on multiple ecosystem properties from various ecosystems and
biomes, in order to foster the search for generality across different categories of response.
Here, a major challenge is to assess the speed of response across various parameters,
including long-term feedbacks, i.e. caused by a nitrogen-dependent feedback on productivity
(Haddad et al. 2002).
Generally, scientists are challenged by relating the ecosystem properties measured
(here: net ecosystem exchange, biomass above and below ground, carbon fixation by
photosynthesis, nutrient ratios) to ecosystem functions and services, such as productivity,
carbon fixation, nutrient cycling, decomposition and water regulation. Measuring ecosystem
services is a fast-developing research area with many debates on how to assess the services
adequately.
Acknowledgements: The contribution of various working groups to the measurements in the
EVENT experiment gives us a unique opportunity to bring bits and pieces together. We thank
J. Böttcher-Treschkow, M. Ewald, N. Herold, Z. Hussein Y. Li, M. Mederer, C. Müller, L.
Mueller, S. Neugebauer, D. Pfab, K. Simmnacher, H. Skiba, S. Walther, M. Wenigmann, D.
Wulf and many student helpers for assistance with data mining in the field and fruitful
discussions.
References: Allan, R.P. & Soden, B.J. (2008) Atmospheric warming and the amplification of precipitation extremes. Science,
321, 1481–1484. Andresen, L.C., Michelsen, A., Jonasson, S., Schmidt, I.K., Mikkelsen, T.N., Ambus, P. & Beier, C. (2010)
Plant nutrient mobilization in temperate heathland responds to elevated CO2, temperature and drought. Plant Soil, 328, 381–396.
Balvanera, P., Pfisterer, A.B., Buchmann, N., He, J.-S., Nakashizuka, T., Raffaelli, D. & Schmid, B. (2006) Quantifying the evidence for biodiversity effects on, ecosystem functioning and services. Ecology Letters, 9, 1146-1156.
Bates, D.M., Sarkar, D. (2007) lme4: Linear mixed-effects models, R package version 0.9975-13, URL http://www.R-project.org.
Manuscript 1: Climate extremes initiate ecosystem regulating functions while maintaining productivity
63
Beierkuhnlein, C., Jentsch, A., Thiel, D., Willner, E. & Kreyling, J. (in press) Provenances of European grass species respond specifically to warming and extreme drought. Journal of Ecology. Special Issue Extreme Events.
Bell, J.E., Sherry, R. & Luo, Y. (2010) Changes in soil water dynamics due to variation in precipitation and temperature: An ecohydrological analysis in a tallgrass prairie. Water Resources Research, 46.
Biaggini, M., Consorti, R., Dapporto, L., Dellacasa, M., Paggetti, E. & Corti, C. (2007) The taxonomic level order as a possible tool for rapid assessment of arthropod diversity in agricultural landscapes. Agric. Ecosyst. Environ., 122, 183–191.
Brookes, P.C., Landman, A., Pruden, G. & Jenkinson, D.S. (1985) Chloroform fumigation and the release of soil nitrogen: A rapid direct extraction method to measure microbial biomass nitrogen in soil. Soil Biology and Biochemistry, 17, 837-842.
Buckland, S.M., Thompson, K., Hodgson, J.G. & Grime, J.P. (2001) Grassland invasions: effects of manipulations of climate and management. J Appl Ecol, 38, 301–309.
Ciais, P., Reichstein, M., Viovy, N., Granier, A., Ogee, J., Allard, V., Aubinet, M., Buchmann, N., Bernhofer, C., Carrara, A., Chevallier, F., De Noblet, N., Friend, A., Friedlingstein, P., Grunwald, T., Heinesch, B., Keronen, P. Knohl, A., Krinner, G., Loustau, D., Manca, G., Matteucci, G., Miglietta, F., Ourcival, J., Papale, D., Pilegaard, K., Rambal, S., Seufert, G., Soussana, J., Sanz, M., Schulze, E.-D., Vesala, T. & Valentini, R. (2005) Europe-wide reduction in primary productivity caused by the heat and drought in 2003. Nature, 437, 529-533.
Costanza, R. R. d'Arge, R. de Groot, S. Farber, M. Grasso, B. Hannon, S. Naeem, K. Limburg, J. Paruelo, R.V. O'Neill,R. Raskin, P. Sutton, and M. van den Belt. 1997. The value of the world's ecosystem services and natural capital. Nature, 387, 253-260.
De Boeck, H., Lemmens, C.M.H.M., Zavalloni, C., Gielen, B., Malchair, S., Carnol, M., Merckx, R., van den Berge, J., Ceulemans, R. & Nijs, I. (2008) Biomass production in experimental grasslands of different species richness during three years of climate warming. Biogeosciences, 5, 585-594.
Dermody, O., Weltzin, J.F., Engel, E.C., Allen, P. & Norby, R.J. (2007) How do elevated CO2, warming, and reduced precipitation interact to affect soil moisture and LAI in an old field ecosystem? Plant Soil, 301, 255–266.
Emmett, B.A., Beier, C., Estiarte, M., Tietema, A., Kristensen, H.L., Williams, D., Penuelas, J., Schmidt, I. & Sowerby, A. (2004) The response of soil processes to climate change: Results from manipulation studies of shrublands across an environmental gradient. Ecosystems, 7, 625–637.
Fay, P.A., Carlisle, J.D., Knapp, A.K., Blair, J.M.& Collins S.L. (2000) Altering rainfall timing and quantity in a mesic grassland ecosystem: Design and performance of rainfall manipulation shelters. Ecosystems, 3, 308-319.
Fay, P.A., Carlisle, J.D., Knapp, A.K., Blair, J.M. & Collins, S.L. (2003) Productivity responses to altered rainfall patterns in a C-4-dominated grassland. Oecologia, 137, 245–251.
Fisher, B., R.K. Turner, P.Morling (2009) Defining and classifying ecosystem services for decision making. Ecological Economics, 68, 643-653.
Gilmanov, T.G., Tieszen, L.L., Wylie, B.K., Flanagan, L.B., Frank, A.B., Haferkamp, M.R., Meyers, T.P. & Morgan, J.A. (2005) Integration of CO2 flux and remotely-sensed data for primary production and ecosystem respiration analyses in the Northern Great Plains: potential for quantitative spatial extrapolation. Global Ecol. Biogeogr., 14, 271–292.
Gleeson, D.B., Muller, C., Ma, W., Banjarree, S., Sicilliano, S. & D.V. Murphy (2010) Influence of water on archaeal and bacterial ammonia oxidiser community dynamics and nitrogen cycle processes. Soil Biology & Biochemistry, doi:10.1016/j.soilbio.2010.06.020)
Grime, J.P., Brown, V.K., Thompson, K., Masters, G.J., Hillier, S.H., Clarke, I.P., Askew, A.P., Corker, D. & Kielty, J.P. (2000) The response of two contrasting limestone grasslands to simulated climate change. Science, 289, 762–765.
Gutschick, V.P. & BassiriRad, H. (2003) Extreme events as shaping physiology, ecology, and evolution of plants: toward a unified definition and evaluation of their consequences. New Phytologist, 160, 21-42.
Haddad, N.M., Tilman, D. & J.M.H. Knops (2002) Long-term oscillations in grassland productivity induced by drought. Ecology Letters, 5, 110-120.
Hector, A. & Bagchi, R. (2007) Biodiversity and ecosystem multi-functionality. Nature, 448, 188–190 IPCC (2007) Climate Change 2007: The Physical Science Basis. Contribution of Working Group I to the Fourth
Assessment Report of the Intergovernmental Panel on Climate Change. Cambridge University Press, Cambridge.
Jentsch, A. (2006) Extreme climatic events in ecological research. Frontiers in Ecology and the Environment, 4, 235-236.
Jentsch, A. & Beierkuhnlein C. (2008) Research frontiers in climate change: Effects of extreme meteorological events on ecosystems. Comptes Rendus Geoscience, 340, 621-628.
Manuscript 1: Climate extremes initiate ecosystem regulating functions while maintaining productivity
64
Jentsch, A. & Beierkuhnlein, C. (2010) Simulating the future responses of ecosystems, key species and European provenances to expected climatic trends and events. Nova Acta Leopoldina NF, 112 (384), 89-98.
Jentsch, A., Kreyling, J. & Beierkuhnlein, C. (2007) A new generation of climate change experiments: events, not trends. Frontiers in Ecology and the Environment, 5, 365-374.
Jentsch, A., Kreyling, J., Boettcher-Treschkow, J. & Beierkuhnlein, C. (2009) Beyond gradual warming: extreme weather events alter flower phenology of European grassland and heath species. Global Change Biology, 15, 837-849.
Kahmen, A., Perner, J. & Buchmann, N. (2005) Diversity dependent productivity in semi-natural grasslands following climate perturbations. Functional Ecology, 19, 594-601.
Knapp, A.K., Beier, C., Briske, D.D., Classen, A.T., Luo, Y., Reichstein, M., Smith, M.D., Smith, S.D., Bell, J.E., Fay, P.A., Heisler, J.L., Leavitt, S.W., Sherry, R.A., Smith, B. & Weng, E. (2008) Consequences of more extreme precipitation regimes for terrestrial ecosystems. Bioscience, 58, 811-821.
Kreyling, J., Jurasinski, G., Grant, K., Retzer, V., Jentsch, A. & Beierkuhnlein, C. (in press) Winter warming pulses strongly affect the development of plant assemblages in temperate grassland and heath. Global Change Biology.
Kreyling, J., Beierkuhnlein, C. & Jentsch, A. (2010) Effects of soil freeze-thaw cycles differ strongly between artificial vegetation types. Basic and Applied Ecology, 11, 65-75.
Kreyling, J., Beierkuhnlein, C. Pritsch, K., Radovski, M., Schloter, M., Wöllecke J. & Jentsch, A. (2008a) Soil biotic processes remain surprisingly stable in face of 100-year extreme weather events in experimental grassland and heath. Plant & Soil, 308, 175-188.
Kreyling J, Beierkuhnlein C, Pritsch K, Schloter M, Jentsch A (2008b): Recurrent soil freeze-thaw cycles enhance plant productivity. New Phytologist, 177, 938-945.
Kreyling, J., Ellis, L., Beierkuhnlein, C. & Jentsch, A. (2008c) Biotic resistance and fluctuating resources are additive in determining invasibility of grassland and heath communities exposed to extreme weather events. Oikos, 117: 1524-1554.
Kreyling, J., Wenigmann, M., Beierkuhnlein, C. & Jentsch, A. (2008d) Effects of extreme weather events on plant productivity and tissue die-back are modified by community composition. Ecosystems, 11, 752-763.
Loik, M.E., Breshears, D.D., Lauenroth, W.K. & Belnap, J. (2004) A multi-scale perspective of water pulses in dryland ecosystems: climatology and ecohydrology of the western USA. Oecologia, 141, 269–281.
Markham, J.H. & Chanway, C.P. (1996) Measuring plant neighbour effects. Functional Ecology, 10, 548-549. Maxwell, K. & Johnson, G.N. (2000) Chlorophyll fluorescence - a practical guide. Journal of Experimental
Botany, 51, 659–668. McGonigle, T.P., Miller, M.H., Evans, D.G., Fairchild, G.L. & Swan, J.A. (1990) A new method which gives an
objective-measure of colonization of roots by vesicular arbuscular mycorrhizal fungi. New Phytologist, 115, 495-501.
Mirzaei, H., Kreyling, J., Hussain, Z., Li, Y., Tenhunen, J., Beierkuhnlein, C. & Jentsch, A. (2008) One extreme drought event enhances subsequent carbon uptake in experimental grassland communities. Journal of Plant Nutrition and Soil Science, 171, 681-689.
Moise, E.R.D. & Henry, H.A.L. (2010) Like moths to a street lamp: exaggerated animal densities in plot-level global change field experiments. Oikos, 119, 791–795.
Morecroft, M.D., Masters, G.J., Brown, V.K., Clarke, I. P., Taylor, M.E. & Whitehouse, A.T. (2004) Changing precipitation patterns alter plant community dynamics and succession in an ex-arable grassland. Functional Ecology, 18, 648-655.
Newman ,G.S., Arthur, M.A., Muller, R.N. (2006) Above- and belowground net primary production in a temperate mixed deciduous forest. Ecosystems, 9, 317–329.
Niklaus, P.A., Stocker, R., Körner, C. & Leadley, P.W. (2000) CO2 flux estimates tend to overestimate ecosystem C sequestration at elevated CO2. Functional Ecology, 14, 546–559.
O’Gorman, P.A. & Schneider, T. (2009) The physical basis for increases in precipitation extremes in simulations of the 21st-century climate change. PNAS, 106, 14773-14777.
Olesen, J.E. & Bindi, M. (2002) Consequences of climate change for European agricultural productivity, land use and policy. European Journal of Agronomy, 16, 239-262.
Penuelas, J., Gordon, C., Llorens, L., Nielsen, T., Tietema, A., Beier, C., Bruna, P., Emmet, B., Estiarte, M. & Gorissen, A. (2004) Nonintrusive field experiments show different plant responses to warming and drought among sites, seasons, and species in a north-south European gradient. Ecosystems, 7, 598-612.
Pfisterer, A.B. & Schmid, B. (2002) Diverstiy-dependent production can decrease the stability of ecosystem functioning. Nature, 416, 84-86.
Potts, D.L., Huxman, T.E., Cable, J.M., English, N.B., Ignace, D.D., Eilts, J.A., Mason, M.J., Weltzin, J.F. & Williams, D.G. (2006) Antecedent moisture and seasonal precipitation influence the response of canopy-scale carbon and water exchange to rainfall pulses in a semi-arid grassland. New Phytol, 170, 849–860.
Schröter, D., Cramer, W., Leemans, R., Prentice, I.C., Araújo, M.B., Arnell, N.W., Bondeau, A., Bugmann, H., Carter, T.R., Gracia, C.A., Vega-Leinert, A.C.D.L., Erhard, M., Ewert, F., Glendining, M., House, J.I.,
Manuscript 1: Climate extremes initiate ecosystem regulating functions while maintaining productivity
65
Kankaanpää, S., Klein, R.J.T., Lavorel, S., Lindner, M., Metzger, M.J., Meyer, J., Mitchell, T.D., Reginster, I., Rounsevell, M., Sabaté, S., Sitch, S., Smith, B., Smith, J., Smith, P., Sykes, M.T., Thonicke, K., Thuiller, W., Tuck, G., Zaehle, S. & Zierl, B. (2005): Ecosystem service supply and vulnerability to global change in Europe. Science, 310, 1333-1337.
Shaw, M.R., Zavaleta, E.S., Chiariello, N.R., Cleland, E.E., Mooney, H.A. & Field, C.B. (2002) Grassland responses to global environmental changes suppressed by elevated CO�. Science, 298, 1987–1990.
Sherry, R.A., Zhou, X.H., Gu, S.L., Arnone, J.A., Schimel, D.S., Verburg, P.S., Wallace, L.L. & Luo, Y.Q. (2007) Divergence of reproductive phenology under climate warming. P Natl Acad Sci USA, 104, 198–202.
Shi, L., Guttenberger, M., Kottke, I. & R.Hampp (2002) The effect of drought on mycorrhizas of beech (Fagus sylvatica L.): changes in community structure, and the content of carbohydrates and nitrogen storage bodies of the fungi. Mycorrhiza,12(6),303-11.
Singh, B.K., Reid, E., Ord, B., Potts, J., & Milard, P. (2006) Investigating microbial community structure in soils by physiological, biochemical and molecular fingerprinting methods. European Journal of Soil Sciences. 57, 72-82
Singh, B.K., Bardgett, R.D., Smith, P & Reay, D.(2010) Microorganisms and climate change: feedbacks and mitigation options. Nature Reviews Microbiology, 8, 779-790
St Clair, S.B., Sudderth, E.A., Fischer, M.L., Torn, M.S., Stuart, S.A., Salve, R., Eggett, D.L. & Ackerly, D.D. (2009) Soil drying and nitrogen availability modulate carbon and water exchange over a range of annual precipitation totals and grassland vegetation types. Glob Change Biol, 15: 3018–3030.
Sternberg, M., Brown, V.K., Masters, G.J. & Clarke, I.P. (1999) Plant community dynamics in a calcareous grassland under climate change manipulations. Plant Ecol, 143, 29–37.
Stitt, M. & Schulze, E.D. (1994) Does Rubisco control the rate of photosynthesis and plant growth? An exercise in molecular ecophysiology. Plant, Cell and Environment, 17, 465–487.
Suttle, K.B., Thomsen, M.A. & Power, M.E. (2007) Species Interactions Reverse Grassland Responses to Changing Climate. Science, 315, 640 – 642.
Swemmer, A.M., Knapp, A.K. & Snyman, H.A. (2007) Intra-seasonal precipitation patterns and above-ground productivity in three perennial grasslands. Journal of Ecology, 95, 780-788.
Tennant, D. (1975) A test of a modified line intersect method for estimating root length. Journal of Ecology, 63, 995-1001.
Tilman, D. (1996) Biodiversity: population versus ecosystem stability. Ecology, 77(2), 350-363. Trillo, N., Fernandez, R.J. (2005) Wheat plant hydraulic properties under prolonged experimental drought:
stronger decline in root-system conductance than in leaf area. Plant Soil, 277, 277–284. van Ruijven, J. & Berendse, F. (2010) Diversity enhances community recovery, but not resistance, after drought.
Journal of Ecology, 98, 81-86. Waldrop, M. & Firestone, M. (2006) Seasonal dynamics of microbial community composition and function in
oak canopy and open grassland soils. Microb. Ecol., 52, 470–479. Walter, J., Beierkuhnlein, C., Hein, R., Nagy, J., Rascher, U., Willner, E. & Jentsch, A. (2011): Do plants
remember drought? Hints towards a drought memory in grasses. Environmental and Experimental Botany 71,34-40.
Wang, Y., Yu, S. & Wang J. (2007) Biomass-dependent susceptibility to drought in experimental grassland communities. Ecology Letters, 10, 401–410.
Weltzin, J.F., Bridgham, S.D., Pastor, J., Chen, J.Q. & Harth, C. (2003) Potential effects of warming and drying on peatland plant community composition. Glob Change Biol, 9, 141–151.
Wiiliams, M.A. (2007) Response of microbial communities to water stress in irrigated and drought-prone tallgrass prairie soils. Soil Biology and Biochemistry, 39, 2750-2757
Williams, M.A. & Xia, X. (2009) Characterization of the water soluble soil organic pool following the rewetting of dry soil in a drought-prone tallgrass prairie. Soil Biology and Biochemistry, 41, 21-28
Wohlfahrt, G., Anfang, C., Bahn, M., Haslwanter, A., Newesely, C., Schmitt, M., Drosler, M., Pfadenhauer, J. & Cernusca, A. (2005) Quantifying nighttime ecosystem respiration of a meadow using eddy covariance, chambers and modelling. Agr. Forest Meteorol., 128, 141–162.
Worm, B., Barbier, E.B., Beaumont, N., Duffy, J.E., Folke, C., Halpern, B.S., X Jackson, J.B.C. , Lotze, H.K., Micheli, F., Palumbi, S.R., Sala, E., Selkoe, K.A., Stachowicz, J.J. & Watson, R. (2006) Impacts of biodiversity loss on ocean ecosystem services. Science, 314, 787-790.
Xiang, S.-R., Doyle, A., Holden, P.A. & Schimel, J.P. (2008) Drying and rewetting effects on C and N mineralization and microbial activity in surface and subsurface California grassland soils. Soil Biol Biochem, 40, 2281–2289.
Zavalloni, C., Gielen, B., De Boek, H.J., Lemens, M.H.M.C., Ceulemans, R. & Nijs, I. (2009) Greater impact of extreme drought on photosynthesis of grasslands exposed to warmer climate in spite of acclimation. Physiologia Plantarum, 136, 57-72.
Manuscript 1: Climate extremes initiate ecosystem regulating functions while maintaining productivity
66
Online Supporting Information
Table S1: Search items for searching the ISI Web of Science® Database for publications on weather
events and climate extremes. Asterisks are place holders within the search string
Main category Search items in ISI Web of Knowledge
Frost *frost event* OR severe night frost* OR *spring frost* OR freeze-thaw* OR
thaw-freeze* OR late frost* OR severe frost* OR *ground frost* OR extreme
frost* OR extreme cold* Heat & drought heat wave* OR heatwave* OR severe heat* OR *temperature event* OR dry
spell* OR extreme heat* OR *winter warming* OR warm* winter OR summer
drought* OR spring drought* OR autumn drought* OR severe drought* Storm extreme storm* OR *winter storm* OR hurricane* OR typhoon* OR cyclone*
OR tornado* OR storm surge* OR *windstorm* OR *wind storm* OR *tropical
storm* OR ice storm*
Heavy rain extreme flood* OR summer flood* OR extreme rain* OR torrential rain* OR
extreme precipitation OR *rainfall event* OR heavy rain* OR hail* OR wet
spell* Extreme extreme event* OR extreme weather event* OR climat* extreme* OR
extreme meteorological event* OR extreme weather* OR extreme climat*
event* Table S2: Links for searching the ISI Web of Science® Database for publications on weather events and
climate extremes
Links Search items in ISI Web of Knowledge
Main items
in “Topic”
Frost, Heat & drought, Storm, Heavy rain, Extreme
AND
in “Topic”
wetland* OR floodplain* OR peat* OR bog* OR fen* OR swamp* OR mire OR
grassland* OR meadow* OR pasture* OR heath* OR shrubland* OR forest* OR
woodland* OR tundra OR taiga OR savanna* OR marsh* OR steppe OR desert*
OR aquatic* OR limn*
*bird* OR avian OR insect* OR butterfly* OR beetle* OR arthropod* OR moth*
OR amphibian* OR reptile* OR mollusc* OR mollusk* OR vertebrate* OR
*invertebrate* OR mammal*
AND
in “Topic” climat* change* OR global change* OR climat* warming
NOT
in “Topic” palaeo* OR paleo* OR pleistocene OR holocene
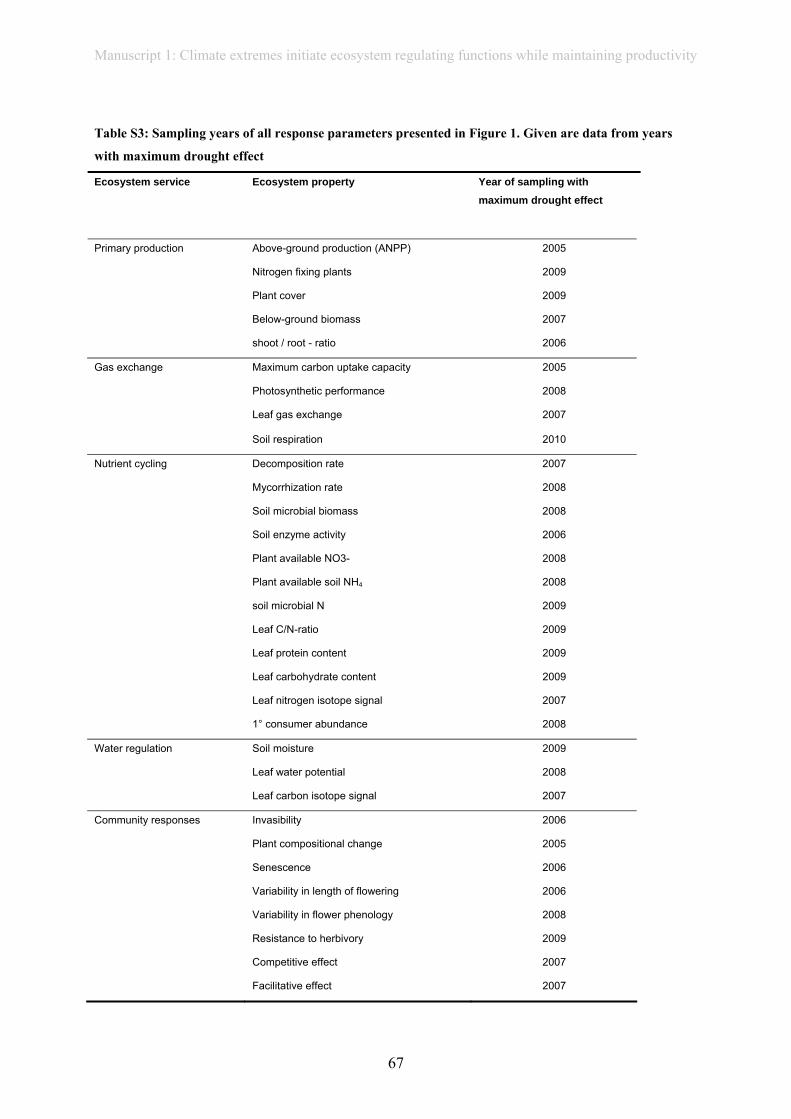
Manuscript 1: Climate extremes initiate ecosystem regulating functions while maintaining productivity
67
Table S3: Sampling years of all response parameters presented in Figure 1. Given are data from years
with maximum drought effect
Ecosystem property Year of sampling with maximum drought effect
Ecosystem service
Above-ground production (ANPP) 2005
Nitrogen fixing plants 2009
Plant cover 2009
Primary production
Below-ground biomass 2007
shoot / root - ratio 2006
Gas exchange Maximum carbon uptake capacity 2005
Photosynthetic performance 2008
Leaf gas exchange 2007
Soil respiration 2010
Nutrient cycling Decomposition rate 2007
Mycorrhization rate 2008
Soil microbial biomass 2008
Soil enzyme activity 2006
Plant available NO3- 2008
Plant available soil NH4 2008
soil microbial N 2009
Leaf C/N-ratio 2009
Leaf protein content 2009
Leaf carbohydrate content 2009
Leaf nitrogen isotope signal 2007
1° consumer abundance 2008
Soil moisture 2009 Water regulation
Leaf water potential 2008
Leaf carbon isotope signal 2007
Community responses Invasibility 2006
Plant compositional change 2005
Senescence 2006
Variability in length of flowering 2006
Variability in flower phenology 2008
Resistance to herbivory 2009
Competitive effect 2007
Facilitative effect 2007
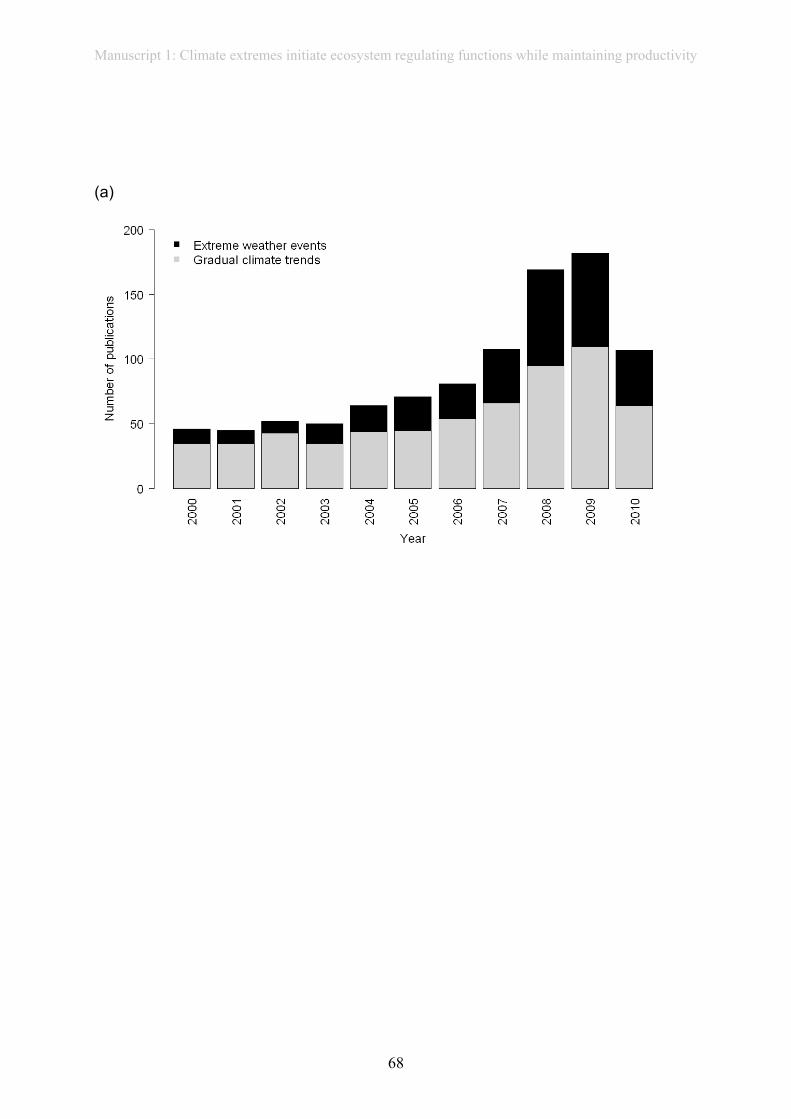
Manuscript 1: Climate extremes initiate ecosystem regulating functions while maintaining productivity
68
(a)
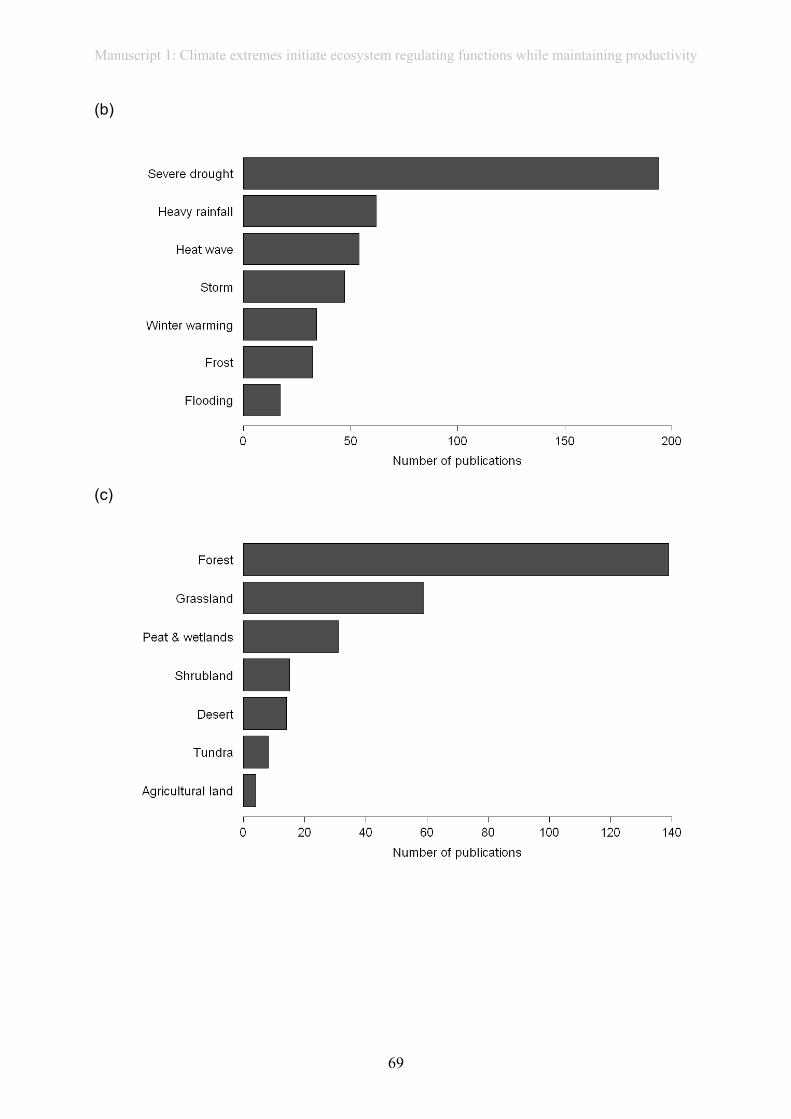
Manuscript 1: Climate extremes initiate ecosystem regulating functions while maintaining productivity
69
(b)
(c)
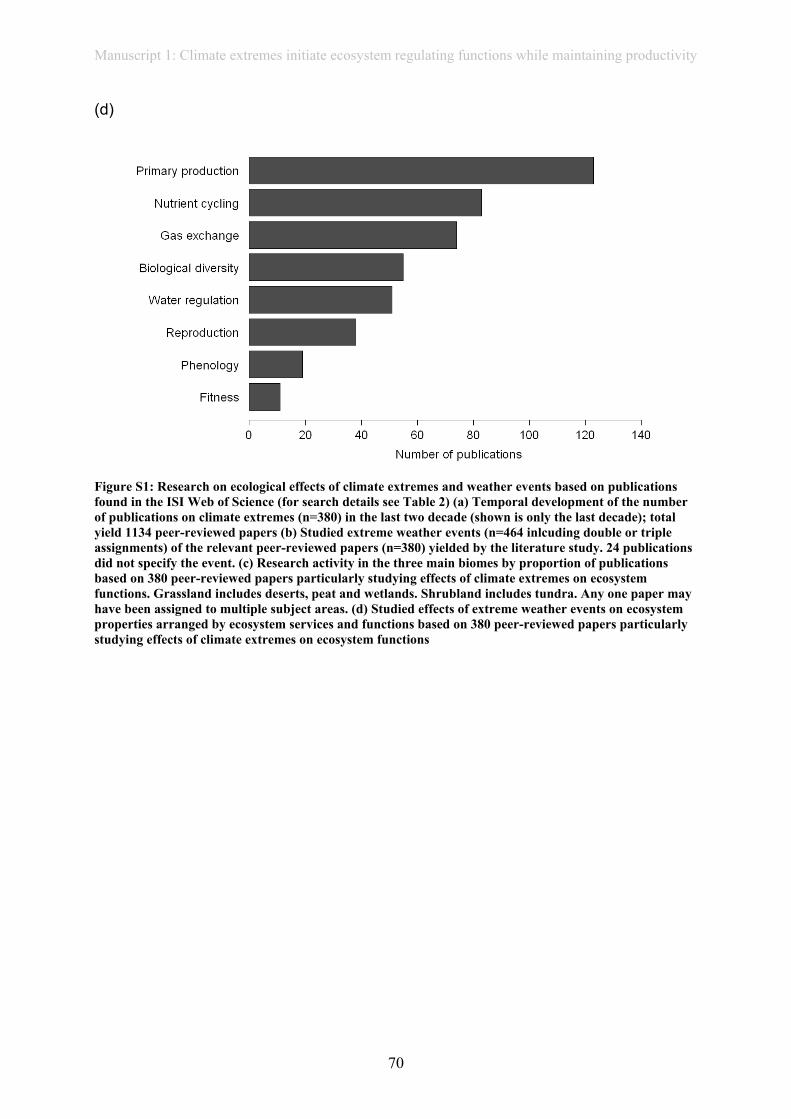
Manuscript 1: Climate extremes initiate ecosystem regulating functions while maintaining productivity
70
(d)
Figure S1: Research on ecological effects of climate extremes and weather events based on publications found in the ISI Web of Science (for search details see Table 2) (a) Temporal development of the number of publications on climate extremes (n=380) in the last two decade (shown is only the last decade); total yield 1134 peer-reviewed papers (b) Studied extreme weather events (n=464 inlcuding double or triple assignments) of the relevant peer-reviewed papers (n=380) yielded by the literature study. 24 publications did not specify the event. (c) Research activity in the three main biomes by proportion of publications based on 380 peer-reviewed papers particularly studying effects of climate extremes on ecosystem functions. Grassland includes deserts, peat and wetlands. Shrubland includes tundra. Any one paper may have been assigned to multiple subject areas. (d) Studied effects of extreme weather events on ecosystem properties arranged by ecosystem services and functions based on 380 peer-reviewed papers particularly studying effects of climate extremes on ecosystem functions
Manuscript 2: How do extreme drought and plant community composition affect host plant metabolites and herbivore performance?
71
Manuscript 2: How do extreme drought and plant community composition
affect host plant metabolites and herbivore performance? Arthropod-Plant Interactions, 2012, 6: 15-25.
Julia Walter1, Roman Hein2,4, Harald Auge3, Carl Beierkuhnlein4, Sonja Löffler5, Kerstin
Reifenrath6, Martin Schädler3, Michael Weber7, Anke Jentsch2
1Conservation Biology, Helmholtz Centre for Environmental Research- UFZ, Permoserstraße 15, 04318 Leipzig,
Germany; phone: 0049-341-2351654; fax: 0049-341-2351470; [email protected] 2Disturbance Ecology, Bayreuth University, 95440 Bayreuth, Germany 3Department of Community Ecology, Helmholtz Centre for Environmental Research- UFZ, Theodor-Lieser-
Straße 4, 06120 Halle, Germany 4Chair of Biogeography, Bayreuth University, 95440 Bayreuth, Germany 5LFE Brandenburg, Alfred-Möller-Straße 1, 16225 Eberswalde, Germany 6Animal Ecology and Tropical Biology, University of Würzburg, Am Hubland, 97074 Würzburg, Germany 7Department of Plant Physiology, Bayreuth University, 95440 Bayreuth, Germany
Abstract
Water availability and plant community composition alter plant nutrient availability
and the accumulation of plant defence compounds therefore having an impact on herbivore
performance. Combined effects of drought stress and plant community composition on leaf
chemicals and herbivore performance are largely unexplored. The objective of our study was,
therefore, to find out the impact of extreme drought and of plant community composition on
plant-herbivore interactions. Larvae of the generalist butterfly Spodoptera littoralis were
reared on leaves of the grass Holcus lanatus which was grown in experimental communities,
differing in species- and functional group-richness. These communities were either subjected
to extreme drought or remained under ambient climatic conditions. Drought decreased
relative water content, soluble protein content, nitrogen and total phenol content and increased
the content of carbohydrates in the grass. As a consequence, the larvae feeding on drought-
exposed plants revealed a longer larval stage, increased pupal weight and higher adult
eclosion rates. Plant community composition mainly caused changes to the defensive
compounds of the grass, but also marginally affected protein and carbohydrate content.
Larvae feeding on species-richest communities without legumes showed the highest
mortality. Our findings imply that climate change that is projected to increase the frequency
Manuscript 2: How do extreme drought and plant community composition affect host plant metabolites and herbivore performance
72
of severe droughts, as well as alter plant community compositions, is likely to affect
arthropod-plant interactions through an alteration of leaf chemicals.
Keywords: climate change; EVENT-experiments; drought; diversity; legume
Introduction
Under global climate change, the variability of precipitation regimes is projected to
increase, and is likely to increase the frequency and severity of droughts (Trenberth et al.
2003; IPCC 2007). For the 21st century, droughts are projected to occur more frequently, and
more regions, also within Europe, will be affected by severe dry spells (Beniston et al. 2007;
IPCC 2007; Li et al. 2009; Wang et al. 2010). Droughts can reduce productivity, but may also
alter forage quality in mesic grassland (Heisler-White et al. 2009).
Several studies tested the effect of drought on plant-herbivore interactions
(EnglishLoeb et al. 1997; Inbar et al. 2001; de Bruyn et al. 2002; Scheirs and de Bruyn 2005;
Nguyen et al. 2007). Drought often resulted in decreased performance of the herbivore
(growth, survival), mainly due to an increase in defensive compounds and a decrease in leaf
nitrogen (Herms and Mattson 1992; EnglishLoeb et al. 1997; Inbar et al. 2001; de Bruyn et al.
2002). Such studies are in accordance with the so called “plant vigour hypothesis” (Price
1991), as it predicts a better performance of herbivores on vigorously growing plants,
compared to stressed plants.
Up until now, most studies investigating the influence of drought on plant tissue
quality and herbivore performance have been conducted on potted plants and not under
realistic plant-growing conditions (EnglishLoeb et al. 1997; Inbar et al. 2001; de Bruyn et al.
2002; Showler and Moran 2003; Scheirs and de Bruyn 2005). Under field conditions, soil
moisture levels do not drop as quickly as in potted plants. Thus, plants might have more time
to acclimate, which will result in a different leaf tissue quality compared to plants growing on
very quickly drying soils.
However, not only abiotic conditions, like drought, affect water- and nutrient
availability for plants. Also biotic factors, like plant community composition, e.g. the specific
species assembly and, as a consequence, competitive or facilitative interactions, affect
resource availability. Both, abiotic conditions and plant community composition are therefore
key determinants for plant survival, plant growth and tissue quality, and might thus also affect
herbivores (Schädler et al. 2007). A very important factor, which has been widely neglected
Manuscript 2: How do extreme drought and plant community composition affect host plant metabolites and herbivore performance
73
in studies on single potted plants, is the influence of plant community composition on plant
metabolites and therefore herbivores: species richness as well as functional group richness
alter resource partitioning among plants. Higher species diversity might buffer the adverse
effects of abiotic stress (Loreau and Hector 2001), but could also change competitive pressure
and facilitative interactions under extreme abiotic conditions (Callaway and Walker 1997). It
is very likely that it is not the sheer richness of species, but more so the presence of certain
functional types that has an effect. The presence of legumes in particular, seems to play a key
role in nutrient availability and ecosystem functioning in many studies, by increasing the
protein and nitrogen contents of neighbouring species (Spehn et al. 2002; Temperton et al.
2007; Dybzinski et al. 2008).
The combined effects of plant community composition and drought conditions on
plant tissue quality and herbivores have rarely been studied to date. Thus, the objectives of
our study were twofold: Firstly, we investigated how an extreme drought, applied under field
conditions, alters plant metabolites and thus affects the development of herbivores. And
secondly, we determined the influence of community composition and diversity on plant
metabolite quantity and, consequently on herbivore performance.
The target host grass Holcus lanatus is grown under field conditions in communities
differing in their number of species and functional types and is exposed to extreme drought.
Larvae of the generalist herbivore Spodoptera littoralis were reared on leaves of the host
grass under constant climatic conditions in a climate chamber.
We hypothesized that i) the extreme drought would lead to an increase in defensive
compounds, such as phenols and to a decrease in nitrogen availability, therefore negatively
affecting the development of the herbivore; and that ii) the negative effects of drought would
be amplified in communities with more species, due to an increase in interspecific
competition for water. However, the presence of a legume species would buffer such adverse
effects, as it may enhance the nitrogen status of neighbouring plants.
Materials & Methods
Study organisms
Spodoptera littoralis (Boisduval) (African cotton leafworm; Lepidoptera: Noctuidae)
is a generalist herbivore that is widely used in laboratories and feeds on over 40 plant families
worldwide (Brown and Dewhurst 1975). It can therefore be seen as a model organism for a
Manuscript 2: How do extreme drought and plant community composition affect host plant metabolites and herbivore performance
74
generalist herbivore. Eggs of this species from laboratory strains were provided by the Max-
Planck-Institute for Chemical Ecology, Jena, Germany.
Holcus lanatus L. (Yorkshire Fog; Poales: Poaceae) is a very common, perennial,
tufted grass growing on various soils and on all kinds of grasslands across Europe. H. lanatus
is predominantly found on wet and boggy, relatively fertile and moderate acidic soils (Grime
et al. 1988; Wurst and van Beersum 2009). It was chosen due to its wide distribution
throughout Europe and its relative importance as a forage plant.
Host-plant treatments and chemical analyses
Our study was conducted in 2009, as part of the EVENT I experiment, which
investigates the effects of simulated extreme weather events on plants and ecosystem
functions (Jentsch et al. 2007). The experimental design consists of two crossed factors:
Extreme weather manipulation and community composition with five replicates of each
factorial combination. The factors were applied in a split-plot design, with community
diversity nested within weather treatments.
Extreme drought (D) was induced using transparent foil rain-out shelters, starting from
a height of 80 cm to avoid strong green-house effects. The intensity of the drought in 2009
was based on the local 1000-year extreme weather event. Vegetation periods (March to
September) from the years 1961-2000 acted as a reference period to calculate the length of the
drought. A Gumbel I distribution was fitted to the annual extremes, and a 1000-year
recurrence was calculated (Gumbel 1958). Drought was defined as the number of consecutive
days with a daily amount of less than 1 mm precipitation. This resulted in a drought period
with a length of 42 days starting on May 20th and ending on June 30th in 2009. The control
treatment (C) remained under natural conditions without any manipulation.
Plant communities were planted in 2 m x 2 m plots except for the monocultures that were
grown in 1 m x 1 m plots. The target species H. lanatus grows in four community
compositions differing by the number of species (one to four) and the number of functional
groups (one to three): Holcus lanatus monocultures (1-), H. lanatus growing together with
one grass species (2-), with one grass species and two forbs (4-) or with one grass species and
two forbs, including a legume species (4+) (Table 1). Original community composition was
maintained by weeding four times per year. All mixed plant communities consist of 100
individuals and monocultures consist of 25 individuals per plot.
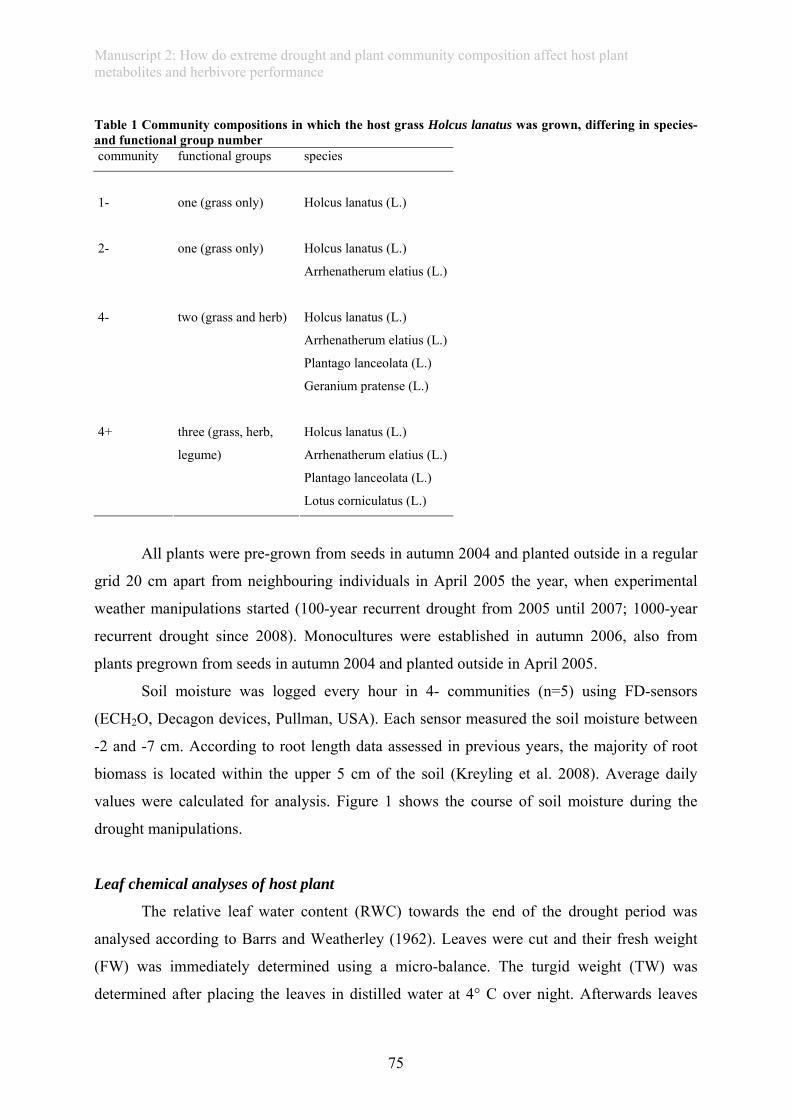
Manuscript 2: How do extreme drought and plant community composition affect host plant metabolites and herbivore performance
75
Table 1 Community compositions in which the host grass Holcus lanatus was grown, differing in species- and functional group number community functional groups species
1- one (grass only) Holcus lanatus (L.)
Holcus lanatus (L.) 2- one (grass only)
Arrhenatherum elatius (L.)
Holcus lanatus (L.)
Arrhenatherum elatius (L.)
Plantago lanceolata (L.)
4- two (grass and herb)
Geranium pratense (L.)
Holcus lanatus (L.)
Arrhenatherum elatius (L.)
Plantago lanceolata (L.)
4+ three (grass, herb,
legume)
Lotus corniculatus (L.)
All plants were pre-grown from seeds in autumn 2004 and planted outside in a regular
grid 20 cm apart from neighbouring individuals in April 2005 the year, when experimental
weather manipulations started (100-year recurrent drought from 2005 until 2007; 1000-year
recurrent drought since 2008). Monocultures were established in autumn 2006, also from
plants pregrown from seeds in autumn 2004 and planted outside in April 2005.
Soil moisture was logged every hour in 4- communities (n=5) using FD-sensors
(ECH2O, Decagon devices, Pullman, USA). Each sensor measured the soil moisture between
-2 and -7 cm. According to root length data assessed in previous years, the majority of root
biomass is located within the upper 5 cm of the soil (Kreyling et al. 2008). Average daily
values were calculated for analysis. Figure 1 shows the course of soil moisture during the
drought manipulations.
Leaf chemical analyses of host plant
The relative leaf water content (RWC) towards the end of the drought period was
analysed according to Barrs and Weatherley (1962). Leaves were cut and their fresh weight
(FW) was immediately determined using a micro-balance. The turgid weight (TW) was
determined after placing the leaves in distilled water at 4° C over night. Afterwards leaves
Manuscript 2: How do extreme drought and plant community composition affect host plant metabolites and herbivore performance
76
were dried to a constant weight at 70° C to determine their dry weight (DW). RWC was
calculated as:
100*)()((%)
DWTWDWFWRWC
−−
= (Barrs and Weatherley 1962)
To analyse the total soluble proteins in fresh plant material, one mixed sample of plant
material was sampled per plot at the end of the drought period, immediately frozen in liquid
nitrogen and stored at -80° C. Frozen material was mortared, soluble proteins of 100 mg plant
material were extracted using 50 mM sodiumphospate-buffer with 1 µm PMSF and 0.5 mM
DTT and determined according to Bradford (1976). We used known concentrations of Bovine
Serum Albumine as a standard.
To analyse the carbon and nitrogen content, mixed samples of three leaves per plot
were taken, dried at 35°C for four days, ground in a ball mill and analyzed with an elemental
analyser (Thermo Quest Flash EA 1112).
To analyse the total soluble carbohydrates, total phenolics, and condensed tannins,
three mixed samples of at least two plants per plot were taken at the end of the drought
period, immediately frozen in liquid nitrogen and lyophilized. 20 mg of leaf material were
extracted in 50 % methanol. Total soluble carbohydrates were analyzed using the anthrone
method with glucose as a standard (Kleber et al. 1987). Extinction was measured at 620 nm.
Total phenols were analyzed using Folin-Ciocalteus reagens and Catechin as a standard and
by measuring extinction at 750 nm (Swain and Hillis 1959). Condensed tannins were
analyzed by adding 4 % vanillin and concentrated HCl to methanolic plant extracts and by
measuring extinction at 500 nm (Broadhurst and Jones 1978). Catechin was used as a
standard.
Rearing experiment
For the feeding experiment, 320 freshly hatched larvae of S. littoralis were placed on
moist filter paper in 160 petri dishes, 10 cm in diameter, closed with parafilm. Thus, each
petri dish contained two larvae. To ensure that plants were already stressed by environmental
conditions at the start of the rearing experiment, it started ten days before the end of the
drought period. Thus, only the first ten days of their development (on average 25 days from
hatching to pupation) fell under the period of severe stress of their host plant, while the
second part fell under the stress recovery phase of the host, with a lower stress level as soil
moisture reached normal levels. Larvae were kept in a climate chamber at 25° C on a 15/9
light/dark cycle. Petri dishes were randomly assigned to four levels in the climate chamber
Manuscript 2: How do extreme drought and plant community composition affect host plant metabolites and herbivore performance
77
and the levels were shifted every second day, putting the lowest level to the highest place and
all other levels one level lower. The plant leaves from one plot were fed to the larvae in four
petri dishes (8 larvae in total). Caterpillars were able to eat ad libitum, as special care was
taken that the grass inside one petri dish was never totally consumed. Leaves were replaced at
least every second day. We recorded the mortality of the larvae, the development time until
pupation, the weight of the pupae one day after pupation and pupal mortality. Through the
isolation in climate chambers we were able to attribute the responses in herbivore
performance to differences in plant compounds, as opposed to when feeding is conducted
under field conditions and it is impossible to disentangle the effects of plant nutrients,
compensatory feeding and direct weather effects on herbivores (Goverde et al. 2002).
Statistical analysis
Chemical leaf traits were analyzed using a two-way ANOVA with weather treatment
and community composition as fixed factors. Additionally, we included the number of
columns and rows as random factors. This automatically implements the nesting of
composition within treatment-blocks in the mixed effect model (Faraway 2006; Dormann and
Kühn 2008). If several samples per plot were taken, as was the case with phenolics,
carbohydrates and condensed tannins, then the plot number was additionally included as a
random factor in the mixed model, to avoid any pseudo-replication.
Developmental time and pupal weight were analyzed using linear mixed effect models
with the petri dish nested within the plot nested within the treatment block as a random factor,
in addition to the row and the column of the treatment blocks as random factors. Larval and
pupal mortality were analyzed using generalized mixed effect models with binomial
distribution and otherwise the same model formula as for other developmental traits.
The significance levels in the mixed effect models were evaluated by Markov Chain
Monte Carlo sampling of 1000 permutations (Baayen 2009; package language R).The
significance of the fixed factors for the generalized mixed effect models was determined by
comparing the null model, without any factors, to the simplest factorial model, in which non-
significant terms had been removed by backwards stepwise selection. Prior to all analyses,
data were transformed accordingly, if the assumptions of ANOVA, homogeneity of variances
and normality, were not met (C/N ratio and nitrogen content: log-transformed; RWC: arcsin-
squareroot-transformed).
To determine the relationship between chemical leaf traits and development traits, we
applied hierarchical partitioning, as leaf chemical traits are often collinear (Schädler et al.
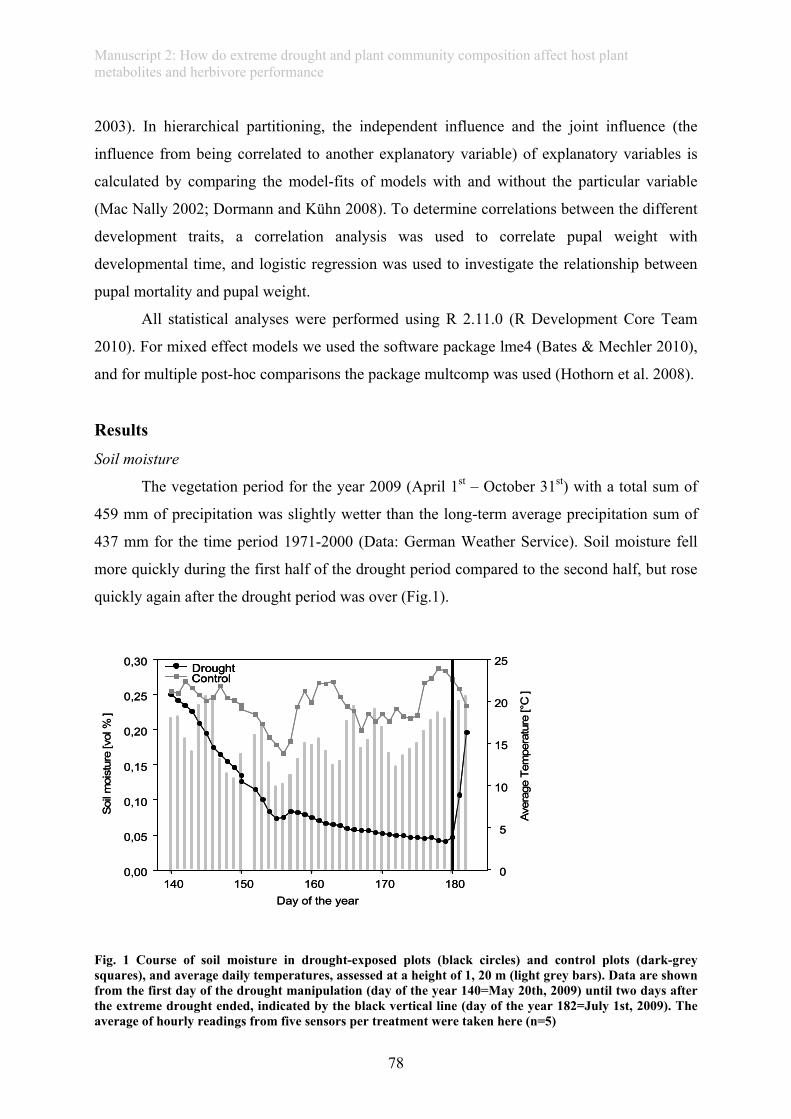
Manuscript 2: How do extreme drought and plant community composition affect host plant metabolites and herbivore performance
78
2003). In hierarchical partitioning, the independent influence and the joint influence (the
influence from being correlated to another explanatory variable) of explanatory variables is
calculated by comparing the model-fits of models with and without the particular variable
(Mac Nally 2002; Dormann and Kühn 2008). To determine correlations between the different
development traits, a correlation analysis was used to correlate pupal weight with
developmental time, and logistic regression was used to investigate the relationship between
pupal mortality and pupal weight.
All statistical analyses were performed using R 2.11.0 (R Development Core Team
2010). For mixed effect models we used the software package lme4 (Bates & Mechler 2010),
and for multiple post-hoc comparisons the package multcomp was used (Hothorn et al. 2008).
Results
Soil moisture
The vegetation period for the year 2009 (April 1st – October 31st) with a total sum of
459 mm of precipitation was slightly wetter than the long-term average precipitation sum of
437 mm for the time period 1971-2000 (Data: German Weather Service). Soil moisture fell
more quickly during the first half of the drought period compared to the second half, but rose
quickly again after the drought period was over (Fig.1).
Day of the year140 150 160 170 180
0,00
0,05
0,10
0,15
0,20
0,25
0,30 DroughtControl
Soil
moi
stur
e[v
ol %
]
0
5
10
15
20
25
Aver
age
Tem
pera
ture
[°C
]
Day of the year140 150 160 170 180
0,00
0,05
0,10
0,15
0,20
0,25
0,30 DroughtControlDroughtControl
Soil
moi
stur
e[v
ol %
]
0
5
10
15
20
25
Aver
age
Tem
pera
ture
[°C
]
Fig. 1 Course of soil moisture in drought-exposed plots (black circles) and control plots (dark-grey squares), and average daily temperatures, assessed at a height of 1, 20 m (light grey bars). Data are shown from the first day of the drought manipulation (day of the year 140=May 20th, 2009) until two days after the extreme drought ended, indicated by the black vertical line (day of the year 182=July 1st, 2009). The average of hourly readings from five sensors per treatment were taken here (n=5)
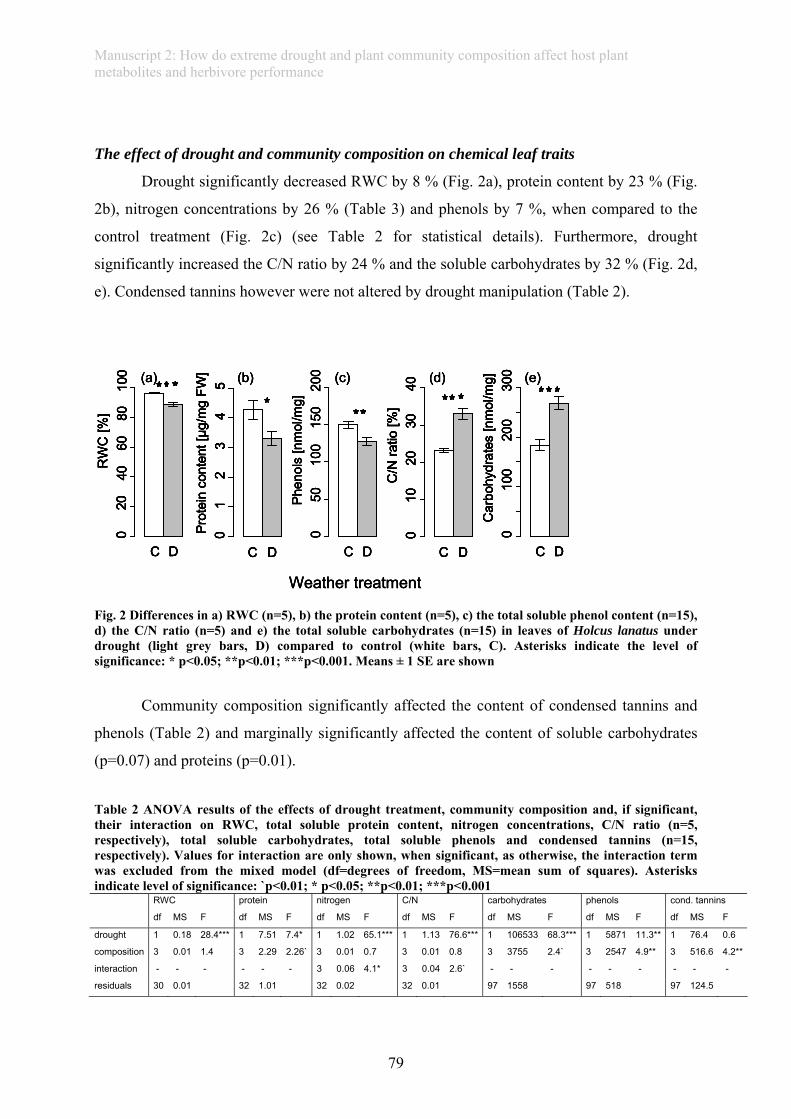
Manuscript 2: How do extreme drought and plant community composition affect host plant metabolites and herbivore performance
79
The effect of drought and community composition on chemical leaf traits
Drought significantly decreased RWC by 8 % (Fig. 2a), protein content by 23 % (Fig.
2b), nitrogen concentrations by 26 % (Table 3) and phenols by 7 %, when compared to the
control treatment (Fig. 2c) (see Table 2 for statistical details). Furthermore, drought
significantly increased the C/N ratio by 24 % and the soluble carbohydrates by 32 % (Fig. 2d,
e). Condensed tannins however were not altered by drought manipulation (Table 2).
C D
RW
C [%
]0
2040
6080
100 (a)
C D
Pro
tein
con
tent
[µg/
mg
FW]
01
23
45 (b)
C D
Phen
ols
[nm
ol/m
g]0
5010
015
020
0 (c)
C D
C/N
ratio
[%]
010
2030
40
(d)
C D
Car
bohy
drat
es[n
mol
/mg]
010
020
030
0 (e)
Weather treatment
C D
RW
C [%
]0
2040
6080
100 (a)
C D
Pro
tein
con
tent
[µg/
mg
FW]
01
23
45 (b)
C D
Phen
ols
[nm
ol/m
g]0
5010
015
020
0 (c)
C D
C/N
ratio
[%]
010
2030
40
(d)
C D
Car
bohy
drat
es[n
mol
/mg]
010
020
030
0 (e)
Weather treatment
C D
RW
C [%
]0
2040
6080
100 (a)
C D
Pro
tein
con
tent
[µg/
mg
FW]
01
23
45 (b)
C D
Phen
ols
[nm
ol/m
g]0
5010
015
020
0 (c)
C D
C/N
ratio
[%]
010
2030
40
(d)
C D
Car
bohy
drat
es[n
mol
/mg]
010
020
030
0 (e)
C D
RW
C [%
]0
2040
6080
100
C D
RW
C [%
]0
2040
6080
100 (a)
C D
Pro
tein
con
tent
[µg/
mg
FW]
01
23
45
C D
Pro
tein
con
tent
[µg/
mg
FW]
01
23
45 (b)
C D
Phen
ols
[nm
ol/m
g]0
5010
015
020
0 (c)
C D
C/N
ratio
[%]
010
2030
40
C D
C/N
ratio
[%]
010
2030
40
(d)
C D
Car
bohy
drat
es[n
mol
/mg]
010
020
030
0
C D
Car
bohy
drat
es[n
mol
/mg]
010
020
030
0 (e)
Weather treatment Fig. 2 Differences in a) RWC (n=5), b) the protein content (n=5), c) the total soluble phenol content (n=15), d) the C/N ratio (n=5) and e) the total soluble carbohydrates (n=15) in leaves of Holcus lanatus under drought (light grey bars, D) compared to control (white bars, C). Asterisks indicate the level of significance: * p<0.05; **p<0.01; ***p<0.001. Means ± 1 SE are shown
Community composition significantly affected the content of condensed tannins and
phenols (Table 2) and marginally significantly affected the content of soluble carbohydrates
(p=0.07) and proteins (p=0.01).
Table 2 ANOVA results of the effects of drought treatment, community composition and, if significant, their interaction on RWC, total soluble protein content, nitrogen concentrations, C/N ratio (n=5, respectively), total soluble carbohydrates, total soluble phenols and condensed tannins (n=15, respectively). Values for interaction are only shown, when significant, as otherwise, the interaction term was excluded from the mixed model (df=degrees of freedom, MS=mean sum of squares). Asterisks indicate level of significance: `p<0.01; * p<0.05; **p<0.01; ***p<0.001 RWC protein nitrogen C/N carbohydrates phenols cond. tannins
df MS F df MS F df MS F df MS F df MS F df MS F df MS F
drought 1 0.18 28.4*** 1 7.51 7.4* 1 1.02 65.1*** 1 1.13 76.6*** 1 106533 68.3*** 1 5871 11.3** 1 76.4 0.6
composition 3 0.01 1.4 3 2.29 2.26` 3 0.01 0.7 3 0.01 0.8 3 3755 2.4` 3 2547 4.9** 3 516.6 4.2**
interaction - - - - - - 3 0.06 4.1* 3 0.04 2.6` - - - - - - - - -
residuals 30 0.01 32 1.01 32 0.02 32 0.01 97 1558 97 518 97 124.5
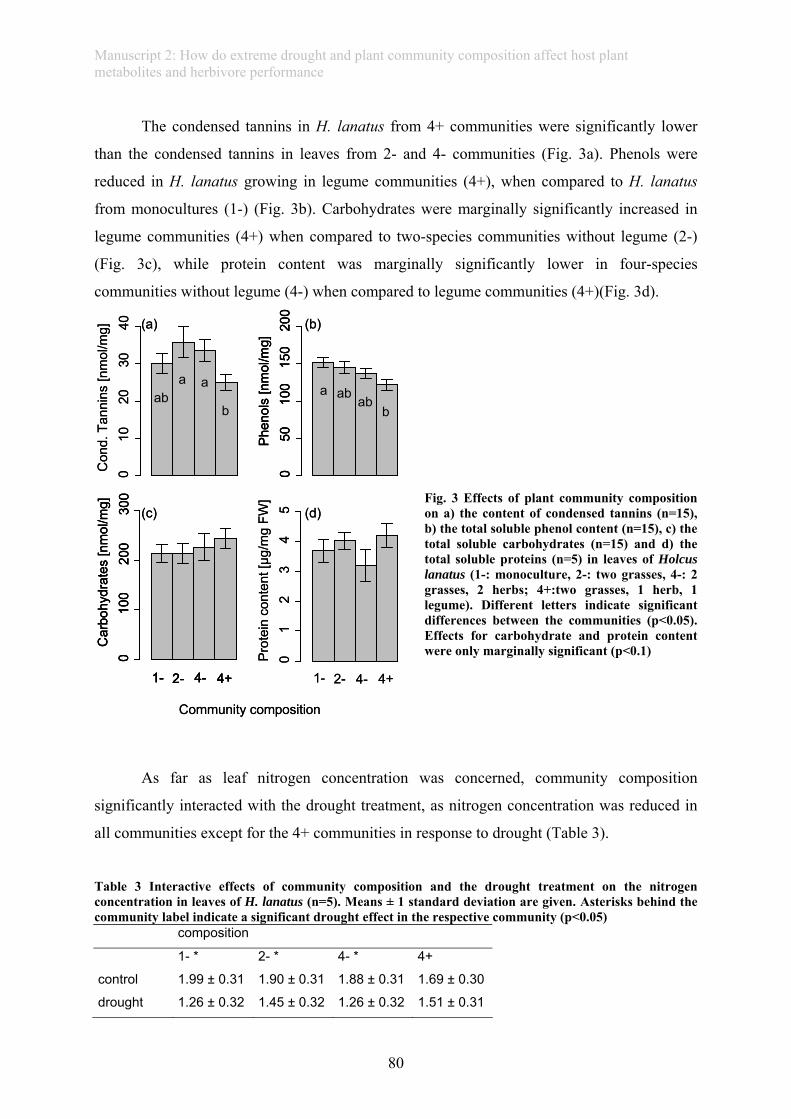
Manuscript 2: How do extreme drought and plant community composition affect host plant metabolites and herbivore performance
80
The condensed tannins in H. lanatus from 4+ communities were significantly lower
than the condensed tannins in leaves from 2- and 4- communities (Fig. 3a). Phenols were
reduced in H. lanatus growing in legume communities (4+), when compared to H. lanatus
from monocultures (1-) (Fig. 3b). Carbohydrates were marginally significantly increased in
legume communities (4+) when compared to two-species communities without legume (2-)
(Fig. 3c), while protein content was marginally significantly lower in four-species
communities without legume (4-) when compared to legume communities (4+)(Fig. 3d).
Fig. 3 Effects of plant community composition on a) the content of condensed tannins (n=15), b) the total soluble phenol content (n=15), c) the total soluble carbohydrates (n=15) and d) the total soluble proteins (n=5) in leaves of Holcus lanatus (1-: monoculture, 2-: two grasses, 4-: 2 grasses, 2 herbs; 4+:two grasses, 1 herb, 1 legume). Different letters indicate significant differences between the communities (p<0.05). Effects for carbohydrate and protein content were only marginally significant (p<0.1)
As far as leaf nitrogen concentration was concerned, community composition
significantly interacted with the drought treatment, as nitrogen concentration was reduced in
all communities except for the 4+ communities in response to drought (Table 3).
Table 3 Interactive effects of community composition and the drought treatment on the nitrogen concentration in leaves of H. lanatus (n=5). Means ± 1 standard deviation are given. Asterisks behind the community label indicate a significant drought effect in the respective community (p<0.05) composition
1- * 2- * 4- * 4+
control 1.99 ± 0.31 1.90 ± 0.31 1.88 ± 0.31 1.69 ± 0.30
drought 1.26 ± 0.32 1.45 ± 0.32 1.26 ± 0.32 1.51 ± 0.31
Con
d. T
anni
ns [n
mol
/mg]
010
2030
40
1- 4-2- 4+
Phen
ols
[nm
ol/m
g]0
5010
015
020
0
1- 4-2- 4+
Car
bohy
drat
es[n
mol
/mg]
010
020
030
0
Prot
ein
cont
ent[
µg/m
g FW
]0
12
34
5
(a) (b)
(d)(c)
Community composition
aba a
ba
abb
ab
Con
d. T
anni
ns [n
mol
/mg]
010
2030
40
1- 4-2- 4+
Phen
ols
[nm
ol/m
g]0
5010
015
020
0Ph
enol
s [n
mol
/mg]
050
100
150
200
1- 4-2- 4+
Car
bohy
drat
es[n
mol
/mg]
010
020
030
0
1- 4-2- 4+1- 4-2- 4+
Car
bohy
drat
es[n
mol
/mg]
010
020
030
0
Prot
ein
cont
ent[
µg/m
g FW
]0
12
34
5
(a) (b)
(d)(c)
Community composition
aba a
ba
abb
ab
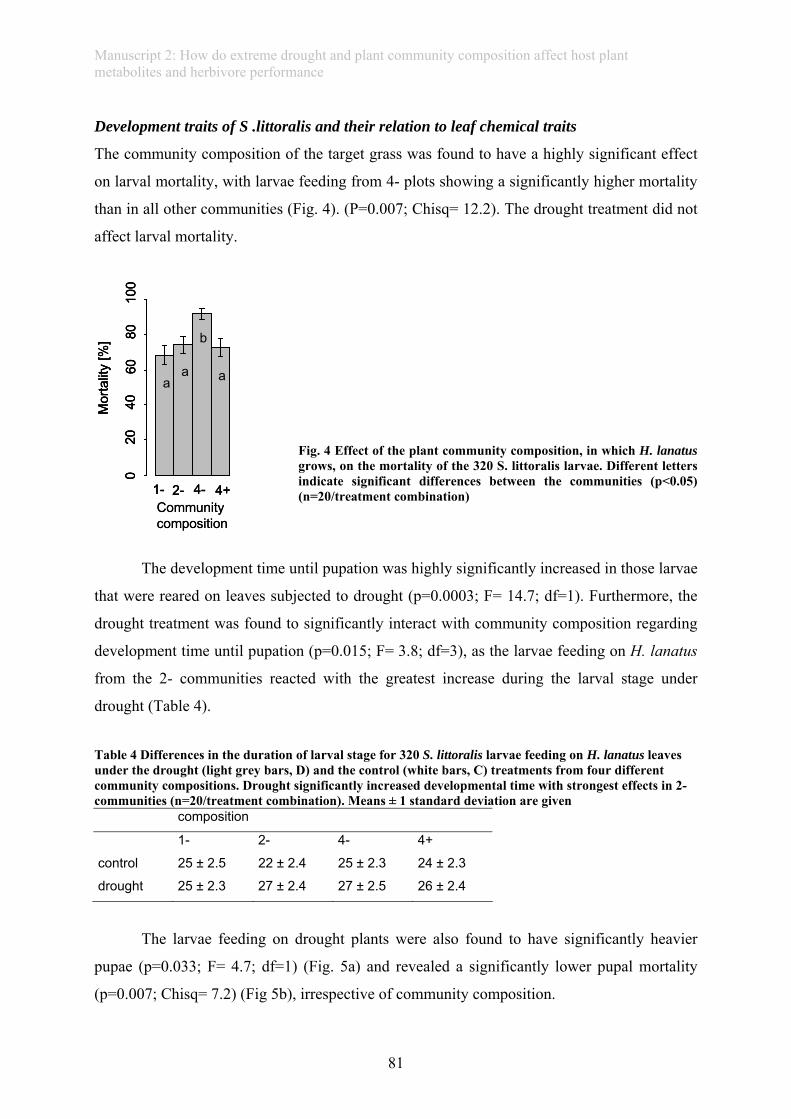
Manuscript 2: How do extreme drought and plant community composition affect host plant metabolites and herbivore performance
81
Development traits of S .littoralis and their relation to leaf chemical traits
The community composition of the target grass was found to have a highly significant effect
on larval mortality, with larvae feeding from 4- plots showing a significantly higher mortality
than in all other communities (Fig. 4). (P=0.007; Chisq= 12.2). The drought treatment did not
affect larval mortality.
Fig. 4 Effect of the plant community composition, in which H. lanatus grows, on the mortality of the 320 S. littoralis larvae. Different letters indicate significant differences between the communities (p<0.05) (n=20/treatment combination)
The development time until pupation was highly significantly increased in those larvae
that were reared on leaves subjected to drought (p=0.0003; F= 14.7; df=1). Furthermore, the
drought treatment was found to significantly interact with community composition regarding
development time until pupation (p=0.015; F= 3.8; df=3), as the larvae feeding on H. lanatus
from the 2- communities reacted with the greatest increase during the larval stage under
drought (Table 4).
Table 4 Differences in the duration of larval stage for 320 S. littoralis larvae feeding on H. lanatus leaves under the drought (light grey bars, D) and the control (white bars, C) treatments from four different community compositions. Drought significantly increased developmental time with strongest effects in 2- communities (n=20/treatment combination). Means ± 1 standard deviation are given composition
1- 2- 4- 4+
control 25 ± 2.5 22 ± 2.4 25 ± 2.3 24 ± 2.3
drought 25 ± 2.3 27 ± 2.4 27 ± 2.5 26 ± 2.4
The larvae feeding on drought plants were also found to have significantly heavier
pupae (p=0.033; F= 4.7; df=1) (Fig. 5a) and revealed a significantly lower pupal mortality
(p=0.007; Chisq= 7.2) (Fig 5b), irrespective of community composition.
Mor
talit
y[%
]
020
4060
8010
0
Communitycomposition
1- 4-2- 4+
aa
b
a
Mor
talit
y[%
]
020
4060
8010
0
Mor
talit
y[%
]
020
4060
8010
0
Communitycomposition
1- 4-2- 4+1- 4-2- 4+
aa
b
a
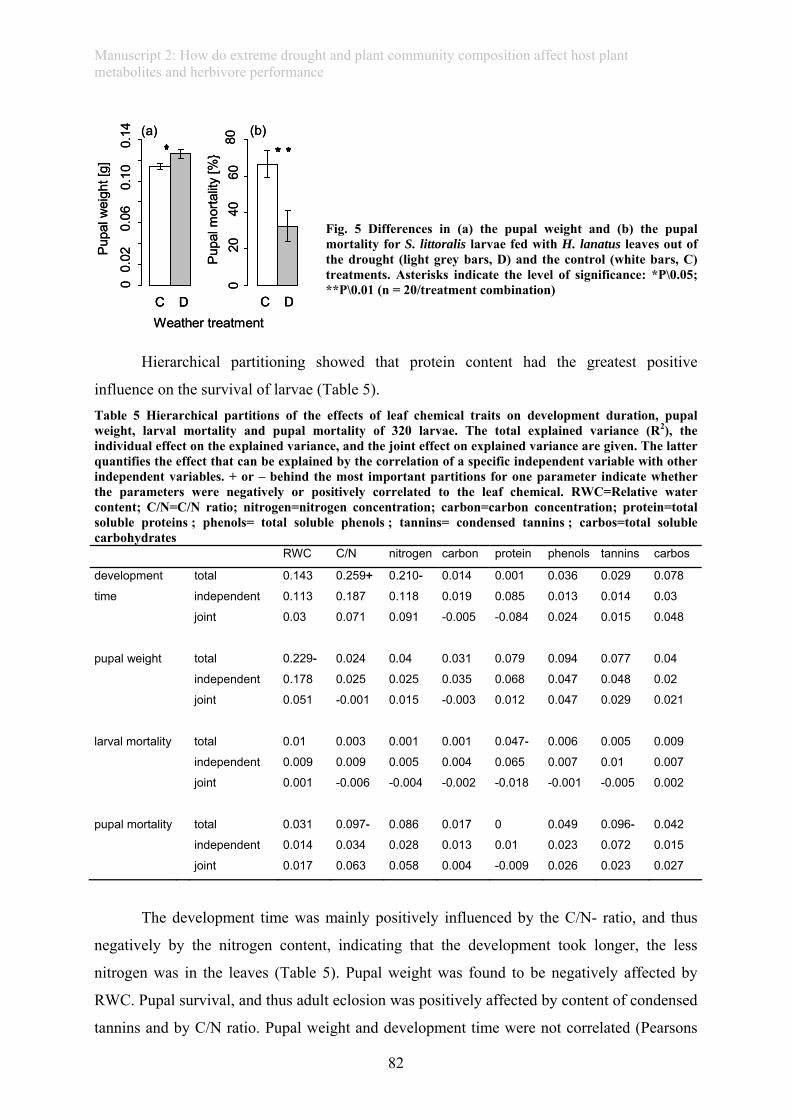
Manuscript 2: How do extreme drought and plant community composition affect host plant metabolites and herbivore performance
82
Fig. 5 Differences in (a) the pupal weight and (b) the pupal mortality for S. littoralis larvae fed with H. lanatus leaves out of the drought (light grey bars, D) and the control (white bars, C) treatments. Asterisks indicate the level of significance: *P\0.05; **P\0.01 (n = 20/treatment combination)
Hierarchical partitioning showed that protein content had the greatest positive
influence on the survival of larvae (Table 5). Table 5 Hierarchical partitions of the effects of leaf chemical traits on development duration, pupal weight, larval mortality and pupal mortality of 320 larvae. The total explained variance (R2), the individual effect on the explained variance, and the joint effect on explained variance are given. The latter quantifies the effect that can be explained by the correlation of a specific independent variable with other independent variables. + or – behind the most important partitions for one parameter indicate whether the parameters were negatively or positively correlated to the leaf chemical. RWC=Relative water content; C/N=C/N ratio; nitrogen=nitrogen concentration; carbon=carbon concentration; protein=total soluble proteins ; phenols= total soluble phenols ; tannins= condensed tannins ; carbos=total soluble carbohydrates RWC C/N nitrogen carbon protein phenols tannins carbos
development total 0.143 0.259+ 0.210- 0.014 0.001 0.036 0.029 0.078
time independent 0.113 0.187 0.118 0.019 0.085 0.013 0.014 0.03
joint 0.03 0.071 0.091 -0.005 -0.084 0.024 0.015 0.048
pupal weight total 0.229- 0.024 0.04 0.031 0.079 0.094 0.077 0.04
independent 0.178 0.025 0.025 0.035 0.068 0.047 0.048 0.02
joint 0.051 -0.001 0.015 -0.003 0.012 0.047 0.029 0.021
larval mortality total 0.01 0.003 0.001 0.001 0.047- 0.006 0.005 0.009
independent 0.009 0.009 0.005 0.004 0.065 0.007 0.01 0.007
joint 0.001 -0.006 -0.004 -0.002 -0.018 -0.001 -0.005 0.002
pupal mortality total 0.031 0.097- 0.086 0.017 0 0.049 0.096- 0.042
independent 0.014 0.034 0.028 0.013 0.01 0.023 0.072 0.015
joint 0.017 0.063 0.058 0.004 -0.009 0.026 0.023 0.027
The development time was mainly positively influenced by the C/N- ratio, and thus
negatively by the nitrogen content, indicating that the development took longer, the less
nitrogen was in the leaves (Table 5). Pupal weight was found to be negatively affected by
RWC. Pupal survival, and thus adult eclosion was positively affected by content of condensed
tannins and by C/N ratio. Pupal weight and development time were not correlated (Pearsons
Pup
alw
eigh
t[g]
00.
020.
060.
100.
14
C DWeather treatment
Pup
alm
orta
lity
[%}
020
4060
80
C D
(a) (b)
Pup
alw
eigh
t[g]
00.
020.
060.
100.
14
C DC DWeather treatment
Pup
alm
orta
lity
[%}
020
4060
80
C DC D
(a) (b)
Manuscript 2: How do extreme drought and plant community composition affect host plant metabolites and herbivore performance
83
correlation coefficient: -0.019; p=0.88). Pupal survival was positively related with pupal
weight (p=0.023; logistic regression).
Discussion
The extreme 42-day drought did not only affect the water content of the target grass
species, but also resulted in changes to almost all of the leaf chemical traits that we assessed.
These changes to the leaf chemicals also clearly affected the development traits of the
herbivore caterpillar. However, in contrast to our expectations, drought did not increase
defensive compounds in the grass. Furthermore, the drought did not result in a worse overall
herbivore performance, as adult eclosion and pupal weight were even higher for larvae fed
from drought treated plants. The community composition of the target grass also affected
some aspects of the leaf chemical composition, but changes cannot clearly be linked to
increased competition or higher stability in more diverse communities. Differences mainly
occurred in legume communities: H. lanatus growing in legume communities showed no
effects of drought on the leaf nitrogen concentration and had the lowest content of condensed
tannins and phenols. The community composition of the target grass affected the mortality of
the herbivore, with highest mortality in larvae feeding on the grass growing in four-species
communities without legume, in which also a trend towards lower protein content was
apparent (4-).
Soil moisture and plant stress
The extreme drought conditions were accompanied by a marked decrease in soil
moisture over the drought period, and this in turn clearly caused plant stress. In the year 2009
we did not directly quantify plant stress levels, e.g. by determining chlorophyll content or
maximum quantum yield. However, a reduction in leaf relative water content in our target
grass in all communities, along with marked changes in leaf chemicals, indicate acclimation
processes and stress reactions, showing that the plants experienced stress (Sinclair and
Ludlow 1985; Chaves et al. 2002).
Effect of drought and community composition on chemical leaf traits
A decrease in proteins and nitrogen, along with an increase in the C/N ratio under
severe drought conditions has also been observed in other studies investigating drought
effects on leaf chemicals (Shure et al. 1998; Liu et al. 2008). However, this is not in
Manuscript 2: How do extreme drought and plant community composition affect host plant metabolites and herbivore performance
84
accordance with the so-called “plant stress hypothesis”, which assumes available nitrogen to
increase under plant stress (White 1984). Nevertheless, as nitrogen uptake is linked to water
uptake, a decrease in nitrogen uptake, and therefore also protein content under drought, is not
surprising. An increase in carbohydrates under drought could be attributed to osmotic
adjustment in the course of drought acclimation. Soluble carbohydrates from starch
degradation act as compatible solutes to prevent turgor loss in plant cells (Chaves et al. 2002;
Regier et al. 2009). The decrease in total phenolics under drought does not support the idea
that plants under stress use the surplus from carbohydrates (due to restricted growth while
photosynthesis is still assimilating carbon) to accumulate more C-based defence compounds
(Herms and Mattson 1992). However, a reduction of phenols in response to drought has also
been reported by Shure et al. (1998). In our study, the need for osmotic adjustment under
extreme drought might have been a reason not to accumulate phenols, but rather invest the
surplus of carbon-based compounds in soluble carbohydrates.
As community composition can alter resource partitioning between plants, it might
also change the forage quality of leaf tissue. Both phenols and condensed tannins were found
to be lowest in the communities that included one legume species. This kind of reduction in
defence compounds can be explained by the potentially higher nitrogen availability in legume
communities caused by N2-fixing in root-nodules, enabling higher growth rates at the expense
of lower defence by C-based compounds (Herms and Mattson 1992). The trend towards
higher protein content in leaves from legume communities compared to four-species
communities without legumes support the idea of an increase in nitrogen availability in
legume communities and increased competition for nitrogen in communities containing four
species, but no legume. Moreover, labelling studies indicate a direct uptake of legume-derived
nitrogen by grasses (Gubsch et al 2011). Overall, the nitrogen concentration of grasses
growing in legume communities (4+) was not affected by drought, but showed changes in
response to drought in the other communities. The higher stability in this communities and the
possible fertilization effect of the legume support other studies which have shown an
enhancement of the nitrogen availability for plants growing in legume communities (Spehn et
al. 2002; Temperton et al. 2007; Dybzinski et al. 2008).
Developmental traits of S. littoralis and their relation to leaf chemical traits
The mortality of larvae was high, as the experiment was started immediately after
hatching of the larvae, when they are quite vulnerable. Furthermore, H. lanatus seemed to be
a sub-optimal food source for S. littoralis, as larvae the same age from the same egg strain
Manuscript 2: How do extreme drought and plant community composition affect host plant metabolites and herbivore performance
85
grew better when feeding on Plantago lanzeolata and Trifolium pratense, under otherwise
similar conditions. Nevertheless, as we expected mortality to be high, due to the results from a
prior trial experiment, we included enough replicates in order to obtain a substantial data set
for statistical analysis.
The reported changes in leaf metabolites, related to the drought treatment and
differences in the community compositions, clearly had an effect on herbivore performance.
Mortality of larvae was higher in four-species communities without a legume compared to the
other communities. Hierarchical partitioning showed that the mortality rate depended mostly
on the protein content. These data hint towards a central role of proteins for the survival of the
early instars. Other studies, too, showed poor larval survival under low nitrogen
concentrations (Myers and Post, 1981; Cates 1987; de Bruyn et al. 2002).
Larval development up to pupation was significantly longer for larvae fed on drought-
stressed plants, which might increase predation risk and thus mortality under natural
conditions (Benrey and Denno 1997). In accordance with Fischer and Fiedler (2000) and with
Morehouse and Rutowski (2010), the prolonged developmental time of the larvae was linked
to a reduced N-availability in drought-stressed leaves. It might be that larvae fed longer on N-
limited grass to reach a certain “growth target” (Raubenheimer and Simpson 1997). Such
compensatory feeding on low quality tissue may be a common phenomenon (Schädler et al.
2007b).
Drought also had positive effects on herbivore performance, irrespective of
community composition: The increased pupal weight might be explained by a higher uptake
of energy, as carbohydrate contents in leaves increased under drought and as larvae fed longer
on drought plants, possibly caused by lowered nitrogen contents. Thus, the “imbalanced diet”
when feeding on drought stressed plants caused firstly compensatory longer feeding, to reach
a certain nitrogen level necessary for development, and secondly led to a higher energy
uptake and higher pupal weights (Raubenheimer and Simpson 1997). RWC was negatively
related to pupal weight, as presumably water dilutes nutrients or carbohydrates in well-
watered plants. The increased pupal weight was correlated with a lower pupal mortality of the
larvae that had been fed from drought-stressed plants, which is in accordance to other studies
(Fischer and Fiedler 2000).
It should be reiterated that the samples for the leaf chemical analysis were taken on the
last two days of the drought treatment, whereas the larval development lasted from
approximately ten days before to ten days after the drought. Thus, larvae fed on leaves that
experienced milder stress levels in their late stages, which might have alleviated the effects of
Manuscript 2: How do extreme drought and plant community composition affect host plant metabolites and herbivore performance
86
extreme drought on leaf chemical traits (Huberty and Denno 2004). Further studies with a
higher temporal resolution would make it possible to investigate the course of changes in leaf
traits over the whole range of plant stress responses.
Nevertheless, the present study reveals that different development parameters can be
differently influenced by extreme drought, even though these only lasted for around half of
the duration of their larval development. Furthermore we show that plant community
composition (and therefore also competition and the presence of specific plant functional
traits) alters leaf metabolism and thereby affects herbivores. Concerning the debate on the
hypotheses on plant-stress (White1984) versus plant-vigour (Price 1991) we confirm other
studies which show the dependence of herbivore performance on plant-stress level (Scheirs
and de Bruyn 2005), investigated traits (Cornelissen et al. 2008) and insect-feeding guild
(Larsson 1989; Koricheva et al. 1998; Huberty and Denno 2004), as our results differ from
other drought experiments using different feeding guilds (EnglishLoeb et al. 1997; de Bruyn
et al. 2002). Differences to other studies may also be attributed to our specific experimental
conditions: Plants were grown in experimental communities in the field, not in isolated pots in
the greenhouse. This ensures more realistic plant growth conditions. In addition, the
herbivores in our study have not been grown on the plants, but were fed in climate chambers,
to more clearly relate the obtained results to changes in plant metabolites. Another reason for
differences to other studies and prominent hypotheses might be that the plants were severly
stressed, but also released from stress and recovered during the feeding experiment.
According to Huberty and Denno (2004) this might have caused differences in herbivore
performance when compared to feeding experiments under constant stress. Our study
provides additional evidence that the nitrogen limitation hypothesis, stating that high nitrogen
contents are beneficial for herbivore performance (White1984) does not seem to be widely
applicable over all development traits and stages (Fischer and Fiedler 2000). Similar to
Fischer & Fiedler (2000) our data provide hints that higher protein or nitrogen contents are
beneficial for a faster rate of development and higher larval survival, although they might
reduce adult eclosion.
Conclusion
Our findings suggest that extreme droughts, which are projected to increase in frequency with
climate change, can also affect the development of herbivores. This is primarily caused by a
Manuscript 2: How do extreme drought and plant community composition affect host plant metabolites and herbivore performance
87
direct alteration of leaf chemicals under severe drought conditions. However, our study also
shows that community composition alters leaf chemicals and might therefore also influence
the development of herbivores. Climate change and severe dry spells are likely to alter plant
community composition, due to species-specific survival strategies, phenotypic plasticity and
niches of plant species, and such alterations in turn might also affect leaf chemicals and thus
herbivore performance, as our study shows. Such changes may support desynchronisation
processes and thus might destabilize established food-webs and ecosystems. Furthermore, we
show that leaf chemicals can influence different development stages in a complex way,
making in difficult to draw any direct connections between leaf nutrients and accordingly
defence compounds and herbivore performance.
Acknowledgements: Many thanks to Christian Schemm for his great work in leaf chemical
analysis and also to Björn Reineking for advice on statistical problems. This work was kindly
supported by the Helmholtz Impulse and Networking Fund through the Helmholtz
Interdisciplinary Graduate School for Environmental Research (HIGRADE).
References: Baayen RH (2009) languageR: Data sets and functions with "Analyzing Linguistic Data: A practical introduction
to statistics" R package version 0.955. http://CRAN.R-project.org/package=languageR. Accessed 3 March 2011.
Barrs HD, Weatherley PE (1962) A re-examination of relative turgidity technique for estimating water deficits in leaves. Austral J Biol Sci 15 (3):413-417.
Bates D, Maechler M (2010) lme4: Linear mixed-effects models using S4 classes. R package version 0.999375-33. http://CRAN.R-project.org/package=lme4. Accessed 3 March 2011.
Beniston M, Stephenson DB, Christensen OB, Ferro CAT, Frei C, Goyette S, Halsnaes K, Holt T, Jylha K, Koffi B, Palutikof J, Schoell R, Semmler T, Woth K (2007) Future extreme events in European climate: an exploration of regional climate model projections. Clim Change 81 (Suppl. 1):71–95.
Benrey B, Denno RF (1997) The slow-growth-high-mortality hypothesis: A test using the cabbage butterfly. Ecol 78 (4):987–999.
Bradford MM (1976) Rapid and sensitive method for quantitation of microgram quantities of protein utilizing principle of protein-dye binding. Analyt Biochem 72 (1-2):248–254.
Broadhurst RB, Jones WT (1978) Analysis of condensed tannins using acidified vanillin. J Sci Food Agricul 29 (9):788–794.
Brown ES, Dewhurst CF (1975) Genus Spodoptera (Lepidoptera, Noctuidae) in Africa and Near East. Bull Entomol Res 65 (2):221-&.
Bruyn L de, Scheirs J, Verhagen R (2002) Nutrient stress, host plant quality and herbivore performance of a leaf-mining fly on grass. Oecologia 130 (4):594–599.
Callaway RM, Walker LR (1997) Competition and facilitation: A synthetic approach to interactions in plant communities. Ecol 78 (7):1958–1965.
Cates RG, Henderson CB, Redak RA (1987) Responses of the western spruce budworm to varying levels of nitrogen and terpenes. Oecologia 73:312-316.
Chaves MM, Pereira JS, Maroco J, Rodrigues ML, Ricardo CP, Osorio ML, Carvalho I, Faria T, Pinheiro C (2002) How plants cope with water stress in the field. Photosynthesis and growth. Ann Bot 89 (Sp. Iss. SI):907–916.
Cornelissen T, Fernandes GW, Vasconcellos-Neto J (2008) Size does matter: variation in herbivory between and within plants and the plant vigor hypothesis. Oikos 117 (8):1121–1130.
Manuscript 2: How do extreme drought and plant community composition affect host plant metabolites and herbivore performance
88
Dormann C, Kühn I (2008) Angewandte Statistik für die biologischen Wissenschaften. 2nd ed. http://www.ufz.de/data/deutschstatswork7649.pdf.
Dybzinski R, Fargione JE, Zak DR, Fornara D, Tilman D (2008) Soil fertility increases with plant species diversity in a long-term biodiversity experiment. Oecologia 158 (1):85–93.
EnglishLoeb G, Stout MJ, Duffey SS (1997) Drought stress in tomatoes: Changes in plant chemistry and potential nonlinear consequences for insect herbivores. Oikos 79 (3):456–468.
Faraway JJ (2006) Extending the Linear Model with R - Generalized Linear, Mixed Effects and Nonparametric Regression Models. Chapman & Hall/ CRC, Boca Raton.
Fischer K, Fiedler K (2000) Response of the copper butterfly Lycaena tityrus to increased leaf nitrogen in natural food plants: evidence against the nitrogen limitation hypothesis. Oecologia 124 (2):235–241.
Goverde M, Erhardt A, Niklaus PA (2002) In situ development of a satyrid butterfly on calcareous grassland exposed to elevated carbon dioxide. Ecol 83 (5):1399–1411.
Grime JP, Hodgson, JG, Hunt R (1988). Comparative Plant ecology. A functional approach to common british species. Unwin Hyman, London, UK.
Gubsch M, Roscher C, Gleixner G, Habekost M, Lipowsky A, Schmid B, Schulze ED, Steinbeiss S, Buchmann N (2011) Foliar and soil δ15N values reveal increased nitrogen partitioning among species in diverse grassland communities. Plant Cell Environ 34 (6):895-908.
Gumbel EJ (1958) Statistical-theory of extreme values. Bull Internat Stat Inst 36 (3):12–14. Heisler-White JL, Blair JM, Kelly EF, Harmoney K, Knapp AK (2009). Contingent productivity responses to
more extreme rainfall regimes across a grassland biome. Glob Change Biol 15 (12): 2894–2904. Herms DA, Mattson WJ (1992) The dilemma of plants- to grow or to defend. Quart Rev Biol 67 (3):283–335. Hothorn T, Bretz F, Westfall P (2008) Simultaneous inference in general parametric models. Biomet J 50
(3):346–363. Huberty AF, Denno RF (2004) Plant water stress and its consequences for herbivorous insects: A new synthesis.
Ecol 85 (5):1383–1398. Inbar M, Doostdar H, Mayer RT (2001) Suitability of stressed and vigorous plants to various insect herbivores.
Oikos 94 (2):228–235. IPCC (2007) Climate change 2007: The physical science basis. Contribution of Working Group I to the fourth
assessment report for the intergovernmental panel on climate change. Cambridge University Press, Cambridge & New York.
Jentsch A, Kreyling J, Beierkuhnlein C (2007) A new generation of climate-change experiments: events, not trends. Front Ecol Environ 5 (7):365–374.
Kleber HP, Schlee D, Schöpp W (1987) Biochemisches Praktikum. Gustav-Fischer-Verlag Jena. Koricheva J, Larsson S, Haukioja E (1998) Insect performance on experimentally stressed woody plants: A
meta-analysis. Ann Rev Entomol 43:195–216. Kreyling J, Beierkuhnlein C, Elmer M, Pritsch K, Radovski M, Schloter M, Woellecke J, Jentsch A (2008) Soil
biotic processes remain remarkably stable after 100-year extreme weather events in experimental grassland and heath. Plant Soil 308 (1-2):175–188.
Larsson S (1989) Stressful times for the plant-stress-insect performance hypothesis. Oikos 56 (2):277–283. Li Y, Ye W, Wang M, Yan X (2009) Climate change and drought: a risk assessment of crop-yield impacts. Clim
Res 39 (1):31–46. Liu Y, Zhang T, Wang J (2008) Photosynthesis and metabolite levels in dehydrating leaves of Reaumuria
soongorica. Acta Biol Cracoviensa Ser Bot 50 (1):19–26. Loreau M, Hector A (2001) Partitioning selection and complementarity in biodiversity experiments. Nature 413
(6855):72-76. Mac Nally R (2002) Multiple regression and inference in ecology and conservation biology: further comments
on identifying important predictor variables. Biodiv Conserv 11 (8):1397–1401. Morehouse NI, Rutowski RL (2010) Developmental responses to variable diet composition in a butterfly: the
role of nitrogen, carbohydrates and genotype. Oikos119 (4):636–645. Myers JH, Post BJ (1981) Plant nitrogen fluctuations of insect populations: a test with the cinnebar moth-tansy
ragwort system. Oecologia 48:151-156 Nguyen TT an, Michaud D, Cloutier C (2007) Proteomic profiling of aphid Macrosiphum euphorbiae responses
to host-plant-mediated stress induced by defoliation and water deficit. J Insect Phys 53 (6):601–611. Price PW (1991) The plant vigor hypothesis and herbivore attack. Oikos 62 (2):244–251. R Development Core Team (2010) R: A language and environment for statistical computing. R Foundation for
Statistical Computing, Vienna, Austria. ISBN 3-900051-07-0, URL http://www.R-project.org. Accessed 3 March 2011
Raubenheimer D, Simpson S J (1997) Integrative models of nutrient balancing: application to insects and vertebrates. Nutr Res Rev 10: 151–179.
Manuscript 2: How do extreme drought and plant community composition affect host plant metabolites and herbivore performance
89
Regier N, Streb S, Cocozza C, Schaub M, Cherubini P, Zeeman SC, Frey B (2009) Drought tolerance of two black poplar (Populus nigra L.) clones: contribution of carbohydrates and oxidative stress defence. Plant Cell Environ 32 (12):1724–1736.
Schädler M, Jung G, Auge H, Brandl R (2003) Palatability, decomposition and insect herbivory: patterns in a successional old-field plant community. Oikos 103 (1):121–132.
Schädler M, Brandl R, Haase J (2007a) Antagonistic interactions between plant competition and insect herbivory. Ecol 88 (6):1490–1498.
Schädler M., Roeder M., Brandl R, Matthies D (2007b) Interactiong effects of elevated CO2, nutrient availability and plant species on a generalist herbivore. Glob Chang Biol 13:1005-1015.
Scheirs J, Bruyn L de (2005) Plant-mediated effects of drought stress on host preference and performance of a grass miner. Oikos 108 (2):371–385.
Showler AT, Moran JP (2003) Effects of drought stressed cotton, Gossypium hirsutum L., on beet armyworm, Spodoptera exigua (Hübner), oviposition, and larval feeding preferences and growth. J Chem Ecol 29 (9):1997-2011.
Shure DJ, Mooreside PD, Ogle SM (1998) Rainfall effects on plant-herbivore processes in an upland oak forest. Ecol 79 (2):604–617.
Sinclair TR, Ludlow MM (1985) Who taught plants thermodynamics? The unfulfilled potential of plant water potential. Aust J Plant Physiol 33:213-217.
Spehn EM, Scherer-Lorenzen M, Schmid B, Hector A, Caldeira MC, Dimitrakopoulos PG, Finn JA, Jumpponen A, O’Donnovan G, Pereira JS, Schulze ED, Troumbis AY, Körner C (2002) The role of legumes as a component of biodiversity in a cross-European study of grassland biomass nitrogen. Oikos 98 (2):205–218.
Swain T, Hillis WE (1959) The phenolic constituents of Prunus domestica. J Sci Food Agric 10: 63-68. Temperton VM, Mwangi PN, Scherer-Lorenzen M, Schmid B, Buchmann N (2007) Positive interactions
between nitrogen-fixing legumes and four different neighbouring species in a biodiversity experiment. Oecologia 151 (2):190–205.
Trenberth KE, Dai A, Rasmussen RM, Parsons DB (2003) The changing character of precipitation. Bull Am Met Soc 84 (9):1205+.
Wang H, Fu R, Kumar A, Li W (2010) Intensification of Summer Rainfall Variability in the Southeastern United States during Recent Decades. J Hydromet 11 (4):1007–1018.
WhiteTC (1984) The abundance of invertebrate herbivores in relation to the availability of nitrogen in stressed food plants. Oecologia 63 (1):90–105.
Wurst S, van Beersum S (2009) The impact of soil organism composition and activated carbon on grass-legume competition. Plant Soil 314 (1-2):1–9.
Manuscript 3: Ecological stress memory and cross stress tolerance in plants in the face of climate extremes
90
Manuscript 3: Ecological stress memory and cross stress tolerance in plants
in the face of climate extremes Environmental and Experimental Botany, 2012, in press.
http://dx.doi.org/10.1016/j.envexpbot.2012.02.009
Julia Waltera*, Anke Jentscha, Carl Beierkuhnleinb, Juergen Kreylingb
aDisturbance Ecology, Bayreuth University, 95440 Bayreuth, Germany; corresponding author aDisturbance Ecology, Bayreuth University, 95440 Bayreuth, Germany
bDepartment of Biogeography, Bayreuth University, 95440 Bayreuth, Germany
∗ corresponding author: [email protected]; phone:+49-921-552360, fax:+49-921-552315
Highlights
1. We define the concept of an ecological stress memory.
2. Some studies hint towards the existence of an ecological stress memory after climate
extremes (drought, heat, frost).
3. Possible mechanisms are e.g. epigenetic modifications.
4. Further work and co-operations between ecologist and molecular biologist are urgently
needed.
Abstract
Under climate change, not only the magnitude, but also the frequency of extreme
weather events is predicted to increase. Such repeated climate stress events may cause
fundamental shifts in species compositions or ecosystem functioning. Yet, few studies
document such shifts. One reason for higher stability of ecosystems than previously expected
may be ecological stress memory at the single plant level. Ecological stress memory is
defined here as any response of a single plant after a stress experience that modifies the
response of the plant towards future stress events including the mode of interaction with other
ecological units. Ecological stress memory is assessed on a whole plant level in ecological
relevant parameters. It is therefore one important aspect of the broader concept of ecological
memory that refers to whole communities and ecosystems. Here, we present studies which
Manuscript 3: Ecological stress memory and cross stress tolerance in plants in the face of climate extremes
91
indicate the existence of ecological stress memory within single plants after drought, frost or
heat stress. Possible mechanisms underlying an ecological stress memory are the
accumulation of proteins, transcription factors or protective metabolites, as well as epigenetic
modifications or morphological changes. In order to evaluate the importance of stress
memory for stabilizing whole ecosystems and communities in times of climate change,
cooperation between ecologists and molecular biologists is urgently needed, as well as more
studies investigating stress memory on a single plant level. Only then the potential of plant
stress memory for stabilizing ecosystems in times of intensifying climatic extremes can be
evaluated and taken into account for measures of mitigation and adaptation to climate change.
Keywords: global warming; ecophysiology; ecological memory; extreme events; heat stress;
frost stress; drought stress
1. Introduction
The increase of climatic variability due to global climate change exerts climatic stress
on plants that is novel in magnitude and frequency (IPCC 2007; Hegerl et al., 2011; Min et
al., 2011). Extreme weather events such as drought, heat waves, heavy rainfall, or frost spells
differ from continuous climatic trends (e.g. warming or rising CO2-levels), as their ecological
consequences are expected to be out of proportion to their relatively short duration (Easterling
et al., 2000; Jentsch et al., 2007; Smith, 2011). Thus, extreme weather events may cause
stronger effects on plants and plant communities than gradual shifts in means, as their
abruptness gives little time for acclimation processes and as their magnitude may be
impossible for single plants to cope with.
Collapsing populations of key species have been reported as direct responses to
extreme climatic events (Allen and Breshears, 1998). However, there is also increasing
incidence for stabilizing processes of climatic fluctuations for instance stimulated by reduced
precipitation or recurrent drought events (Fay et al., 2000; Kahmen et al., 2005; Jentsch et al.,
2011; Lloret et al. 2011). Such stabilizing mechanisms may occur already at the species and
single plant level and are not yet fully appreciated. Ecological stress memory, dealt with in
this article, might be one aspect leading to more stable community compositions in the face of
an increasing frequency of extreme climatic events.
An ecological stress memory might emerge as plants reveal modifications, like
acclimation, upon stress exposure that might persist after the stress stopped. Thus, when stress
frequency increases, plants may not have returned to their previous reference state in the time
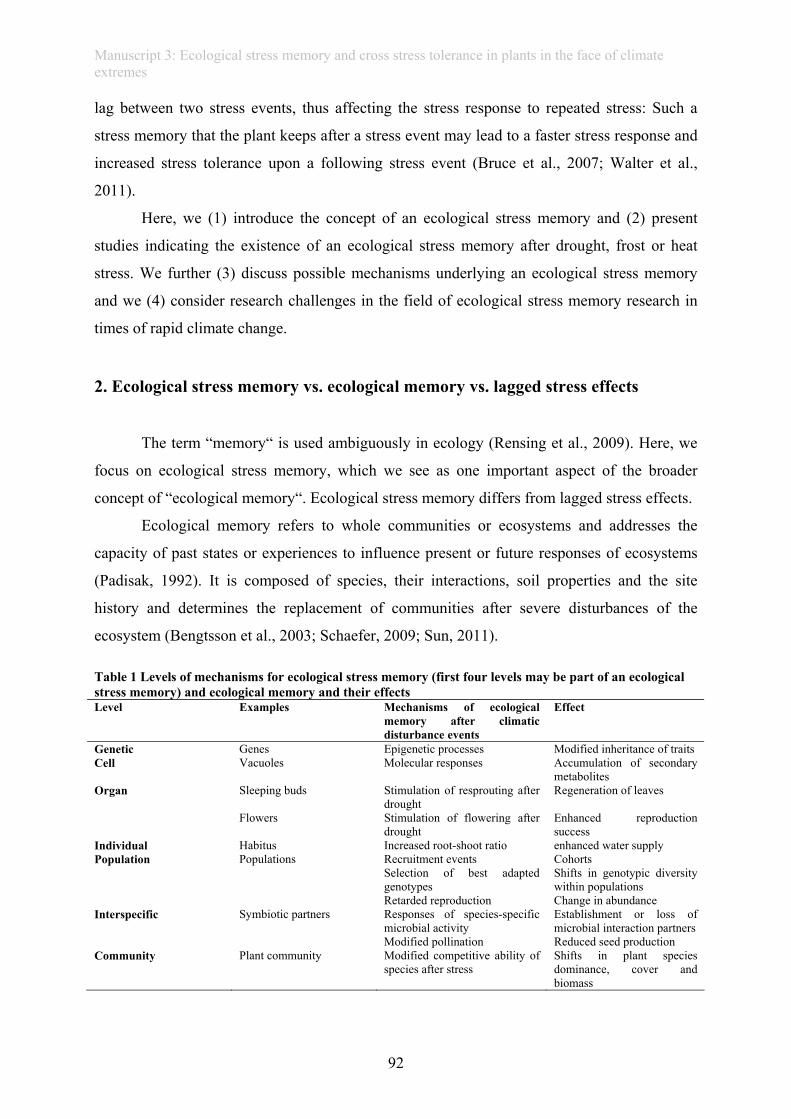
Manuscript 3: Ecological stress memory and cross stress tolerance in plants in the face of climate extremes
92
lag between two stress events, thus affecting the stress response to repeated stress: Such a
stress memory that the plant keeps after a stress event may lead to a faster stress response and
increased stress tolerance upon a following stress event (Bruce et al., 2007; Walter et al.,
2011).
Here, we (1) introduce the concept of an ecological stress memory and (2) present
studies indicating the existence of an ecological stress memory after drought, frost or heat
stress. We further (3) discuss possible mechanisms underlying an ecological stress memory
and we (4) consider research challenges in the field of ecological stress memory research in
times of rapid climate change.
2. Ecological stress memory vs. ecological memory vs. lagged stress effects
The term “memory“ is used ambiguously in ecology (Rensing et al., 2009). Here, we
focus on ecological stress memory, which we see as one important aspect of the broader
concept of “ecological memory“. Ecological stress memory differs from lagged stress effects.
Ecological memory refers to whole communities or ecosystems and addresses the
capacity of past states or experiences to influence present or future responses of ecosystems
(Padisak, 1992). It is composed of species, their interactions, soil properties and the site
history and determines the replacement of communities after severe disturbances of the
ecosystem (Bengtsson et al., 2003; Schaefer, 2009; Sun, 2011). Table 1 Levels of mechanisms for ecological stress memory (first four levels may be part of an ecological stress memory) and ecological memory and their effects Level Examples Mechanisms of ecological
memory after climatic disturbance events
Effect
Genetic Genes Epigenetic processes Modified inheritance of traits Cell Vacuoles Molecular responses Accumulation of secondary
metabolites Organ Sleeping buds Stimulation of resprouting after
drought Regeneration of leaves
Flowers Stimulation of flowering after drought
Enhanced reproduction success
Individual Habitus Increased root-shoot ratio enhanced water supply Population Populations Recruitment events Cohorts Selection of best adapted
genotypes Shifts in genotypic diversity within populations
Retarded reproduction Change in abundance Interspecific Symbiotic partners Responses of species-specific
microbial activity Establishment or loss of microbial interaction partners
Modified pollination Reduced seed production Community Plant community Modified competitive ability of
species after stress Shifts in plant species dominance, cover and biomass
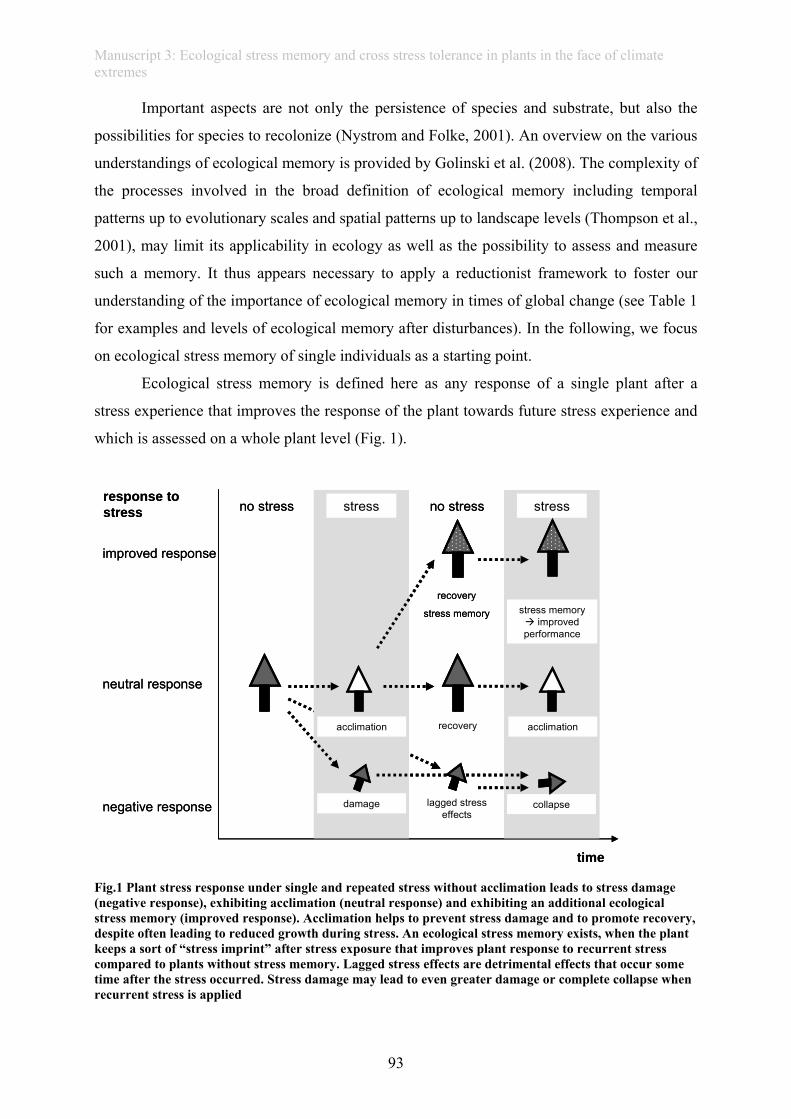
Manuscript 3: Ecological stress memory and cross stress tolerance in plants in the face of climate extremes
93
Important aspects are not only the persistence of species and substrate, but also the
possibilities for species to recolonize (Nystrom and Folke, 2001). An overview on the various
understandings of ecological memory is provided by Golinski et al. (2008). The complexity of
the processes involved in the broad definition of ecological memory including temporal
patterns up to evolutionary scales and spatial patterns up to landscape levels (Thompson et al.,
2001), may limit its applicability in ecology as well as the possibility to assess and measure
such a memory. It thus appears necessary to apply a reductionist framework to foster our
understanding of the importance of ecological memory in times of global change (see Table 1
for examples and levels of ecological memory after disturbances). In the following, we focus
on ecological stress memory of single individuals as a starting point.
Ecological stress memory is defined here as any response of a single plant after a
stress experience that improves the response of the plant towards future stress experience and
which is assessed on a whole plant level (Fig. 1).
negative response
neutral response
improved response
no stress no stressstress stress
acclimation
recovery
stress memory
recovery acclimation
stress memoryimproved
performance
damage lagged stress effects
collapse
response to stress
time
negative response
neutral response
improved response
no stress no stressstress stress
acclimation
recovery
stress memory
recovery acclimation
stress memoryimproved
performance
damage lagged stress effects
collapse
response to stress
time Fig.1 Plant stress response under single and repeated stress without acclimation leads to stress damage (negative response), exhibiting acclimation (neutral response) and exhibiting an additional ecological stress memory (improved response). Acclimation helps to prevent stress damage and to promote recovery, despite often leading to reduced growth during stress. An ecological stress memory exists, when the plant keeps a sort of “stress imprint” after stress exposure that improves plant response to recurrent stress compared to plants without stress memory. Lagged stress effects are detrimental effects that occur some time after the stress occurred. Stress damage may lead to even greater damage or complete collapse when recurrent stress is applied
Manuscript 3: Ecological stress memory and cross stress tolerance in plants in the face of climate extremes
94
An ecological stress memory might involve the persistence of acclimation mechanisms
and protective substances. However, it is not acclimation per se, as such a memory remains
active long after the stress has been applied, and enables the plant to respond quicker and
more adequate to a recurrent stress event. It thus requires a persisting “imprint” modifying
future stress response. For acclimation, the plant does not need to experience real stress, as,
e.g. for frost acclimation, certain environmental cues are sufficient to trigger acclimation
within the seasonal life cycle performance. Ecological stress memory has a temporal
dimension and, in this sense can only be studied after the stress stopped and the plant
recovered, e.g. took up its pre-stress metabolism again and repaired or compensated damage.
After applying recurrent stress, ecological stress memory should lead to an improved
performance when compared to plants without a persisting stress memory.
Contrastingly, lagged or delayed stress effects are detrimental effects of single stress
events that become clearly apparent only after some time, e.g. when the plant dies or a
community collapses (Fig. 1). The response of trees to drought, for instance, is often
expressed in increased mortality but this may happen even several years after the drought
event (Bigler et al., 2007). Likewise, alterations in soil frost events can lead to increased
mortality of dwarf-shrubs after more than one year, but with no apparent effects in the first
year after the stress event (Kreyling et al., 2010). Such lagged responses clearly indicate
carry-over effects in fitness which are not easily detectable directly after the event and which
may explain the findings of reduced resilience upon repeated stress events. For example,
Lloret et al. (2004) investigated the impact of recurrent drought (1985 and 1995) on
resprouting and die-back in Quercus ilex. They found a progressive loss of individual
resilience upon recurrent drought, as the ability to survive and resprout was reduced compared
to the first drought. Mueller et al. (2005) examined Pinus edulis and Juniperus monosperma
mortality after extreme drought episodes and also found a reduction of resilience and a higher
mortality rate for a recurrent drought in 2002 compared to the previous drought in 1996. It
may have been that detrimental effects have persisted even after many years and plants may
not have been recovered before the following stress exposure: Starch stocks in lignotubers of
Q. ilex were found not to be restored to their pre-stress values even 10 years after an extreme
drought (Lopez et al., 2009). Thus, to clearly distinguish such lagged stress effects from an
ecological stress memory it may be necessary for experiments to apply a recurrent stress event
and to compare the answer of recurrently stressed plants to single stressed plants. Only when
the performance to recurrent stress is improved when compared to single stressed plants, the
definition allows calling this an ecological stress memory.
Manuscript 3: Ecological stress memory and cross stress tolerance in plants in the face of climate extremes
95
In the following, we review mechanisms of drought tolerance and evidences for
drought memory, of frost tolerance and frost memory as well as of heat stress tolerance and
heat stress memory.
3. Drought tolerance and drought memory
Plants are able to acclimate to drought stress, thereby increasing their drought
tolerance. Mechanisms of acclimation include the accumulation of osmoprotective proteins,
like dehydrins (Bohnert, 2000; Lambers et al., 2008), the accumulation of soluble sugars
(Lambers et al., 2008; Walter et al., 2012), a reduction of the photosynthetic apparatus along
with additional mechanisms to prevent damage by reactive oxygen species (Munne-Bosch
and Alegre, 2000) and the accumulation of compatible solutes (proline, betaine) (Bohnert,
2000). Changes in gene expression that accompany drought acclimation are often ABA-
mediated, and upregulated genes include genes of the LEA family (late embryogenesis
abundant) (Bohnert, 2000; Lambers et al., 2008). In addition to physiological changes,
phenotypic and morphological responses can be initiated during drought stress, such as an
increased root to shoot ratio or the development of roots in deeper soil layers (Newman et al.,
2006).
Some recent findings indicate the existence of an ecological drought memory: Walter
et al. (2011) found an increase in photoprotection in single grass plants under repeated
drought when compared to plants that were not subjected to drought previously, even several
weeks after the first drought was applied and after the plants were completely cut and regrown
(Fig. 2A).
Similarly, Onate et al. (2011) showed that Urtica dioica subjected to combined
drought and nutrient deficiency in their juvenile phase revealed improved drought stress
tolerance in mature leaves, especially in reproductive shoots.
Under laboratory conditions, Goh et al. (2003) found that Arabidopsis thaliana
repeatedly subjected to high levels of abscisic acid (ABA), also involved in drought stress
signaling and response, led to a formation of ecological stress memory, as gene expression
was changed in response to following stress events compared to non-treated plants. Knight et
al. (1998) observed changes in drought stress-induced calcium-signaling after plants had
encountered either osmotic or oxidative stress previously.
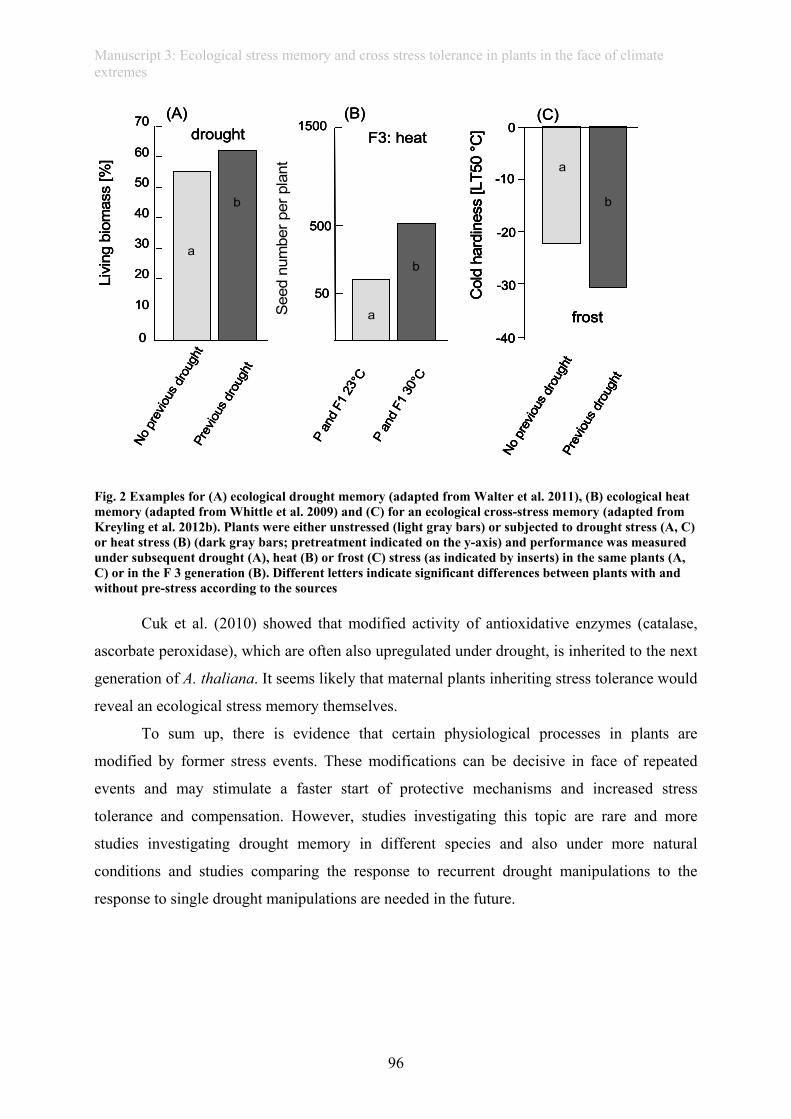
Manuscript 3: Ecological stress memory and cross stress tolerance in plants in the face of climate extremes
96
Fig. 2 Examples for (A) ecological drought memory (adapted from Walter et al. 2011), (B) ecological heat memory (adapted from Whittle et al. 2009) and (C) for an ecological cross-stress memory (adapted from Kreyling et al. 2012b). Plants were either unstressed (light gray bars) or subjected to drought stress (A, C) or heat stress (B) (dark gray bars; pretreatment indicated on the y-axis) and performance was measured under subsequent drought (A), heat (B) or frost (C) stress (as indicated by inserts) in the same plants (A, C) or in the F 3 generation (B). Different letters indicate significant differences between plants with and without pre-stress according to the sources
Cuk et al. (2010) showed that modified activity of antioxidative enzymes (catalase,
ascorbate peroxidase), which are often also upregulated under drought, is inherited to the next
generation of A. thaliana. It seems likely that maternal plants inheriting stress tolerance would
reveal an ecological stress memory themselves.
To sum up, there is evidence that certain physiological processes in plants are
modified by former stress events. These modifications can be decisive in face of repeated
events and may stimulate a faster start of protective mechanisms and increased stress
tolerance and compensation. However, studies investigating this topic are rare and more
studies investigating drought memory in different species and also under more natural
conditions and studies comparing the response to recurrent drought manipulations to the
response to single drought manipulations are needed in the future.
50Se
ednu
mbe
rper
pla
nt
P an
d F1
23 °
CP
and
F1 3
0 °C
F3: heat
500
1500
a
b
(B)Li
ving
biom
ass
[%]
0
10
20
30
40
50
60
70
a
b
droughtNo
pre
vious
drou
ght
Prev
ious dr
ough
t
(A)
a
b
No p
revio
usdr
ough
tPr
eviou
s drou
ght
frost
Col
d ha
rdin
ess
[LT5
0 °C
]
-40
0
-10
-20
-30
(C)
50Se
ednu
mbe
rper
pla
nt
P an
d F1
23 °
CP
and
F1 3
0 °C
F3: heat
500
1500
a
b
(B)
50Se
ednu
mbe
rper
pla
nt
P an
d F1
23 °
CP
and
F1 3
0 °C
F3: heat
500
1500
a
b
(B)Li
ving
biom
ass
[%]
0
10
20
30
40
50
60
70
a
b
droughtNo
pre
vious
drou
ght
Prev
ious dr
ough
t
(A)Li
ving
biom
ass
[%]
0
10
20
30
40
50
60
70
a
b
droughtNo
pre
vious
drou
ght
Prev
ious dr
ough
t
(A)
a
b
No p
revio
usdr
ough
tPr
eviou
s drou
ght
frost
Col
d ha
rdin
ess
[LT5
0 °C
]
-40
0
-10
-20
-30
(C)
a
b
No p
revio
usdr
ough
tPr
eviou
s drou
ght
frost
Col
d ha
rdin
ess
[LT5
0 °C
]
-40
0
-10
-20
-30
a
b
No p
revio
usdr
ough
tPr
eviou
s drou
ght
frost
Col
d ha
rdin
ess
[LT5
0 °C
]
-40
0
-10
-20
-30
(C)
Manuscript 3: Ecological stress memory and cross stress tolerance in plants in the face of climate extremes
97
4. Frost tolerance and frost memory
In regions where subzero temperatures are reached, perennial plants show the potential
to acclimate to frost to reduce frost damage, caused by intracellular ice crystals and
dehydration. As apoplastic ice formation leads to cell dehydration, drought acclimation and
frost acclimation often involve the same mechanisms, like accumulation of soluble sugars or
transcription of dehydrins and LEA-genes (Lambers et al., 2008; Janska et al., 2010). Frost
acclimation is triggered by low temperature and by changes in the photoperiod (Thomashow,
1999; Janska et al., 2010). Hardening usually takes several weeks, while dehardening, i.e. the
loss of frost hardiness, can occur within hours after temperature increase (Rapacz et al.,
2000), leaving the plants vulnerable to short-term late frost events during the growing season
or after winter warming events.
The frequency of frost days and nights is expected to decrease in various biomes
under global climate warming (IPCC 2007), yet, an increase in minimum temperature over
winter is unlikely (Kodra et al., 2011). Observed and projected reduction in snow cover,
which acts as insulation for many plants, in combination with more variable air temperatures
may further exacerbate the frequency of frost stress in many northern regions (Kreyling,
2010). As global warming may regionally lead to an earlier dehardening and onset of the
growing season, the risk of late frost damage is likely to increase, when the timing of late
frost events is not changing (Rigby and Porporato, 2008;Woldendorp et al., 2008).
Furthermore, global warming might lead to more frequent freeze-thaw cycles during winter,
possibly associated with (partial) dehardening after especially warm winter days, leading to
frost damage at further sub-zero temperatures (Bokhorst et al., 2009).
It is well established that plants are able to “remember“ low temperatures over a
certain time span, as vernalization, the promotion of spring flowering favored by low
temperatures requires some sort of winter-memory (Sung and Amasino, 2005). Here, we
argue that cold tolerance acclimation is no ecological stress memory itself, as the plants
harden under low temperatures but without experiencing frost stress. Cold acclimation rather
is an evolutionary response to avoid frost stress. Experience of frost stress, for example during
freeze-thaw cycles or under late frost events, could enable the plant to react differently to the
next frost spell, even without prior acclimation.
Tahkokorpi et al. (2007) found increased anthocyanin levels in spring in newly grown
stems of Vaccinium myrtillus after plants had been subjected to frost stress in winter,
Manuscript 3: Ecological stress memory and cross stress tolerance in plants in the face of climate extremes
98
compared to plants not experiencing frost stress before. This strongly indicates an ecological
frost stress memory on a whole plant level.
Under laboratory conditions, Knight et al. (1996) found a modified calcium signature
in A. thaliana after plants had experienced a cold shock before. Calcium acts as a second
messenger in low temperature signaling and may therefore trigger altered response to repeated
frost.
However, Polle et al. (1996) showed that spruce needles surviving a spring frost event
revealed less antioxidative enzymes and pigments in the following fall, thus probably
showing reduced frost protection despite a transient increase in antioxidative enzymes after
spring frost was applied. This shows that frost stress may lead to a loss of resilience rather
than to the formation of a “positive” ecological frost memory.
To sum up, few studies hint towards the existence of an ecological frost stress memory
(Tahkokorpi et al. 2007; Knight et al. 1996), although the response to repeated frost stress has
not yet been investigated. It remains to be elucidated if frost stress experience helps to survive
subsequent frost stress, as one study also indicates a decrease in frost resistance after frost
stress (Polle et al. 1996).
5. Heat stress tolerance and heat stress memory
On a cell-level, heat stress acclimation is rather well understood: Upon exposure to
extremely high temperatures, expression of normal housekeeping genes is stopped and heat
shock proteins (HSP), which act to prevent protein damage or photo-oxidation and which
repair already denaturated proteins (chaperones) are increasingly synthesized (Parcellier et al.,
2003; Baniwal et al., 2004; Kotak et al., 2007). Furthermore, compatible solutes like prolin or
betaine act to stabilize proteins (Schulze et al., 2005).
Under global warming it is very likely that heat waves will increase in frequency and
magnitude over most land areas, as indicated, e.g., by the European mega-heatwaves in 2003
and 2010 (Schär et al., 2004; Barriopedro et al., 2011; IPCC 2011). Yet, studies investigating
an ecological heat stress memory are widely lacking in plant ecology.
Interestingly, a transgenerational ecological stress memory was found for mild heat
stress: Plants from the F3 generation showed a heat-specific fitness improvement when the
parental and F1 generation had been treated with mild heat (30°C), even when the F2
generation was grown under normal conditions (Whittle et al., 2009) (Fig. 2B). As for all
Manuscript 3: Ecological stress memory and cross stress tolerance in plants in the face of climate extremes
99
transgenerational studies, the existence of ecological stress memory within one plant
generation was not tested, but is implied by the inheritance of stress tolerance.
To conclude, we found no study investigating an ecological heat stress memory in
single plants. Nevertheless, the results by Whittle et al. (2009) indicate the existence of a heat
stress memory improving heat tolerance after heat stress was already experienced in the past.
6. Cross-stress memory
As frost, heat and drought stress all involve cell dehydration, acclimation mechanisms
are partly the same (Beck et al., 2007). It is thus possible that acclimation and formation of a
stress memory to one kind of stress also prevents damage by other stressors, providing cross-
stress memory and tolerance. For instance, frost tolerance of local populations or ecotypes,
respectively, is related to drought tolerance (Blodner et al., 2005).
More specifically, exposure to an extreme drought event in the preceding year was
found to support late frost tolerance in grass species (Kreyling et al., 2012a) and maximum
frost hardiness in juvenile Pinus nigra (Kreyling et al., 2012b) (Fig. 2C).
Another form of cross-stress tolerance is increased herbivore resistance after the
experience of abiotic stress like drought, caused by an increase in C-based secondary
metabolites upon growth restriction due to abiotic stress (Herms and Mattson, 1992). It is
unclear yet, how long such modifications of secondary compounds are maintained. However,
Agrawal (2002) showed that the progeny of maternal plants attacked by herbivores also
revealed higher induced resistance towards herbivores. This implies heritability and thus a
form of stress memory of induced defense, although it is unclear if this could also act to
prevent drought, heat or frost damage.
7. Possible mechanisms behind an ecological stress memory
As possible mechanisms for an ecological stress memory, Bruce et al. (2007) suggest
the accumulation of transcription factors or proteins to facilitate a fast response upon repeated
stress exposure as well as epigenetic mechanisms, such as histone modifications or chemical
changes at the DNA (methylation, acetylation) that are inherited through mitotic or even
meiotic cell divisions (Bossdorf et al., 2008; Chinnusamy et al., 2008; Boyko and Kovalchuk,
2011). Another possibility is the accumulation of protective substances. However, this is not
likely to be very important, as synthesis of protective substances is costly and often prevents
Manuscript 3: Ecological stress memory and cross stress tolerance in plants in the face of climate extremes
100
normal growth (Herms and Mattson, 1992). Today, it is well established that plant stress
induces epigenetic changes (Goh et al., 2003; Chinnusamy et al., 2008). It was shown that
epigenetic changes upon UV-C and flagellin exposure (Molinier et al., 2006), upon TMV
(tobacco-mosaic-virus)-exposure (Boyko et al., 2007), upon pathogen or herbivore attack or
low nutrients (Verhoeven et al., 2010) and upon nitrogen deficiency (Kou et al., 2011) are
inherited. Furthermore, inherited DNA-hypomethylation in rice seedlings increased pathogen
resistance (Akimoto et al., 2007) and inherited epigenetic changes upon TMV exposure
increased pathogen resistance in progenies (Kathiria et al., 2010) However, no general
heritability of epigenetic changes upon stress exposure was found in A. thaliana, implying
that transgenerational epigenetic memory seems to be restricted to special conditions (Pecinka
et al., 2009). The results of Tahkokorpi et al. (2007) hint towards epigenetic changes as
underlying mechanisms of an ecological frost memory, as the new stems growing in spring
never experienced frost stress themselves but revealed modifications (see Section 4). Thus,
information had to be conveyed through mitotic divisions.
A further possibility to retain an ecological stress memory are changes in phenology or
morphology of the plant that remain stable over longer time scales than mere changes in the
accumulation of protective substances. Shifts in root to shoot ratio in response to drought
(Kalapos et al., 1996; Kahmen et al., 2005) or winter warming pulses (Kreyling et al., 2008)
are one obvious morphological response with implications for future drought tolerance.
Furthermore, specific leaf area can be adapted to drought conditions (Kalapos et al., 1996),
thereby reducing water loss of this tissue also for future drought events (see Table 1 for
examples of mechanisms of an ecological stress memory).
8. Research challenges
Studies investigating ecological stress memory are rare. Most studies on the duration
and heritability of plant stress are conducted on a cellular level and focus on genetic or
epigenetic aspects. In such studies, time spans between the initial and the repeated stress is
usually restricted to only several hours to days (Bruce et al., 2007). More ecologically
relevant research and assessments of stress tolerance and ecological stress memory are
needed. Furthermore, multigenerational epigenetic studies should consider consequences of
extreme weather events more prominently.
In order to evaluate the ecological relevance of ecological stress memory, assessing
ecologically meaningful parameters at the plant level in controlled lab experiments needs to
Manuscript 3: Ecological stress memory and cross stress tolerance in plants in the face of climate extremes
101
be accompanied by field experiments and observations after naturally occurring extremes.
Here, long-term field- and monitoring studies investigating the response to naturally occurring
extremes in natural plant communities might be very valuable. To simultaneously elucidate
underlying processes and mechanisms, cooperation between ecologists and molecular
biologists are urgently needed. For instance, it is still unclear whether unseasonable frost
damage in spring influences acclimation in the following fall and if this might be detrimental
or beneficial.
In particular the absolute degree and the temporal stability of ecological stress memory
requires attention because ecological stress memory could play an important role in
stabilizing ecological communities in the face of more frequent extreme climatic events. Here,
we suggest that ecological stress memory can, at least partly, explain the surprisingly weak
effects of repeated extreme drought events on the productivity of grassland communities
(Jentsch et al. 2011). Heritability of beneficial stress memory to following generations,
potentially by epigenetic processes, is another highly relevant aspect for our understanding of
ecological response to more frequent extreme climatic events.
To conclude, there are evidences for the existence of an ecological stress memory.
However, mechanisms and consequences are not yet well investigated. A stress memory of
single plants might act to stabilize plant communities under frequent climatic extremes and
might increase resilience. It might be even possible to mitigate detrimental effects of extreme
events by artificially applying milder stress on a small scale, e.g. for agriculture. However, it
is not yet clear if, on a field and landscape scale, lagged detrimental effects might lead to a
reduction of resilience under repeated extreme weather events that outweigh possible positive
effects of an ecological stress memory. Furthermore, increased acclimation towards recurring
stressors might reduce mortality of plants, but might as well reduce agricultural yield if plants
reduce their photosynthetic activity to prevent damage. Hopefully, future research will
contribute to elucidate mechanisms and consequences of an ecological stress memory.
Acknowledgements: We thank two anonymous reviewers for valuable hints and comments
to clarify our concepts and improve our manuscript.
References: Agrawal, A.A., 2002. Herbivory and maternal effects: mechanisms and consequences of transgenerational
induced plant resistance. Ecology 83, 3408–3415. Akimoto, K., Katakami, H., Kim, H.-J., Ogawa, E., Sano, C.M., Wada, Y., Sano, H., 2007. Epigenetic
inheritance in rice plants. Annals of Botany 100, 205–217.
Manuscript 3: Ecological stress memory and cross stress tolerance in plants in the face of climate extremes
102
Allen, C.D., Breshears, D.D., 1998. Drought-induced shift of a forest-woodland ecotone: Rapid landscape response to climate variation. Proceedings of the National Academy of Sciences of the United States of America 95, 14839–14842.
Baniwal, S.K., Bharti, K., Chan, K.Y., Fauth, M., Ganguli, A., Kotak, S., Mishra, S.K., Nover, L., Port, M., Scharf, K.D., Tripp, J., Weber, C., Zielinski, D., Koskull-Doring, P. von, 2004. Heat stress response in plants: a complex game with chaperones and more than twenty heat stress transcription factors. Journal of Biosciences 29, 471–487.
Barriopedro, D., Fischer, E.M., Luterbacher, J., Trigo, R., Garcia-Herrera, R., 2011. The hot summer of 2010: redrawing the temperature record map of Europe. Science 332, 220–224.
Beck, E.H., Fettig, S., Knake, C., Hartig, K., Bhattarai, T., 2007. Specific and unspecific responses of plants to cold and drought stress. Journal of Biosciences 32, 501–510.
Bengtsson, J., Angelstam, P., Elmqvist, T., Emanuelsson, U., Folke, C., Ihse, M., Moberg, F., Nystrom, M., 2003. Reserves, resilience and dynamic landscapes. Ambio 32, 389–396.
Bigler, C., Gavin, D.G., Gunning, C., Veblen, T.T., 2007. Drought induces lagged tree mortality in a subalpine forest in the Rocky Mountains. Oikos 116, 1983–1994.
Blodner, C., Skroppa, T., Johnsen, O., Polle, A., 2005. Freezing tolerance in two Norway spruce (Picea abies [L.] Karst.) progenies is physiologically correlated with drought tolerance. Journal of Plant Physiology 162, 549–558.
Bohnert, H.J., 2000. What makes desiccation tolerable? Genome Biology 1, 1–4. Bokhorst, S.F., Bjerke, J.W., Tommervik, H., Callaghan, T.V., Phoenix, G.K., 2009. Winter warming events
damage sub-Arctic vegetation: consistent evidence from an experimental manipulation and a natural event. Journal of Ecology 97, 1408–1415.
Bossdorf, O., Richards, C.L., Pigliucci, M., 2008. Epigenetics for ecologists. Ecology Letters 11, 106–115. Boyko, A., Kovalchuk, I., 2011. Genome instability and epigenetic modification-heritable responses to
environmental stress? Current Opinion in Plant Biology 14, 260–266. Boyko, A., Kathiria, P., Zemp, F.J., Yao, Y., Pogribny, I., Kovalchuk, I., 2007. Transgenerational changes in the
genome stability and methylation in pathogen-infected plants (virus-induced plant genome instability). Nucleic Acids Research 35, 1714–1725.
Bruce, T.J.A., Matthes, M.C., Napier, J.A., Pickett, J.A., 2007. Stressful "memories" of plants: evidence and possible mechanisms. Plant Science 173, 603–608.
Chinnusamy, V., Gong, Z., Zhu, J.-K., 2008. Abscisic acid-mediated epigenetic processes in plant development and stress responses. Journal of Integrative Plant Biology 50, 1187–1195.
Cuk, K., Gogala, M., Tkalec, M., Vidakovic-Cifrek, Z., 2010. Transgenerational stress memory in Arabidopsis thaliana(L.)Heynh.: antioxidative enzymes and HSP70. Acta Botanica Croatica 69, 183–197.
Easterling. D.R., Meehl, G.A., Parmesan, C., Changnon, S.A., Karl, T.R., Mearns, L.O., 2000. Climate extremes: observations, modeling, and impacts. Science 289, 2068–2074.
Fay, P.A., Carlisle, J.D., Knapp, A.K., Blair, J.M., Collins, S.L., 2000. Altering rainfall timing and quantity in a mesic grassland ecosystem: Design and performance of rainfall manipulation shelters. Ecosystems 3, 308–319.
Goh, C.H., Nam, H.G., Park, Y.S., 2003. Stress memory in plants: a negative regulation of stomatal response and transient induction of rd22 gene to light in abscisic acid-entrained Arabidopsis plants. Plant Journal 36, 240–255.
Golinski, M., Bauch, C., Arland, M., 2008. The effects of endogenous ecological memory on population stability and resilience in a variable environment. Ecological Modelling 212, 334–341.
Hegerl, G.C., Hanlon, H., Beierkuhnlein, C., 2011. Elusive extremes. Nature Geoscience 4, 142-143. Herms, D.A., Mattson W. J., 1992. The dilemma of plants - to grow or to defend. Quarterly Review of Biology
67, 283–335. IPCC, 2007. Climate change 2007: The Physical Science Basis. Contribution of Working Group I to the fourth
assessment report for the intergovernmental panel on climate change. Cambridge University Press, Cambridge & New York.
IPCC, 2011. IPCC Special Report on Managing the Risks of Extreme Events and Disasters to Advance Climate Change Adaptation. Facts Sheet. http://www.ipcc.ch/news_and_events/docs/srex/SREX_fact_sheet.pdf (last accessed November 28th, 2011).
Janska, A., Marsik, P., Zelenkova, S., Ovesna, J., 2010. Cold stress and acclimation-what is important for metabolic adjustment? Plant Biology 12, 395–405.
Jentsch, A., Kreyling, J., Beierkuhnlein, C., 2007. A new generation of climate-change experiments: events, not trends. Frontiers in Ecology and the Environment 5, 365–374.
Jentsch, A., Kreyling, J., Elmer, M., Gellesch, E., Glaser, B., Grant, K., Hein, R., Lara, M., Mirzae, H., Nadler, S., Nagy, L., Otieno, D., Pritsch, K., Rascher, U., Schädler, M., Schloter, M., Singh, B., Stadler, J., Walter, J., Wellstein, C., Wöllecke, J., Beierkuhnlein, C., 2011. Climate extremes initiate ecosystem-regulating functions while maintaining productivity. Journal of Ecology 99, 689–702.
Manuscript 3: Ecological stress memory and cross stress tolerance in plants in the face of climate extremes
103
Kahmen, A., Perner, J., Buchmann, N., 2005. Diversity-dependent productivity in semi-natural grasslands following climate perturbations. Functional Ecology 19, 594–601.
Kalapos, T., van den Boogaard, R., Lambers, H., 1996. Effect of soil drying on growth, biomass allocation and leaf gas exchange of two annual grass species. Plant and Soil 185, 137–149.
Kathiria, P., Sidler, C., Golubov, A., Kalischuk, M., Kawchuk, L.M., Kovalchuk, I., 2010. Tobacco Mosaic Virus infection results in an increase in recombination frequency and resistance to viral, bacterial, and fungal pathogens in the progeny of infected tobacco plants. Plant Physiology 153, 1859–1870.
Knight, H., Trewavas, A.J., Knight, M.R., 1996. Cold calcium signalling in Arabidopsis involves two cellular pools and a change in calcium signature after acclimation. Plant Cell 8, 489–503.
Knight, H., Brandt, S., Knight, M.R.,1998. A history of stress alters drought calcium signalling pathways in Arabidopsis. Plant Journal 16, 681–687.
Kodra, E., Steinhaeuser, K., Ganguly, A.R., 2011. Persisting cold extremes under 21st-century warming scenarios. Geophysical Research Letters 38, L08705.
Kotak, S., Larkindale, J., Lee, U., Koskull-Doering, P. von, Vierling, E., Scharf, K.-D., 2007. Complexity of the heat stress response in plants. Current Opinion in Plant Biology 10, 310–316.
Kou, H.P., Li, Y., Song, X.X., Ou, X.F., Xing, S.C., Ma, J., von Wettstein, D., Liu, B., 2011. Heritable alteration in DNA methylation induced by nitrogen-deficiency stress accompanies enhanced tolerance by progenies to the stress in rice (Oryza sativa L.). Journal of Plant Physiology 168, 1685–1693.
Kreyling, J., 2010. Winter climate change: a critical factor for temperate vegetation performance. Ecology 91, 1939–1948.
Kreyling, J., Beierkuhnlein, C., Pritsch, K., Schloter, M., Jentsch, A., 2008. Recurrent soil freeze-thaw cycles enhance grassland productivity. New Phytologist 177, 938–945.
Kreyling, J., Beierkuhnlein, C., Jentsch, A., 2010. Effects of soil freeze-thaw cycles differ between experimental plant communities. Basic and Applied Ecology 11, 65–75.
Kreyling, J., Thiel, D., Simmnacher, K., Willner, E., Jentsch, A., Beierkuhnlein, C., 2012a. Ecotypic differentiation and past climatic experience influence the response to late spring frost in four common grass species of Central Europe. Ecography 35, 268-275.
Kreyling, J., Wiesenberg, G., Thiel, D., Wohlfahrt, C., Huber, G., Walter, J., Jentsch, A., Konnert, M., Beierkuhnlein, C. 2012b. Cold hardiness of Pinus nigra Arnold as influenced by geographic origin, warming, and extreme summer drought. Environmental and Experimental Botany 78, 99-108.
Lambers, H., Chapin III, F.S., Pons, T.L., 2008. Plant Physiological Ecology, 2nd ed. Springer, New York.
Lloret, F., Siscart, D., Dalmases, C., 2004. Canopy recovery after drought dieback in holm-oak Mediterranean forests of Catalonia (NE Spain). Global Change Biology 10, 2092–2099.
Lloret, F., Escudero, A., Iriondi, J.M., Martínez-Vilalta, J., Valladares F., 2011. Extreme climatic events and vegetation: the role of stabilizing processes. Global Change Biology, DOI: 10.1111/j.1365-2486.2011.02624.x
Lopez, B.C., Gracia, C.A., Sabate, S., Keenan, T., 2009. Assessing the resilience of Mediterranean holm oaks to disturbances using selective thinning. Acta Oecologica 35, 849–854.
Min, S.-K., Zhang, X., Zwiers, F.W., Hegerl, G.C., 2011. Human contribution to more-intense precipitation extremes. Nature 470, 378–381.
Molinier, J., Ries, G., Zipfel, C., Hohn, B., 2006. Transgeneration memory of stress in plants. Nature 442, 1046–1049.
Mueller, R.C., Scudder, C.M., Porter, M.E., Trotter, R.T., Gehring, C.A., Whitham, T.G., 2005. Differential tree mortality in response to severe drought: evidence for long-term vegetation shifts. Journal of Ecology 93, 1085–1093.
Munne-Bosch, S., Alegre, L., 2000. Changes in carotenoids, tocopherols and diterpenes during drought and recovery, and the biological significance of chlorophyll loss in Rosmarinus officinalis plants. Planta 210, 925–931.
Newman, G.S., Arthur, M.A., Muller, R.N., 2006. Above- and belowground net primary production in a temperate mixed deciduous forest. Ecosystems 9, 317–329.
Nystrom, M., Folke, C., 2001. Spatial resilience of coral reefs. Ecosystems 4, 406–417. Onate, M., Blanc, J., Munne-Bosch, S., 2011. Influence of stress history on the response of the dioecious plant
Urtica dioica L. to abiotic stress. Plant Ecology and Diversity 4, 45–54. Padisak, J., 1992. Seasonal Succession of Phytoplankton in a large shallow lake (Balaton, Hungary)-a dynamic
approach to ecological memory, its possible role and mechanisms. Journal of Ecology 80, 217–230. Parcellier, A., Gurbuxani, S., Schmitt, E., Solary, E., Garrido, C., 2003. Heat shock proteins, cellular chaperones
that modulate mitochondrial cell death pathways. Biochemical and Biophysical Research Communications 304, 505–512.
Manuscript 3: Ecological stress memory and cross stress tolerance in plants in the face of climate extremes
104
Pecinka, A., Rosa, M., Schikora, A., Berlinger, M., Hirt, H., Luschnig, C., Scheid, O.M., 2009. Transgenerational stress memory is not a general response in Arabidopsis. PLoS One 4. e5202. doi:10.1371/journal.pone.0005202
Polle, A., Kroniger, W., Rennenberg, H., 1996. Seasonal fluctuations of ascorbate-related enzymes: Acute and delayed effects of late frost in spring on antioxidative systems in needles of Norway spruce (Picea abies L). Plant and Cell Physiology 37, 717–725.
Rapacz, M., Plazek, A., Niemczyk, E., 2000. Frost de-acclimation of barley (Hordeum vulgare L.) and meadow fescue (Festuca pratensis Huds.). Relationship between soluble carbohydrate content and resistance to frost and the fungal pathogen Bipolaris sorokiniana (Sacc.) Shoem. Annals of Botany 86, 539–545.
Rensing, L., Koch, M., Becker, A., 2009. A comparative approach to the principal mechanisms of different memory systems. Naturwissenschaften 96, 1373–1384.
Rigby, J.R., Porporato, A., 2008. Spring frost risk in a changing climate. Geophysical Research Letters 35, L12703.
Schaefer, V., 2009. Alien invasions, ecological restoration in cities and the loss of ecological memory. Restoration Ecology 17, 171–176.
Schar, C., Vidale, P.L., Luthi, D., Frei, C., Haberli, C., Liniger, M.A., Appenzeller, C., 2004. The role of increasing temperature variability in European summer heatwaves. Nature 427, 332–336.
Schulze, E.D., Beck, E., Müller-Hohenstein, K., 2005. Plant Ecology. Springer, Berlin, London. Smith, M.D., 2011. An ecological perspective on extreme climatic events: A synthetic definition and framework
to guide future research. Journal of Ecology 99, 656–663. Sun, Z.Y., 2011. Ecological memory and its potential applications in ecology: A review. Chinese Journal of
Applied Ecology 22 (3), 549–555. Sung, S., Amasino, R.M., 2005. Remembering winter: toward a molecular understanding of vernalization.
Annual Review of Plant Biology 56, 491–508. Tahkokorpi, M., Taulavuori, K., Laine, K., Taulavuori, E., 2007. After-effects of drought-related winter stress in
previous and current year stems of Vaccinium myrtillus L. Environmental and Experimental Botany 61, 85–93.
Thomashow, M., 1999. Plant cold acclimation: freezing tolerance genes and regulatory mechanisms. Annual Reviews in Plant Physiology and Plant Molecular Biolology 50, 571–599.
Thompson, J.N., Reichman, O.J., Morin, P.J., Polis, G.A., Power, M.E., Sterner, R.W., Couch, C.A., Gough, L., Holt, R., Du Hooper, Keesing, F., Lovell, C.R., Milne, B.T., Molles, M.C., Roberts, D.W., Strauss, S.Y., 2001. Frontiers of ecology. Bioscience 51, 15–24.
Verhoeven, K.J.F., Jansen, J.J., van Dijk, P.J., Biere, A., 2010. Stress-induced DNA methylation changes and their heritability in asexual dandelions. New Phytologist 185, 1108–1118.
Walter, J., Hein, R., Auge, H., Beierkuhnlein, C., Löffler, S., Reifenrath, K., Schädler, M., Weber, M., Jentsch, A. (2012) How do extreme drought and plant community composition affect host plant metabolites and herbivore performance? Arthropod-Plant Interactions 6, 15-25.
Walter, J., Nagy, L., Hein, R., Rascher, U., Beierkuhnlein, C., Willner, E., Jentsch, A., 2011. Do plants remember drought? Hints towards a drought-memory in grasses. Environmental and Experimental Botany 71, 34–40.
Whittle, C.A., Otto, S.P., Johnston, M.O., Krochko, J.E., 2009. Adaptive epigenetic memory of ancestral temperature regime in Arabidopsis thaliana. Botany-Botanique 87, 650–657.
Woldendorp, G., Hill, M.J., Doran, R., Ball, M.C., 2008. Frost in a future climate: modelling interactive effects of warmer temperatures and rising atmospheric [CO2] on the incidence and severity of frost damage in a temperate evergreen (Eucalyptus pauciflora). Global Change Biology 14, 294–308.
Manuscript 4: Do plants remember drought? Hints towards a drought memory in grasses
105
Manuscript 4: Do plants remember drought? Hints towards a drought-
memory in grasses Environmental and Experimental Botany, 2011, 71: 34–40.
Julia Waltera, Laura Nagyb,g, Roman Heinb,g , Uwe Rascherc, Carl Beierkuhnleinb , Evelin
Willnerd, Anke Jentschg
aConservation Biology, Helmholtz Centre for Environmental Research- UFZ, Permoserstraße 15, 04318 Leipzig,
Germany bChair of Biogeography, Bayreuth University, 95440 Bayreuth, Germany cInstitute of Chemistry and Dynamics of the Geosphere (ICG), Phytosphere (ICG-3), Forschungszentrum Jülich
GmbH, 52425 Jülich, Germany dLeibniz Institute of Plant Genetics and Crop Plant Research (IPK), Genebank, Satellite Collections North, D-
23999 Malchow/Poel, Germany gGeoecology / Physical Geography, Institute for Environmental Science, University of Koblenz-Landau,
Forststraße 7, 76829 Landau, Germany
Corresponding author: Julia Walter, phone: +49-341-235-1654, fax: +49-341-235-1470,
email: [email protected]
Abbreviations
Fm: maximum fluorescence yield of the dark adapted leaf
F0: steady state fluorescence yield of the dark adapted leaf
Fv: variable fluorescence yield of the dark adapted leaf
Fv/Fm: potential maximum quantum yield of photosystem II
Pn [µmol CO2 m-2s-1]: Net photosynthesis
PPFD [µmol m-2s-1]: photosynthetically active photon flux density
RWC [%]: Relative leaf water content
Highlights 1. Grasses react differently to recurrent drought when compared to a single drought.
2. Results indicate improved photoprotection of recurrently droughted plants.
3. “Stress imprints” after stress preexposure can lead to improved performance under
recurrent stress exposure.
4. Differences in reaction to a recurrent drought are obtained after several weeks and harvest.
Manuscript 4: Do plants remember drought? Hints towards a drought memory in grasses
106
Abstract
The frequency of extreme drought events is projected to increase under global climate
change, causing damage to plants and crop yield despite potential acclimation. We
investigated whether grasses remain acclimated to drought even after a harvest and remember
early summer drought exposure over a whole vegetation period. For this, we compared the
response of Arrhenatherum elatius plants under a second, late, drought (they were pre-
exposed to an early drought before), to plants exposed to a single, only late, extreme drought.
Surprisingly, the percentage of living biomass after a late drought increased for plants that
were exposed to drought earlier in the growing season compared to single-stressed plants,
even after harvest and resprouting after the first drought. Relative leaf water content did not
differ between the two treatments. Net photosynthesis was non-significantly reduced by 25%
in recurrent drought treatment. Maximum quantum efficiency (Fv/Fm) and maximum
fluorescence (Fm) were reduced in plants that were exposed to recurrent drought. These
findings indicated improved photoprotection in double-stressed plants. Our results provide
first hints towards a “drought memory” over an entire vegetation period, even after harvest
and resprouting. However, the advantage of improved photoprotection might also cause
reductions in photosynthesis that could have adverse effects on crop yield under more severe
or longer droughts.
Keywords: recurrent drought stress, climate warming, memory-effect, water deficit,
Chlorophyll a fluorescence, phenotypic plasticity
1. Introduction
Droughts are often regarded as major threats to ecosystems under global climate
change, as water stress limits crop yield more than all other biotic and abiotic factors
combined (Lambers et al., 2008). The frequency and magnitude of regional drought periods
have been increasing since the 1970s, with an exacerbation of the situation projected for many
parts of the world (Schar et al., 2004; Trenberth et al., 2003). In Europe, the Mediterranean
and mid-continental regions are expected to experience increased drought periods,
accompanied by heat waves, as witnessed during the summer drought of 2003 (Schar et al.,
2004).
Manuscript 4: Do plants remember drought? Hints towards a drought memory in grasses
107
Recent studies have investigated the impact of single drought events on ecosystems
(Noormets et al., 2008), plant communities (van Peer et al., 2004; Kreyling et al., 2008) or
single species (Galle et al., 2007; Jentsch et al., 2009). However, the consequences of
recurrent drought events when compared to a single drought event on stress response and
post-stress recovery are still not well understood.
Theory predicts that abiotic stress reduces resilience of ecosystems as a response to a
single stress event, resulting in deteriorated performance and a total loss of resilience, when
the system is affected by recurrent stressful events (Scheffer et al., 2001). On the other hand,
plants are able to acclimate when faced with abiotic stress (Lambers et al., 2008; Bruce et al.,
2007), revealing phenotypic plasticity as a response to environmental variability (Aubin-
Horth and Renn, 2009). Short-term drought acclimation includes modifications to pigment
content and the xanthophyll cycle (enhanced non-photochemical quenching) in order to
prevent photodamage (Munne-Bosch and Alegre, 2000; Jiang et al., 2005). Phenotypic
plasticity can cause a “stress imprint” that might facilitate a fast and protective response to a
recurrent stressful event. Bruce et al. (2007) mention epigenetic changes and accumulation of
signalling proteins or transcription factors as mechanisms for such a “memory effect”.
Persistent changes in gene expression have been documented following a stressful event
(Aubin-Horth and Renn, 2009). Epigenetic modifications can be inherited through mitosis or
even meiosis (Goh et al., 2003; Bird, 2007; Bruce et al., 2007; Verhoeven et al., 2010). Up to
now, experiments investigating these stress imprints have been mostly restricted to small time
spans of less than one week (Bruce et al., 2007). Furthermore, studies investigating plant
performance and functional consequences, and not only underlying molecular mechanisms in
response to recurrent stress are rather rare. In woody communities, drought was found to
reduce resilience, rendering plants more vulnerable to a recurrent disturbance (Lloret et al.,
2004; Mueller et al., 2005). In grassland communities, mild droughts and warming did not
lead to an enhanced resistance or recovery to an extreme follow-up drought but rather to a
larger decrease in green vegetation cover in communities experiencing recurrent drought
(Zavalloni et al., 2008). It has also been shown that plants can reveal memory effects after
frost events, leading to a deteriorated performance long after frost stress was applied (Polle et
al. 1996; Tahkokorpi et al. 2007; Kreyling et al. 2010).
The objective of our study was to identify differences in the effects of recurrent
drought compared to a single drought on plant productivity and the photosynthetic
performance of potted individuals of Arrhenatherum elatius (L.). A. elatius is a widely
distributed and agriculturally important European perennial grass. It occurs mainly in moist,
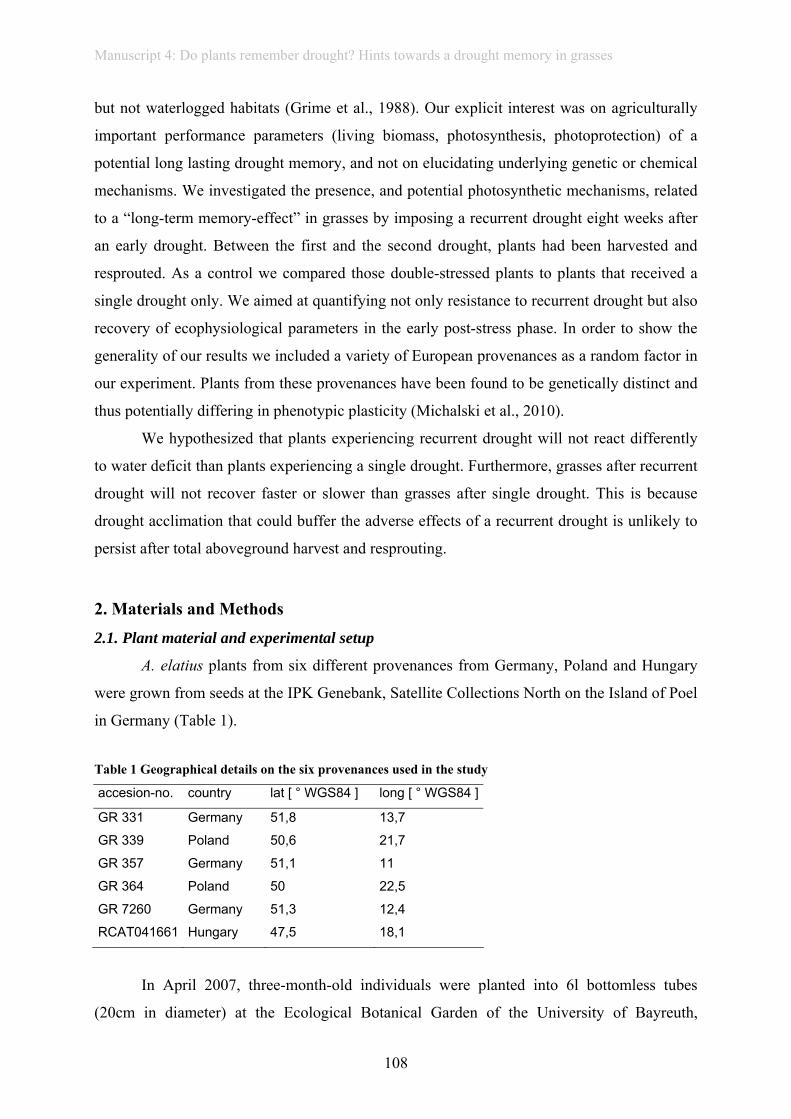
Manuscript 4: Do plants remember drought? Hints towards a drought memory in grasses
108
but not waterlogged habitats (Grime et al., 1988). Our explicit interest was on agriculturally
important performance parameters (living biomass, photosynthesis, photoprotection) of a
potential long lasting drought memory, and not on elucidating underlying genetic or chemical
mechanisms. We investigated the presence, and potential photosynthetic mechanisms, related
to a “long-term memory-effect” in grasses by imposing a recurrent drought eight weeks after
an early drought. Between the first and the second drought, plants had been harvested and
resprouted. As a control we compared those double-stressed plants to plants that received a
single drought only. We aimed at quantifying not only resistance to recurrent drought but also
recovery of ecophysiological parameters in the early post-stress phase. In order to show the
generality of our results we included a variety of European provenances as a random factor in
our experiment. Plants from these provenances have been found to be genetically distinct and
thus potentially differing in phenotypic plasticity (Michalski et al., 2010).
We hypothesized that plants experiencing recurrent drought will not react differently
to water deficit than plants experiencing a single drought. Furthermore, grasses after recurrent
drought will not recover faster or slower than grasses after single drought. This is because
drought acclimation that could buffer the adverse effects of a recurrent drought is unlikely to
persist after total aboveground harvest and resprouting.
2. Materials and Methods
2.1. Plant material and experimental setup
A. elatius plants from six different provenances from Germany, Poland and Hungary
were grown from seeds at the IPK Genebank, Satellite Collections North on the Island of Poel
in Germany (Table 1).
Table 1 Geographical details on the six provenances used in the study
accesion-no. country lat [ ° WGS84 ] long [ ° WGS84 ]
GR 331 Germany 51,8 13,7
GR 339 Poland 50,6 21,7
GR 357 Germany 51,1 11
GR 364 Poland 50 22,5
GR 7260 Germany 51,3 12,4
RCAT041661 Hungary 47,5 18,1
In April 2007, three-month-old individuals were planted into 6l bottomless tubes
(20cm in diameter) at the Ecological Botanical Garden of the University of Bayreuth,
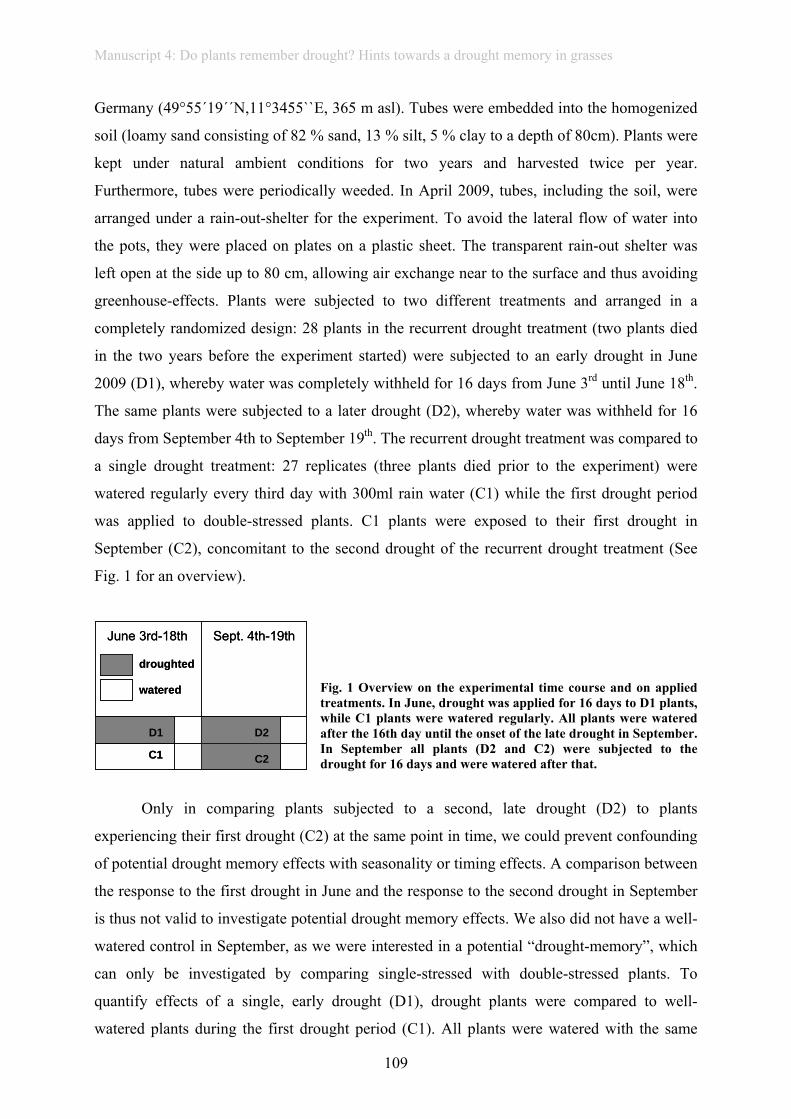
Manuscript 4: Do plants remember drought? Hints towards a drought memory in grasses
109
Germany (49°55´19´´N,11°3455``E, 365 m asl). Tubes were embedded into the homogenized
soil (loamy sand consisting of 82 % sand, 13 % silt, 5 % clay to a depth of 80cm). Plants were
kept under natural ambient conditions for two years and harvested twice per year.
Furthermore, tubes were periodically weeded. In April 2009, tubes, including the soil, were
arranged under a rain-out-shelter for the experiment. To avoid the lateral flow of water into
the pots, they were placed on plates on a plastic sheet. The transparent rain-out shelter was
left open at the side up to 80 cm, allowing air exchange near to the surface and thus avoiding
greenhouse-effects. Plants were subjected to two different treatments and arranged in a
completely randomized design: 28 plants in the recurrent drought treatment (two plants died
in the two years before the experiment started) were subjected to an early drought in June
2009 (D1), whereby water was completely withheld for 16 days from June 3rd until June 18th.
The same plants were subjected to a later drought (D2), whereby water was withheld for 16
days from September 4th to September 19th. The recurrent drought treatment was compared to
a single drought treatment: 27 replicates (three plants died prior to the experiment) were
watered regularly every third day with 300ml rain water (C1) while the first drought period
was applied to double-stressed plants. C1 plants were exposed to their first drought in
September (C2), concomitant to the second drought of the recurrent drought treatment (See
Fig. 1 for an overview).
Fig. 1 Overview on the experimental time course and on applied treatments. In June, drought was applied for 16 days to D1 plants, while C1 plants were watered regularly. All plants were watered after the 16th day until the onset of the late drought in September. In September all plants (D2 and C2) were subjected to the drought for 16 days and were watered after that.
Only in comparing plants subjected to a second, late drought (D2) to plants
experiencing their first drought (C2) at the same point in time, we could prevent confounding
of potential drought memory effects with seasonality or timing effects. A comparison between
the response to the first drought in June and the response to the second drought in September
is thus not valid to investigate potential drought memory effects. We also did not have a well-
watered control in September, as we were interested in a potential “drought-memory”, which
can only be investigated by comparing single-stressed with double-stressed plants. To
quantify effects of a single, early drought (D1), drought plants were compared to well-
watered plants during the first drought period (C1). All plants were watered with the same
June 3rd-18th Sept. 4th-19th
D1
C1
D2
C2
droughted
watered
June 3rd-18th Sept. 4th-19th
D1
C1
D2
C2
droughted
watered
Manuscript 4: Do plants remember drought? Hints towards a drought memory in grasses
110
amount of water (300 ml, every third day) until the onset of the experiment and in between
the two drought treatments.
2.2. Aboveground biomass
Aboveground biomass was harvested on July 5th, 17 days after the first drought (D1
and C1) ended, and on October 9th, 21 days after the second drought ended (D2 and C2). After
this time, reversible drought damages should have been recovered. As we only compare D2
with C2 plants and D1 with C1 plants, the difference of four days in recovery time after
drought does not have an effect on the results. Plants were cut 4 cm above the ground in order
to simulate common management techniques in meadows, sorted into living (green) and dead
biomass. Dead biomass was defined as wilted, brown plant parts that lost chlorophyll.
Biomass was dried at 70° C for 72 hours and weighed. Percentage of dead biomass was
calculated as percentage of oven-dried, dead biomass in relation to overall oven-dried biomass
of individual plants.
2.3. Relative leaf water content (RWC)
Relative leaf water content was determined in the afternoon of the 13th day of the first
and second drought treatment (June 15th and September 16th), according to Barrs and
Weatherley (1962).The second lowest leaf of each plant was cut, stored in a moistened plastic
bag for transport, and immediately weighed to determine fresh weight (FW). Leaves were
stored in distilled water at 4° C over night and weighed the next morning to determine turgid
weight (TW). Afterwards leaves were dried at 70° C and the dry weight (DW) was
determined.
RWC was calculated as:
100*)()((%)
DWTWDWFWRWC
−−
=
2.4. Chlorophyll a fluorescence
Chlorophyll a fluorescence was recorded using a pulse-amplitude-modulated
photosynthesis yield analyzer (PAM 2000 and Mini-PAM) (Waltz, Effeltrich, Germany) with
a leaf clip holder as described by Bilger et al. (1995). The second or third fully-expanded
leaves were measured on four different blades of one individual. Four measurements per plant
were averaged for further analysis. We obtained predawn fluorescence values (between 2:00
and 4:00) at the end of the first drought treatment, throughout the second drought period and
Manuscript 4: Do plants remember drought? Hints towards a drought memory in grasses
111
throughout the early recovery phase after the second drought. The maximum quantum
efficiency of photosystem II was calculated as Fv/Fm. Variable fluorescence (Fv) and
maximum fluorescence (Fm) were measured before dawn. Fv was calculated as Fm-F0, Fm
being the maximum fluorescence of the dark adapted leaf after applying a saturating light
pulse and F0 being the steady state fluorescence yield of the dark adapted leaf (Maxwell and
Johnson, 2000).
To enable a comparison between absolute fluorescence values, a fluorescence standard
material was measured before and after each measuring cycle. Standard measurements were
used to normalize the fluorescence values obtained and to calibrate the two different PAMs in
use. Predawn measurements of fluorescence at the dark adapted leaf allow drawing
conclusions about underlying processes which alter plant photosynthetic performance and
about photoinhibitory damage and non-photochemical quenching (Maxwell and Johnson,
2000). Absolute F0 and Fm values were taken to separate the effects of photodamage,
becoming apparent with an increase of F0, from the effects of photoprotection related to
enhanced non-photochemical quenching, becoming apparent with a decrease in Fm (Osmond
et al., 1993; Araus et al., 1998; Maxwell and Johnson, 2000).
2.5. Leaf gas exchange
The net CO2 assimilation rate (Pn) and transpiration were measured at midday
(between 11:30 and 13:30), when drought stress should be at its maximum, due to high
temperature and irradiance. It was measured on the second, fully developed leaf of each plant
using a gas-exchange system (Li-6400, Li-Cor, Lincoln, NE, USA) equipped with a CO2
cartridge to adjust and maintain constant CO2 of 400 μmol mol–1 air within the leaf cuvette.
Gas exchange measurements were conducted on clear days without clouds to maintain
constant PPFD. After reaching steady-state photosynthesis, data were logged. The leaf area
was estimated simultaneously by measuring the leaf width and later on used to correct values
for net photosynthesis, as leaf blades did not fill the whole leaf cuvette. Gas exchange was
measured under ambient light conditions at the end of the first drought period, in the early and
late drought period and in the early recovery phase after the drought.
2.6. Statistical analysis
To determine significant differences between single and recurrent drought treatments,
analyses of variance were performed for all variables for each sampling date. We defined
“treatment” as a fixed factor. “Provenance” was a random factor in this experiment, as
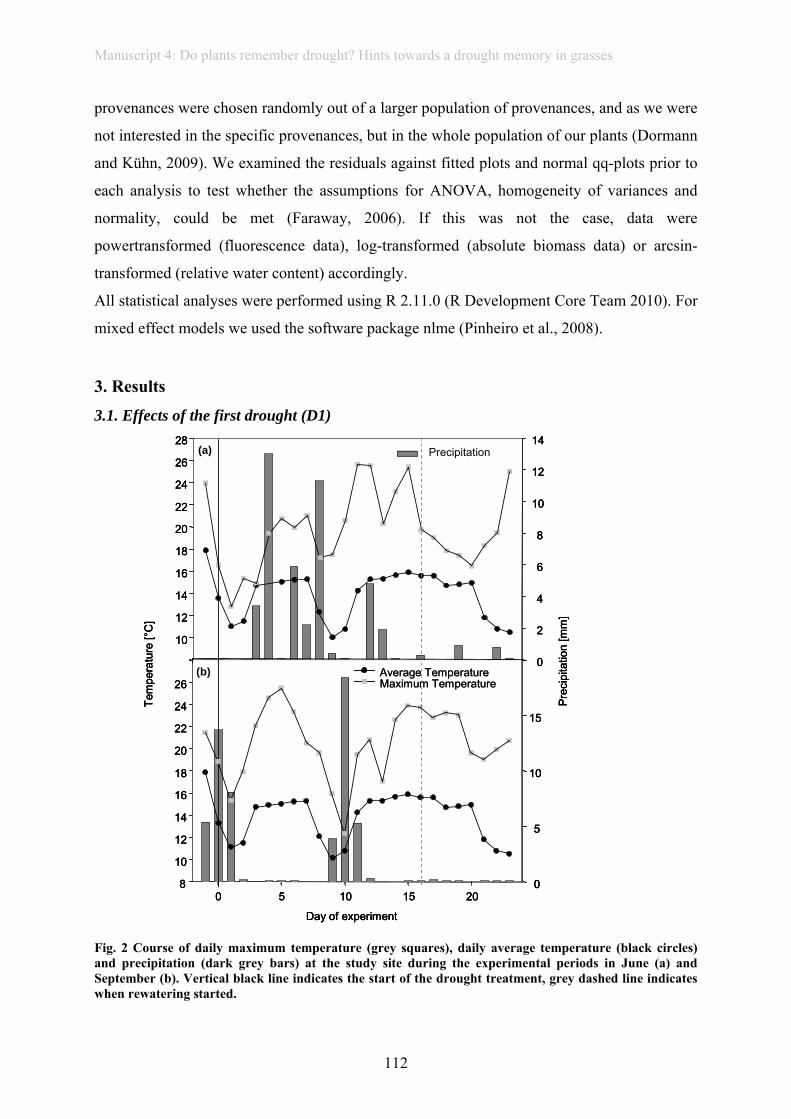
Manuscript 4: Do plants remember drought? Hints towards a drought memory in grasses
112
provenances were chosen randomly out of a larger population of provenances, and as we were
not interested in the specific provenances, but in the whole population of our plants (Dormann
and Kühn, 2009). We examined the residuals against fitted plots and normal qq-plots prior to
each analysis to test whether the assumptions for ANOVA, homogeneity of variances and
normality, could be met (Faraway, 2006). If this was not the case, data were
powertransformed (fluorescence data), log-transformed (absolute biomass data) or arcsin-
transformed (relative water content) accordingly.
All statistical analyses were performed using R 2.11.0 (R Development Core Team 2010). For
mixed effect models we used the software package nlme (Pinheiro et al., 2008).
3. Results
3.1. Effects of the first drought (D1)
Tem
pera
ture
[°C
]
10
12
14
16
18
20
22
24
26
28
0
2
4
6
8
10
12
14
Pre
cipi
tatio
n[m
m]
0 5 10 15 208
10
12
14
16
18
20
22
24
26Average TemperatureMaximum Temperature
Day of experiment
0
5
10
15
Precipitation(a)
(b)
Tem
pera
ture
[°C
]
10
12
14
16
18
20
22
24
26
28
0
2
4
6
8
10
12
14
Pre
cipi
tatio
n[m
m]
0 5 10 15 208
10
12
14
16
18
20
22
24
26Average TemperatureMaximum Temperature
Day of experiment
0
5
10
15
Precipitation(a)
(b)
Tem
pera
ture
[°C
]
10
12
14
16
18
20
22
24
26
28
0
2
4
6
8
10
12
14
Pre
cipi
tatio
n[m
m]
0 5 10 15 208
10
12
14
16
18
20
22
24
26Average TemperatureMaximum TemperatureAverage TemperatureMaximum Temperature
Day of experiment
0
5
10
15
Precipitation(a)
(b)
Fig. 2 Course of daily maximum temperature (grey squares), daily average temperature (black circles) and precipitation (dark grey bars) at the study site during the experimental periods in June (a) and September (b). Vertical black line indicates the start of the drought treatment, grey dashed line indicates when rewatering started.
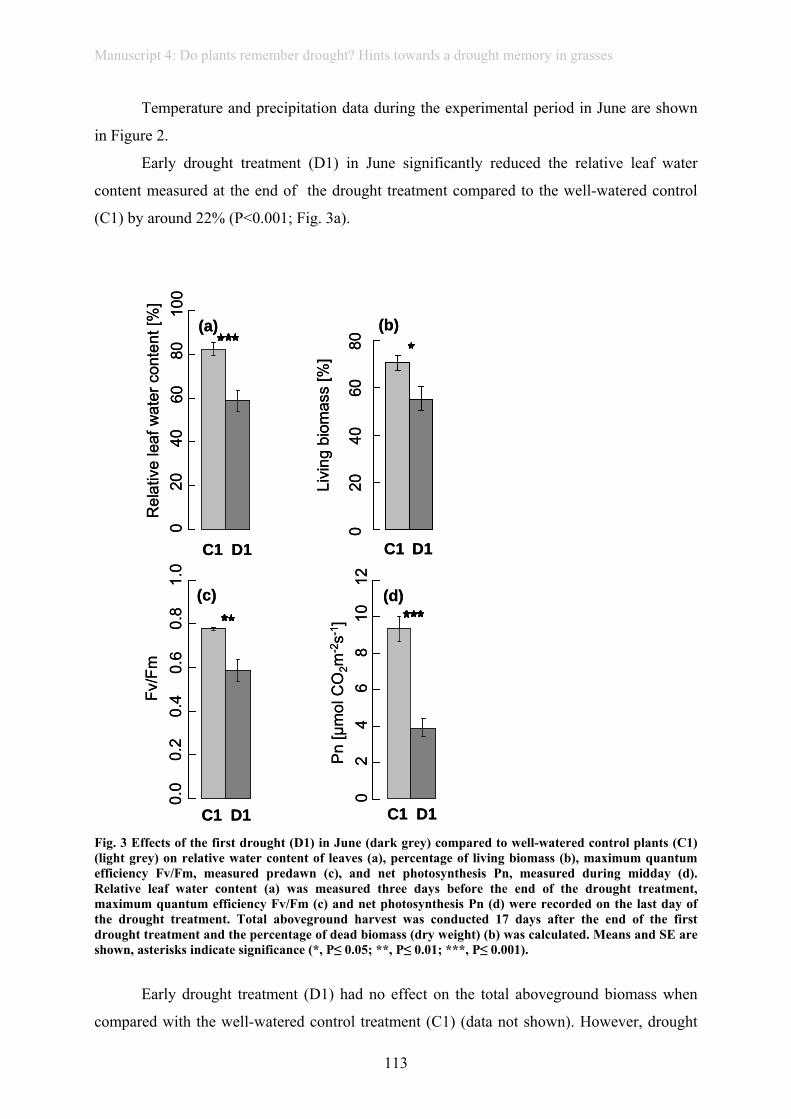
Manuscript 4: Do plants remember drought? Hints towards a drought memory in grasses
113
Temperature and precipitation data during the experimental period in June are shown
in Figure 2.
Early drought treatment (D1) in June significantly reduced the relative leaf water
content measured at the end of the drought treatment compared to the well-watered control
(C1) by around 22% (P<0.001; Fig. 3a).
C1 D1
Rel
ativ
e le
afw
ater
cont
ent[
%]
020
4060
8010
0
(a)P
n[µ
mol
CO
2m-2
s-1]
02
46
810
12
(d)
C1 D1
Fv/F
m0.
00.
20.
40.
60.
81.
0
(c)
C1 D1 C1 D1
Livi
ngbi
omas
s[%
]
020
4060
80
(b)
C1 D1
Rel
ativ
e le
afw
ater
cont
ent[
%]
020
4060
8010
0
(a)P
n[µ
mol
CO
2m-2
s-1]
02
46
810
12
(d)
C1 D1
Fv/F
m0.
00.
20.
40.
60.
81.
0
(c)
C1 D1 C1 D1
Livi
ngbi
omas
s[%
]
020
4060
80
(b)
Fig. 3 Effects of the first drought (D1) in June (dark grey) compared to well-watered control plants (C1) (light grey) on relative water content of leaves (a), percentage of living biomass (b), maximum quantum efficiency Fv/Fm, measured predawn (c), and net photosynthesis Pn, measured during midday (d). Relative leaf water content (a) was measured three days before the end of the drought treatment, maximum quantum efficiency Fv/Fm (c) and net photosynthesis Pn (d) were recorded on the last day of the drought treatment. Total aboveground harvest was conducted 17 days after the end of the first drought treatment and the percentage of dead biomass (dry weight) (b) was calculated. Means and SE are shown, asterisks indicate significance (*, P≤ 0.05; **, P≤ 0.01; ***, P≤ 0.001).
Early drought treatment (D1) had no effect on the total aboveground biomass when
compared with the well-watered control treatment (C1) (data not shown). However, drought
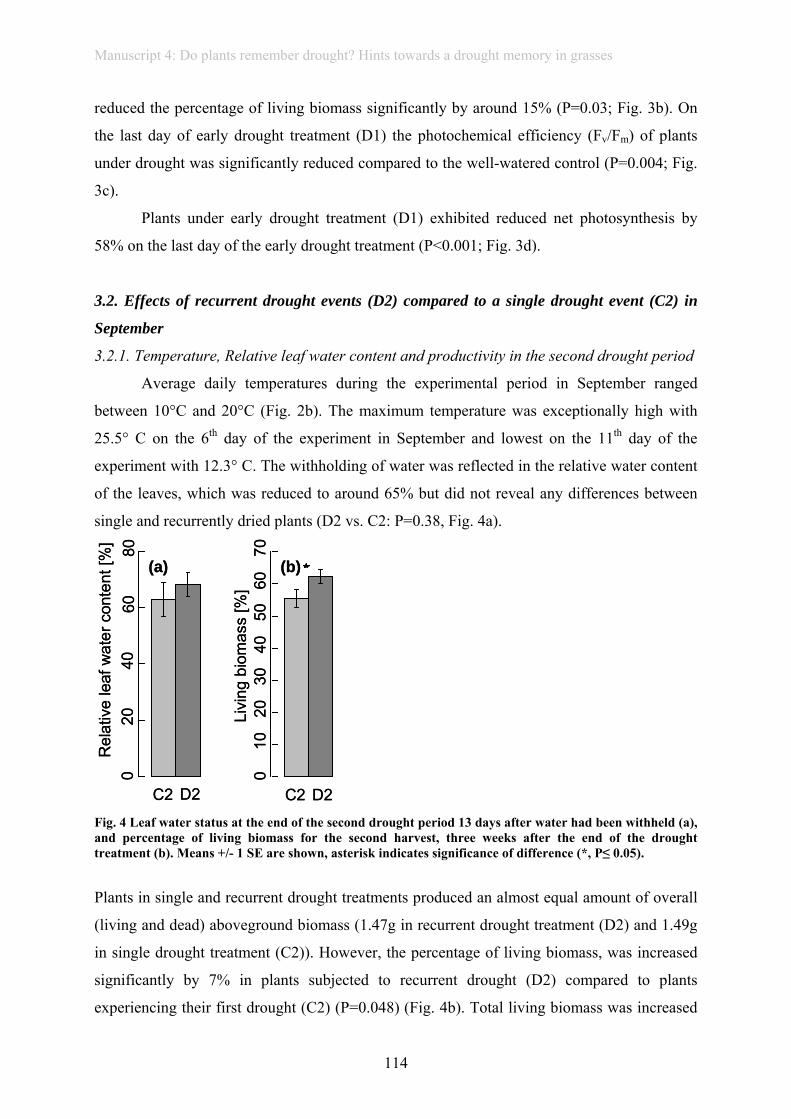
Manuscript 4: Do plants remember drought? Hints towards a drought memory in grasses
114
reduced the percentage of living biomass significantly by around 15% (P=0.03; Fig. 3b). On
the last day of early drought treatment (D1) the photochemical efficiency (Fv/Fm) of plants
under drought was significantly reduced compared to the well-watered control (P=0.004; Fig.
3c).
Plants under early drought treatment (D1) exhibited reduced net photosynthesis by
58% on the last day of the early drought treatment (P<0.001; Fig. 3d).
3.2. Effects of recurrent drought events (D2) compared to a single drought event (C2) in
September
3.2.1. Temperature, Relative leaf water content and productivity in the second drought period
Average daily temperatures during the experimental period in September ranged
between 10°C and 20°C (Fig. 2b). The maximum temperature was exceptionally high with
25.5° C on the 6th day of the experiment in September and lowest on the 11th day of the
experiment with 12.3° C. The withholding of water was reflected in the relative water content
of the leaves, which was reduced to around 65% but did not reveal any differences between
single and recurrently dried plants (D2 vs. C2: P=0.38, Fig. 4a).
C2
Rel
ativ
e le
afw
ater
cont
ent[
%]
020
4060
80
D2
(a)
Livi
ngbi
omas
s[%
]0
1020
3040
5060
70
C2 D2
(b)
C2
Rel
ativ
e le
afw
ater
cont
ent[
%]
020
4060
80
D2
(a)
Livi
ngbi
omas
s[%
]0
1020
3040
5060
70
C2 D2
(b)
Fig. 4 Leaf water status at the end of the second drought period 13 days after water had been withheld (a), and percentage of living biomass for the second harvest, three weeks after the end of the drought treatment (b). Means +/- 1 SE are shown, asterisk indicates significance of difference (*, P≤ 0.05).
Plants in single and recurrent drought treatments produced an almost equal amount of overall
(living and dead) aboveground biomass (1.47g in recurrent drought treatment (D2) and 1.49g
in single drought treatment (C2)). However, the percentage of living biomass, was increased
significantly by 7% in plants subjected to recurrent drought (D2) compared to plants
experiencing their first drought (C2) (P=0.048) (Fig. 4b). Total living biomass was increased
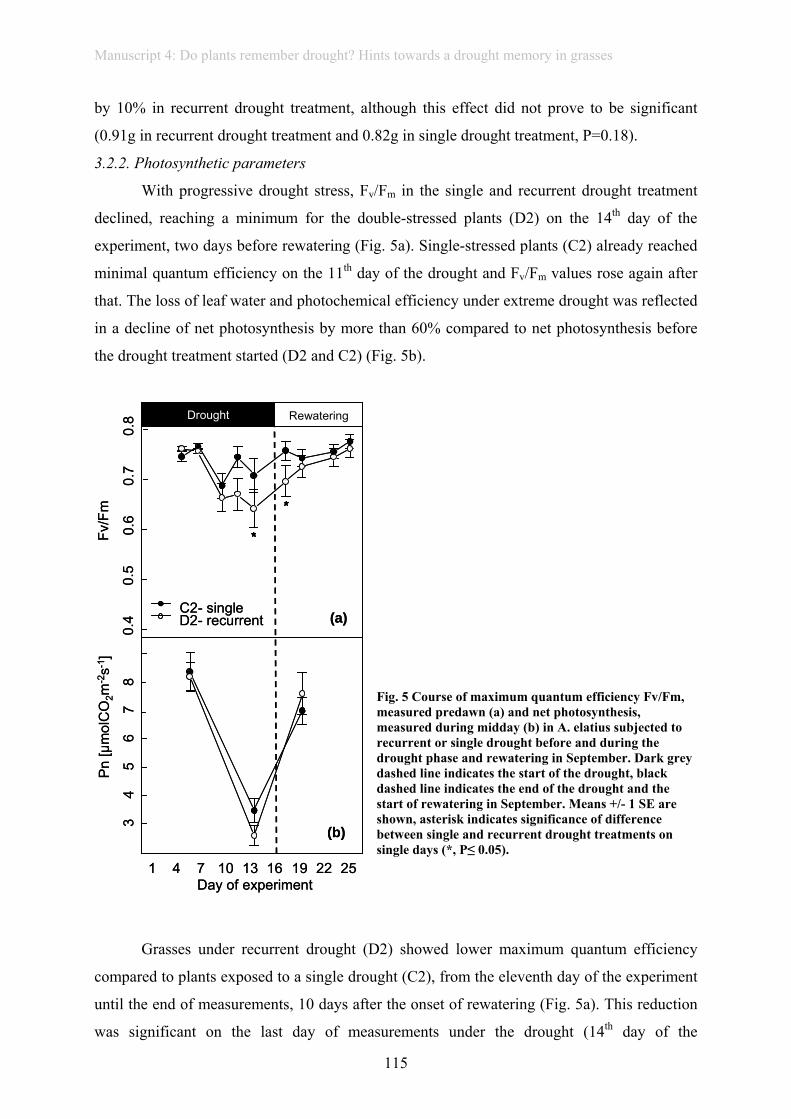
Manuscript 4: Do plants remember drought? Hints towards a drought memory in grasses
115
by 10% in recurrent drought treatment, although this effect did not prove to be significant
(0.91g in recurrent drought treatment and 0.82g in single drought treatment, P=0.18).
3.2.2. Photosynthetic parameters
With progressive drought stress, Fv/Fm in the single and recurrent drought treatment
declined, reaching a minimum for the double-stressed plants (D2) on the 14th day of the
experiment, two days before rewatering (Fig. 5a). Single-stressed plants (C2) already reached
minimal quantum efficiency on the 11th day of the drought and Fv/Fm values rose again after
that. The loss of leaf water and photochemical efficiency under extreme drought was reflected
in a decline of net photosynthesis by more than 60% compared to net photosynthesis before
the drought treatment started (D2 and C2) (Fig. 5b).
Fig. 5 Course of maximum quantum efficiency Fv/Fm, measured predawn (a) and net photosynthesis, measured during midday (b) in A. elatius subjected to recurrent or single drought before and during the drought phase and rewatering in September. Dark grey dashed line indicates the start of the drought, black dashed line indicates the end of the drought and the start of rewatering in September. Means +/- 1 SE are shown, asterisk indicates significance of difference between single and recurrent drought treatments on single days (*, P≤ 0.05).
Grasses under recurrent drought (D2) showed lower maximum quantum efficiency
compared to plants exposed to a single drought (C2), from the eleventh day of the experiment
until the end of measurements, 10 days after the onset of rewatering (Fig. 5a). This reduction
was significant on the last day of measurements under the drought (14th day of the
Rewatering
34
56
78
Pn
[µm
olC
O2m
-2s-1
]
Day of experiment1 4 7 10 13 16 19 22 25
0.4
0.5
0.6
0.7
0.8
Fv/F
m
C2- singleD2- recurrent
Drought
(a)
(b)
Rewatering
34
56
78
Pn
[µm
olC
O2m
-2s-1
]
Day of experiment1 4 7 10 13 16 19 22 25
0.4
0.5
0.6
0.7
0.8
Fv/F
m
C2- singleD2- recurrent
Drought
(a)
(b)
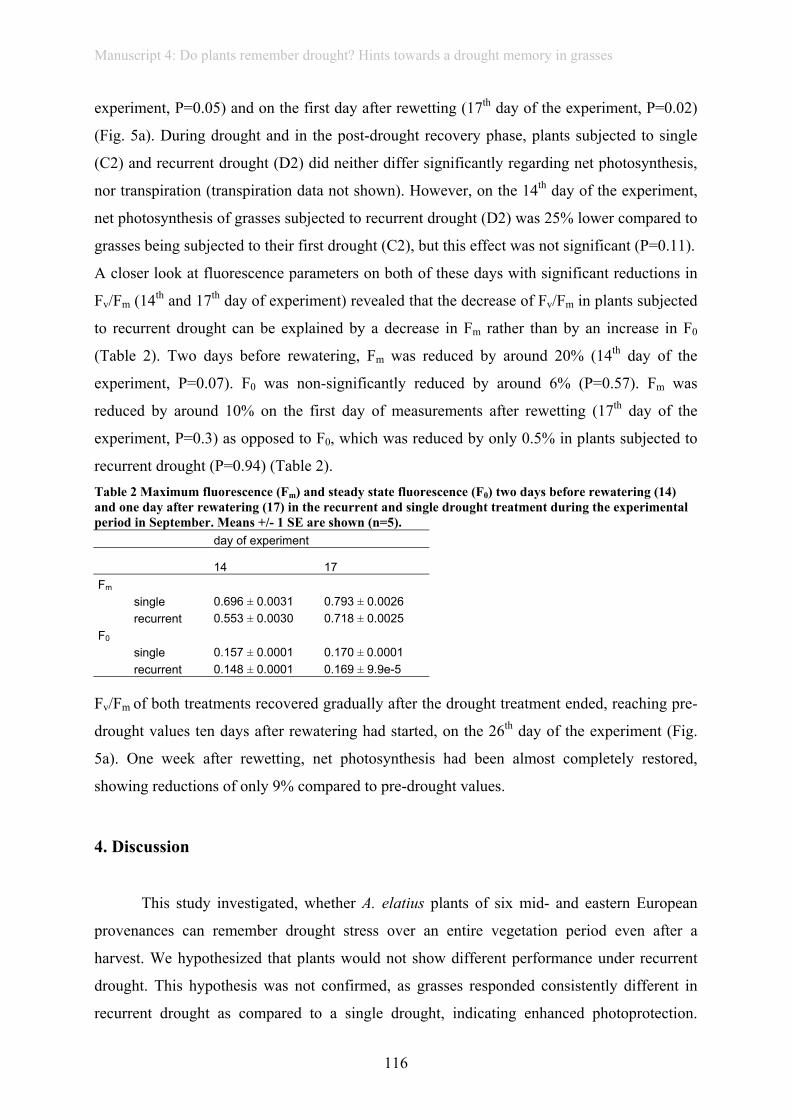
Manuscript 4: Do plants remember drought? Hints towards a drought memory in grasses
116
experiment, P=0.05) and on the first day after rewetting (17th day of the experiment, P=0.02)
(Fig. 5a). During drought and in the post-drought recovery phase, plants subjected to single
(C2) and recurrent drought (D2) did neither differ significantly regarding net photosynthesis,
nor transpiration (transpiration data not shown). However, on the 14th day of the experiment,
net photosynthesis of grasses subjected to recurrent drought (D2) was 25% lower compared to
grasses being subjected to their first drought (C2), but this effect was not significant (P=0.11).
A closer look at fluorescence parameters on both of these days with significant reductions in
Fv/Fm (14th and 17th day of experiment) revealed that the decrease of Fv/Fm in plants subjected
to recurrent drought can be explained by a decrease in Fm rather than by an increase in F0
(Table 2). Two days before rewatering, Fm was reduced by around 20% (14th day of the
experiment, P=0.07). F0 was non-significantly reduced by around 6% (P=0.57). Fm was
reduced by around 10% on the first day of measurements after rewetting (17th day of the
experiment, P=0.3) as opposed to F0, which was reduced by only 0.5% in plants subjected to
recurrent drought (P=0.94) (Table 2). Table 2 Maximum fluorescence (Fm) and steady state fluorescence (F0) two days before rewatering (14) and one day after rewatering (17) in the recurrent and single drought treatment during the experimental period in September. Means +/- 1 SE are shown (n=5). day of experiment
14 17 Fm single 0.696 ± 0.0031 0.793 ± 0.0026 recurrent 0.553 ± 0.0030 0.718 ± 0.0025 F0 single 0.157 ± 0.0001 0.170 ± 0.0001 recurrent 0.148 ± 0.0001 0.169 ± 9.9e-5 Fv/Fm of both treatments recovered gradually after the drought treatment ended, reaching pre-
drought values ten days after rewatering had started, on the 26th day of the experiment (Fig.
5a). One week after rewetting, net photosynthesis had been almost completely restored,
showing reductions of only 9% compared to pre-drought values.
4. Discussion
This study investigated, whether A. elatius plants of six mid- and eastern European
provenances can remember drought stress over an entire vegetation period even after a
harvest. We hypothesized that plants would not show different performance under recurrent
drought. This hypothesis was not confirmed, as grasses responded consistently different in
recurrent drought as compared to a single drought, indicating enhanced photoprotection.
Manuscript 4: Do plants remember drought? Hints towards a drought memory in grasses
117
Surprisingly, this effect persisted after total aboveground biomass harvest and regrowth. The
observed changes in reaction to recurrent drought are not in accordance with findings
indicating reduced resistance or resilience after having already been exposed to drought stress
before (Lloret et al., 2004; Zavalloni et al., 2008 ). However, these were conducted under field
conditions and Zavalloni et al. (2008) investigated community responses. Thus, different
outcome of the experiments are not surprising. The findings are in accordance with reported
stress imprint effects or stress memory (Bruce et al., 2007). However, to our knowledge, no
study has already provided evidence that grasses do remember drought stress even after a
harvest and can exhibit improved performance in the face of repeated abiotic stress over such
a long duration. Stress imprint and acclimation were previously mostly reported to last for
“several days” (Bruce et al., 2007).
Under severe drought, grasses experiencing recurrent drought showed reduced
maximum quantum efficiency Fv/Fm (Fig. 5a). This was mainly related to reductions in
maximum fluorescence, indicating enhanced dissipation of light energy to prevent
photodamage (Maxwell and Johnson, 2000). Osmond et al. (Osmond et al., 1993) and Araus
et al. (Araus et al., 1998) suggest that a correlation of reduced Fv/Fm with an increase of F0
can be interpreted as chronic photoinhibitory damage due to the degradation of the D1 protein
in the reaction centers. By contrast, a constant F0 and decreasing Fm values, as in our study,
point towards photoinhibition related to enhanced non-photochemical quenching via the
Xanthophyll cycle and thus indicate photoprotection (Araus et al., 1998). Another possible
explanation of decreased Fv/Fm caused by reduced Fm values might be a reduction of
chlorophyll. Unfortunately, we did not measure chlorophyll content in our study. However, a
reduction of chlorophyll can be considered as a feature of acclimation, as it reduces the
possibility of photodamage because of an excess of energy (Munne-Bosch and Alegre, 2000).
Net photosynthesis did not reveal any differences between grasses under recurrent (D2) and
single drought (C2), but showed a trend towards lower photosynthesis in plants receiving
recurrent stress under extreme drought (Fig. 5b). This is in accordance with the reduced
photochemical efficiency in plants recurrently experiencing drought (D2).
The results of the aboveground biomass support the hypothesis of enhanced
photoprotection of double-stressed plants, as the percentage of living biomass was
significantly increased in plants experiencing their second drought, although total
aboveground biomass or total living biomass were not significantly altered.
Plants can adapt to drought by enhancing root growth. However, relative water content
of the leaves was not significantly enhanced in plants experiencing recurrent drought,
Manuscript 4: Do plants remember drought? Hints towards a drought memory in grasses
118
indicating that the observed results can not be explained by changes in root biomass or
improved water uptake mechanisms.
Ecophysiological measurements did not reveal any consistent differences between
recurring (D2) and single drought (C2) in the post drought recovery phase. Maximum
quantum efficiency two days after rewetting in grasses subjected to recurring drought was
significantly lower compared to grasses subjected to their first drought. This was more likely
related to increased stress levels under drought rather than a lower recovery rate. Some studies
indicated that recovery rate depends on experienced stress level (Miyashita et al., 2005; Resco
et al., 2009). The significantly lower percentage of dead biomass in plants subjected to
recurring drought can be a sign of quicker recovery, but is more likely to be a sign of
improved photoprotection, as discussed above. In accordance to other studies, the recovery of
ecophysiological parameters was quite fast, almost reaching pre-stress levels after about one
week (Galle et al., 2007; Galmes et al., 2007).
We did not elucidate underlying molecular or biochemical mechanisms for
acclimation in this study, as we were interested in the effects or recurrent drought on
agricultural relevant performance parameters. Thus, we can only hypothesize about potential
long-lasting acclimation processes in the grasses. The observed phenotypic plasticity could be
either explained by belowground dynamics or by long-lasting changes in gene expression,
rendering the plants more permissive to react quickly to recurrent stress, e.g. epigenetic
processes (Aubin-Horth and Renn, 2009;Molinier et al., 2006; Bird, 2007; Bossdorf et al.,
2008). Verhoeven et al. (Verhoeven et al., 2010) recently showed that stress induces changes
in methylation patterns and that these patterns are heritable. An investigation of the changes
in methylation patterns as a response to drought and a link of observed methylation patterns to
stress response are very promising. Furthermore, we could only investigate six provenances of
A. elatius plants, which originated mainly from areas in Europe with quite similar climatic
conditions. Other, more different provenances were not surviving in sufficient replicates for
our study. Nevertheless, an extension of our experiment to other provenances and plant
groups seems promising, as they may reveal different acclimation patterns and therefore also
different responses to recurrent drought.
5. Conclusion
To conclude, our study indicates that grasses under drought retain a long-lasting stress
imprint that facilitates a faster and more protective response towards a recurrent drought.
Manuscript 4: Do plants remember drought? Hints towards a drought memory in grasses
119
Grasses being subjected to recurring drought showed improved photoprotection. However,
under more intense or frequent drought events, the reduction of photochemical efficiency and
thus photosynthesis, could lead to a loss of productivity (Murchie et al., 2009). This is
indicated in our study by a trend towards a lower photosynthetic rate under extreme drought.
However, further studies have to elucidate acclimation processes on a molecular and
biochemical level more deeply, and relate them to functional parameters. Long-term
acclimation mechanisms still have to be scrutinized for a better understanding of plant
responses to a changing climate, and to be able to make projections and recommendations for
adaptation to climate change.
6. Acknowledgements: Many thanks to all interns, who assisted with the measurements, in
particular Inés Pastor. We thank Prof. W. Beyschlag and Jun. Prof. Christiane Werner-Pinto
of the University of Bielefeld and Prof. J. Tenhunen of the University of Bayreuth for
providing us with their PAMs. Many thanks to Dr. H.Auge of the Helmholtz Centre for
Environmental Research in Halle, for providing us with the LI-6400. Thanks to Reinhold
Stahlmann and several technical assistants for their help. This work was kindly supported by
the Helmholtz Impulse and Networking Fund through the Helmholtz Interdisciplinary
Graduate School for Environmental Research (HIGRADE). Thanks to the anonymous
reviewers for helping to improve the manuscript.
References: Araus, J.L., Amaro, T., Voltas, J., Nakkoul, H., Nachit, M.M., 1998. Chlorophyll fluorescence as a selection
criterion for grain yield in durum wheat under Mediterranean conditions. Field Crop. Res. 55, 209–223. Aubin-Horth, N., Renn, S.C.P., 2009. Genomic reaction norms: using integrative biology to understand
molecular mechanisms of phenotypic plasticity. Mol. Ecol. 18, 3763–3780. Barrs, H.D., Weatherley, P.E., 1962. A re-examination of relative turgidity technique for estimating water
deficits in leaves. Austral. J. Biol. Sci. 15, 413-417. Bilger, W., Schreiber, U., Bock, M., 1995. Determination of the quantum efficiency of photosystem II and
nonphotochemical quenching of chlorophyll fluorescence in the field. Oecologia 102, 425–432. Bird, A., 2007. Perceptions of epigenetics. Nature 447, 396–398. Bossdorf, O., Richards, C.L., Pigliucci, M., 2008. Epigenetics for ecologists. Ecol.Lett. 11, 106–115. Bruce, T.J.A., Matthes, M.C., Napier, J.A., Pickett, J.A., 2007. Stressful ‘‘memories" of plants: Evidence and
possible mechanisms. Plant Sci. 173, 603–608. Dormann, C.F., Kühn, I., 2009. Angewandte Statistik für die biologischen Wissenschaften. Second ed. URL:
http://www.ufz.de/data/deutschstatswork7649.pdf (June 29th, 2010). Faraway, J.J., 2006. Extending the Linear Model with R - Generalized Linear, Mixed Effects and Nonparametric
Regression Models. Chapman and Hall/ CRC, Boca Raton. Galle, A., Haldimann, P., Feller, U., 2007. Photosynthetic performance and water relations in young pubescent
oak (Quercus pubescens) trees during drought stress and recovery. New Phytol. 174, 799–810. Galmes, J., Medrano, H., Flexas, J., 2007. Photosynthetic limitations in response to water stress and recovery in
Mediterranean plants with different growth forms. New Phytol. 175, 81-93. Goh, C.H., Nam, H.G., Park, Y.S., 2003. Stress memory in plants: a negative regulation of stomatal response and
transient induction of rd22 gene to light in abscisic acid-entrained Arabidopsis plants. Plant J. 36, 240–255. Grime, J.P., Hodgson, J.G., Hunt, R., 1988. Comparative Plant ecology. A functional approach to common
british species. Unwin Hyman, London.
Manuscript 4: Do plants remember drought? Hints towards a drought memory in grasses
120
Jentsch, A., Kreyling, J., Boettcher-Treschkow, J., Beierkuhnlein, C., 2009. Beyond gradual warming: extreme weather events alter flower phenology of European grassland and heath species. Global Change Biol. 15, 837–849.
Jiang, C.D., Li, P.M., Gao, H.Y., Zou, Q., Jiang, G.M., Li, L.H., 2005. Enhanced photoprotection at the early stages of leaf expansion in field-grown soybean plants. Plant Sci. 168, 911–919.
Kreyling, J., Wenigmann, M., Beierkuhnlein, C., Jentsch, A., 2008. Effects of extreme weather events on plant productivity and tissue die-back are modified by community composition. Ecosystems 11, 752–763.
Kreyling, J., Beierkuhnlein, C., Jentsch, A., 2010. Effects of soil freeze–thaw cycles differ between experimental plant communities. Basic Appl. Ecol. 11, 65-75.
Lambers, H., Chapin, III F.S., Pons, T.L., 2008. Plant physiological ecology. Second ed. Springer, New York. Lloret, F., Siscart, D., Dalmases, C., 2004. Canopy recovery after drought dieback in holm-oak Mediterranean
forests of Catalonia (NE Spain). Global Change Biol. 10, 2092–2099. Maxwell, K., Johnson, G.N., 2000. Chlorophyll fluorescence - a practical guide. J. Exp. Bot. 51, 659–668. Michalski, S.G., Durka, W., Jentsch, A., Kreyling, J., Pompe, S., Schweiger, O., Willner, E. and Beierkuhnlein,
C. (2010). Evidence for genetic differentiation and divergent selection in an autotetraploid forage grass (Arrhenatherum elatius). Theor. Appl. Genet. 120, 1151-1162.
Miyashita, K., Tanakamaru, S., Maitani, T., Kimura, K., 2005. Recovery responses of photosynthesis, transpiration, and stomatal conductance in kidney bean following drought stress. Environ. Exp. Bot. 53, 205–214.
Molinier, J., Ries, G., Zipfel, C., Hohn, B., 2006. Transgeneration memory of stress in plants. Nature 442, 1046–1049.
Mueller, R.C., Scudder, C.M., Porter, M.E., Trotter, R.T., Gehring, C.A., Whitham, T.G., 2005. Differential tree mortality in response to severe drought: evidence for long-term vegetation shifts. J. Ecol. 93, 1085–1093.
Munne-Bosch, S., Alegre, L., 2000. Changes in carotenoids, tocopherols and diterpenes during drought and recovery, and the biological significance of chlorophyll loss in Rosmarinus officinalis plants. Planta 210, 925–931.
Murchie, E.H., Pinto, M., Horton, P., 2009. Agriculture and the new challenges for photosynthesis research. New Phytol. 181, 532–552.
Noormets, A., McNulty, S.G., DeForest, J.L., Sun, G., Li, Q., Chen, J., 2008. Drought during canopy development has lasting effect on annual carbon balance in a deciduous temperate forest. New Phytol. 179, 818–828.
Osmond, C.B., Ramus, J., Levavasseur, G., La Franklin, Henley, W.J., 1993. Fluorescence quenching during photosynthesis and photoinhibition of Ulva-Rotundata Blid. Planta 190, 97–106.
Pinheiro, J., Bates, D., DebRoy, S., Sarkar, D. and the R Core team, 2008. nlme, Linear and Nonlinear Mixed Effects Models. R package version 3.1-89.
Polle, A., Kröniger, W., Rennenberg, H., 1996. Seasonal Fluctuations of Ascorbate-Related Enzymes: Acute and delayed effects of late frost in spring on antioxidative systems in needles of Norway Spruce (Picea abies L.). Plant Cell Physiol. 37, 717-725.
R Development Core Team, 2010. R: A language and environment for statistical computing. R Foundation for Statistical Computing, Vienna, Austria. ISBN 3-900051-07-0, URL http://www.R-project.org.
Resco, V., Ewers, B.E., Sun, W., Huxman, T.E., Weltzin, J.F., Williams, D.G., 2009. Drought-induced hydraulic limitations constrain leaf gas exchange recovery after precipitation pulses in the C-3 woody legume, Prosopis velutina. New Phytol. 181, 672–682.
Schar, C., Vidale, P.L., Luthi, D., Frei, C., Haberli, C., Liniger, M.A., Appenzeller, C., 2004. The role of increasing temperature variability in European summer heatwaves. Nature 427, 332–336.
Scheffer, M., Carpenter, S., Foley, J.A., Folke, C., Walker, B., 2001. Catastrophic shifts in ecosystems. Nature 413, 591–596.
Tahkokorpi, M., Taulavuori, K., Laine, K., Taulavuori, E., 2007. After-effects of drought-related winter stress in previous and current year stems of Vaccinium myrtillus L. Environ. Exp. Bot. 61, 85-93.
Trenberth, K.E., Dai, A., Rasmussen, R.M., Parsons, D.B., 2003. The changing character of precipitation. Bull. Am. Met. Soc. 84, 1205-1217.
van Peer, L., Nijs, I., Reheul, D., Cauwer, B. de, 2004. Species richness and susceptibility to heat and drought extremes in synthesized grassland ecosystems: compositional vs physiological effects. Funct. Ecol. 18, 769–778.
Verhoeven, K.J.F., Jansen, J.J., van Dijk, P.J., Biere, A., 2010. Stress-induced DNA methylation changes and their heritability in asexual dandelions. New Phytol. 185, 1108–1118.
Zavalloni, C., Gielen, B., Lemmens, C.M.H.M., Boeck, H.J. de, Blasi, S., van den Bergh, S., Nijs, I., Ceulemans, R., 2008. Does a warmer climate with frequent mild water shortages protect grassland communities against a prolonged drought? Plant Soil 308, 119–130.
Manuscript 5: Cold hardiness of Pinus nigra Arnold as influenced by geographic origin, warming, and extreme summer drought
121
Manuscript 5: Cold hardiness of Pinus nigra Arnold as influenced by
geographic origin, warming, and extreme summer drought Environmental and Experimental Botany, 2012, 78: 99-108.
Juergen Kreyling1, Guido L.B. Wiesenberg2, Daniel Thiel1, Christian Wohlfart1, Gerhard
Huber3, Julia Walter4, Anke Jentsch4, Monika Konnert3, Carl Beierkuhnlein1
1Biogeography, University of Bayreuth, D-95440 Bayreuth, Germany
² Agroecosystem Research, University of Bayreuth, D-95440 Bayreuth, Germany 3Bavarian Institute for Forest Seeding and Planting (ASP), D-83317 Teisendorf, Germany 4Disturbance Ecology, University of Bayreuth, D-95440 Bayreuth, Germany
Corresponding author: J. Kreyling ([email protected])
phone: ++49 921 552259
fax: ++49 921 552315
Highlights:
1. Cold hardiness of Pinus nigra shows local adaptation to climate at its geographic origin
2. Winter cold hardiness increases with summer drought and summer warming
3. Cold hardiness is related to the content of soluble carbohydrates and composition of fatty
acids and alkanes
4. Pinus nigra shows similar cold hardiness as the native Central European forest trees
Abstract
Adaptation to the adverse effects of climate change is being investigated more and more
through the introduction of species from warmer and drier climates, such as the (sub-)
mediterranean Pinus nigra to dry sites in temperate Central Europe. Winter survival,
however, may pose a serious threat to this strategy as cold extremes, which naturally
determine the poleward range limits of forest trees, are not expected to follow the general
warming trend in the near future.
Here, juveniles of P. nigra from eight provenances throughout Europe were exposed to
different climate change scenarios (factorial combinations of 42 days of drought and warming
Manuscript 5: Cold hardiness of Pinus nigra Arnold as influenced by geographic origin, warming, and extreme summer drought
122
by 1.6°C) in a common garden experiment in Bayreuth, Germany. Cold hardiness (LT50) was
determined by the Relative Electrolyte Leakage method (REL) in two consecutive winters.
Cold hardiness of foliage differed by 10°C between the provenances studied and a local
adaptation to minimum temperature was found. Cold hardiness was further affected by
extreme summer drought, increasing cold hardiness by 3.9°C on average in the subsequent
winter, and by summer warming, increasing cold hardiness by 3.4°C. Year-round warming
had no significant effect on cold hardiness. Cold hardiness was related to the content of
soluble carbohydrates and to the composition of fatty acids and alkanes in the needles.
Juveniles of P. nigra exhibited a comparable cold hardiness as juveniles of species native to
Central Europe (P. sylvestris, Picea abies, Fagus sylvatica and Quercus petraea) under the
same climatic conditions. Cold hardiness of the fine roots of P. nigra averaged -16.5°C
compared to -23.8°C on average for needles.
Our results imply that the cold hardiness of the foliage is adaptive to both long-term
growing conditions at the seed origin (genetic heritage) and short-term alterations of these
conditions (individual plasticity), while first hints suggest that cold hardiness of the roots is
high and might not be adaptive. For P. nigra, below- and above-ground cold hardiness of
selected provenances in mid-winter appear suitable for cultivation in temperate regions.
Keywords: frost hardiness, black pine, ecotype, cold tolerance, global warming, winter
ecology
1. Introduction
Species respond to climate change by poleward range shifts (Parmesan and Yohe,
2003). The speed of warming, however, is expected to exceed natural migration rates in many
cases (Thomas et al., 2004). In forestry in particular, human-assisted range shifts are proposed
to counter long generation cycles and modest dispersal abilities of forest trees (Schaberg et
al., 2008b; McKenney et al., 2009). Yet, the importance of winter conditions is often
overlooked, especially in the ecology of temperate regions (Kreyling, 2010). Absolute
minimum temperatures have strong implications for species distributions by often
determining their poleward range limits (Sakai and Weiser, 1973; Repo et al., 2008). A single
cold extreme can offset any distributional adaptations to the general warming trend (Jalili et
al., 2010) and in spite of the mean warming and their decreased frequency of occurrence, both
the intensity and the duration of such cold extremes may even increase regionally within this
Manuscript 5: Cold hardiness of Pinus nigra Arnold as influenced by geographic origin, warming, and extreme summer drought
123
century due to atmospheric circulation changes and internal atmospheric variability which
counteract the warming trend from greenhouse forcing (Vavrus et al., 2006; Kodra et al.,
2011).
Phenotypic plasticity and the adaptive potential of forest trees are determined by their
high genetic diversity, allowing forest trees to develop local adaptations to environmental
stressors (Hosius et al., 2006; Schaberg et al., 2008b). The cold hardiness of Pinus devoniana,
for instance, increases with increasing frost risk along an altitudinal gradient (Saenz-Romero
and Tapia-Olivares, 2008). Similarly, changes to the cold hardiness of Fagus sylvatica
indicate local adaptation to the prevailing minimum winter temperatures (Visnjic and
Dohrenbusch, 2004) and to late spring frost risk (Kreyling et al., 2011b) across Europe, and
the frost tolerance of Tsuga heterophylla is adapted to frost risk along latitudinal and
altitudinal gradients in North America (Kuser and Ching, 1980). Provenance trials
demonstrate a differential performance between the provenances of different geographic
origins of Pinus nigra (Varelides et al., 2001), which is the target species of this study. P.
nigra was selected because it is discussed in forestry as target species for translocations to
Central Europe (Kölling, 2007; Huber 2011) and because of its high genetic diversity
(Nkongolo et al., 2002; Jagielska et al., 2007). Based on its fragmented submediterranean
range, one could assume that it lacks adaptation to winter frost, at least in some provenances.
Provenance trials suggest that frost damage occurs around -20°C and in particular those
provenances from Corsica do not survive -25°C (summarized in Huber, 2011).
The cold hardiness of evergreen tree species fluctuates over the course of the year.
During acclimation in autumn, the plant organs become increasingly tolerant to the damaging
effects of tissue freezing, particularly protecting cellular membranes which are a prime place
of freezing injury (Bigras et al., 2001). Even though the genetic controls of the protective
processes in conifers are complex and not yet sufficiently understood (Holliday et al., 2008),
data has been summarized on the chemical components that are involved (Thomashow, 1999).
During acclimation, lipid composition in the plasma membrane shifts towards more
unsaturated lipids (Bakht et al., 2006) in addition to accumulation of soluble carbohydrates,
hydrophilic polypeptides, antioxidants and chaperones in the membranes (Thomashow, 1999).
Increased concentrations of all these chemical components serve the general purpose of
preventing intra-cellular ice crystallization (Bigras et al., 2001).
Plants grown under generally warmer conditions, however, may lose their functional
adaptations to frost (Eccel et al., 2009). Plants can further cope with different environmental
stressors by similar responses at the cellular and molecular level when these stressors trigger
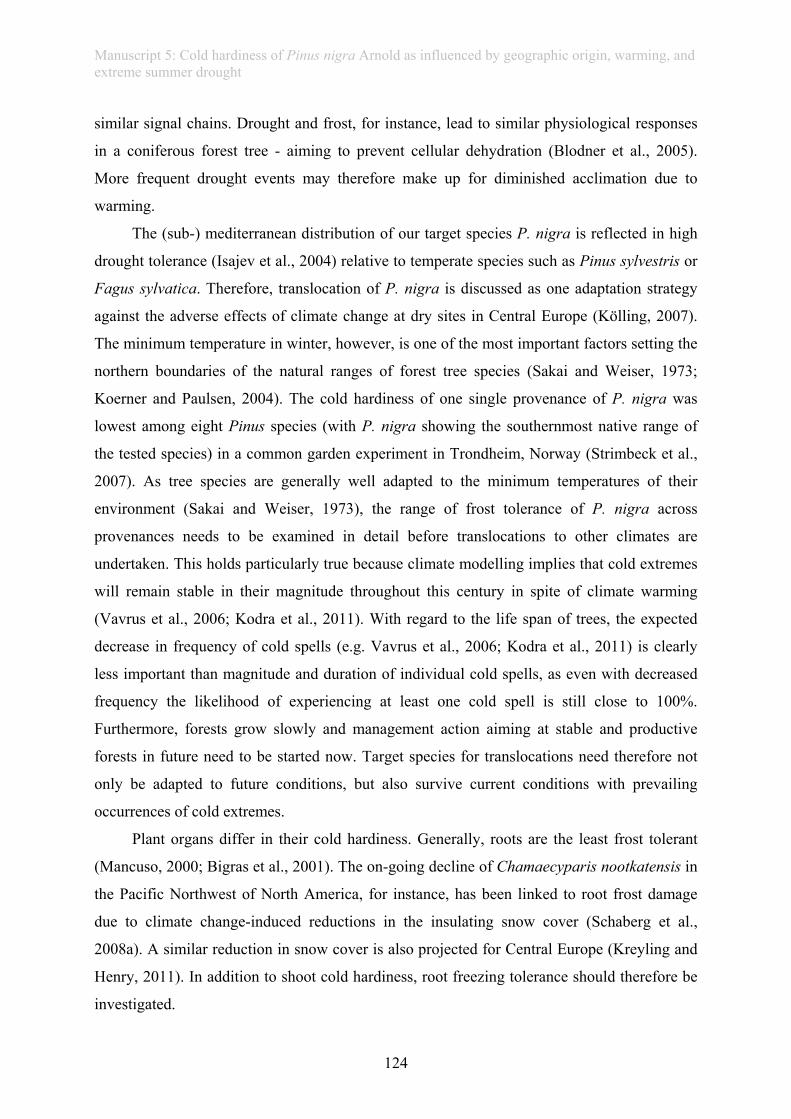
Manuscript 5: Cold hardiness of Pinus nigra Arnold as influenced by geographic origin, warming, and extreme summer drought
124
similar signal chains. Drought and frost, for instance, lead to similar physiological responses
in a coniferous forest tree - aiming to prevent cellular dehydration (Blodner et al., 2005).
More frequent drought events may therefore make up for diminished acclimation due to
warming.
The (sub-) mediterranean distribution of our target species P. nigra is reflected in high
drought tolerance (Isajev et al., 2004) relative to temperate species such as Pinus sylvestris or
Fagus sylvatica. Therefore, translocation of P. nigra is discussed as one adaptation strategy
against the adverse effects of climate change at dry sites in Central Europe (Kölling, 2007).
The minimum temperature in winter, however, is one of the most important factors setting the
northern boundaries of the natural ranges of forest tree species (Sakai and Weiser, 1973;
Koerner and Paulsen, 2004). The cold hardiness of one single provenance of P. nigra was
lowest among eight Pinus species (with P. nigra showing the southernmost native range of
the tested species) in a common garden experiment in Trondheim, Norway (Strimbeck et al.,
2007). As tree species are generally well adapted to the minimum temperatures of their
environment (Sakai and Weiser, 1973), the range of frost tolerance of P. nigra across
provenances needs to be examined in detail before translocations to other climates are
undertaken. This holds particularly true because climate modelling implies that cold extremes
will remain stable in their magnitude throughout this century in spite of climate warming
(Vavrus et al., 2006; Kodra et al., 2011). With regard to the life span of trees, the expected
decrease in frequency of cold spells (e.g. Vavrus et al., 2006; Kodra et al., 2011) is clearly
less important than magnitude and duration of individual cold spells, as even with decreased
frequency the likelihood of experiencing at least one cold spell is still close to 100%.
Furthermore, forests grow slowly and management action aiming at stable and productive
forests in future need to be started now. Target species for translocations need therefore not
only be adapted to future conditions, but also survive current conditions with prevailing
occurrences of cold extremes.
Plant organs differ in their cold hardiness. Generally, roots are the least frost tolerant
(Mancuso, 2000; Bigras et al., 2001). The on-going decline of Chamaecyparis nootkatensis in
the Pacific Northwest of North America, for instance, has been linked to root frost damage
due to climate change-induced reductions in the insulating snow cover (Schaberg et al.,
2008a). A similar reduction in snow cover is also projected for Central Europe (Kreyling and
Henry, 2011). In addition to shoot cold hardiness, root freezing tolerance should therefore be
investigated.
Manuscript 5: Cold hardiness of Pinus nigra Arnold as influenced by geographic origin, warming, and extreme summer drought
125
Here, eight provenances of P. nigra from autochthonous origins and from southern
Germany were tested for their cold hardiness in a common garden experiment in southern
Germany. We hypothesized that (1) cold hardiness differs between provenances, with
provenances from colder origins displaying superior cold hardiness, and that (2) cold
hardiness is affected by climatic experiences of the individuals with drought increasing cold
hardiness and warming decreasing cold hardiness. We further expected that (3) differences in
cold hardiness between provenances are physiologically-related to the content of soluble
carbohydrates and lipid composition of the needles, and that (4) the (sub-) mediterranean
species P. nigra is less frost-tolerant than tree species native to Central Europe, while (5) cold
hardiness of the fine roots of P. nigra is high compared to cold hardiness of its foliage as it
naturally occurs in regions without continuous snow cover.
2. Material and methods
Juveniles of P. nigra from eight provenances throughout Europe were exposed to
different climate change scenarios (warming and extreme drought) in a common garden
experiment. Cold hardiness was determined by the Relative Electrolyte Leakage method
(REL) in two consecutive winters. The experiment was established in Bayreuth, Germany
(49°55’19” N, 11°34’55” E) in March 2009. The long-term mean annual temperature for the
site is 8.2°C, whereas long-term mean annual precipitation is 724 mm.
2.1. Experimental design
Eight provenances of P. nigra (Figure 1; Table 1) were obtained as seeds and cultivated
at the Bavarian Institute for Forest Seeding and Planting (ASP) in Teisendorf, Germany from
April 2008 to April 2009.
Manuscript 5: Cold hardiness of Pinus nigra Arnold as influenced by geographic origin, warming, and extreme summer drought
126
Figure 1: Origins of the target provenances (open circles) within the distribution of P. nigra (black lines and dots for fragmented populations Isajev et al., 2004). X indicates the experimental site. Abbreviations of provenances are specified in Table 1. Grey scales display the mean minimum temperature for the period 1950 to 2000 with a 5’ spatial resolution (Hijmans et al., 2005).
These provenances are part of an international long-term provenance trial which started
in 2009 (Huber, 2011). The provenances stem from autochthonous populations of P. nigra
except for the provenance from Zellingen, Germany, which was introduced from Austrian
sources in 1909. Subspecies identities of the provenances are assigned geographically and
morphologically (Table 1), as genetic analyses are not yet available (Huber, 2011).
Table 1 Origins of target provenances used in the experiment with corresponding climatic information. Skie: Identification number in an international provenance trial (Huber, 2011). MAT: Mean Annual Temperature; MinT: Mean Minimum Temperature; MAP: Mean Annual Precipitation; Precip. Seasonality: Coefficient of variation in mean monthly precipitation sum. All climate data for the period 1950 to 2000 from worldclim (Hijmans et al., 2005). Provenance Country Subspecies Skie North East Altitude
(m)
MAT
(°C)
MinT
(°C)
MAP
(mm)
Precip.
Seasonality
DE Germany nigra 01 49°53'17" 09°43'16" 290 9.2 -3.1 587 18
AU Austria nigra 07 47°46'00" 16°11'00" 369 8.4 -4.9 712 33
YU Serbia nigra 12 43°49'39" 19°35'22" 866 8.7 -5.6 964 17
HR Croatia nigra/
dalmatica
14 43°26'00" 17°13'00" 256 13.2 1.2 1108 33
IT.N Italy nigra 17 45°42'00" 13°49'00" 372 11.4 -1.2 1212 17
IT.S Italy laricio 19 39°18'08" 16°20'22" 1500 9.0 2.2 1300 48
FR1 France nigra 23 44°09'10" 05°52'30" 549 10.7 -2.9 789 16
FR2 France laricio 24 44°24'18" 03°58'39" 581 10.8 -0.9 745 19
Manuscript 5: Cold hardiness of Pinus nigra Arnold as influenced by geographic origin, warming, and extreme summer drought
127
The Croatian provenance stems from a location very close to one of the few
autochthonous stands of P. nigra subspecies dalmatica and its assignment to the subspecies
nigra is somewhat questionable. The seedlings were transported to Bayreuth and individually
planted into 4-litre plastic pots filled with sandy silt (pH 7.3, total C 1.9%, total N 0.15%,
plant available NO3--N 22.5 mg l-1; plant available NH4
+-N 1.8 mg l-1). Selection of the plants
occurred randomly for each provenance from all those plants alive at the planting date. The
mean plant size at the start of the experiment was 12.2 cm ± 2.5 cm SD.
The potted individuals were exposed to the fully crossed threefold factorial combination
of (1) a drought manipulation (drought and control) and (2) a continuous warming
manipulation (warming and reference) and (3) the provenance treatment (eight provenances).
The two climate treatments were crossed resulting in four climate manipulations (control,
drought, warming, warming & drought), that were replicated three times, resulting in 12
experimental units in total. The provenance treatment was nested within each experimental
unit. Each provenance was further replicated with seven plants per experimental unit (nested
replicates), resulting in 21 plants per factorial combination of the three-factorial design and
672 plants overall. Each experimental unit was covered by a single rain-out shelter (11 m by 7
m, 3.8 m high) constructed of a steel frame (GlasMetall Riemer GmbH) and covered with a
transparent polyethylene sheet (0.2 mm, SPR5, Hermann Meyer GmbH) enabling an almost
90% penetration of photosynthetically-active radiation. The edge of the rain-out shelters was
at a height of 80 cm.
The control irrigation regime simulated the local daily 30-year average precipitation.
The application was carried out twice a week with collected rain water. The drought treatment
consisted of 42 days without precipitation, which represents the local statistical 1000-year
recurrence drought event. Drought duration was not a priori set before the manipulations. We
monitored plant performance during the treatment and would have stopped the treatment
when either 66% of the plants showed water stress symptoms (discoloration of foliage) or
when 33% of the plants exhibited lethal stress, or when the local 1000-year extreme would be
reached. The latter condition was set because we assume that events with more than 1000 year
recurrence time are not too realistic even when changing frequencies of extremes due to
climate change are acknowledged (Schär et al., 2004). The same protocol was applied in a
parallel experiment with four grass species (Beierkuhnlein et al., 2011), which all showed
severe drought symptoms after about 20 days, emphasizing the high drought tolerance of
Pinus nigra. The drought treatment started on May 27th 2009 and resulted in the soil moisture
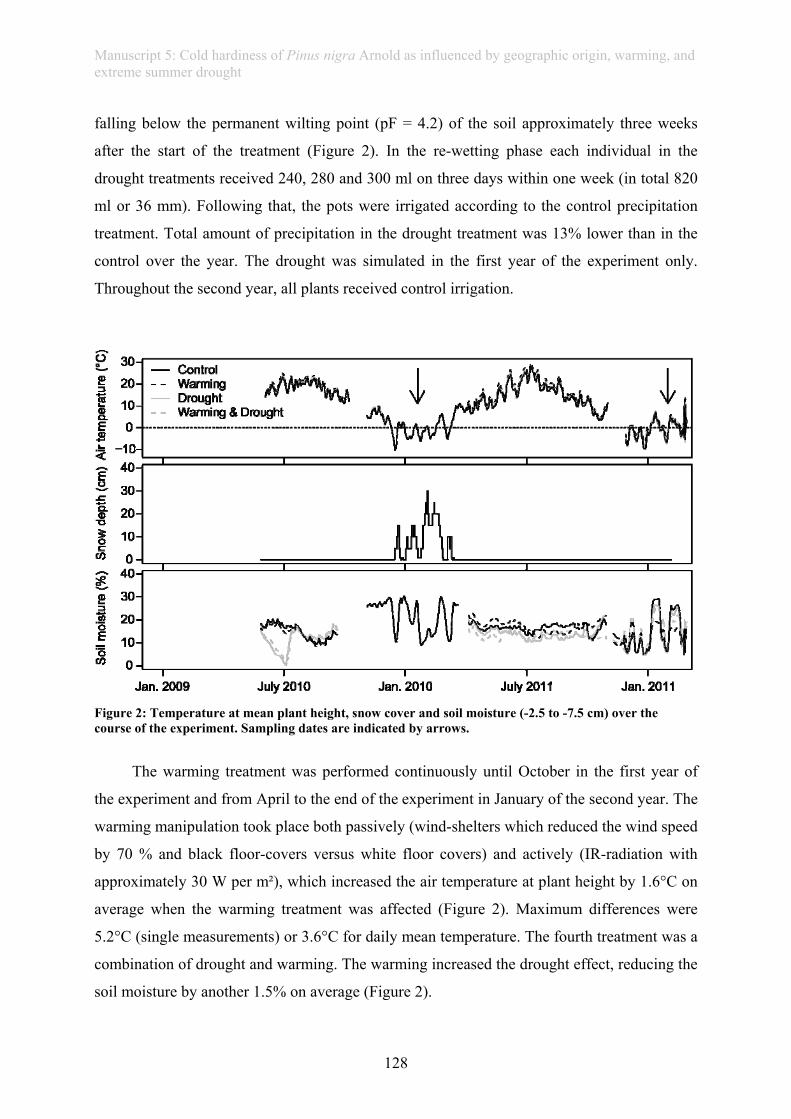
Manuscript 5: Cold hardiness of Pinus nigra Arnold as influenced by geographic origin, warming, and extreme summer drought
128
falling below the permanent wilting point (pF = 4.2) of the soil approximately three weeks
after the start of the treatment (Figure 2). In the re-wetting phase each individual in the
drought treatments received 240, 280 and 300 ml on three days within one week (in total 820
ml or 36 mm). Following that, the pots were irrigated according to the control precipitation
treatment. Total amount of precipitation in the drought treatment was 13% lower than in the
control over the year. The drought was simulated in the first year of the experiment only.
Throughout the second year, all plants received control irrigation.
Figure 2: Temperature at mean plant height, snow cover and soil moisture (-2.5 to -7.5 cm) over the course of the experiment. Sampling dates are indicated by arrows.
The warming treatment was performed continuously until October in the first year of
the experiment and from April to the end of the experiment in January of the second year. The
warming manipulation took place both passively (wind-shelters which reduced the wind speed
by 70 % and black floor-covers versus white floor covers) and actively (IR-radiation with
approximately 30 W per m²), which increased the air temperature at plant height by 1.6°C on
average when the warming treatment was affected (Figure 2). Maximum differences were
5.2°C (single measurements) or 3.6°C for daily mean temperature. The fourth treatment was a
combination of drought and warming. The warming increased the drought effect, reducing the
soil moisture by another 1.5% on average (Figure 2).
Manuscript 5: Cold hardiness of Pinus nigra Arnold as influenced by geographic origin, warming, and extreme summer drought
129
During the first winter of the experiment, plants were kept outside the shelters in a sand
bed from October to April. Figure 2 illustrates that the plants were covered by snow during
the coldest parts of the first winter. For the second winter, plants were kept inside the shelters
with the warming treatment ongoing.
2.2. Response parameters
Cold hardiness was quantified by a slightly modified version of the relative electrolyte
leakage method (REL) of ex-situ samples according to Strimbeck et al. (2007): Pre-tests
revealed no differences in absolute values when the samples were frozen with or without 1ml
solution containing an ice nucleator, presumably because the surface of the samples was wet
and froze at around 0°C anyhow. Furthermore, higher freezing rates were applied. At a rate of
0.6°C/h (Strimbeck et al. 2007) it would have taken 3.5 days to reach our minimum
temperature, whereas commonly the rate of 6°C/h is applied (e.g. Sutinen 1992, Schaberg
2008). Two needles from the current year were sampled per individual in mid-winter of both
years (January 20th in 2010 and January 31st in 2011), rinsed with de-ionized water, and cut to
0.5 cm. Samples from the seven nested replicates per provenance and experimental unit were
combined to form one mixed sample, homogenized and subsequently divided into seven
subsamples subjected to different temperature levels for one hour (+4.5°C, -7.5°C, -14.5°C, -
23°C, -33°C; -40°C, -196°C (liquid N)) using a controlled environment chamber (Licht-
Thermostate Typ 1301, RUMED) and a manually controlled chain of freezers sequentially at
the lowest temperatures. Initial electrolyte leakage was determined in 16 ml 0.1% v/v Triton
X-100_Bidest after 24 h and the final electrolyte leakage was determined after autoclavation
of the samples. Electrolyte leakage was quantified by the conductivity of the solution at 25°C
measured with a WTW inolab pH/Cond 720. Cold hardiness is expressed as the LT50 for
each mixed sample, estimated by non-linear regression of the REL versus the temperature
levels using the formula by Anderson et al. (1988):
(1)
YT is the REL at temperature T, Ymin is the asymptotic value of the response variable in
uninjured tissue, Ymax is the asymptotic value at maximum low-temperature stress, k
represents the steepness of the response curve, and Tm is the midpoint of the symmetrical
curve (an estimate of LT50). Curve fitting was carried out using a quantile regression and the
function “nlrq()” from the software package “quantreg” (Koenker, 2006).
Manuscript 5: Cold hardiness of Pinus nigra Arnold as influenced by geographic origin, warming, and extreme summer drought
130
The multitude of different technical protocols for REL used in the literature (freezing
with or without additional solution, various freezing rates and durations, etc.) limits the
comparability between studies strongly. However, the relative differences within a protocol
should be robust and more or less independent of e.g. freezing rates (Sutinen et al 1992).
Therefore, we stick to the interpretation of relative differences within our study and minimize
the discussion of absolute values.
Cold hardiness of needles from the current year or terminal buds was additionally
determined for juvenile and adult individuals of the most important local tree species (P.
sylvestris, Picea abies, Fagus sylvatica and Quercus petraea). Samples were taken on 26th of
January in the first winter. Three mixed samples of seven individuals each were obtained
from a nearby forest (lowland site: 350 m asl) and, for the juvenile stage of the two conifers,
from a highland site (Waldstein, Fichtelgebirge, 760 m asl) about 50 km northwest of the
experimental site.
In the second winter, carefully excavated fine roots of two provenances (FR1 and IT.S)
exhibiting low and high cold hardiness in their foliage in the first year were analyzed for their
cold hardiness by applying the same protocol as for the needles.
Mean annual minimum temperatures for the period 1950 to 2000 (mean temperature of
the coldest day for the years 1950-2000) for each geographic origin of the provenances were
retrieved from worldclim (Hijmans et al., 2005) and used as indicators for minimum
temperatures (Table 1). We assume that the relative differences between geographic origins
have been suitably reflected, although these values exceed the absolute minimum
temperatures due to daily averaging (for our experimental site the minimum temperature
based on worldclim is -3.5°C while the absolute annual minimum temperatures between 1998
and 2011 at an hourly resolution ranged between -10.8 and -25.5°C). An ordinary least
squares regression between this indicator and cold hardiness was applied for the control
treatment in order to detect local adaptation to late frost events.
Soluble carbohydrates were quantified in the first winter for two provenances exhibiting
low and high cold hardiness, respectively (FR1 and IT.S). Mixed samples of one needle from
the seven plants per experimental unit were taken, immediately frozen in liquid nitrogen and
stored at -30°C. Frozen material was ground in a ball mill; soluble carbohydrates of 20 mg of
plant material were extracted in 50 % methanol and analyzed using the anthrone method
(Kleber et al., 1997). Extinction was measured at 620 nm. We used known concentrations of
Glucose as a standard.
Manuscript 5: Cold hardiness of Pinus nigra Arnold as influenced by geographic origin, warming, and extreme summer drought
131
Lipid composition was obtained for the same two provenances (FR1 and IT.S).
Epicuticular wax lipids including alkanes as the most abundant wax component were
recovered by rinsing needles for 60 seconds in dichloromethane (DCM), which resembles
standard techniques using chloroform (Radler and Horn, 1965). After removal of the
epicuticular wax lipids, needles were ground to a fine powder using a ball mill (Retsch
M200). Internal waxes were recovered by standard Soxhlet extraction using a mixture of
DCM/Methanol (93:7) (Wiesenberg et al., 2010). Extracts of internal and epicuticular waxes
were dried and sequentially separated using solid-phase extraction into lipid fractions
including fatty acid and alkane fractions (Wiesenberg et al., 2010). The following section only
discusses the results of the alkane fraction as a representative component of epicuticular wax
lipids and the fatty acids of internal lipids as the dominant compound class of cell membranes.
Other fractions were also analyzed, but no significant differences in their distribution patterns
were obtained. Aliquots of deuteriated standards (D39C20 acids and D50C24 alkane,
respectively) were added to the lipid fractions for compound identification and quantification.
Fatty acid fractions were derivatized using BSTFA (N,O- Bis (trimethylsilyl)
trifluoroacetamide) for 1h at 80°C, whereas alkanes did not require any further preparation.
All fractions were measured using gas chromatography coupled with flame ionization
detection (Agilent 7890).
In addition to lipid distribution patterns, molecular proxies were also determined to
evaluate the differences between provenances and climate manipulations. The average chain
length (ACL) of lipids is influenced by lipid biosynthesis and regulates the water repellency
of hydrophobic hydrocarbon chains of fatty acids in cell membranes as well as fatty acids and
alkanes in epicuticular waxes (Kolattukudy et al., 1976). Initially, the ACL was used to
differentiate plant and microbial sources of organic matter in terrestrial sediments (Bray and
Evans, 1961):
ACL = Σ (zn * n) / Σ (zn) (2)
where n is the number of carbons and zn the amount of fatty acids or alkanes with n
carbons. Another parameter to obtain the differences in the lipid biosynthesis as affected by
environmental stress is the predominance of odd versus even alkanes, the so-called carbon
preference index (CPI: Kolattukudy et al., 1976):
CPI = [(Σ n-C25-33 odd / Σ n-C24-32 even) + (Σ n-C25-33 odd / Σ n-C26-34 even)]/2 (3)
The degradation of alkanes and a less effective synthesis of the predominant odd alkanes in
waxes lead to a reduction of the CPI under environmental stress (Wiesenberg et al., 2008).
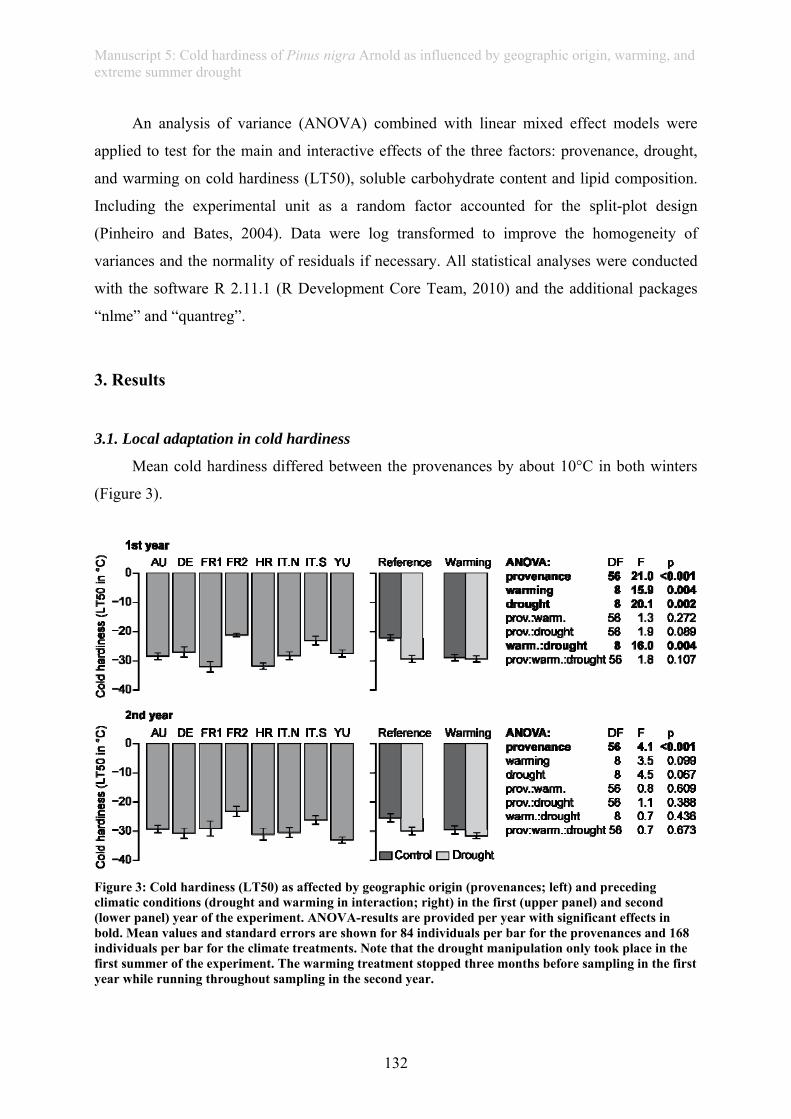
Manuscript 5: Cold hardiness of Pinus nigra Arnold as influenced by geographic origin, warming, and extreme summer drought
132
An analysis of variance (ANOVA) combined with linear mixed effect models were
applied to test for the main and interactive effects of the three factors: provenance, drought,
and warming on cold hardiness (LT50), soluble carbohydrate content and lipid composition.
Including the experimental unit as a random factor accounted for the split-plot design
(Pinheiro and Bates, 2004). Data were log transformed to improve the homogeneity of
variances and the normality of residuals if necessary. All statistical analyses were conducted
with the software R 2.11.1 (R Development Core Team, 2010) and the additional packages
“nlme” and “quantreg”.
3. Results
3.1. Local adaptation in cold hardiness
Mean cold hardiness differed between the provenances by about 10°C in both winters
(Figure 3).
Figure 3: Cold hardiness (LT50) as affected by geographic origin (provenances; left) and preceding climatic conditions (drought and warming in interaction; right) in the first (upper panel) and second (lower panel) year of the experiment. ANOVA-results are provided per year with significant effects in bold. Mean values and standard errors are shown for 84 individuals per bar for the provenances and 168 individuals per bar for the climate treatments. Note that the drought manipulation only took place in the first summer of the experiment. The warming treatment stopped three months before sampling in the first year while running throughout sampling in the second year.
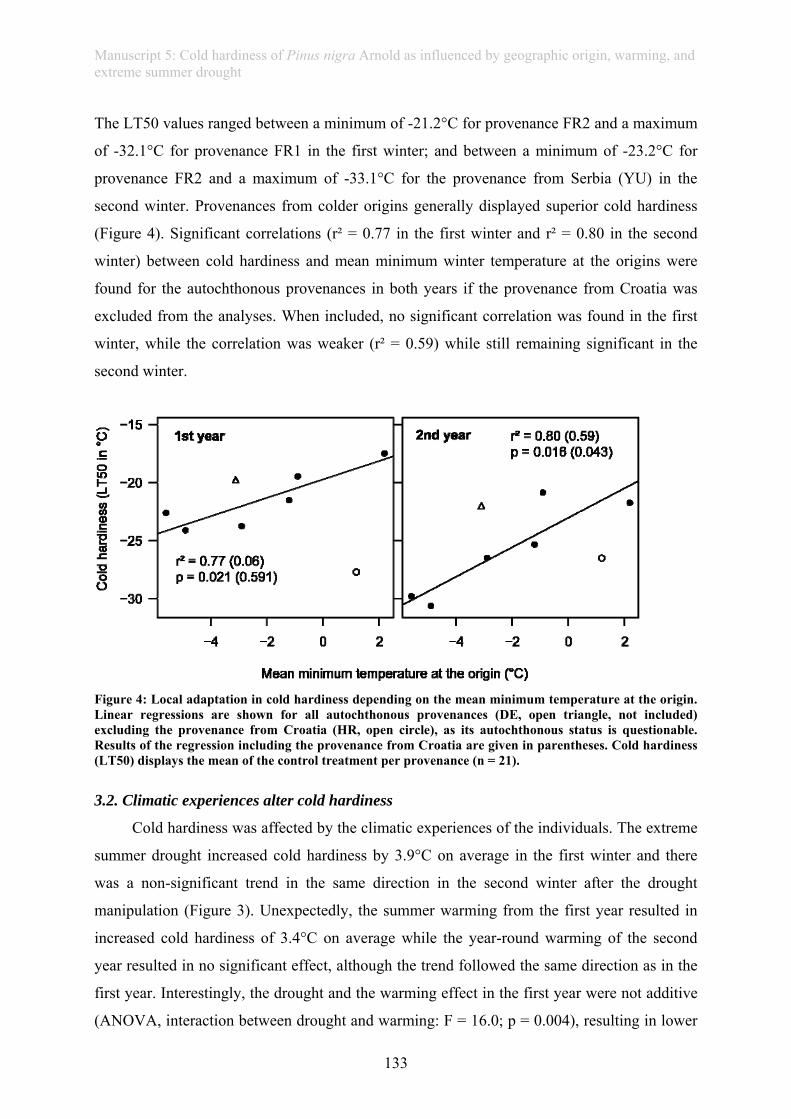
Manuscript 5: Cold hardiness of Pinus nigra Arnold as influenced by geographic origin, warming, and extreme summer drought
133
The LT50 values ranged between a minimum of -21.2°C for provenance FR2 and a maximum
of -32.1°C for provenance FR1 in the first winter; and between a minimum of -23.2°C for
provenance FR2 and a maximum of -33.1°C for the provenance from Serbia (YU) in the
second winter. Provenances from colder origins generally displayed superior cold hardiness
(Figure 4). Significant correlations (r² = 0.77 in the first winter and r² = 0.80 in the second
winter) between cold hardiness and mean minimum winter temperature at the origins were
found for the autochthonous provenances in both years if the provenance from Croatia was
excluded from the analyses. When included, no significant correlation was found in the first
winter, while the correlation was weaker (r² = 0.59) while still remaining significant in the
second winter.
Figure 4: Local adaptation in cold hardiness depending on the mean minimum temperature at the origin. Linear regressions are shown for all autochthonous provenances (DE, open triangle, not included) excluding the provenance from Croatia (HR, open circle), as its autochthonous status is questionable. Results of the regression including the provenance from Croatia are given in parentheses. Cold hardiness (LT50) displays the mean of the control treatment per provenance (n = 21).
3.2. Climatic experiences alter cold hardiness
Cold hardiness was affected by the climatic experiences of the individuals. The extreme
summer drought increased cold hardiness by 3.9°C on average in the first winter and there
was a non-significant trend in the same direction in the second winter after the drought
manipulation (Figure 3). Unexpectedly, the summer warming from the first year resulted in
increased cold hardiness of 3.4°C on average while the year-round warming of the second
year resulted in no significant effect, although the trend followed the same direction as in the
first year. Interestingly, the drought and the warming effect in the first year were not additive
(ANOVA, interaction between drought and warming: F = 16.0; p = 0.004), resulting in lower
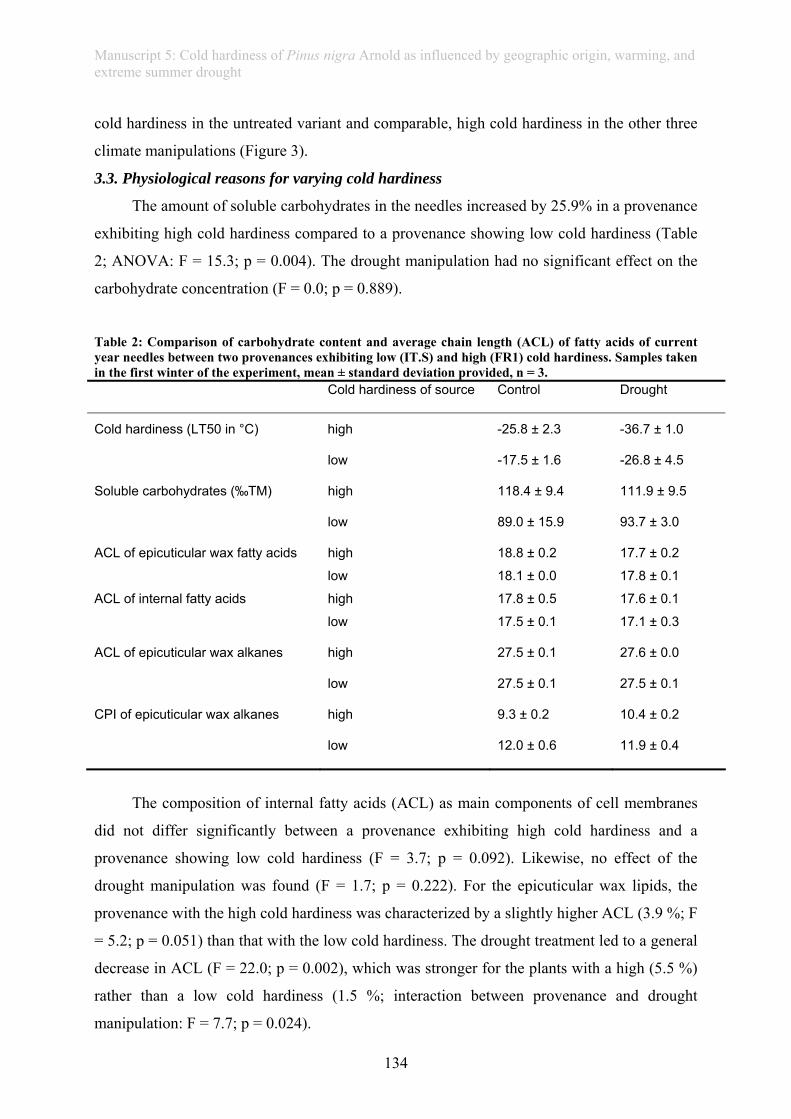
Manuscript 5: Cold hardiness of Pinus nigra Arnold as influenced by geographic origin, warming, and extreme summer drought
134
cold hardiness in the untreated variant and comparable, high cold hardiness in the other three
climate manipulations (Figure 3).
3.3. Physiological reasons for varying cold hardiness
The amount of soluble carbohydrates in the needles increased by 25.9% in a provenance
exhibiting high cold hardiness compared to a provenance showing low cold hardiness (Table
2; ANOVA: F = 15.3; p = 0.004). The drought manipulation had no significant effect on the
carbohydrate concentration (F = 0.0; p = 0.889).
Table 2: Comparison of carbohydrate content and average chain length (ACL) of fatty acids of current year needles between two provenances exhibiting low (IT.S) and high (FR1) cold hardiness. Samples taken in the first winter of the experiment, mean ± standard deviation provided, n = 3. Cold hardiness of source Control Drought
Cold hardiness (LT50 in °C) high -25.8 ± 2.3 -36.7 ± 1.0
low -17.5 ± 1.6 -26.8 ± 4.5
Soluble carbohydrates (‰TM) high 118.4 ± 9.4 111.9 ± 9.5
low 89.0 ± 15.9 93.7 ± 3.0
ACL of epicuticular wax fatty acids high 18.8 ± 0.2 17.7 ± 0.2
low 18.1 ± 0.0 17.8 ± 0.1
ACL of internal fatty acids high 17.8 ± 0.5 17.6 ± 0.1
low 17.5 ± 0.1 17.1 ± 0.3
ACL of epicuticular wax alkanes high 27.5 ± 0.1 27.6 ± 0.0
low 27.5 ± 0.1 27.5 ± 0.1
CPI of epicuticular wax alkanes high 9.3 ± 0.2 10.4 ± 0.2
low 12.0 ± 0.6 11.9 ± 0.4
The composition of internal fatty acids (ACL) as main components of cell membranes
did not differ significantly between a provenance exhibiting high cold hardiness and a
provenance showing low cold hardiness (F = 3.7; p = 0.092). Likewise, no effect of the
drought manipulation was found (F = 1.7; p = 0.222). For the epicuticular wax lipids, the
provenance with the high cold hardiness was characterized by a slightly higher ACL (3.9 %; F
= 5.2; p = 0.051) than that with the low cold hardiness. The drought treatment led to a general
decrease in ACL (F = 22.0; p = 0.002), which was stronger for the plants with a high (5.5 %)
rather than a low cold hardiness (1.5 %; interaction between provenance and drought
manipulation: F = 7.7; p = 0.024).
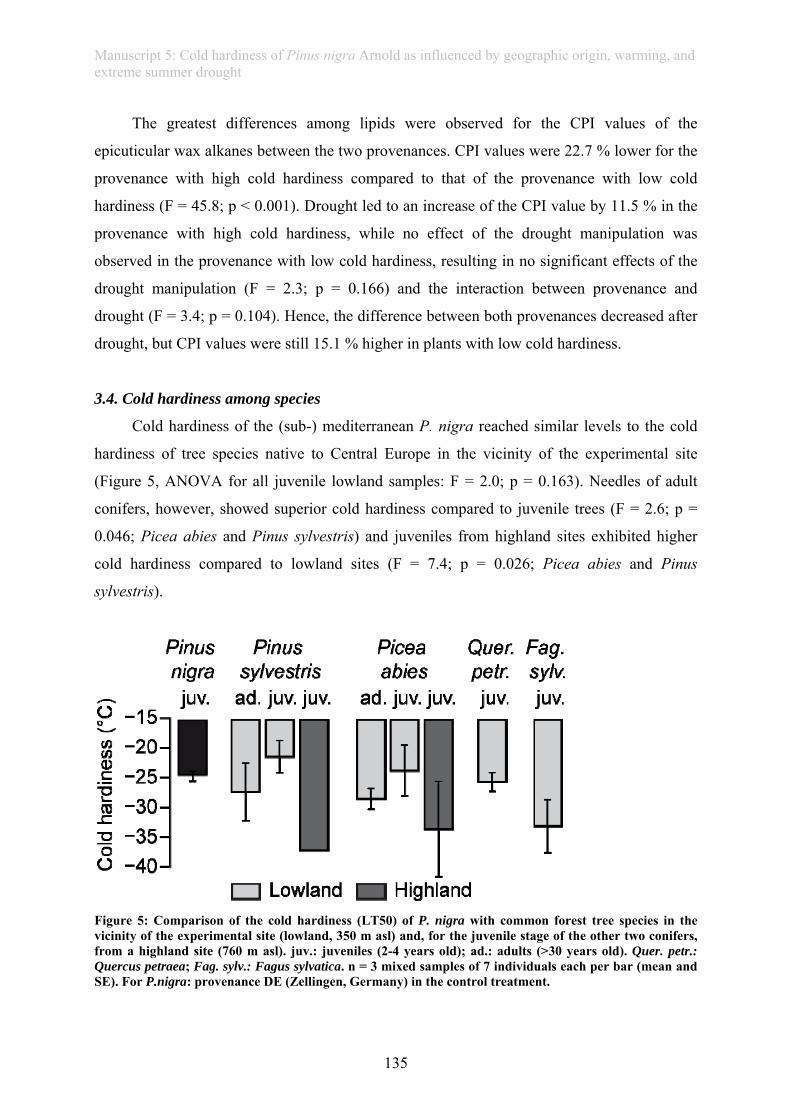
Manuscript 5: Cold hardiness of Pinus nigra Arnold as influenced by geographic origin, warming, and extreme summer drought
135
The greatest differences among lipids were observed for the CPI values of the
epicuticular wax alkanes between the two provenances. CPI values were 22.7 % lower for the
provenance with high cold hardiness compared to that of the provenance with low cold
hardiness (F = 45.8; p < 0.001). Drought led to an increase of the CPI value by 11.5 % in the
provenance with high cold hardiness, while no effect of the drought manipulation was
observed in the provenance with low cold hardiness, resulting in no significant effects of the
drought manipulation (F = 2.3; p = 0.166) and the interaction between provenance and
drought (F = 3.4; p = 0.104). Hence, the difference between both provenances decreased after
drought, but CPI values were still 15.1 % higher in plants with low cold hardiness.
3.4. Cold hardiness among species
Cold hardiness of the (sub-) mediterranean P. nigra reached similar levels to the cold
hardiness of tree species native to Central Europe in the vicinity of the experimental site
(Figure 5, ANOVA for all juvenile lowland samples: F = 2.0; p = 0.163). Needles of adult
conifers, however, showed superior cold hardiness compared to juvenile trees (F = 2.6; p =
0.046; Picea abies and Pinus sylvestris) and juveniles from highland sites exhibited higher
cold hardiness compared to lowland sites (F = 7.4; p = 0.026; Picea abies and Pinus
sylvestris).
Figure 5: Comparison of the cold hardiness (LT50) of P. nigra with common forest tree species in the vicinity of the experimental site (lowland, 350 m asl) and, for the juvenile stage of the other two conifers, from a highland site (760 m asl). juv.: juveniles (2-4 years old); ad.: adults (>30 years old). Quer. petr.: Quercus petraea; Fag. sylv.: Fagus sylvatica. n = 3 mixed samples of 7 individuals each per bar (mean and SE). For P.nigra: provenance DE (Zellingen, Germany) in the control treatment.
Manuscript 5: Cold hardiness of Pinus nigra Arnold as influenced by geographic origin, warming, and extreme summer drought
136
3.5. Cold hardiness of roots
Cold hardiness of fine roots of P. nigra averaged -16.5°C. The two tested provenances
(IT.S and FR1) did not differ significantly (F = 1.6; p = 0.239) in the cold hardiness of their
roots in the second winter of the experiment (-15.4 ± 1.9°C and -17.5 ± 1.1°C respectively
(±1SE), n = 12). The drought (F = 0.1; p = 0.805) and warming (F = 0.1; p = 0.754 )
treatments also resulted in no significant effect on LT50 of the fine roots.
4. Discussion
4.1. Local adaptation in cold hardiness
Cold hardiness differed by about 10°C between the studied provenances of P. nigra.
Local adaptation to minimum temperature regimes was indicated as provenances from colder
origins reached superior cold hardiness. These results correspond well with findings from
other forest trees such as P. devoniana (Saenz-Romero and Tapia-Olivares, 2008), Fagus
sylvatica (Visnjic and Dohrenbusch, 2004), Tsuga heterophylla (Kuser and Ching, 1980),
Fagus crenata and Betula ermanii (Gansert et al., 1999), all showing local adaptation to
winter cold extremes. Our data indicates further that minimum temperature does not only
determine the northern range limits of species (Sakai and Weiser, 1973), but that within
species variability in cold hardiness also needs to be taken into account. The provenance from
Croatia (HR), however, did not fit well into the overall pattern. We assume that this
provenance is either not autochthonous, i.e. originating from a warmer winter climate, or
belongs to the subspecies dalmatica, which is described for very restricted areas along the
Croatian coast. Genetic characterization of the species and subspecies will shed light on this
question.
P. nigra is known for its high genetic diversity (Jagielska et al., 2007) which surpasses
that of other pines (Nkongolo et al., 2002). Although no consensus on its taxonomy has been
reached (Huber, 2011), six main subspecies are recognized with P. nigra ssp nigra being the
most abundant in Europe (Isajev et al., 2004). Provenances furthermore differ in growth and
ecological performance, expressed in local adaptations to soil and mean annual temperature
and precipitation in provenance trials (Varelides et al., 2001). The strongly contrasting cold
hardiness in our experiment suggests that minimum temperature is another genetically
selective parameter, not only for frost sensitive subspecies such as P. nigra ssp laricio
(Varelides et al., 2001), but also for P. nigra ssp nigra, which is usually considered to be the
most frost tolerant among the subspecies (Isajev et al., 2004, Huber, 2011).
Manuscript 5: Cold hardiness of Pinus nigra Arnold as influenced by geographic origin, warming, and extreme summer drought
137
4.2. Climatic experiences alter cold hardiness
Cold hardiness was affected by climatic experiences of the individuals with drought
increasing cold hardiness by 3.9°C on average in the subsequent winter and no significant
carry-over effect to the second winter. This finding can be explained by drought and frost
triggering similar responses at the cellular and molecular level to prevent cellular dehydration
(Blodner et al., 2005). Without experiencing drought themselves, the newly formed needles in
the second year of the experiment lacked significant additional cold hardiness in the drought
manipulation. More frequent drought events accompanying climate change may therefore
increase cold hardiness in single (dry) years, but not generally.
It has been suggested that trees grown under generally warmer conditions may lose their
functional adaptations to frost (Eccel et al., 2009). Surprisingly, our results contradict this
expectation with increased cold hardiness by 3.4°C on average in the warming treatment after
the first season. The warming, however, was stopped in October and acclimation of the
formerly warmed individuals evidently surpassed the control plants when subjected to the
same temperature from October on. Responsiveness to current year climates are also reported
for deciduous forest trees (Repo et al., 2008). Yet, the year-round warming in the second year
of the experiment resulted in no significant difference between the treatments. Clearly, further
experiments on interacting climatic drivers are urgently needed, as the response to such
interactions might differ considerably from single factor experiments (Shaw et al., 2002;
Kreyling et al., 2011b).
Here, we focused on the realized maximum frost hardiness, e.g. the hardiness directly
after the coldest days of winter. Much bigger differences than observed between the
provenances (10°C) or between the climate manipulations (up to 3.9°C) occur within each
needle over the course of the year (more than 60°C in a single provenance of P. nigra;
Sutinen et al., 1992). Cues which drive this strong seasonality involve photoperiod and
minimum temperature experience. Their relative importance, however, is still unresolved,
differs between species (Kozlowski and Pallardy, 2002; Holliday et al., 2008) and may even
differ between provenances in the same species. Our results add to this discussion by showing
that both genetic heritage (differences between the provenances) and preceding climatic
experience (here mainly summer drought) can affect the absolute frost hardiness. Potential
differences in the temporal pattern of frost hardiness between provenances are of high
ecological relevance, especially with regard to early or late frost events and phenological
differences within species (Visnjic and Dohrenbusch, 2004; Kreyling et al. 2011b). These
Manuscript 5: Cold hardiness of Pinus nigra Arnold as influenced by geographic origin, warming, and extreme summer drought
138
points call for more detailed investigations on intra-specific differences in seasonality of frost
hardiness.
4.3. Physiological reasons for different cold hardiness
Differential cold hardiness between provenances was related to contents of soluble
carbohydrates and fatty acids in the needles. Content of soluble carbohydrates is also reported
to be closely related to local adaptations in cold hardiness of different Quercus species (Morin
et al., 2007). The lipid contents of P. nigra have been reported previously for mature trees and
needles collected during late summer (Maffei et al., 2004). In contrast to these mature trees,
where n-C29 and n-C31 alkanes contribute 2.2 % and 37.2 %, respectively, to total alkanes, the
juveniles of different provenances in our study were all dominated by n-C29 alkane (36.3 ± 2.8
%) and lower contents of n-C31 alkane (9.6 ± 1.0 %). This difference is probably due to
different needle and plant age when compared to the literature results, whereas differences
between provenances are not likely as they did not differ in their relative contribution of n-C29
and n-C31 alkanes in our study. In general, the hydrophobicity of the waxes is improved under
water and cold stress to protect plants against water loss by an increased turnover of wax
components towards hydrophobic aliphatic compounds which is not necessarily related to
shifts in the total amount of waxes (Shepherd and Griffiths, 2006). For trees, such
investigations are still scarce and limited to selected tree species (e.g. for different Picea
species: Cape and Percy, 1993; or Pinus palustris: Prior et al., 1997). Our observations of
small changes in the lipid composition (ACL values) confirm minor influences of cold and
water stress on lipid biosynthesis, as described elsewhere (Cape and Percy, 1993; Shepherd
and Griffiths, 2006). The low CPI values of epicuticular wax alkanes of the plants with high
cold hardiness, however, indicate a strong biosynthesis rate associated by a production of
byproducts and degradation products such as even alkanes. This increased production of wax
components indicates the role of alkanes to improve the cold hardiness (Prior et al., 1997).
The drought manipulation led to a reduction in the formation rates of alkanes (higher CPI) for
the provenance with higher cold hardiness similar as observed for sesame plants (Kim et al.,
2007). Hence, biosynthesis of epicuticular wax alkanes is influenced by water stress and
appears to be related to cold hardiness in P. nigra. Freezing tolerance in plants is
accompanied by lipid remodeling at the outer membrane (Moellering et al. 2010), another
aspect fitting well to our data and indicating that the effect of changes in the lipid composition
might be more important for cold hardening than previously assumed. It should be noted,
though, that both the observed differences in cold hardiness and the differences in
Manuscript 5: Cold hardiness of Pinus nigra Arnold as influenced by geographic origin, warming, and extreme summer drought
139
composition and concentrations of cell membrane compounds could be driven by other
factors such as water stress over summer in the provenance with superior frost hardiness.
Seasonality of precipitation and mean annual precipitation were three times lower at the
origin of this provenance (Table 1). Further causal and functional analyses of frost hardiness
and hardening are clearly required (Holliday et al., 2008).
4.4. Cold hardiness among species
Juveniles of the (sub-) mediterranean species P. nigra exhibited comparable cold
hardiness as juveniles of species native to Central Europe in the vicinity of the experiment,
i.e. under the same climatic conditions. Under colder conditions in Norway it has been shown
that P. nigra is more sensitive to freezing injury than boreal conifers (Strimbeck et al., 2007).
Its ability to adjust to prevailing climatic conditions therefore appears limited in comparison
to boreal species such as P. sylvestris or Picea abies. Yet, under the same climatic conditions,
these species did not differ from P. nigra in our study, implying that realized frost hardiness
and potential frost hardiness need to be discussed separately. It should be emphasized here
that within-species variation in cold hardiness, i.e. differences among provenances of P. nigra
and differences between lowland and highland sites or juvenile and adult individuals for the
other species clearly exceeded among-species variation at the juvenile stage. Generally,
variation among species at the same site and under the same climatic conditions appears less
important than commonly assumed. Within-species variation and individual performance
might be more relevant for forest ecology (Clark, 2010).
We used juvenile trees in their second to third year in this experiment. Our results
concerning P. sylvestris and Picea abies confirm previous findings that seedlings are more
sensitive against frost events than older trees (Bolte et al., 2007). However, the juvenile stage
is of high importance for the natural regeneration of forest stands. Moreover, the high
selective pressure of single extreme events such as frost or drought can reduce the genetic
diversity of future stands (Hosius et al., 2006).
4.5. Cold hardiness of roots
Cold hardiness of fine roots of P. nigra averaged -16.5°C over two provenances, which
is a high value compared to the cold hardiness of its foliage (-23.8°C on average for the
control treatment). This might be an adaptation to the species’ natural habitat where soil frost
events occur more or less regularly as no snow cover insulates the soil against air temperature
fluctuations (Kreyling, 2010). Chamaecyparis nootkatensis serves as an example of a forest
Manuscript 5: Cold hardiness of Pinus nigra Arnold as influenced by geographic origin, warming, and extreme summer drought
140
tree from temperate rain-forests with low root cold hardiness (roots do not survive
temperatures below -5°C) in response to deep snow cover in its natural habitat (Schaberg et
al., 2008a). Winter climate change, however, is expected to lead to reduced snow cover and,
in consequence of the reduced insulation, to colder soils despite the general air warming trend
(Groffman et al., 2001). For Central Europe, a reduction in snow cover is already taking
place, while minimum temperature of the soil may not decrease (Kreyling and Henry, 2011).
Interestingly, no response in cold hardiness of fine roots occurred for the different climate
treatments in our experiment. In addition, we investigated root cold hardiness for two
provenances with strongly contrasting shoot cold hardiness and did not find significant
differences in the roots. This supports Schaberg et al. (2008a) who conclude that no
acclimation occurs in cold hardiness of fine roots. More detailed investigations concerning
this aspect are clearly needed, especially with respect to the question if cold hardiness of roots
lacks adaptive potential to changing climate conditions. For P. nigra our results imply that no
selective pressure is expected as root cold tolerance is generally high.
4.6. Assisted colonization
P. nigra, based on its ecology and natural distribution (Isajev et al., 2004), is well
adapted to warmer and drier conditions expected for parts of Central Europe under climate
change (Kölling, 2007, Huber, 2011). Here, we show that cold hardiness, at least of some
provenances, is also no limitation for the use of this species in Central Europe even if cold
extremes remain constant throughout this century (Vavrus et al., 2006; Kodra et al., 2011).
Assisted colonization or transplantations are widely applied in forestry and may serve as
adaptation strategy against adverse effects of climate change on ecosystem functioning
(McKenney et al., 2009, Schaberg et al., 2008b). Numerous examples of failed
transplantations (Zobel et al., 1987), however, warn against rushed action. The assisted
colonization of pre-adapted ecotypes of key species within their current range is suggested to
contribute to functional integrity of forest stands without the need to introduce exotic species
with unknown risks (Kreyling et al., 2011a). Yet, naturally dominating tree species may lack
pre-adapted ecotypes at their warm and dry range limits. Here, congeneric species from
adjacent climates are preferable over other species. P. sylvestris and P. nigra may serve as an
example, with the latter potentially replacing the former at warmest and driest sites of its
range while maintaining ecosystem functioning. Our results suggest that cold hardiness is
significantly related to climatic conditions at the origin of the provenances, implying that the
Manuscript 5: Cold hardiness of Pinus nigra Arnold as influenced by geographic origin, warming, and extreme summer drought
141
selection of frost-tolerant provenances could be based on the current climatic conditions
within the species ranges. However, our finding that climatic experiences within the life of
single plants alter cold hardiness indicates that provenance trials under control conditions may
be misleading under changing climatic mean and extreme conditions. The multitude of
possible climatic variables to be selected for and uncertainties concerning future climates
imply that the search for best-adapted provenances should not be the only strategy. In
addition, management actions which promote genetic diversity (e.g. supporting natural
regeneration and addition of genetically diverse material) are crucial as genetic diversity
enables organisms to continue adapting and evolving to new conditions within one or several
generation cycles (Hosius et al., 2006; Schaberg et al., 2008b). Furthermore, the role of
herbivores and diseases under changing climate requires detailed investigations. For instance,
a needle blight known as the “red band disease” (Dothistroma septospora) is reported to
increase in importance over recent years in P. nigra (Isajev et al., 2004), a development that
may be related to climate change (Watt et al., 2011).
Ultimately, tree species responses should be regarded in the context of populations
under competitive pressure. The advantage of common garden experiments is that they can
detect the spectrum of possible species-specific responses. Nevertheless, there is a need to test
the obtained results in communities where the competitive balance might amplify or buffer
responses.
5. Conclusions
Cold hardiness of Pinus nigra foliage is highly variable between provenances and
shows signs of local adaptation to prevailing minimum temperatures at the origin. Both severe
drought events and summer warming can increase cold hardiness, indicating that the
interaction of different climate parameters leads to unexpected results and that winter survival
can be altered by climatic events during the growing season. Physiologically, cold hardiness
is related to soluble carbohydrate content and lipid composition. Interestingly, variation of
cold hardiness of the needles within the (sub-) mediterranean species P. nigra was higher than
between this species and other species common to the temperate zone of Central Europe.
Taken together, our results imply that the cold hardiness of the foliage of P. nigra is adaptive
to long-term growing conditions at the origin (genetic heritage) and to short-term alterations
of these conditions (individual plasticity), while first hints suggest that cold hardiness of the
Manuscript 5: Cold hardiness of Pinus nigra Arnold as influenced by geographic origin, warming, and extreme summer drought
142
roots is high and probably not under selective pressure currently. Our data from mid-winter
suggests that below- and above-ground cold hardiness of selected provenances appear to be
well adapted to cultivation in temperate regions as an adaptation strategy against the adverse
effects of climate change in dry habitats. However, with respect to late spring and early
autumn frost events, the temporal pattern of frost hardiness with potential intra-specific
differences should be investigated in more detail. Before translocations are recommended,
further investigations are required, e.g. exploring the role of biotic interactions under
changing climatic conditions. Generally, within-species diversity should be conserved at the
species level and improved in anthropogenically founded stands in order to allow for adaption
to climate change.
6. Acknowledgements: This study was funded by the Oberfrankenstiftung (OFra_02631) in
cooperation with the "Bavarian Climate Programme 2020" in the joint research center
“FORKAST” and the Bavarian State Ministry of the Environment and Public Health
(ZKL01Abt7_18456). We thank Christian Schemm, Elke König, Stefan König, Christine Pilsl
and numerous student workers and interns for their outstanding help during the field work.
References: Anderson, J.A., Kenna, M.P., Taliaferro, C.M., 1988. Cold hardiness of Midiron and Tifgreen bermudagrass.
Hortscience 23, 748–750. Bakht, J., Bano, A., Dominy, P., 2006. The role of abscisic acid and low temperature in chickpea (Cicer
arietinum) cold tolerance. II. Effects on plasma membrane structure and function. J Exp Bot 57, 3707–3715. Bigras, F.J., Ryyppo, A., Lindstrom, A., Sattin, E., 2001. Cold acclimation and deacclimation of shoots and roots
of conifer seedlings. In: Bigras, F.J., Colombo, S.J. (Eds.), Conifer cold hardiness. Kluwer, Dordrecht, pp. 57–88.
Blodner, C., Skroppa, T., Johnsen, O., Polle, A., 2005. Freezing tolerance in two Norway spruce (Picea abies [L.] Karst.) progenies is physiologically correlated with drought tolerance. J Plant Physiol 162, 549–558.
Bolte, A., Czajkowski, T., Kompa, T., 2007. The north-eastern distribution range of European beech - a review. Forestry 80, 413–429.
Bray, E., Evans, E., 1961. Distribution of n-paraffins as a clue to the recognition of source beds. Geochim Cosmochim Acta 22, 2–15.
Cape, J.N., Percy, K.E., 1993. Environmental-influences on the development of spruce needle cuticles. New Phytol 125, 787–799.
Clark, J.S., 2010. Individuals and the variation needed for high species diversity in forest trees. Science 327, 1129–1132.
Eccel, E., Rea, R., Caffarra, A., Crisci, A., 2009. Risk of spring frost to apple production under future climate scenarios: the role of phenological acclimation. Int J Biometeorol 53, 273–286.
Gansert, D., Backes, K., Kakubari, Y., 1999. Altitudinal and seasonal variation of frost resistance of Fagus crenata and Betula ermanii along the Pacific slope of Mt. Fuji, Japan. J Ecol 87, 382–390.
Groffman, P.M., Driscoll, C.T., Fahey, T.J., Hardy, J.P., Fitzhugh, R.D., Tierney, G.L., 2001. Colder soils in a warmer world: A snow manipulation study in a northern hardwood forest ecosystem. Biogeochemistry 56, 135–150.
Hijmans, R.J., Cameron, S.E., Parra, J.L., Jones, P.G., Jarvis, A., 2005. Very high resolution interpolated climate surfaces for global land areas. Int J Climatol 25, 1965–1978.
Manuscript 5: Cold hardiness of Pinus nigra Arnold as influenced by geographic origin, warming, and extreme summer drought
143
Holliday, J.A., Ralph, S.G., White, R., Bohlmann, J., Aitken, S.N., 2008. Global monitoring of autumn gene expression within and among phenotypically divergent populations of Sitka spruce (Picea sitchensis). New Phytol 178, 103–122.
Hosius, B., Leinemann, L., Konnert, M., Bergmann, F., 2006. Genetic aspects of forestry in the central Europe. Europ J Forest Res 125, 407–417.
Huber, G., 2011. Internationaler Bayerischer Schwarzkiefern-Herkunftsversuch 2009/2010 - Neue Tests für Schwarzkiefern-Herkünfte in Bayern im Hinblick auf den Klimawandel. Forstarchiv, in press.
Isajev, V., Fady, B., Semerci, H., Andonovski, V., 2004. EUFORGEN Technical Guidelines for genetic conservation and use for European black pine (Pinus nigra). International Plant Genetic Resources Institute, Rome, Italy.
Jagielska, A., Cwalina, M., Prus-Glowacki, W., 2007. Genetic diversity of the black pine‘s stands (Pinus nigra) Arn. Sylwan 151, 23–31.
Jalili, A., Jamzad, Z., Thompson, K., Araghi, M.K., Ashrafi, S., Hasaninejad, M., Panahi, P., Hooshang, N., Azadi, R., Tavakol, M.S., Palizdar, M., Rahmanpour, A., Farghadan, F., Mirhossaini, S.G., Parvaneh, K., 2010. Climate change, unpredictable cold waves and possible brakes on plant migration. Global Ecol Biogeogr 19, 642–648.
Kim, K.S., Park, S.H., Jenks, M.A., 2007. Changes in leaf cuticular waxes of sesame (Sesamum indicum L.) plants exposed to water deficit. J Plant Pysiol 164, 1134–1143.
Kleber, H.-P., Schlee, D., Schöpp, W., 1997. Biochemisches Praktikum. Methoden für Studium, Praxis, Forschung. G. Fischer, Jena.
Kodra, E., Steinhaeuser, K., Ganguly, A., 2011. (2011), Persisting cold extremes under 21st-century warming scenarios. Geophys Res Lett, doi:10.1029/2011GL047103.
Koenker, R., 2006. Quantile Regression. R package version 4.02. http://www.r-project.org. Kolattukudy, P., Croteau, R., Buckner, J., 1976. Biochemistry of plant waxes. In: Kolattukudy, P. (Ed.),
Chemistry and Biochemistry of Natural Waxes. Elsevier, Amsterdam, pp. 290–347. Kölling, C., 2007. Klimahüllen für 27 Waldbäume. AFZ - Der Wald 23, 1242–1245. Kreyling, J., 2010. Winter climate change: a critical factor for temperate vegetation performance. Ecology 91,
1939–1948. Kreyling, J., Bittner, T., Jaeschke, A., Jentsch, A., Steinbauer, M.J., Thiel, D., Beierkuhnlein, C., 2011a. Assisted
colonization - a question of focal units and recipient localities. Restor Ecol 19, 433-440. Kreyling, J., Henry, H.A.L., 2011. Vanishing winters in Germany: soil frost dynamics and snow cover trends,
and ecological implications. Clim Res 46, 269–276. Kreyling, J., Thiel, D., Nagy, L., Jentsch, A., Huber, G., Konnert, M., Beierkuhnlein, C., 2011b. Late frost
sensitivity of juvenile Fagus sylvatica L. differs between southern Germany and Bulgaria and depends on preceding air temperature. Europ J Forest Res, DOI: 10.1007/s10342-011-0544-y.
Korner, C, Paulsen, J. 2004. A world-wide study of high altitude treeline temperatures. J Biogeogr 31: 713–732. Kozlowski, T.T., Pallardy, S.G., 2002. Acclimation and adaptive responses of woody plants to environmental
stresses. Bot Rev 68, 270–334. Kuser, J.E., Ching, K.K., 1980. Provenance variation in phenology and cold hardiness of western hemlock
seedlings. Forest Sci 26, 463–470. Maffei, M., Badino, S., Bossi, S., 2004. Chemotaxonomic significance of leaf wax n-alkanes in the Pinales
(Coniferales). Journal of Biological Research 1, 3–19. Mancuso, S., 2000. Electrical resistance changes during exposure to low temperature measure chilling and
freezing tolerance in olive tree (Olea europaea L.) plants. Plant Cell Environ 23, 291–299. McKenney, D., Pedlar, J., O‘Neill, G., 2009. Climate change and forest seed zones: Past trends, future prospects
and challenges to ponder. Forest Chron 85, 258–266. Moellering, E.R., Muthan, B., Benning, C., 2010. Freezing tolerance in plants requires lipid remodeling at the
outer chloroplast membrane. Science 330, 226–228. Morin, X., Ameglio, T., Ahas, R., Kurz-Besson, C., Lanta, V., Lebourgeois, F., Miglietta, F., Chuine, I., 2007.
Variation in cold hardiness and carbohydrate concentration from dormancy induction to bud burst among provenances of three European oak species. Tree Physiol 27, 817–825.
Nkongolo, K.K., Michael, P., Gratton, W.W., 2002. Identification and characterization of RAPD markers inferring genetic relationships among Pine species. Genome 45, 51–58.
Parmesan, C., Yohe, G., 2003. A globally coherent fingerprint of climate change impacts across natural systems. Nature 421, 37–42.
Pinheiro, J.C., Bates, D.M., 2004. Mixed-effects models in S and S-PLUS. Springer, New York. Prior, S.A., Pritchard, S.G., Runion, G.B., Rogers, H.H., Mitchell, R.J., 1997. Influence of atmospheric CO2
enrichment, soil N, and water stress on needle surface wax formation in Pinus palustris (Pinaceae). Am J Bot 84, 1070–1077.
Manuscript 5: Cold hardiness of Pinus nigra Arnold as influenced by geographic origin, warming, and extreme summer drought
144
R Development Core Team, 2010. [R: A Language and Environment for Statistical Computing. R version 2.11.1. R Foundation for Statistical Computing. ISBN 3-900051-07-0, URL http://www.R-project.org, Vienna, Austria.
Radler, F., Horn, D.H., 1965. Composition of grape cuticle wax. Aust J Chem 18, 1059-&. Repo, T., Mononen, K., Alvila, L., Pakkanen, T.T., Hanninen, H., 2008. Cold acclimation of pedunculate oak
(Quercus robur L.) at its northernmost distribution range. Environ Exp Bot 63, 59–70. Saenz-Romero, C., Tapia-Olivares, B.L., 2008. Genetic variation in frost damage and seed zone delineation
within an altitudinal transect of Pinus devoniana (P. michoacana) in Mexico. Silva Genet 57, 165–170. Sakai, A., Weiser, C.J., 1973. Freezing resistance of trees in North America with reference to tree regions.
Ecology 54, 118–126. Schaberg, P.G., Hennon, P.E., D'Amore, D.V., Hawley, G.J., 2008a. Influence of simulated snow cover on the
cold tolerance and freezing injury of yellow-cedar seedlings. Glob Change Biol 14, 1282–1293. Schaberg, P.G., DeHayes, D.H., Hawley, G.J., Nijensohn, S.E., 2008b. Anthropogenic alterations of genetic
diversity within tree populations: Implications for forest ecosystem resilience. Forest Ecol Manag 256, 855–862.
Schär, C, Vidale, PL, Luthi, D, Frei, C, Haberli, C, Liniger, MA, Appenzeller, C. 2004. The role of increasing temperature variability in European summer heatwaves. Nature 427: 332–336.
Shaw, M.R., Zavaleta, E.S., Chiariello, N.R., Cleland, E.E., Mooney, H.A., Field, C.B., 2002. Grassland responses to global environmental changes suppressed by elevated CO2. Science 298, 1987–1990.
Shepherd, T., Griffiths, D.W., 2006. The effects of stress on plant cuticular waxes. New Phytol 171, 469–499. Strimbeck, G.R., Kjellsen, T.D., Schaberg, P.G., Murakami, P.F., 2007. Cold in the common garden:
comparative low-temperature tolerance of boreal and temperate conifer foliage. Trees-Struct Funct 21, 557–567.
Sutinen, M.L., Palta, J.P., Reich, P.B., 1992. Seasonal differences in freezing stress resistance of needles of Pinus nigra and Pinus resinosa - evaluation of the electrolyte leakage method. Tree Physiol 11, 241–254.
Thomas, C.D., Cameron, A., Green, R.E., Bakkenes, M., Beaumont, L.J., Collingham, Y.C., Erasmus, B. F. N., de Siqueira, M. F., Grainger, A., Hannah, L., Hughes, L., Huntley, B., van Jaarsveld, A. S., Midgley, G.F., Miles, L., Ortega-Huerta, M.A., Peterson, A.T., Phillips, O.L., Williams, S.E., 2004. Extinction risk from climate change. Nature 427, 145–148.
Thomashow, M.F., 1999. Plant cold acclimation: Freezing tolerance genes and regulatory mechanisms. Ann Rev Plant Physiol Plant Molec Biol 50, 571–599.
Varelides, C., Brofas, G., Varelides, Y., 2001. Provenance variation in Pinus nigra at three sites in Northern Greece. Ann Forest Sci 58, 893–900.
Vavrus, S., Walsh, J.E., Chapman, W.L., Portis, D., 2006. The behavior of extreme cold air outbreaks under greenhouse warming. Int J Climatol 26, 1133–1147.
Visnjic, V.C., Dohrenbusch, A., 2004. Frost resistance and phenology of European beech provenances (Fagus sylvatica L. ). Allg Forst Jgdztg 175, 101–108.
Watt, M.S., Ganley, R.J., Kriticos, D.J., Manning, L.K., 2011. Dothistroma needle blight and pitch canker: the current and future potential distribution of two important diseases of Pinus species. Can J Forest Res 41, 412–424.
Wiesenberg, G.L.B., Schmidt, M.W.I., Schwark, L., 2008. Plant and soil lipid modifications under elevated atmospheric CO2 conditions: I. Lipid distribution patterns. Org Geochem 39, 91–102.
Wiesenberg, G.L.B., Gocke, M., Kuzyakov, Y., 2010. Fast incorporation of root-derived lipids and fatty acids into soil - Evidence from a short term multiple (CO2)-C-14 pulse labelling experiment. Org Geochem 41, 1049–1055.
Zobel, B.J., Wyk, G.v., Stahl, P., 1987. Growing Exotic Forests. Wiley, New York, N.Y.
Manuscript 6: Increased rainfall variability reduces biomass and forage quality of temperate grassland largely independent of mowing frequency
145
Manuscript 6: Increased rainfall variability reduces biomass and forage
quality of temperate grassland largely independent of mowing frequency Agriculture, Ecosystems and Environment, 2012, 148: 1-10.
Julia Waltera*, Kerstin Grantb∗, Carl Beierkuhnleinc, Jürgen Kreylingc, Michael Weberd, Anke
Jentschb
aConservation Biology, Helmholtz Centre for Environmental Research- UFZ, Permoserstraße 15, 04318 Leipzig,
Germany, [email protected], phone:+49-341-2351654, fax: :+49-341-2351470, corresponding author bDisturbance Ecology, Bayreuth University, 95440 Bayreuth, Germany cDepartment of Biogeography, Bayreuth University, 95440 Bayreuth, Germany dDepartment of Plant Physiology, Bayreuth University, 95440 Bayreuth, Germany
Highlights
1. Grassland was subjected to increased rainfall variability and mowing frequency.
2. Increased rainfall variability reduces grassland productivity and forage quality.
3. More frequent mowing initially increases and later on decreases productivity.
4. Mowing regime does mostly not interact with rainfall variability manipulations.
5. Sufficient overall rainfall amount is important for grassland resilience.
Abstract
Climate models indicate that global warming will stimulate atmospheric exchange
processes and increase rainfall variability, leading to longer dry periods and more intense
rainfall events. Recent studies suggest that both the magnitude of the rainfall events and their
frequency may be as important for temperate grassland productivity as the annual sum.
However, until now interactive effects between land management practice, such as mowing
frequency, and rainfall variability on productivity and forage quality have not been studied in
detail. Here, we present the data from a field experiment (EVENT II) in which a Central-
European grassland was subjected to increased spring rainfall variability (low, intermediate
and extreme rainfall variability without any change to the rainfall amount) and increased
mowing frequency (four times compared to twice a year). We assessed biomass production,
∗ authors contributed equally to the publication
Manuscript 6: Increased rainfall variability reduces biomass and forage quality of temperate grassland largely independent of mowing frequency
146
forage quality parameters, root-length and shoot-root ratio. Enhanced spring rainfall
variability reduced midsummer productivity and the leaf N and protein concentrations of a
target species, but did not exert any long-term effects on biomass production and forage
quality in late summer. However, the increased spring rainfall variability reduced
aboveground net primary productivity by 15 %. More frequent mowing increased productivity
in the first year of the study, but decreased productivity at the end of the second year, showing
a decline in the potential for overcompensation after a history of more intense mowing.
Generally, more frequent mowing decreased the shoot-root ratio and increased the
concentration of leaf N. Increased mowing frequency neither buffered, nor amplified the
adverse effects of rainfall variability on productivity, but made leaf N concentrations in early
summer more responsive to altered rainfall patterns. These results highlight the fact that even
relatively small and short-term alterations to rainfall distribution can reduce production and
forage quality, with little buffering capacity of altered mowing frequency. Comparisons with
productivity data from the first year of the study, in which both, rainfall distribution and
rainfall amount were modified, demonstrate the crucial role of sufficient moisture (annual
rainfall amount) for grassland resilience: In this first year, negative effects of extreme rainfall
variability lasted until the end of the year. To conclude, increased rainfall variability under
climate change will likely affect agricultural yield in temperate meadows. Management
strategies to buffer these effects have yet to be developed.
Keywords: EVENT II experiment, extreme weather event, rainout-shelter, forage quality,
Alopecurus pratensis, Trifolium pratense
1. Introduction
Climate change is projected to modify not only annual precipitation sum, but also to
result in more extreme rainfall regimes in many parts of the world (IPCC 2007; Jentsch and
Beierkuhnlein, 2008). This will cause more severe drought periods as well as an increase in
the frequency and magnitude of extreme precipitation events (Trenberth et al., 2003, Min et
al., 2011). Evidence is mounting that the frequency and severity of droughts and extreme
precipitation events has already increased over recent decades in many regions (Blenkinsop
and Fowler, 2007; Haylock and Goodess, 2004; IPCC 2007).
Primary productivity and ecosystem functioning in terrestrial ecosystems are strongly
influenced by the annual amount of precipitation (Sala et al., 1988). However, recent research
suggests that rainfall variability may exert an even stronger influence on ecosystem
Manuscript 6: Increased rainfall variability reduces biomass and forage quality of temperate grassland largely independent of mowing frequency
147
functioning, where especially temperate grassland systems seem to be responsive to changes
in rainfall variability. In grassland, more extreme rainfall regimes (less, but more intense
rainfall events) affect ANPP (aboveground net primary productivity) (Barrett et al., 2002;
Fay, 2009; Heisler-White et al., 2009; Knapp et al., 2002), carbon cycling (Chou et al., 2008;
Fay, 2009; Harper et al., 2005) and N mineralization (Barrett et al., 2002, Heisler-White et al.,
2009). The latter may in turn affect leaf quality in terms of N or protein content. Large
reductions in ANPP have been shown in mesic grassland in response to more extreme rainfall
patterns (Fay et al., 2003; Heisler-White et al., 2009; Knapp et al., 2008).
In addition to the rainfall amount and variability, land management strategies, such as
mowing frequency, can affect productivity and leaf litter quality in managed grassland. More
frequent cutting is known to increase leaf N content. However, whether or not mowing
increases or decreases the productivity of grassland depends on the mowing intensity, e.g.
mowing history, mowing frequency and cutting height (Green and Detling, 2000;
McNaughton, 1979; Turner et al., 1993; Weigelt et al., 2009). Mowing or defoliation is likely
to alter the response to rainfall variability by altering plant community composition
(Swemmer and Knapp, 2008). Furthermore, a reduction of transpirative tissue alters water
uptake and consumption and therefore reaction towards rainfall (Heitschmidt et al., 1999;
McNaughton, 1979; Yang and Midmore, 2004). Currently, a knowledge gap exists on how
land management practices, such as mowing frequency, are interacting with more extreme
rainfall regimes: Increased mowing frequency might buffer the effects of rainfall variability
on grassland, diminishing the amplitude of the response towards rainfall extremes (Swemmer
and Knapp, 2008). A study by Bernhardt-Römermann et al. (2011) indicates that climate
parameters get less important for biomass production under intermediate mowing frequencies.
However, land management strategies might also amplify the effects of rainfall variability. To
our knowledge, this is the first study to experimentally manipulate mowing and rainfall
patterns in European managed grassland (meadows) in order to identify any potential
interactions between rainfall variability and mowing frequency.
The primary objectives of our study were (1) to investigate the factorially-combined
effects of increased spring rainfall variability and increased mowing frequency on the
productivity and the forage quality of semi-natural, Central-European temperate grassland and
(2) to determine, whether mowing frequency amplifies or buffers the effects of rainfall
variability on biomass production and leaf quality of a target species. We conducted a field
experiment in which we altered the temporal distribution and the magnitude of the rainfall
events, but not the overall rainfall sum. To assess potential interactions between rainfall
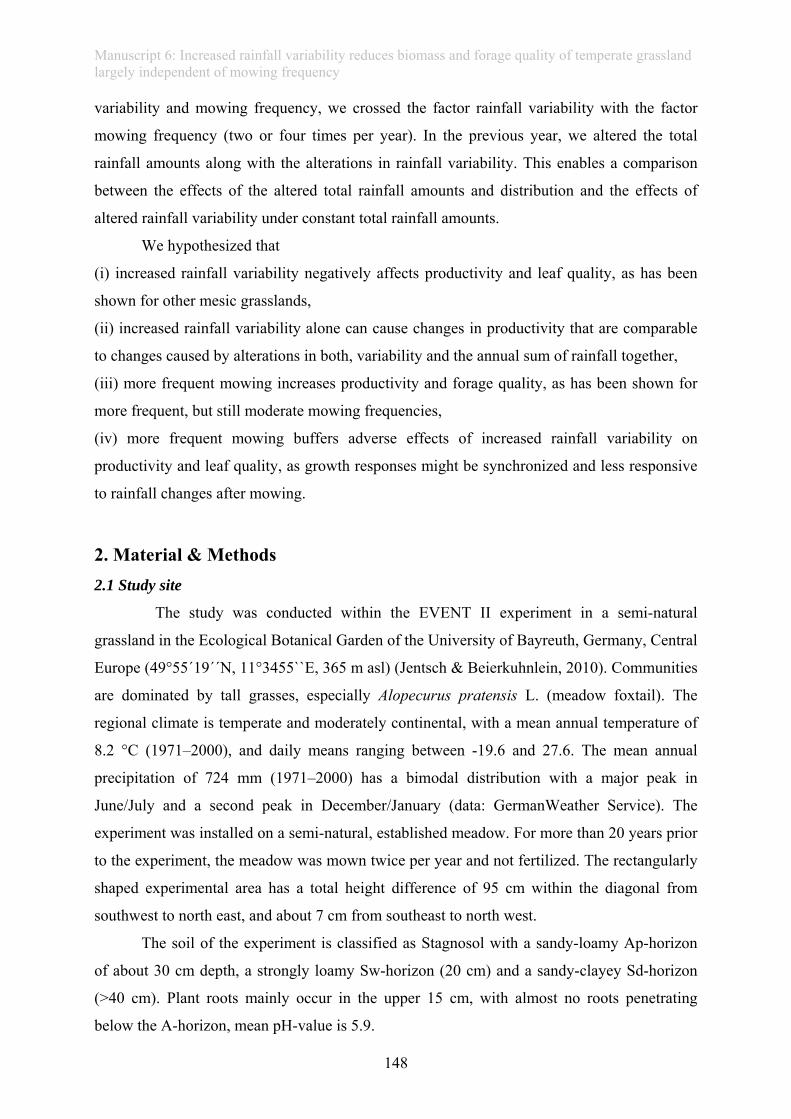
Manuscript 6: Increased rainfall variability reduces biomass and forage quality of temperate grassland largely independent of mowing frequency
148
variability and mowing frequency, we crossed the factor rainfall variability with the factor
mowing frequency (two or four times per year). In the previous year, we altered the total
rainfall amounts along with the alterations in rainfall variability. This enables a comparison
between the effects of the altered total rainfall amounts and distribution and the effects of
altered rainfall variability under constant total rainfall amounts.
We hypothesized that
(i) increased rainfall variability negatively affects productivity and leaf quality, as has been
shown for other mesic grasslands,
(ii) increased rainfall variability alone can cause changes in productivity that are comparable
to changes caused by alterations in both, variability and the annual sum of rainfall together,
(iii) more frequent mowing increases productivity and forage quality, as has been shown for
more frequent, but still moderate mowing frequencies,
(iv) more frequent mowing buffers adverse effects of increased rainfall variability on
productivity and leaf quality, as growth responses might be synchronized and less responsive
to rainfall changes after mowing.
2. Material & Methods 2.1 Study site
The study was conducted within the EVENT II experiment in a semi-natural
grassland in the Ecological Botanical Garden of the University of Bayreuth, Germany, Central
Europe (49°55´19´´N, 11°3455``E, 365 m asl) (Jentsch & Beierkuhnlein, 2010). Communities
are dominated by tall grasses, especially Alopecurus pratensis L. (meadow foxtail). The
regional climate is temperate and moderately continental, with a mean annual temperature of
8.2 °C (1971–2000), and daily means ranging between -19.6 and 27.6. The mean annual
precipitation of 724 mm (1971–2000) has a bimodal distribution with a major peak in
June/July and a second peak in December/January (data: GermanWeather Service). The
experiment was installed on a semi-natural, established meadow. For more than 20 years prior
to the experiment, the meadow was mown twice per year and not fertilized. The rectangularly
shaped experimental area has a total height difference of 95 cm within the diagonal from
southwest to north east, and about 7 cm from southeast to north west.
The soil of the experiment is classified as Stagnosol with a sandy-loamy Ap-horizon
of about 30 cm depth, a strongly loamy Sw-horizon (20 cm) and a sandy-clayey Sd-horizon
(>40 cm). Plant roots mainly occur in the upper 15 cm, with almost no roots penetrating
below the A-horizon, mean pH-value is 5.9.
Manuscript 6: Increased rainfall variability reduces biomass and forage quality of temperate grassland largely independent of mowing frequency
149
2.2 Experimental Design
The EVENT II experiment was established in 2008. The experimental design consists
of two factorially-crossed factors: (1) manipulation of the temporal distribution and
magnitude of rainfall events in the growing season and (2) manipulation of mowing
frequency. We implemented three scenarios of rainfall variability treatments in 2008 and
2009, assigned to the same plots: (1) low rainfall variability with weekly irrigation, ensuring a
continuous water supply, (2) intermediate rainfall variability, with natural ambient rainfall
variability and (3) extreme rainfall variability, including an extreme spring drought.
Table 1 Average soil moisture [vol %], variation coefficient (CV) of soil moisture [%], number of rainfall events exceeding 1 mm, the sum of the rainfall amount [mm] and the variation coefficient (CV) of daily rainfall amount [%] in 2008 and 2009.
parameter year time span low mid extreme natural average soil moisture 2008 26/05-30/10 2008 (158 days) 29 21 19 2009 01/04-31/10 2009 (214 days) 30 29 25 2009 01/04-17/05 2009 (47 days) 42 40 36 2009 -29/06 2009 (43 days) 29 29 21 2009 -09/08 2009 (43 days) 32 31 27 2009 -28/10 2009 (80 days) 23 24 22 CV soil moisture 2008 26/05-30/10 2008 (158 days) 20 31 38 2009 01/04-31/10 2009 (214 days) 35 35 37 2009 01/04-17/05 2009 (47 days) 6 8 13 2009 -29/06 2009 (43 days) 21 24 30 2009 -09/08 2009 (43 days) 25 29 26 2009 -28/10 2009 (80 days) 35 36 35 no. of events 2008 26/05-30/10 2008 (158 days) 61 53 45 2009 01/04-31/10 2009 (214 days) 80 71 60 2009 01/04-17/05 2009 (47 days) 19 16 16 2009 -29/06 2009 (43 days) 17 13 1 2009 -09/08 2009 (43 days) 17 16 17 2009 -28/10 2009 (80 days) 27 25 25 precipitation sum 2008 26/05-30/10 2008 (158 days) 445.2 334.8 296.1 334.8 2009 01/04-31/10 2009 (214 days) 596.8 596.8 596.8 458.5 2009 01/04-17/05 2009 (47 days) 130.2 99.5 99.5 99.5 2009 -29/06 2009 (43 days) 102.5 108.1 36.6 77.4 2009 -09/08 2009 (43 days) 164.2 152.2 223.7 127.1 2009 -28/10 2009 (80 days) 199.9 205 205 154.5 CV precipitation 2008 26/05-30/10 2008 (158 days) 164 183 204 183 2009 01/04-31/10 2009 (214 days) 204 256 297 227 2009 01/04-17/05 2009 (47 days) 227 280 280 280 2009 -29/06 2009 (43 days) 156 248 656 183
2009 -09/08 2009 (43 days) 192 205 223 220 -28/10 2009 (80 days) 203 275 275 192
1 Highest values in each category are in bold. 2 Values for the vegetation period 2008 and 2009 and for the time spans between the compensation irrigation treatments in 2009 for the differing rainfall variability treatments are given. Values for 2009 shown over one time span begin with a compensation irrigation and exclude the following compensation irrigation, as the latter is only effective for soil moisture and biomass for the following period.
Manuscript 6: Increased rainfall variability reduces biomass and forage quality of temperate grassland largely independent of mowing frequency
150
In 2008, the first year of the study, total growing season amount of rainfall and
variability of rainfall were altered. This made it possible to assess direct drought effects, as
the extreme rainfall variability treatment also received least total rainfall (see Table 1 for an
overview over soil moisture and rainfall parameters in both years).
In 2009, the main year of the study, we controlled the amount of rainfall over the
growing season for all treatments and manipulated only the distribution of rainfall, in order to
isolate the effect of rainfall variability. All rainfall variability treatments were adjusted to the
total 597 mm of rainfall of the low variability treatment in four compensation irrigations
(Table 2). Thus, not only the length of the dry intervals, but also the magnitude of rainfall per
event was changed.
The low rainfall variability treatment received at least the 30-year weekly average
rainfall each week. The vegetation periods from 1971 to 2000 served as a reference (data:
German Weather Service). Missing amounts on natural rainfall were added if the weekly
rainfall was less than the long-term average for the same week. This treatment ensured
continuous water availability. If weekly rainfall exceeded the long-term sum, it was not
subtracted for the next irrigation. For 2008, the overall rainfall amount of 553 mm on the low
rainfall variability treatment (natural plus irrigated rainfall) within the vegetation period
(April 1st-October 30th) exceeded the 30-year-average by 94 mm. In 2009, the total amount of
597 mm, irrigated on all treatments by applying compensation irrigations (see below),
exceeded the 30-year-average by 138 mm. Both years consequently resemble rather wet
years.
The intermediate rainfall variability treatment remained under ambient conditions
without any treatment, except for the compensation irrigations applied in 2009 which adjusted
rainfall sum to the low rainfall variability treatment at four points of time (Table 2). Thus, in
2009 the intermediate rainfall variability treatment received the ambient rainfall plus the
compensation irrigations.
Table 2 Amount and timing of compensation irrigation [mm] in 2009 on the extreme and intermediate rainfall variability treatments given to apply the same overall rainfall amount on all treatments over the vegetation period. Treatment
date extreme mid
May 18th 36.6 36.6
June 30th 96.5* 25.1
August 10th 60.3 60.3
October 28th 32 32
*applied on two consecutive days
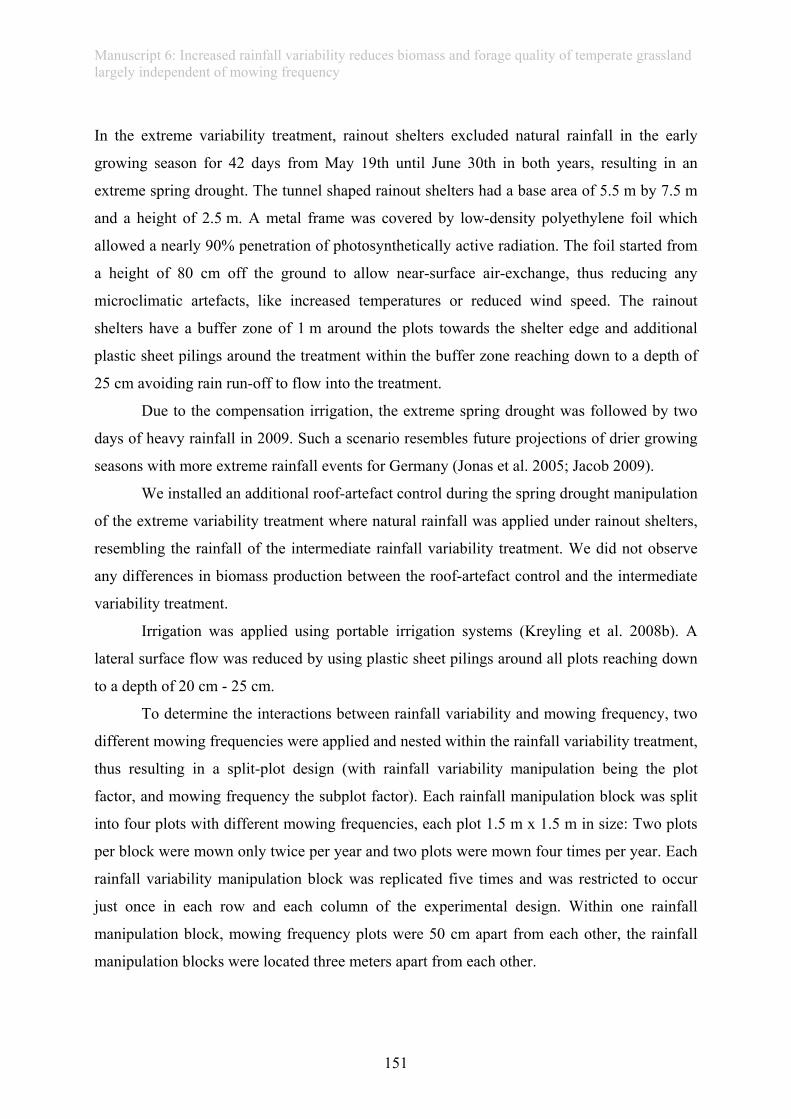
Manuscript 6: Increased rainfall variability reduces biomass and forage quality of temperate grassland largely independent of mowing frequency
151
In the extreme variability treatment, rainout shelters excluded natural rainfall in the early
growing season for 42 days from May 19th until June 30th in both years, resulting in an
extreme spring drought. The tunnel shaped rainout shelters had a base area of 5.5 m by 7.5 m
and a height of 2.5 m. A metal frame was covered by low-density polyethylene foil which
allowed a nearly 90% penetration of photosynthetically active radiation. The foil started from
a height of 80 cm off the ground to allow near-surface air-exchange, thus reducing any
microclimatic artefacts, like increased temperatures or reduced wind speed. The rainout
shelters have a buffer zone of 1 m around the plots towards the shelter edge and additional
plastic sheet pilings around the treatment within the buffer zone reaching down to a depth of
25 cm avoiding rain run-off to flow into the treatment.
Due to the compensation irrigation, the extreme spring drought was followed by two
days of heavy rainfall in 2009. Such a scenario resembles future projections of drier growing
seasons with more extreme rainfall events for Germany (Jonas et al. 2005; Jacob 2009).
We installed an additional roof-artefact control during the spring drought manipulation
of the extreme variability treatment where natural rainfall was applied under rainout shelters,
resembling the rainfall of the intermediate rainfall variability treatment. We did not observe
any differences in biomass production between the roof-artefact control and the intermediate
variability treatment.
Irrigation was applied using portable irrigation systems (Kreyling et al. 2008b). A
lateral surface flow was reduced by using plastic sheet pilings around all plots reaching down
to a depth of 20 cm - 25 cm.
To determine the interactions between rainfall variability and mowing frequency, two
different mowing frequencies were applied and nested within the rainfall variability treatment,
thus resulting in a split-plot design (with rainfall variability manipulation being the plot
factor, and mowing frequency the subplot factor). Each rainfall manipulation block was split
into four plots with different mowing frequencies, each plot 1.5 m x 1.5 m in size: Two plots
per block were mown only twice per year and two plots were mown four times per year. Each
rainfall variability manipulation block was replicated five times and was restricted to occur
just once in each row and each column of the experimental design. Within one rainfall
manipulation block, mowing frequency plots were 50 cm apart from each other, the rainfall
manipulation blocks were located three meters apart from each other.
Manuscript 6: Increased rainfall variability reduces biomass and forage quality of temperate grassland largely independent of mowing frequency
152
2.3 Soil moisture
Soil moisture was logged every hour using frequency domain (FD)-sensors (ECH2O,
Decagon devices, Pullman, USA) that had been installed in May 2008 in each plot to capture
the dynamics of soil water content in response to rainfall variability (n=5/ treatment). Each
sensor measured the soil moisture between -2 and -7 cm. According to the root length data,
the majority of root biomass is located within the upper 5 cm of the soil. Average daily values
were calculated for analysis.
2.4 Biomass production and ANPP
Primary productivity was estimated based on the total aboveground harvest of all plant
material in two 0.1 m2 rectangles from the core of each plot. Harvesting was conducted in the
first week of July and in the second week of September for the plots that were mown twice
per year. The plots that were mown four times per year had additional harvests in the third
week of May and the first week of August. To compare the results of productivity for July and
September, the weight of aboveground dry biomass was summed for the plots that were
already mown before (the cumulated biomass of May and July for the July harvest and the
cumulated biomass of August and September for the September harvest for the plots mown
four times per year). The dry weight of the two rectangles was averaged. To assess ANPP, the
total biomass produced over the whole year was calculated. Aboveground biomass was dried
at 70° C for 72 hours and weighed to the nearest 0.1 g.
2.5 Root length and shoot-root ratio
Root length was acquired by the minirhizotron-technique in 2009. One clear plastic
tube (5 cm in diameter) was installed at a depth of 45 cm at a 45-degree angle at the
beginning of 2009. Images of 3.8 cm² were taken at 5 cm, 15 cm, 25 cm, and 35 cm depth
along each tube by a digital camera mounted on an endoscope. The images in each plot were
taken in the week after the first drought period (July 1st-July 4th) and at the end of the
vegetation period (September 14th-September 18th). Images were analysed for root length
using the line intersection method (Tennant, 1975) within a systematic grid (10 x 10, grid
width of 0.2 cm x 0.2 cm). Afterwards, the values for each depth were summed to assess the
summed root length over all rooting depths. Shoot-root ratio was evaluated using the ratio
between above-ground biomass and the summed root length over all depths (Kreyling et al.,
2008a). Both parameters were standardized beforehand to the same mean and standard
deviation due to the different measured units of above- and belowground parameter.
Manuscript 6: Increased rainfall variability reduces biomass and forage quality of temperate grassland largely independent of mowing frequency
153
2.6 Forage quality
To determine leaf N (N) and carbon (C) concentrations of the dominant tallgrass,
Alopecurus pratensis, one mixed sample per plot was taken after drying and weighing the
biomass in 2009. Samples were ground in a ball mill and analyzed with an elemental analyser
(Thermo Quest Flash EA 1112). To provide additional information about the impacts of
drought on the forage quality in other species, we include data from another sampling
campaign here. In this, we assessed the drought effects on the protein content of the key
legume Trifolium pratense. We took mixed samples from the leaves of three different plants
on the last day of the drought treatment, which were immediately frozen in liquid N. We
determined the total soluble proteins according to Bradford (1976). Soluble proteins were
extracted using 50mM TRIS-HCl (pH 7.6) and 1µM PMSF.
2.7 Statistical analysis
We performed two-factorial ANOVA in order to test for the significance of the effects
of the fixed factors rainfall variability treatment and mowing frequency on the response
variables. To account for the split-plot design, we included the row and the column of the
weather treatment blocks as random factors in our linear mixed effect model, as each rainfall
manipulation was restricted to occur just once in each row and each column of the design. To
include row and column number as random effects automatically implements the nesting of
mowing frequency within rainfall treatment blocks in the model, as one weather treatment
block with its corresponding and unique row and column combination includes four values of
the response variable (within one block the two mowing frequencies are represented twice
each) (Faraway, 2006). Prior to analyses, we tested whether the assumptions of an ANOVA,
homogeneity of variances and normally-distributed errors had been met by visually checking
the residuals against the fitted plots and the normal qq-plots (Faraway, 2006). If these
assumptions were not fulfilled then the data were square-root (root length) or log-transformed
(biomass, N data). All statistical analyses were performed using R 2.11.0 (R Development
Core Team, 2010). For mixed effect models we used the software package lme4 (Bates &
Maechler, 2010), and the package multcomp (Hothorn et al., 2008) for multiple post-hoc
comparisons. Significance levels in mixed effect models were evaluated by Markov Chain
Monte Carlo sampling of 1000 permutations, using the software package language R (Baayen,
2009).
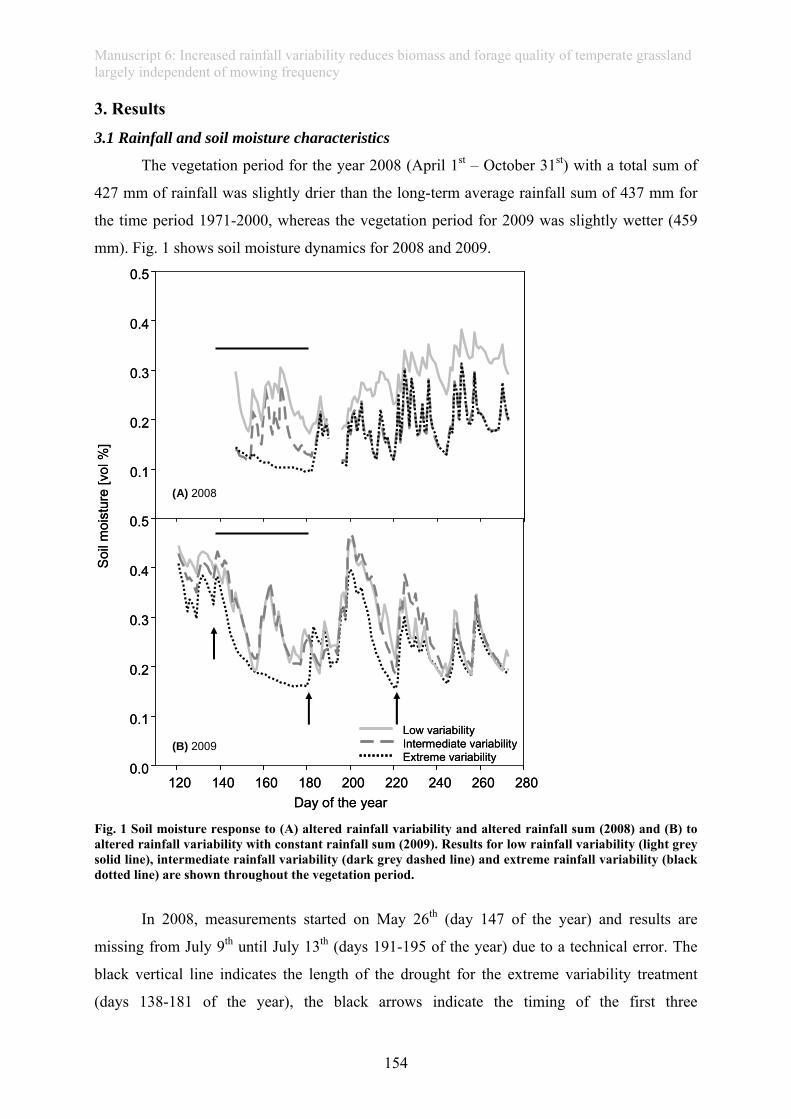
Manuscript 6: Increased rainfall variability reduces biomass and forage quality of temperate grassland largely independent of mowing frequency
154
3. Results
3.1 Rainfall and soil moisture characteristics
The vegetation period for the year 2008 (April 1st – October 31st) with a total sum of
427 mm of rainfall was slightly drier than the long-term average rainfall sum of 437 mm for
the time period 1971-2000, whereas the vegetation period for 2009 was slightly wetter (459
mm). Fig. 1 shows soil moisture dynamics for 2008 and 2009.
Day of the year120 140 160 180 200 220 240 260 280
Soi
l moi
stur
e [v
ol %
]
0.0
0.1
0.2
0.3
0.4
0.5
0.1
0.2
0.3
0.4
0.5
Intermediate variability Low variability
Extreme variability
(A) 2008
(B) 2009
Day of the year120 140 160 180 200 220 240 260 280
Soi
l moi
stur
e [v
ol %
]
0.0
0.1
0.2
0.3
0.4
0.5
0.1
0.2
0.3
0.4
0.5
Intermediate variability Low variability
Extreme variability Intermediate variability Low variability
Extreme variability
(A) 2008
(B) 2009
Fig. 1 Soil moisture response to (A) altered rainfall variability and altered rainfall sum (2008) and (B) to altered rainfall variability with constant rainfall sum (2009). Results for low rainfall variability (light grey solid line), intermediate rainfall variability (dark grey dashed line) and extreme rainfall variability (black dotted line) are shown throughout the vegetation period.
In 2008, measurements started on May 26th (day 147 of the year) and results are
missing from July 9th until July 13th (days 191-195 of the year) due to a technical error. The
black vertical line indicates the length of the drought for the extreme variability treatment
(days 138-181 of the year), the black arrows indicate the timing of the first three
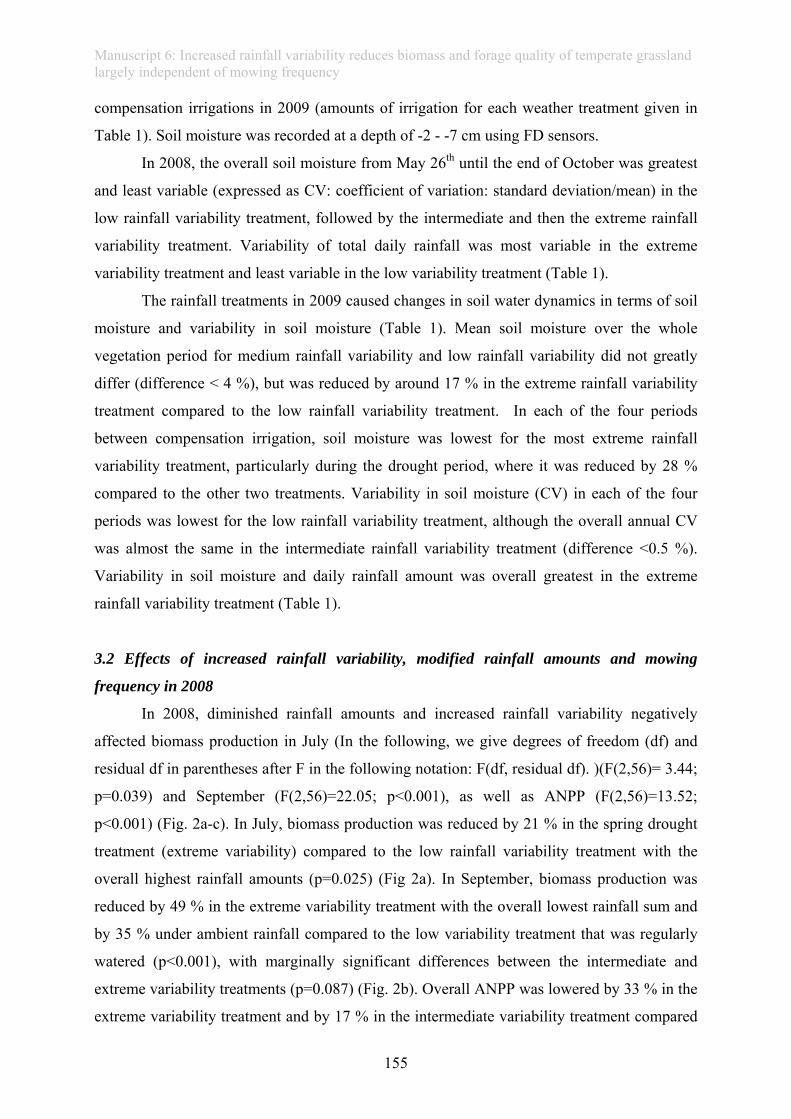
Manuscript 6: Increased rainfall variability reduces biomass and forage quality of temperate grassland largely independent of mowing frequency
155
compensation irrigations in 2009 (amounts of irrigation for each weather treatment given in
Table 1). Soil moisture was recorded at a depth of -2 - -7 cm using FD sensors.
In 2008, the overall soil moisture from May 26th until the end of October was greatest
and least variable (expressed as CV: coefficient of variation: standard deviation/mean) in the
low rainfall variability treatment, followed by the intermediate and then the extreme rainfall
variability treatment. Variability of total daily rainfall was most variable in the extreme
variability treatment and least variable in the low variability treatment (Table 1).
The rainfall treatments in 2009 caused changes in soil water dynamics in terms of soil
moisture and variability in soil moisture (Table 1). Mean soil moisture over the whole
vegetation period for medium rainfall variability and low rainfall variability did not greatly
differ (difference < 4 %), but was reduced by around 17 % in the extreme rainfall variability
treatment compared to the low rainfall variability treatment. In each of the four periods
between compensation irrigation, soil moisture was lowest for the most extreme rainfall
variability treatment, particularly during the drought period, where it was reduced by 28 %
compared to the other two treatments. Variability in soil moisture (CV) in each of the four
periods was lowest for the low rainfall variability treatment, although the overall annual CV
was almost the same in the intermediate rainfall variability treatment (difference <0.5 %).
Variability in soil moisture and daily rainfall amount was overall greatest in the extreme
rainfall variability treatment (Table 1).
3.2 Effects of increased rainfall variability, modified rainfall amounts and mowing
frequency in 2008
In 2008, diminished rainfall amounts and increased rainfall variability negatively
affected biomass production in July (In the following, we give degrees of freedom (df) and
residual df in parentheses after F in the following notation: F(df, residual df). )(F(2,56)= 3.44;
p=0.039) and September (F(2,56)=22.05; p<0.001), as well as ANPP (F(2,56)=13.52;
p<0.001) (Fig. 2a-c). In July, biomass production was reduced by 21 % in the spring drought
treatment (extreme variability) compared to the low rainfall variability treatment with the
overall highest rainfall amounts (p=0.025) (Fig 2a). In September, biomass production was
reduced by 49 % in the extreme variability treatment with the overall lowest rainfall sum and
by 35 % under ambient rainfall compared to the low variability treatment that was regularly
watered (p<0.001), with marginally significant differences between the intermediate and
extreme variability treatments (p=0.087) (Fig. 2b). Overall ANPP was lowered by 33 % in the
extreme variability treatment and by 17 % in the intermediate variability treatment compared
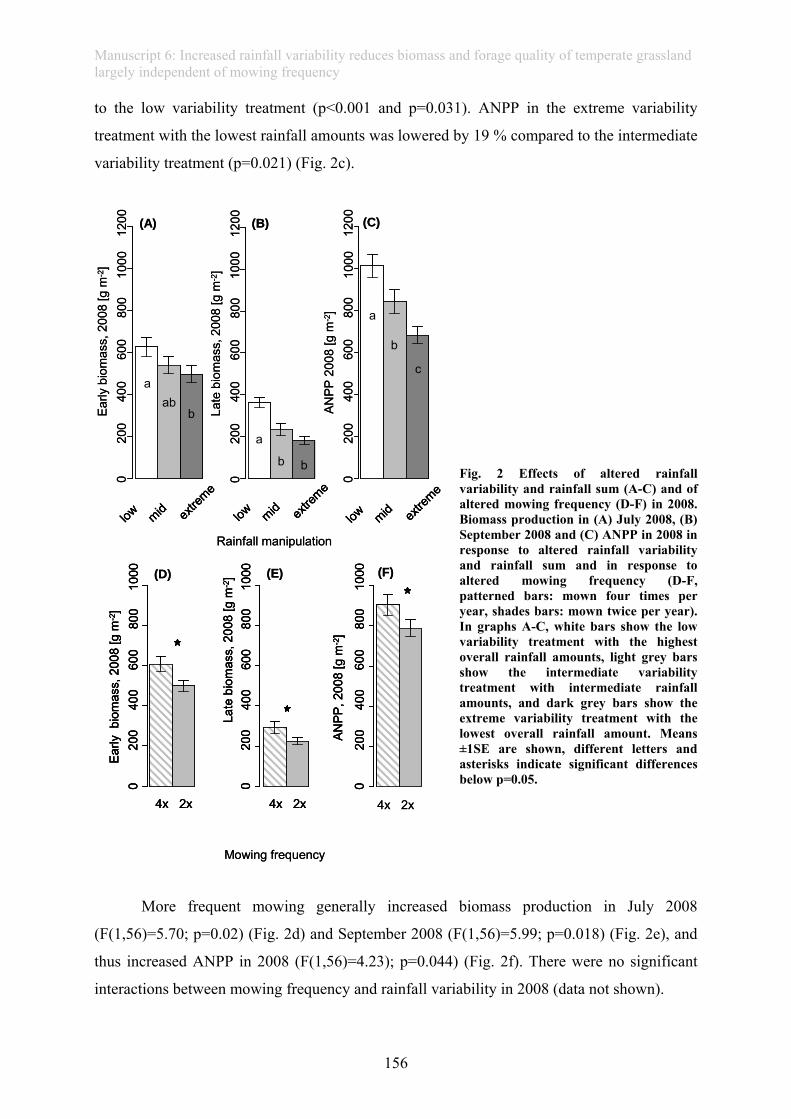
Manuscript 6: Increased rainfall variability reduces biomass and forage quality of temperate grassland largely independent of mowing frequency
156
to the low variability treatment (p<0.001 and p=0.031). ANPP in the extreme variability
treatment with the lowest rainfall amounts was lowered by 19 % compared to the intermediate
variability treatment (p=0.021) (Fig. 2c).
Fig. 2 Effects of altered rainfall variability and rainfall sum (A-C) and of altered mowing frequency (D-F) in 2008. Biomass production in (A) July 2008, (B) September 2008 and (C) ANPP in 2008 in response to altered rainfall variability and rainfall sum and in response to altered mowing frequency (D-F, patterned bars: mown four times per year, shades bars: mown twice per year). In graphs A-C, white bars show the low variability treatment with the highest overall rainfall amounts, light grey bars show the intermediate variability treatment with intermediate rainfall amounts, and dark grey bars show the extreme variability treatment with the lowest overall rainfall amount. Means ±1SE are shown, different letters and asterisks indicate significant differences below p=0.05.
More frequent mowing generally increased biomass production in July 2008
(F(1,56)=5.70; p=0.02) (Fig. 2d) and September 2008 (F(1,56)=5.99; p=0.018) (Fig. 2e), and
thus increased ANPP in 2008 (F(1,56)=4.23); p=0.044) (Fig. 2f). There were no significant
interactions between mowing frequency and rainfall variability in 2008 (data not shown).
ANPP
200
8 [g
m-2]
020
040
060
080
010
0012
00
Early
bio
mas
s, 2
008
[g m
-2]
020
040
060
080
010
0012
00
Late
bio
mas
s, 2
008
[g m
-2]
020
040
060
080
010
0012
00
Rainfall manipulation
b
a
b
extre
me
midlowextre
me
midlow
aab
b
b
a
c
extre
me
midlow
(D) (E) (F)
020
040
060
080
010
00
ANPP
, 200
8 [g
m-2
]
Late
bio
mas
s, 2
008
[g m
-2]
4x 2x
020
040
060
080
010
00
4x 2x
Early
bio
mas
s, 2
008
[g m
-2]
020
040
060
080
010
00
4x 2x
Mowing frequency
(B) (C)(A)
ANPP
200
8 [g
m-2]
020
040
060
080
010
0012
00
Early
bio
mas
s, 2
008
[g m
-2]
020
040
060
080
010
0012
00
Late
bio
mas
s, 2
008
[g m
-2]
020
040
060
080
010
0012
00
Rainfall manipulation
b
a
b
extre
me
midlow extre
me
midlowextre
me
midlow extre
me
midlow
aab
b
b
a
c
extre
me
midlow extre
me
midlow
(D) (E) (F)
020
040
060
080
010
00
ANPP
, 200
8 [g
m-2
]
020
040
060
080
010
00
ANPP
, 200
8 [g
m-2
]
Late
bio
mas
s, 2
008
[g m
-2]
4x 2x
020
040
060
080
010
00La
te b
iom
ass,
200
8 [g
m-2]
4x 2x
020
040
060
080
010
00
4x 2x
Early
bio
mas
s, 2
008
[g m
-2]
020
040
060
080
010
00
4x 2x
Early
bio
mas
s, 2
008
[g m
-2]
020
040
060
080
010
00
4x 2x
Mowing frequency
(B) (C)(A)
Manuscript 6: Increased rainfall variability reduces biomass and forage quality of temperate grassland largely independent of mowing frequency
157
3.3. Effects of increased rainfall variability in 2009
Rainfall variability significantly altered biomass production in the early summer of
2009 ((F(2,56)= 11.19; p<0.001), shortly after extreme drought followed by heavy rainfall
was applied to the extreme variability treatments (first week of July) (Fig. 3a). Communities
subjected to the extreme rainfall variability revealed 20 % less aboveground biomass
compared to the low variability treatment (p<0.001) and 13 % less biomass compared to the
intermediate variability treatment (p= 0.002). These strong effects of extreme rainfall
variability assessed in July did not persist until September, as then extreme rainfall variability
did not significantly affect biomass production (F(2,56)=0.72; p=0.49) (Fig. 3b).
Nevertheless, the strong early summer effects of extreme rainfall variability led to negative
ANPP responses (F(2,56)=9.11; p<0.001), as communities under extreme rainfall variability
produced 15 % less biomass than communities under low variability treatment (p<0.001) and
7 % less biomass than communities under intermediate variability treatment (p= 0.024) (Fig.
3c).
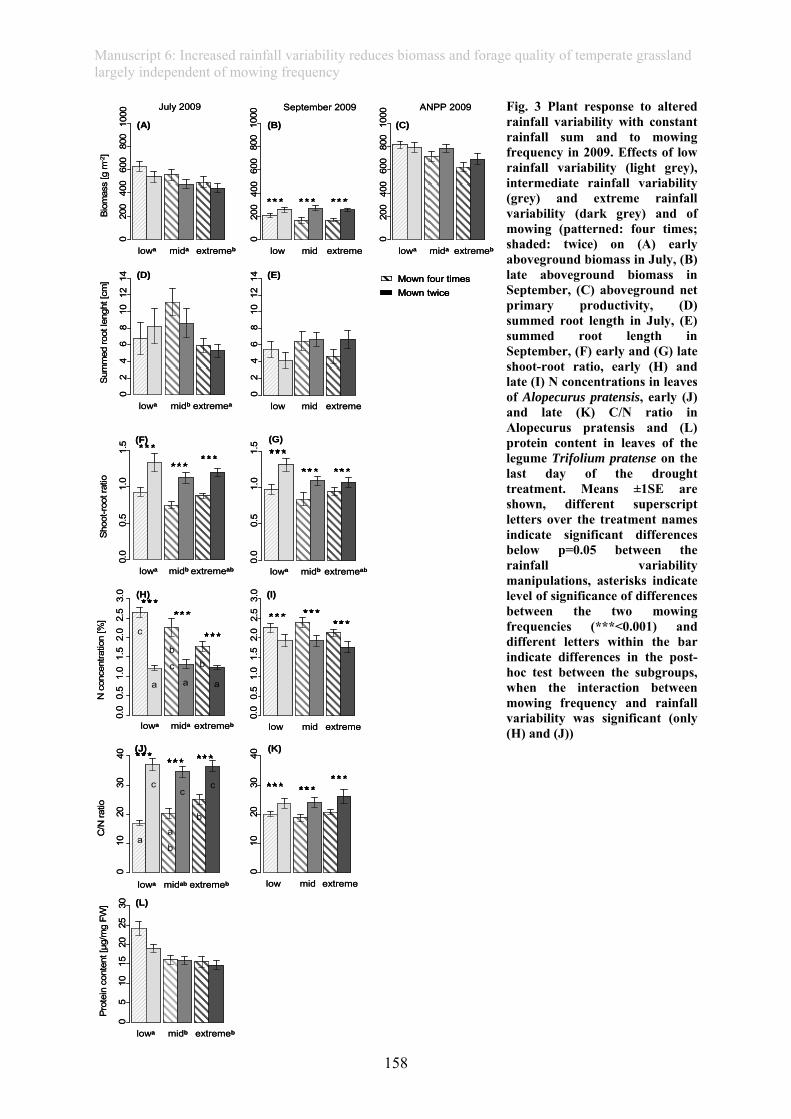
Manuscript 6: Increased rainfall variability reduces biomass and forage quality of temperate grassland largely independent of mowing frequency
158
Fig. 3 Plant response to altered rainfall variability with constant rainfall sum and to mowing frequency in 2009. Effects of low rainfall variability (light grey), intermediate rainfall variability (grey) and extreme rainfall variability (dark grey) and of mowing (patterned: four times; shaded: twice) on (A) early aboveground biomass in July, (B) late aboveground biomass in September, (C) aboveground net primary productivity, (D) summed root length in July, (E) summed root length in September, (F) early and (G) late shoot-root ratio, early (H) and late (I) N concentrations in leaves of Alopecurus pratensis, early (J) and late (K) C/N ratio in Alopecurus pratensis and (L) protein content in leaves of the legume Trifolium pratense on the last day of the drought treatment. Means ±1SE are shown, different superscript letters over the treatment names indicate significant differences below p=0.05 between the rainfall variability manipulations, asterisks indicate level of significance of differences between the two mowing frequencies (***<0.001) and different letters within the bar indicate differences in the post-hoc test between the subgroups, when the interaction between mowing frequency and rainfall variability was significant (only (H) and (J))
extremeb
Biom
ass
[g m
-2]
020
040
060
080
010
00
midalowa extreme0
200
400
600
800
1000
midlow extremeb
020
040
060
080
010
00
midalowa
extremea
Sum
med
root
leng
ht[c
m]
02
46
810
1214
midblowa extreme
02
46
810
1214
midlow
(A) (B) (C)
(D) (E)
midb extremeab
Shoo
t-roo
trat
io
0.0
0.5
1.0
1.5
lowa
(F)
midb extremeab
0.0
0.5
1.0
1.5
lowa
(G)
extremeb
N c
once
ntra
tion
[%]
0.0
0.5
1.0
1.5
2.0
2.5
3.0
midalowa
(H)
low extreme
0.0
0.5
1.0
1.5
2.0
2.5
3.0
mid
(I)
C/N
ratio
010
2030
40
extremebmidablowa
(J)
extreme
010
2030
40
midlow
(K)
extremeb
Pro
tein
con
tent
[µg/
mg
FW]
05
1015
2025
30
midblowa
(L)
September 2009July 2009 ANPP 2009
Mown four timesMown twice
aaa
c
b
c b
cc
c
aa
b
b
extremeb
Biom
ass
[g m
-2]
020
040
060
080
010
00
midalowa extreme0
200
400
600
800
1000
midlow extremeb
020
040
060
080
010
00
midalowa
extremea
Sum
med
root
leng
ht[c
m]
02
46
810
1214
midblowa extreme
02
46
810
1214
midlow
(A) (B) (C)
(D) (E)
midb extremeab
Shoo
t-roo
trat
io
0.0
0.5
1.0
1.5
lowa
(F)
midb extremeab
0.0
0.5
1.0
1.5
lowa
(G)
extremeb
N c
once
ntra
tion
[%]
0.0
0.5
1.0
1.5
2.0
2.5
3.0
midalowa
(H)
low extreme
0.0
0.5
1.0
1.5
2.0
2.5
3.0
mid
(I)
C/N
ratio
010
2030
40
extremebmidablowa
(J)
extreme
010
2030
40
midlow
(K)
extremeb
Pro
tein
con
tent
[µg/
mg
FW]
05
1015
2025
30
midblowa
(L)
September 2009July 2009 ANPP 2009
Mown four timesMown twiceMown four timesMown twice
aaa
c
b
c b
cc
c
aa
b
b
Manuscript 6: Increased rainfall variability reduces biomass and forage quality of temperate grassland largely independent of mowing frequency
159
A redistribution of rainfall resulted in changes in the summed root length in July
(F(2,56)=4.41; p=0.017) (Fig. 3d). The summed root length was highest in the intermediate
rainfall variability treatment and 43 % and 24 % shorter in extreme and low rainfall
variability treatments (p= 0.024 and p=0.032, respectively). In September, no differences
occurred in the summed root length (F(2,56)=2.17; p=0.12)(Fig. 3e).
The shoot-root ratio in July was affected by extreme rainfall variability (F(2,56)=5.44;
p= 0.007), as it was increased by 22 % in the low rainfall variability treatment when
compared to the intermediate rainfall variability treatment (p=0.003) (Fig. 3f). The effect of
this rainfall variability treatment on shoot-root ratio persisted until September (F(2,56)=4.10;
p=0.022), as the shoot-root ratio was still increased in the low rainfall variability treatment
compared to the intermediate rainfall variability treatment (p=0.017) (Fig. 3g).
Increased spring variability in rainfall patterns also affected the forage quality in early
summer: Leaf N concentration of the target grass Alopecurus pratensis was decreased in July
under extreme rainfall variability compared to low (p<0.001) and intermediate rainfall
variability treatments (p= 0.037; overall rainfall treatment effect F(2,54)=5.03; p=0.01)(Fig.
3h). The C/N ratio in June was marginally significantly affected by rainfall variability
(F(2,54)=3.07; p= 0.055), as it was increased under extreme rainfall variability compared to
low rainfall variability (p=0.002) (Fig.3j). Rainfall effects on N concentration and C/N ratio
interacted with effects of mowing frequency, shown at section 3.5. Extreme rainfall
variability did not affect the forage quality in September, as neither leaf N concentration
(F(2,56)=1.71; p=0.19) nor the C/N ratio (F(2,56)=1.19; p=0.31) in Alopecurus pratensis was
altered in response to rainfall treatments (Fig. 3i,k). Protein content in the legume Trifolium
pratense was also affected by rainfall variability treatments (F(2,54)=12.33; p<0.001), as
protein content was increased under a low rainfall variability treatment when compared to
intermediate and extreme rainfall variability (p<0.001) (Fig. 3l).
3.4 Effects of the mowing frequency in 2009
In 2009, more frequent mowing caused a marginally significant positive response of
productivity during midsummer: The cumulated biomass of the two harvests until July 2009
in the communities that had been mown four times was 12 % greater than the biomass
production in those plots that had only been mown twice per year (F(1,56)=11.19); p= 0.057)
(Fig. 3a). Contrastingly, more frequent mowing in mid and late summer resulted in a 32 %
decrease in biomass compared to those communities that had only been mown twice per year
Manuscript 6: Increased rainfall variability reduces biomass and forage quality of temperate grassland largely independent of mowing frequency
160
(F(1,56)=38.66; p<0.001) (Fig. 3b). This reversal of effects resulted in ANPP showing no
response to altered mowing frequency over the whole year (F(1,56)=2.00; p=0.16) (Fig. 3c).
The shoot-root ratio decreased consistently by more frequent mowing in early
(F(1,56)=58.79; p<0.001) and late (F(1,56)=21.04; p<0.001) summer ((Fig. 3f,g), whereas the
root length was not affected at any point in time (Fig. 3d,e).
The C/N ratio in leaves of Alopecurus pratensis in July decreased (F(1,54)=122.02;
p>0.001)and N concentration increased (F(1,54)=109.81); p<0.001) as a result of more
frequent mowing in early summer (Fig. 3h,j), both interacting with rainfall variability (see
section 3.5). The same effect of mowing frequency on the leaf N relation was observed in
September (F(1,56)=14.49 for N content and 15.99 for C/N ratio; p<0.001) (Fig. 3i,k).
3.5 Interactions between rainfall variability and mowing frequency
Mowing frequency did not interact with rainfall variability in terms of productivity,
root length or shoot-root ratio in any year. There was a significant interaction for leaf N
concentration and consequently C/N ratio in July 2009 (F(2,54)=5.34; p=0.011 and
F(2,54)=3.54; p=0.036, respectively): Differences in N concentrations caused by rainfall
variability were comparatively greater for more frequently mown communities (Fig. 3h),
which caused the significant interaction between mowing frequency and rainfall variability.
Accordingly, the differences in the C/N ratio in July caused by rainfall variability were
comparatively greater in those plants that were mown more frequently and was hardly
noticeable in plants mown only twice per year (Fig. 3j).
4. Discussion
Climate change is projected not only to alter the annual amount of rainfall, but also
rainfall variability, resulting in more intense rainfall events and longer dry periods in between.
Our results emphasize that overall rainfall amount is a strong driver of grassland productivity
and forage quality. However, we demonstrate that this is not only caused by mere differences
in amount, but also by differences in rainfall variability which usually accompany shifts in
rainfall amounts: We show that altered rainfall variability even under constant rainfall
amounts affected community productivity and also the leaf quality of our target species.
Mowing frequency strongly affected biomass production and quality, but neither buffered nor
amplified the effects of rainfall variability on productivity.
Manuscript 6: Increased rainfall variability reduces biomass and forage quality of temperate grassland largely independent of mowing frequency
161
4.1 Effects of increased rainfall variability in 2009, compared to the effects of increased
rainfall and modified rainfall amounts in 2008
In the dry year of 2008, soil moisture for the low variability treatment was always
higher compared to the other two treatments, according to the highest total rainfall amount.
The effects from the rainfall treatments (altered amount and variability) on productivity were
generally greater in 2008 and lasted longer than in 2009. We did not expect such great effects
in the first year of the study, as other studies often show weaker, lagged or even no effects of
grassland productivity towards drought (Bloor et al., 2010; Gilgen and Buchmann, 2009;
Kreyling et al., 2008b). These results highlight the important role of the overall rainfall
amount for grassland productivity. In 2008 there were also differences in biomass production
between the low rainfall variability treatment with the highest rainfall amounts and the
intermediate rainfall variability treatment with the lower rainfall amounts, whereas in 2009,
when both treatments received the same amount of rainfall, there were no differences between
the low and intermediate rainfall variability treatments. Nevertheless, the results from 2009
showed that changes in rainfall variability can only affect productivity, when the variability is
extreme. However, we show that it is not only rainfall amount that influences productivity and
forage quality of temperate grassland, but also the rainfall variability and intervals, in which a
given rainfall amount is applied. The relatively short-lived effects of extreme spring rainfall
variability in 2009, compared to the long-lasting effects of the treatments in 2008, highlight
the importance of sufficient water availability and thus the total rainfall amounts for grassland
resilience. Therefore, in contrast to the studies on mesic grassland systems of North America
(Fay et al., 2003; Knapp et al., 2002), here, in temperate grassland of Central-Europe, overall
rainfall amount seemed to influence ANPP stronger than rainfall variability alone. We cannot
completely rule out the possibility that the drought effect of 2008 could have enhanced the
spring effects of extreme variability in 2009, e.g. by making soil more susceptible to drying.
However, as the productivity trend is different from that observed at the end of 2008 (with no
differences between the intermediate and low variability treatment in early 2009), we
conclude that most of the effect can be attributed to altered spring rainfall variability.
4.2 Effects of increased rainfall variability with constant rainfall amounts
In 2009, which was naturally a wet year, the amount of rainfall that resulted from
many small events (as in the low rainfall variability treatment) or from several moderate
events (as in the intermediate rainfall variability treatment) did not discriminate soil moisture.
The results show that very extreme rainfall events, as in the extreme variability treatment
Manuscript 6: Increased rainfall variability reduces biomass and forage quality of temperate grassland largely independent of mowing frequency
162
directly after drought, are not efficient in constantly increasing soil moisture, as they also
increase water runoff and the length of the dry periods. Furthermore, long dry periods may
reduce the water holding capacity of the soil or may even make the rhizosphere hydrophobic
(Browning et al., 2007; Carminati et al., 2010), as indicated by the greater responsiveness of
soil moisture towards dryness and the lower responsiveness to wet pulses in the extreme
variability treatment.
Our results provide evidence of a high short-term sensitivity of grassland after extreme
spring rainfall variability that was neutralised until September. Nevertheless, ANPP was
affected negatively by the extreme rainfall variability, indicating a possible risk of production
losses for agriculture under global climate change. Comparable studies in mesic grassland
also show losses in ANPP under increased rainfall variability: Heisler-White et al. (2009)
report an 18 % reduction in productivity, although the rainfall variability, which they applied,
was greater (up to a 75 % increase in the number of rainfall events) than in our experiment (a
33 % reduction in events between extreme and low variability). Fay et al. (2003) and Knapp
et al. (2002) report a 10 % reduction in long-term productivity after subjecting mesic tallgrass
prairie to more extreme rainfall patterns.
Root length data in early summer indicate that extreme dryness, as well as regular
water availability may decrease root biomass. Although enhanced root growth under drought
is viewed as an adaptive feature of many species under drought, other studies also indicate
that grassland roots may not respond with enhanced root growth to dryness (Kreyling et al.,
2008a). Again, these changes to root length only became apparent in July and were thus
relatively short-lived. However, the shoot-root ratio changed consistently as a result of
changing rainfall patterns.
The reduction of leaf N under extreme rainfall variability could be due to less
microbial activity caused by low soil moisture and long dry periods, or even due to N
leaching that is increased after extreme rainfall events (Heisler-White et al., 2008).
Surprisingly, the protein content in the target legume Trifolium pratense directly after drought
was not affected by the extreme variability, but rather showed an increased protein content in
the leaves under low rainfall variability, with no differences between intermediate and
extreme rainfall variability. This indicates that the leaf quality of different functional groups
reacts independently and differently towards rainfall variability. Furthermore, regular water
availability might have increased the activity of N fixers in the nodules of Trifolium pratense.
Manuscript 6: Increased rainfall variability reduces biomass and forage quality of temperate grassland largely independent of mowing frequency
163
4.3 The effects of mowing frequency
The overcompensation in biomass production in more frequently mown
communities in 2008 and early 2009 was reversed by a clear negative effect on productivity
in September 2009. Most of the previous studies conducted on the effects of defoliation on
productivity indicate either negative or neutral effects (Biondini et al., 1999; Green and
Detling, 2000; Hejcman et al., 2010; Leriche et al., 2003; Maron and Jeffries, 2001;
Milchunas and Lauenroth, 1993), while the effects of overcompensation are reported mostly
for very low or intermediate intensities of cutting (Bernhardt-Römermann et al., 2011;
Weigelt et al., 2009; Zhao et al., 2008) or for communities without any previous mowing
history (Turner et al., 1993) and are often lessened after a history of several mowing events
(Loeser et al., 2004). Our study also shows that overcompensation is reversed after one
vegetation period of more frequent mowing. Our results therefore indicate that mowing
history should be considered and adjusted to optimize productivity.
Our findings of increased leaf quality in terms of N concentration and protein content
are consistent with many other studies showing increased N concentration in leaves that were
cut more frequently; (Green and Detling, 2000; Maron and Jeffries, 2001; Turner et al., 1993).
This might be explained by the generally lower shoot-root ratio in more frequently mown
plots, caused by a reduced shoot biomass: This allows for a higher concentration of N in leaf
tissue, as root biomass has to allocate resources to less aboveground biomass. Furthermore,
increased defoliation intensity accelerates decomposition and N mineralization, thereby
increasing the N level in the soil and thus mowing may enhance root N uptake and allocation
to the shoots (Green and Detling, 2000; Klumpp et al., 2009; Turner et al., 1993).
Thus, although the effects of mowing on biomass production are ambivalent, the
effects of mowing frequency on forage quality are unequivocally positive, as N, which is
often a limiting factor for herbivores, increases.
4.4 Interactive effects between rainfall variability and mowing frequency
Mowing frequency and rainfall variability did not interact for most of the assessed
parameters. Nevertheless, leaf N concentration and the C/N ratio in early summer were very
responsive towards rainfall variability only in the more frequently mown plots, indicating a
higher responsiveness of younger leaves with a lower shoot-root ratio towards extreme
rainfall variability and drought. Grasses with a lower shoot-root ratio can allocate more N to
the leaves, however, water availability is necessary for mineral uptake through the roots. As
less frequently mown and thus older leaves have lower leaf N concentrations, they may not
Manuscript 6: Increased rainfall variability reduces biomass and forage quality of temperate grassland largely independent of mowing frequency
164
depend as largely on temporal water availability. In sum, although frequent mowing increases
forage quality it might also increase the fluctuations in forage quality under climate change.
5. Conclusions
Our study shows that increased rainfall variability under climate change may cause
losses in temperate grassland productivity and also reduces forage quality. In contrast to other
studies, a comparison to the data of the previous year indicates that overall rainfall amount is
more important for temperate grassland productivity than rainfall variability. However,
changes in variability, that accompany changes in total rainfall amount, surely amplify the
effects of differences in rainfall amount. Furthermore, our results indicate that mowing history
might be more important for explaining productivity than mowing frequency alone. In sum,
positive effects of more frequent mowing on forage quality might be diminished by increased
rainfall variability just as increased rainfall variability alone negatively affects forage quality.
To conclude, climate change will affect agriculture in Europe by changing meadow usability.
Management strategies to buffer adverse effects on forage quality and quantity have yet to be
investigated and established, as mowing frequency seems to have a rather small buffering
capacity.
6. Acknowledgements: This work was kindly supported by the Helmholtz Impulse and
Networking Fund through the Helmholtz Interdisciplinary Graduate School for
Environmental Research (HIGRADE). The study was funded by the "Bavarian Climate
Programme 2020" in the joint research center FORKAST and by the German Science
Foundation (DFG JE 282/6-1). We thank the German Weather Service for the long-term
precipitation data. We also thank two anonymous reviewers for their help in improving the
manuscript substantially.
7. References: Baayen, R.H. 2009. languageR: Data sets and functions with "Analyzing Linguistic Data: A practical
introduction to statistics" R package version 0.955. http://CRAN.R-project.org/package=languageR Barrett, J.E., McCulley, R.L., Lane, Burke, I.C., Lauenroth, W.K., 2002. Influence of climate variability on plant
production and nitrogen-mineralization in Central US grasslands. Journal of Vegetation Science 13 (3), 383–394.
Bates, D., Maechler, M. 2010. lme4: Linear mixed-effects models using S4 classes. R package version 0.999375-33. http://CRAN.R-project.org/package=lme4
Bernhardt-Römermann, M., Römermann, C., Sperlich, S., Schmidt, W., (2011). Explaining grassland biomass- the contribution of climate, species and functional diversity depends on fertilization and mowing frequency. Journal of Applied Ecology, doi:10.1111/j.1365-2664.2011.01968.x
Manuscript 6: Increased rainfall variability reduces biomass and forage quality of temperate grassland largely independent of mowing frequency
165
Biondini, M.E., Steuter, A.A., Hamilton, R.G., 1999. Bison use of fire-managed remnant prairies. Journal of Range Management 52 (5), 454–461.
Blenkinsop, S., Fowler, H.J., 2007. Changes in European drought characteristics projected by the PRUDENCE regional climate models. International Journal of Climatology 27 (12), 1595–1610.
Bloor, J.M.G., Pichon, P., Falcimagne, R., Leadley, P., Soussana, J.-F., 2010. Effects of warming, summer drought, and CO2 enrichment on aboveground biomass production, flowering phenology, and community structure in an upland grassland ecosystem. Ecosystems 13 (6), 888–900.
Bradford, M.M., 1976. Rapid and sensitive method for quantitation of microgram quantities of protein utilizing principle of protein-dye binding. Analytical Biochemistry 72 (1-2), 248–254.
Browning, L.S., Hershberger, K.R., Bauder, J.W., 2007. Soil water retention at varying matric potentials following repeated wetting with modestly saline-sodic water and subsequent air drying. Communications in Soil Science and Plant Analysis 38 (19-20), 2619–2634.
Carminati, A., Moradi, A.B., Vetterlein, D., Vontobel, P., Lehmann, E., Weller, U., Vogel, H.-J., Oswald, S.E., 2010. Dynamics of soil water content in the rhizosphere. Plant and Soil 332 (1-2), 163–176.
Chou, W.W., Silver, W.L., Jackson, R.D., Thompson, A.W., Allen-Diaz, B., 2008. The sensitivity of annual grassland carbon cycling to the quantity and timing of rainfall. Global Change Biology 14 (6), 1382–1394.
Faraway, J.J. 2006. Extending the Linear Model with R - Generalized Linear, Mixed Effects and Nonparametric Regression Models. Chapman & Hall/ CRC, Boca Raton.
Fay, P.A., Carlisle, J.D., Knapp, A.K., Blair, J.M., Collins, S.L., 2003. Productivity responses to altered rainfall patterns in a C-4-dominated grassland. Oecologia 137 (2), 245–251.
Fay, P.A., 2009. Precipitation variability and primary productivity in water-limited ecosystems: how plants `leverage‘ precipitation to `finance‘ growth. New Phytologist 181 (1), 5–8.
Gilgen, A.K., Buchmann, N., 2009. Response of temperate grasslands at different altitudes to simulated summer drought differed but scaled with annual precipitation. Biogeosciences 6 (11), 2525–2539.
Green, R.A., Detling, J.K., 2000. Defoliation-induced enhancement of total aboveground nitrogen yield of grasses. Oikos 91 (2), 280–284.
Harper, C.W., Blair, J.M., Fay, P.A., Knapp, A.K., Carlisle, J.D., 2005. Increased rainfall variability and reduced rainfall amount decreases soil CO2 flux in a grassland ecosystem. Global Change Biology 11 (2), 322–334.
Haylock, Goodess, C.M., 2004. Interannual variability of European extreme winter rainfall and links with mean large-scale circulation. International Journal of Climatology 24 (6), 759–776.
Heisler-White, J.L., Blair, J.M., Kelly, E.F., Harmoney, K., Knapp, A.K., 2009. Contingent productivity responses to more extreme rainfall regimes across a grassland biome. Global Change Biology 15 (12), 2894–2904.
Heisler-White, J.L., Knapp, A.K., Kelly, E.F., 2008. Increasing precipitation event size increases aboveground net primary productivity in a semi-arid grassland. Oecologia 158 (1), 129–140.
Heitschmidt, R.K., Haferkamp, Karl, M.G., Hild, A.L., 1999. Drought and grazing: I. Effects on quantity of forage produced. Journal of Range Management 52 (5), 440–446.
Hejcman, M., Schellberg, J., Pavlu, V., 2010. Long-term effects of cutting frequency and liming on soil chemical properties, biomass production and plant species composition of Lolio-Cynosuretum grassland after the cessation of fertilizer application. Applied Vegetation Science 13 (3), 257–269.
Hothorn, T., Bretz, F., Westfall, P. 2008. Simultaneous inference in general parametric models. Biometrical Journal 50, 346–363.
IPCC, 2007. Climate change 2007: The physical science basis. Contribution of Working Group I to the fourth assessment report for the intergovernmental panel on climate change. Cambridge University Press, Cambridge & New York.
Jacob D., 2009. Regionalisierte Szenarien des Klimawandels-Regional climate change scenarios. Raumforschung und Raumordnung 67, 89-96.
Jentsch A., Beierkuhnlein C., 2010. Simulating the future – responses of ecosystems, key species and European provenances to expected climatic trends and events. Nova Acta Leopoldina 112, 89-98.
Jentsch, A., Beierkuhnlein, C., 2008. Research frontiers in climate change: Effects of extreme meteorological events on ecosystems. Comptes Rendus Geoscience 340 (9-10), 621–628.
Jonas, M. , Stäger, T., Schönwiese C.D., 2005. Climate Change 07/05. Berechnung der Wahrscheinlichkeiten für das Eintreten von Extremereignissen durch Klimaänderungen- Schwerpunkt Deutschland. UBA-report, http://www.umweltbundesamt.de/uba-info-medien/mysql_medien.php?anfrage=Kennummer&Suchwort=2946. assessed July 28th in 2011.
Klumpp, K., Fontaine, S., Attard, E., Le Roux, X., Gleixner, G., Soussana, J.-F., 2009. Grazing triggers soil carbon loss by altering plant roots and their control on soil microbial community. Journal of Ecology 97 (5), 876–885.
Knapp, A.K., Fay, P.A., Blair, J.M., Collins, S.L., Smith, M.D., Carlisle, J.D., Harper, C.W., Danner, B.T., Lett, M.S., McCarron, J.K., 2002. Rainfall variability, carbon cycling, and plant species diversity in a mesic grassland. Science 298 (5601), 2202–2205.
Manuscript 6: Increased rainfall variability reduces biomass and forage quality of temperate grassland largely independent of mowing frequency
166
Knapp, A.K., Beier, C., Briske, D.D., Classen, A.T., Luo, Y., Reichstein, M., Smith, M.D., Smith, S.D., Bell, J.E., Fay, P.A., Heisler, J.L., Leavitt, S.W., Sherry, R., Smith, B., Weng, E., 2008. Consequences of More Extreme Precipitation Regimes for Terrestrial Ecosystems. Bioscience 58 (9), 811–821.
Kreyling, J., Beierkuhnlein, C., Elmer, M., Pritsch, K., Radovski, M., Schloter, M., Woellecke, J., Jentsch, A., 2008a. Soil biotic processes remain remarkably stable after 100-year extreme weather events in experimental grassland and heath. Plant and Soil 308 (1-2), 175–188.
Kreyling, J., Wenigmann, M., Beierkuhnlein, C., Jentsch, A., 2008b. Effects of extreme weather events on plant productivity and tissue die-back are modified by community composition. Ecosystems 11 (5), 752–763.
Leriche, H., Le Roux, X., Desnoyers, F., Benest, D., Simioni, G., Abbadie, L., 2003. Grass response to clipping in an African savanna: Testing the grazing optimization hypothesis. Ecological Applications 13 (5), 1346–1354.
Loeser, Crews, T.E., Sisk, T.D., 2004. Defoliation increased above-ground productivity in a semi-arid grassland. Journal of Range Management 57 (5), 442–447.
Maron, J.L., Jeffries, R.L., 2001. Restoring enriched grasslands: Effects of mowing on species richness, productivity, and nitrogen retention. Ecological Applications 11 (4), 1088–1100.
McNaughton, S.J., 1979. Grazing as an optimization process- grass ungulate relationships in the Serengeti. American Naturalist 113 (5), 691–703.
Milchunas, D.G., Lauenroth, W.K., 1993. Quantitative effects of grazing on vegetation and soils over a global range of environments. Ecological Monographs 63 (4), 327–366.
Min, K-S., Zhang, X, Zwiers, F.W., Hegerl, G., 2011. Human contribution to more-intense precipitation extremes. Nature 470, 378-381.
R Development Core Team, 2010. R: A language and environment for statistical computing. R Foundation for Statistical Computing, Vienna, Austria. ISBN 3-900051-07-0, URL http://www.R-project.org.
Sala, O.E., Parton, W.J., La Joyce, Lauenroth, W.K., 1988. Primary production of the central grassland region of the United States. Ecology 69 (1), 40–45.
Swemmer, A.M., Knapp, A.K., 2008. Defoliation synchronizes aboveground growth of co-occuring C-4 grass species. Ecology 89 (10), 2860–2867.
Tennant, D., 1975. Test of a modified line intersect method of estimating root length. Journal of Ecology 63 (3), 995–1001.
Trenberth, K.E., Dai, A., Rasmussen, R.M., Parsons, D.B., 2003. The changing character of precipitation. Bulletin of the American Meteorological Society 84 (9), 1205+.
Turner, C.L., Seastedt, T.R., Dyer, M.I., 1993. Maximization of aboveground grassland production - The role of defoliation frequency, intensity, and history. Ecological Applications 3 (1), 175–186.
Weigelt, A., Weisser, W.W., Buchmann, N., Scherer-Lorenzen, M., 2009. Biodiversity for multifunctional grasslands: equal productivity in high -diversity low –input and low-diversity high-input systems. Biogeosciences 6, 1695-1706.
Yang, Z., Midmore, D.J., 2004. Experimental assessment of the impact of defoliation on growth and production of water-stressed maize and cotton plants. Experimental Agriculture 40 (2), 189–199.
Zhao, W., Chen, S.-P., Lin, G.-H., 2008. Compensatory growth responses to clipping defoliation in Leymus chinensis (Poaceae) under nutrient addition and water deficiency conditions. Plant Ecology 196 (1), 85–99.
Manuscript 7: Combined effects of multifactor climate change and land-use on decomposition in temperate grassland
167
Manuscript 7: Combined effects of multifactor climate change and land-use
on decomposition in temperate grassland Submitted to Soil Biology and Biochemistry on July 27th, 2012
Julia Walter1, Roman Hein1, Carl Beierkuhnlein2, Verena Hammerl3, Anke Jentsch1, Martin
Schädler4, Jan Schuerings1, Juergen Kreyling2
1 Disturbance Ecology, University of Bayreuth, 95440 Bayreuth, Germany 2 Biogeography, BayCEER, University of Bayreuth, 95440 Bayreuth, Germany 3Environmental Genomics, Helmholtz Zentrum Munich, 85764 Neuherberg, Germany 4Department of Community Ecology, Helmholtz Centre for Environmental Research- UFZ, Theodor-Lieser-Straße 4, 06120 Halle, Germany
Corresponding author: Julia Walter, phone:+49-921-552360, mail: julia.walter@uni-
bayreuth.de; fax: +49-921-552315
Summary
1. Climate change is likely to alter decomposition rates through direct effects on soil biotic
activity and indirect effects on litter quality with possible impacts on the global carbon budget
and nutrient cycling. Currently, there is an urgent need to study combined effects of various
climatic drivers and of agricultural practise on decomposition.
2. In an in-situ litter bag experiment, we studied effects of rainfall variability (including
drought plus heavy rain pulses and regular irrigation) interacting with increased winter
temperature and precipitation and with changes in cutting frequency, on decomposition in a
temperate grassland. Following a realistic scenario, litter bags contained litter out of all
different climate and land-use manipulations and were placed within the plots of litter origin.
Moreover, to disentangle causes for altered decomposition, we studied decomposition of litter
Manuscript 7: Combined effects of multifactor climate change and land-use on decomposition in temperate grassland
168
pre-exposed to the manipulations under ambient standard conditions and decomposition of
standard material under differing rainfall variability in additional experimental approaches.
3. Decomposition was reduced when litter bags were exposed to drought for six weeks within
an 11 months period. Neither additional winter rain nor winter warming had an effect on
decomposition, probably because winter warming reduced snow cover and increased
variability of surface temperatures. Climate manipulations did neither change litter quality,
nor decomposition under ambient standard conditions. Thus, reduced decomposition under
extreme rainfall variability and drought may be mainly caused by a decrease in soil biotic
activity, as indicated by reduced decomposition of standard material during drought.
4. More frequent cutting strongly stimulated decomposition, however, this stimulating effect
was absent under extreme rainfall variability including drought. The stimulation of
decomposition under more frequent cutting was attributed to changes in litter quality, namely
a decrease in C/N ratio. Accordingly, litter from more frequently cut communities
decomposed faster under ambient standardized conditions.
5. Projected increases in drought frequency under climate change may inhibit decomposition
and alter nutrient and carbon cycling along with soil quality. Especially decomposition in
frequently cut grassland appears vulnerable towards drought. Under winter warming, a
reduction of snow cover leading to more variable surface temperatures may counteract
increased carbon loss transiently until the cooling capacity of missing snow cover is
exceeded.
Keywords: carbon turnover, climate change, C/N ratio, EVENT experiments, extreme
weather event, global warming, litter bag, microbial activity, nutrient cycling
1. Introduction
Litter decomposition plays a major role for the carbon budget as well as for nutrient
cycling in terrestrial ecosystems (Aerts 1997; Chapin et al. 2002). Decomposition processes
are mainly governed by the three factors climate, leaf litter quality and the composition and
Manuscript 7: Combined effects of multifactor climate change and land-use on decomposition in temperate grassland
169
activity of the decomposer community (Swift et al. 1979; Lavelle et al. 1993; Aerts 1997).
Thus, climate change is likely to alter decomposition processes: Changes in litter
decomposition rates might severely affect soil quality along with carbon and nutrient cycling.
As grassland biomes store up to 30 % of soil carbon worldwide (Risch et al. 2007), effects of
climatic change on decomposition in grassland are of major interest, because positive
feedback processes may intensify warming due to rising CO2 levels (Bontti et al. 2009).
Climate change does not only result in a gradual warming trend, but also increases intra-
annual rainfall variability, causing longer dry periods and more intense heavy rain spells
(Meehl et al. 2007). Moreover, within Central Europe, warming will be most pronounced
during winter, when also the overall precipitation amount is projected to increase (Christensen
et al. 2007).
Changing climate is likely to alter decomposition processes through short term
changes in soil moisture or temperature which directly affect soil biological processes,
including microbial and soil community composition and activity (Hobbie 1996; Aerts 1997).
Indirectly, climate change will alter decomposition through chemical changes of litter within
single plants as well as through shifts in plant species composition (Hobbie 1996; Aerts 2006;
Fortunel et al. 2009; Baptist et al. 2010; Osanai et al. 2012).
Reduced water availability or drought often have a negative effect on litter
decomposition or soil respiration (Lensing & Wise 2007; Risch et al. 2007; van Meeteren et
al. 2008; Bontti et al. 2009; Joos et al. 2010), although these effects may be only short-termed
(Kemp et al. 2003; O‘Neill et al. 2003) or even non-existent (Kreyling et al. 2008).
Constantly high water availability has also been shown to reduce decomposition (Tiemann &
Billings 2011; Lensing & Wise 2007}. Warming has often been found to increase litter
decomposition (Hobbie 1996; van Meeteren et al. 2008; Kirwan & Blum 2011) due to an
increase in microbial and enzymatic activity (Chapin et al. 2002; Aerts 2006; Allison &
Treseder 2011), although some studies suggest that this effect does not always occur
Manuscript 7: Combined effects of multifactor climate change and land-use on decomposition in temperate grassland
170
(Giardina & Ryan 2000; Risch et al. 2007). Furthermore, increased winter temperatures are
likely to result in colder soil conditions due to snow melting (Kreyling 2010), which may
even decrease decomposition. Accordingly, no consensus about the role of global warming on
decomposition has emerged yet.
The few existing studies combining multiple climatic factors often found non-additive
effects of the different factors, as, for instance, combination of CO2 enrichment and warming
did not react in the same way as both factors alone on microbial biomass carbon (Andresen et
al. 2010) or as temperature-dependence of decomposition depended on moisture-availability
(Butenschoen et al. 2011). Thus, acceleration of decomposition caused by warming may be
offset under drier conditions (Gavazov 2010; Butenschoen et al. 2011).
Therefore, there is an urgent need to further study interactions between different
climatic factors according to scenarios of future change, most importantly the simultaneously
on-going warming and changed precipitation variability, under natural conditions (Aerts
2006; Butenschoen et al. 2011). Moreover, the impact of agricultural practise, such as
frequency of cutting on decomposition needs to be addressed, as those may strongly alter
decomposition, e.g. by changes in litter quality caused by more frequent cutting (Walter et al.
2012).
To study combined effects of increased inter-annual rainfall variability with winter
climate change scenarios and agricultural practise on decomposition, we conducted a litter
bag experiment in semi-natural grassland under different climate change scenarios and cutting
frequencies . Grassland was subjected to summer drought followed by heavy rain pulses
(extreme variability), to regular irrigation (low variability) and to ambient rainfall (mid
variability) in combination with winter warming, additional winter rain and two cutting
frequencies. We wanted to disentangle the causes for possible changes in decomposition,
being either leaf chemical alterations or modifications in soil biotic activity, by testing
decomposition in an in-situ experiment and under standardized conditions.
Manuscript 7: Combined effects of multifactor climate change and land-use on decomposition in temperate grassland
171
Our hypotheses were that
(1.) extreme rainfall variability including drought will reduce decomposition rates
(2.) more frequent cutting will stimulate decomposition independent of summer rainfall
variability, caused by more beneficial leaf chemistry, e.g. younger leaves with higher nitrogen
content
(3.) winter warming will increase decomposition, except for winter warming leading to actual
decreases in temperature on the soil surface due to snow-melt and thus loss of insulation
(4.) additional winter rain will not affect decomposition as winters in Central Europe are
already usually wet and decomposition should not be moisture-limited in this time
2. Material and Methods
2.1. Study site and experimental setup
The study was conducted within the EVENT II experiment, which investigates the
impact of inter-annual rainfall variability in combination with winter climate change and
agricultural practise in temperate grassland. The experiment was established in 2008 in a
semi-natural grassland in the Ecological Botanical Garden of the University of Bayreuth,
Germany, Central Europe (49°55´19´´N, 11°3455``E, 365 m asl) (Walter et al. 2012) and this
study was conducted in 2010-2011 when three years of rainfall manipulations were already
completed. Communities are dominated by tall grasses, especially Alopecurus pratensis L.
(meadow foxtail) and Arrhenatherum elatius L. (tall oat grass). The regional climate is
temperate and moderately continental.
The experimental design for this study consisted of five replications of three rainfall
variability regimes applied in the vegetation periods in blocks 6 m x 4 m in size. For the
manipulations of rainfall variability the temporal distribution and the magnitude of rainfall per
rainfall event in the growing season was altered, but annual rainfall amount was kept constant
since 2009 by applying compensation irrigations. The three rainfall variability regimes were:
Manuscript 7: Combined effects of multifactor climate change and land-use on decomposition in temperate grassland
172
(1) low variability, with weekly irrigation corresponding to the 30 year average amount of the
respective week, ensuring a continuous water supply (low), (2) mid variability, receiving
ambient rainfall plus compensation irrigations (4 times per year) to keep the annual rainfall
amount constant at quarterly intervals (mid) and (3) extreme variability, subjected to a
summer drought treatment, followed by heavy rain pulses (extreme). For the low variability
treatment, periods from 1971 to 2000 served as a reference (data: Foken 2003). Missing
amounts on natural precipitation were added if the weekly precipitation was less than the
long-term average for the same week to ensure continuous water availability. If weekly
precipitation exceeded the long-term sum, it was not subtracted for the next irrigation. The
irrigated amount of 925 mm from September 1st 2010 until August 31st 2011, applied on all
variability treatments, exceeded the 30-year-average sum for this time period by 202 mm,
thus simulating a rather wet year. Table 1 lists the irrigated amounts of all compensation
irrigations for the mid and extreme variability treatment.
Table 1 Compensation irrigations applied on mid- and extreme variability treatments during the experimental period to ensure an overall identical precipitation sum in all rainfall variability regimes date rainfall variability regime mid extremeSeptember 27th 2010 17.5 17.5May 23rd 2011 52.9 52.9July 4th 2011 26.3 26.3August 15th 2011 33.9 229.9** applied on two consecutive days
For the extreme variability treatment, tunnel-shaped rain-out-shelters excluded natural
precipitation from June 22nd until August 3rd in 2010 and from July 5th until August 16th in
2011, resulting in an extreme summer drought of 42 days, followed by two days of extreme
irrigation as compensation irrigations. The PE-foil of the rain-out-shelters allowed nearly 90
% of photosynthetic active radiation. Shelters were started off a height of 0.8 m to reduce
microclimatic artifacts. Irrigation was applied using portable irrigation systems with a drop
size and rainfall intensity comparable to natural rainfall events. A lateral surface flow was
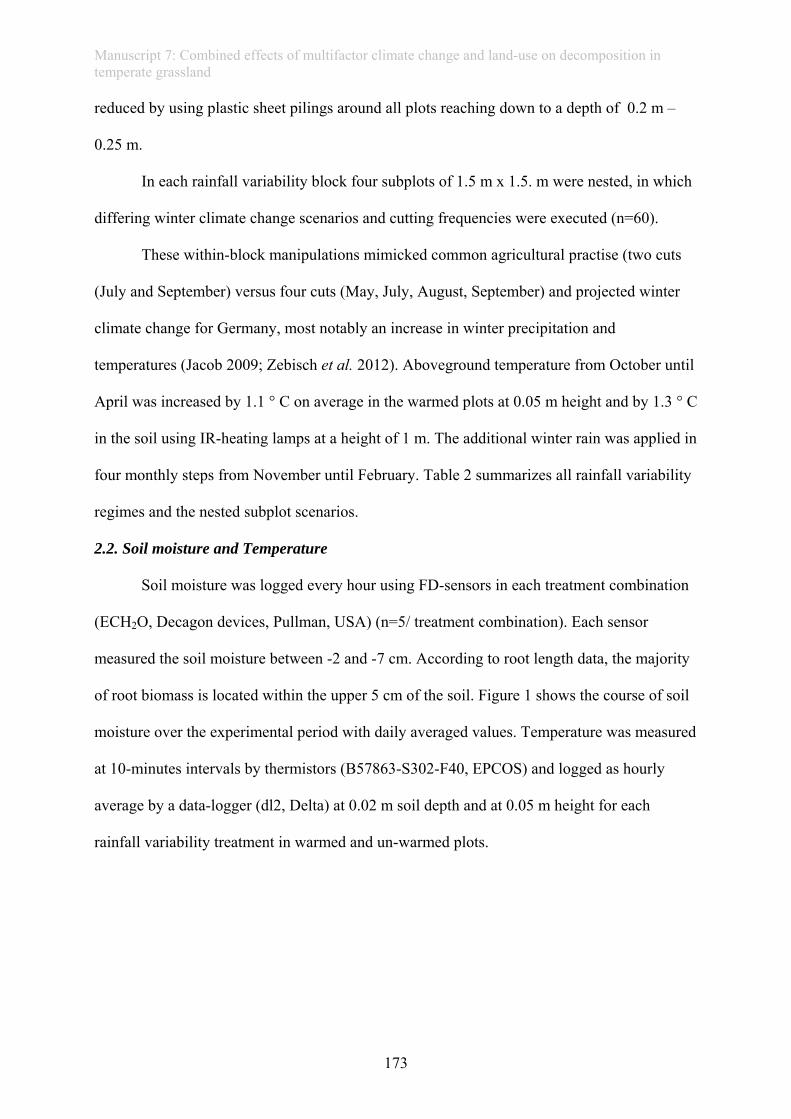
Manuscript 7: Combined effects of multifactor climate change and land-use on decomposition in temperate grassland
173
reduced by using plastic sheet pilings around all plots reaching down to a depth of 0.2 m –
0.25 m.
In each rainfall variability block four subplots of 1.5 m x 1.5. m were nested, in which
differing winter climate change scenarios and cutting frequencies were executed (n=60).
These within-block manipulations mimicked common agricultural practise (two cuts
(July and September) versus four cuts (May, July, August, September) and projected winter
climate change for Germany, most notably an increase in winter precipitation and
temperatures (Jacob 2009; Zebisch et al. 2012). Aboveground temperature from October until
April was increased by 1.1 ° C on average in the warmed plots at 0.05 m height and by 1.3 ° C
in the soil using IR-heating lamps at a height of 1 m. The additional winter rain was applied in
four monthly steps from November until February. Table 2 summarizes all rainfall variability
regimes and the nested subplot scenarios.
2.2. Soil moisture and Temperature
Soil moisture was logged every hour using FD-sensors in each treatment combination
(ECH2O, Decagon devices, Pullman, USA) (n=5/ treatment combination). Each sensor
measured the soil moisture between -2 and -7 cm. According to root length data, the majority
of root biomass is located within the upper 5 cm of the soil. Figure 1 shows the course of soil
moisture over the experimental period with daily averaged values. Temperature was measured
at 10-minutes intervals by thermistors (B57863-S302-F40, EPCOS) and logged as hourly
average by a data-logger (dl2, Delta) at 0.02 m soil depth and at 0.05 m height for each
rainfall variability treatment in warmed and un-warmed plots.
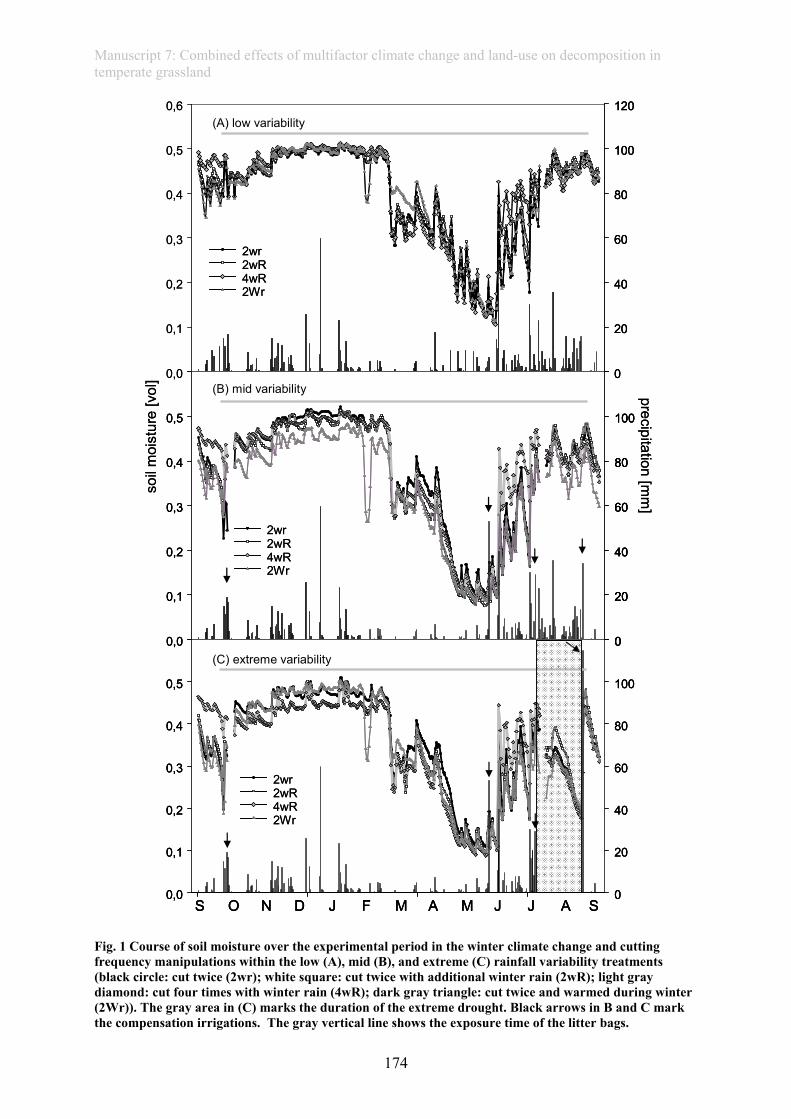
Manuscript 7: Combined effects of multifactor climate change and land-use on decomposition in temperate grassland
174
0,0
0,1
0,2
0,3
0,4
0,5
0,6
0
20
40
60
80
100
120
2wr2wR4wR2Wr
0,0
0,1
0,2
0,3
0,4
0,5
0
20
40
60
80
100
0,0
0,1
0,2
0,3
0,4
0,5
0
20
40
60
80
100
S O N D J F M A M J J A S
2wr2wR4wR2Wr
2wr2wR4wR2Wr
(A) low variability
(B) mid variability
(C) extreme variability
soil
moi
stur
e[v
ol]
precipitation[m
m]
0,0
0,1
0,2
0,3
0,4
0,5
0,6
0
20
40
60
80
100
120
0
20
40
60
80
100
120
2wr2wR4wR2Wr
2wr2wR4wR2Wr
0,0
0,1
0,2
0,3
0,4
0,5
0
20
40
60
80
100
0,0
0,1
0,2
0,3
0,4
0,5
0
20
40
60
80
100
0
20
40
60
80
100
0,0
0,1
0,2
0,3
0,4
0,5
0
20
40
60
80
100
0,0
0,1
0,2
0,3
0,4
0,5
0
20
40
60
80
100
S O N D J F M A M J J A SS O N D J F M A M J J A S
2wr2wR4wR2Wr
2wr2wR4wR2Wr
2wr2wR4wR2Wr
2wr2wR4wR2Wr
(A) low variability
(B) mid variability
(C) extreme variability
soil
moi
stur
e[v
ol]
precipitation[m
m]
Fig. 1 Course of soil moisture over the experimental period in the winter climate change and cutting frequency manipulations within the low (A), mid (B), and extreme (C) rainfall variability treatments (black circle: cut twice (2wr); white square: cut twice with additional winter rain (2wR); light gray diamond: cut four times with winter rain (4wR); dark gray triangle: cut twice and warmed during winter (2Wr)). The gray area in (C) marks the duration of the extreme drought. Black arrows in B and C mark the compensation irrigations. The gray vertical line shows the exposure time of the litter bags.
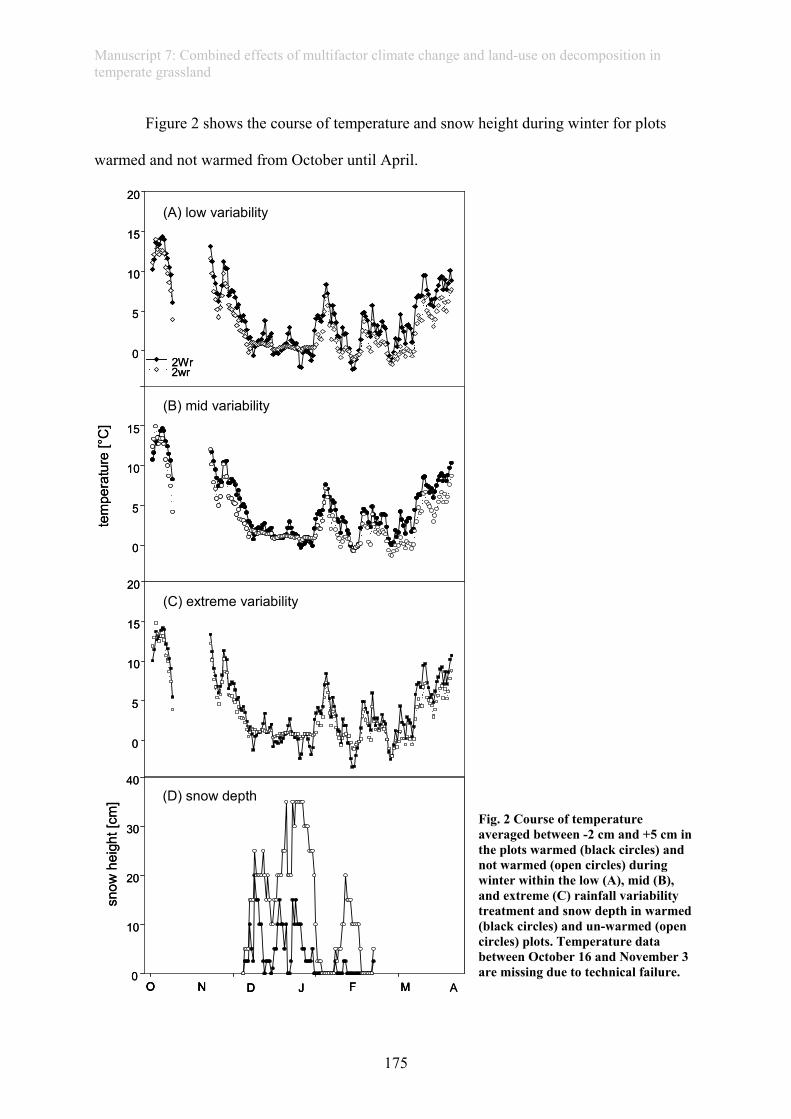
Manuscript 7: Combined effects of multifactor climate change and land-use on decomposition in temperate grassland
175
Figure 2 shows the course of temperature and snow height during winter for plots
warmed and not warmed from October until April.
Fig. 2 Course of temperature averaged between -2 cm and +5 cm in the plots warmed (black circles) and not warmed (open circles) during winter within the low (A), mid (B), and extreme (C) rainfall variability treatment and snow depth in warmed (black circles) and un-warmed (open circles) plots. Temperature data between October 16 and November 3 are missing due to technical failure.
O N D J F M A
tem
pera
ture
[°C
]
0
5
10
15
20
0
5
10
15
0
5
10
15
20
2Wr2wr
(A) low variability
(B) mid variability
(C) extreme variability
snow
heig
ht[c
m]
0
10
20
30
40(D) snow depth
O N D JO NO N D JD J F MF M A
tem
pera
ture
[°C
]
0
5
10
15
20
0
5
10
15
0
5
10
15
20
2Wr2wr2Wr2wr
(A) low variability
(B) mid variability
(C) extreme variability
snow
heig
ht[c
m]
0
10
20
30
40(D) snow depth
Manuscript 7: Combined effects of multifactor climate change and land-use on decomposition in temperate grassland
176
2.3. Sampling design for the litter bags and chemical analyses
To investigate the effects of rainfall variability regime in interaction with the different
winter climate change and cutting scenarios, biomass sampling for the litter bags was
conducted at September 6th and 7th in 2010. We obtained mixed samples by cutting four
different circular areas, 0.20 m in diameter in each plot (n=60). To estimate effects of changes
in leaf chemicals caused by different cutting regimes and to disentangle intra- from
interspecific alterations, we additionally sampled a single grass species, A. pratensis out of the
subplots 2wR and 4wR. All samples were oven-dried for 72 hours at 40 °C. After drying, 3 g
± 0.03 g were weighed into nylon mesh bags (10 cm x 20 cm) with a mesh size of 1 mm and
the exact weight was recorded. This allows fungi, bacteria, microfauna and most of the
mesofauna to attack the litter (Chapin et al. 2002). Mixed samples and A. pratensis out of
2wR and 4wR plots were ground in a ball mill and analysed for carbon (C) and nitrogen (N)
with an elemental analyser (Thermo Quest Flash EA 1112).
2.4. Placement of the litter bags
To test decomposition under natural conditions, two mixed litter bags per plot were
placed in the respective plots their litter was sampled from in late September. Bags were
placed on the vegetation that was cut to the ground and attached to the ground using two
plastic coated wires placed diagonally over the litter bag. Litter bags were removed in late
August 2011 (after 11 month) and thus received a direct summer drought followed by a
rewetting pulse in 2011.
To disentangle the causes for effects of rainfall variability regime and cutting
frequency on decomposition, mixed samples out of all rainfall variability regimes and the
subplots 2wR and 4wR (n=30) were placed on a standardized, untreated, mulched plot outside
the experimental site. To disentangle chemical effects caused by intra-specific (variations of
leaf chemicals within single plant species) or inter-specific (variations in leaf chemicals due to
changes in plant community composition) alteration the A. pratensis samples were also placed
Manuscript 7: Combined effects of multifactor climate change and land-use on decomposition in temperate grassland
177
on this untreated plot (n=30). Those bags were removed in May 2011, after 8 months of
decomposition.
After retrieval, all bags were dried for 72 hours at 40° C and stored in air tight
containers with silica gel until they were weighed on a micro-balance. Percentage of dry
weight loss was calculated as a proxy for decomposition. Table 2 gives an overview over the
sampling design and placement of the litter bags.
Table 2 Descriptions and abbreviations of applied rainfall variability regimes during the vegetation period and of the therein nested winter climate change and cutting frequency scenarios and sampling design for the litter bags variability description mowing
frequency/ winter climate
description mixed litter bags within experiment*
untreated standard plot
low weekly irrigation 2wr mown twice/ year, no further manipulation 2 mixed, Sept‐August
with 2wR mown twice, 60 mm winter rain added 2 mixed, Sept‐August 2 mixed, 2 A.pratensis
30‐year average 4wR mown four times, 60 mm winter rain added 2 mixed, Sept‐August 2 mixed, 2 A.pratensis
2Wr mown twice, winter warming October‐April 2 mixed, Sept‐August
mid ambient rainfall 2wr mown twice/ year, no further manipulation 2 mixed, Sept‐August
with 2wR mown twice, 60 mm winter rain added 2 mixed, Sept‐August 2 mixed, 2 A.pratensis
compensation 4wR mown four times, 60 mm winter rain added 2 mixed, Sept‐August 2 mixed, 2 A.pratensis
irrigation 2Wr mown twice, winter warming October‐April 2 mixed, Sept‐August
extreme 42 days summer 2wr mown twice/ year, no further manipulation 2 mixed, Sept‐August
drought followed 2wR mown twice, 60 mm winter rain added 2 mixed, Sept‐August 2 mixed, 2 A.pratensis
by extreme 4wR mown four times, 60 mm winter rain added 2 mixed, Sept‐August 2 mixed, 2 A.pratensis
compensation 2Wr mown twice, winter warming October‐April 2 mixed, Sept‐August
irrigation pulses
* bags were sampled from and placed on the respective treatment combination
** bags were sampled from the respective treatment combination and placed on untreated control plot to disentangle causes for changes
in decomposition rates (litter quality or soil biotic activity)
2.5. Soil biotic activity
A bait-lamina test (Kratz 1998) was performed to measure effects of rainfall
variability on soil biotic activity in August 2011, during the drought period in the extreme
variability treatment. This approach complements the decomposition trial with plot-specific
litter by investigating the treatment effects using a standard material. Each bait-lamina stick
(Terra Protecta® GmbH, Berlin, Germany) contained 16 baits which consisted of a wet
mixture of cellulose, bran flakes and activated coal (70:27:3). Within each rainfall variability
Manuscript 7: Combined effects of multifactor climate change and land-use on decomposition in temperate grassland
178
regime, only the 2wr, 2wR and 2W subplots were included, as in the preceding year, cutting
frequency was shown not to affect soil enzymatic activity (see supplemental information). In
each plot, two baited sticks were placed vertically into soil and remained there for 14 days. At
the end of the exposure period each stick was carefully removed from soil, placed into plastic
bags and stored in a freezer at -30 ° C until analysis. Perforated baits of the cleaned bait sticks
were recorded and expressed as percentage of eaten baits per plot.
2.6. Statistical analysis
To test for significant effects of summer rainfall variability in the differing winter
climate change and cutting frequency scenarios, two-factorial ANOVA with the fixed factors
“rainfall variability regime” and “winter climate change and cutting scenario” were
performed. As each rainfall variability block was restricted to occur just once in each row and
each column of the design, we included the row and the column of the weather treatment
blocks as random factors in our linear mixed effect model. This also implements the nesting
of winter climate change/ cutting scenario within the rainfall variability blocks in the model,
as one block with its corresponding and unique row and column combination includes four
values of the response variable (Faraway 2006). Tukey HSD tests were calculated for post-
hoc analysis of differences between rainfall variability treatments. As the subplot scenarios
were not all directly comparable with each other we only included the directly comparable
data in further mixed models for post-hoc analysis to avoid unnecessary comparisons, if the
effect of subplot scenarios or the interaction of subplot scenarios with rainfall variability was
significant. Scenarios that are directly comparable as only one factor is varied are 2x +wr with
4x +wr to test for effects of cutting frequency, 2x +wr with 2x to test for effects of winter rain
and 2x +ww with 2x to test for effects of winter warming. These data were analysed for
effects of winter climate change and cutting frequency and of combined effects of those with
rainfall variability.
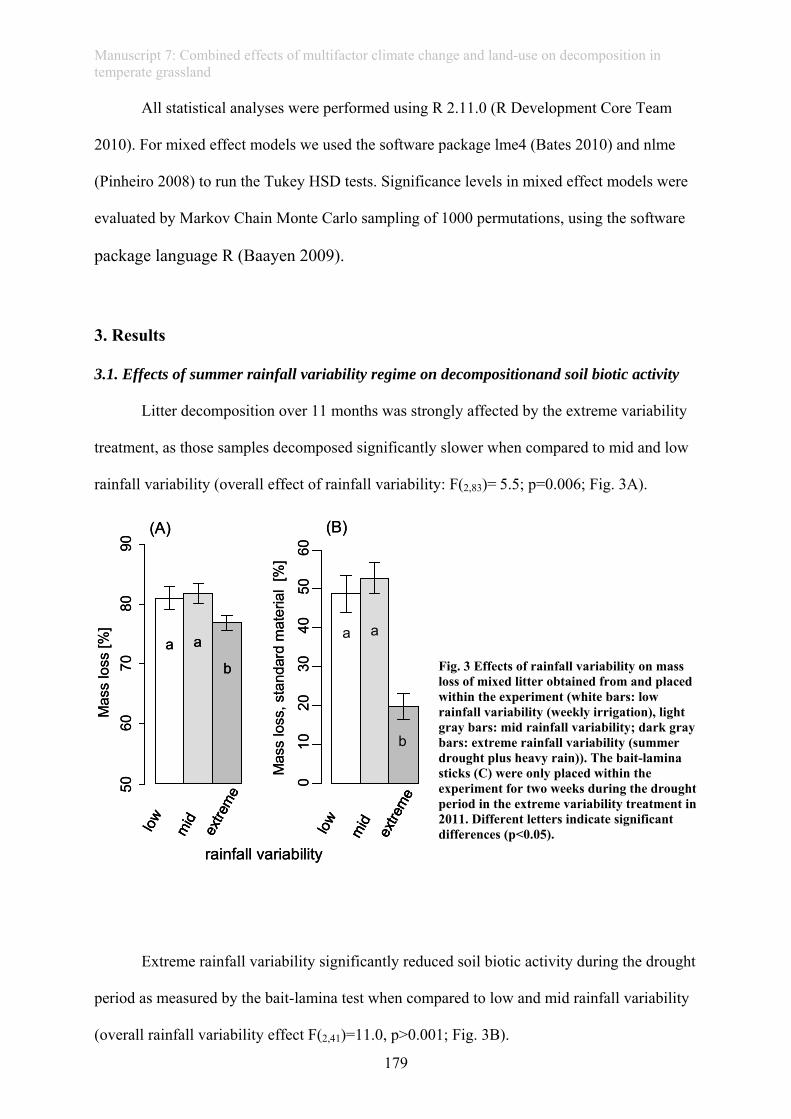
Manuscript 7: Combined effects of multifactor climate change and land-use on decomposition in temperate grassland
179
All statistical analyses were performed using R 2.11.0 (R Development Core Team
2010). For mixed effect models we used the software package lme4 (Bates 2010) and nlme
(Pinheiro 2008) to run the Tukey HSD tests. Significance levels in mixed effect models were
evaluated by Markov Chain Monte Carlo sampling of 1000 permutations, using the software
package language R (Baayen 2009).
3. Results
3.1. Effects of summer rainfall variability regime on decompositionand soil biotic activity
Litter decomposition over 11 months was strongly affected by the extreme variability
treatment, as those samples decomposed significantly slower when compared to mid and low
rainfall variability (overall effect of rainfall variability: F(2,83)= 5.5; p=0.006; Fig. 3A).
Fig. 3 Effects of rainfall variability on mass loss of mixed litter obtained from and placed within the experiment (white bars: low rainfall variability (weekly irrigation), light gray bars: mid rainfall variability; dark gray bars: extreme rainfall variability (summer drought plus heavy rain)). The bait-lamina sticks (C) were only placed within the experiment for two weeks during the drought period in the extreme variability treatment in 2011. Different letters indicate significant differences (p<0.05).
Extreme rainfall variability significantly reduced soil biotic activity during the drought
period as measured by the bait-lamina test when compared to low and mid rainfall variability
(overall rainfall variability effect F(2,41)=11.0, p>0.001; Fig. 3B).
a a
b
midlow
extre
me
(A)
Mas
slo
ss, s
tand
ard
mat
eria
l [%
]
010
2030
4050
60
Mas
slo
ss[%
]50
6070
8090
(B)
a a
b
rainfall variability
midlow
extre
me
a a
ba a
b
midlow
extre
me
midlow
extre
me
(A)
Mas
slo
ss, s
tand
ard
mat
eria
l [%
]
010
2030
4050
60
Mas
slo
ss[%
]50
6070
8090
(B)
a a
b
rainfall variability
midlow
extre
me
midlow
extre
me
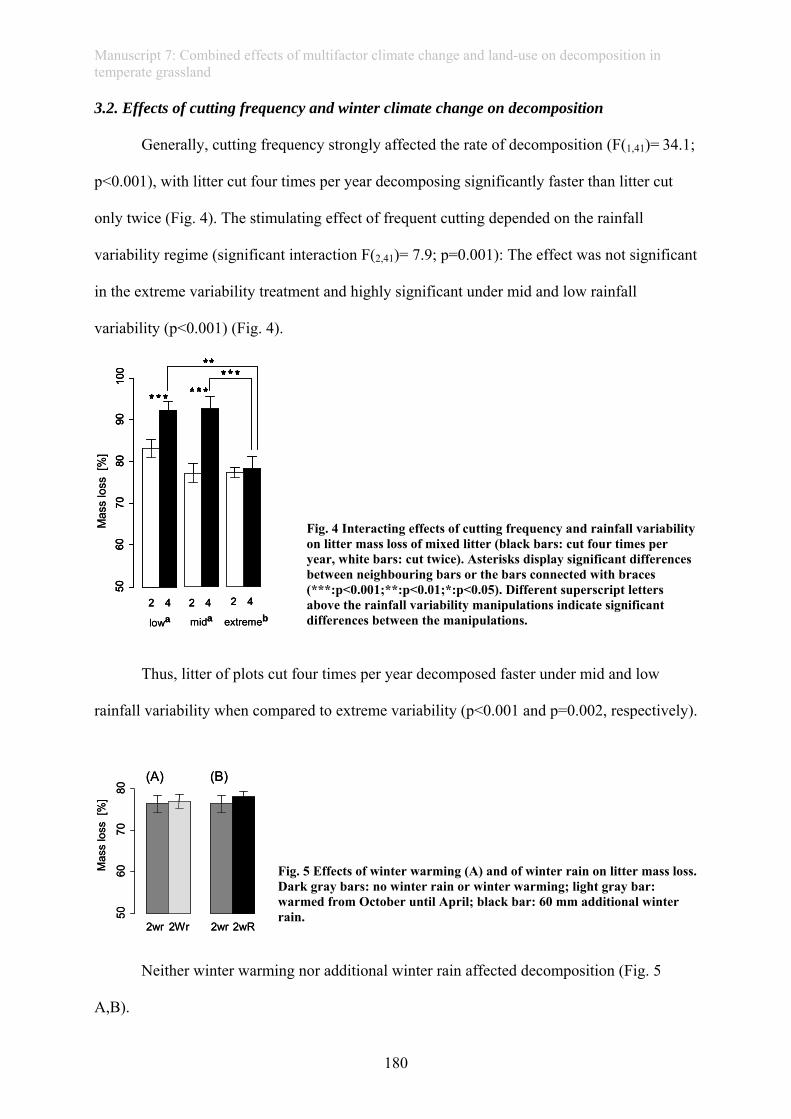
Manuscript 7: Combined effects of multifactor climate change and land-use on decomposition in temperate grassland
180
3.2. Effects of cutting frequency and winter climate change on decomposition
Generally, cutting frequency strongly affected the rate of decomposition (F(1,41)= 34.1;
p<0.001), with litter cut four times per year decomposing significantly faster than litter cut
only twice (Fig. 4). The stimulating effect of frequent cutting depended on the rainfall
variability regime (significant interaction F(2,41)= 7.9; p=0.001): The effect was not significant
in the extreme variability treatment and highly significant under mid and low rainfall
variability (p<0.001) (Fig. 4).
Fig. 4 Interacting effects of cutting frequency and rainfall variability on litter mass loss of mixed litter (black bars: cut four times per year, white bars: cut twice). Asterisks display significant differences between neighbouring bars or the bars connected with braces (***:p<0.001;**:p<0.01;*:p<0.05). Different superscript letters above the rainfall variability manipulations indicate significant differences between the manipulations.
Thus, litter of plots cut four times per year decomposed faster under mid and low
rainfall variability when compared to extreme variability (p<0.001 and p=0.002, respectively).
Fig. 5 Effects of winter warming (A) and of winter rain on litter mass loss. Dark gray bars: no winter rain or winter warming; light gray bar: warmed from October until April; black bar: 60 mm additional winter rain.
Neither winter warming nor additional winter rain affected decomposition (Fig. 5
A,B).
extremeblowa mida2 4 2 4 2 4
5060
7080
9010
0
Mas
slo
ss[%
]
extremeblowa mida2 42 4 2 42 4 2 42 4
5060
7080
9010
050
6070
8090
100
Mas
slo
ss[%
]
(A) (B)
Mas
slo
ss[%
]
5060
7080
2wr 2Wr 2wr 2wR
(A) (B)
Mas
slo
ss[%
]
5060
7080
2wr 2Wr 2wr 2wR
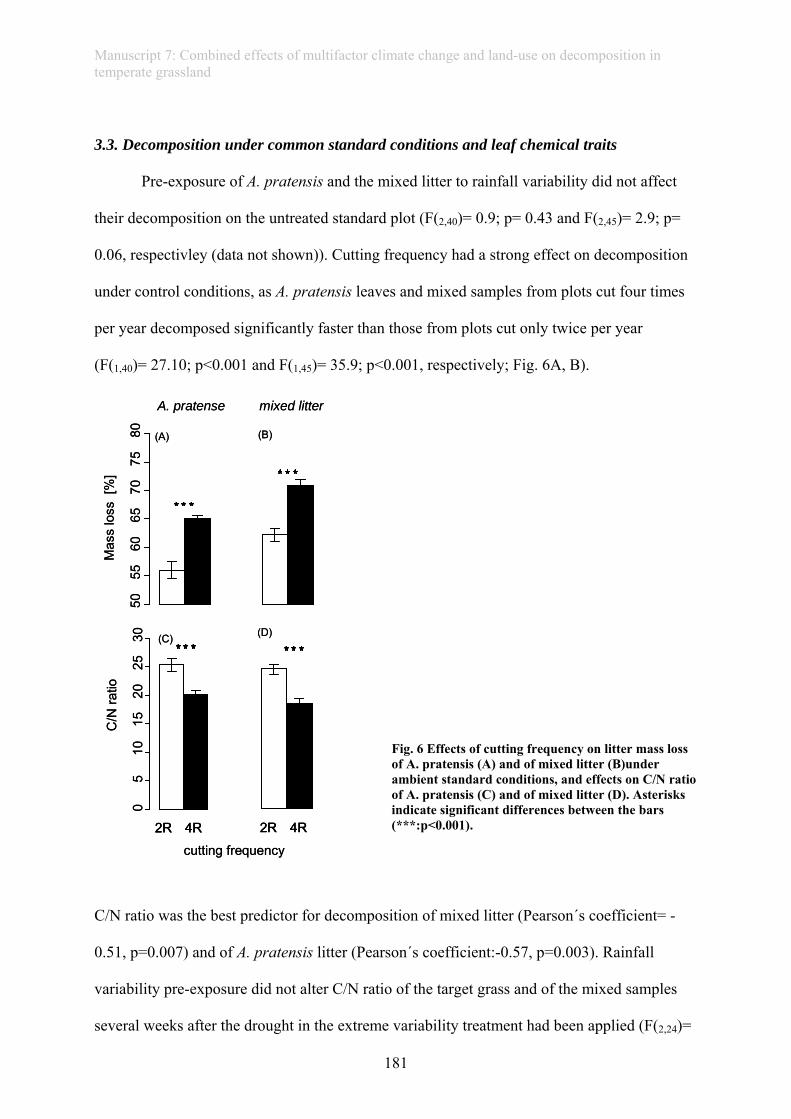
Manuscript 7: Combined effects of multifactor climate change and land-use on decomposition in temperate grassland
181
3.3. Decomposition under common standard conditions and leaf chemical traits
Pre-exposure of A. pratensis and the mixed litter to rainfall variability did not affect
their decomposition on the untreated standard plot (F(2,40)= 0.9; p= 0.43 and F(2,45)= 2.9; p=
0.06, respectivley (data not shown)). Cutting frequency had a strong effect on decomposition
under control conditions, as A. pratensis leaves and mixed samples from plots cut four times
per year decomposed significantly faster than those from plots cut only twice per year
(F(1,40)= 27.10; p<0.001 and F(1,45)= 35.9; p<0.001, respectively; Fig. 6A, B).
Fig. 6 Effects of cutting frequency on litter mass loss of A. pratensis (A) and of mixed litter (B)under ambient standard conditions, and effects on C/N ratio of A. pratensis (C) and of mixed litter (D). Asterisks indicate significant differences between the bars (***:p<0.001).
C/N ratio was the best predictor for decomposition of mixed litter (Pearson´s coefficient= -
0.51, p=0.007) and of A. pratensis litter (Pearson´s coefficient:-0.57, p=0.003). Rainfall
variability pre-exposure did not alter C/N ratio of the target grass and of the mixed samples
several weeks after the drought in the extreme variability treatment had been applied (F(2,24)=
Mas
slo
ss[%
]
5055
6065
7075
80
C/N
ratio
05
1015
2025
30
(A)
(C) (D)
A. pratense mixed litter
(B)
2R 4R
cutting frequency
2R 4R
Mas
slo
ss[%
]
5055
6065
7075
80
C/N
ratio
05
1015
2025
30
(A)
(C) (D)
A. pratense mixed litter
(B)
2R 4R2R 4R
cutting frequency
2R 4R2R 4R
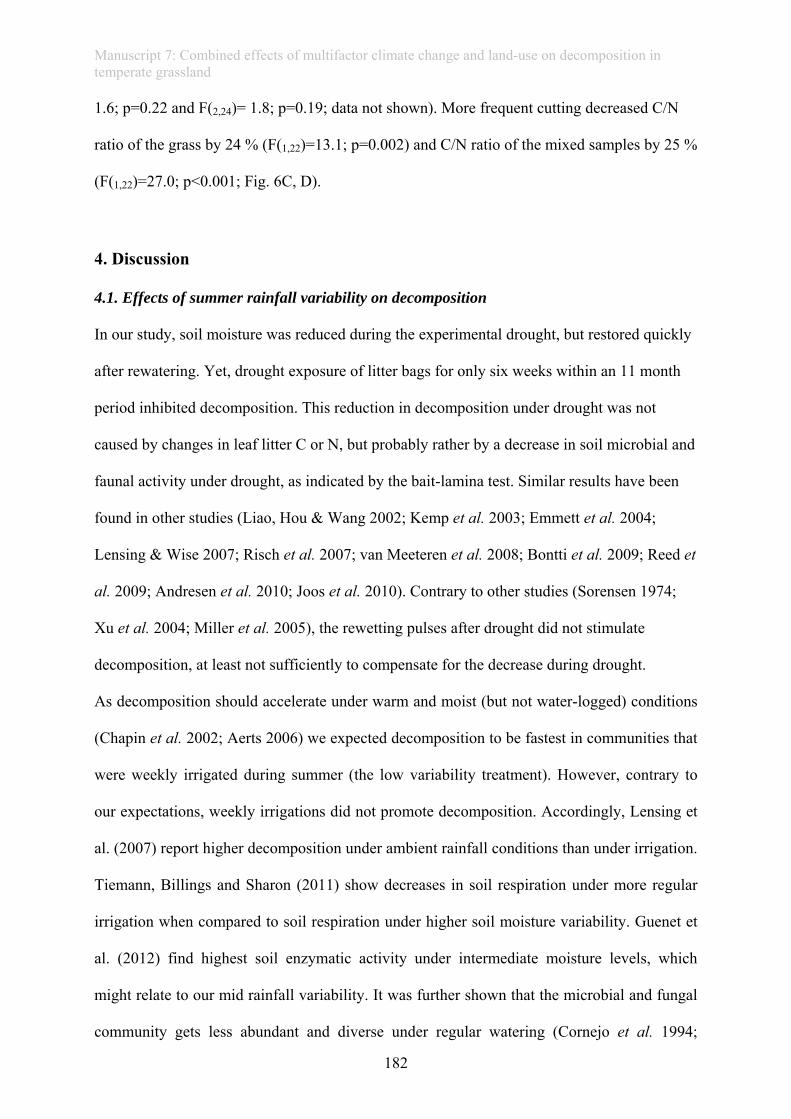
Manuscript 7: Combined effects of multifactor climate change and land-use on decomposition in temperate grassland
182
1.6; p=0.22 and F(2,24)= 1.8; p=0.19; data not shown). More frequent cutting decreased C/N
ratio of the grass by 24 % (F(1,22)=13.1; p=0.002) and C/N ratio of the mixed samples by 25 %
(F(1,22)=27.0; p<0.001; Fig. 6C, D).
4. Discussion
4.1. Effects of summer rainfall variability on decomposition
In our study, soil moisture was reduced during the experimental drought, but restored quickly
after rewatering. Yet, drought exposure of litter bags for only six weeks within an 11 month
period inhibited decomposition. This reduction in decomposition under drought was not
caused by changes in leaf litter C or N, but probably rather by a decrease in soil microbial and
faunal activity under drought, as indicated by the bait-lamina test. Similar results have been
found in other studies (Liao, Hou & Wang 2002; Kemp et al. 2003; Emmett et al. 2004;
Lensing & Wise 2007; Risch et al. 2007; van Meeteren et al. 2008; Bontti et al. 2009; Reed et
al. 2009; Andresen et al. 2010; Joos et al. 2010). Contrary to other studies (Sorensen 1974;
Xu et al. 2004; Miller et al. 2005), the rewetting pulses after drought did not stimulate
decomposition, at least not sufficiently to compensate for the decrease during drought.
As decomposition should accelerate under warm and moist (but not water-logged) conditions
(Chapin et al. 2002; Aerts 2006) we expected decomposition to be fastest in communities that
were weekly irrigated during summer (the low variability treatment). However, contrary to
our expectations, weekly irrigations did not promote decomposition. Accordingly, Lensing et
al. (2007) report higher decomposition under ambient rainfall conditions than under irrigation.
Tiemann, Billings and Sharon (2011) show decreases in soil respiration under more regular
irrigation when compared to soil respiration under higher soil moisture variability. Guenet et
al. (2012) find highest soil enzymatic activity under intermediate moisture levels, which
might relate to our mid rainfall variability. It was further shown that the microbial and fungal
community gets less abundant and diverse under regular watering (Cornejo et al. 1994;
Manuscript 7: Combined effects of multifactor climate change and land-use on decomposition in temperate grassland
183
Hawkes et al. 2011), which might also inhibit a promotion of decomposition under regularly
watered conditions.
4.2. Effects of cutting frequency and interactions with summer rainfall variability
As expected, more frequent cutting promoted decomposition. This can be explained by
a more beneficial C/N ratio and thus a faster decomposition in community mixtures as well as
in the single grass species, which has been shown for decomposition under untreated standard
conditions. As leaf chemical changes in the single grass species pointed in the same direction
and were of the same magnitude as changes in mixed litter we conclude that the chemical
changes of mixed litter are due to intra-specific changes and not to changes in community
composition. Thus, in our study the influence on decay processes of intra-specific variation
under different environmental conditions was larger than the influence inter-specific
variations, which contrasts other findings (Hobbie 1996; Aerts 2006; Wardle et al. 2009).
Cutting frequency also strongly interacted with summer rainfall variability as decomposition
was not stimulated by cutting four times per year when litter was derived out of the extreme
rainfall variability regime. Unlike the general accelerating effect of more frequent cutting on
decomposition, the reduction of this accelerating effect under drought cannot be explained by
changes in leaf chemicals, as it is not mirrored in C/N ratio alterations and did not occur on
the untreated standard plot. In the preceding year 2009 it was shown that cutting frequency
does not alter soil enzymatic activity (see SI for an example), but we do not have data from
our experimental period. Microclimatic conditions might react differently under drought in
more frequently cut communities. During summer, soil moisture was often slightly higher in
more frequently cut communities, which might have rendered the microbial community more
vulnerable towards drought. Further studies should investigate long-term microbial activity
and microclimate during and after drought in more and less frequently cut meadows. Our
findings imply that decomposition in more frequently cut grassland might be more responsive
to drought conditions than less frequently cut grassland. Such an impairment of nutrient
Manuscript 7: Combined effects of multifactor climate change and land-use on decomposition in temperate grassland
184
turnover may lead to reductions in soil quality and thus also to reductions in productivity and
forage quality under more frequent drought events, especially in more intensively managed
grassland.
4.3. Effects of winter warming and winter rain on decompostion
A lack of a stimulating effect of warming on decomposition is often due to a concomitant
decrease in soil moisture (Aerts 2006; Bontti et al. 2009; Gavazov 2010). Our soil moisture
data also show a sudden drop under winter warming in February (Fig. 1). However, this drop
was not caused by increased evapotranspiration, but probably by a prolonged soil frost in the
warmed communities, due to melting of the snow cover in the warmed plots, when compared
to un-warmed plots (Fig.2). Our warming treatment increased temperature slightly by 1.1° C
on average, but also decreased temperature minima and resulted in a 16 % increase of frost
days at 5 cm height, again probably caused by missing insulation due to snow-melt. These
findings support evidence that winter warming might well lead to an increase in frost stress
for many plants (Groffman et al. 2001; Gu et al. 2008; Kreyling 2010) and might lead to an
increase in soil or surface temperature variability during winter, therefore explaining the
missing stimulation of decomposition in our winter warming manipulation. In summary, snow
cover appears to be the crucial factor controlling decomposition in warmer winters.
Concerns that global warming might lead to a stimulation of decomposition and soil
respiration and thus to increases of carbon loss and positive feedback processes on climate,
especially under cold conditions (Kirschbaum 1995; Aerts 2006) seem not to be generally
justified regarding temperate grassland during winter (Giardina & Ryan 2000). Our results,
however, imply that snow cover is critical for this conclusion. With ongoing climate warming,
winter conditions in the southern temperate zone reach a point where lack of snow is
accompanied by warmer soil conditions (Kreyling & Henry 2011), which is in contrast to
more northern regions (Henry 2008) and the situation in our study. Based on this, we
conclude that acceleration of decomposition is more likely to take place in southern temperate
Manuscript 7: Combined effects of multifactor climate change and land-use on decomposition in temperate grassland
185
regions than in northern temperate regions. The lack of a stimulating effect of additional
winter rain on decomposition shows that moisture can only stimulate decay processes when it
is a limiting factor, which is not the case during Central European winters. With regard to
decomposition, the very likely trend towards wetter winters in temperate regions (Christensen
et al. 2007) consequently appears unimportant.
5. Conclusions
We show that even a very short drought relative to the exposure period decreases
decomposition rate by 5 %.. Especially decomposition in more frequently cut grassland was
vulnerable towards drought. Drier climatic conditions under global warming could thus slow
down nutrient cycling and alter soil-carbon balance in more intensively managed grassland.
Surprisingly, changes in winter climate and especially winter warming had no stimulating
effect on decomposition. We attribute this finding to reduced snow cover which caused colder
soils due to missing insulation against air temperature variability in the warming treatment
during considerable periods of time over winter. We conclude that the interplay between
climate warming and decomposition depends on snow cover. Changes in climatic variables
directly affected decomposition through changes of soil biotic activity and not through litter
quality alterations, as neither C/N ratio nor decomposition under untreated standard
conditions was altered by litter pre-exposure to rainfall variability. Contrastingly, the
stimulation of decomposition of more frequent cutting can be largely explained by changed
litter quality, most notably a decrease in C/N ratio. To conclude, although grassland
decomposition and soil biotic activity seemed to be quite resistant towards changes in climatic
variables, certain future projections, such as increased drought frequency or continued winter
warming beyond the cooling capacity of missing snow cover could necessitate an adaptation
of agricultural routines to sustain soil quality and productivity.
Manuscript 7: Combined effects of multifactor climate change and land-use on decomposition in temperate grassland
186
References
Aerts, R. (2006) The freezer defrosting: global warming and litter decomposition rates in cold biomes. Journal of Ecology, 94, 713–724.
Aerts, R. (1997) Climate, leaf litter chemistry and leaf litter decomposition in terrestrial ecosystems: A triangular relationship. Oikos, 79, 439–449.
Allison, S.D. & Treseder, K.K. (2011) Climate change feedbacks to microbial decomposition in boreal soils. Fungal Ecology, 4, 362–374.
Andresen, L.C., Michelsen, A., Ambus, P. & Beier, C. (2010) Belowground heathland responses after 2 years of combined warming, elevated CO(2) and summer drought. Biogeochemistry, 101, 27–42.
Baayen, R. (2009) Language R: Data Sets and Functions with Analyzing Linguistic Data: A Practical Introduction to Statistics. http://CRAN.R-project.org/package=languageR.
Baptist, F., Yoccoz, N.G. & Choler, P. (2010) Direct and indirect control by snow cover over decomposition in alpine tundra along a snowmelt gradient. Plant and Soil, 328, 397–410.
Bardett, R.D., Wardle, D.A. (2010) Aboveground-belowground linkages – biotic interactions, ecosystem processes, and global change. Oxford University Press, Oxford.
Bates, D.M.M. (2010) lme4: Linear Mixed-effects Models Using S4 Classes. http://CRAN.R-project.org/package=lme4.
Bontti, E.E., Decant, J.P., Munson, S.M., Gathany, M.A., Przeszlowska, A., Haddix, M.L., Owens, S., Burke, I.C., Parton, W.J. & Harmon, M.E. (2009) Litter decomposition in grasslands of Central North America (US Great Plains). Global Change Biology, 15, 1356–1363.
Butenschoen, O., Scheu, S. & Eisenhauer, N. (2011) Interactive effects of warming, soil humidity and plant diversity on litter decomposition and microbial activity. Soil Biology and Biochemistry, 43, 1902–1907.
Chapin III S.F, Matson P. A. & MooneyH. A. (2002) Principles of terrestrial ecosystem ecology. Springer, New York.
Cornejo, F.H., Varela, A. & Wright, S.J. (1994) Tropical forest litter decomposition under seasonal drought-nutrient release, fungi and bacteria. Oikos, 70, 183–190.
Christensen, J.H., Hewitson, B., Busuioc, A., Chen, A., Gao, X., Held, I., Jones, R., Kolli, R.K., Kwon, W.-T. , Laprise, R., Magaña Rueda, V., Mearns, L., Menéndez, C.G. , Räisänen, J., Rinke, A., Sarr, A., Whetton, P. (2007) Regional Climate Projections. Climate Change 2007: The Physical Science Basis. Contribution of Working Group I to the Fourth Assessment Report of the Intergovernmental Panel on Climate Change (eds Solomon, S., Qin, D., Manning, M., Chen, Z., Marquis, M., Averyt, K.B., Tignor, M., and Miller, H.L.).pp. 847-940.Cambridge University, Cambridge, New York.
Emmett, B.A., Beier, C., Estiarte, M., Tietema, A., Kristensen, H.L., Williams, D., Penuelas, J., Schmidt, I. & Sowerby, A. (2004) The response of soil processes to climate change: Results from manipulation studies of shrublands across an environmental gradient. Ecosystems, 7, 625–637.
Faraway, J. (2006) Extending the Linear Model with R – Generalized Linear, Mixed Effects and Nonparametric Regression Models. Chapman&Hall/CRC, Boca Raton.
Foken, T.(2003) Lufthygienisch-Bioklimatische Kennzeichnung des oberen Egertales, Bayreuther Institut für Terrestrische Ökosystemforschung (BITÖK): Bayreuther Forum Ökologie, Selbstverlag 100.
Fortunel, C., Garnier, E., Joffre, R., Kazakou, E., Quested, H., Grigulis, K., Lavorel, S., Ansquer, P., Castro, H., Cruz, P., Dolezal, J., Eriksson, O., Freitas, H., Golodets, C., Jouany, C., Kigel, J., Kleyer, M., Lehsten, V., Leps, J., Meier, T., Pakeman, R., Papadimitriou, M., Papanastasis, V.P., Quetier, F., Robson, M., Sternberg, M., Theau, J.-P., Thebault, A. & Zarovali, M. (2009) Leaf traits capture the effects of land use changes and climate on litter decomposability of grasslands across Europe. Ecology, 90, 598–611.
Gavazov, K.S. (2010) Dynamics of alpine plant litter decomposition in a changing climate. Plant and Soil, 337, 19–32.
Giardina, C. & Ryan, M. (2000) Evidence that decomposition rates of organic carbon in mineral soil do not vary with temperature. Nature, 404, 858–861.
Groffman, P.M., Driscoll, C.T., Fahey, T.J., Hardy, J.P., Fitzhug, R. & Tierney, G. (2001) Colder soils in a warmer world: a snow manipulation study in a northern hardwood forest ecosystem. Biogeochemistry, 56, 135–150.
Gu, L., Hanson, P.J., Post, W.M., Kaiser, D.P., Yang, B., Nemani, R., Pallardy, S.G., & Meyers, T. (2008) The 2007 eastern US spring freeze: increased cold damage in a warming world? BioScience, 58, 253–262.
Guenet, B., Lenhart, K., Leloup, J., Giusti-Miller, S., Pouteau, V., Mora, P., Nunan, N. & Abbadie, L. (2012) The impact of long-term CO2 enrichment and moisture levels on soil microbial community structure and enzyme activitie. Geoderma, 170, 331-336.
Hawkes, C.V., Kivlin, S.N., Rocca, J.D., Huguet, V., Thomsen, M.A. & Suttle, K.B. (2011) Fungal community responses to precipitation. Global Change Biology, 17, 1637–1645.
Henry, H.A.L. (2008) Climate change and soil freezing dynamics: historical trends and projected changes. Climatic Change, 87, 421–434.
Manuscript 7: Combined effects of multifactor climate change and land-use on decomposition in temperate grassland
187
Hobbie, S. (1996) Temperature and plant species control over litter decomposition in Alaskan tundra. Ecological Monographs, 66, 503–522.
Jacob, D. (2009) Regionalisierte Szenarien des Klimawandels-Regional climate change scenarios. Raumforschung und Raumordnung, 69, 89–96.
Joos, O., Hagedorn, F., Heim, A., Gilgen, A.K., Schmidt, M.W.I., Siegwolf, R.T.W. & Buchmann, N. (2010) Summer drought reduces total and litter-derived soil CO2 effluxes in temperate grassland - clues from a C-13 litter addition experiment. Biogeosciences, 7, 1031–1041.
Kemp, P.R., Reynolds, J.F., Virginia, R.A. & Whitford, W.G. (2003) Decomposition of leaf and root litter of Chihuahuan desert shrubs: effects of three years of summer drought. Journal of Arid Environments, 53, 21–39.
Kirschbaum, M. (1995) The temperature dependence of soil organic matter decomposition, and the effect of global warming on soil organic C storage. Soil Biology and Biochemistry, 27, 753–760.
Kirwan, M.L. & Blum, L.K. (2011) Enhanced decomposition offsets enhanced productivity and soil carbon accumulation in coastal wetlands responding to climate change. Biogeosciences, 8, 987–993.
Kratz, W. (1998) The bait-lamina test. Environmental Science and Pollution Research, 5, 94-96. Kreyling, J. (2010) Winter climate change: a critical factor for temperate vegetation performance. Ecology, 91,
1939–1948. Kreyling, J. & Henry, H.A.L. (2011) Vanishing winters in Germany: soil frost dynamics and snow cover trends,
and ecological implications. Climate Research, 46, 269–276. Kreyling, J., Beierkuhnlein, C., Elmer, M., Pritsch, K., Radovski, M., Schloter, M., Wöllecke, J. & Jentsch, A.
(2008) Soil biotic processes remain remarkably stable after 100-year extreme weather events in experimental grassland and heath. Plant and Soil, 308, 175–188.
Lavelle, P., Blanchart, E., Martin, A., Martin, S. & Spain, A. (1993) A hierarchical model for decomposition in terrestrial ecosystems: Application to soils of the humid tropics. Biotropica, 25, 130–150.
Lensing, J.R. & Wise, D.H. (2007) Impact of changes in rainfall amounts predicted by climate-change models on decomposition in a deciduous forest. Applied Soil Ecology, 35, 523–534.
Liao, J.X., Hou, Z.D. & Wang, G.X. (2002) Effects of elevated CO2 and drought on chemical composition and decomposition of spring wheat (Triticum aestivum). Functional Plant Biology, 29, 891–897.
Meehl, G.A., Stocker, T.F., Collins, W.D., Friedlingstein, P., Gaye, A.T., Gregory, J.M., Kitoh A., Knutti, R., Murphy, J.M., Noda, A, Raper, S.C.B., Watterson, I.G., Weaver A.J., and Zhao, Z.-C. (2007): Global Climate Projections. Climate Change 2007: The Physical Science Basis.Contribution of Working Group I to the Fourth Assessment Report of the Intergovernmental Panel on Climate Change (eds Solomon, S., Qin, D., Manning, M., Chen, Z., Marquis, M., Averyt, K.B., Tignor, M., and Miller, H.L.). pp. 748-845. Cambridge University Press, Cambridge, New York.
Miller, A., Schimel J.P., Meixner T., Sickman J.O. & Melack J.M (2005) Episodic rewetting enhances carbon and nitrogen release from chaparral soils. Soil Biology and Biochemistry, 37, 2195–2204.
O‘Neill, E.G., Johnson, D.W., Ledford, J. & Todd, D. (2003) Acute seasonal drought does not permanently alter mass loss and nitrogen dynamics during decomposition of red maple (Acer rubrum L.) litter. Global Change Biology, 9, 117–123.
Osanai, Y., Flittner, A., Janes, J.K., Theobald, P., Pendall, E., Newton, P.C.D. & Hovenden, M.J. (2012) Decomposition and nitrogen transformation rates in a temperate grassland vary among co-occurring plant species. Plant and Soil, 350, 365–378.
Pinheiro J., Bates D., DebRoy S., Sarkar D. & the R. Core team (2008) nlme, Linear and Nonlinear Mixed Effects Models. http://cran.r-project.org/web/packages/nlme/index.html.
R Development Core Team (2010) R: A Language and Environment for Statistical Computing. R Foundation for Statistical Computing. http://www.R-project.org.
Reed, H.E., Blair, J.M., Wall, D.H. & Seastedt, T.R. (2009) Impacts of management legacies on litter decomposition in response to reduced precipitation in a tallgrass prairie. Applied Soil Ecology, 42, 79–85.
Risch, A.C., Jurgensen, M.F. & Frank, D.A. (2007) Effects of grazing and soil micro-climate on decomposition rates in a spatio-temporally heterogeneous grassland. Plant and Soil, 298, 191–201.
Sorensen, L. (1974) Rate of decomposition of organic-matter in soil as influenced by repeated air drying–rewetting and repeated additions of organic material. Soil Biology and Biochemistry, 6, 287–292.
Swift, M., Heal, O. & Anderson, J. (1979) Decomposition in terrestrial ecosystems. Unversity of California Press, Berkeley.
Tiemann, L.K. & Billings, S.A. (2011) Changes in variability of soil moisture alter microbial community C and N resource use. Soil Biology and Biochemistry, 43, 1837–1847.
van Meeteren, M.M., Tietema, A., van Loon, E.E. & Verstraten, J.M. (2008) Microbial dynamics and litter decomposition under a changed climate in a Dutch heathland. Applied Soil Ecology, 38, 119–127.
Walter, J., Grant, K., Beierkuhnlein, C., Kreyling, J., Weber, M. & Jentsch, A. (2012) Increased rainfall variability reduces biomass and forage quality of temperate grassland largely independent of cutting frequency. Agriculture, Ecosystems and Environment, 148, 1–10.

Manuscript 7: Combined effects of multifactor climate change and land-use on decomposition in temperate grassland
188
Wardle, D.A., Bardgett, R.D., Walker, L.R. & Bonner, K.I. (2009) Among- and within-species variation in plant litter decomposition in contrasting long-term chronosequences. Functional Ecology, 23, 442–453.
Xu, L., Baldocchi, D.D. , Tang, J. (2004) How soil moisture, rain pulses, and growth alter the response of ecosystem respiration to temperature. Global Biogeochemical Cycles, 18, GB400.
Zebisch, M., Grothmann, T., Schröter, D., Hasse, C., Fritsch, U. & Cramer, W. (2012) Climate Change-Klimawandel in Deutschland. Vulnerabilität und Anpassungsstrategienklimasensitiver Systeme-UBA Forschungsbericht. www.umweltdaten.de/publikationen/fpdf-l/2947.pdf, 14 Mar 2012.
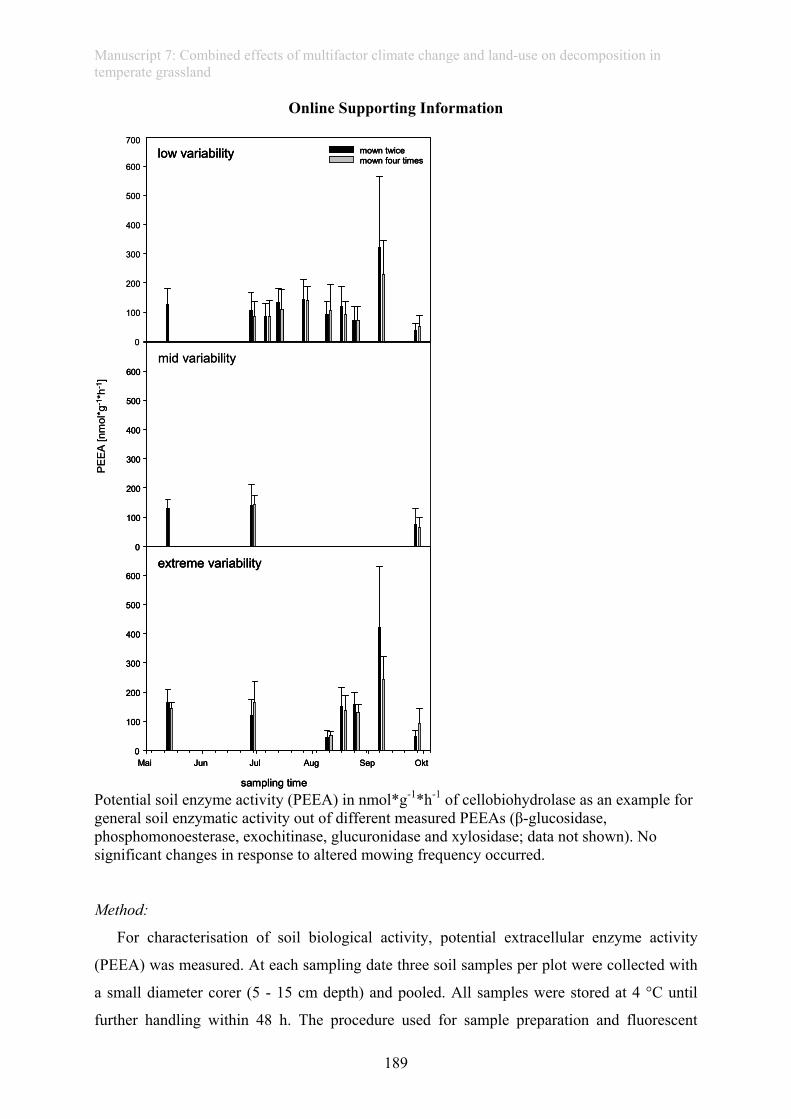
Manuscript 7: Combined effects of multifactor climate change and land-use on decomposition in temperate grassland
189
Online Supporting Information
PEEA
[nm
ol*g
-1*h
-1]
mown twicemown four times
low variability
sampling time
Mai Jun Jul Aug Sep Okt
extreme variability0
100
200
300
400
500
600mid variability
0
100
200
300
400
500
600
0
100
200
300
400
500
600
700
PEEA
[nm
ol*g
-1*h
-1]
mown twicemown four times
low variability mown twicemown four times
low variability
sampling time
Mai Jun Jul Aug Sep Okt
extreme variability
sampling time
Mai Jun Jul Aug Sep Okt
extreme variability0
100
200
300
400
500
600
0
100
200
300
400
500
600mid variability
0
100
200
300
400
500
600
0
100
200
300
400
500
600
0
100
200
300
400
500
600
700
Potential soil enzyme activity (PEEA) in nmol*g-1*h-1 of cellobiohydrolase as an example for general soil enzymatic activity out of different measured PEEAs (β-glucosidase, phosphomonoesterase, exochitinase, glucuronidase and xylosidase; data not shown). No significant changes in response to altered mowing frequency occurred. Method:
For characterisation of soil biological activity, potential extracellular enzyme activity
(PEEA) was measured. At each sampling date three soil samples per plot were collected with
a small diameter corer (5 - 15 cm depth) and pooled. All samples were stored at 4 °C until
further handling within 48 h. The procedure used for sample preparation and fluorescent
Manuscript 7: Combined effects of multifactor climate change and land-use on decomposition in temperate grassland
190
measurement has been described by Pritsch et al. (2005). The enzyme assay based on
methylumbelliferone (MUF) labelled substrates was prepared in black microplates. Solutions
were prepared as previously described (Pritsch et al. 2005; Kreyling et al. 2008). Samples
were incubated for 120 minutes at a concentration of 400 µM. After incubation, the reaction
in the microplates was alkalinised and stopped with a 1 M Tris buffer (pH 10.8) and
centrifuged for 5 min at 20 °C and 1120 x g. Fluorescence measurements were performed on
a Spectrofluorometer (SpectraMax GEMINI EM, Sannyvale, USA) at excitation/emission
wavelengths of 365 / 450 nm. Released amounts of MUF were calculated based on the
calibration curves and expressed as PEEA in nmol per gram soil dry weight per hour (nmol g-
1 h-1).
Kreyling, J., Beierkuhnlein, C., Elmer, M., Pritsch, K., Radovski, M., Schloter, M., Wöllecke, J. & Jentsch, A. (2008) Soil biotic processes remain remarkably stable after 100-year extreme weather events in experimental grassland and heath. Plant and Soil, 308, 175–188.
Pritsch K., Luedemann G., Matyssek R., Hartmann A., Schloter M., Scherb H. and Grams T. E. E. 2005
Mycorrhizosphere responsiveness to atmospheric ozone and inoculation with Phytophthora citricola in a phytotron experiment with spruce/beech mixed cultures. Plant Biology, 7, 718-727.
Synopsis
191
Synopsis More frequent and more extreme weather events, especially drought, will affect temperate
grassland in many ways. They will alter biotic interactions and ecosystem processes at
multiple levels, thereby also affecting ecosystem services, such as fodder provisison. Some
aspects and processes, like forage quality or decomposition seem to be more vulnerable
towards drought and extreme rainfall variability in more frequently mown grassland. Further
research is necessary to understand mechanisms of grassland resilience and to enable policy
makers to take measures for adaptation and mitigation under global climate change and
consequently to maintain functionality of temperate grassland, which provides numerous
ecosystem services.

192
Hiermit erkäre ich, dass ich die Arbeit selbständig verfasst und keine anderen als die von mir
angegebenen Quellen und Hilfsmittel benutzt habe.
Ferner erkläre ich, dass ich anderweitig mit oder ohne Erfolg nicht versucht habe, diese
Dissertation einzureichen. Ich habe keine gleichartige Doktorprüfung an einer anderen
Hochschule endgültig nicht bestanden.
Bayreuth, 11.04.2012,