beyond essay length: evaluating e-rater®'s … essay length: evaluating e-rater ......
TRANSCRIPT
Beyond Essay Length: Evaluating e-rater®’sPerformance on TOEFL® Essays
Martin Chodorow
Jill Burstein
Research ReportsReport 73February 2004
Beyond Essay Length:
Evaluating e-rater®’s Performance on TOEFL® Essays
Martin Chodorow
Hunter College of the City University of New York ETS, Princeton, NJ
Jill Burstein
ETS, Princeton, NJ
RR-04-04
ETS is an Equal Opportunity/Affirmative Action Employer. Copyright © 2004 by ETS. All rights reserved. No part of this report may be reproduced or transmitted in any form or by any means, electronic or mechanical, including photocopy, recording, or any information storage and retrieval system, without permission in writing from the publisher. Violators will be prosecuted in accordance with both U.S. and international copyright laws. EDUCATIONAL TESTING SERVICE, ETS, the ETS logos, e-rater, TOEFL, and the TOEFL logo are registered trademarks of Educational Testing Service. The Test of English as a Foreign Language is a trademark of Educational Testing Service. College Board is a registered trademark of the College Entrance Examination Board. Graduate Management Admission Test and GMAT are registered trademarks of the Graduate Management Admission Council.
i
Abstract
This study examines the relation between essay length and holistic scores assigned to Test of
English as a Foreign Language™ (TOEFL®) essays by e-rater®, the automated essay scoring
system developed by ETS. Results show that an early version of the system, e-rater99, accounted
for little variance in human reader scores beyond that which could be predicted by essay length.
A later version of the system, e-rater01, performs significantly better than its predecessor and is
less dependent on length due to its greater reliance on measures of topical content and of
complexity and diversity of vocabulary. Essay length was also examined as a possible
explanation for differences in scores among examinees with native languages of Spanish, Arabic,
and Japanese. Human readers and e-rater01 show the same pattern of differences for these
groups, even when effects of length are controlled.
Key words: automatic essay scoring, writing assessment, Test of English as a Foreign Language,
TOEFL, e-rater, essay length
ii
The Test of English as a Foreign Language™ (TOEFL®) was developed in 1963 by the National Council on the Testing of English as a Foreign Language. The Council was formed through the cooperative effort of more than 30 public and private organizations concerned with testing the English proficiency of nonnative speakers of the language applying for admission to institutions in the United States. In 1965, Educational Testing Service® (ETS®) and the College Board® assumed joint responsibility for the program. In 1973, a cooperative arrangement for the operation of the program was entered into by ETS, the College Board, and the Graduate Record Examinations (GRE®) Board. The membership of the College Board is composed of schools, colleges, school systems, and educational associations; GRE Board members are associated with graduate education. ETS administers the TOEFL program under the general direction of a policy board that was established by, and is affiliated with, the sponsoring organizations. Members of the TOEFL Board (previously the Policy Council) represent the College Board, the GRE Board, and such institutions and agencies as graduate schools of business, junior and community colleges, nonprofit educational exchange agencies, and agencies of the United States government.
A continuing program of research related to the TOEFL test is carried out under the direction of the TOEFL Committee of Examiners. Its 12 members include representatives of the TOEFL Board and distinguished English as a second language specialists from the academic community. The Committee meets twice yearly to review and approve proposals for test-related research and to set guidelines for the entire scope of the TOEFL research program. Members of the Committee of Examiners serve four-year terms at the invitation of the Board; the chair of the committee serves on the Board. Because the studies are specific to the TOEFL test and the testing program, most of the actual research is conducted by ETS staff rather than by outside researchers. Many projects require the cooperation of other institutions, however, particularly those with programs in the teaching of English as a foreign or second language and applied linguistics. Representatives of such programs who are interested in participating in or conducting TOEFL-related research are invited to contact the TOEFL program office. All TOEFL research projects must undergo appropriate ETS review to ascertain that data confidentiality will be protected. Current (2003-2004) members of the TOEFL Committee of Examiners are: Micheline Chalhoub-Deville University of Iowa Lyle Bachman University of California, Los Angeles Deena Boraie The American University in Cairo Catherine Elder University of Auckland Glenn Fulcher University of Dundee William Grabe Northern Arizona University Keiko Koda Carnegie Mellon University Richard Luecht University of North Carolina at Greensboro Tim McNamara The University of Melbourne James E. Purpura Teachers College, Columbia University Terry Santos Humboldt State University Richard Young University of Wisconsin-Madison
To obtain more information about the TOEFL programs and services, use one of the following:
E-mail: [email protected]
Web site: www.toefl.org

iii
Acknowledgments
We wish to thank Chi Lu for assistance with data preparation and e-rater analysis. We are
grateful to the following for their helpful comments on an earlier version of this report: Hunter
Breland, Brent Bridgeman, Fred Davidson, Yong-Won Lee, and Larry Stricker.
iv
Table of Contents
Page
Introduction..................................................................................................................................... 1
Human Reader Scores..................................................................................................................... 3
E-rater Scores.................................................................................................................................. 4
The Study........................................................................................................................................ 7
Data Sets ................................................................................................................................. 7
Essay Score and Essay Length................................................................................................ 8
Removing Length Effects ..................................................................................................... 15
E-rater Features and Essay Length........................................................................................ 16
Native Language and Essay Length...................................................................................... 19
Summary and Conclusions ........................................................................................................... 30
References..................................................................................................................................... 32
Notes ............................................................................................................................................. 34
Appendixes
A - TOEFL Writing Scoring Guide....................................................................................... 35
B - Confusion Matrices for Essay Scores Combined Across Mixed Cross-validation Sets for Seven Prompts .......................................................................................................... 37
v
List of Tables
Page
Table 1. TOEFL-CBT Prompts.................................................................................................... 2
Table 2. Training and Cross-validation Set Sizes (Numbers of Essays)...................................... 7
Table 3. Predicting HR Scores in Mixed Cross-validation Sets Using Length-Based Regression Models Estimated From Training Sets: Multiple Correlations and Agreement Proportions (Kappas) ................................................................................................... 10
Table 4. Predicting HR Scores in Mixed Cross-validation Sets Using E-rater99: Correlations and Agreement Proportions (Kappas).......................................................................... 11
Table 5. Predicting HR Scores in Mixed Cross-validation Sets Using E-rater01: Correlations and Agreement Proportions (Kappas).......................................................................... 12
Table 6. Correlations and Agreement Proportions (Kappas) Between H1 and H2 in Mixed Cross-validation Sets.................................................................................................... 14
Table 7. Partial Correlations in Mixed Cross-validation Sets After Removing Length and Length Squared ............................................................................................................ 16
Table 8. Features Appearing in Four or More E-rater Models................................................... 17
Table 9. Squared Partial Correlations Between E-rater Features and HR Scores in Mixed Cross-validation Sets After Removing Length and Length Squared........................... 18
Table 10. Mean Essay Score by Native Language Group, Rater, and Prompt ............................ 20
Table 11. Analyses of Rater (HR and E-rater99) × Language for Seven Prompts ...................... 24
Table 12. Analyses of Rater (HR and E-rater01) × Language for Seven Prompts ...................... 25
Table 13. Mean Number of Words in Essay by Native Language Group and Prompt................ 28
Table 14. Analyses of Rater (HR and E-rater01) × Language for Six Prompts, With Effects of Covariates Length and Length Squared Removed....................................................... 29
Table B1. Score Predicted by Length-based Models Estimated From Training Sets................... 37
Table B2. Score Predicted by E-rater99 ....................................................................................... 37
Table B3. Score Predicted by E-rater01 ....................................................................................... 38
Table B4. H2 Score....................................................................................................................... 38
vi
List of Figures
Page
Figure 1. Essay length and human reader score for Prompt C........................................................ 9
Figure 2. Rater (HR and e-rater99) × Language for seven prompts. ............................................ 22
Figure 3. Rater (HR and e-rater01) × Language for seven prompts. ............................................ 26
1
Introduction
Automatic systems for scoring essays have been available for decades, but only in the past
few years has automatic scoring been used in large-scale high-stakes testing, such as on graduate
school admissions exams, or in low-stakes environments, such as Web-based assessment of
practice writing (see Burstein & Chodorow, 2002, for an overview). Four scoring systems are
currently available commercially: e-rater®, developed at ETS; Project Essay Grade (PEG), offered
by Tru-Judge, Inc.; Intelligent Essay Assessor, offered by Knowledge Assessment Technologies;
and IntelliMetric, offered by Vantage Learning. Each system trains on essays that human readers
have assigned a holistic score (a single number that represents the quality of writing). From the
training examples, the system learns which features are the best predictors of essay score. For
each new essay, it measures these features and uses the measurements to make its prediction. The
differences among the systems lie in the particular features that they extract and in the ways in
which they combine the features in generating a score.
Scoring performance is usually measured by comparing the predicted scores on a cross-
validation set of essays to the scores assigned by human readers. For current systems, these
comparisons have shown impressively high levels of agreement with human reader scores
(Burstein & Chodorow, 1999; Elliot, 2002; Herrington and Moran, 2001; Landauer, Laham, &
Foltz, 2002; Page, 2002), often comparable to the rates found between two human readers.
Recently, however, Sheehan (2001) has argued that such results may be misleading. She notes
that much of the variability in essay score can be accounted for by a simple surface feature—
essay length—and she suggests that only if we first control for effects of length can we produce
an accurate picture of how well an automatic scoring system measures the quality, as opposed to
the quantity, of writing.
In this report, we consider the effects of length when evaluating the performance of the
e-rater system on essays written for prompts (topics) used in the computer-based Test of English
as a Foreign Language™ (TOEFL®). These essays, which are currently scored by human
readers, are written by thousands of nonnative English speakers, or speakers of another variety of
English (such as a regional dialect), who take the TOEFL exam when applying for admission to
U.S. colleges and universities. As part of the test, they are given 30 minutes to write an essay on
a prompt that has been randomly drawn from a large set of possible topics. The prompts used in
the current study are shown in Table 1.
2
Table 1
TOEFL-CBT Prompts
Topic Prompt A Do you agree or disagree with the following statement?
Playing a game is fun only when you win.
B Do you agree or disagree with the following statement? It is more important for students to study history and literature than it is for them to study science and mathematics.
C Neighbors are the people who live near us. In your opinion, what are the qualities of a good neighbor?
D Do you agree or disagree with the following statement? All students should be required to study art and music in secondary school.
E Some young children spend a great amount of their time practicing sports. Discuss the advantages and disadvantages of this.
F Some people pay money for the things they want or need. Other people trade products or goods for what they need. Compare the advantages of these two ways of obtaining things. Which way do you prefer?
G You have enough money to purchase either a house or a business. Which would you choose to buy?
Our goal is to determine the effect of length on e-rater and human reader scores on essays
for these prompts, and then statistically remove that effect so that other variables of interest can
be studied. With length controlled, we will ask (1) how much agreement is there between e-rater
and human readers in assessing the quality of writing, and (2) which features of writing does e-
rater rely on in scoring essays? In a previous study (Burstein & Chodorow, 1999), we considered
the first of these questions, but without controlling for essay length. At that time, data were
available from just two TOEFL prompts representing only a small number of essays. Also, the
version of e-rater in use then (e-rater99) did not include the full set of features that were later
incorporated. The current study thus gives us an opportunity to compare performance of the
3
current operational version of e-rater (e-rater01) with the earlier version, and to do so on more
prompts and with more essays.
The TOEFL Test of Written English Guide (ETS, 1996) reports mean essay score by
native language for the more than 100 native languages spoken by TOEFL examinees. To what
degree might the differences in score among these language groups be a reflection of differences
in essay length? More specifically, we will ask (3) is there an effect of native language that is
independent of essay length, and, if so, does e-rater show the same pattern of differences across
native language groups as that seen in the scores of human readers?
We begin with a description of essay scoring by humans and by e-rater.
Human Reader Scores
The purpose of the TOEFL essay is to assess the examinee’s proficiency in writing
English. Each essay is read and scored independently by two trained human readers who use a
six-point scoring rubric, with 1 denoting an essay of the lowest quality and 6 indicating the
highest quality.1 The scoring guide (www.toefl.org/educator/edtwegui.html) lists criteria for
scores of 5 and 6 that include the properties “is well organized,” “uses clearly appropriate details
to support a thesis,” “demonstrates syntactic variety,” and shows “a range of vocabulary.” By
contrast, 1s and 2s show “serious disorganization or underdevelopment” and may show “serious
and frequent errors in sentence structure or usage.” Notably, the scoring guide does not refer to
essay length as a basis for evaluation. (See Appendix A for the complete list of current scoring
guide criteria and www.toefl.org/toeflcbt/cbscrsvc.html for additional information.)
The score assigned to an essay (referred to here as the human reader or HR score) is the
mean of the two readers’ scores (H1 and H2), provided that these scores do not differ by more
than one point. In the event of a larger discrepancy, a third reader is asked to grade the essay, and
the final score is the mean of the adjacent or matching scores. For example, suppose H1 is 3 and
H2 is 5. If the third reader gives the essay a 4, then HR will be 4 (the mean of 3, 4, and 5). If the
third reader gives a 5, HR will be 5, since two scores match. If the third reader gives a 6, HR will
be 5.5, the mean of the two adjacent scores 5 and 6.
4
E-rater Scores
As noted earlier, automatic scoring systems, such as e-rater, require training data. E-rater
measures numerous features of writing in its training essays and then uses a stepwise linear
regression procedure to select the features (usually a small set of 8 to 10) that are most predictive
of essay score for each prompt. While the overall feature set is highly varied, it contains no direct
measure of essay length. As we described it in 1999,
The driving concept that underlies e-rater is that it needs to evaluate the same kinds of
features that human readers do. This is why from the beginning of its development,
we made it a priority to use features from the scoring guide and to eliminate any
direct measures of essay length. Even though length measures can be shown to be
highly correlated with human reader essay scores, length variables are not scoring
guide criteria. (Burstein & Chodorow, 1999, p. 69)
Although some researchers have suggested adding explicit measures of length to improve
correlations with human readers, the assessment community is generally concerned about the
effect this would have on coachability.
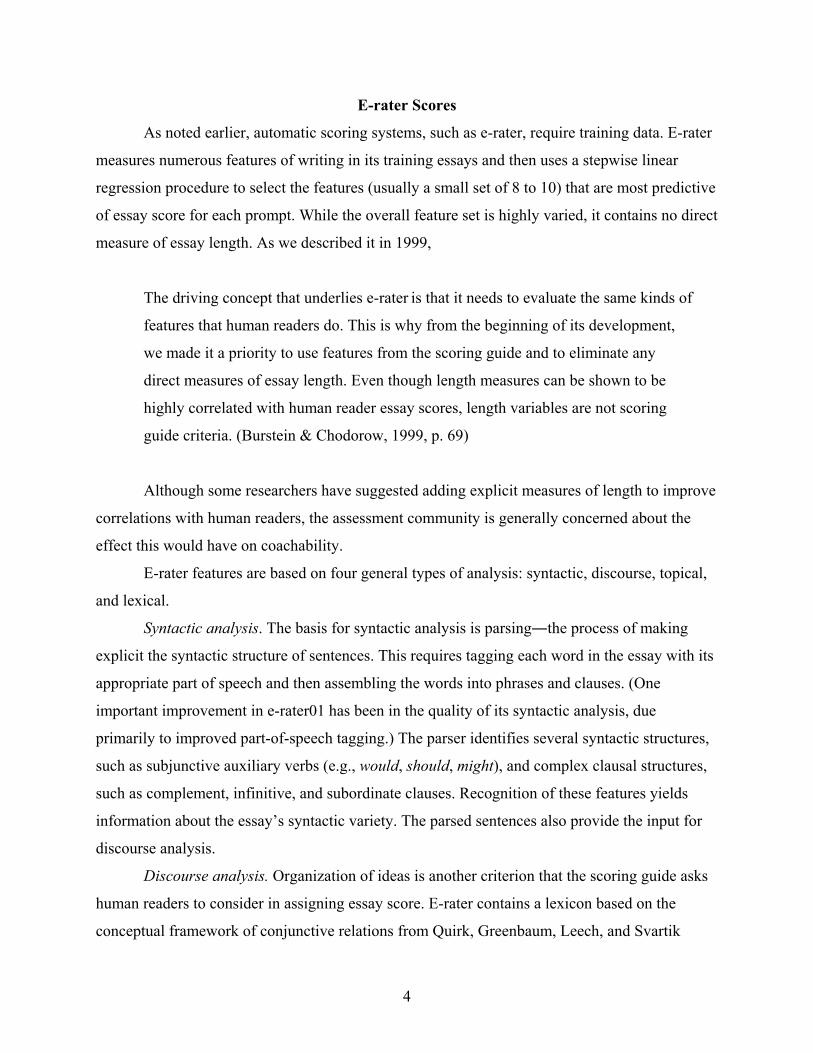
E-rater features are based on four general types of analysis: syntactic, discourse, topical,
and lexical.
Syntactic analysis. The basis for syntactic analysis is parsing―the process of making
explicit the syntactic structure of sentences. This requires tagging each word in the essay with its
appropriate part of speech and then assembling the words into phrases and clauses. (One
important improvement in e-rater01 has been in the quality of its syntactic analysis, due
primarily to improved part-of-speech tagging.) The parser identifies several syntactic structures,
such as subjunctive auxiliary verbs (e.g., would, should, might), and complex clausal structures,
such as complement, infinitive, and subordinate clauses. Recognition of these features yields
information about the essay’s syntactic variety. The parsed sentences also provide the input for
discourse analysis.
Discourse analysis. Organization of ideas is another criterion that the scoring guide asks
human readers to consider in assigning essay score. E-rater contains a lexicon based on the
conceptual framework of conjunctive relations from Quirk, Greenbaum, Leech, and Svartik
5
(1985) in which cue terms, such as In summary and In conclusion, are classified as conjuncts
used for summarizing. The conjunct classifiers contain information about whether or not the item
is a kind of discourse development term (e.g., for example and because), or whether it is more
likely to be used to begin a discourse statement (e.g., First, Second, or Third).
E-rater also contains heuristics that define the syntactic or essay-based structures in
which these terms must appear to be considered as discourse markers. For example, for the word
first to be considered a discourse marker, it must not be a nominal modifier, as in the sentence,
“The first time I went to Europe was in 1982,” in which first modifies the noun time. Instead,
first must occur as an adverbial conjunct to be considered a discourse marker, as in the sentence,
“First, it has often been noted that length is highly correlated with essay score.” The lexicon of
cue terms and the associated heuristics are used by e-rater to automatically annotate a high-level
discourse structure of each essay. These annotations are also used by the system to partition each
essay into separate arguments, which are input to the topical analysis component.
Topical analysis. Good essays are relevant to the assigned topic. They also tend to use a
more specialized and precise vocabulary in discussing the topic than do poorer essays. We
should therefore expect a good essay to resemble other good essays in its choice of words and,
conversely, a poor essay to resemble other poor ones. To capture use of vocabulary or
identification of topic, e-rater uses content vector analyses that are based on the vector-space
model commonly found in information retrieval applications (Salton, 1989). Training essays are
converted into vectors of word frequencies, and the frequencies are then transformed into word
weights, where the weight of a word is directly proportional to its frequency in the essay but
inversely related to number of essays in which it appears. For example, the is typically the most
frequent word in an essay but because it is found in all essays, its computed weight is extremely
low. To calculate the topical analysis of a test essay, the essay is converted into a vector of word
weights, and a search is conducted to find the training vectors most similar to it. Similarity is
measured by the cosine of the angle between two vectors. For one feature, called topical analysis
by essay, the test vector consists of all the words in the essay. The value of the feature is the
mean of the scores of the most similar training vectors. The other feature, topical analysis by
argument, evaluates vocabulary usage at the argument level. The discourse analysis is used to
partition the essay into its main points of discussion, and a vector is created for each. These
argument vectors are individually compared to the training set so that a topical analysis score can
6
be assigned to each argument. The value for this feature is a mean of the argument scores. (See
Burstein & Chodorow, 1999, for details of these procedures.)
Analysis of lexical (text) complexity. While the topical analysis features compare the
specific words of the test essay to the words in the scored training set, the lexical (or text)
complexity features treat words more abstractly (Larkey, 1998). Each essay is described in terms
of the number of unique words it contains, the average length of its words, the number of words
it has with five or more characters, with six or more characters, and so on. These numerical
values reflect the range, frequency, and morphological complexity of the essay’s vocabulary. For
example, longer words are less common than shorter ones, and words beyond six characters are
more likely to be morphologically derived through affixation. Larkey has shown that these text
complexity features contribute significantly to predicting scores of essays written for the
Graduate Management Admission Test® (GMAT®). E-rater99 did not include the text
complexity features, but they are part of e-rater01.
In order to predict score, e-rater measures more than 50 features of the kinds described
above in each training essay. It then computes a stepwise linear regression to select those
features that make significant contributions to the prediction of essay score. Thus, for each
prompt, the result of training is a regression equation that can be applied to the features of a new
test essay to produce a predicted value. This value is rounded to the nearest whole number to
yield the predicted score. Performance is assessed by predicting scores of essays that are not in
the training set (cross-validation essays) and comparing them to HR scores.
E-rater scores are currently used in several kinds of applications. Since February 1999,
ETS has used e-rater as one of the two initial readers for the GMAT writing assessments, and, in
this capacity, it has scored more than 1 million essays. E-rater’s scores either match or are within
one point of the human reader scores about 96% of the time. ETS is using e-rater to score essays
for numerous educational institutions across middle school, high school, college, and graduate
school populations. In these lower-stakes environments, where students are practicing their
writing skills, e-rater is often the sole scorer of the essays.
7
The Study
Data Sets
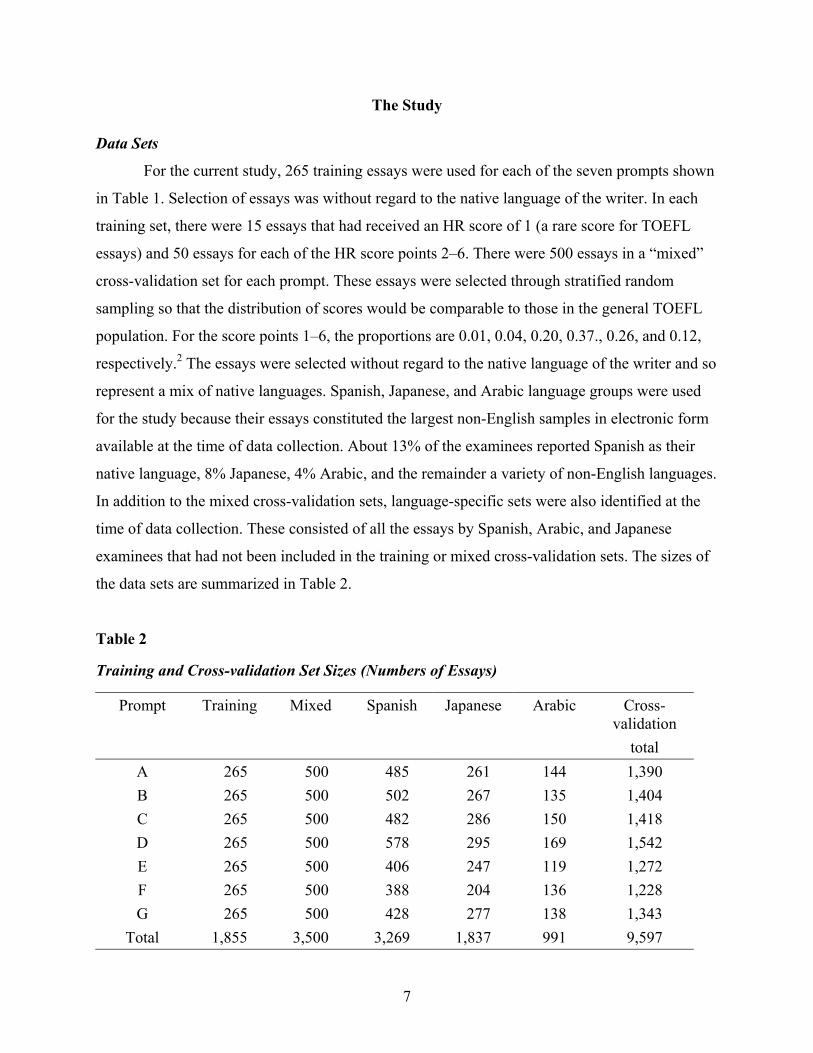
For the current study, 265 training essays were used for each of the seven prompts shown
in Table 1. Selection of essays was without regard to the native language of the writer. In each
training set, there were 15 essays that had received an HR score of 1 (a rare score for TOEFL
essays) and 50 essays for each of the HR score points 2–6. There were 500 essays in a “mixed”
cross-validation set for each prompt. These essays were selected through stratified random
sampling so that the distribution of scores would be comparable to those in the general TOEFL
population. For the score points 1–6, the proportions are 0.01, 0.04, 0.20, 0.37., 0.26, and 0.12,
respectively.2 The essays were selected without regard to the native language of the writer and so
represent a mix of native languages. Spanish, Japanese, and Arabic language groups were used
for the study because their essays constituted the largest non-English samples in electronic form
available at the time of data collection. About 13% of the examinees reported Spanish as their
native language, 8% Japanese, 4% Arabic, and the remainder a variety of non-English languages.
In addition to the mixed cross-validation sets, language-specific sets were also identified at the
time of data collection. These consisted of all the essays by Spanish, Arabic, and Japanese
examinees that had not been included in the training or mixed cross-validation sets. The sizes of
the data sets are summarized in Table 2.
Table 2
Training and Cross-validation Set Sizes (Numbers of Essays)
Prompt Training
Mixed
Spanish Japanese Arabic Cross-validation
total A 265 500 485 261 144 1,390 B 265 500 502 267 135 1,404 C 265 500 482 286 150 1,418 D 265 500 578 295 169 1,542 E 265 500 406 247 119 1,272 F 265 500 388 204 136 1,228 G 265 500 428 277 138 1,343
Total 1,855 3,500 3,269 1,837 991 9,597
8
Essay Score and Essay Length
In the following, we look at essay score and length in two ways. The first approach,
similar to Sheehan (2001), is an indirect one that compares e-rater scores and HR scores to those
produced by a model that uses only length information derived from training essays. Here, the
question is, do e-rater and HR differ significantly from the length-only model in terms of
performance? The second approach is more direct. It compares e-rater scores to HR scores using
partial correlations to remove the length effects.
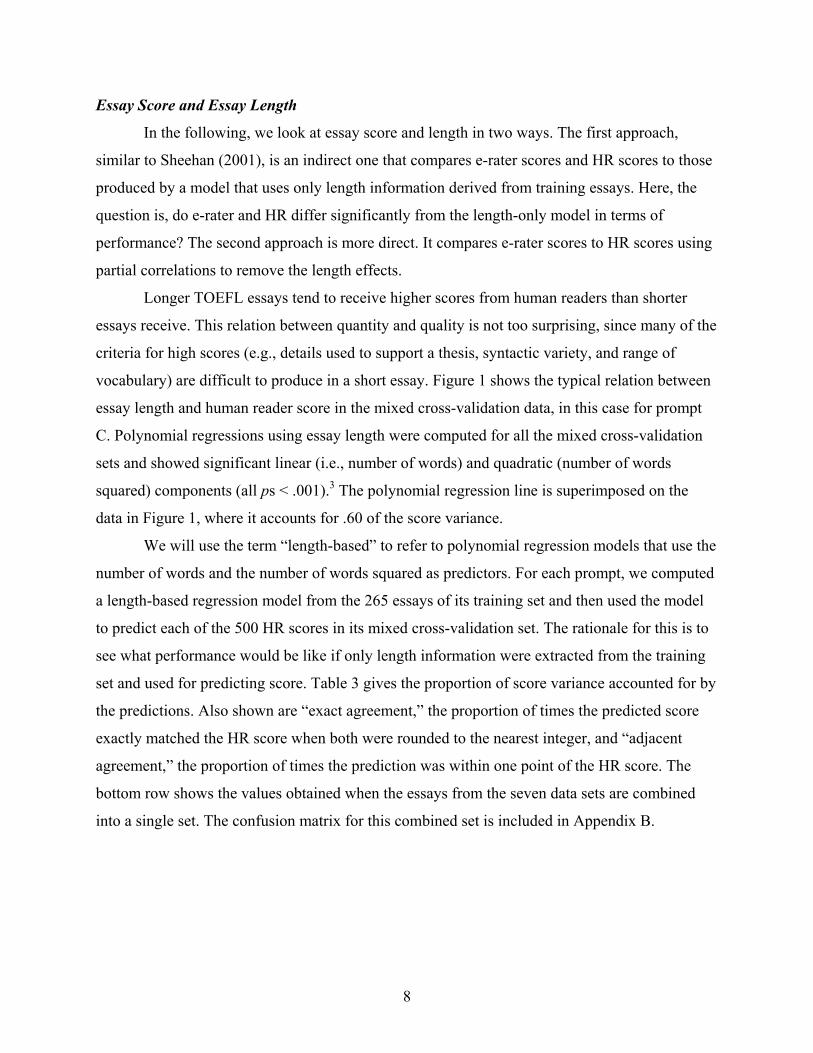
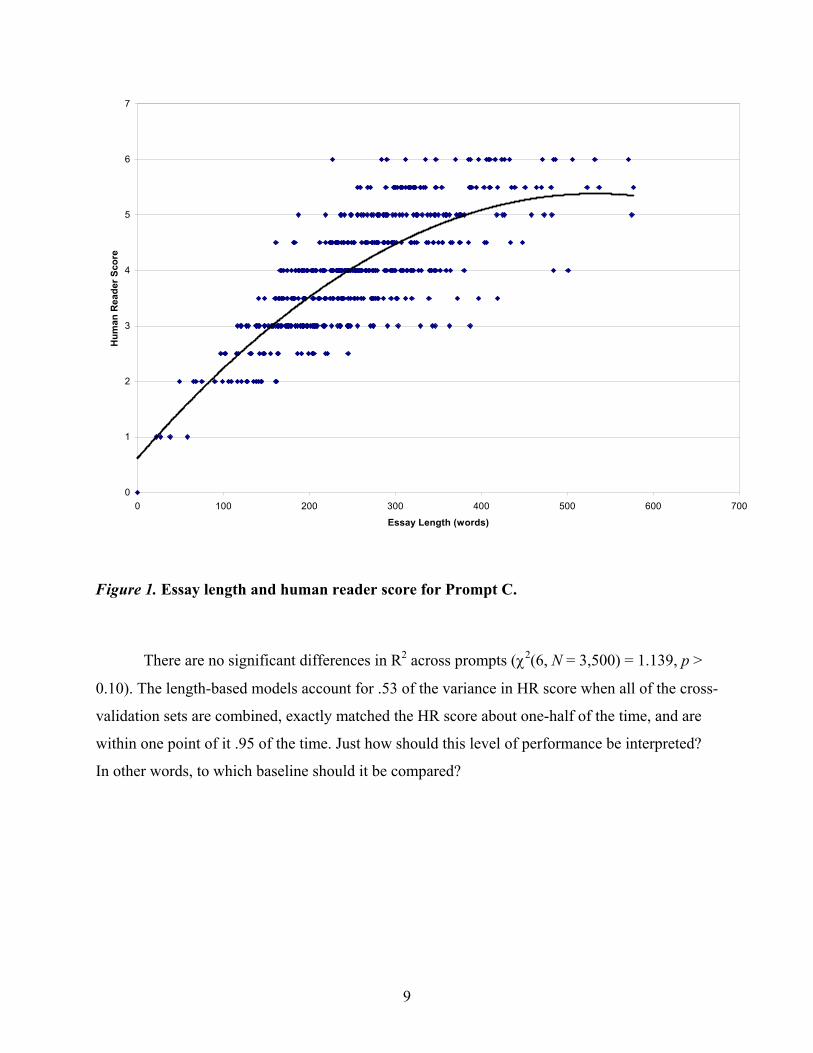
Longer TOEFL essays tend to receive higher scores from human readers than shorter
essays receive. This relation between quantity and quality is not too surprising, since many of the
criteria for high scores (e.g., details used to support a thesis, syntactic variety, and range of
vocabulary) are difficult to produce in a short essay. Figure 1 shows the typical relation between
essay length and human reader score in the mixed cross-validation data, in this case for prompt
C. Polynomial regressions using essay length were computed for all the mixed cross-validation
sets and showed significant linear (i.e., number of words) and quadratic (number of words
squared) components (all ps < .001).3 The polynomial regression line is superimposed on the
data in Figure 1, where it accounts for .60 of the score variance.
We will use the term “length-based” to refer to polynomial regression models that use the
number of words and the number of words squared as predictors. For each prompt, we computed
a length-based regression model from the 265 essays of its training set and then used the model
to predict each of the 500 HR scores in its mixed cross-validation set. The rationale for this is to
see what performance would be like if only length information were extracted from the training
set and used for predicting score. Table 3 gives the proportion of score variance accounted for by
the predictions. Also shown are “exact agreement,” the proportion of times the predicted score
exactly matched the HR score when both were rounded to the nearest integer, and “adjacent
agreement,” the proportion of times the prediction was within one point of the HR score. The
bottom row shows the values obtained when the essays from the seven data sets are combined
into a single set. The confusion matrix for this combined set is included in Appendix B.
9
0
1
2
3
4
5
6
7
0 100 200 300 400 500 600 700
Essay Length (words)
Hum
an R
eade
r Sco
re
Figure 1. Essay length and human reader score for Prompt C.
There are no significant differences in R2 across prompts (χ2(6, N = 3,500) = 1.139, p >
0.10). The length-based models account for .53 of the variance in HR score when all of the cross-
validation sets are combined, exactly matched the HR score about one-half of the time, and are
within one point of it .95 of the time. Just how should this level of performance be interpreted?
In other words, to which baseline should it be compared?
10
1o e
e
P PP
κ −=
−
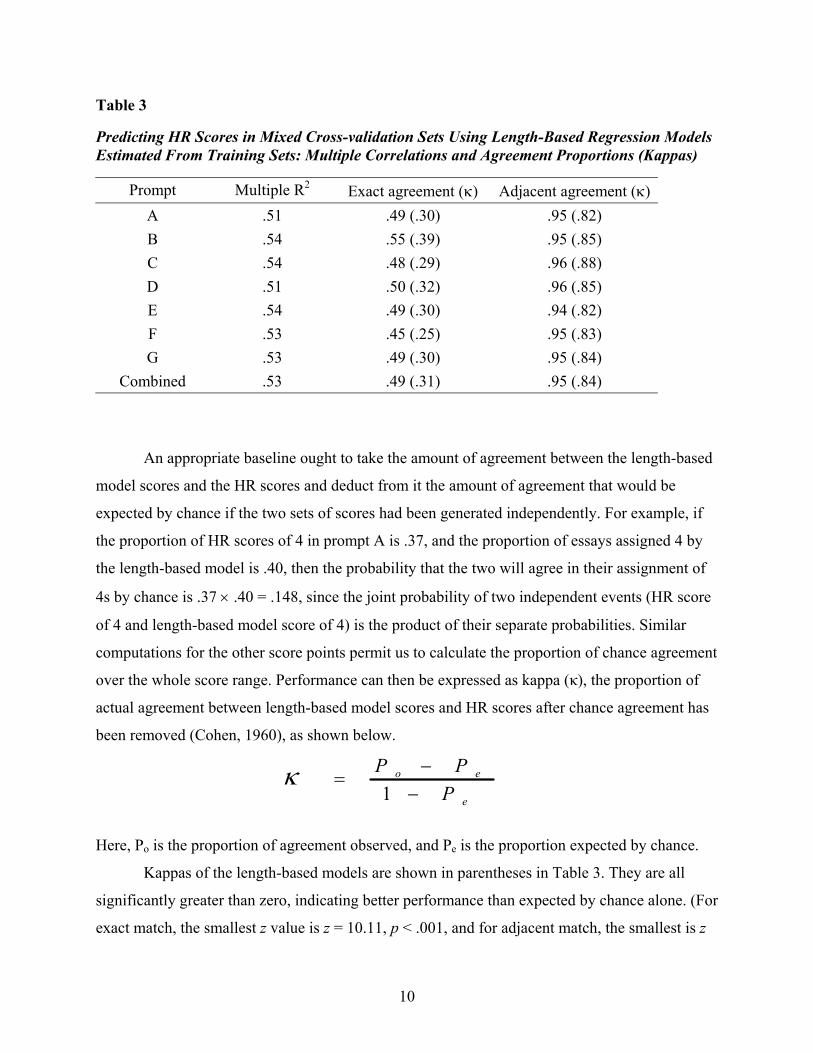
Table 3
Predicting HR Scores in Mixed Cross-validation Sets Using Length-Based Regression Models Estimated From Training Sets: Multiple Correlations and Agreement Proportions (Kappas)
Prompt Multiple R2 Exact agreement (κ) Adjacent agreement (κ) A .51 .49 (.30) .95 (.82) B .54 .55 (.39) .95 (.85) C .54 .48 (.29) .96 (.88) D .51 .50 (.32) .96 (.85) E .54 .49 (.30) .94 (.82) F .53 .45 (.25) .95 (.83) G .53 .49 (.30) .95 (.84)
Combined .53 .49 (.31) .95 (.84)
An appropriate baseline ought to take the amount of agreement between the length-based
model scores and the HR scores and deduct from it the amount of agreement that would be
expected by chance if the two sets of scores had been generated independently. For example, if
the proportion of HR scores of 4 in prompt A is .37, and the proportion of essays assigned 4 by
the length-based model is .40, then the probability that the two will agree in their assignment of
4s by chance is .37 × .40 = .148, since the joint probability of two independent events (HR score
of 4 and length-based model score of 4) is the product of their separate probabilities. Similar
computations for the other score points permit us to calculate the proportion of chance agreement
over the whole score range. Performance can then be expressed as kappa (κ), the proportion of
actual agreement between length-based model scores and HR scores after chance agreement has
been removed (Cohen, 1960), as shown below.
Here, Po is the proportion of agreement observed, and Pe is the proportion expected by chance.
Kappas of the length-based models are shown in parentheses in Table 3. They are all
significantly greater than zero, indicating better performance than expected by chance alone. (For
exact match, the smallest z value is z = 10.11, p < .001, and for adjacent match, the smallest is z
11
= 6.42, p < .001; see Fleiss, 1981, for significance tests involving kappa.) This, of course, is not
surprising, given the significant correlation between HR score and essay length. However, a
kappa less than about 0.40 is considered to show poor agreement, while one above 0.75 indicates
excellent agreement (Landis & Koch, 1977). Using these criteria, the length-based models show
poor exact agreement with HR but excellent adjacent agreement.
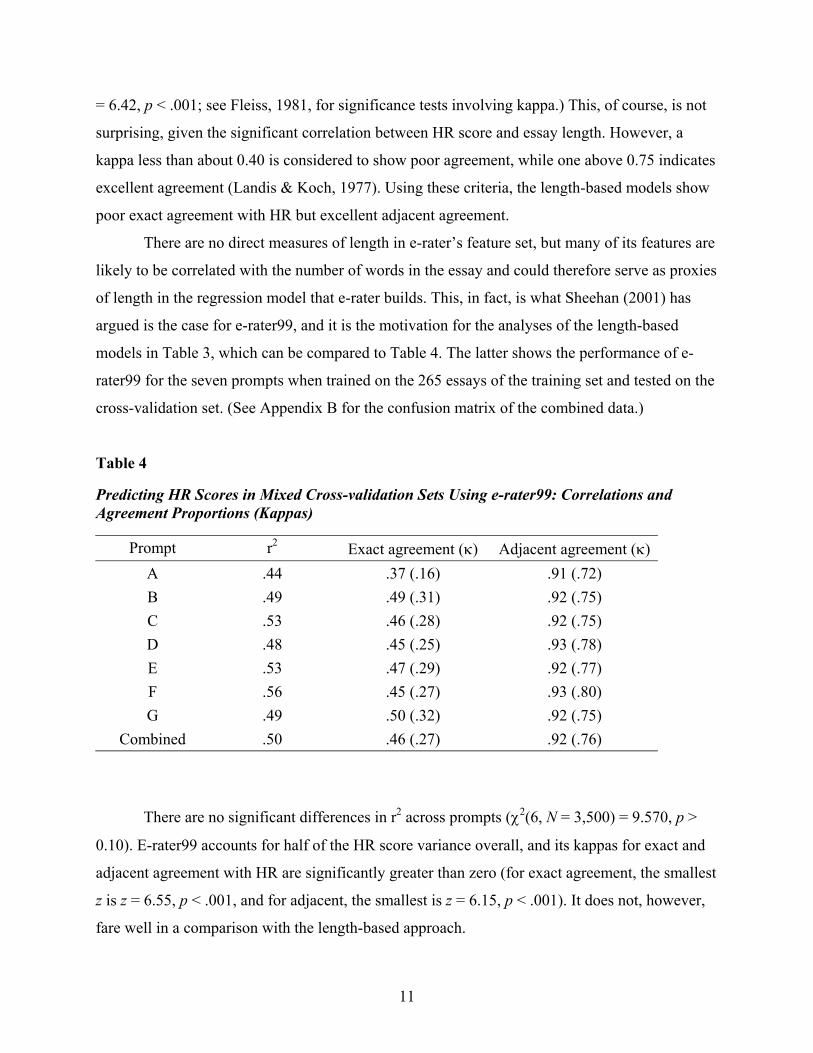
There are no direct measures of length in e-rater’s feature set, but many of its features are
likely to be correlated with the number of words in the essay and could therefore serve as proxies
of length in the regression model that e-rater builds. This, in fact, is what Sheehan (2001) has
argued is the case for e-rater99, and it is the motivation for the analyses of the length-based
models in Table 3, which can be compared to Table 4. The latter shows the performance of e-
rater99 for the seven prompts when trained on the 265 essays of the training set and tested on the
cross-validation set. (See Appendix B for the confusion matrix of the combined data.)
Table 4
Predicting HR Scores in Mixed Cross-validation Sets Using e-rater99: Correlations and Agreement Proportions (Kappas)
Prompt r2 Exact agreement (κ) Adjacent agreement (κ) A .44 .37 (.16) .91 (.72) B .49 .49 (.31) .92 (.75) C .53 .46 (.28) .92 (.75) D .48 .45 (.25) .93 (.78) E .53 .47 (.29) .92 (.77) F .56 .45 (.27) .93 (.80) G .49 .50 (.32) .92 (.75)
Combined .50 .46 (.27) .92 (.76)
There are no significant differences in r2 across prompts (χ2(6, N = 3,500) = 9.570, p >
0.10). E-rater99 accounts for half of the HR score variance overall, and its kappas for exact and
adjacent agreement with HR are significantly greater than zero (for exact agreement, the smallest
z is z = 6.55, p < .001, and for adjacent, the smallest is z = 6.15, p < .001). It does not, however,
fare well in a comparison with the length-based approach.
12
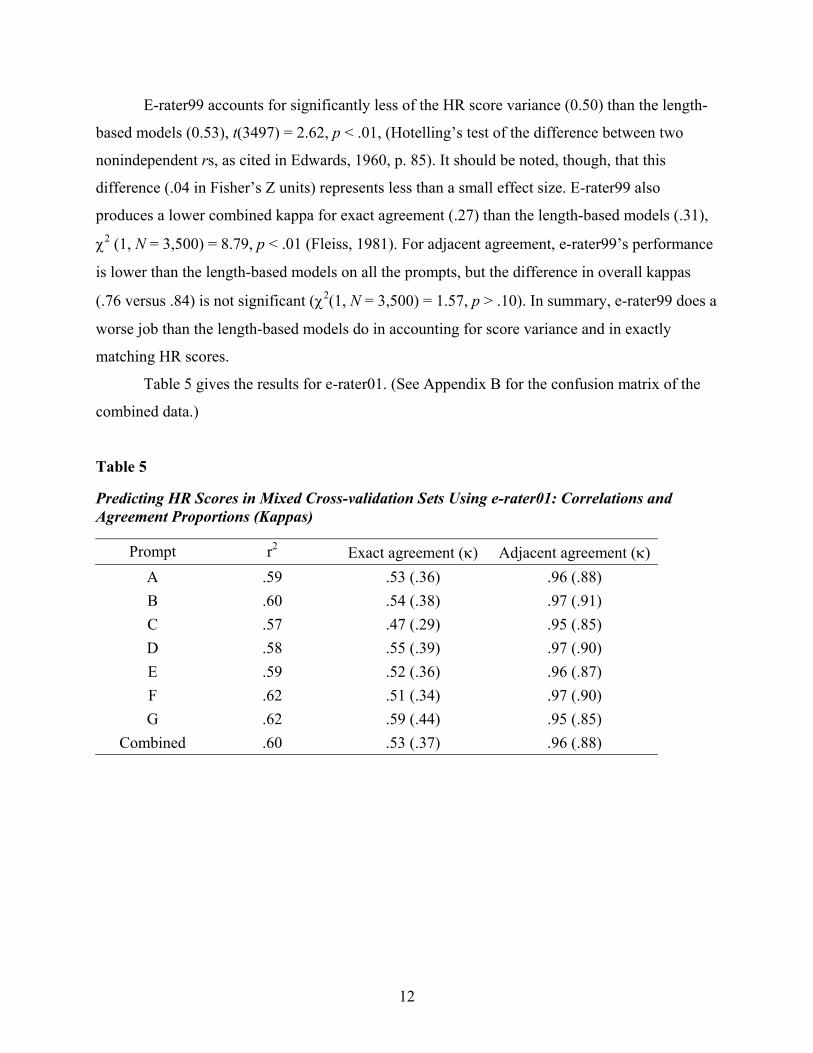
E-rater99 accounts for significantly less of the HR score variance (0.50) than the length-
based models (0.53), t(3497) = 2.62, p < .01, (Hotelling’s test of the difference between two
nonindependent rs, as cited in Edwards, 1960, p. 85). It should be noted, though, that this
difference (.04 in Fisher’s Z units) represents less than a small effect size. E-rater99 also
produces a lower combined kappa for exact agreement (.27) than the length-based models (.31),
χ2 (1, N = 3,500) = 8.79, p < .01 (Fleiss, 1981). For adjacent agreement, e-rater99’s performance
is lower than the length-based models on all the prompts, but the difference in overall kappas
(.76 versus .84) is not significant (χ2(1, N = 3,500) = 1.57, p > .10). In summary, e-rater99 does a
worse job than the length-based models do in accounting for score variance and in exactly
matching HR scores.
Table 5 gives the results for e-rater01. (See Appendix B for the confusion matrix of the
combined data.)
Table 5
Predicting HR Scores in Mixed Cross-validation Sets Using e-rater01: Correlations and Agreement Proportions (Kappas)
Prompt r2 Exact agreement (κ) Adjacent agreement (κ) A .59 .53 (.36) .96 (.88) B .60 .54 (.38) .97 (.91) C .57 .47 (.29) .95 (.85) D .58 .55 (.39) .97 (.90) E .59 .52 (.36) .96 (.87) F .62 .51 (.34) .97 (.90) G .62 .59 (.44) .95 (.85)
Combined .60 .53 (.37) .96 (.88)
13
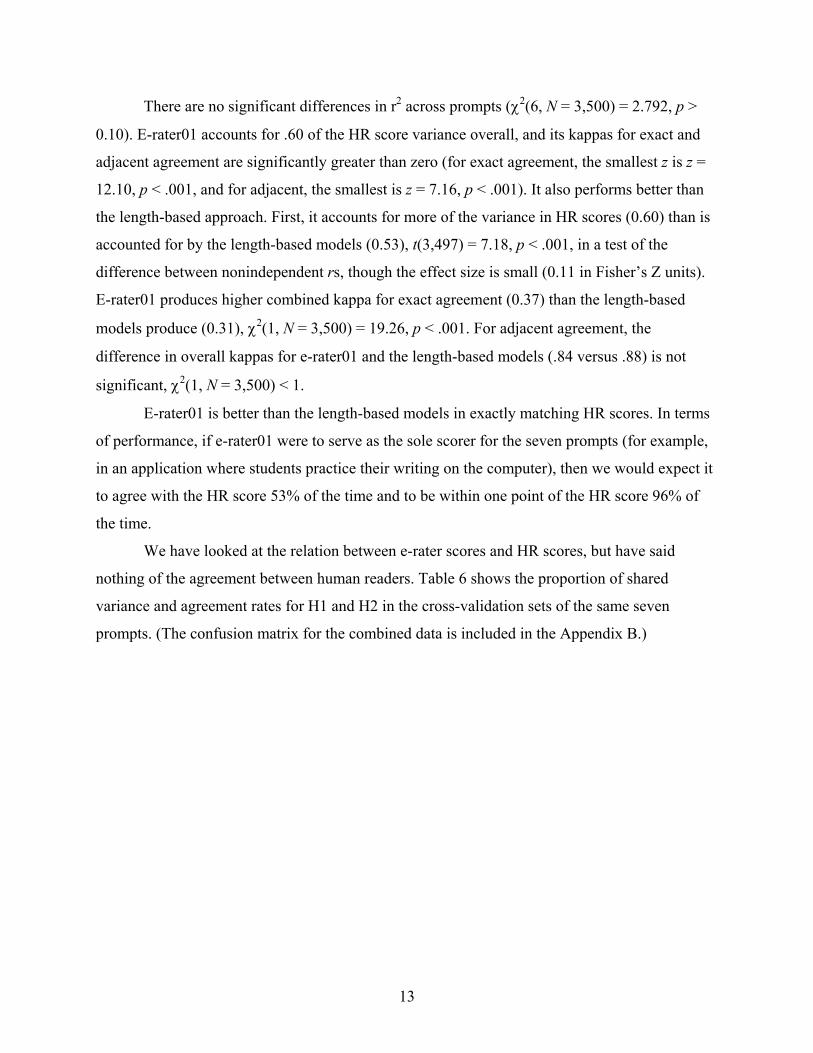
There are no significant differences in r2 across prompts (χ2(6, N = 3,500) = 2.792, p >
0.10). E-rater01 accounts for .60 of the HR score variance overall, and its kappas for exact and
adjacent agreement are significantly greater than zero (for exact agreement, the smallest z is z =
12.10, p < .001, and for adjacent, the smallest is z = 7.16, p < .001). It also performs better than
the length-based approach. First, it accounts for more of the variance in HR scores (0.60) than is
accounted for by the length-based models (0.53), t(3,497) = 7.18, p < .001, in a test of the
difference between nonindependent rs, though the effect size is small (0.11 in Fisher’s Z units).
E-rater01 produces higher combined kappa for exact agreement (0.37) than the length-based
models produce (0.31), χ2(1, N = 3,500) = 19.26, p < .001. For adjacent agreement, the
difference in overall kappas for e-rater01 and the length-based models (.84 versus .88) is not
significant, χ2(1, N = 3,500) < 1.
E-rater01 is better than the length-based models in exactly matching HR scores. In terms
of performance, if e-rater01 were to serve as the sole scorer for the seven prompts (for example,
in an application where students practice their writing on the computer), then we would expect it
to agree with the HR score 53% of the time and to be within one point of the HR score 96% of
the time.
We have looked at the relation between e-rater scores and HR scores, but have said
nothing of the agreement between human readers. Table 6 shows the proportion of shared
variance and agreement rates for H1 and H2 in the cross-validation sets of the same seven
prompts. (The confusion matrix for the combined data is included in the Appendix B.)
14
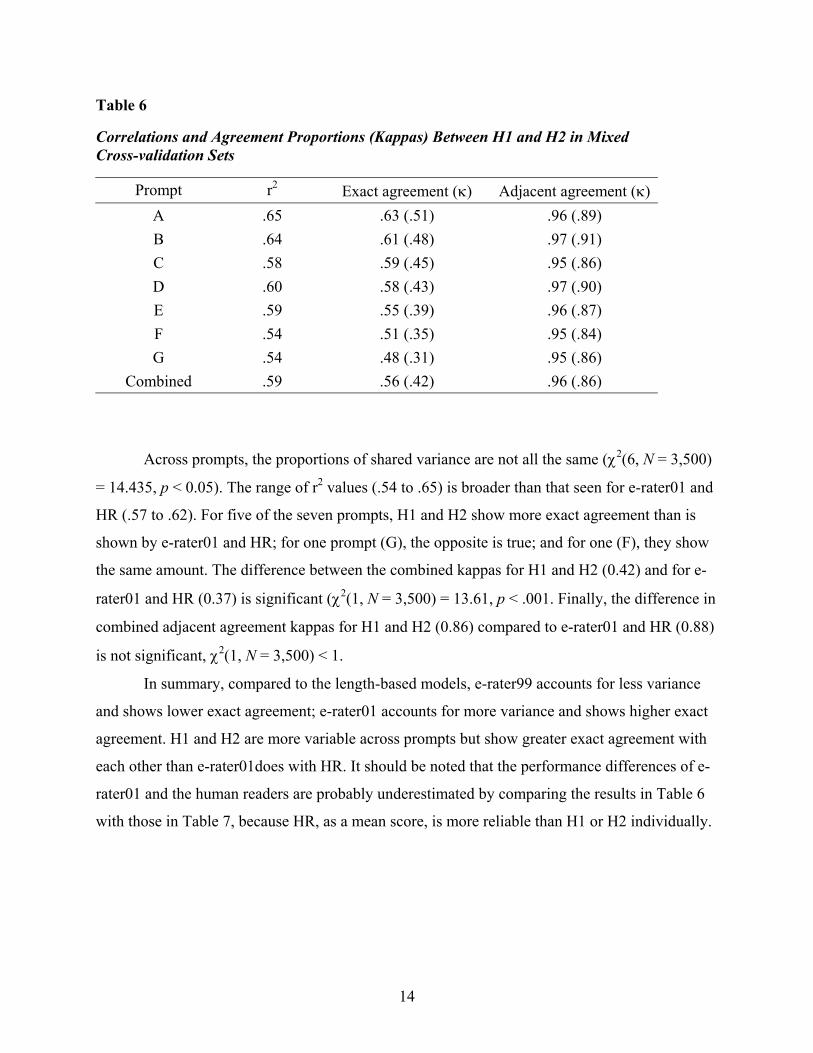
Table 6
Correlations and Agreement Proportions (Kappas) Between H1 and H2 in Mixed Cross-validation Sets
Prompt r2 Exact agreement (κ) Adjacent agreement (κ) A .65 .63 (.51) .96 (.89) B .64 .61 (.48) .97 (.91) C .58 .59 (.45) .95 (.86) D .60 .58 (.43) .97 (.90) E .59 .55 (.39) .96 (.87) F .54 .51 (.35) .95 (.84) G .54 .48 (.31) .95 (.86)
Combined .59 .56 (.42) .96 (.86)
Across prompts, the proportions of shared variance are not all the same (χ2(6, N = 3,500)
= 14.435, p < 0.05). The range of r2 values (.54 to .65) is broader than that seen for e-rater01 and
HR (.57 to .62). For five of the seven prompts, H1 and H2 show more exact agreement than is
shown by e-rater01 and HR; for one prompt (G), the opposite is true; and for one (F), they show
the same amount. The difference between the combined kappas for H1 and H2 (0.42) and for e-
rater01 and HR (0.37) is significant (χ2(1, N = 3,500) = 13.61, p < .001. Finally, the difference in
combined adjacent agreement kappas for H1 and H2 (0.86) compared to e-rater01 and HR (0.88)
is not significant, χ2(1, N = 3,500) < 1.
In summary, compared to the length-based models, e-rater99 accounts for less variance
and shows lower exact agreement; e-rater01 accounts for more variance and shows higher exact
agreement. H1 and H2 are more variable across prompts but show greater exact agreement with
each other than e-rater01does with HR. It should be noted that the performance differences of e-
rater01 and the human readers are probably underestimated by comparing the results in Table 6
with those in Table 7, because HR, as a mean score, is more reliable than H1 or H2 individually.
15
Removing Length Effects
The results in Tables 3, 4, and 5 are useful for comparing the performance of e-rater99
and e-rater01 to length-based models, but they do not directly assess the relation between essay
length and e-rater score. In fact, the length-based models of Table 3 were built from training sets
that are not representative of the TOEFL population in terms of essay lengths. As noted, the
training sets give equal representation to score points 2–6 (in contrast to their actual
distributions), and they overrepresent the rare score of 1. As a result, the distribution of lengths
in the training essays does not match the distribution in the cross-validation sets.
An alternative approach that avoids this shortcoming is to look at the relation between e-
rater scores and HR scores in the mixed cross-validation sets while using partial correlation to
control for the effects of length. Partial correlation allows us to use length information (number
of words and number of words squared) to predict HR scores, and also to predict e-rater scores.
The residual or difference between the HR score and its length-based prediction represents the
part of the HR score that length cannot explain. Similarly, the residual between the e-rater score
and its length-based prediction represents the part of the e-rater score that length cannot explain.
We can then ask if a correlation exists between these residuals. If it does, e-rater must be using at
least some information that is independent of length in predicting human reader scores. If it does
not, then e-rater’s performance is no better than that of a model that uses only the number of
words and the number of words squared.
Table 7 shows the variance in HR scores accounted for by e-rater99 and e-rater01 when
the length measures have been partialed out. For comparison, it also shows the shared variance
between H1 and H2 with the effects of length removed in the same way.
16
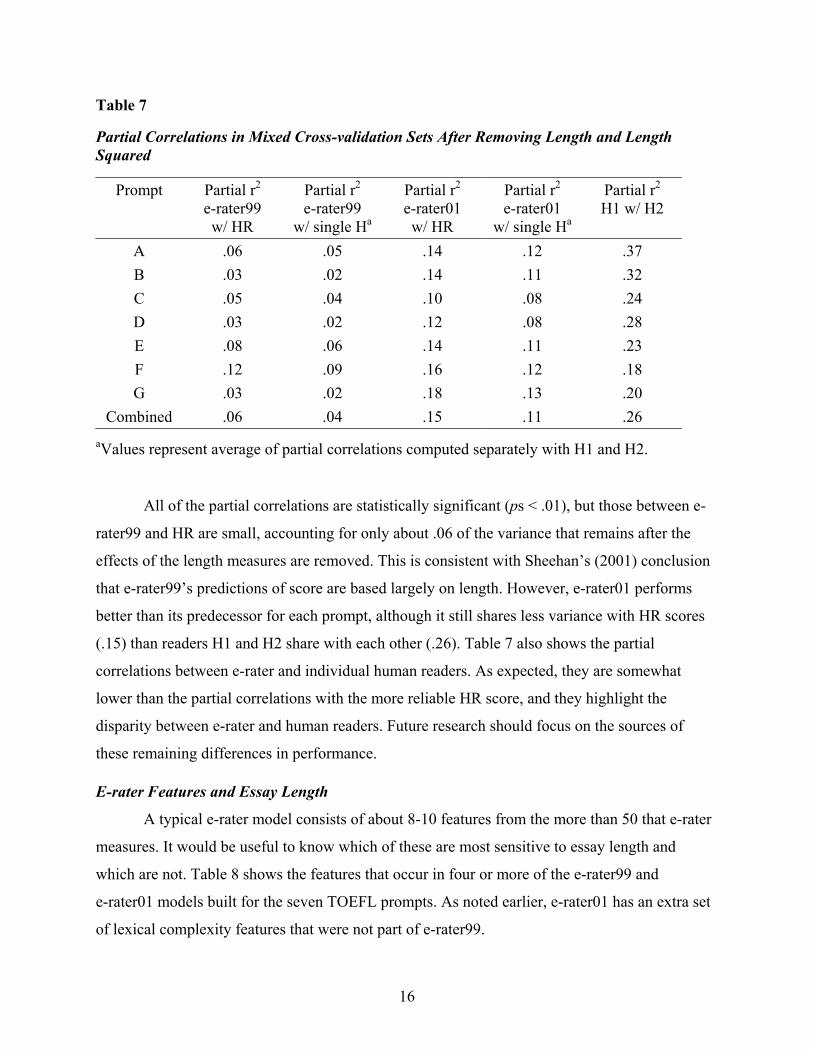
Table 7
Partial Correlations in Mixed Cross-validation Sets After Removing Length and Length Squared
Prompt Partial r2 e-rater99 w/ HR
Partial r2 e-rater99
w/ single Ha
Partial r2 e-rater01 w/ HR
Partial r2 e-rater01
w/ single Ha
Partial r2 H1 w/ H2
A .06 .05 .14 .12 .37 B .03 .02 .14 .11 .32 C .05 .04 .10 .08 .24 D .03 .02 .12 .08 .28 E .08 .06 .14 .11 .23 F .12 .09 .16 .12 .18 G .03 .02 .18 .13 .20
Combined .06 .04 .15 .11 .26 aValues represent average of partial correlations computed separately with H1 and H2.
All of the partial correlations are statistically significant (ps < .01), but those between e-
rater99 and HR are small, accounting for only about .06 of the variance that remains after the
effects of the length measures are removed. This is consistent with Sheehan’s (2001) conclusion
that e-rater99’s predictions of score are based largely on length. However, e-rater01 performs
better than its predecessor for each prompt, although it still shares less variance with HR scores
(.15) than readers H1 and H2 share with each other (.26). Table 7 also shows the partial
correlations between e-rater and individual human readers. As expected, they are somewhat
lower than the partial correlations with the more reliable HR score, and they highlight the
disparity between e-rater and human readers. Future research should focus on the sources of
these remaining differences in performance.
E-rater Features and Essay Length
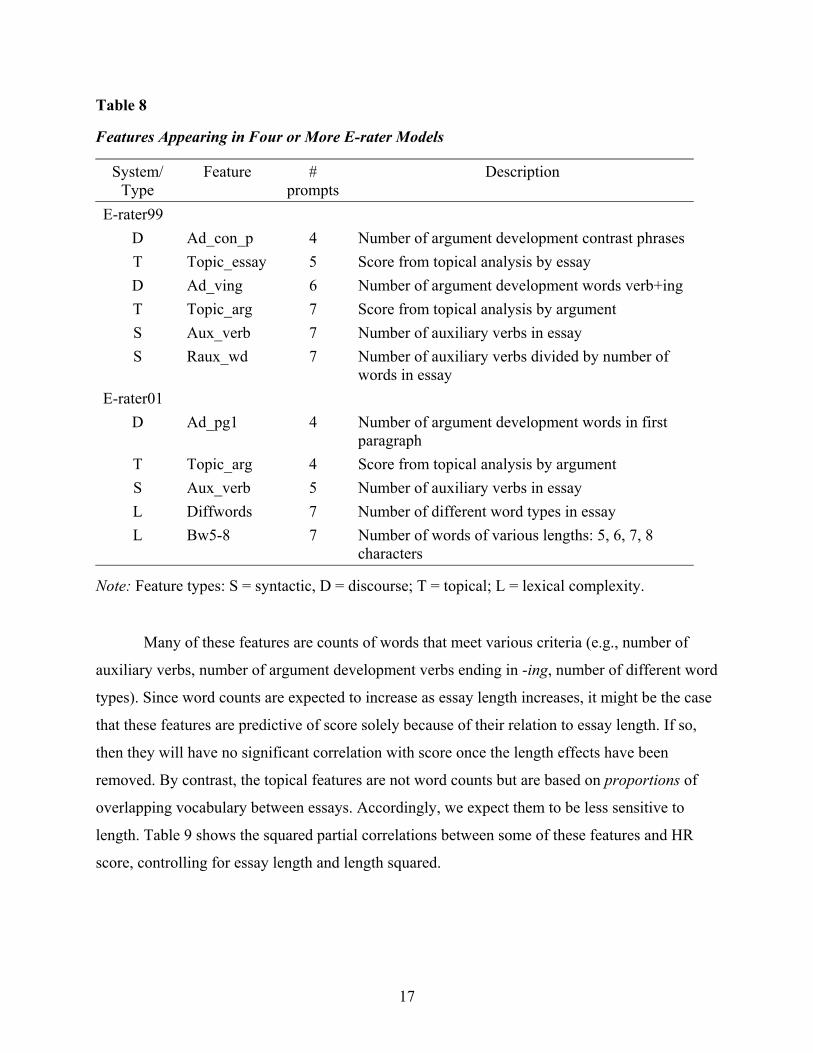
A typical e-rater model consists of about 8-10 features from the more than 50 that e-rater
measures. It would be useful to know which of these are most sensitive to essay length and
which are not. Table 8 shows the features that occur in four or more of the e-rater99 and
e-rater01 models built for the seven TOEFL prompts. As noted earlier, e-rater01 has an extra set
of lexical complexity features that were not part of e-rater99.
17
Table 8
Features Appearing in Four or More E-rater Models
System/ Type
Feature # prompts
Description
E-rater99 D Ad_con_p 4 Number of argument development contrast phrases T Topic_essay 5 Score from topical analysis by essay D Ad_ving 6 Number of argument development words verb+ing T Topic_arg 7 Score from topical analysis by argument S Aux_verb 7 Number of auxiliary verbs in essay S Raux_wd 7 Number of auxiliary verbs divided by number of
words in essay E-rater01
D Ad_pg1 4 Number of argument development words in first paragraph
T Topic_arg 4 Score from topical analysis by argument S Aux_verb 5 Number of auxiliary verbs in essay L Diffwords 7 Number of different word types in essay L Bw5-8 7 Number of words of various lengths: 5, 6, 7, 8
characters
Note: Feature types: S = syntactic, D = discourse; T = topical; L = lexical complexity.
Many of these features are counts of words that meet various criteria (e.g., number of
auxiliary verbs, number of argument development verbs ending in -ing, number of different word
types). Since word counts are expected to increase as essay length increases, it might be the case
that these features are predictive of score solely because of their relation to essay length. If so,
then they will have no significant correlation with score once the length effects have been
removed. By contrast, the topical features are not word counts but are based on proportions of
overlapping vocabulary between essays. Accordingly, we expect them to be less sensitive to
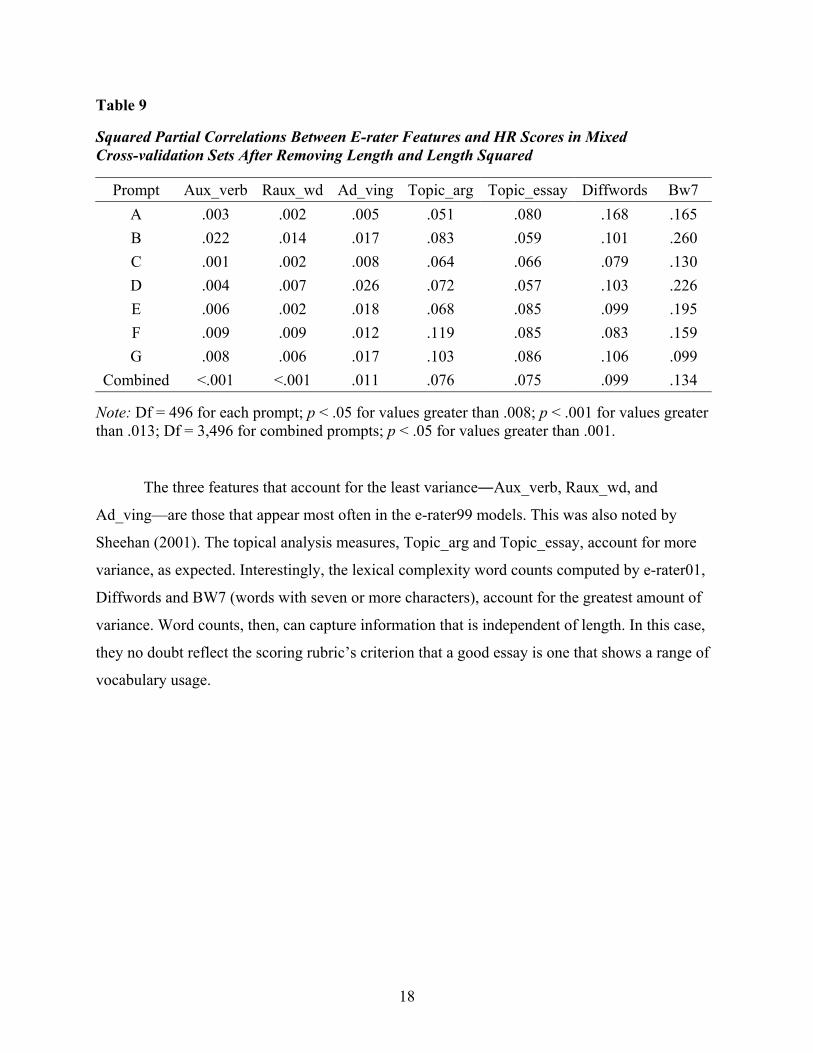
length. Table 9 shows the squared partial correlations between some of these features and HR
score, controlling for essay length and length squared.
18
Table 9
Squared Partial Correlations Between E-rater Features and HR Scores in Mixed Cross-validation Sets After Removing Length and Length Squared
Prompt Aux_verb Raux_wd Ad_ving Topic_arg Topic_essay Diffwords Bw7 A .003 .002 .005 .051 .080 .168 .165 B .022 .014 .017 .083 .059 .101 .260 C .001 .002 .008 .064 .066 .079 .130 D .004 .007 .026 .072 .057 .103 .226 E .006 .002 .018 .068 .085 .099 .195 F .009 .009 .012 .119 .085 .083 .159 G .008 .006 .017 .103 .086 .106 .099
Combined <.001 <.001 .011 .076 .075 .099 .134
Note: Df = 496 for each prompt; p < .05 for values greater than .008; p < .001 for values greater than .013; Df = 3,496 for combined prompts; p < .05 for values greater than .001.
The three features that account for the least variance―Aux_verb, Raux_wd, and
Ad_ving—are those that appear most often in the e-rater99 models. This was also noted by
Sheehan (2001). The topical analysis measures, Topic_arg and Topic_essay, account for more
variance, as expected. Interestingly, the lexical complexity word counts computed by e-rater01,
Diffwords and BW7 (words with seven or more characters), account for the greatest amount of
variance. Word counts, then, can capture information that is independent of length. In this case,
they no doubt reflect the scoring rubric’s criterion that a good essay is one that shows a range of
vocabulary usage.
19
Future improvements in e-rater will require the development of new features that measure
more of the criteria in the scoring rubric. For example, Leacock and Chodorow (2001) report a
relationship between HR score and the prevalence of low probability sequences of parts-of-
speech in TOEFL essays. These sequences (e.g., plural noun followed by singular verb, such as
books is) are often associated with grammatical errors, something that human readers are almost
certainly sensitive to in assessing the quality of sentence structure, but that e-rater99 and e-
rater01 do not measure.4
Native Language and Essay Length
In an earlier study (Burstein & Chodorow, 1999), we reported significant essay score
differences among Arabic, Chinese, Spanish, and English language groups. We also found a
significant interaction between rater and language group. For that dataset, e-rater99 assigned
higher scores than HR assigned to essays written by native speakers of some languages, and it
assigned lower scores than HR assigned to essays written by native speakers of other languages.
Sheehan (2001) argues that this interaction of rater and language reflects the tendency of e-rater
to rely more on essay length than human readers do. Here we examine the relation between rater,
native language, and length for our seven prompts.
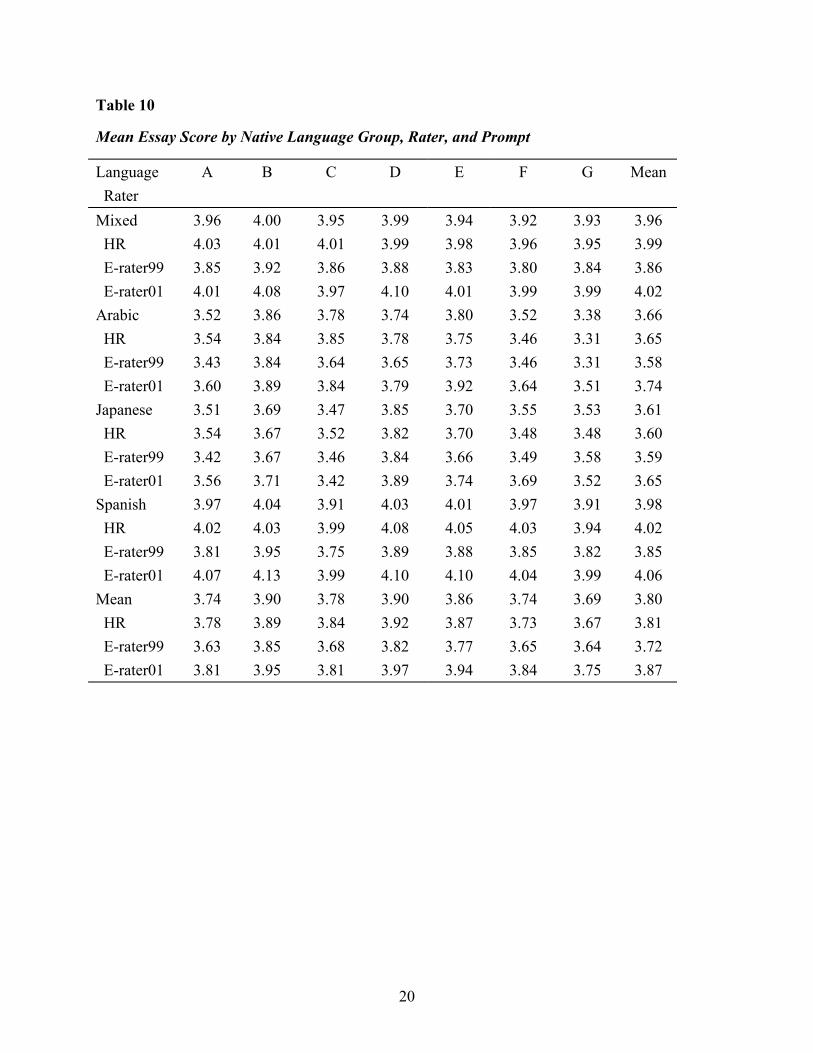
Table 10 shows mean HR, e-rater99, and e-rater01 scores by native language group and
prompt.
20
Table 10
Mean Essay Score by Native Language Group, Rater, and Prompt
Language Rater
A B C D E F G Mean
Mixed 3.96 4.00 3.95 3.99 3.94 3.92 3.93 3.96 HR 4.03 4.01 4.01 3.99 3.98 3.96 3.95 3.99 E-rater99 3.85 3.92 3.86 3.88 3.83 3.80 3.84 3.86 E-rater01 4.01 4.08 3.97 4.10 4.01 3.99 3.99 4.02 Arabic 3.52 3.86 3.78 3.74 3.80 3.52 3.38 3.66 HR 3.54 3.84 3.85 3.78 3.75 3.46 3.31 3.65 E-rater99 3.43 3.84 3.64 3.65 3.73 3.46 3.31 3.58 E-rater01 3.60 3.89 3.84 3.79 3.92 3.64 3.51 3.74 Japanese 3.51 3.69 3.47 3.85 3.70 3.55 3.53 3.61 HR 3.54 3.67 3.52 3.82 3.70 3.48 3.48 3.60 E-rater99 3.42 3.67 3.46 3.84 3.66 3.49 3.58 3.59 E-rater01 3.56 3.71 3.42 3.89 3.74 3.69 3.52 3.65 Spanish 3.97 4.04 3.91 4.03 4.01 3.97 3.91 3.98 HR 4.02 4.03 3.99 4.08 4.05 4.03 3.94 4.02 E-rater99 3.81 3.95 3.75 3.89 3.88 3.85 3.82 3.85 E-rater01 4.07 4.13 3.99 4.10 4.10 4.04 3.99 4.06 Mean 3.74 3.90 3.78 3.90 3.86 3.74 3.69 3.80 HR 3.78 3.89 3.84 3.92 3.87 3.73 3.67 3.81 E-rater99 3.63 3.85 3.68 3.82 3.77 3.65 3.64 3.72 E-rater01 3.81 3.95 3.81 3.97 3.94 3.84 3.75 3.87
21
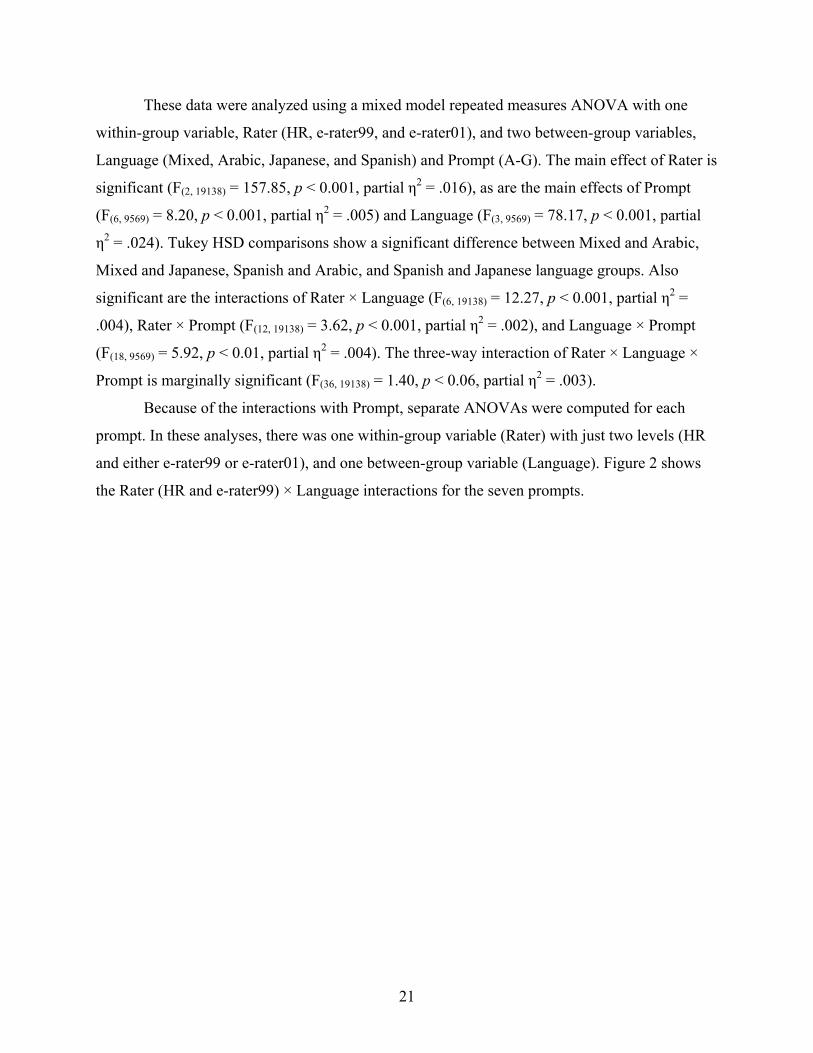
These data were analyzed using a mixed model repeated measures ANOVA with one
within-group variable, Rater (HR, e-rater99, and e-rater01), and two between-group variables,
Language (Mixed, Arabic, Japanese, and Spanish) and Prompt (A-G). The main effect of Rater is
significant (F(2, 19138) = 157.85, p < 0.001, partial η2 = .016), as are the main effects of Prompt
(F(6, 9569) = 8.20, p < 0.001, partial η2 = .005) and Language (F(3, 9569) = 78.17, p < 0.001, partial
η2 = .024). Tukey HSD comparisons show a significant difference between Mixed and Arabic,
Mixed and Japanese, Spanish and Arabic, and Spanish and Japanese language groups. Also
significant are the interactions of Rater × Language (F(6, 19138) = 12.27, p < 0.001, partial η2 =
.004), Rater × Prompt (F(12, 19138) = 3.62, p < 0.001, partial η2 = .002), and Language × Prompt
(F(18, 9569) = 5.92, p < 0.01, partial η2 = .004). The three-way interaction of Rater × Language ×
Prompt is marginally significant (F(36, 19138) = 1.40, p < 0.06, partial η2 = .003).
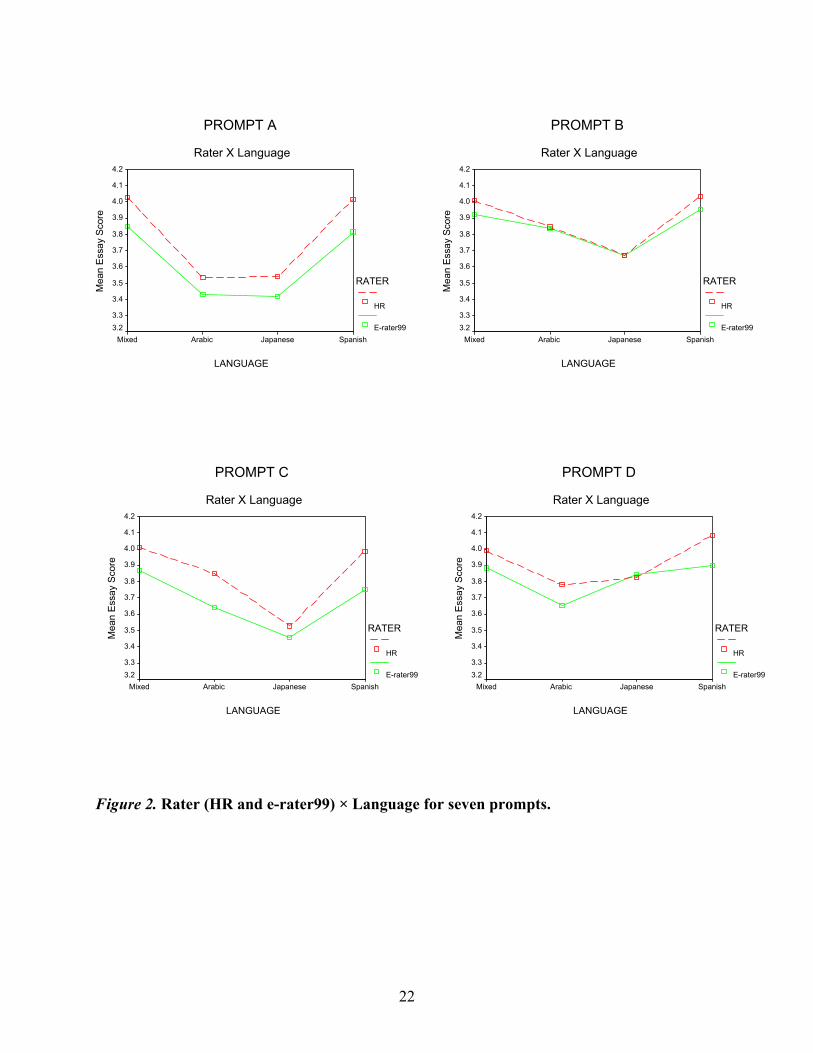
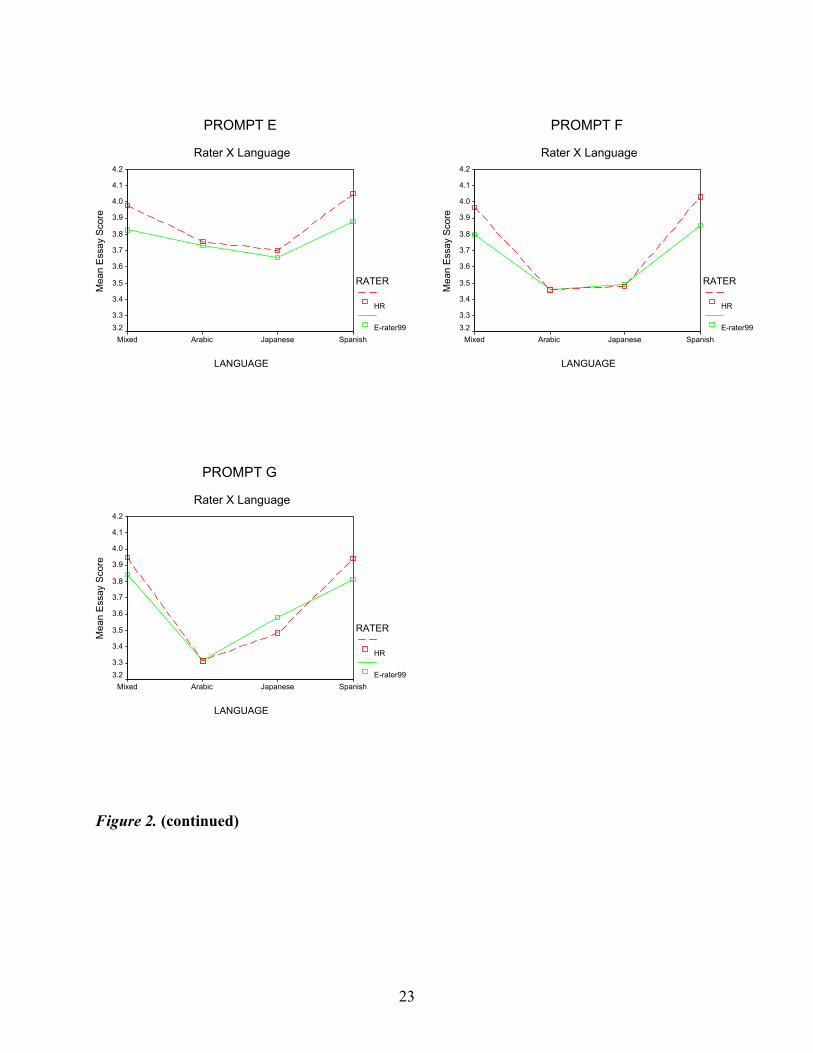
Because of the interactions with Prompt, separate ANOVAs were computed for each
prompt. In these analyses, there was one within-group variable (Rater) with just two levels (HR
and either e-rater99 or e-rater01), and one between-group variable (Language). Figure 2 shows
the Rater (HR and e-rater99) × Language interactions for the seven prompts.
22
Figure 2. Rater (HR and e-rater99) × Language for seven prompts.
PROMPT B
Rater X Language
LANGUAGE
SpanishJapaneseArabicMixed
Mea
n Es
say
Scor
e
4.2
4.1
4.0
3.9
3.8
3.7
3.6
3.5
3.4
3.33.2
RATER
HR
E-rater99
PROMPT A
Rater X Language
LANGUAGE
SpanishJapaneseArabicMixed
Mea
n Es
say
Scor
e
4.2
4.1
4.0
3.9
3.8
3.7
3.6
3.5
3.4
3.33.2
RATER
HR
E-rater99
PROMPT D
Rater X Language
LANGUAGE
SpanishJapaneseArabicMixed
Mea
n Es
say
Scor
e
4.2
4.1
4.0
3.9
3.8
3.7
3.6
3.5
3.4
3.33.2
RATER
HR
E-rater99
PROMPT C
Rater X Language
LANGUAGE
SpanishJapaneseArabicMixed
Mea
n Es
say
Scor
e
4.2
4.1
4.0
3.9
3.8
3.7
3.6
3.5
3.4
3.33.2
RATER
HR
E-rater99
23
Figure 2. (continued)
PROMPT E
Rater X Language
LANGUAGE
SpanishJapaneseArabicMixed
Mea
n Es
say
Scor
e
4.2
4.1
4.0
3.9
3.8
3.7
3.6
3.5
3.4
3.33.2
RATER
HR
E-rater99
PROMPT F
Rater X Language
LANGUAGE
SpanishJapaneseArabicMixed
Mea
n Es
say
Scor
e
4.2
4.1
4.0
3.9
3.8
3.7
3.6
3.5
3.4
3.33.2
RATER
HR
E-rater99
PROMPT G
Rater X Language
LANGUAGE
SpanishJapaneseArabicMixed
Mea
n Es
say
Scor
e
4.2
4.1
4.0
3.9
3.8
3.7
3.6
3.5
3.4
3.33.2
RATER
HR
E-rater99
24
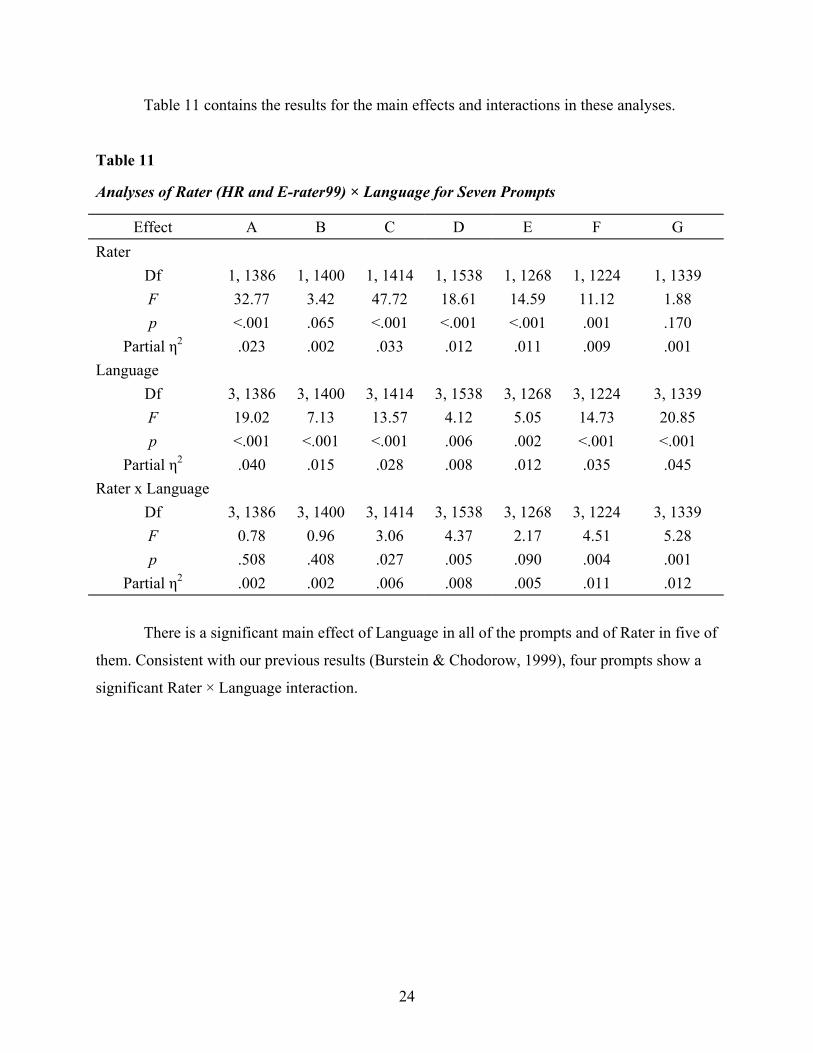
Table 11 contains the results for the main effects and interactions in these analyses.
Table 11
Analyses of Rater (HR and E-rater99) × Language for Seven Prompts
Effect A B C D E F G Rater
Df 1, 1386 1, 1400 1, 1414 1, 1538 1, 1268 1, 1224 1, 1339 F 32.77 3.42 47.72 18.61 14.59 11.12 1.88 p <.001 .065 <.001 <.001 <.001 .001 .170
Partial η2 .023 .002 .033 .012 .011 .009 .001 Language
Df 3, 1386 3, 1400 3, 1414 3, 1538 3, 1268 3, 1224 3, 1339 F 19.02 7.13 13.57 4.12 5.05 14.73 20.85 p <.001 <.001 <.001 .006 .002 <.001 <.001
Partial η2 .040 .015 .028 .008 .012 .035 .045 Rater x Language
Df 3, 1386 3, 1400 3, 1414 3, 1538 3, 1268 3, 1224 3, 1339 F 0.78 0.96 3.06 4.37 2.17 4.51 5.28 p .508 .408 .027 .005 .090 .004 .001
Partial η2 .002 .002 .006 .008 .005 .011 .012
There is a significant main effect of Language in all of the prompts and of Rater in five of
them. Consistent with our previous results (Burstein & Chodorow, 1999), four prompts show a
significant Rater × Language interaction.
25
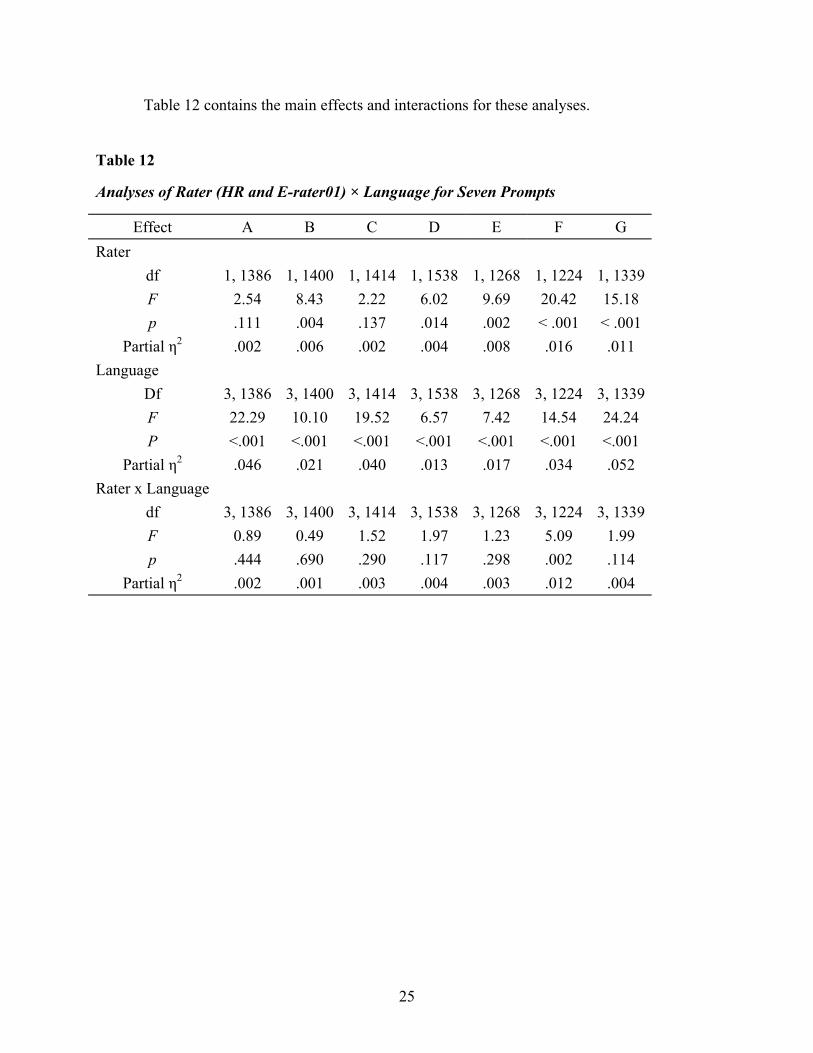
Table 12 contains the main effects and interactions for these analyses.
Table 12
Analyses of Rater (HR and E-rater01) × Language for Seven Prompts
Effect A B C D E F G Rater
df 1, 1386 1, 1400 1, 1414 1, 1538 1, 1268 1, 1224 1, 1339 F 2.54 8.43 2.22 6.02 9.69 20.42 15.18 p .111 .004 .137 .014 .002 < .001 < .001
Partial η2 .002 .006 .002 .004 .008 .016 .011 Language
Df 3, 1386 3, 1400 3, 1414 3, 1538 3, 1268 3, 1224 3, 1339 F 22.29 10.10 19.52 6.57 7.42 14.54 24.24 P <.001 <.001 <.001 <.001 <.001 <.001 <.001
Partial η2 .046 .021 .040 .013 .017 .034 .052 Rater x Language
df 3, 1386 3, 1400 3, 1414 3, 1538 3, 1268 3, 1224 3, 1339 F 0.89 0.49 1.52 1.97 1.23 5.09 1.99 p .444 .690 .290 .117 .298 .002 .114
Partial η2 .002 .001 .003 .004 .003 .012 .004
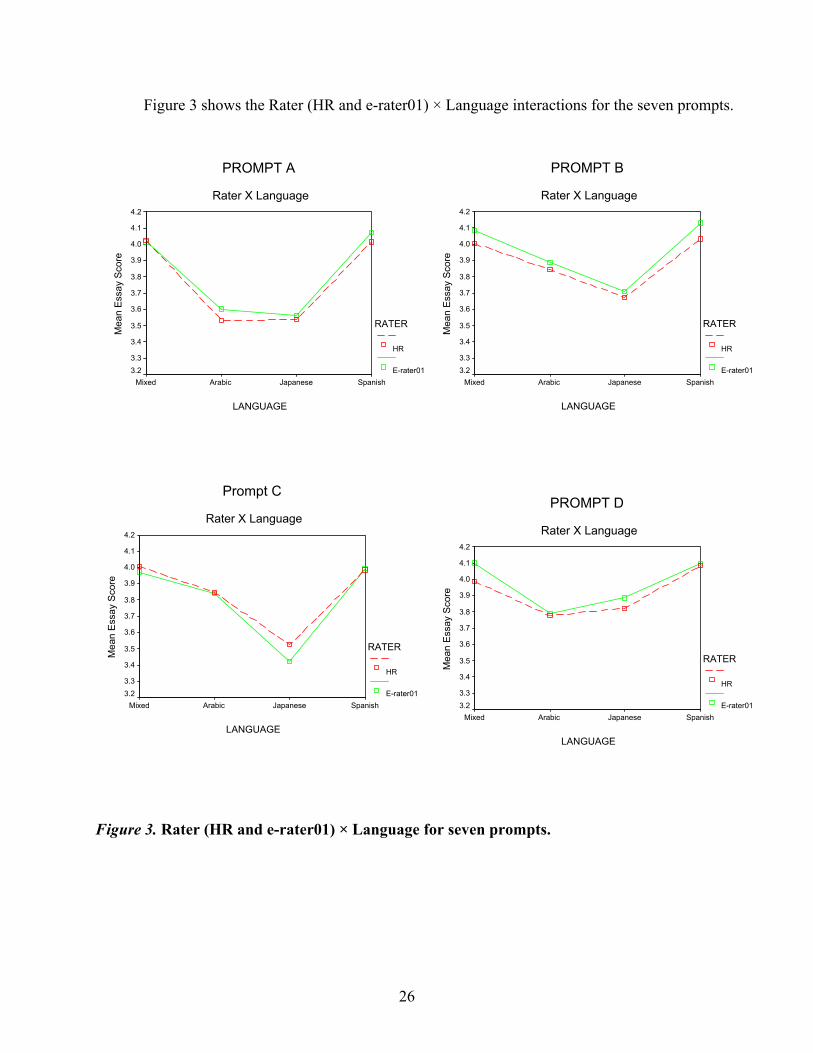
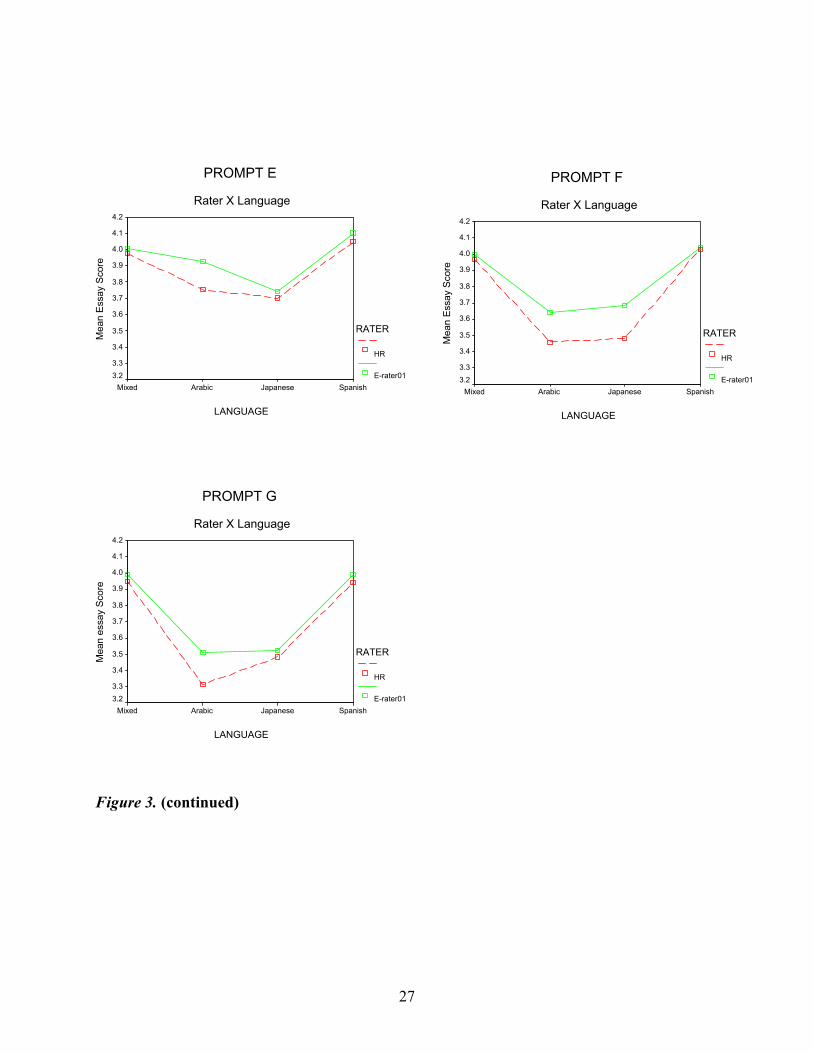
26
Figure 3 shows the Rater (HR and e-rater01) × Language interactions for the seven prompts.
PROMPT A
Rater X Language
LANGUAGE
SpanishJapaneseArabicMixed
Mea
n Es
say
Scor
e
4.2
4.1
4.0
3.9
3.8
3.7
3.6
3.5
3.4
3.33.2
RATER
HR
E-rater01
Figure 3. Rater (HR and e-rater01) × Language for seven prompts.
PROMPT B
Rater X Language
LANGUAGE
SpanishJapaneseArabicMixed
Mea
n Es
say
Scor
e
4.2
4.1
4.0
3.9
3.8
3.7
3.6
3.5
3.4
3.33.2
RATER
HR
E-rater01
Prompt C
Rater X Language
LANGUAGE
SpanishJapaneseArabicMixed
Mea
n Es
say
Scor
e
4.2
4.1
4.0
3.9
3.8
3.7
3.6
3.5
3.4
3.33.2
RATER
HR
E-rater01
PROMPT D
Rater X Language
LANGUAGE
SpanishJapaneseArabicMixed
Mea
n Es
say
Scor
e
4.2
4.1
4.0
3.9
3.8
3.7
3.6
3.5
3.4
3.33.2
RATER
HR
E-rater01
27
Figure 3. (continued)
PROMPT F
Rater X Language
LANGUAGE
SpanishJapaneseArabicMixed
Mea
n Es
say
Scor
e
4.2
4.1
4.0
3.9
3.8
3.7
3.6
3.5
3.4
3.33.2
RATER
HR
E-rater01
PROMPT E
Rater X Language
LANGUAGE
SpanishJapaneseArabicMixed
Mea
n Es
say
Scor
e
4.2
4.1
4.0
3.9
3.8
3.7
3.6
3.5
3.4
3.33.2
RATER
HR
E-rater01
PROMPT G
Rater X Language
LANGUAGE
SpanishJapaneseArabicMixed
Mea
n es
say
Scor
e
4.2
4.1
4.0
3.9
3.8
3.7
3.6
3.5
3.4
3.33.2
RATER
HR
E-rater01
28
In these analyses, as in those of Table 11, Language is a significant main effect for all of
the prompts and Rater is significant for five of them. However, in contrast to the previous results,
there is only one significant interaction of Rater × Language (for Prompt F). Although far from
conclusive, this suggests that e-rater01 may be more likely than e-rater99 to produce a pattern of
scores among language groups that is similar to the pattern found in HR.
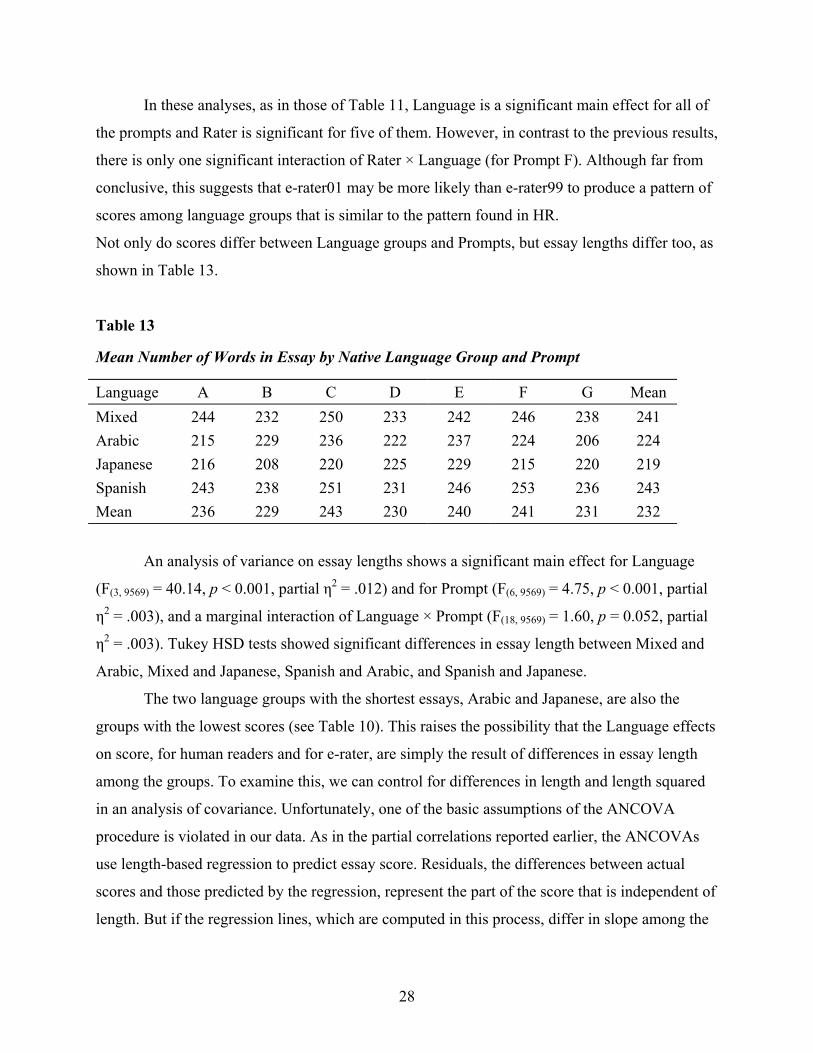
Not only do scores differ between Language groups and Prompts, but essay lengths differ too, as
shown in Table 13.
Table 13
Mean Number of Words in Essay by Native Language Group and Prompt
Language A B C D E F G Mean Mixed 244 232 250 233 242 246 238 241 Arabic 215 229 236 222 237 224 206 224 Japanese 216 208 220 225 229 215 220 219 Spanish 243 238 251 231 246 253 236 243 Mean 236 229 243 230 240 241 231 232
An analysis of variance on essay lengths shows a significant main effect for Language
(F(3, 9569) = 40.14, p < 0.001, partial η2 = .012) and for Prompt (F(6, 9569) = 4.75, p < 0.001, partial
η2 = .003), and a marginal interaction of Language × Prompt (F(18, 9569) = 1.60, p = 0.052, partial
η2 = .003). Tukey HSD tests showed significant differences in essay length between Mixed and
Arabic, Mixed and Japanese, Spanish and Arabic, and Spanish and Japanese.
The two language groups with the shortest essays, Arabic and Japanese, are also the
groups with the lowest scores (see Table 10). This raises the possibility that the Language effects
on score, for human readers and for e-rater, are simply the result of differences in essay length
among the groups. To examine this, we can control for differences in length and length squared
in an analysis of covariance. Unfortunately, one of the basic assumptions of the ANCOVA
procedure is violated in our data. As in the partial correlations reported earlier, the ANCOVAs
use length-based regression to predict essay score. Residuals, the differences between actual
scores and those predicted by the regression, represent the part of the score that is independent of
length. But if the regression lines, which are computed in this process, differ in slope among the
29
various language groups, then the ANCOVA procedure cannot be used (Mertler & Vannatta,
2001). This is the case for all seven prompts.5 An examination of the data arranged by length
showed a small number of essays that were empty or almost empty (containing less than 10
words) and a small number with more than 550 words (greater than three standard deviations
above the mean essay length). With these very short and very long essays removed (less than 1%
of the total number of essays), the homogeneity of slopes assumption was satisfied for six of the
seven prompts (all but prompt C) for HR and e-rater01 data, and analyses of covariance were
computed for these sets.
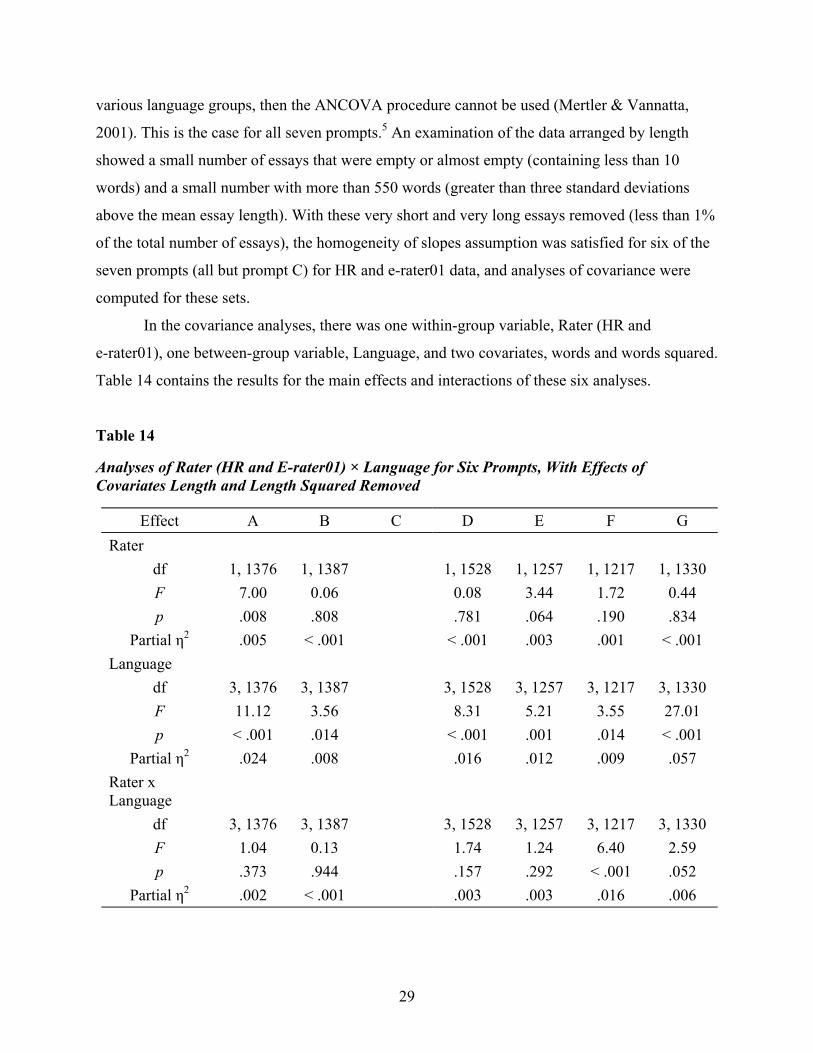
In the covariance analyses, there was one within-group variable, Rater (HR and
e-rater01), one between-group variable, Language, and two covariates, words and words squared.
Table 14 contains the results for the main effects and interactions of these six analyses.
Table 14
Analyses of Rater (HR and E-rater01) × Language for Six Prompts, With Effects of Covariates Length and Length Squared Removed
Effect A B C D E F G Rater
df 1, 1376 1, 1387 1, 1528 1, 1257 1, 1217 1, 1330 F 7.00 0.06 0.08 3.44 1.72 0.44 p .008 .808 .781 .064 .190 .834
Partial η2 .005 < .001 < .001 .003 .001 < .001 Language
df 3, 1376 3, 1387 3, 1528 3, 1257 3, 1217 3, 1330 F 11.12 3.56 8.31 5.21 3.55 27.01 p < .001 .014 < .001 .001 .014 < .001
Partial η2 .024 .008 .016 .012 .009 .057 Rater x Language
df 3, 1376 3, 1387 3, 1528 3, 1257 3, 1217 3, 1330 F 1.04 0.13 1.74 1.24 6.40 2.59 p .373 .944 .157 .292 < .001 .052
Partial η2 .002 < .001 .003 .003 .016 .006
30
The main effect of Language is significant for all six prompts, although effect sizes are
somewhat smaller in these analyses than in the previous ones, which did not control for length
(see Table 12). The main effect of Rater is much less prevalent when effects of length are
removed. In Table 12, five of seven prompts show a difference between HR and e-rater01, but in
the current analyses, the Rater difference is significant for only one of six prompts. Finally, as in
the previous results, the Rater × Language interaction is significant for only one prompt. This
general absence of Rater × Language interactions means that HR and e-rater01produce similar
patterns of language group differences.
The results, then, indicate that the effect of native language is not entirely due to
differences in essay length, as Language is still a significant factor for all six prompts. Instead,
other aspects of writing must be responsible for the higher sores of the Spanish and the lower
scores of the Arabic and Japanese examinees. Future research should look for distinctive patterns
of feature values that can characterize the writing of these and other groups.
Summary and Conclusions
We return now to our original three questions about e-rater and essay length.
1. With the effects of length removed, how much agreement is there between e-rater and
human readers in assessing the quality of writing?
• E-rater99 performs no better than a model that uses only the number of words and the
number of words squared to predict score. Partial correlations show that it accounts
for only .05 of the variance in HR score when effects of length are removed.
• E-rater01 is significantly better than length-based models and accounts for .14 of the
HR variance when length is partialed out.
• Human readers have slightly higher levels of exact agreement (0.56) than that which
is found e-rater01 and HR (0.53), but there is no difference in adjacent agreement
proportions. With length partialed out, H1 and H2 share .26 of their variance, a value
that is greater than the partial shared variance of e-rater01 and HR (.15).
2. Which features of writing does e-rater rely on in scoring essays?
• The regression models of e-rater99 rely heavily on counts of argument development
words and auxiliary verbs, as well as on topical analysis features. When length is
31
partialed out, it is primarily the topical analysis features that account for a significant
proportion of variance.
• The regression models of e-rater01 rely largely on topical analysis features and
lexical complexity measures. Although the latter include word counts of various sorts,
these measures still account for a significant proportion of the variance when length is
removed.
3. Is there an effect of native language on score that is independent of essay length, and, if
so, does e-rater show the same pattern of differences across native language groups as
HR scores show?
• There is a main effect for language in the data of the current study. The mixed and
Spanish groups have higher scores on average than the Arabic and Japanese. These
differences remain even when length is removed.
For most of the prompts, e-rater01 shows the same pattern of differences across native
language groups as HR, even with length differences partialed out. Future work should
include additional language groups to see if these results generalize.
In practical terms, e-rater01 differs from human readers by only a very small amount in
exact agreement, and it is indistinguishable from human readers in adjacent agreement. But
despite these similarities, human readers and e-rater are not the same. When length is removed,
human readers share more variance than e-rater01 shares with HR. The human readers must be
sensitive to additional characteristics of writing that the machine is not. This suggests that the
greatest improvements in machine scoring will come from the development of new features for
as-yet unmeasured aspects of composition. The improvement in performance from e-rater99 to
e-rater01 reflects the addition of lexical complexity features, and recent advances in automatic
detection of grammatical errors (Leacock & Chodorow, 2001) have provided measures of
syntactic proficiency and word usage that e-rater02 models use.4 The goal of future work should
be to make available an even larger and more sophisticated array of features. Not only will this
lead to better scoring performance, but it will also let us capture more of the richness and
diversity of human language.
32
References
Burstein, J., & Chodorow, M. (1999). Automated essay scoring for nonnative English speakers.
Proceedings of the Workshop on Computer-Mediated Language Assessment and
Evaluation of Natural Language Processing. Joint Symposium of the Association of
Computational Linguistics and the International Association of Language Learning
Technologies (pp.68-75). College Park, Maryland.
Burstein, J., & Chodorow, M. (2002). Directions in automated essay analysis, In R. Kaplan (Ed.),
The Oxford handbook of applied linguistics (pp. 487-497). New York: Oxford University
Press.
Cohen, J. (1960). A coefficient of agreement for nominal scales. Educational and Psychological
Measurement, 20, 37-46.
Edwards, A. (1960). Experimental design in psychological research. New York: Rinehart.
Elliott, S. (2002). Intellemetric: From here to validity. In M. Shermis & J. Burstein (Eds.),
Automated essay scoring: A cross-disciplinary perspective. Hillsdale, NJ: Lawrence
Erlbaum Associates.
ETS. (1996). TOEFL Test of Written English guide. Princeton, NJ: Author.
Fleiss, J. L. (1981). Statistical methods for rates and proportions (2nd ed.). New York: John
Wiley & Sons.
Herrington, A., & Moran, C. (2001). What happens when machines read our students’ writing?
College English, 63(4), 480-499.
Keppel, G. (1991). Design and analysis: A researcher’s handbook (3rd ed.). Englewood Cliffs,
NJ: Prentice Hall.
Landauer, T., Laham, D., & Foltz, P. (2002). Automated scoring and annotation of essays with
the Intelligent Essay Assessor™. In M. Shermis & J. Burstein (Eds.), Automated essay
scoring: A cross-disciplinary perspective. Hillsdale, NJ: Lawrence Erlbaum Associates.
Landis, J. R., & Koch, G. G. (1977). The measurement of observer agreement for categorical
data. Biometrics, 33, 159-174.
Larkey, L. (1998). Automatic essay grading using text categorization techniques. Proceedings of
the 21st ACM-SIGIR Conference on Research and Development in Information Retrieval
(pp. 90-95), Melbourne, Australia.
33
Leacock, C., & Chodorow, M. (2001). Automatic assessment of vocabulary usage without
negative evidence (TOEFL Research Report No. 67). Princeton, NJ: ETS.
Mertler, C., & Vannatta, R. (2001). Advanced and multivariate statistical methods: Practical
application and interpretation. Los Angeles: Pyrzak Publishing.
Page, E. B. (2002). Project essay grade: PEG. In M. Shermis & J. Burstein (Eds.), Automated
essay scoring: A cross-disciplinary perspective. Hillsdale, NJ: Lawrence Erlbaum
Associates.
Quirk, R., Greenbaum, S., Leech, S., & Svartik, J. (1985). A comprehensive grammar of the
English language. New York: Longman.
Salton G. (1989). Automatic text processing: The transformation, analysis, and retrieval of
information by computer. New York: Addison-Wesley Publishing.
Sheehan, K. (2001). Discrepancies in human and computer generated essay scores for TOEFL-
CBT essays. Unpublished manuscript.
34
Notes 1 A score of 0 can also be assigned to indicate that the essay contains little or no text, or that it is
not on the assigned topic. 2 Less than 0.5% of the essays in the mixed cross-validation sets have a score of 0. 3 Only one prompt, E, had a significant cubic component. 4 A newer version of e-rater, e-rater02, not evaluated here, uses number of low probability part-
of-speech sequences in its prediction of essay score. 5 Homogeneity of regression slopes was tested with an analysis of variance that included in its
model an interaction term for language*words*words2. Significance of this interaction
indicates a violation of the assumption of homogeneous regression slopes (Keppel, 1991;
Mertler & Vannatta, 2001).
35
Appendix A
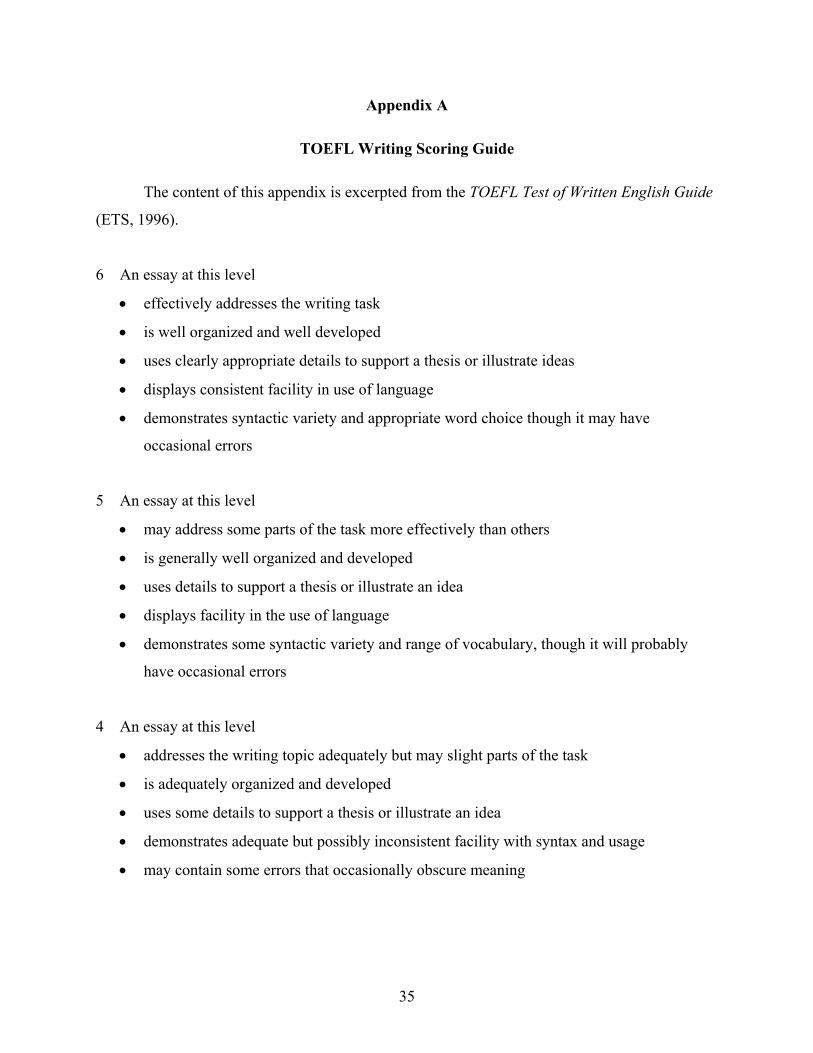
TOEFL Writing Scoring Guide
The content of this appendix is excerpted from the TOEFL Test of Written English Guide
(ETS, 1996).
6 An essay at this level
• effectively addresses the writing task
• is well organized and well developed
• uses clearly appropriate details to support a thesis or illustrate ideas
• displays consistent facility in use of language
• demonstrates syntactic variety and appropriate word choice though it may have
occasional errors
5 An essay at this level
• may address some parts of the task more effectively than others
• is generally well organized and developed
• uses details to support a thesis or illustrate an idea
• displays facility in the use of language
• demonstrates some syntactic variety and range of vocabulary, though it will probably
have occasional errors
4 An essay at this level
• addresses the writing topic adequately but may slight parts of the task
• is adequately organized and developed
• uses some details to support a thesis or illustrate an idea
• demonstrates adequate but possibly inconsistent facility with syntax and usage
• may contain some errors that occasionally obscure meaning
36
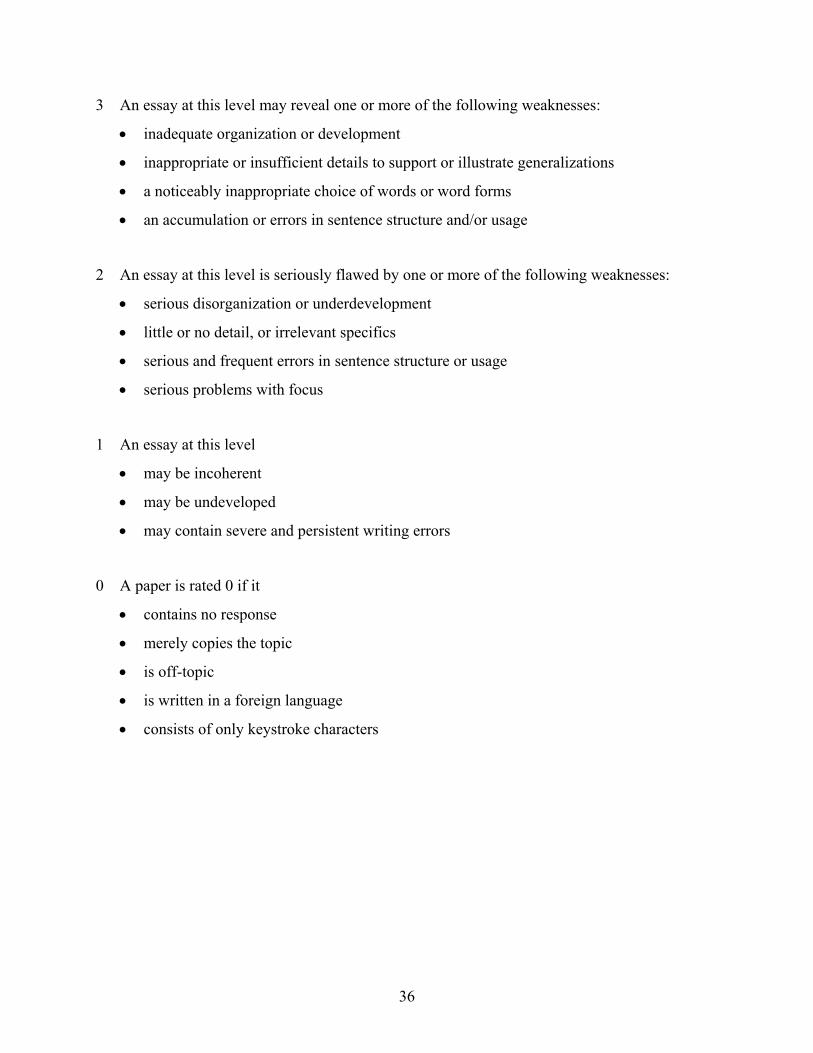
3 An essay at this level may reveal one or more of the following weaknesses:
• inadequate organization or development
• inappropriate or insufficient details to support or illustrate generalizations
• a noticeably inappropriate choice of words or word forms
• an accumulation or errors in sentence structure and/or usage
2 An essay at this level is seriously flawed by one or more of the following weaknesses:
• serious disorganization or underdevelopment
• little or no detail, or irrelevant specifics
• serious and frequent errors in sentence structure or usage
• serious problems with focus
1 An essay at this level
• may be incoherent
• may be undeveloped
• may contain severe and persistent writing errors
0 A paper is rated 0 if it
• contains no response
• merely copies the topic
• is off-topic
• is written in a foreign language
• consists of only keystroke characters
37
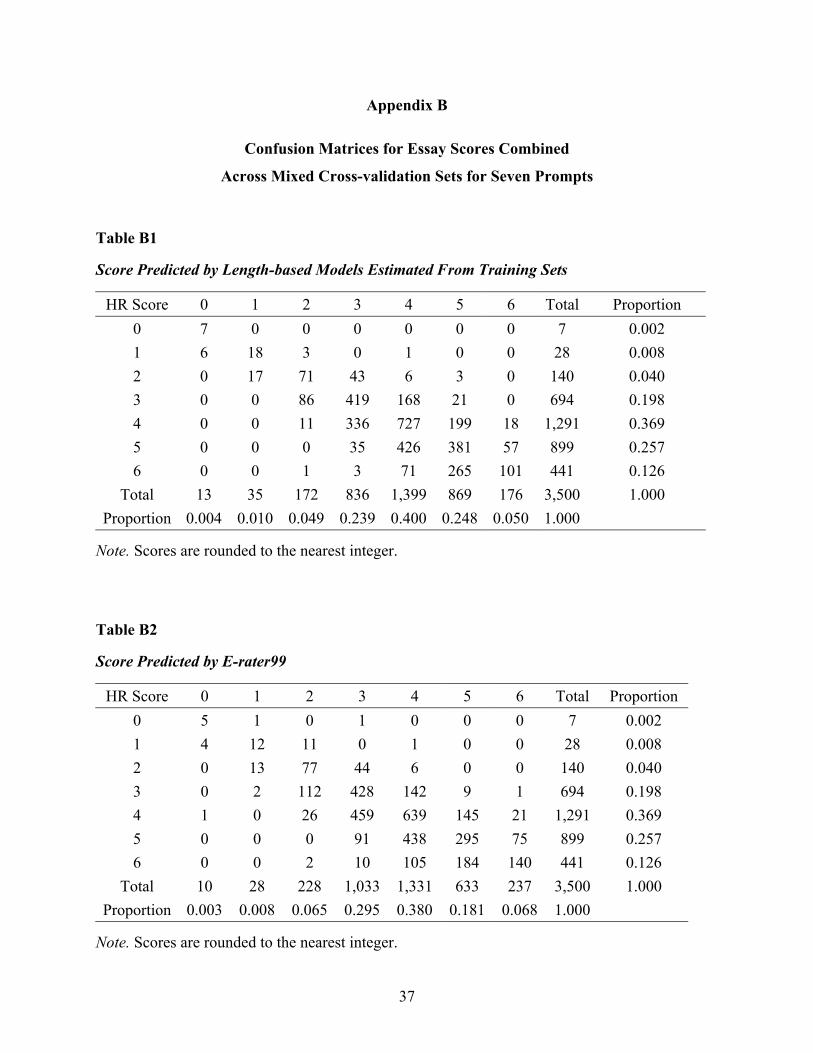
Appendix B
Confusion Matrices for Essay Scores Combined
Across Mixed Cross-validation Sets for Seven Prompts
Table B1
Score Predicted by Length-based Models Estimated From Training Sets
HR Score 0 1 2 3 4 5 6 Total Proportion 0 7 0 0 0 0 0 0 7 0.002 1 6 18 3 0 1 0 0 28 0.008 2 0 17 71 43 6 3 0 140 0.040 3 0 0 86 419 168 21 0 694 0.198 4 0 0 11 336 727 199 18 1,291 0.369 5 0 0 0 35 426 381 57 899 0.257 6 0 0 1 3 71 265 101 441 0.126
Total 13 35 172 836 1,399 869 176 3,500 1.000 Proportion 0.004 0.010 0.049 0.239 0.400 0.248 0.050 1.000
Note. Scores are rounded to the nearest integer.
Table B2
Score Predicted by E-rater99
HR Score 0 1 2 3 4 5 6 Total Proportion 0 5 1 0 1 0 0 0 7 0.002 1 4 12 11 0 1 0 0 28 0.008 2 0 13 77 44 6 0 0 140 0.040 3 0 2 112 428 142 9 1 694 0.198 4 1 0 26 459 639 145 21 1,291 0.369 5 0 0 0 91 438 295 75 899 0.257 6 0 0 2 10 105 184 140 441 0.126
Total 10 28 228 1,033 1,331 633 237 3,500 1.000 Proportion 0.003 0.008 0.065 0.295 0.380 0.181 0.068 1.000
Note. Scores are rounded to the nearest integer.
38
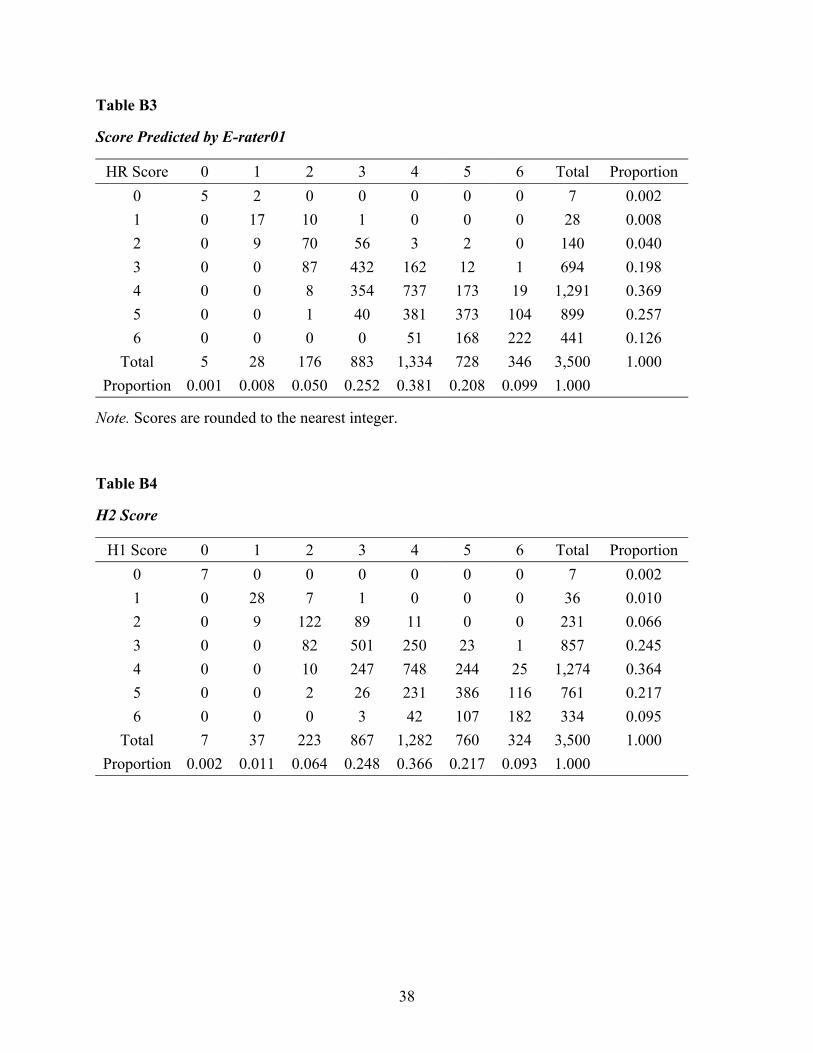
Table B3
Score Predicted by E-rater01
HR Score 0 1 2 3 4 5 6 Total Proportion 0 5 2 0 0 0 0 0 7 0.002 1 0 17 10 1 0 0 0 28 0.008 2 0 9 70 56 3 2 0 140 0.040 3 0 0 87 432 162 12 1 694 0.198 4 0 0 8 354 737 173 19 1,291 0.369 5 0 0 1 40 381 373 104 899 0.257 6 0 0 0 0 51 168 222 441 0.126
Total 5 28 176 883 1,334 728 346 3,500 1.000 Proportion 0.001 0.008 0.050 0.252 0.381 0.208 0.099 1.000
Note. Scores are rounded to the nearest integer.
Table B4
H2 Score
H1 Score 0 1 2 3 4 5 6 Total Proportion 0 7 0 0 0 0 0 0 7 0.002 1 0 28 7 1 0 0 0 36 0.010 2 0 9 122 89 11 0 0 231 0.066 3 0 0 82 501 250 23 1 857 0.245 4 0 0 10 247 748 244 25 1,274 0.364 5 0 0 2 26 231 386 116 761 0.217 6 0 0 0 3 42 107 182 334 0.095
Total 7 37 223 867 1,282 760 324 3,500 1.000 Proportion 0.002 0.011 0.064 0.248 0.366 0.217 0.093 1.000
Beyond Essay Length: Evaluating e-rater®’sPerformance on TOEFL® Essays
Martin Chodorow
Jill Burstein
Research ReportsReport 73February 2004
Test of English as a Foreign LanguagePO Box 6155
Princeton, NJ 08541-6155USA
To obtain more information about TOEFL programs and services, use one of the following:
Phone: 609-771-7100Email: [email protected]
Web site: www.ets.org/toefl
73313-035288 • Y24E.05 • Printed in U.S.A.I.N. 990112
®