beyond computation: information technology, organizational ...ebusiness.mit.edu/erik/jep beyond...
TRANSCRIPT
1
Beyond Computation:
Information Technology, Organizational Transformation
and Business Performance
Erik Brynjolfsson and Lorin M. Hitt
Abstract To understand the economic value of computers, one must broaden the traditional definition of both the technology and its effects. Case studies and firm-level econometric evidence suggest that: 1) organizational “investments” have a large influence on the value of IT investments; and 2) the benefits of IT investment are often intangible and disproportionately difficult to measure. Our analysis suggests that the link between IT and increased productivity emerged well before the recent surge in the aggregate productivity statistics and that the current macroeconomic productivity revival may in part reflect the contributions of intangible capital accumulated in the past.
Erik Brynjolfsson is Associate Professor of Management, Sloan School of Management, Massachusetts Institute of Technology, Cambridge, Massachusetts and Co-director of the Center for eBusiness at MIT. Lorin M. Hitt is Assistant Professor of Operations and Information Management, Wharton School, University of Pennsylvania, Philadelphia, Pennsylvania. Their e-mail addresses are <[email protected]> and <[email protected]> and their websites are <http://ebusiness.mit.edu/erik> and <http://grace.wharton.upenn.edu/~lhitt>, respectively.
2
Computers and Economic Growth
How do computers contribute to business performance and economic growth?
Even today, most people who are asked to identify the strengths of computers
tend to think of computational tasks like rapidly multiplying large numbers.
Computers have excelled at computation since the Mark I (1939), the first
modern computer, and the ENIAC (1943), the first electronic computer without
moving parts. During World War II, the U.S. government generously funded
research into tools for calculating the trajectories of artillery shells. The
result was the development of some of the first digital computers with
remarkable capabilities for calculation -- the dawn of the computer age.
However, computers are not fundamentally number crunchers. They are
symbol processors. The same basic technologies can be used to store,
retrieve, organize, transmit, and algorithmically transform any type of
information that can be digitized -- numbers, text, video, music, speech,
programs, and engineering drawings, to name a few. This is fortunate because
most problems are not numerical problems. Ballistics, code breaking, parts of
accounting, and bits and pieces of other tasks involve lots of calculation.
But the everyday activities of most managers, professionals, and information
workers involves other types of thinking. As computers become cheaper and
more powerful, the business value of computers is limited less by
computational capability, and more by the ability of managers to invent new
processes, procedures and organizational structures that leverage this
capability. As this form of innovation continues to develop, the applications
of computers are expected to expand well beyond computation for the
3
foreseeable future.
The fundamental economic role of computers becomes clearer if one thinks
about organizations and markets as information processors (Galbraith, 1977;
Simon, 1976; Hayek, 1945). Most of our economic institutions and intuitions
emerged in an era of relatively high communications costs, limited
computational capability, and related constraints. Information technology
(IT), defined as computers as well as related digital communication
technology, has the broad power to reduce the costs of coordination,
communications, and information processing. Thus, it is not surprising that
the massive reduction in computing and communications costs has engendered a
substantial restructuring of the economy. The majority of modern industries
are being significantly affected by computerization.
Information technology is best described not as a traditional capital
investment, but as a "general purpose technology" (Bresnahan and Trajtenberg,
1995). In most cases, the economic contributions of general purpose
technologies are substantially larger than would be predicted by simply
multiplying the quantity of capital investment devoted to them by a normal
rate of return. Instead, such technologies are economically beneficial mostly
because they facilitate complementary innovations.
Earlier general purpose technologies, such as the telegraph, the steam
engine and the electric motor, illustrate a pattern of complementary
innovations that eventually lead to dramatic productivity improvements. Some
of the complementary innovations were purely technological, such as Marconi's
"wireless" version of telegraphy. However, some of the most interesting and
productive developments were organizational innovations. For example, the
4
telegraph facilitated the formation of geographically dispersed enterprises
(Milgrom and Roberts, 1992); while the electric motor provided industrial
engineers more flexibility in the placement of machinery in factories,
dramatically improving manufacturing productivity by enabling workflow
redesign (David, 1990). The steam engine was at the root of a broad cluster
of technological and organizational changes that helped ignite the first
industrial revolution.
In this paper, we review the evidence on how investments in IT are
linked to higher productivity and organizational transformation, with emphasis
on studies conducted at the firm-level. Our central argument is twofold:
first, that a significant component of the value of IT is its ability to
enable complementary organizational investments such as business processes and
work practices; second, these investments, in turn, lead to productivity
increases by reducing costs and, more importantly, by enabling firms to
increase output quality in the form of new products or in improvements in
intangible aspects of existing products like convenience, timeliness, quality,
and variety. 1 There is substantial evidence from both the case literature
on individual firms and multi-firm econometric analyses supporting both these
points, which we review and discuss in the first half of this paper. This
emphasis on firm-level evidence stems in part from our own research focus but
also because firm-level analysis has significant measurement advantages for
examining intangible organizational investments and product and service
innovation associated with computers.
Moreover, as we argue in the latter half of the paper, these factors are
not well captured by traditional macroeconomic measurement approaches. As a
5
result, the economic contributions of computers are likely to be understated
in aggregate level analyses. Placing a precise number on this bias is
difficult, primarily because of issues about how private, firm-level returns
aggregate to the social, economy-wide benefits and assumptions required to
incorporate complementary organizational factors into a growth accounting
framework. However, our analysis suggests that the returns to computer
investment may be substantially higher than what is assumed in traditional
growth accounting exercises and the total capital stock (including intangible
assets) associated with the computerization of the economy may be understated
by a factor of ten.Taken together, these considerations suggest the bias is on
the same order of magnitude as the currently measured benefits of computers.
Thus, while the recent macroeconomic evidence about computers
contributions is encouraging, our views are more strongly influenced by the
micreonomic data. The micro data suggest that the surge in productivity that
we now see in the macro statistics has its roots in over a decade of computer-
enabled organizational investments. The recent productivity boom can in part
be explained as a return on this large, intangible and largely ignored form of
capital.
Case Examples
Companies using IT to change the way they conduct business often say
that their investment in IT complements changes in other aspects of the
organization. These complementarities have a number of implications for
understanding the value of computer investment. To be successful, firms
typically need to adopt computers as part of a “system” or “cluster” of
mutually reinforcing organizational changes (Milgrom and Roberts, 1990).
6
Changing incrementally, either by making computer investments without
organizational change, or only partially implementing some organizational
changes, can create significant productivity losses as any benefits of
computerization are more than outweighed by negative interactions with
existing organizational practices (Brynjolfsson, Renshaw and Van Alstyne,
1997). The need for "all or nothing" changes between complementary systems
was part of the logic behind the organizational reengineering wave of the
1990s and the slogan "Don't Automate, Obliterate" (Hammer, 1990). It may also
explain why many large scale IT projects fail (Kemerer and Sosa, 1991), while
successful firms earn significant rents.
Many of the past century's most successful and popular organizational
practices reflect the historically high cost of information processing. For
example, hierarchical organizational structures can reduce communications
costs because they minimize the number of communications links required to
connect multiple economic actors, as compared with more decentralized
structures (Malone, 1987; Radner, 1993). Similarly, producing simple,
standardized products is an efficient way to utilize inflexible, scale-
intensive manufacturing technology. However, as the cost of automated
information processing has fallen by over 99.9% since the 1960s, it is
unlikely that the work practices of the previous era will also the same ones
that best leverage the value of cheap information and flexible production. In
this spirit, Milgrom and Roberts (1990) construct a model in which firms'
transition from "mass production" to flexible, computer-enabled, "modern
manufacturing" is driven by exogenous changes in the price of IT. Similarly,
Bresnahan (1999), and Bresnahan, Brynjolfsson and Hitt (2000) show how changes
7
in IT costs and capabilities lead to a cluster of changes in work organization
and firm strategy that increases the demand for skilled labor.
In this section we will discuss case evidence on three aspects of how
firms have transformed themselves by combining IT with changes in work
practices, strategy, and products and services; they have transformed the
firm, supplier relations, and the customer relationship. These examples
provide qualitative insights into the nature of the changes, making it easier
to interpret the more quantitative econometric evidence that follows.
Transforming the Firm
The need to match organizational structure to technology capabilities
and the challenges of making the transition to an IT-intensive production
process is concisely illustrated by a case study of "MacroMed" (a pseudonym),
a large medical products manufacturer (Brynjolfsson, Renshaw and Van Alstyne,
1997). In a desire to provide greater product customization and variety,
MacroMed made a large investment in computer integrated manufacturing. These
investments also coincided with an enumerated list of other major changes
including: the elimination of piece rates, giving workers authority for
scheduling machines, decision rights, process and workflow innovation, more
frequent and richer interactions with customers and suppliers, increased
lateral communication and teamwork and other changes in skills, processes,
culture, and structure (see Table 1).
However, the new system initially fell well short of management
expectations for greater flexibility and responsiveness. Investigation
revealed that line workers still retained many elements of the now-obsolete
8
old work practices, not from any conscious effort to undermine the change
effort, but simply as an inherited pattern. For example, one earnest and well-
intentioned worker explained that "the key to productivity is to avoid
stopping the machine for product changeovers." While this heuristic was
valuable with the old equipment, it negated the flexibility of the new
machines and created large work-in-process inventories. Ironically, the new
equipment was sufficiently flexible that the workers were able to get it to
work much like the old machines! The strong complementarities within the old
cluster of work practices and within the new cluster greatly hindered the
transition from one to the other.
Eventually, management concluded that the best approach was to introduce
the new equipment in a "greenfield" site with a handpicked set of young
employees who were relatively unencumbered by knowledge of the old practices.
The resulting productivity improvements were significant enough that
management ordered all the factory windows painted black to prevent potential
competitors from seeing the new system in action. While other firms could
readily buy similar computer controlled equipment, they would still have to
make the much larger investments in organizational learning before fully
benefiting from them and the exact recipe for achieving these benefits was not
trivial to invent (see Brynjolfsson, Renshaw, & Van Alstyne, 1997 for
details). Similarly, large changes in work practices have been documented in
case studies of IT adoption in a variety of settings (e.g. Hunter, Bernhardt,
Hughes and Skuratowitz, 2000; Levy, Beamish, Murnane and Autor, 2000; Malone &
Rockart, 1992; Murnane, Levy and Autor, 1999; Orlikowski, 1992).
9
Changing Interactions with Suppliers
Due to problems coordinating with external suppliers, large firms often
produce many of their required inputs in-house. General Motors is the classic
example of a company whose success was facilitated by high levels of vertical
integration. However, technologies such as electronic data interchange (EDI),
internet-based procurement systems, and other interorganizational information
systems have significantly reduced the cost, time and other difficulties of
interacting with suppliers. For example, firms can place orders with suppliers
and receive confirmations electronically, eliminating paperwork and the delays
and errors associated with manual processing of purchase orders (Johnston and
Vitale, 1988). However, the even greater benefits can be realized when
interorganizational systems are combined with new methods of working with
suppliers.
An early successful interorganizational system is the Baxter ASAP
system, which lets hospitals electronically order supplies directly from
wholesalers (Vitale and Konsynski, 1988; Short and Venkatraman, 1992). The
system was originally designed to reduce the costs of data entry – a large
hospital could generate 50,000 purchase orders annually which had to be
written out by hand by Baxter's field sales representatives at an estimated
cost of $25-35 each. However, once Baxter computerized its ordering had data
available on levels of hospital stock, it took increasing responsibility for
the entire supply operation: designing stock room space, setting up computer-
based inventory systems, and providing automated inventory replenishment. The
combination of the technology and the new supply chain organization
substantially improved efficiency for both Baxter (no paper invoices,
10
predictable order flow) and the hospitals (elimination of stockroom management
tasks, lower inventories, and less chance of running out of items). Later
versions of the ASAP system let users order from other suppliers, creating an
electronic marketplace in hospital supplies.
ASAP was directly associated with costs savings on the order of $10 to
$15 million per year, which allowed them to rapidly recover the $30 million up
front investment and ~$3 million annual operating costs. However, management
at Baxter believed that even greater benefits were being realized through
incremental product sales at the 5,500 hospitals that had installed the ASAP
system, not to mention the possibility of a reduction of logistics costs borne
by the hospitals themselves, an expense which consumes as much as a 30% of a
hospital’s budget.
Computer-based supply chain integration has been especially
sophisticated in consumer packaged goods. Traditionally, manufacturers
promoted products such as soap and laundry detergent by offering discounts,
rebates, or even cash payments to retailers to stock and sell their products.
Because many consumer products have long shelf lives, retailers tended to buy
massive amounts during promotional periods, which increased volatility in
manufacturing schedules and distorted manufacturers view of their market. In
response, manufacturers sped up their packaging changes to discourage
stockpiling of products and developed internal audit departments to monitor
retailers' purchasing behavior for contractual violations (Clemons, 1993).
To eliminate these inefficiencies, Procter and Gamble (P&G) pioneered a
program called "efficient consumer response" (McKenney and Clark, 1995). In
this approach, each retailer's checkout scanner data goes directly to the
11
manufacturer; ordering, payments, and invoicing are fully automated through
electronic data interchange; products are continuously replenished on a daily
basis; and promotional efforts are replaced by an emphasis on "everyday low
pricing." Manufacturers also involved themselves more in inventory decisions
and moved toward "category management," where a lead manufacturer would take
responsibility for an entire retail category (say, laundry products)
determining stocking levels for their own and other manufacturers' products,
as well as complementary items.
These changes, in combination, greatly improved efficiency. Consumers
benefited from lower prices, and increased product variety, convenience, and
innovation. Without the direct computer-computer links to scanner data and
the electronic transfer of payments and invoices, they could not have attained
the levels of speed and accuracy needed to implement such a system.
Technological innovations related to the commercialization of the
Internet have dramatically decreased the cost of building electronic supply
chain links. Computer enabled procurement and on-line markets enable a
reduction in input costs through a combination of reduced procurement time and
more predictable deliveries, which reduces the need for buffer inventories and
reduces spoilage for perishable products, reduced price due to increasing
price transparency and the ease of price shopping, and reduced direct costs of
purchase order and invoice processing. These innovations are estimated to
lower the costs of purchased inputs by 10% to 40% depending on the industry
(Goldman Sachs, 1999).
Some of these savings clearly represent a redistribution of rents from
suppliers to buyers, with little effect on overall economic output. However,
12
many of the other changes represent direct improvements in productivity
through greater production efficiency and indirectly by enabling an increase
in output quality or variety without excessive cost. To respond to these
opportunities, firms are restructuring their supply arrangements and placing
greater reliance on outside contractors. Even General Motors, once the
exemplar of vertical integration, has reversed course and divested its large
internal suppliers. As one industry analyst recently stated, "What was once
the greatest source of strength at General Motors -– its strategy of making
parts in-house -– has become its greatest weakness" (Schnapp, 1998). To get
some sense of the magnitude of this change, the spinoff in 1999 of Delphi
Automotive Systems, only one of GM’s many internal supply divisions, created a
separate company that by itself has $28 Billion in sales.
Changing Customer Relationships The Internet has opened up a new range of possibilities for enriching
interactions with customers. Dell Computer has succeeded in attracting
customer orders and improving service by placing configuration, ordering, and
technical support capabilities on the web (Rangan and Bell, 1999). It coupled
this change with systems and work practice changes that emphasize just-in-time
inventory management, build-to-order production systems, and tight integration
between sales and production planning. Dell has implemented a consumer-driven
build-to-order business model, rather than using the traditional build-to-
stock model of selling computers through retail stores, which gives Dell as
much as a 10 percent advantage over its rivals in production cost. Some of
these savings represent the elimination of wholesale distribution and
retailing costs. Others reflect substantially lower levels of inventory
throughout the distribution channel. However, a subtle but important by-
product of these changes in production and distribution are that Dell can be
13
more responsive to customers. When Intel releases a new microprocessor, as it
does several times each year, Dell can sell it to customers within seven days
compared to 8 weeks or more for some less Internet-enabled competitors. This
is a non-trivial difference in an industry where adoption of new technology
and obsolescence of old technology is rapid, margins are thin, and many
component prices drop by 3-4% each month.
Other firms have also built closer relations with their customer via the
web and related technologies. For instance, web retailers like Amazon.com
provide personalized recommendation to visitors and allows them to customize
numerous aspects of their shopping experience. As described by Denise Caruso,
“Amazon’s on-line account maintenance system provides its customers with
secure access to everything about their account at any time. [S]uch
information flow to and from customers would paralyze most old-line
companies.” Merely providing Internet access to a traditional bookstore would
have had a relatively minimal impact without the cluster of other changes
implemented by firms like Amazon.
In increasingly ubiquitous example is using the web for handling basic
customer inquiries. For instance, UPS now handles a total of 700,000 package
tracking requests via the Internet every day. It costs UPS 10¢ per piece to
serve that information via the Web vs. $2 to provide it over the phone
(Seybold and Marshak 1998). Consumers benefit too. Because customers find it
easier to track packages over the web than via a phone call, UPS estimates
that 2/3 of the web users would not have bothered to check on their packages
if they did not have web access.
Large-Sample Empirical Evidence on IT, Organization and Productivity
The case study literature offers many examples of strong links between
IT and investments in complementary organizational practices. However, to
14
reveal general trends and to quantify the overall impact, we must examine
these effects across a wide range of firms and industries. In this section we
explore the results from large-sample statistical analyses. First, we examine
studies on the direct relationship between IT investment and business value.
We then consider studies that measured organizational factors and their
correlation with IT use, as well as the few initial studies that have linked
this relationship to productivity increases.
IT and Productivity
Much of the early research on the relationship between technology and
productivity used economy-level or sector-level data and found little evidence
of a relationship. For example, Roach (1987) found that while computer
investment per white-collar worker in the service sector rose several hundred
percent from 1977 to 1989, output per worker, as conventionally measured, did
not increase discernibly. In several papers, Morrison and Berndt examined
Bureau of Economic Analysis data for manufacturing industries at the two-digit
SIC level and found that the gross marginal product of "high tech capital"
(including computers) was less than its cost and that in many industries these
supposedly labor-saving investments were associated with an increase in labor
demand (Berndt and Morrison, 1995; Morrison, 1996). Robert Solow (1987)
summarized this kind of pattern in his well-known remark: "[Y]ou can see the
computer age everywhere except in the productivity statistics."
However, by the early 1990s, analyses at the firm-level were beginning
to find evidence that computers had a substantial effect on firms'
productivity levels. Using data from over 300 large firms over the period
15
1988-1992, Brynjolfsson and Hitt (1995, 1996) and Lichtenberg (1995) estimated
production functions that use the firm's output (or value-added) as the
dependent variable and use ordinary capital, IT capital, ordinary labor, IT
labor, and a variety of dummy variables for time, industry, and firm.2 The
pattern of these relationships is summarized in Figure 1, which compares firm-
level IT investment with multifactor productivity (excluding computers) for
the firms in the Brynjolfsson and Hitt (1995) dataset. There is a clear
positive relationship, but also a great deal of individual variation in firms’
success with IT.
Estimates of the average annual contribution of computer capital to
total output generally exceed $0.60 per dollar of capital stock, depending on
the analysis and specification (Brynjolfsson and Hitt, 1995, 1996;
Lichtenberg, 1995; Dewan and Min, 1997). These estimates are statistically
different from zero, and in most cases significantly exceed the expected rate
of return of about $.42 (the Jorgensonian rental price of computers – see
Brynjolfsson and Hitt, 2000). This suggests either abnormally high returns to
investors or the existence of unmeasured costs or barriers to investment.
Similarly, most estimates of the contribution of information systems labor to
output exceed $1 (and are as high as $6) for every $1 of labor costs.
Several researchers have also examined the returns to IT using data on
the use of various technologies rather than the size of the investment.
Greenan and Mairesse (1996) matched data on French firms and workers to
measure the relationship between a firm's productivity and the fraction of its
employees who report using a personal computer at work. Their estimates of
computers' contribution to output are consistent with earlier estimates of the
16
computer’s output elasticity.
Other micro-level studies have focused on the use of computerized
manufacturing technologies. Kelley (1994) found that the most productive
metal-working plants use computer-controlled machinery. Black and Lynch (1996)
found that plants where a larger percentage of employees use computers are
more productive in a sample containing multiple industries. Computerization
has also been found to increase productivity in government activities both at
the process level, such as package sorting at the post office or toll
collection (Muhkopadhyay, Rajiv and Srinivasan, 1997) and at higher levels of
aggregation (Lehr and Lichtenberg, 1998).
Taken collectively, these studies suggest that IT is associated with
substantial increases in output. Questions remain about the mechanisms and
direction of causality in these studies. Perhaps instead of IT causing greater
output, “good firms” or average firms with unexpectedly high sales
disproportionately spend their windfall on computers. For example, while
Doms, Dunne and Troske (1997) found that plants using more advanced
manufacturing technologies had higher productivity and wages, they also found
that this was commonly the case even before the technologies were introduced.
Efforts to disentangle causality have been limited by the lack of good
instrumental variables for factor investment at the firm-level. However,
attempts to correct for this bias using available instrumental variables
typically increase the estimated coefficients on IT even further (for example,
Brynjolfsson and Hitt, 1996; 2000). Thus, it appears that reverse causality
is not driving the results: with firms with an unexpected increase in free
17
cash flow invest in other factors, such as labor, before they change their
spending on IT. Nonetheless, there appears to be a fair amount of causality
in both directions – certain organizational characteristics make IT adoption
more likely and vice versa.
The firm-level productivity studies can shed some light on the
relationship between IT and organizational restructuring. For example,
productivity studies consistently find that the output elasticities of
computers exceed their (measured) input shares. One explanation for this
finding is that the output elasticities for IT are about right, but the
productivity studies are underestimating the input quantities because they
neglect the role of unmeasured complementary investments. Dividing the output
of the whole set of complements by only the factor share of IT will imply
disproportionately high rates of return for IT.3
A variety of other evidence suggests that hidden assets play an
important role in the relationship between IT and productivity. Brynjolfsson
and Hitt (1995) estimated a firm fixed effects productivity model. This method
can be interpreted as dividing firm-level IT benefits into two parts; one part
is due to variation in firms' IT investments over time, the other to firm
characteristics. Brynjolfsson and Hitt found that in the firm fixed effects
model, the coefficient on IT was about 50 percent lower, compared to the
results of an ordinary least squares regression, while the coefficients on the
other factors, capital and labor, changed only slightly. This change suggests
that unmeasured and slowly changing organizational practices (the "fixed
effect") significantly affect the returns to IT investment.
Another indirect implication from the productivity studies comes from
18
evidence that effects of IT are substantially larger when measured over longer
time periods. Brynjolfsson and Hitt (2000) examined the effects of IT on
productivity growth rather than productivity levels, which had been the
emphasis in most previous work, using data that included more than 600 firms
over the period 1987 to 1994. When one-year differences in IT are compared to
one-year differences in firm productivity, the measured benefits of computers
are approximately equal to their measured costs. However, the measured
benefits rise by a factor of two to eight as longer time periods are
considered, depending on the econometric specification used. One
interpretation of these results is that short-term returns represent the
direct effects of IT investment, while the longer-term returns represent the
effects of IT when combined with related investments in organizational change.
Further analysis, based on earlier results by Schankermann (1981) in the R&D
context, suggested that these omitted factors were not simply IT investments
that were erroneously misclassified as capital or labor. Instead, to be
consistent with the econometric results, the omitted factors had to have been
accumulated in ways that would not appear on the current balance sheet. Firm-
specific human capital and "organizational capital" are two examples of
omitted inputs would fit this description.4
A final perspective on the value of these organizational complements to
IT can be found using financial market data, drawing on the literature on
Tobin's q. This approach measures the rate of return of an asset indirectly,
based on comparing the stock market value of the firm to the replacement value
of the various capital assets it owns. Typically, Tobin's q has been employed
to measure the relative value of observable assets such as R&D or physical
19
plant. However, as suggested by Hall (1999a, 1999b), Tobin's q can also be
viewed as providing a measure of the total quantity of capital, including the
value of "technology, organization, business practices, and other produced
elements of successful modern corporation." Using an approach along these
lines, Brynjolfsson and Yang (1997) found that while one dollar of ordinary
capital is valued at approximately one dollar by the financial markets, one
dollar of IT capital appears to be correlated with between $5 and $20 of
additional stock market value for Fortune 1000 firms using data spanning 1987
to 1994. Since these results largely apply to large, established firms rather
than new high-tech startups, and since they predate most of the massive
increase in market valuations for technology stocks in the late 1990s, these
results are not likely to be sensitive to the possibility of a recent “high-
tech stock bubble.”
A more likely explanation for these results is that IT capital is
disproportionately associated with other intangible assets like the costs of
developing new software, populating a database, implementing a new business
process, acquiring a more highly skilled staff, or undergoing a major
organizational transformation, all of which go uncounted on a firm’s balance
sheet. In this interpretation, for every dollar of IT capital, the typical
firm has also accumulated between $4 and $19 in additional intangible assets.
A related explanation is that firms must incur substantial "adjustment costs"
before IT is effective. These adjustment costs drive a wedge between the
value of a computer resting on the loading dock and one that is fully
integrated into the organization.
The evidence from the productivity and the Tobin's q analyses provides
20
some insights into the properties of IT-related intangible assets, even if we
cannot measure these assets directly. Such assets are large, potentially
several multiples of the measured IT investment. They are unmeasured in the
sense that they do not appear as a capital asset or as other components of
firm input, although they do appear to be unique characteristics of particular
firms as opposed to industry effects. Finally, they have more effect in the
long term than the short term, suggesting that multiple years of adaptation
and investment is required before their influence is maximized.
Direct Measurement of the Interrelationship between IT and Organization
Some studies have attempted to measure organizational complements
directly, and to show either that they are correlated with IT investment, or
that firms that combine complementary factors have better economic
performance. Finding correlations between IT and organizational change, or
between these factors and measures of economic performance, is not sufficient
to prove that these practices are complements, unless a full structural model
specifies the production relationships and demand drivers for each factor.
Athey and Stern (1997) discuss issues in the empirical assessment of
complementarity relationships. However, after empirically evaluating possible
alternative explanations and combining correlations with performance analyses,
complementarities are often the most plausible explanation for observed
relationships between IT, organizational factors, and economic performance.
The first set of studies in this area focuses on correlations between
use of IT and extent of organizational change. An important finding is that IT
investment is greater in organizations that are decentralized and have a
21
greater level or demand for human capital. For example, Breshahan,
Brynjolfsson and Hitt (2000) surveyed approximately 400 large firms to obtain
information on aspects of organizational structure like allocation of decision
rights, workforce composition, and investments in human capital. They found
that greater levels of IT are associated with increased delegation of
authority to individuals and teams, greater levels of skill and education in
the workforce, and greater emphasis on pre-employment screening for education
and training. In addition, they find that these work practices are correlated
with each other, suggesting that they are part of a complementary work
system.5
Research on jobs within specific industries has begun to explore the
mechanisms within organizations that create these complementarities. Drawing
on a case study on the automobile repair industry, Levy, Beamish, Murnane and
Autor (2000) argue that computers are most likely to substitute for jobs that
rely on rule-based decision making while complementing non-procedural
cognitive tasks. In banking, researchers have found that many of the skill,
wage and other organizational effects of computers depend on the extent to
which firms couple computer investment with organizational redesign and other
managerial decisions (Hunter, Bernhardt, Hughes and Skuratowitz, 2000;
Murnane, Levy and Autor, 1999). Researchers focusing at the establishment
level have also found complementarities between existing technology
infrastructure and firm work practices to be a key determinant of the firm's
ability to incorporate new technologies (Bresnahan and Greenstein, 1997); this
also suggests a pattern of mutual causation between computer investment and
organization.
22
A variety of industry-level studies also show a strong connection
between investment in high technology equipment and the demand for skilled,
educated workers (Berndt, Morrison and Rosenblum, 1992; Berman, Bound and
Griliches, 1994; Autor, Katz and Krueger, 1998). Again, these findings are
consistent with the idea that increasing use of computers is associated with a
greater demand for human capital.
Several researchers have also considered the effect of IT on macro-
organizational structures. They have typically found that greater levels of
investment in IT are associated with smaller firms and less vertical
integration. Brynjolfsson, Malone, Gurbaxani and Kambil (1994) found that
increases in the level of IT capital in an economic sector were associated
with a decline in average firm size in that sector, consistent with IT leading
to a reduction in vertical integration. Hitt (1999), examining the
relationship between a firm's IT capital stock and direct measures of its
vertical integration, arrived at similar conclusions. These results
corroborate earlier case analyses and theoretical arguments that suggested
that IT would be associated with a decrease in vertical integration because it
lowers the costs of coordinating externally with suppliers (Malone, Yates and
Benjamin, 1987; Gurbaxani and Whang, 1991; Clemons and Row, 1992).
One difficulty in interpreting the literature on correlations between IT
and organizational change is that some managers may be predisposed to try
every new idea and some managers may be averse to trying anything new at all.
In such a world, IT and a "modern" work organization might be correlated in
firms because of the temperament of management, not because they are economic
complements. To rule out this sort of spurious correlation, it is useful to
23
bring measures of productivity and economic performance into the analysis. If
combining IT and organizational restructuring is economically justified, then
firms that adopt these practices as a system should outperform those that fail
to combine IT investment with appropriate organizational structures.
In fact, firms that adopt decentralized organizational structures and
work structures do appear to have a higher contribution of IT to productivity
(Bresnahan, Brynjolfsson and Hitt, 2000). For example, for firms that are
more decentralized than the median firm (as measured by individual
organizational practices and by an index of such practices), have, on average,
a 13 percent greater IT elasticity and a 10 percent greater investment in IT
than the median firm. Firms that are in the top half of both IT investment and
decentralization are on average 5 percent more productive than firms that
above average only in IT investment or only the decentralized organization.
Similar results also appear when economic performance is measured as
stock market valuation. Firms in the top third of decentralization have a 6
percent higher market value after controlling for all other measured assets;
this is consistent with the theory that organizational decentralization
behaves like an intangible asset. Moreover, the stock market value of a dollar
of IT capital is between $2 and $5 greater in decentralized firms than in
centralized firms (per standard deviation of the decentralization measure),
and this relationship is particularly striking for firms that are
simultaneously extensive users of IT and highly decentralized as shown in
Figure 2 (Brynjolfsson, Hitt and Yang, 2000).
The weight of the firm-level evidence shows that a combination of
investment in technology and changes in organizations and work practices
24
facilitated by these technologies contributes to firms’ productivity growth
and market value. However, much work remains to be done in categorizing and
measuring the relevant changes in organizations and work practices, and
relating them to IT and productivity.
The Divergence of Firm-Level and Aggregate Studies on IT and Productivity
While the evidence indicates that IT has created substantial value for
firms that have invested in it, it has been a challenge to link these benefits
to macroeconomic performance. A major reason for the gap in interpretation is
that traditional growth accounting techniques focus on the (relatively)
observable aspects of output, like price and quantity, while neglecting the
intangible benefits of improved quality, new products, customer service and
speed. Similarly, traditional techniques focus on the relatively observable
aspects of investment, such as the price and quantity of computer hardware in
the economy, and neglect the much larger intangible investments in developing
complementary new products, services, markets, business processes, and worker
skills. Paradoxically, while computers have vastly improved the ability to
collect and analyze data on almost any aspect of the economy, the current
computer-enabled economy has become increasingly difficult to measure using
conventional methods. Nonetheless, standard growth accounting techniques
provide a useful benchmark for the contribution of IT to economic growth.
Studies of the contribution of IT concluded that technical progress in
computers contributed roughly 0.3 percentage points per year to real output
growth when data from the 1970s and 1980s were used (Jorgenson and Stiroh,
25
1995; Oliner and Sichel, 1994; Brynjolfsson, 1996).
Much of the estimated growth contribution comes directly from the large
quality-adjusted price declines in the computer producing industries. The
nominal value of purchases of IT hardware in the United States in 1997 was
about 1.4 percent of GDP. Since the quality-adjusted prices of computers
decline by about 25 percent per year, simply spending the same nominal share
of GDP as in previous years represents an annual productivity increase for the
real GDP of 0.3 percentage points (that is, 1.4 x .25 = .35). A related
approach is to look at the effect of IT on the GDP deflator. Reductions in
inflation, for a given amount of growth in output, imply proportionately
higher real growth and, when divided by a measure of inputs, for higher
productivity growth as well. Gordon (1998, p.4) calculates that "computer
hardware is currently contributing to a reduction of U.S. inflation at an
annual rate of almost 0.5% per year, and this number would climb toward one
percent per year if a broader definition of IT, including telecommunications
equipment, were used."
More recent growth-accounting analyses by the same authors have linked
the recent surge in measured productivity in the U.S. to increased investments
in IT. Using similar methods as in their earlier studies, Oliner and Sichel
(this issue) and Jorgenson and Stiroh (1999) find that the annual contribution
of computers to output growth in the second half of the 1990s is closer to 1.0
or 1.1 percentage points per year. Gordon (this issue) makes a similar
estimate. This is a large contribution for any single technology, although
researchers have raised concerns that computers are primarily an intermediate
input and that the productivity gains disproportionately visible in computer
26
producing industries as opposed to computer using industries. For instance,
Gordon notes that after he makes adjustments for the business cycle, capital
deepening and other effects, there has been virtually no change in the rate of
productivity growth outside of the durable goods sector. Jorgenson and Stiroh
ascribe a larger contribution to computer-using industries, but still not as
great as in the computer-producing industries.
Should we be disappointed by the productivity performance of the
downstream firms?
Not necessarily. Two points are worth bearing in mind when comparing
upstream and downstream sectors. First, the allocation of productivity
depends on the quality-adjusted transfer prices used. If a high deflator is
applied, the upstream sectors get credited with more output and productivity
in the national accounts, but the downstream firms get charged with using more
inputs and thus have less productivity. Conversely, a low deflator allocates
more of the gains to the downstream sector. In both cases, the increases in
the total productivity of the economy are, by definition, identical. Since it
is difficult to compute accurate deflators for complex, rapidly changing
intermediate goods like computers, one must be careful in interpreting the
allocation of productivity across producers and users.6
The second point is more semantic. Arguably, downstream sectors are
delivering on the IT revolution by simply maintaining levels of measured total
factor productivity growth in the presence of dramatic changes in the costs,
nature and mix of intermediate computer goods. This reflects a success in
costlessly converting technological innovations into real output that benefits
end consumers. If “mutual insurance” maintains a constant nominal IT budget
27
in the face of 50% IT price declines over two years, it is treated in the
national accounts as using 100% more real IT input for production. A
commensurate increase in real output is required merely to maintain the same
measured productivity level as before. This is not necessarily automatic
since it requires a significant change in the input mix and organization of
production. In the presence of adjustment costs and imperfect output
measures, one might reasonably have expected measured productivity to
initially decline in downstream sectors as they absorb a rapidly changing set
of inputs and introduce new products and services.
Regardless of how the productivity benefits are allocated, these studies
show that a substantial part of the upturn in measured productivity of the
economy as a whole can be linked to increased real investments in computer
hardware and declines in their quality-adjusted prices. However, there are
several key assumptions implicit in economy- or industry-wide growth
accounting approaches which can have a substantial influence on their results,
especially if one seeks to know whether investment in computers are increasing
productivity as much as alternate possible investments. The standard growth
accounting approach begins by assuming that all inputs earn “normal” rates of
return. Unexpected windfalls, whether the discovery of a single new oil
field, or the invention of a new process which makes oil fields obsolete, show
up not in the growth contribution of inputs but as changes in the multifactor
productivity residual. By construction, an input can contribute more to
output in these analyses only by growing rapidly, not by having an unusually
high net rate of return.
Changes in multifactor productivity growth, in turn, depend on accurate
28
measures of final output. However, nominal output is affected by whether firm
expenditures are expensed, and therefore deducted from value-added, or
capitalized and treated as investment. As emphasized throughout this paper,
IT is only a small fraction of a much larger complementary system of tangible
and intangible assets. However, current statistics typically treat the
accumulation of intangible capital assets, such as new business processes, new
production systems and new skills, as expenses rather than as investments.
This leads to a lower level of measured output in periods of net capital
accumulation. Second, current output statistics disproportionately miss many
of the gains that IT has brought to consumers such as variety, speed, and
convenience. We will consider these issues in turn.
The magnitude of investment in intangible assets associated with
computerization may be large. Analyses of 800 large firms by Brynjolfsson and
Yang (1997) suggest that the ratio of intangible assets to IT assets may be 10
to 1. Thus, the $167 billion in computer capital recorded in the U.S. national
accounts in 1996 may have actually been only the tip of an iceberg of $1.67
trillion of IT-related complementary assets in the United States.
Examination of individual IT projects indicates that the 10:1 ratio may
even be an underestimate in many cases. For example, a survey of enterprise
resource planning projects found that the average spending on computer
hardware accounted for less than 4 percent of the typical start-up cost of
$20.5 million, while software licenses and development were another 16 percent
of total costs (Gormely et al., 1998). The remaining costs included hiring
outside and internal consultants to help design new business processes and to
train workers in the use of the system. The time of existing employees,
29
including top managers, that went into the overall implementation were not
included, although they too are typically quite substantial.
The upfront costs were almost all expensed by the companies undertaking
the implementation projects. However, insofar as the managers who made these
expenditures expected them to pay for themselves only over several years, the
non-recurring costs are properly thought of as investments, not expenses, when
considering the impact on economic growth. In essence, the managers were
adding to the nation’s capital stock not only of easily visible computers, but
also of less visible business processes and worker skills.
How might these measurement problems affect economic growth and
productivity calculations? In a steady state, it makes little difference,
because the amount of new organizational investment in any given year is
offset by the "depreciation" of organizational investments in previous years.
The net change in capital stock is zero. Thus, in a steady state, classifying
organizational investments as expenses does not bias overall output growth as
long as it is done consistently from year to year. However, the economy has
hardly been in a steady state with respect to computers and their complements.
Instead, the U.S. economy has been rapidly adding to its stock of both types
of capital. To the extent that this net capital accumulation has not been
counted as part of output, output and output growth have been underestimated.
The software industry offers a useful example of the impact of
classifying a category of spending as expense or investment. Historically,
efforts on software development have been treated as expenses, but recently
the government has begun recognizing that software is an intangible capital
asset. Software investment by U.S. businesses and governments grew from $10
30
billion in 1979 to $159 billion in 1998 (Parket and Grimm, 2000). Properly
accounting for this investment has added 0.15 to 0.20 percentage points to the
average annual growth rate of real GDP in the 1990s. While capitalizing
software is an important improvement in our national accounts, software is far
from the only, or even most important, complement to computers.
If the wide array of intangible capital costs associated with computers
were treated as investments rather than expenses, the results would be
striking. According to some preliminary estimates from Yang (2000), building
on estimates of the intangible asset stock derived from stock market
valuations of computers, the true growth rate of U.S. GDP, after accounting
for the intangible complements to IT hardware, has been increasingly
underestimated by an average of over 1 percent per year since the early 1980s,
with the underestimate getting worse over time as net IT investment has grown.
Productivity growth has been underestimated by a similar amount. This
reflects the large net increase in intangible assets of the U.S. economy
associated with the computerization that was discussed earlier. Over time, the
economy earns returns on past investment, converting it back into consumption.
This has the effect of raising GDP growth as conventionally measured by a
commensurate amount even if the "true" GDP growth remains unchanged.
While the quantity of intangible assets associated with IT is difficult
to estimate precisely, the central lesson is that these complementary changes
are significant and cannot be ignored in any realistic attempt to estimate the
overall economic contributions of IT.
The productivity gains from investments in new IT are underestimated in
a second major way: failure to account fully for quality change in consumable
31
outputs. It is typically much easier to count the number of units produced
than to assess intrinsic quality -- especially if the desired quality may vary
across customers. A significant fraction of value of quality improvements due
to investments in IT -- like greater timeliness, customization, and customer
service -- is not directly reflected as increased industry sales, and thus is
implicitly treated as nonexistent in official economic statistics.
These issues have always been a concern in the estimation of the true
rate of inflation and the real output of the U.S. economy (Boskin et. al.,
1997). If output mismeasurement for computers were similar to output
mismeasurement for previous technologies, estimates of long term productivity
trends would be unaffected (Baily and Gordon, 1988). However, there is
evidence that in several specific ways, computers are associated with an
increasing degree of mismeasurement that is likely to lead to increasing
underestimates of productivity and economic growth.
The production of intangible outputs is an important consideration for
IT investments whether in the form of new products or improvements in existing
products. Based on a series of surveys of information services managers
conducted in 1993, 1995 and 1996, Brynjolfsson and Hitt (1997) found that
customer service and sometimes other aspects of intangible output
(specifically quality, convenience, and timeliness) ranked higher than cost
savings as the motivation for investments in information services. Brooke
(1992) found that IT was also associated with increases in product variety.
Indeed, government data show many inexplicable changes in productivity,
especially in the sectors where output is poorly measured and where changes in
quality may be especially important (Griliches, 1994). Moreover, simply
32
removing anomalous industries from the aggregate productivity growth
calculation can change the estimate of U.S. productivity growth by 0.5% or
more (Corrado and Slifman, 1999). The problems with measuring quality change
and true output growth are illustrated by selected industry-level productivity
growth data over different time periods, shown in Table 1. According to
official government statistics, a bank today is only about 80 percent as
productive as a bank in 1977; a health care facility is only 70 percent as
productive and a lawyer only 65 percent as productive as they were 1977.
These statistics seem out of touch with reality. In 1977, all banking was
conducted the teller windows; today, customers can access a network of 139,000
ATMs 24-hours a day, 7 days a week (Osterberg and Sterk, 1997), as well as a
vastly expanded array of banking services via the Internet. The more than
tripling of cash availability via ATMs required an incremental investment on
the order of $10Bn compared with over $70Bn invested in physical bank
branches. Computer-controlled medical equipment has facilitated more
successful and less invasive medical treatment. Many procedures that
previously required extensive hospital stays can now be performed on an
outpatient basis; instead of surgical procedures, many medical tests now use
non-invasive imaging devices such as x-rays, MRI, or CT scanners. Information
technology has supported the research and analysis that has led to these
advances plus a wide array of improvements in medication and outpatient
therapies. A lawyer today can access much wider range of information through
on-line databases and manage many more legal documents. In addition, some
basic legal services, such as drafting a simple will, can now be performed
without a lawyer using inexpensive software packages such as Willmaker.
33
One of the most important types of unmeasured benefits arises from new
goods. Sales of new goods are measured in the GDP statistics as part of
nominal output, although this does not capture the new consumer surplus
generated by such goods, which causes them to be preferred over old goods.
Moreover, the Bureau of Labor Statistics has often failed to incorporate new
goods into price indices until many years after their introduction; for
example, it did not incorporate the VCR into the consumer price index until
1987, about a decade after they began selling in volume. This leads the price
index to miss the rapid decline in price that many new goods experience early
in their product cycle. As a result, the inflation statistics overstate the
true rise in the cost of living, and when the nominal GDP figures are adjusted
using that price index, the real rate of output growth is understated (Boskin
et al., 1997). The problem extends beyond new high tech products, like
personal digital assistants and handheld web browsers. Computers enable more
new goods to be developed, produced, and managed in all industries. For
instance, the number of new products introduced in supermarkets has grown from
1,281 in 1964, to 1831 in 1975, and then to 16,790 in 1992 (Nakamura, 1997);
the data management requirements to handle so many products would have
overwhelmed the computerless supermarket of earlier decades. Consumers have
voted with their pocketbooks for the stores with greater product variety.
This collection of results suggests that IT may be associated with
increases in the intangible component of output, including variety, customer
convenience, and service. Because it appears that the amount of unmeasured
output value is increasing with computerization, this measurement problem not
only creates an underestimate of output level, but also errors in measurement
34
of output and productivity growth when compared with earlier time periods
which had a smaller bias due to intangible outputs.
Just as the Bureau of Economic Analysis successfully reclassified many
software expenses as investments and is making quality adjustments, perhaps we
will also find ways to measure the investment component of spending on
intangible organizational capital and to make appropriate adjustments for the
value of all gains attributable to improved quality, variety, convenience and
service. Unfortunately, addressing these problems can be difficult even for
single firms and products, and the complexity and number of judgments required
to address them at the macroeconomic level is extremely high. Moreover,
because of the increasing service component of all industries (even basic
manufacturing), which entails product and service innovation and intangible
investments, these problem cannot be easily solved by focusing on a limited
number of “hard to measure” industries – they are pervasive throughout the
economy.
Meanwhile, however, firm-level studies can overcome some of the
difficulties in assessing the productivity gains from IT. For example, it is
considerably easier at the firm-level to make reasonable estimates of the
investments in intangible organizational capital and to observe changes in
organizations, while it is harder to formulate useful rules for measuring such
investment at the macroeconomic level.
Firm-level studies may be less subject to aggregation error when firms
make different levels of investments in computers and thus could have
different capabilities for producing higher value products (Brynjolfsson and
Hitt, 1996, 2000). Suppose a firm invests in IT to improve product quality
35
and consumers recognize and value these benefits. If other firms do not make
similar investments, any difference in quality will lead to differences in the
equilibrium product prices that each firm can charge. When an analysis is
conducted across firms, variation in quality will contribute to differences in
output and productivity and thus, will be measured as increases in the output
elasticity of computers. However, when firms with high quality products and
firms with low quality products are combined together in industry data (and
subjected to the same quality-adjusted deflator for the industry), both the IT
investment and the difference in revenue will average out, and a lower
correlation between IT and (measured) output will be detected. Interestingly,
Siegel (1997) found that the measured effect of computers on productivity was
substantially increased when he used a structural equation framework to
directly model the errors in production input measurement in industry-level
data.
However, firm-level data can be an insecure way to capture the social
gains from improved product quality. For example, not all price differences
reflect differences in product or service quality. When price differences are
due to differences in market power that are not related to consumer
preferences, then firm-level data will lead to inaccurate estimates of the
productivity effects of IT. Similarly, increases in quality or variety (e.g.,
new product introductions in supermarkets) can be a by-product of anti-
competitive product differentiation strategies, which may or may not increase
total welfare. Moreover, firm-level data will not fully capture the value of
quality improvements or other intangible benefits if these benefits are
ubiquitous across an industry, because then there will not be any inter-firm
36
variation in quality and prices. Instead, competition will pass the gains on
to consumers. In this case, firm-level data will also understate the
contribution of IT investment to social welfare.
Conclusion
Concerns about an IT “productivity paradox” were raised in the late
1980s. Over a decade of research since then has substantially improved our
understanding of the relationship between IT and economic performance. The
firm level studies in particular suggest that, rather than being paradoxically
unproductive, computers have had an impact on economic growth that is
disproportionately large compared to their share of capital stock or
investment, and that this impact is likely to grow further in coming years.
In particular, both case studies and econometric work point to
organizational complements such as new business processes, new skills and new
organizational and industry structures as a major driver of the contribution
of IT. These complementary investments, and the resulting assets, may be as
much as an order of magnitude larger than the investments in the computer
technology itself. However, they go largely uncounted in our national
accounts, suggesting that computers have made a much larger real contribution
to the economy than previously believed.
The use of firm-level data has cast a brighter light on the black box of
production in the increasingly IT-based economy. The outcome has been a
better understanding of the key inputs, including complementary organizational
assets, as well as the key outputs including the growing roles of new
37
products, new services, quality, variety, timeliness and convenience.
Measuring the intangible components of complementary systems will never be
easy. But if researchers and business managers recognize the importance of the
intangible costs and benefits of computers and undertake to evaluate them, a
more precise assessment of these assets needn’t be beyond computation.
38
Acknowledgements
Portions of this manuscript are to appear in MIS Review and in an edited
volume, The Puzzling Relations Between Computer and the Economy, Nathalie
Greenan, Yannick Lhorty and Jacques Mairesse, eds., MIT Press, 2001. The authors thank David Autor, Brad DeLong, Robert Gordon, Shane
Greenstein, Dale Jorgenson, Alan Krueger, Dan Sichel, Robert Solow, and Kevin
Stiroh and Timothy Taylor for valuable comments on (portions of) earlier
drafts. This work funded in part by NSF Grant IIS-9733877.
39
References
Athey, S.; and S. Stern (1997), "An Empirical Framework for Testing
Theories about Complementarities in Organizational Design," Mimeo, MIT.
Attewell, P. and J. Rule (1984), "Computing and Organizations: What We
Know and What We Don't Know," Communications of the ACM 27(12): 1184-1192.
Autor, D., L. F. Katz and A. B. Krueger. (1998) “Computing Inequality:
Have Computers Changed the Labor Market?” Quarterly Journal of Economics.
November.
Baily, M. N. and R. J. Gordon (1988). The Productivity Slowdown,
Measurement Issues, and the Explosion of Computer Power. in Brookings Papers
on Economic Activity. W. C. Brainard and G. L. Perry. Washington, DC, The
Brookings Institution: 347-431.
Berman, E.; J. Bound; and Z. Griliches (1994), "Changes in the Demand
for Skilled Labor within U.S. Manufacturing Industries," Quarterly Journal of
Economics 109 (May): 367-398.
Berndt, E. R. and C. J. Morrison (1995), "High-tech Capital Formation
and Economic Performance in U.S. Manufacturing Industries: An Exploratory
Analysis," Journal of Econometrics 65: 9-43.
Berndt, E. R., C. J. Morrison and L. S. Rosenblum (1992), High-Tech
Capital, Economic Performance and Labor Composition in U.S. Manufacturing
Industries: An Exploratory Analysis. MIT Working Paper 3414EFA.
Black, S.E. and L.M. Lynch (1996), "How to Compete: The Impact of
Workplace Practices and IT on Productivity," Harvard University, Cambridge, MA
and US Department of Labor, Washington, D.C. September.
Boskin, Michael J.; Dulberger, Ellen R.; Gordon, Robert J.; Griliches,
40
Zvi; and Dale Jorgenson(1997). "The CPI Commission: Findings and
Recommendations." American Economic Review 87(2): 78-83.
Bresnahan, T., Brynjolfsson, E. and L. Hitt (2000) IT, Workplace
Organization and the Demand for Skilled Labor: A Firm-level Analysis, Mimeo,
MIT, Stanford, and Wharton.
Bresnahan, T. F. and M. Trajtenberg (1995), "General Purpose
Technologies: 'Engines of Growth'?" Journal of Econometrics 65: 83-108.
Breshahan, T.F. and S. Greenstein (1997), “Technical Progress and Co-
Invention in Computing and in the Use of Computers.” Brookings Papers on
Economic Activity: Microeconomics (January): 1-78.
Bresnahan, T.F. (1999), “Computerization and Wage Dispersion: An
Analytic Reinterpretation,” Economic Journal..
Brooke, G. M. (1992), "The Economics of Information Technology:
Explaining the Productivity Paradox," MIT Sloan School of Management Center
for Information Systems Research Working Paper No. 238(April).
Brynjolfsson, E. (1993). "The Productivity Paradox of Information
Technology," Communications of the ACM 35(12): 66-77.
Brynjolfsson, E. (1996), "The Contribution of Information Technology to
Consumer Welfare," Information Systems Research 7(3): 281-300.
Brynjolfsson, E., T. Malone, V. Gurbaxani, and A. Kambil (1994), “Does
Information Technology Lead to Smaller Firms?” Management Science 40(12):
1628-1644.Brynjolfsson, E. and L. Hitt (1995), "Information Technology as a
Factor of Production: The Role of Differences Among Firms," Economics of
Innovation and New Technology 3(4): 183-200.
Brynjolfsson, E. and L. Hitt (1996), "Paradox Lost? Firm-level Evidence
41
on the Returns to Information Systems Spending," Management Science 42(4):
541-558.
Brynjolfsson, E. and Hitt, L. (1997) "Breaking Boundaries,"
Informationweek (September 22): 54-61.
Brynjolfsson, E. and L. Hitt (2000), "Computing Productivity: Are
Computers Pulling Their Weight?" Mimeo, MIT and Wharton.
Brynjolfsson, E. and Yang, S. (1996), "Information Technology and
Productivity: A Review of the Literature," in Zelkowitz, M., ed., Advances in
Computers, Vol. 43.
Brynjolfsson, E. and Yang, S. (1997), "The Intangible Benefits and Costs
of Computer Investments: Evidence from Financial Markets," in Proceedings of
the International Conference on Information Systems, Atlanta, GA. Revised
(2000).
Brynjolfsson, E., A. Renshaw and M. V. Alstyne (1997), "The Matrix of
Change," Sloan Management Review, Winter.
Brynjolfsson, E., Hitt, L. and S.K. Yang (2000), "Intangible Assets:
How the Interaction of Information Systems and Organizational Structure
Affects Stock Market Valuations," mimeo, MIT and Wharton. A previous version
appeared in the Proceedings of the International Conference on Information
Systems, Helsinki, Finland (1998).
Corrado, C. and L. Slifman (1999), “Decomposition of Productivity and
Unit Costs,” American Economic Review 89(2): 328-332.
Clemons, Eric K; Thatcher, Matt E.; Row, Michael C. (1995),
Identifying sources of reengineering failures: A study of the behavioral
factors contributing to reengineering risks, Journal of Management Information
42
Systems 12(2): 9-36.
Clemons, Eric K. (1993), Reengineering the Sales Function: Reengineering
Internal Operations, Teaching Case, The Wharton School.
David, P. A. (1990), "The Dynamo and the Computer: A Historical
Perspective on the Modern Productivity Paradox," American Economic Review
Papers and Proceedings l (2): 355-361.
Dewan, S. and Min, C.K. (1997), "Substitution of Information Technology
for Other Factors of Production: A Firm-level Analysis," Management Science
43(12): 1660-1675.
Doms, Mark, Dunne, Timothy, Troske, Kenneth R "Workers, Wages, and
Technology," The Quarterly Journal of Economics 112(1): 253-290.
Galbraith, J. (1977), Organizational Design, Reading, MA: Addison-
Wesley.
Gordon, Robert J. (1998), "Monetary Policy in the Age of Information
Technology: Computers and the Solow Paradox," Working Paper, Northwestern
University.
Goldman Sachs (1999), B2B: To Be or Not 2B? High Technology Group
Whitepaper, November, 1999.
Gormley, J., W. Bluestein, J. Gatoff and H. Chun (1998), “The Runaway
Costs of Packaged Applications,” The Forrester Report, Vol. 3, No. 5,
Cambridge, MA.
Greenan, N. and Mairesse, J. (1996), "Computers and Productivity in
France: Some Evidence," National Bureau of Economic Research Working Paper
5836, November.
Griliches, Z. (1994), "Productivity, R&D and the Data Constraint,"
43
American Economic Review 84(2): 1-23.
Gullickson, W. and M.J. Harper (1999), “Possible Measurement Bias in
Aggregate Productivity Growth,” Monthly Labor Review 122 (2, February): 47-
67.
Gurbaxani, V. and S. Whang (1991), "The Impact of Information Systems on
Organizations and Markets." Communications of the ACM 34(1): 59-73.
Hall, R. E. (1999), The Stock Market and Capital Accumulation, NBER
Working Paper No. 7180 (June).
Hall, R. E. (1999b), Reorganization, NBER Working Paper No. 7181 (June).
Hammer, M. (1990), "Reengineering Work: Don't Automate, Obliterate."
Harvard Business Review (July-August): 104-112.
Hitt, L. (1996), Economic Analysis of Information Technology and
Organization, Unpublished doctoral dissertation, MIT Sloan School of
Management.
Hitt, Lorin M. (1999), “Information Technology and Firm Boundaries:
Evidence from Panel Data,” Information Systems Research 10(9, June): 134-
149.Hunter, Larry W., Bernhardt, Annette, Hughes, Katherine L., and Eva
Skuratowicz (2000), “Its Not Just the ATMs: Firm Strategies, Work
Restructuring and Workers’ Earnings in Retail Banking,” mimeo, Wharton
School.Johnston, H Russell, Vitale, Michael R. (1988), "Creating Competitive
Advantage with Interorganizational Information Systems," MIS Quarterly 12(2):
153-165.
Jorgenson, Dale W. and Kevin Stiroh (1995). "Computers and Growth,"
Journal of Economics of Innovation and New Technology 3: 295-316.
Jorgenson, Dale W. and Kevin Stiroh (1999) Information Technology and
Growth”. American Economic Review, Papers and Proceedings. May.
44
Kelley, Maryellen R. (1994), "Productivity and Information Technology:
The Elusive Connection," Management Science 40(11): 1406-1425.
Kemerer, C. F. and G. L. Sosa (1991), "Systems Development Risks in
Strategic Information Systems," Information and Software Technology 33(3):
212-223. Levy, Frank; Beamish, Anne; Murnane, Richard J; and David Autor (2000),
“Computerization and Skills: Examples from a Car Dealership,” mimeo, MIT and
Harvard. Lichtenberg, F. R. (1995), "The Output Contributions of Computer
Equipment and Personal: A Firm-Level Analysis," Economics of Innovation and
New Technology 3: 201-217.
Lehr, W. and F.R. Lichtenberg, “Computer Use and Productivity Growth in
Federal Government Agencies 1987-92,” Journal of Industrial Economics 46(2):
257-279.
Malone, T. W.; J. Yates, and R. I. Benjamin (1987), "Electronic Markets
and Electronic Hierarchies," Communications of the ACM 30(6): 484-497.
Malone, Thomas W. (1987), "Modelling Coordination in Organizations and
Markets," Management Science 33(10): 1317-1332.
McKenney, J.L. and T.H. Clark (1995), Proctor and Gamble: Improving
Consumer Value through Process Redesign. Harvard Business School Case Study
9-195-126.
Milgrom, P. and J. Roberts (1990), "The Economics of Modern
Manufacturing: Technology, Strategy, and Organization," American Economic
Review 80(3): 511-528.
Morrison, Catherine J. (1996), "Assessing the Productivity of
Information Technology Equipment in U.S. Manufacturing Industries," Review of
Economics & Statistics 79(3): 471-481.
45
Mukhopadhyay, Tridas, Rajiv, Surendra, Kannan Srinivasan (1997), "
Information Technology Impact on Process Output and Quality," Management
Science 43(12): 1645-1659.
Murnane, Richard J.; Levy, Frank; and David Autor (1999),
“Technological Change, Computers and Skill Demands: Evidence from the Back
Office Operations of a Large Bank,” mimeo, NBER Economic Research Labor
Workshop (June).
Nakamura, L. I. (1997), "The Measurement of Retail Output and the
Retail Revolution", paper presented at the CSLS Workshop on Service Sector
Productivity and the Productivity Paradox, Ottawa, Canada, April.
Oliner, S, D. and Sichel, D.E. (1994), "Computers and Output Growth
Revisited: How Big is the Puzzle?" Brookings Papers on Economic Activity:
Microeconomics (2): 273-334.
Orlikowski, W. J. (1992). Learning from Notes: Organizational Issues in
Groupware Implementation. in Conference on Computer Supported Cooperative
Work. J. Turner and R. Kraut. Toronto, Association for Computing Machinery:
362-369.
Osterberg, William P and Sandy A. Sterk (1997), "Do more banking offices
mean more banking services?" Economic Commentary (Federal Reserve Bank of
Cleveland), 1-5.
Radner, R. (1993), "The Organization of Decentralized Information
Processing," Econometrica 62: 1109-1146.
Rangan, V. and M. Bell (1998), Dell Online. Harvard Business School
Case Study 9-598-116.
Roach, Stephen S. (1987), "America's Technology Dilemma: A Profile of
46
the Information Economy," Morgan Stanley Special Economic Study (April).
Schankerman, M. (1981), "The Effects of Double-Counting and Expensing on
the Measured Returns to R&D," Review of Economics and Statistics 63: 454-458.
Schnapp, John (1998), "An Old Strategy is Backfiring at G.M.," New York
Times (July 12): section 3: 12.
Short, James E.; Venkatraman, N. (1992), "Beyond Business Process
Redesign: Redefining Baxter's Business Network," Sloan Management Review
34(1): 7-20.
Seybold, Patricia and Marshak, Ronni, Customers.com: How to Create A
Profitable Business Strategy for the Internet & Beyond, Times Books.
Siegel, Donald (1997), "The Impact of Computers on Manufacturing
Productivity Growth: A Multiple-Indicators Multiple-Causes Approach," Review
of Economics & Statistics 79(1): 68-78.
Simon, Herbert A. (1976), Administrative Behavior, New York: The Free
Press, 3rd Edition.
Solow, R.M. (1987), "We'd Better Watch Out," New York Times Book Review,
(July 12): 36.
Vitale, M. and Konsynski, B. (1988), Baxter Healthcare Corp.: ASAP
Express, Harvard Business School Case 9-188-080.
Wilson, Diane D. (1995), "IT Investment and Its Productivity Effects: An
Organizational Sociologist's Perspective on Directions for Future Research,"
Economics of Innovation and New Technology (3): 235-251.
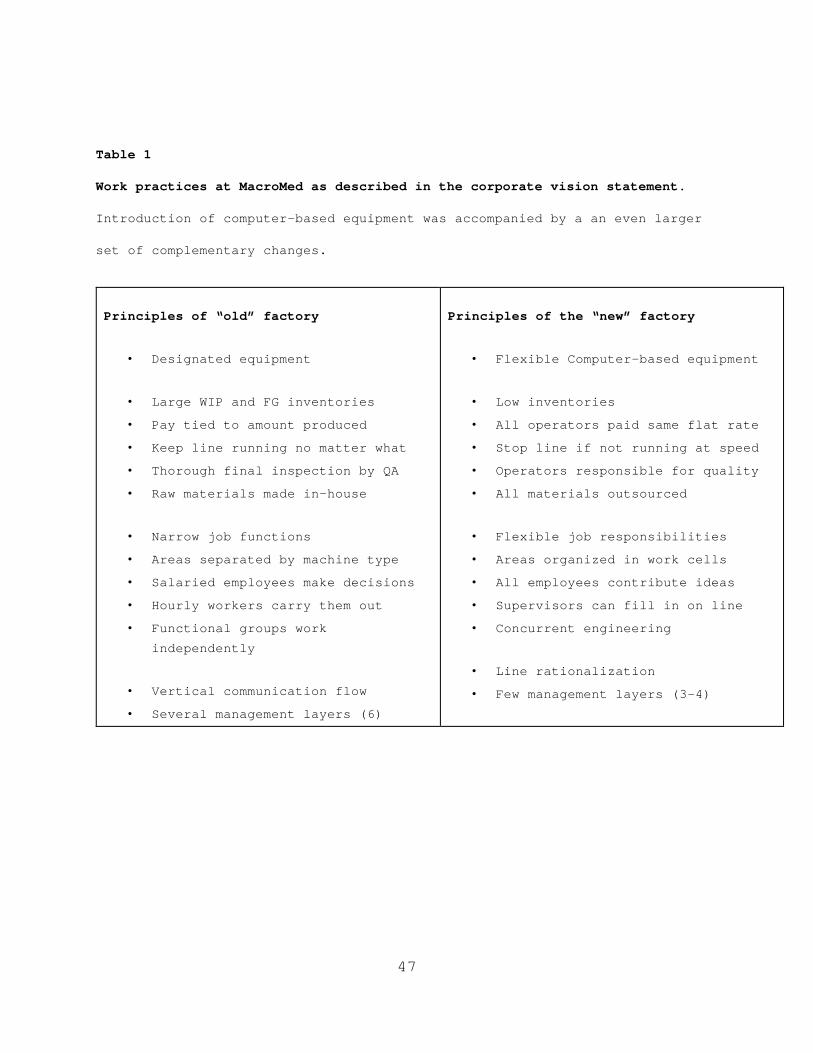
47
Table 1
Work practices at MacroMed as described in the corporate vision statement.
Introduction of computer-based equipment was accompanied by a an even larger
set of complementary changes.
Principles of “old” factory
• Designated equipment
• Large WIP and FG inventories
• Pay tied to amount produced
• Keep line running no matter what
• Thorough final inspection by QA
• Raw materials made in-house
• Narrow job functions
• Areas separated by machine type
• Salaried employees make decisions
• Hourly workers carry them out
• Functional groups work independently
• Vertical communication flow
• Several management layers (6)
Principles of the “new” factory
• Flexible Computer-based equipment
• Low inventories
• All operators paid same flat rate
• Stop line if not running at speed
• Operators responsible for quality
• All materials outsourced
• Flexible job responsibilities
• Areas organized in work cells
• All employees contribute ideas
• Supervisors can fill in on line
• Concurrent engineering
• Line rationalization
• Few management layers (3-4)
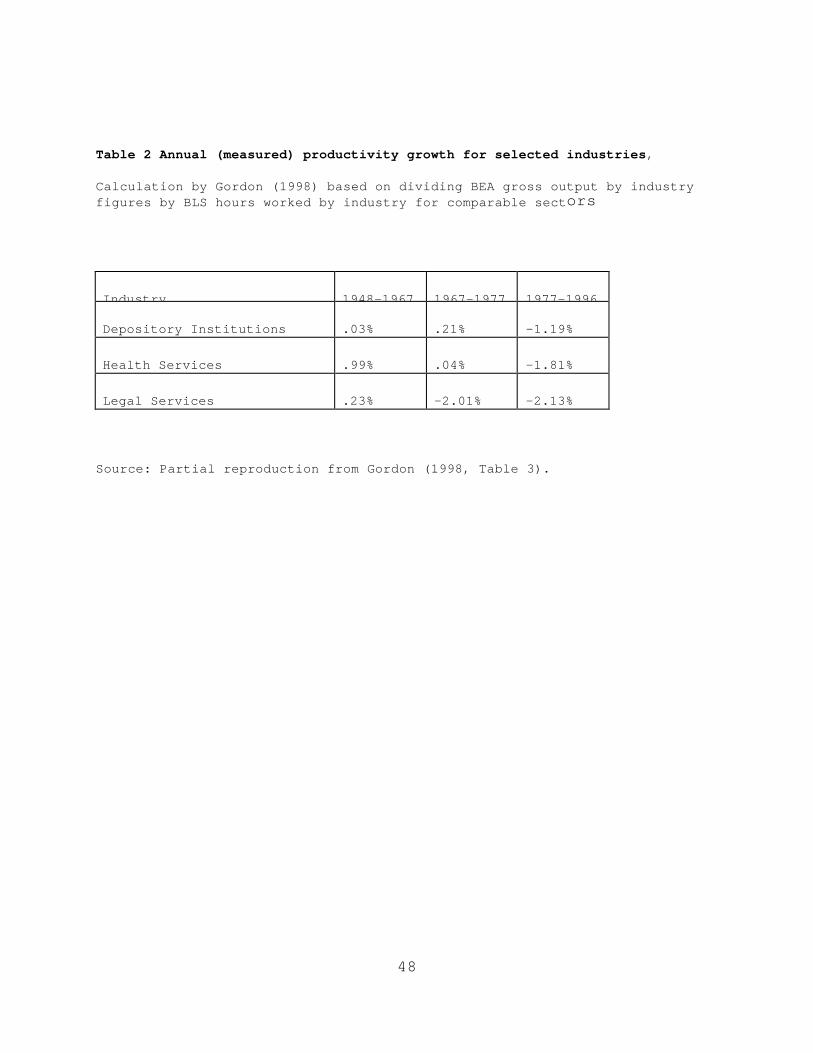
48
Table 2 Annual (measured) productivity growth for selected industries,
Calculation by Gordon (1998) based on dividing BEA gross output by industry figures by BLS hours worked by industry for comparable sectors
Industry 1948-1967 1967-1977 1977-1996
Depository Institutions .03% .21% -1.19%
Health Services .99% .04% -1.81%
Legal Services .23% -2.01% -2.13%
Source: Partial reproduction from Gordon (1998, Table 3).
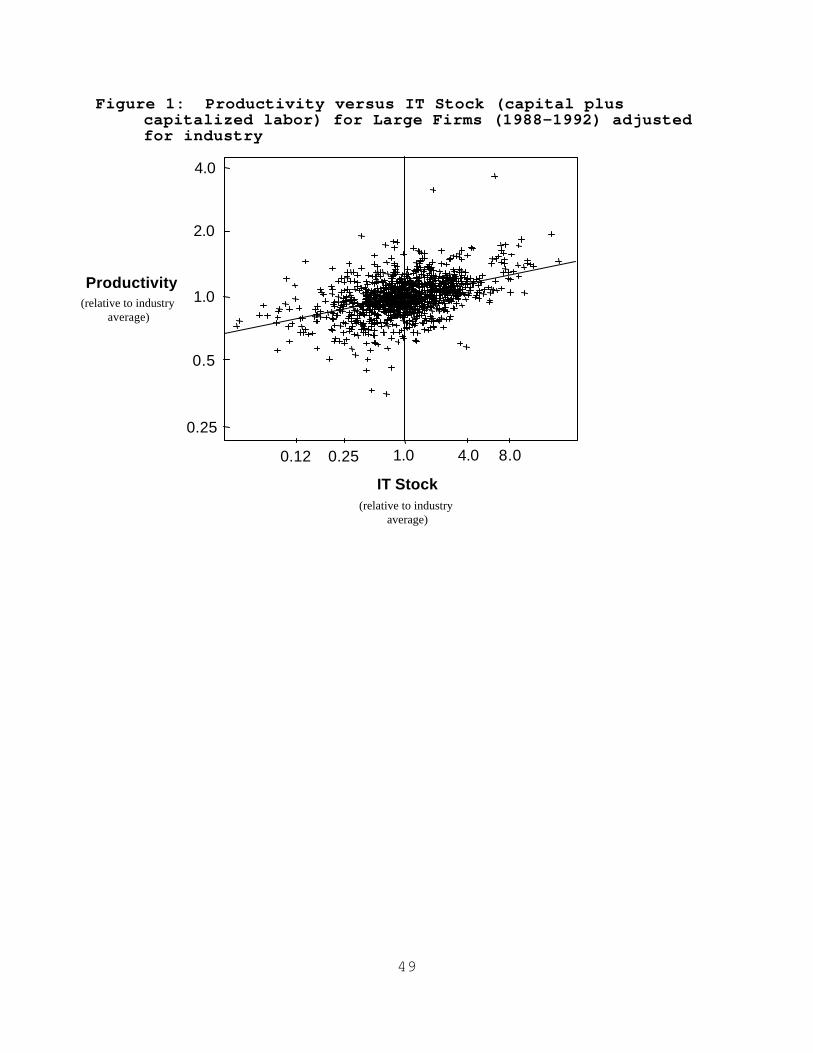
49
Figure 1: Productivity versus IT Stock (capital plus capitalized labor) for Large Firms (1988-1992) adjusted for industry
0.25
0.5
1.0
2.0
4.0
0.12 0.25 1.0 4.0 8.0
Productivity(relative to industry
average)
IT Stock(relative to industry
average)
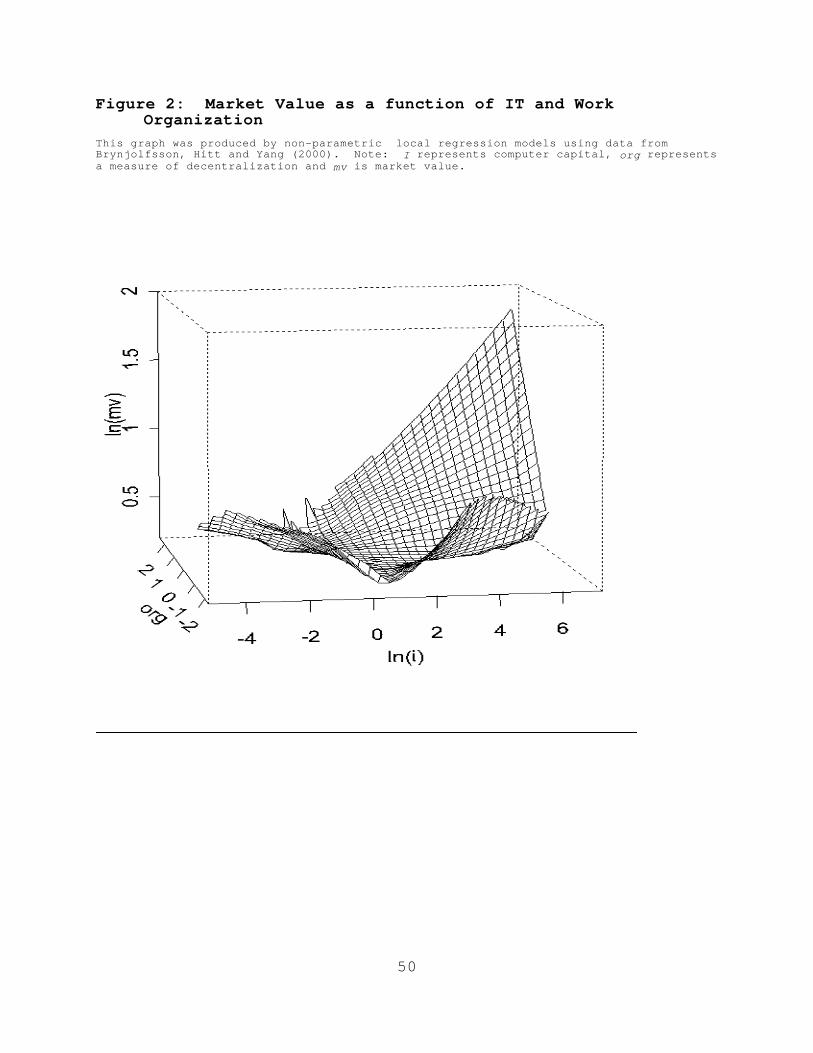
50
Figure 2: Market Value as a function of IT and Work Organization
This graph was produced by non-parametric local regression models using data from Brynjolfsson, Hitt and Yang (2000). Note: I represents computer capital, org represents a measure of decentralization and mv is market value.

51

52
53
1. For a more general treatment of the literature on IT value see reviews by Attewell and Rule (1984); Brynjolfsson (1993); Wilson (1995); and Brynjolfsson and Yang (1996). For a discussion of the problems in economic measurement of computers contributions at the macroeconomic level see Baily and Gordon (1988), Siegel (1997), and Gullickson and Harper (1999).
2. These studies assumed a standard form (Cobb-Douglas) for the production function, and measured the variables in logarithms. In general, using different functional forms, such as the transcendental logarithmic (translog) production function, has little effect on the measurement of output elasticities. 3. Hitt (1996) and Brynjolfsson and Hitt (2000) present a formal analysis of this issue. 4. Part of the difference in coefficients between short and long difference specifications could also be explained by measurement error (which tends to average out somewhat over longer time periods). Such errors-in-variables can bias down coefficients based on short differences, but the size of the change is too large to be attributed solely to this effect (Brynjolfsson and Hitt, 2000).
5. Kelley (1994) found that the use of programmable manufacturing equipment is correlated with several aspects of human resource practices.
6. It is worth noting that if the exact quality change of an intermediate good is mismeasured, then the total productivity of the economy is not affected, only the allocation between sectors. However, if computer-using industries take advantage of the radical change in input costs and quality to introduce new quality levels (or entirely new goods) and these changes are not fully reflected in final output deflators, then total productivity will be affected. In periods of rapid technological change, both phenomena are common.