better health outcomes from limited...
TRANSCRIPT

Africa Region Human DevelopmentWorking Paper Series
Better Health Outcomesfrom Limited Resources:
Focusing on Priority Services in Malawi
Oscar F. Picazo
Africa RegionThe World Bank

© April 2002Human Development SectorAfrica RegionThe World Bank
The views expressed herein are those of the author anddo not necessarily reflect the opinions or policies of theWorld Bank or any of its affiliated organizations.
Cover photo by Oscar Picazo.Cover design by Tomoko Hirata.
ii AFRICA REGION HUMAN DEVELOPMENT WORKING PAPER SERIES

1 Introduction 1
2 Key findings and recommendations 3
The resource envelope and health sector performance 3The government budget 5Extra-budgetary sources of funds 7Private health expenditures 8Donor financing and expenditures 9Sectoral efficiency improvement 10
3 MOHP budget and expenditures 13
Allocation trends 13MOHP’s Medium-Term Expenditure Framework 17Continuing challenges in the MTEF process 19Recommendations for improved resource allocation and use 21
4 Extra-budgetary sources of funds 23
Drug revolving funds 23Cost-sharing programs 23
5 Private health expenditures 26
Mission/CHAM facilities 26Private for-profit health providers 27Health insurance 27Household health expenditures 29
BETTER HEALTH OUTCOMES FROM LIMITED RESOURCES iii
Contents

6 Donor financing and expenditures 31
Allocation vs. expenditures 32Project pipeline 34Health service focus of donor projects 34Uses of donor resources 34Geographic distribution of donor projects 38
7 Analysis of the Fourth National Health Plan 40
Infrastructure implications 40Personnel implications 41Recurrent cost implications 42Total cost of the NHP and options for phasing 43
8 Efficiency improvement in the health sector 45
Hospital autonomy 45Improving pharmaceutical financing, distribution and use 47Health service decentralization 49Contracting of health services 52The role of nongovernmental organizations 53
Appendix – Unit cost of providing health services to the top five disease conditions in Malawi 55
References 59
List of Tables
1 Key socioeconomic and health indicators in Malawi: various years 22 MOHP recurrent and donor expenditures in the health sector: FY94/95-FY98/99 43 Malawi health spending and performance compared to other countries in Sub-Saharan Africa:
various years 54 MOHP recurrent expenditures and per capita expenditures, in current and real terms:
FY95/96-FY98/99 145 MOHP recurrent expenditures by level of institution: FY95/96-FY98/99 156 MOHP recurrent expenditures by level of cost center: FY98/99 167 MOHP recurrent expenditures by economic classification: FY95/96-FY98/99 178 MOHP staff breakdown: FY97 189 Recommended key actions for improved use of MOHP resources 2210 Recommended restructuring of selected hospital services in Malawi 2511 Estimated revenues from cost-sharing program based on alternative scenarios 2512 Health service providers in Malawi: mid-1990s 2613 Benefits and contribution rates of different types of health insurance plans offered by
the Medical Aid Society of Malawi 2814 Operating indicators of the Medical Aid Society of Malawi: 1993/94-1996/97 28
iv AFRICA REGION HUMAN DEVELOPMENT WORKING PAPER SERIES

15 Annual household health expenditures in Malawi: 1990-91 2916 Reported paying patterns of poor and nonpoor households for health services
by urban and rural location: 1995 3017 Summary of donors’ health sector allocations and expenditures in Malawi: FY94/95-FY97/98 3118 Budget allocation and expenditures of donor projects: as of end-FY97/98 3219 Donors’ budget allocation and expenditures in the health sector in Malawi: FY94/95-FY97/98 3520 Pipeline analysis of major donor projects in the health sector in Malawi: FY98/99-FY01/02 3621 Donor projects by health service focus in Malawi: as of end-FY97/98 3622 Donor expenditures by major classification: FY96/97 and FY97/98 3723 Implementing agencies of donor projects in Malawi: as of end-FY97/98 3824 District location of donor projects in Malawi: as of end-FY97/98 3825 Current vs. proposed vs. standard number of health facilities in Malawi 4026 NHP’s “priority” infrastructure program and cost 4127 Current vs. proposed vs. standard number of health personnel in Malawi 4128 Current vs. proposed number of personnel for health centers and district/rural hospitals in Malawi 4229 Estimated recurrent cost requirements of the NHP’s infrastructure program 4330 MOHP contracting out and rationalization of government functions 52
Appendix tables
1-A Average cost of care per patient, by type of care, by type of disease, and by type of facility: 1998 561-B Average cost of care per inpatient and per OPD visit by disease: 1998 57
BETTER HEALTH OUTCOMES FROM LIMITED RESOURCES v


n order to identify appropriate policy andadministrative measures to address develop-ment issues in the health sector, it is helpful to
have access to country-specific knowledge thatsheds light on the key weaknesses in the healthsystem. In a large number of Sub-Saharan countries,however, such a knowledge base remains sparse,reflecting the absence or sometimes systematic neg-lect of analytical work in the past. The presentreport deals with health financing issues in Malawiand analyzes trends in health expenditures in the1990s, along with the prospects for improvingresource mobilization, allocation and use in thehealth sector of that country.
Malawi’s major public health issues includeHIV/AIDS, poor reproductive health and severeconstraints in the availability of health personnel,drugs and other supplies, in conjunction with avery limited capacity of the Government to defineand implement good health policies. The mostpressing challenges include defining a cost-effectiveand sustainable package of health services that theGovernment can commit itself to finance, reaching aconsensus on an appropriate division of responsi-bility between the public and private sectors forfinancing and delivering health services, settingsustainable levels of health worker remuneration,and creating institutional arrangements for efficient
management. Reform in these areas are key toimproving the quality of health services in Malawi.
The Government of Malawi has committed itselfto addressing the deficiencies in the health systemunder its proposed debt relief program. In order todo so, an infusion of additional resources, from bothdomestic and international sources, may well beneeded. However, an equally important issue isensuring that currently available resources are usedefficiently and equitably. The evidence suggests thatin Malawi, as in many Sub-Saharan countries, sub-stantial scope for progress exists in this regard. TheGovernment of Malawi indeed has begun formulat-ing a reform program to improve the performanceof the health system, including a “fast-track”approach to produce more trained health workers(especially nurses), restructure the pharmaceuticaldistribution system, increase government financingof key health sector recurrent inputs, gradualdecentralization of health services, and a more coor-dinated approach to donor assistance in the healthsector. However, much more remains to be done,particularly in tackling the institutional andhuman-resource capacity constraints.
The publication of this health expenditurereview for Malawi is intended to contribute to ourcollective knowledge about the country’s healthsector and the nature of the policy challenges, and
BETTER HEALTH OUTCOMES FROM LIMITED RESOURCES vii
Foreword
I

to share that knowledge where possible. It is myhope that as new knowledge emerges in the courseof implementing the country’s poverty reductionstrategy, this knowledge will be instrumental inovercoming the constraints in the health sector thatcurrently impede poverty reduction in Malawi.
Ok PannenborgSenior Health Advisor and Sector Leader forHealth, Nutrition and PopulationHuman DevelopmentAfrica Region
viii AFRICA REGION HUMAN DEVELOPMENT WORKING PAPER SERIES

Africa Region Human DevelopmentWorking Paper Series
Better Health Outcomesfrom Limited Resources:
Focusing on Priority Services in Malawi


1
Introduction
1
alawi is one of the poorest countries in theworld, with a per capita income of aroundUS$180 in 1996. Its demographic profile
exhibits a population that is high growth (2.8 per-cent a year), young (47.5 percent are below 15 yearsof age), mostly rural (77.7 percent), and has a veryhigh dependency ratio (97 dependents for every 100adults of working age). Malawi’s public spendingon health has historically been high (at least until1993/94) relative to other Sub-Saharan countriesand developing nations with comparable GNP percapita, but the country’s living conditions areamong the poorest in the world. Although physicalaccess to a health facility has improved over theyears, access to functional health services continuesto be limited as indicated by low provider-to-popu-lation ratios and often severe unavailability ofdrugs, contraceptives, and other supplies. As muchas 54 percent fell below the given household-income poverty line in the mid-1990s. There is norecent update on poverty, but given the poor eco-nomic performance throughout the 1990s, one caninfer that the situation has not improved dramati-cally. Life expectancy at birth has fallen from 45years in 1982 to 42 years in 1998, due largely to the
AIDS epidemic. The economic slowdown thatbegan in 1994/95 and the continuing decline in theinternational price of Malawi’s key export (tobacco)on which a large proportion of Malawians depend,have added to the complexity of making appropri-ate recommendations to improve health sector per-formance.
This health expenditure review (HER) providesoccasion to take stock of Malawi’s performance inthe health sector. The paper reviews the status of thecountry’s health expenditures, identifies issues onthe level and quality of these expenditures, and pro-vides recommendations to improve resource mobi-lization, resource allocation, and organizational effi-ciency. Section 2 of the paper summarizes the keyfindings and recommendations. The next four sec-tions deal with the various sources of health financ-ing: section 3 on government health expenditures,section 4 on extra-budgetary funds, section 5 on pri-vate sector financing, and section 6 on donor financ-ing. Section 7 analyzes the implications of theMalawi National Health Plan while section 8 exam-ines reform proposals related to sector efficiencyand improvement.
M

2 AFRICA REGION HUMAN DEVELOPMENT WORKING PAPER SERIES
Table 1Key socioeconomic and health indicators indicators in Malawi: various years
Indicators Latest Year Available
Total population mid-1999 10.8 million
Avg. annual growth of pop. 1990-1998 2.8 percent
Percent urban population 1998 22.3 percent
Growth of urbanization 1990-98 9.5 percent
Total fertility rate 1998 6.4 children
Crude birth rate 2001 47 per 1,000 population
Crude death rate 2001 23 per 1,000 population
Life expectancy at birth 1998 42 years
Infant mortality rate 1998 134 per 1,000
Under-5 mortality rate 1998 229 per 1,000
Maternal mortality rate 1999 620 per 100,000
Adult HIV-1 seroprevalence per 100 adults End-1999 16.1
Children 0-1 immunized against DPT 1998 96 percent
Children 0-1 immunized against measles 1998 90 percent
Oral rehydration therapy use among under-5 children 1992-93 50 percent
Percent of infants with low birth weights 1991-94 10 percent
Population per physician 1990-96 33,344
Population per hospital bed 1990-96 625
Percent of births attended by trained health personnel 1990-95 57 percent
GNP per capita (Atlas dollars) 1999 US$180
Public health expenditures as percent of GDP 1990-97 3.3 percent
Source: World Bank African Development Indicators 2001.

his review highlights the need to further pri-oritize the activities under the MalawiNational Health Plan so that the plan will be
a basis for government policy and budgetary com-mitments and also an instrument to marshal andorchestrate donor support to the sector. Once thegovernment has determined that its core functionunder the Plan is the provision of an essential pack-age of health services, it needs to translate thispolicy aim into budgetary allocations at both thecentral and district levels. It also needs to ensurethat inputs, especially drugs, medical supplies, andtrained staff, are made available to support thedelivery of the package. Health services notincluded in the package should be subject to fees,either on a modest cost-sharing or on a full-costrecovery basis. The fiscal crisis has underscored theimportance of fee revenues to cushion the impact ofdeclining budget allocations to health facilities.Finally, the government needs to focus more on thefinancing and delivery of district health servicesand providing for their legal and administrativeframework.
The resource envelope and health sectorperformance
For the first half of the 1990s, Malawi’s health sectorenjoyed relatively robust financing as the Govern-ment of Malawi (GOM) deliberately increased publicfunding of social services. In 1993, as much as 7.4percent of central government expenditures was
devoted to health which compared favorably with4.2 percent for similar countries in Sub-SaharanAfrica and 4.8 percent for developing countries withsimilar GNP per capita. The economic contractionfrom 1994-95, however, ushered in the budget crunchthat continues to this day, dramatically altering thefinancing picture. Since FY94/95, government healthspending has barely kept pace with inflation andpopulation growth, with real per capita expendituresof the Ministry of Health and Population (MOHP)actually declining from MK (Malawi Kwacha) 45.12to only MK40.91 in FY98-99 (Table 2). Investmentsmade in the first half of the decade (expansion ofphysical infrastructure) are now wanting in recurrentcosts. The government was slow to tap extra-budget-ary sources of funds (user fees) to arrest the declinein real per-capita public spending; it was also slow toreconfigure its budget to focus on those services thatprovided the greatest health impact (promotive andpreventive services), choosing instead to allocate theincreasingly meager resources to a broad set of serv-ices, and allowing donor-funded new capital invest-ments that required additional running costs thatcould not be provided adequately in the recurrentbudget.
Donor resources have risen significantly in nom-inal terms since FY95/96, which somehow cush-ioned the adverse impact of a stagnant real percapita MOHP spending. However, since theseresources were not designed to directly support thebudget except for limited amounts that went todepartmental support, donor-funded projects were
2
Key findings andrecommendations
T
3

kept running well while the government healthservice delivery system remained underfunded.Also, inflation has reduced the sizeable nominalincrease in donor spending, with real per capitadonor spending tending to decline.
The difficult economic prospects for Malawirequire greater fiscal prudence and better resourceallocation in the health sector. Donors continue toshow willingness to support the sector (with a largepercentage of allocated amounts remaining undis-bursed), but a new way of providing and managingdonor assistance is imperative. Surveys also showhousehold willingness to contribute to the financ-ing of health care. Finally, nongovernment organi-zations (for-profit and nonprofit providers alike)can be tapped by the government in pursuit ofnational health goals. The challenge for the govern-ment is to orchestrate these domestic resources, tocapitalize on the continuing goodwill of donors,
and to explore alternative financing and service-delivery modalities so that health services can beimproved.
Though the level of per capita health spending inMalawi has declined since the mid-1990s, it stillcompares favorably with its neighboring countries.Based on available data, government and donors’health expenditures per capita in Malawi wasUS$7.82 in FY97/98 while it was US$4.72 in Kenyaand US$8.90 in Tanzania in the mid-1990s (Table 3).As the HER will show, the allocation of Malawihealth expenditures by levels of care is not undulyunbalanced and also compares favorably with thesecountries. But sector performance data indicate thatMalawi’s health spending seems not to be yieldingthe expected health outcomes commensurate withthe country’s level and allocation of health expendi-tures, or commensurate with the reported coveragerates of its health programs. Among four compari-
4 AFRICA REGION HUMAN DEVELOPMENT WORKING PAPER SERIES
Table 2MOHP recurrent and donor expenditures in the health sector: FY94/95–FY98/99
Items FY94/95 FY95/96 FY96/97 FY97/98 FY98/99
MOHP recurrent expenditures (MK millions) 244.929 334.763 590.747 668.569 753.265
Donors’ expenditures (US$ millions) 28.2 35.7 50.0 47.1 n.a.
Number of MK =US$1.0 8.7 15.3 15.3 17.5 43.0
Donors’ expenditures (MK millions) 245.34 546.21 765.00 824.25 n.a.
Total expenditures (MK millions) 490.269 880.973 1,355.747 1,492.819 n.a.
Pop. of Malawi (millions) 9.96 10.25 10.57 10.91 11.24
MOHP recurrent expenditures per capita (MK) 24.59 32.66 55.89 61.28 67.02
Donors’ expenditures per capita (MK) n.a. 53.28 72.37 75.55 n.a.
MOHP and donors’ expenditures per capita (MK) n.a. 85.94 128.26 136.83 n.a.
Price index (1995=1.000) 0.545 1.000 1.354 1.517 1.638
MOHP recurrent expenditures per capita, at constant 1995 prices (MK) 45.12 32.66 41.27 40.40 40.91
Donors’ expenditures per capita, at constant 1995 prices (MK) n.a. 53.28 53.45 49.80 n.a.
MOHP and donors’ expenditures per capita, at constant 1995 prices (MK) n.a. 85.94 94.73 90.20 n.a.
Note: There is no consistency between the population figures used by the GOM and those reported in international bodies (such as Population Reference Bureau, the World Bank). Thelatest Malawi National Census has not yet been finalized. This table uses the GOM population figures.
Source: This review.

son countries in Sub-Saharan Africa, Malawi hasthe lowest life expectancy at birth, the highest infantand childhood mortality rates, and the highestmaternal mortality rate. And although the country’simmunization coverage is high, child mortalityremains high.
There is clearly a conundrum that policymakersin the health sector need to face. Poor sector per-formance cannot be blamed entirely on the lowlevel of health spending (some comparison coun-tries have lower spending per capita), or on the allo-cation of these expenditures (other countries havemore skewed resource allocation). Explanations forthis conundrum should be sought in technical effi-ciency (how well the system and individual facili-ties are managed), in the incentive structure for staffand program managers (salary levels, degree of
autonomy, appropriateness and mix of skills, coun-terproductive coping mechanisms of staff), and inthe overall institutional environment (the ability ofMOHP to plan, marshal, and deploy resources toareas and services in greatest need). The quality ofhealth services being provided also need to beexamined further, and remedial measures taken.This HER provides a broad macro/sectoral pictureof the level and allocation of resources, but muchmore remains to be done to analyze and address themicro/facility-specific problems plaguing the deliv-ery of health services.
The government budget
The GOM is the biggest provider of health services,though funding has been eroded over the past few
BETTER HEALTH OUTCOMES FROM LIMITED RESOURCES 5
Table 3Malawi health spending and performance compared to other countries in Sub-Saharan Africa:various years
Indicators Malawi Kenya Tanzania Zambia
GNP per capita in US$ (1997) 220 330 210 380
Population in millions (mid-1997) 11.24 28.0 33.3 9.4
Gov’t expenditures on health per capita (US$) 3.50 3.56 4.23 8.12
Donor expenditures on health per capita (US$) 4.32 1.16 4.67 5.94
Gov’t + donors’ expenditures on health per capita (US$) 7.82 4.72 8.90 14.06
Percentage of HH expenditures per capita spent on health care (1993) 8.0 5.0 n.d. 3.0
Percentage of children immunized against DPT (1993-95) 98 40 79 76
Percentage of children immunized against measles (1993-95) 99 35 75 78
Percentage of births attended by trained health worker (1990-93) 41 n.d. n.d. 43
Population per physician (1990-94) 45,737 21,970 n.d. 10,917
Life expectancy at birth in years (1996) 43 58 50 44
Infant mortality rate per 1,000 live births (1992-93) 133 61 84 107
Childhood mortality rate per 1,000 live births (1992-93) 225 94 167 190
Maternal mortality rate per 100,000 live births (1993) 620 170 410 n.d.
Sources of data: World Bank African Development Indicators (1998/99); World Development Report (1997); Malawi Human Resources and Poverty (1996); Health Policy in Eastern Africa:A Structured Approach (1997, draft); Malawi Health Expenditure Review (1999); Zambia Health Sector Expenditure Review (1995).

years by a chronic budget crisis and a limited capac-ity to plan health services. In FY95, the MOHPbegan budgetary reform under the Medium-TermExpenditure Framework (MTEF) aimed at keepingthe scope and level of health services in line withavailable budgetary resources. However, the MTEFexperience up to 2000 indicates that the processremains a mechanistic “budget cut-and-defend”exercise that is not central to the MOHP’s concep-tion of its long-term strategic role in the sector.Incremental budgeting continues to be practiced,budget protection is based on maintaining the cur-rent level of investments (especially hospitals), andthe scope of MOHP operations remains far widerthan it can effectively fund and adequately super-vise. As a result, no dramatic budget reallocationtowards more cost-effective preventive and promo-tive health services has occurred. In fact, there areindications from the donor survey conducted forthis study that donors may be crowding out thegovernment from funding what should be its corefunction (preventive and promotive health), andthat as a result, a greater proportion of governmentresources are flowing to tertiary-care institutions.
Admittedly, the level of government health allo-cation is too low, but instead of focusing on cost-effective services with large public-health impact,the government has opted to finance all existinghealth programs and infrastructure including cost-ineffective interventions. Some donors have con-tributed to the crisis by offering infrastructureexpansion with little regard for their recurrent-costimplications. The MOHP should use the budgetcrisis and the MTEF process as an opportunity torethink its role, scope, and focus. Towards this end,the following actions are recommended:
Further refine the National Health Plan asthe basis for priority setting, programming,and budgeting
GOM launched the Malawi National Health Plan(NHP) in May 1999, embodying the government’svision 2007 “to provide every Malawian with anaffordable package of essential health services(EHS) based on intensified community efforts andbacked by upgraded health centers and appropriatedistrict hospitals.” As the funding gap analysis
below shows, the NHP’s financial requirements arefar greater than the available resources forecast forthe medium term. There the focus of the Plan mustbe sharper.
Implementation of the NHP first requires translat-ing the EHS into policy. This entails (a) definition ofand agreement on the package that the GOM is com-mitted to fund; (b) the political and administrativeapproval of the EHS package; and (c) official policyon the provision and funding of nonessential or non-package health services. The absence of such a policyon nonessential services is tantamount to the gov-ernment’s acquiescing to continued unplanned infra-structure construction and system expansion.
The policy on the EHS package then needs to betranslated into its programmatic requirements,which entails (a) costing out the package itself;(b) identifying and costing out the support servicesand other incremental inputs needed to implementthe package (staff training, information and educa-tion campaigns, supervision and monitoring, infor-mation systems support); (c) adjusting the servicesincluded in the package on the basis of their costsand available fiscal resources over the next three tofive years; and developing an implementation planto carry out the approved strategy.
Finally, the EHS program costing exercise needsto be translated into the government budget, whichentails actual government allocation for the pack-age (both at central and district levels); governmentcommitment not to divert the budget for nonpack-age services; and use of the refined NHP and itsimplementation plan as the basis for marshallingadditional external donor support.
Tighten the coordination and institutionallocus of planning and budgeting
The scarcity of resources demands more circum-spect policymaking, planning, programming, budg-eting, and releasing functions and tighter coordina-tion of these functions. Discussions are neededwithin the government on the budgetary implica-tions—especially recurrent cost implications—ofeach health policy, program, service, or function.The MOHP must routinely undertake an exercise ofmaking alternative choices given alternative fund-ing scenarios. Key actions in this area involve:
6 AFRICA REGION HUMAN DEVELOPMENT WORKING PAPER SERIES

• Synchronizing the mandate and membership ofthe MTEF Committee and the Cash Budget Com-mittee so that there is less variability in the plan-ning/budgeting and cash-releasing functions.Releases should be governed by the agreed-uponbudget priorities.
• Decentralizing some of the MOHP functions todistricts and regional offices (such as monitoringand supervision) to free senior officers for morestrategic policy concerns, rather than havingthem occupied with day-to-day management.
• Integrating the recurrent and developmentbudgets, or at least making both of them as trans-parent and comprehensive as possible. Until themerger of the Ministry of Finance (MOF) and theNational Economic Council (NEC), these twoactivities were disconnected, with recurrentbudgeting mainly the purview of the MOF anddevelopment budgeting mainly the purview ofthe NEC. This bifurcation made it difficult to for-mulate a rational forward-looking budget thattook account of the recurrent-cost implications ofall capital investments. The merger of the twoministries into the Ministry of Finance and Eco-nomic Planning should at least provide the insti-tutional locus for a more consistent budgetingexercise.
• Strengthening the capacity of the MOHP Plan-ning Unit to undertake health needs, costing, andcost-effectiveness analyses; to analyze budgetary,service-performance, demographic, and socioe-conomic data and propose adjustments onexpenditure flows; and to analyze the recurrent-cost implications of major health investments(donated or not) and recommend the best courseof action on these proposed investments.
Rationalize capital investments
Given a limited planning and regulatory capacity, aMalawi NHP that is essentially a “wish-list” forinfrastructure projects undermines any rationalapproach to sector investments because it leavesopen the possibility of investors and donors offer-ing projects to the government, even if such projects
worsen the recurrent-cost situation of the budget. Akey tactic in solving the recurrent-cost problem is torationalize capital investment decisions.
Key actions in this area involve:
• Exerting moral suasion at the highest levels indonor headquarters so that uncalled-for medicalinvestments in Malawi are deferred unless thedonor is willing to fully or partly cover the run-ning costs of the infrastructure in the mediumterm, or until such time that the budget crisis hasabated. Imposing policy conditions in donorprojects can also rationalize investments.
• Enforcing a thorough and comprehensive finan-cial analysis of the recurrent-cost implications ofany new government- or donor-funded project,and developing stringent health-planning andpublic-finance standards to appraise these proj-ects. In this regard, the National Economic Coun-cil, working with the MOHP, should specifyproject-approval criteria that can then be used toset national investment priorities. In themedium-term, MOHP also needs to explore thepolitical feasibility of enacting a Public HealthInvestment Act to set the parameters for health-sector investments, along the lines of “certificate-of-need” or similar approaches.
• Reducing or waiving counterpart funds, ordesigning counterpart-fund requirements so thatthey occur more in the out-years of projectsrather than up-front, or until such time that theexisting budgetary crisis has abated.
Extra-budgetary sources of funds
The GOM’s inability to finance the health needs ofMalawians through tax revenues should encourageit to explore other financing modalities that arecompatible with the population’s ability to pay.
Expand program on drug revolving funds
Pilot-testing of drug revolving funds (DRFs) underthe International Development Association’s (IDA)Population, Health and Nutrition (PHN) Projecthas shown that they can be a viable source of sus-
BETTER HEALTH OUTCOMES FROM LIMITED RESOURCES 7

tainable financing and can facilitate communityaccess to basic pharmaceutical supplies. There arepotentially 600 villages that can participate in theseschemes. Key actions in this area involve (a) con-ducting more DRF training programs on commu-nity organization and DRF management, and(b) reviving the stalled reforms to restructure theCentral Medical Stores (CMS). The sustainability of DRFs hinges on the availability of drugs, whichin turn hinges on the institutional and financialsustainability of CMS, which procures drugs forDRFs.
Implement formal cost-sharing programs ingovernment hospitals
Despite years of intent, government hospitals havenot formally established institutionally sustainablefee programs. Existing efforts are haphazard anduncoordinated; they have not been properly evalu-ated. Current disparities exist between MOHPfacilities, which do not formally impose fees, anddistrict-designated mission and local-authorityhealth facilities, which do. Partly because no feesare charged at the hospital level, and partly becausegovernment primary-care facilities are ill-funded,all tertiary government facilities are clogged withpatients who bypass the referral system.
To jump-start the fee initiative, the first keyaction is to conduct a thorough and comprehensivereview of existing formal and informal fee schemes.A Japanese PHRD grant is currently supporting thereview of the cost-sharing programs of the centralhospitals. In May 1999, a DfID-funded consultancycompleted a draft health financing strategy forMalawi (LATH: 1999). Based on the findings ofthese analyses, MOHP needs to develop a nationalgovernment fee policy covering district hospitals,district-designated Christian Hospital Associationof Malawi (CHAM) facilities receiving governmentsubventions, and local-authority facilities. Thenational fee policy should permit (a) central anddistrict hospitals to impose fees and have privatewards based on fees; (b) permit 100 percentretention of fee revenues at the hospital level;(c) permit hospital use of fee revenues subjectto specified guidelines from MOHP and spendingauthorities designated by the government;
(d) synchronize fee schedules among the differentlevels of care; and (e) specify waived or exemptedhealth services, persons, or areas to protect thepoor.
The second key action is to, develop guidelineson the accounting, safekeeping, and utilization offee revenues, including the phases of the fee pro-grams, the schedule of fees to be charged, staff tasksand responsibilities, and the planning and use ofgenerated revenues. The guidelines should alsodefine the waiver and exemption system at centraland district hospitals and the procedures that staffneed to follow on means-testing, waiving, andexemption.
The third key activity is to restructure the CentralMedical Stores so that drugs are made available ona sustainable basis. Fee programs depend cruciallyon the availability of drugs, which is a major indi-cator of quality of health services in Sub-SaharanAfrica.
Improve health insurance reimbursement
Although health insurance coverage is smallnationwide, it represents a significant pool of thosewith the ability to pay and thus provides a poten-tially major payment system for hospitals. GOMhospitals need to review their fee schedules andreimbursement rates to patients under medical aidschemes or health insurance coverage to align themwith actual costs and remove unnecessary govern-ment subsidy for these patients with the abilityto pay.
The government needs to study the administra-tive, financial, and economic feasibility of convert-ing the current government-funded Referral ofCases Abroad into a medical aid scheme for civilservants or a health insurance contract with a pri-vate insurer.
Private health expenditures
Private health expenditures are a significant,though largely unstudied, source of health financ-ing in Malawi. There is a well-established nonprofitsector (Christian Hospital Association of Malawi orCHAM) and a burgeoning for-profit sector, mainlyprivate clinics.
8 AFRICA REGION HUMAN DEVELOPMENT WORKING PAPER SERIES

Learn from nonprofit health providers
A third of CHAM resources are from user chargesand sale of drugs generated from modest fee sched-ules that do not deny poor patients access to care.GOM should learn from these institutionalized sys-tems and practices. GOM also needs to reconsiderreviving the CHAM subvention program (whichgrew from MK4.6 million in FY90/91 to MK22.2 mil-lion in FY94/95) but was eliminated with the onsetof the budget crisis in FY95/96. It should be notedthat CHAM facilities provide services to more thana third of the Malawi population, mostly in ruralareas where there are no government providers.
Encourage but regulate private for-profithealth providers
Serious issues with respect to equity, pricing, andquality of care have emerged in the wake of thehealth-sector privatization and liberalization. GOMneeds periodically to evaluate the impact of open-ing the medical sector to private practice.
The government should assist the Medical Aid So-ciety of Malawi (MASM) address the issue of provi-der-driven over-consumption of health services. Thisproblem is manifested through over-prescription,over-examination, and prolonged length of stay forpatients with health insurance coverage. It can be ad-dressed through better monitoring of providers andmore stringent professional guidelines and discipline.
Finally, AIDS care should be addressed in thecontext of health insurance as well as publicfinance. Though AIDS is a national epidemic, theissue of financing AIDS care is being flagged moreactively by private insurance schemes. These pro-grams fear that they will collapse under the impactof large-scale clamor for expensive treatment willraise premiums to an unaffordable level. Theincreasing international clamor to provide financ-ing and coverage for expensive antiretroviral drugshighlights the importance of this issue.
Promote household expenditures, butimprove protection systems for the poor
A UNICEF-commissioned survey in 1995 revealssubstantial freeloading (households with capacity
to pay for health services but do not) and under-coverage (households with scant capacity to paybut who do) in health facilities across the country.Informal fee programs without official sanction orwith scanty supervision tend to worsen these prob-lems. Fee programs need to be formally established,especially in urban facilities where nonpoor house-holds are mostly located. But the waiver andexemption systems of these programs should bestrengthened, staff should be trained in them, and avigorous information campaign should be launchedso that patients know which persons or conditionsare eligible for free care.
Donor financing and expenditures
Donors account for about half of health expendi-tures in Malawi. As of the end of FY97, as much asUS$246.5 million were allocated to the sector, ofwhich only US$115.7 million had been expended.The slow disbursement rate (46.9 percent as of end-FY97) is a cause of concern, especially in the currentbudget crisis when donor resources ought tocushion the impact of fiscal stringency. Here areseveral recommended actions to improve the use ofdonor funds:
Improve project pipeline management anddisbursement
The administrative bottlenecks at MOHP headquar-ters should be eased. Within government, delegationauthority must be established for officials who areaway, and whose signatures are necessary to movethe paperwork. Government capacity has to bestrengthened to manage and follow up requiredactions in order for donor funds to flow or for pro-curement to proceed. Both government and donorsneed to review time-consuming and onerous pro-curement procedures, improve understanding ofthese procedures, and train more staff in all aspectsof procurement and financial management. A pro-curement unit within MOHP may be called for.MOHP needs to draw up a project monitoring chartfor each of the donor-funded projects, monitor dis-bursements more closely, and pay close attention toslow-moving projects. Tighter coordination isrequired among the MOHP, the Ministry of Finance,
BETTER HEALTH OUTCOMES FROM LIMITED RESOURCES 9

local governments, and nongovernmental organiza-tions (NGOs). Periodic review and flagging of issuescan speed compliance with legal, policy, program, oradministrative requirements and conditions for dis-bursement. A regular portfolio review between theGovernment and the Bank appears to be yieldingpositive results; such a practice needs to beexpanded to other donors.
Tighten central coordination of donor-funded projects
The plethora of projects is beginning to ‘balkanize’Malawi’s health sector as each donor stakes itsclaim on a district or vertical project. The tendencyis for each donor-funded district to have its ownhealth priorities, training thrusts, informationrequirements, and financial systems, with littleregard for national-system requirements, eventualdata aggregation, or service standards. This trendmust be stopped, but this can only be done withstrong, central MOHP coordination.
The geographic distribution of donor-fundedprojects must be rationalized. The inventory ofthese projects shows that donors tend to locate inbetter-off areas, with remote districts having littleaccess to donor-funded services. GOM has to estab-lish explicit criteria and guidance on where donorprojects should locate to ensure greater equity.
Similarly, donor-funded training needs to berationalized. Donors are spending a staggeringamount (US$4.5 million annually) on long- andshort-term training (workshops, conferences), withlittle documentation of their impact on health serv-ice quality. Future training activities should bebased on a sector-wide human resource develop-ment plan and should include (a) a program forsynchronizing and harmonizing existing trainingprograms and possibly combining similar ones; and(b) a mechanism for evaluating their impact.
Improve management of project managersand contractors
There is an increasing trend towards privatizing orcontracting the supervision and management ofdonor projects. Given the perceived costliness ofnongovernment management of projects, GOM and
donors should work together in (a) setting standardsfor consultant fees, technical assistance contracts,and contract provisions to achieve greater cost-effec-tiveness, quality control, and equity; (b) synchroniz-ing project design, supervision, and evaluationactivities to save costs; and (c) drawing up a code ofconduct for NGOs and contractors, including theirfinancial responsibilities.
Explore the feasibility of a multidonorbudget or expenditure support program
The sheer number of donor projects and activities(at least 34) overburdens the constrained capacity atcentral MOHP and may account for slow disburse-ments. The design, appraisal, management, moni-toring, and evaluation requirements of individualprojects are immense and tend to overburden theMalawian bureaucracy. In addition, individualdonor projects may in fact worsen the recurrent-costproblem as GOM can ill-afford to provide the 10-15percent of government counterpart funding. Thesituation is worse for capital projects as GOM needsto set aside their running costs, which are increas-ingly becoming unavailable in the current fiscalsqueeze. Finally, donor-funded projects in principledo not provide salary supplements, yet the lowlevel of salaries is probably the single most impor-tant factor that accounts for the poor quality ofhealth services. A way out of this conundrum of“cash-rich” donor projects and “cash-starved”GOM may be a multidonor budget or expendituresupport program that can be made contingent uponGOM’s commitment to prioritize its budget to pro-vide an essential package of health services, and tolaunch policy and administrative initiatives to sup-port such service-delivery focus. The MOHP’s pre-liminary discussions with donors on a sector-wideapproach (SWAp) is a step in this direction.
Sectoral efficiency improvement
In addition to budgetary reform, three other areascan be pursued to improve efficiency in Malawi’shealth sector: restructuring the Central MedicalStores (CMS); granting of hospital autonomy toselected tertiary facilities; and further decentraliz-ing the health service. All of these improvements
10 AFRICA REGION HUMAN DEVELOPMENT WORKING PAPER SERIES

involve profound systems change and institutionaldevelopment and therefore have inherent risks andcosts, especially during the transition. The govern-ment needs to carefully weigh the options withineach reform area to minimize transition costs.
Pursue the stalled pharmaceutical sector reforms
Drug availability is the lynchpin that joins majorflanks of any health sector reform. If drugs areunavailable, community drug revolving fundscannot operate and fee-based cost-sharing pro-grams cannot succeed. Without a good revenuebase from fees to cushion the impact of reducedbudgetary support, tertiary hospitals cannotbecome autonomous. Given the centrality of phar-maceuticals in the whole health sector reform effort,the government needs to pursue the stalled restruc-turing of the CMS to make it more autonomous,sustainable, and efficient. Without these CMSreforms, the financing, procurement, and distribu-tion of drugs will continue to be imperiled.
The supply-side reforms in pharmaceuticalsneed to be supported by corresponding improve-ment in consumption patterns. This can be achievedthrough a variety of mechanisms including improv-ing physician-prescription behavior through bettertraining and monitoring, imposing partial or full-cost fees on prescription drugs at government facil-ities, and establishing therapeutic committees anddrug registers at hospitals to keep track of drug con-sumption, reduce theft, and encourage the develop-ment of demand-driven (rather than the currentinefficient supply-driven) system.
Grant hospital autonomy to selectedhospitals
The Working Group on Hospital Autonomy hasidentified three specific proposals, which should besupported. First, undertake a feasibility study tounderpin the hospital reform strategy. The studyshould (a) analyze the degree of autonomy that can-didate hospitals currently have with respect to man-agement, staffing and personnel, budgeting andfinancial resource base, procurement, and qualityimprovement; (b) discuss the legal, policy, organiza-
tional, management, and financial requirements forexpanding their autonomy; (c) set quantitative tar-gets for the feasible reduction of government sub-sidy and for increased alternative revenue sourcessuch as fees, insurance reimbursement, official andprivate philanthropic grants, and nonmedical rev-enues; and (d) set service-delivery targets that can beused in the planned health service “contracts”between the Government and the hospital boards.
Second, on the basis of the results of the studyand stakeholder consultations, provide legal auton-omy to the three central hospitals and seven “busy”district hospitals (Rumphi, Mzimba, Kasungu,Dedza, Mangochi, Machinga, and Mulanje), andestablish an enabling policy environment to makethem self-financing. An Act of Parliament isrequired to grant full autonomy to these facilities.The Act should also redefine the role of the MOHPwith respect to autonomous hospitals. In lieu ofvery specific instructions, regulations, control, andsupervision of most aspects of hospital manage-ment, the MOHP should establish goals, targets andpolicies for hospital services to be provided, andthen fund hospitals according to these requirementsthrough a health-service contract with each of them.This arrangement distinguishes between MOHP aspurchaser and regulator of services and theautonomous hospitals as providers of services.
The Working Group on Hospital Autonomy’sthird proposal is to establish a Council of HospitalBoards comprising representatives from the individ-ual hospital boards. The Council should be perceivedas a trade organization acting in the interests of theautonomous hospitals in their dealings with theMOHP in such areas as staff salaries, pensions, andbenefits; hospital fee schedules; staff training; bulkprocurement and equipment sharing; and coordina-tion of management systems and procedures.
Hospital autonomy should be implemented inthe context of hospital financing reform based on arealistic assessment of the budget and availableextra-budgetary resources; the essential and cost-effective clinical services that these hospitals shouldprovide; and the cost-effective ways of providingancillary services including contracting. Finally,these reforms should be underpinned by hospitalrenovation or refurbishment, staff retraining, drugavailability, and other visible signs of quality im-
BETTER HEALTH OUTCOMES FROM LIMITED RESOURCES 11

provement. (Any fee-based program supportive ofhospital autonomy is bound to fail without requi-site improvement in quality.)
Carry out planned activities to supporthealth service decentralization
With the passage of the Local Government Act, theholding of local elections, and the establishment oflocal councils, the legal and political structure fordevolution have been set in motion. he greater chal-lenge now is to institutionalize the fiscal frameworkfor decentralization so that central grants and trans-fers are channeled appropriately to peripheral areasand key health priorities are adequately funded ontime. The flow of bilateral and multilateral assis-tance to the districts is particularly knotty sincethere are many donors, each with specific require-ments. So far, no adequate mechanism has beendefined for this purpose.
The extent and pace of decentralization woulddepend on the capacity of local authorities tomanage decentralized health services, as well asMOHP’s ability to support and supervise thesefunctions. Key issues in this area are the availabilityof skilled staff at the local level, and the status ofcivil servants to be “absorbed” by local authorities.The roles and functions of private providers undera decentralized setup should also be defined. Thekey issues in this regard are:
• the revitalization of the subvention program andpossible conversion of such traditional and infor-mal relationship into a more formalized health-service contract between the GOM as funder andmission hospitals as providers, with specificresponsibilities and deliverables defined in termsof target coverage, cost, and quality; and
• the wider participation of CHAM and NGOs inservice delivery in their respective health dis-tricts, and in health policy at the national level.
Monitor and evaluate the contracting ofhealth services
The Government is in the process of contracting outancillary health services such as cleaning, transport,building and ground maintenance, laundry,security, catering, audit, and mortuary. These arenovel experiments in Malawi and need to be closelymonitored and evaluated in terms of efficiency andcost-effectiveness relative to the status-quo (that is,self-provision). So far, contracting of clinicalservices is not yet under discussion, but given theburgeoning private medical practice, the Govern-ment should consider it. Lessons learned fromnearby countries (South Africa) should inform thedesign of contracts, price negotiation, and otherconsiderations.
12 AFRICA REGION HUMAN DEVELOPMENT WORKING PAPER SERIES

Allocation trends
n the first half of the 1990s, the GOM made adeliberate effort to increase public spending inhealth, raising the health budget from MK83
million in FY91 to MK415 million in FY95. As aresult, the proportion of the MOHP budget to thetotal government budget increased from 9 percentin FY91 to 11 percent in FY95 (Mwambaghi 1996).Because of relatively modest inflation during theperiod, at 1990 prices the budget rose from MK72million in FY91 to MK108 million in FY95. Percapita, the GOM health budget at 1990 pricesincreased from MK7.94 in FY91 to MK10.25 in FY95.
These successes began to unravel towards themiddle of the decade in the wake of political uncer-tainties, the economic downturn in 1994-95, a largecurrency depreciation, and the inflation thatensued. By 1996, forecasts made by the Ministry ofFinance incorporating economic growth andexpected tax and other revenues showed that liberalincreases in the health budget were no longer possi-ble (Marshall 1996). At that time, the health budgetwas expected to be MK760 million in FY97, MK865million in FY98, and MK970 million in FY99. Atthese levels, the health budget was expected toretain its 15 percent share of voted expendituresand 12 percent to 13 percent of total GOM budget.
These forecasts turned out to be optimistic; infact, actual health expenditures (at current prices)were only MK334.8 million for FY95, MK590.7 mil-lion for FY96, and MK668.6 million for FY97. For
FY98, the MOHP’s budget ceiling was pegged atMK753.3 million (Table 4). Reckoned in real prices,the Ministry’s tight level of health spending is evenmore stark: while the absolute and per capita levelsof recurrent expenditures more than doubled nom-inally, at 1995 constant prices, per capita MOHPspending has remained constant at around MK40during the past three years.
MOHP expenditures by level of institution
Under the MTEF, dramatic changes were made inMOHP budget accounting and presentation,making it difficult to analyze MOHP recurrentexpenditures by level of institution. The data pre-sented in Table 5, therefore, should be interpretedwith care; they are meant to be impressionistic.
For FY98, MOHP requested a budget of MK753.3million, of which more than a third (35.9 percent)was for central HQ, a minuscule 1.7 percent was forthe three regional offices, around 17.1 percent assallocated for the four central hospitals, and close toa half (45.3 percent) was devoted to the 24 districthealth offices (inclusive of district hospitals, ruralhospitals, and preventive and promotive care serv-ices delivered in their catchment areas). Contrary tothe stated policy thrust of greater decentralization,the central MOHP HQ dramatically increased itsshare of allocation. On the other hand, the share ofresources devoted to district health offices shrankfrom more than a third (67.7 percent) of actualexpenditures in FY95 to only 45.3 percent of the
3
MOHP budget andexpenditures
13
I

allocated amount in FY98. The share of resourcesgoing to regional health offices was also down (4.4percent in FY95 to 1.7 percent in FY98). Some ofthese drops might have been due to accountingchanges (for example, certain budget items were“recentralized” for accounting purposes and cost-center responsibility, or portions of the Regionaland District Medical Offices budgets were trans-ferred to central administration), but the magnitudeof the numbers involved raises serious concerns.
The four central hospitals, which used to accountfor around 25 percent of MOHP’s budget got asmaller share in FY98. Budgetary resources devotedto the two largest hospitals (Queen Elizabeth andLilongwe Central), however, remain large: one terti-ary hospital (with an average annual budget ofMK45 million) consumes as much as three districthospitals (each with an average annual budget ofMK15 million). The government needs to find alter-native ways of funding these large urban-basedinstitutions so that critical health services in theperiphery are not crowded out of funding. The gov-ernment also needs to ensure that institutions stickto their budgets. Recent experiences on allocationsversus expenditures show that MOHP HQ and cen-tral hospitals tend to overspend while district
health offices tend to underspend, indicating thatthe government’s bias towards urban areas and cur-ative care has increased in a tight fiscal situation.
MOHP expenditures by level of cost center
For FY98, MOHP rewrote its budget to reflect iden-tified priority programs. The results of this exerciseare shown in Table 6. District health offices providepreventive/promotive services and primary/secondary curative services, which togetheraccounted for roughly 45.7 percent of the FY98budget allocation. The central hospitals provide ter-tiary curative as well as rehabilitative health serv-ices, which together accounted for roughly 17 per-cent of the FY98 budget. The remaining 35 percentof the budget went for technical and administrativeservices provided by central HQ and regionaloffices.
These budget figures, however, mask the realtype of health services rendered by health facilities.For instance, hospital managers say that aroundthree-fourths of patients at central hospitals are pri-mary-care patients who should have been treated atlower level facilities. The ill-functioning referralsystem (largely made inoperative by poorly funded
14 AFRICA REGION HUMAN DEVELOPMENT WORKING PAPER SERIES
Table 4MOHP recurrent expenditures and per capita expenditures in current and real terms:FY95/96-FY98/99 (in million Malawi Kwacha)
Percent changeItems FY95/96 FY96/97 FY97/98 FY98/99 FY95/98
MOHP recurrent expenditures in current prices (MK m) 334.763 590.747 668.569 753.265 125.0
Price index (1995=1.000) 1.000 1.354 1.517 1.638 63.8
MOHP recurrent expenditures in real prices, 1995=100 (MK m) 334.763 436.298 440.718 459.869 37.4
Population (m) 10.25 10.57 10.91 11.24 9.7
Per capita MOHP recurrent expenditures in current prices (MK) 32.66 55.89 61.28 67.02 105.2
Per capita MOHP recurrent expenditures in real prices, 1995=100 (MK) 32.66 41.27 40.40 40.91 25.3
Notes: (a) Malawi’s FY is from April 1 to March 30 the following year. (b) Population is based on mid-calendar year estimates. (c) FY95/96 to FY97/98 figures are actual expenditures;FY98/99 figures are budget allocations submitted to Parliament as of June 30, 1998.
Source of basic data: MOHP Planning Unit.
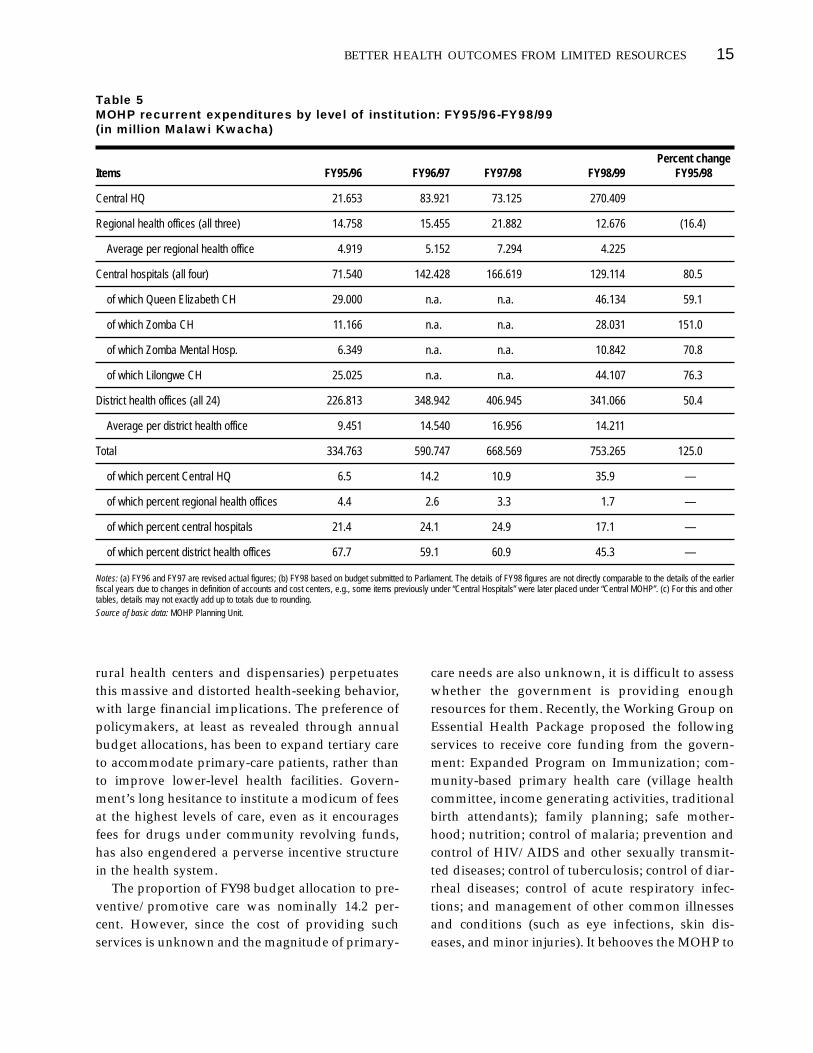
rural health centers and dispensaries) perpetuatesthis massive and distorted health-seeking behavior,with large financial implications. The preference ofpolicymakers, at least as revealed through annualbudget allocations, has been to expand tertiary careto accommodate primary-care patients, rather thanto improve lower-level health facilities. Govern-ment’s long hesitance to institute a modicum of feesat the highest levels of care, even as it encouragesfees for drugs under community revolving funds,has also engendered a perverse incentive structurein the health system.
The proportion of FY98 budget allocation to pre-ventive/promotive care was nominally 14.2 per-cent. However, since the cost of providing suchservices is unknown and the magnitude of primary-
care needs are also unknown, it is difficult to assesswhether the government is providing enoughresources for them. Recently, the Working Group onEssential Health Package proposed the followingservices to receive core funding from the govern-ment: Expanded Program on Immunization; com-munity-based primary health care (village healthcommittee, income generating activities, traditionalbirth attendants); family planning; safe mother-hood; nutrition; control of malaria; prevention andcontrol of HIV/AIDS and other sexually transmit-ted diseases; control of tuberculosis; control of diar-rheal diseases; control of acute respiratory infec-tions; and management of other common illnessesand conditions (such as eye infections, skin dis-eases, and minor injuries). It behooves the MOHP to
BETTER HEALTH OUTCOMES FROM LIMITED RESOURCES 15
Table 5MOHP recurrent expenditures by level of institution: FY95/96-FY98/99 (in million Malawi Kwacha)
Percent changeItems FY95/96 FY96/97 FY97/98 FY98/99 FY95/98
Central HQ 21.653 83.921 73.125 270.409
Regional health offices (all three) 14.758 15.455 21.882 12.676 (16.4)
Average per regional health office 4.919 5.152 7.294 4.225
Central hospitals (all four) 71.540 142.428 166.619 129.114 80.5
of which Queen Elizabeth CH 29.000 n.a. n.a. 46.134 59.1
of which Zomba CH 11.166 n.a. n.a. 28.031 151.0
of which Zomba Mental Hosp. 6.349 n.a. n.a. 10.842 70.8
of which Lilongwe CH 25.025 n.a. n.a. 44.107 76.3
District health offices (all 24) 226.813 348.942 406.945 341.066 50.4
Average per district health office 9.451 14.540 16.956 14.211
Total 334.763 590.747 668.569 753.265 125.0
of which percent Central HQ 6.5 14.2 10.9 35.9 —
of which percent regional health offices 4.4 2.6 3.3 1.7 —
of which percent central hospitals 21.4 24.1 24.9 17.1 —
of which percent district health offices 67.7 59.1 60.9 45.3 —
Notes: (a) FY96 and FY97 are revised actual figures; (b) FY98 based on budget submitted to Parliament. The details of FY98 figures are not directly comparable to the details of the earlierfiscal years due to changes in definition of accounts and cost centers, e.g., some items previously under “Central Hospitals” were later placed under “Central MOHP”. (c) For this and othertables, details may not exactly add up to totals due to rounding.
Source of basic data: MOHP Planning Unit.

fully fund these programs to avert expensive hospi-talization and thereby begin to gradually reduceallocations to the hospital sector in favor of lower-level facilities.
MOHP expenditures by economicclassification
Personal emoluments accounted for more than athird (36.9 percent) of the FY98 budget allocation(see Table 7). Personal emoluments include salaries,wages for non-established staff and temporaryemployees, and a significant amount for housingallowance.
There are no basic staffing norms (range of skillsand services to be provided at each level of care) inMalawi. As a result, the appropriate mix of healthworkers required is unknown. Analysis of theMOHP plantilla, however, shows that the majority
(51.8 percent) are low-skilled workers doing ancil-lary duties (Table 8). By its sheer number, the cost ofmaintaining such workforce must be significant.For higher-skilled workers, the vacancy rate is highdue to low salaries and the difficulty of filling staffpositions in rural areas where housing amenities areoften unavailable. Proposals have been made tobuild staff houses at regional/district offices andstudent accommodations at central hospital/train-ing institutions. A few donors are also mulling overthe possibility of providing salary supplements tohealth staff in rural areas.
The low salary of civil servants should beaddressed. In the absence of a suitable resolution,some workers may be adopting counter-productivebehavior to augment their meager salaries (atten-dance at as many workshops as possible, travelunder the guise of supervision). Though this issuehas been discussed at senior levels, a thorough-
16 AFRICA REGION HUMAN DEVELOPMENT WORKING PAPER SERIES
Table 6MOHP recurrent expenditures by level of cost center: FY98/99 (in million Malawi Kwacha)
Percent Items Coverage Amount Share
a. Preventive and Human resources, child health, nutrition, reproductive health, environmental health, 107.025 14.2promotive services communicable disease control, noncommunicable disease control, health education
b. Primary curative Human resources, patient care, special services (ambulance, mortuary), 45.844 6.1services construction/rehabilitation
c. Secondary curative Human resources, patient care, special servicess (ambulance, mortuary), hospital 191.549 25.4services management, construction/rehabilitation
d. Tertiary curative Human resources, patient care, special services (ambulance, mortuary, CSSD), 121.713 16.2services hospital management, construction/rehabilitation
e. Rehabilitative health Human resources, physio/occupational therapy, psychiatric services, prosthetic 6.259 0.8services services, home-based care
f. Health technical Human resources, lab services, radiology services, pharmaceutical services, 223.425 29.7support services physical-assets maintenance
g. Administrative and Human resources, general administration, planning and evaluation, financial 47.204 6.3technical services management, clinical services, nursing services, support to preventive services
h. Support to other Subventions and subscriptions to local and international organizations 9.840 1.3institutions
i. Population services — 0.406 Negl.
Total All 753.265 100.0
Source of basic data: MOHP Planning Unit.

going “right-sizing” of the bureaucracy is yet to beimplemented. Meanwhile, personal emoluments asa share of total MOHP expenditures continued todecline (from 39.6 percent in FY95 to 36.9 percent inFY98), reflecting the number of staff leaving thecivil service as well as those dying of AIDS andother diseases.
MOHP’s medium-term expenditure framework
In FY95, in response to the extremely tight budgetsituation, MOHP was one of the four ministries todevelop and execute a Medium-Term ExpenditureFramework (MTEF) to keep health services in linewith available budgetary resources. The aim of theMTEF exercise to help ministries prioritize the serv-ices they will provide. Despite the initial difficulties,certain positive aspects have been incorporated to
rationalize the MOHP’s budget and public expendi-ture management.
Development of sector objectives
In FY96, the Ministry conducted a logical frameworkexercise, developed sector objectives, and initiatedthe move away from incremental budgeting andtowards a more programmatic approach. On thebasis of the existing program portfolio, however, itappears that MOHP used the logframe exercise to jus-tify cramping all the existing programs within theframework, rather than to prioritize. Thus, the log-frame became an “all-inclusive” device rather than anexercise to streamline operations and do away withthe lowest priorities. According to MOHP planningstaff, the elimination of “less priority” programs wasnever discussed in the early years of the MTEF as the
BETTER HEALTH OUTCOMES FROM LIMITED RESOURCES 17
Table 7MOHP recurrent expenditures by economic classification: FY95/96-FY98/99 (in million Malawi Kwacha)
FY95/96 FY96/97 FY97/98 FY98/99 Percent changeItemsa amount percent amount percent FY95/96-FY98/99
Personal emoluments 132.402 39.6 277.808 36.9 109.8
of which administration, technical support and RHO 12.404 3.7 25.348 3.4
of which four central hospitals 39.298 11.7 66.927 8.9
of which district health offices 78.312 23.4 185.533 24.6
of which training institutionsb 2.388 0.7 .0 0.0
Goods and services 191.200 57.1 452.078 60.0 136.4
administration, technical support and RHO 14.042 4.2 243.903 32.3
of which, four central hospitals 39.504 11.8 58.866 7.8
of which, district health offices 131.615 39.3 149.309 19.8
of which, training institutionsb 6.039 1.8 .0 0.0
Capital transfers 4.651 1.4 9.840 1.3 111.6
Capital formation 6.510 1.9 13.539 1.8 108.0
Total 334.763 100.0 753.265 100.0 125.0
Notes: (a) Expenditures for the three regional offices are included under admin. & tech. support. (b) Training institutions have been made autonomous and were taken off the MOHPbudget in 1997/1998.
Source of basic data: MOH Planning Unit.

Ministry hoped that a more robust budget the nextyear could be used to protect existing programs. InFY98, the budget crisis continued but the eliminationof programs, services, and functions remained taboowithin MOHP. Given the extremely limited budgetprovided by the Ministry of Finance, the relationshipbetween the Treasury and MOHP continued to takethe form of a budget “cut and defend” approach.
New budget accounting system and classifications
Under the old/transitory accounting system, objec-tives were defined in accounting terms and tended tolump together institutions doing different things.The new accounting system attempts to lump similarinstitutions/functions based on a program; the defi-nition of cost centers also clarified financial responsi-bility. It is possible that by bringing the “Cost Center”
closer to the “Program” rather than to the “Activi-ties”, the budget accounting system may be moreperformance-oriented rather than input-oriented,but this conjecture needs to be verified by results.
MOHP also developed new program budgetclassifications in FY96 that made it relatively easierto see program priorities and were better than clas-sifications in use until FY95. The old (transitory)classifications were based on objectives thatreflected accounting inputs; the new classificationswere based on programs, that is, they unifiedaccounting functions that were similar (preventivecare, curative care). The new classifications wereconsidered more transparent.
Introduction of cash budgeting
In theory, the introduction of cash-based budgetingand lump-sum releases under MTEF should have
18 AFRICA REGION HUMAN DEVELOPMENT WORKING PAPER SERIES18 AFRICA REGION HUMAN DEVELOPMENT WORKING PAPER SERIES
Table 8MOHP staff breakdown: FY97/98
Number of Number of filled Percent to total Grade estimated posts and funded posts filled and funded posts
S1 — — —
S2/P2 9 9 0.1
S3/P3 4 4 Negl.
S4/P4 31 31 0.3
S5/P5 42 43 0.5
S6/P6 5 5 Negl.
S7/P7 68 68 0.7
S8/P8 89 89 0.9
CEO/CTO/PO/AO 335 347 3.6
D1-8 87 89 0.9
SEO/STO 361 381 4.0
EO/TO 941 824 8.7
SCO/STA 520 520 5.5
CO/TA/DP3/2 2,177 2,172 22.8
SC1-IV 4,924 4,933 51.8
Total 9,493 9,515 100.0
Source of data: Budget submission.

encouraged ministries to prioritize their spending.However, according to MOHP planning staff, thecash budgeting system may unduly create adverseincentives within MOHP to spend quickly; it alsoengenders aggressive lobbying by program man-agers and hospital directors, which can subvert allo-cations based on strategic considerations. SomeMOHP informants believe the cash-based budget-ing system preserves the status quo, and in factdoes not lead to real reallocation based on cost-effectiveness criteria. These adverse incentives areexacerbated by the fact that the members of theMOHP’s MTEF Committee (which prepares thebudget) do not also site on the Cash Budget Com-mittee (which allocates funds made available by theTreasury). Real power lies within the Cash BudgetCommittee, whose priorities do not necessarilyreflect those by the MTEF Committee.
Stopping virement
MOF has stopped all ministries from the practice ofvirement, that is, using a line item to fund expendi-tures in another line item that has been exhausted.Virement prohibition is intended to instill greaterfiscal discipline, though under very extreme finan-cial situations, virement is often used to meet emer-gencies and contingencies. The prohibition of vire-ment, while admirable in itself, can be renderedineffective by the Treasury’s and/or the CashBudget Committee’s delay of releases to specificprograms or budget items. A program could beseverely underfunded during the year if the CashBudget Committee decides to use the availablefunds for something else, even one that is of lesspriority.
Continuing challenges in the MTEF process
Given the tight budget situation, GOM cannot fullyfund all health services that it has traditionally pro-vided. It appears that the government has not takenthis to heart and is spreading its resources too thinlyby service and program area. Even under three tofour years of MTEF, MOHP’s scope of services andprograms remains broad, ranging from preven-tive/promotive programs, to basic and specialistcurative services, to such programs and funded
activities as rehabilitative care (physiotherapy andoccupational therapy, psychiatric services, andprosthetic services), cancer registry, oral health,mental health, the maintenance of high-tech equip-ment, treatment abroad, free mortuary, and trans-port of the dead.
Analysis of the past budgets under MTEF showsMOHP prefers to run most if not all of its traditionalprograms and to distribute the meager budgetacross all these programs, rather than cut away lessnecessary programs and focus on those servicesthat are justified epidemiologically, cost-effectively,and on the basis of equity. This broad rather thanfocused approach hurts all programs, poorly pro-tects cost-effective primary-care services, and leadsto the unfortunate drying up of key interventionsthat are aimed more at the poor and rural areas,such as extremely limited budgets for key interven-tions in malaria, tuberculosis, and other promo-tive/preventive services. There are also indicationsthat health services under local authorities, whichought to provide first-level contact, are far moreunderfunded than MOHP hospitals.
Macro constraints
The continuing breadth of MOHP operations, evenunder MTEF, can be explained by political, institu-tional, administrative, and technical problems thatneed to be addressed in order to realize the fruits ofbetter management of public expenditure. First,MOHP has suffered because MOF does not offi-cially announce its budget ceiling early. The lateofficial announcement of ceiling has been going onsince FY94 and was true at least until 1998/99. Itappears that the MOF finds it politically difficult toannounce the ceiling early as it will come undervery strong pressure from politicians and technicalministries lobbying for higher ceilings.
Second, the recurrent and capital developmentbudget processes have historically been bifurcated:MOF is principally involved in the recurrent budgetwhile the NEC takes care of the developmentbudget. In general, donor-funded expendituresremain reckoned within the development budget,even though much of these expenditures arerecurrent. Similarly, the Recurrent Budget thatMOHP prepares for MOF approval includes capital
BETTER HEALTH OUTCOMES FROM LIMITED RESOURCES 19

formation, which ought to be under the Develop-ment Budget. The MTEF exercise aims to consolidatethese two processes, but full consolidation remainsto be completed. Since MTEF began, heavy focus hasbeen placed on recurrent expenditures. Consolida-tion of the recurrent and development budgets isextremely important as it will show how GOM anddonor resources are being allocated and whichprograms are relatively well-funded and which arenot. Historical trends indicate GOM’s heavy biastoward curative care while donors in general focuson preventive and promotive care. A sector ex-penditure plan that lays out the anticipatedresources from both government and donors overthe next three to five years is clearly needed toinform the annual MTEF exercise. The recent unifi-cation of the Treasury and the NEC into the Ministryof Finance and Economic Planning should alsoaugur well for a more comprehensive and consistentbudgeting exercise.
Institutional and political constraints
The government and MOHP policymakers appearunable to face the budget inadequacy squarely,according to planning staff. Capital investments,especially in the hospital sector, are largely physi-cian-driven or politician-driven or sometimesdonor-driven, with the lobbying sponsor havinglittle regard for the recurrent-cost implications ofthese investments or for the alternatives for whichthe funds could be used, especially for ill-fundedpreventive/promotive health programs. A fewdonors are also prone to offer capital investmentswith little regard for their recurrent cost implica-tions, thereby forcing the government to budgetfunds to maintain this new infrastructure ratherthan use those funds for the more cost-effectiveinterventions. MOHP needs to be more aware of thecost implications of these choices, to be prepared toassess the projects that are offered, and to resistpolitical pressures to accept them. Donors shouldalso be educated on the adverse recurrent-costimpact of their capital investments. Due to the veryfragile budget situation now and in the near future,both donors and GOM ought to be extremely waryof the cost implications of even the most modestcapital investments in the sector.
To assess how the recurrent costs and counter-part funding requirements exacerbate the MOHPbudget crisis, this study calculated (a) the recurrent-cost implications of health investments, especiallyhospitals, using an R ratio – the ratio of recurrentexpenditure requirements to total investment cost –of 0.247, based on a Malawi study (Heller 1997); and(b) the required counterpart funding of donor-funded projects in the PHN sector, which is typi-cally 10-15 percent. Based on these rough calcula-tions, the implied recurrent cost requirements forMOHP capital expenditures rises threefold fromMK24.1 million in FY95 to MK74.9 million in FY97.On the other hand, based on a 12.5 percent counter-part-fund requirement, MOHP needed at leastMK40 million a year in the past three fiscal years(1995-97).
Technical constraints
The health sector’s MTEF exercise as practiced inthe late 1990s has been more “strategic”. MOHPconsulted with stakeholders (program managersand district health officials) but these consultationswere not done in the context of finalizing, budget-ing for, and implementing the draft health sectorstrategic framework. Rather, budget consultationsand cuts were made on the basis of existing pro-grams and protecting the sunk costs of existinginvestments. MOHP Planning staff admit that theso-called MTEF, in spirit and in practice, is stilllargely an incremental budgeting approach and isfar from the desired standard of budgeting on thebasis of sector objectives. The inertia of incrementalbudgeting means that the MTEF process is simply acutting-and-defending-the-budget exercise, ratherthan a means to give the GOM a way to strategi-cally plan its core functions, namely, what it shouldbe funding and providing cost-effectively toMalawians.
Limited technical data and skills hamper theMOHP from moving towards a more strategicapproach. There are no unit costs available for pro-gram costing exercises. Neither are effectiveness oroutput indicators available for programs, making itdifficult to make rational choices about health-serv-ice alternatives under alternative funding scenarios.In the absence of this information, prioritization
20 AFRICA REGION HUMAN DEVELOPMENT WORKING PAPER SERIES
becomes a matter of lobbying by program man-agers, rather than of policymakers deliberatelymaking strategic choices based on epidemiologicalneeds, cost-effectiveness, and/or equity criteria. Inaddition, there are no practical means of allocatingjoint costs across programs, for example, thesalaries of staff members involved in multiple pro-grams have not been apportioned appropriately tothose programs. Also, staff listed in one facility ordistrict may in fact be working in another facility ordistrict or in the central office.
Many of these problems can be resolved if MOHP takes a purposeful approach to devel-oping its national health strategic plan that, amongother things, (a) defines the Ministry’s role and corefunctions in health service provision and financing;(b) justifies these roles, functions and services interms of well-established economic and cost-effectiveness criteria; and (c) based on thesecriteria, explicitly sets priorities based on theresource envelope available from the governmentbudget, extra-budgetary resources, and donors’contributions.
Staff constraints
The low pay of MOHP civil servants (generallyUS$80-100 per month) spawns coping practices thathave a deleterious effect on service delivery, such aspilferage of drugs and other supplies, misuse ofvehicles, reduced time in service, absenteeism, andinformal fee charging. There are significant, albeitunquantified, inefficiencies engendered by thesepractices. More stringent controls are needed tocurb them, but the long-term solution can only bewith pay reform that is tied to civil service andsystem-wide “right-sizing”. Civil service retrench-ment can generate savings that can be used to raisethe salaries of the remaining work force, similar towhat was done in neighboring Zambia. At present,the MTEF budget protects personal emoluments,and GOM appears not yet ready for retrenchment.However, deaths from the AIDS epidemic and staffresignations due to the low salaries are depletingthe MOHP civil service. This may not be the bestapproach to MOHP right-sizing since the mostskilled – and therefore marketable – staff often leavefirst. The retraining costs of new staff are also con-
siderable, with significant impact on the MTEFbudget.
Recommendations for improved resourceallocation and use
The changes in budget titles and subprograms inthe past few years make it difficult to compare theannual consistency in government priorities. How-ever, based on principles of cost-effectiveness andthe appropriate role of the government in the healthsector, Table 9 provides a summary of recommen-dations for improved targeting and more effectiveuse of government resources. The following need tobe highlighted:
• Referral of cases abroad – These referrals costMK2.8 million in FY95/96. Under such a system,GOM self-insures by directly funding the referralhealth services of senior civil servants. The eco-nomics of this system (in terms of medical andadministrative costs, program benefits, andequity effects) compared to the alternativesystem of health insurance contracts should beanalyzed and, if feasible, contracts should beimplemented to replace direct funding.
• Mortuary services and public transport of thedead – Unlike other countries in Sub-SaharanAfrica, GOM provides free mortuary and trans-port services, a policy that has probably preventedthe development of a private-sector funeral indus-try. Mortuary and transport of dead bodies can beoperated on a full or partial cost-recovery basis, asthey are in neighboring countries.
• External travel and external traveling allowance– MOHP does not have information on howmany of these trips are necessary and how manycan be postponed or eliminated. A recent 2001government circular, however, noted this prob-lem and has specified actions to assess the levelof importance of these trips.
• Fuels and lubricants and maintenance of motorvehicles – More stringent monitoring of the trans-port fleet is needed to reduce possible theft offuels and lubricants and vehicle mismanagement.
BETTER HEALTH OUTCOMES FROM LIMITED RESOURCES 21

Better fleet management is also called for, espe-cially for vehicles separately funded by donors.
• Construction and rehabilitation – All new clinicor hospital construction should be deferred,unless adequate recurrent costs are found tooperate them over the medium-term.
• Pharmaceutical supply – Potentially large effi-ciencies can be gained from better physician pre-scription, monitoring, and fees for prescriptiondrugs. Informants cite the widespread free-drugpolicy in hospitals as the major cause of leakageof drugs to the private sector. Partial or full costrecovery is recommended.
22 AFRICA REGION HUMAN DEVELOPMENT WORKING PAPER SERIES22 AFRICA REGION HUMAN DEVELOPMENT WORKING PAPER SERIES22 AFRICA REGION HUMAN DEVELOPMENT WORKING PAPER SERIES
Table 9Recommended key actions for improved use of MOHP resources
Action Illustrative programs, services or budget items
Budget items or programs • Preventive and promotive services, primary curative services, secondary curative servicesto be protected • Disease outbreak investigation and management
• Purchase of drugs and vaccines, subject to establishment of full or partial cost-recovery program for drugsdispensed in hospitals.
• Maintenance of boreholes• Maintenance of plant and equipment• Water and sanitation• Subventions to local institutions providing preventive services promotive services
Budget items or programs • Personal emoluments (for ‘excess’ or redundant staff)to be reduced or down-scaled • External travel and allowances
• Workshops, seminars, other training• Fuels and lubricants, maintenance of motor vehicles (wastage)• Subscriptions to local and foreign institutions• Tertiary curative and rehabilitative services, in general• Administrative services deemed less necessary
Budget items or programs • All hospital construction, unless recurrent costs for their operation are assured to be deferred • Hosting of international meetings
Budget items or programs • Imposition of full cost-recovery for patients with health insurance, patients utilizing high-tech to be restructured medical services
• Imposition of full or partial cost-recovery for specialist physician consultation, prescription drugs, radiology and lab services, hospital food, mortuary services and transport of the dead.
• Ambulance services, use of operating theater, physio/occupational therapy, and prosthetic services• Contracting out of hospital preventive maintenance and other ancillary/support services • Conversion of direct-funded foreign referrals into a health insurance program, subject to copayments from
members
Budget items or programs • Referral of cases abroadto be eliminated • Cancer registry
Source of data: This study.

he country’s narrow tax base and less-than-optimistic forecast of economic growthleaves little scope for a dramatic increase in
health sector allocation in the medium-term. Thecentral government is clearly unable to afford thecontinued financing of free health care at all levelsespecially with a rapidly growing population (Mar-shall 1996). The Technical Working Group onHealth Financing, and more recently the DfID-com-missioned technical work on health financing strat-egy, have identified extra-budgetary financing asone way of alleviating the adverse impact of thefiscal crunch. The key initiatives that can be pur-sued include community drug revolving funds, fee-based hospital revenue programs, and more aggres-sive claiming of health insurance reimbursementsfrom medical aid schemes.
Drug revolving funds
About 600 villages can be tapped to establish drugrevolving funds (DRF). The World Bank providesassistance under the PHN Project for the establish-ment of DRFs operating under a 100 percent cost-recovery target. Since June 1996, one community ineach of the 10 priority districts under the PHN Pro-ject has begun DRFs and has distributed the initialstock of sulfadoxine/pyrimethamine (SP), paraceta-mol and aspirin. The village health committeesmanaging these DRFs store and dispense the drugs,keep the funds generated, and order new suppliesfrom the health centers.
Supervisory assessments of these funds indicatetheir good performance in distributing SP, paraceta-mol, aspirin, eye and skin ointments, and micronu-trients. The communities keep good records, and forthe items sold, the prices charged are far less thanpeople would otherwise pay at private shops or thehealth center (WB 1996). To expand this program,MOHP plans to provide DRF seed money, give aninitial stock of five basic drugs (anti-malarials, eyeointment, skin ointment, cotrimoxazole, and ironfortification) plus cotton wool and bandages; and toorganize and train village health committees on DRFmanagement. Funds from drug sales will be used torestock, improve physical condition of the clinics,and provide incentives to clinic staff.
The issues facing the DRF program are: (a) thefinancing, international sourcing, and replenish-ment of drug stocks once the PHN project ends;(b) the choice of drugs that will be under the revolv-ing funds, and how specific needs of communitiescan be addressed; and (c) the stalled reforms withrespect to the Central Medical Stores(CMS). Thesustainability of DRFs hinges on the availability ofdrugs, which in turn depends on the institutionaland financial sustainability of CMS.
Cost-sharing programs
Status
Government district hospitals operate generalwards and, in general, impose no fees. Discussions
4
Extra-budgetary sources of funds
T
23

on instituting user charges within government hos-pitals were at an advanced stage in the early 1990s(Rep. of Malawi 1992) but they were never part ofthe policy component of the IDA-funded PHN Pro-ject, the government never introduced. Althoughcost-sharing programs at district hospitals andhealth centers were initiated any formal fee pro-grams (though fees for drugs are being charged in afew sites). Tertiary hospitals do operate paymentwards; these cost-sharing systems are currentlybeing evaluated under a Japanese PHRD grant.
In contrast to government hospitals, CHAMfacilities have sliding-scale fees so that indigentpatients are not necessarily denied treatment (Nga-lande 1994). Each hospital has a board that decideson the modest fee schedules. Though not all healthunits have cashiers, medical assistants and nursesare trained to collect the money. Fees generated areused to purchase drugs and medical supplies.
Local-authority health facilities that receive budg-etary support from the Ministry of Local Govern-ment also charge fees. The lack of common policybetween MOHP and local-authority facilities, andbetween government hospitals and subventedCHAM hospitals, has led to an anomaly where cer-tain districts have fee programs while others do not.
Proposals
MOHP proposals call for a gradual approach ofestablishing fee programs, first at the central hospi-tals, then at the district hospitals, and finally athealth centers and clinics. The government has indi-cated that urban middle- and higher-income groupsshould bear the cost of care at government hospitals.
A cursory examination of the services provided bycentral hospitals indicates considerable scope for feerevenues (Table 10). MOHP and hospital managementneed to focus on (a) strengthening the private patients’paying scheme, which requires private patients to paythe actual cost of care received; (b) reviewing andupdating reimbursement schedules for patients withprivate health insurance coverage; and (c) costing thehospital services that are amenable to fee impositionand developing fee schedules for them (such as high-tech medical services, prescription drugs, radiologyand laboratory services, mortuary services, and phys-iotherapy and occupational therapy).
MOHP recently permitted district hospitals tointroduce cost recovery in private wings. There arealso discussions on the need to recover costs fromservices such as mortuary, ambulance, radiologicaland laboratory exams, prescription drugs, and useof amenity wards. Full cost-recovery should be pur-sued for members of medical-aid schemes and pri-vate insurance plans. Failure to do so results in anill-funded government facility subsidizing privateinsurance plans. Partial cost-sharing for other hos-pital and health-center services should be consid-ered. District hospitals should review fee schedulesand reimbursement rates to patients under medicalaid scheme or health insurance to align them withactual costs so that these patients are not undulysubsidized by the government.
Geographic or demographic targeting can pro-tect the poor from fees. Poverty studies have wellestablished the characteristics of the poor inMalawi. Poor households tend to live in rural areas,especially in dense central and southern regionsand along the Mozambican border; some live inbomas (townships); others in pockets of cities espe-cially Lilongwe. Poor households are almost alwaysheaded by someone with little or no education; thepoor also tend to have a high dependency ratio.Assuming such a cost-sharing program gets imple-mented, what is the forecast for fee revenues? TheLiverpool Associates in Tropical Health (LATH1999) developed a simple model for assessing thepotential revenue from user fees. The model’s hypo-thetical district comprised one district hospital, 12health centers, four dispensaries, and 10 healthposts. Table 11 shows five scenarios and their corre-sponding revenue uptakes (net of assumed runningcosts) for a typical district and nationwide.
Note that the most optimistic scenario (5), if donenow, yields MK 7.9 million per district (or MK 189.6million nationwide), which is equivalent to about15 percent of the recurrent expenditure budget forFY2000/01. Note also that the above scenariosexclude central hospitals (Queen Elizabeth, ZombaCentral, Zomba Mental, Lilongwe Central, andmost recently Mzuzu Central), some of which havelarger revenue potential than lower-level facilities.The above figures, therefore, should be viewed aslower-bound estimates for potential user-fee rev-enues of the entire government health system.
24 AFRICA REGION HUMAN DEVELOPMENT WORKING PAPER SERIES

BETTER HEALTH OUTCOMES FROM LIMITED RESOURCES 25
Table 10Recommended restructuring of selected hospital services in Malawi
Services Remarks Proposed restructuring
Patients with medical aid scheme With ability to pay Subject to full cost-recovery or health insurance coverage
Private patients paying scheme With ability to pay Subject to full or partial cost-recovery in amenity wards
High-tech medical services Expensive and probably socially Subject to full cost-recovery (CT-scan, dialysis, etc.) cost-ineffective
Specialist physician consultation Fee basis in most countries Subject to full or partial cost-recovery
Pharmaceutical supply Fee basis for prescription drugs in Subject to full cost-recovery; reduce wastage through most countries treatment protocols, drug registers, much-improved
monitoring, and physician education; reorganize intoHospital Drug Capitalization Program
Radiology and lab services Fee basis in most countries Subject to full or partial cost-recovery
Food provision Included in the per-diem cost in Reduce theft and wastage; subject to cost recovery; most countries provide alternative cooking facilities
Mortuary services Private business in most countries Subject to full or partial cost-recovery (funeral parlor)
Transport of the dead Private business in most countries Subject to full or partial cost-recovery (funeral parlor)
Ambulance services Fee basis in most countries Reduce abuse of transport; subject to full or partial cost-recovery
Use of operating theater Fee basis in most countries Subject to full or partial cost-recovery
Preventive maintenance, electromedical On contractual arrangement in Contract out engineering and physical asset many countries management
Physio/occupational therapy Fee basis in most countries Subject to full or partial cost-recovery
Prosthetic services Private business in most countries Privatize or subject to full or partial cost-recovery
Source: This study.
Table 11Estimated revenues from cost-sharing program based on alternative scenarios
Revenue yield Revenue yield Revenue yield nationwide nationwide
per district (@ 24 districts (in US$ millionScenarios (in MK m) in MK m) @US$1=MK43)
Scenario 1: strengthening OPD1 and private amenity wings MK 1.4 m MK 33.6 m US$ 0.78 m
Scenario 2: nominal fee and extended exemptions MK 3.0 m MK 72.0 m US$ 1.67 m
Scenario 3: nominal fee and limited exemptions MK 4.3 m MK 103.2 m US$ 2.40 m
Scenario 4: higher fee and extended exemptions MK 5.3 m MK 127.2 m US$ 2.96 m
Scenario 5: still higher fees and extended exemptions MK 7.9 m MK 189.6 m US$ 4.41 m
Source: LATH, 1999.

Mission/CHAM facilities
ongovernmental organizations (NGOs)play a critical role in Malawi’s health sector.Mission facilities, most of which are organ-
ized under the Christian Hospital Association ofMalawi (CHAM), are the largest group, accountingfor 19 percent of all facilities, 38 percent of beds, and10 percent of outpatient visits (Table 12). Most ofthese church-sponsored health institutions predatethe government health system and provide trainingfor nurses and other health personnel. Thoughorganized as a network, CHAM facilities operateautonomously. Hospital finances, including fee rev-
enues, are managed by independent committees;fee schedules are made at the local level.
In districts where there are no government hos-pitals, CHAM facilities may be designated to fulfilltheir functions. These district-designated CHAMhospitals receive financial support (subvention)from the Ministry of Finance covering most of theirsalary costs. CHAM subventions dramaticallyincreased from MK4.6 million in FY90/91 toMK22.2 in FY94/95, but the budget support pro-gram dried up the following year due to the fiscalcrisis. In the mid-1990s, CHAM facilities claimedthat 42.0 percent of their operating funds come fromsubvention grants, 25.5 percent from donations, and
5
Private healthexpenditures
N
26
Table 12Health service providers in Malawi: mid-1990s
Number of outpatient Type of provider Number of facilities Number of beds visits per year (millions)
MOHP 339 8,156 15.8
of which Queen Elizabeth CH 1 1,057 About 0.4
of which Lilongwe CH 1 700 About 0.4
Local governments 65 493 0.5
Missions/CHAM 164 5,648 2.1
For-profit providers and nonprofit NGOs 282 596 2.6
Total 850 14,893 21.1
Source: GOM and MOHP, Basic Health Statistics 1994.

32.5 percent from fees, sale of drugs, and otherinternally generated revenues.
All CHAM facilities charge fees. District-desig-nated CHAM hospitals have private wings thatgenerate revenues. Patients in general wards alsopay but at a much-reduced rate. Fees are paid incash though in-kind payments are also accepted.CHAM waives payment only in exceptional cases.The larger hospitals have written criteria and regu-lations on who can be waived or exempted, butthese are not very transparent in smaller facilities. Astudy on outpatient paying patterns commissionedby UNICEF in 1995 indicates that 95 percent of allCHAM patients pay treatment fees, 19 percent payassociated health-service fees, and 22 percent payfor transport costs. In contrast, only a negligiblepercentage of MOHP patients pay treatment fees,only 12 percent pay associated health service fees,and only 9 percent pay for transport costs. CHAMfees are modest: a typical patient in 1995 paid MK1for an access ticket, MK6 for medicines, MK2 forconsultation, and MK 2 for lab exams.
CHAM facilities receive donations (in cash or inkind, such as, medical equipment and supplies).Expenditures on expatriate health workers and reli-gious orders are unknown.
Private for-profit health providers
Private estates and corporations, especially those infar-flung areas, usually provide on-site health serv-ices to employees, their dependents, and sometimesnon-employees and non-dependents. The NchimaPlantation, for instance, operates a clinic staffedwith five nurses and one medical assistant and sup-plied with drugs from the UK, courtesy of theNchima Trust. The clinic charges token fees, whichare fixed for a course of treatment or service (MK25for deliveries; MK2 for pediatric treatment; MK10for adult confinement; and MK5 for child confine-ment). GOM should encourage private estates andcorporations that do not currently provide healthservices to their employees and their dependents toset up such services. In spite of serious limitationsin the public sector, there is very little discussion ofthe role of these in-plant health services.
Since GOM allowed private medical practice in1991, the for-profit sector has dramatically ex-
panded. As of the end of 1996, the Registry ofHealth Professionals listed 23 medical practitionersand seven dentists, all practicing in cities and largetowns; 60 medical assistants; 30 clinical officers; 67registered premises for private practice; and 19licensed specialists, medical practitioners, and den-tists in part-time practice. New regulations alsomade it possible for government health workers(doctors and medical officers) to have second jobsas private practitioners. As a result, moonlightinggovernment doctors have shown up in cities andmoonlighting paramedics in periurban areas. Drugshops are also a convenient source not only of phar-maceuticals but sometimes of medical advice. TheCollege of Medicine graduates 20 doctors a year (96have graduated since it opened in 1991), and theprivatization of the medical sector could boost itsoutput. So far, there has been no evaluation of howthis liberalization of the health sector has affectedhealth-service access, equity, or quality of care.
Traditional healers are well-established, chargingas much as MK10-25 for eye problems, MK40-100for pneumonia cases, and MK60 for common ill-nesses. An estimated 13,000 traditional healerspractice in rural and urban areas. Some of themreport seeing as many as 200 patients a month; atMK60 per patient, this patient volume translates toMK12,000 in fees collected a month, more than thesalary of government doctors.
Health insurance
The slow structural transformation of the economyand a narrow base of formal employment constrainthe development of social/compulsory or private/voluntary health insurance in Malawi. Neverthe-less, unlike its neighbors Zambia (which made pri-vate health insurance illegal in the 1970s) and Tan-zania (which followed a socialist path for much ofits history), Malawi has a small established privatehealth insurance industry.
The self-insuring agencies operate their ownhealth insurance schemes – Federal Reserve Bank,the Post Office, National Bank, Inde Bank, Admarc,Levy Brothers, etc. The government encouragesparastatals to establish health insurance and med-ical aid schemes for their employees. All parastatalscurrently have some form of health insurance for
BETTER HEALTH OUTCOMES FROM LIMITED RESOURCES 27

senior staff, while a number operate clinics forjunior staff. Scant information exists on the organi-zation of these schemes, their number, coverage,benefit packages, or utilization patterns.
The Medical Aid Society of Malawi (MASM) is asubsidiary of the National Insurance Co. and wasestablished in 1983 as a nonprofit organization underthe Trustees Incorporation Act. MASM provideshealth insurance coverage to employees (and de-pendents) of large companies and better-off self-em-ployed professionals. Contribution rates of employeesand employers vary by company, but the benefitpackages are standardized as shown in Table 13.
MASM’s operating indicators are shown in Table14. Though the membership base remains small, it is
a profitable enterprise and expects market expan-sion. Recent and prospective activities include:(a) Acquisition a 15 percent share in the MwaiwathuHospital, probably the most modern hospital inMalawi, and (b) the plan to establish its own phar-macy, actions that will make MASM evolve towardsa managed-care setup. Further, the self-insured com-panies have asked MASM to manage their schemes,in effect making MASM an “administrative servicesonly” contractor to these schemes.
Moral hazard is a major issue facing MASM andother private insurance schemes in Malawi. Con-tracted private providers tend to over-use laborato-ries and x-rays, over-treat through prolonged con-finement, and over-prescribe drugs. This problem
28 AFRICA REGION HUMAN DEVELOPMENT WORKING PAPER SERIES
Table 13Benefits and contribution rates of different types of health insurance plans offered by theMedical Aid Society of Malawi
Type of health Illustrative insurance plan Benefits contribution rates
Basic • 100 percent of the cost of inpatient confinement in government and CHAM hospitals. MK26/person/month
General • 100 percent of the cost of inpatient confinement in government and CHAM hospitals; MK106/person/month 80 percent if in private hospital.
• 100 percent of cost of outpatient consultations + 80 percent of cost of drugs.
Extended • 100 percent of the cost of inpatient confinement in government, CHAM, and private hospitals. MK350/person/month• 100 percent of cost of outpatient consultations + 90 percent of cost of drugs.• 50 percent of the cost of inpatient confinement abroad (South Africa and Zimbabwe),
with a cap of MK100,000 per member.
Source of data: MASM.
Table 14Operating indicators of the Medical Aid Society of Malawi: 1993/94-1996/97
Items 1993/94 1994/95 1995/96 1996/97
Estimated membership (including family members) 16,000 17,000 18,000 20,500
Contributions (MK Mn) 20.50 30.11 40.55 42.47
Domestic claims (MK Mn) 15.44 25.54 30.40 34.46
Foreign claims (MK Mn) 1.38 3.00 0.58 1.47
Administrative costs (MK Mn) 3.87 4.61 5.15 5.60
Income (MK Mn) — — 6.70 4.60
Number of staff 15 17 19 20
Source of data: MASM.

encouraged MASM to take greater control of the pro-vision of care through direct equity investments in ahospital and a pharmacy.
The second major problem has to do with AIDS.Insurance contracts exclude AIDS care, but to avoidlosing clients, MASM currently does not strictlyenforce this clause. This approach can continue aslong as AIDS patients do not demand the expensivecocktail of AIDS drugs available in Western coun-tries. As soon as they make such demands, the pre-mium rates will have to be adjusted to such animpossibly high rate that private health insurancemay become unviable, throwing such patients backinto the ill-funded government system. This is acritical issue that GOM must tackle.
Fiscal difficulties have triggered proposals toexplore social health insurance for the formallyemployed, but Malawi’s National Health Plan pro-vides no specific actions to pursue it.
Household health expenditures
Table 15 shows indicators of annualized householdhealth expenditures based on a survey of one-month expenditures conducted in 1990-91. Theexpenditure pattern reflects the geographic patternof income and wealth (as well as the presence ofproviders), with urban households spending 6.5times as much as rural households on health serv-ices. The Blantyre figures are remarkably high, witha typical household spending MK107 (or US$40) onhealth care a year, in contrast to a typical ruralhousehold which spends only MK8-12 (US$3-5) ayear. Rural household underspending can be allevi-ated with more intensive public spending, but thetrend in MOHP expenditures does not point in thisdirection.
In March 1995, UNICEF conducted anothersurvey (Table 16) showing the persistence of rural
BETTER HEALTH OUTCOMES FROM LIMITED RESOURCES 29
Table 15Annual household health expenditures in Malawi: 1990-91 (in Malawi Kwacha)
Doctor Dental Fees forand and paramedical Pharma- Other Health
Hospital hospital optical and traditional ceutical medical insurance Location fees OPD fees fees healers expenses expenses contributions Total
Blantyre City 28.32 48.60 7.56 5.88 12.24 0.84 3.60 107.04
Lilongwe City 0.24 23.64 0.00 4.32 12.00 0.24 14.16 54.60
Zomba Municipality 1.92 22.68 24.60 5.40 16.44 0.60 0.00 71.64
Mzuzu City 5.76 24.00 0.60 5.28 15.36 0.84 2.52 54.36
Unweighted average for urban 9.06 29.73 8.19 5.22 14.01 0.63 20.28 71.91
South, rural 0.24 3.00 0.12 1.80 2.76 0.00 0.00 7.92
Central, rural 0.48 4.80 0.12 2.88 4.44 0.12 0.36 13.20
North, rural 0.12 1.08 0.12 3.12 7.68 0.00 0.00 12.12
Unweighted average for rural 0.28 2.96 0.12 2.60 4.96 0.04 0.12 11.08
Unweighted average for all 4.67 16.35 4.16 3.91 9.49 0.34 10.20 41.50
Note: Annualized from reported monthly figures.
Memo item: The exchange rate to the US$ was MK2.7 in 1990 and MK2.8 in 1991.
Source of basic data: National Statistics Office, 1994.

households’ underspending on health services(MK180 a year) relative to urban households(MK720 a year). Analysis of survey results also indi-cates the degree of leakage and undercoverage offee programs in Malawi. At the national level, asmuch as 61 percent of nonpoor households gethealth services without paying (leakage) while asmuch as 43 percent of poor households end uppaying (undercoverage). Thus, many householdswith capacity to pay for health services are free-loading while just as many households with scant
means are paying for care. These findings stronglyindicate the need to sharpen the focus of fee pro-grams (imposing fees on free-care urban facilitieswhere those with capacity to pay are mostlylocated) and to establish clearer waiver and exemp-tion systems in both urban and rural facilities. Thesurvey did not disaggregate respondents by thetype of facility used (MOHP, CHAM, local authori-ties, private for profit), making it difficult to recom-mend institution-specific reforms.
30 AFRICA REGION HUMAN DEVELOPMENT WORKING PAPER SERIES
Table 16Reported paying patterns of poor and nonpoor households for health services,by urban and rural location: 1995
Income status Reported poor Reported nonpoor
Geographic location National Urban Rural National Urban Rural
Percent of households reported not paying 47 percent 58 percent 56 percent 61 percent 47 percent 63 percent
Percent of households reported paying 43 percent 42 percent 44 percent 39 percent 53 percent 37 percent
Average monthly MK 12 MK 31 MK 9 MK 23 MK 60 MK 15(Annual) amount paid (MK 144) (MK 372) (MK 108) (MK 276) (MK 720) (MK 180)by paying households
Memo item: The exchange rate to the US$ was MK15.3 in 1995.
Source of basic data: UNICEF, March 1995.

alawi hosts five bilateral and eight multi-lateral donors in the health sector.1 FromFY94-FY97, these had an aggregate coun-
try allocation of around US$1.4 billion (or aroundUS$350 million a year), of which 19 percent wasallocated to health. In terms of sector allocation,health was eclipsed only by “economic-manage-
ment”, which garnered 21 percent of total donorallocation during the period. Education and humanresources took 15 percent, and agriculture, 14 per-cent. The respective percentage shares of the rest ofthe sectors (natural resources, transport, energy,social development, and so on) were less than 6 per-cent each.
6
Donor financing andexpenditures
M
31
Table 17Donors’ health sector allocations and expenditures in Malawi: FY94/95–FY97/98
Percent changeItems FY94/95 FY95/96 FY96/97 FY97/98 FY94-FY97
Donors’ country budget allocation (US$ m) 319.3 376.0 331.9 375.6 17.6
Donors’ actual expenditures (US$ m) 259.5 307.0 262.2 349.2 34.6
Donors’ health sector allocation (US$ m) 50.4 57.1 72.3 86.0 70.6
Donors’ health sector expenditures (US$ m) 28.2 35.7 50.0 47.1 67.0
Percentage of health sector allocation to total allocation 15.8 15.2 21.8 22.9 .—
Percentage of health sector expenditure to total expenditure 10.9 11.7 19.1 13.5 .—
Population of Malawi (m) 10.25 10.57 10.91 11.24 9.7
Donors’ health sector expenditures per capita (US$) 2.58 3.38 4.58 4.19 62.4
Note: Donors have varying fiscal years: (a) Jan. 1-Dec. 31 – GTZ, EU, UNAIDS, UNDP, UNFPA, UNICEF, WFP, and WHO; (b) Apr. 1-Mar. 31 - CIDA, DfID, JICA, IDA; (c) Oct. 1-Sept. 30 -USAID. No attempt was made in this study to transform the original responses to conform with the Government of Malawi’s fiscal year.
Source of basic data: Survey of donors.

Allocation vs. expenditures
Donors’ allocation to health dramatically increasedfrom 15.8 percent in FY94 to 22.9 percent in FY97(Table 17), reflecting their collective commitment tothe sector. By FY97, the share of health expendituresto total donor expenditures had reached 13.5 per-cent. The level and pace of donor health expendi-tures far exceeded population growth so that percapita donor health expenditures rose markedlyover the four-year period to reach US$4.19 in FY97,after peaking at US$4.58 in FY96. It is largely duethis increased donor-funding of the sector that total
per capita health expenditures in Malawi have notdeclined in the face of drastic reduction of govern-ment health spending.
The multilateral agencies (IDA, UNAIDS,UNFPA, UNICEF, the World Food Program, WHO,and the European Union) account for around 48.4percent of donor allocations in the health sector; thebilateral donors (CIDA, DfID, GTZ, JICA, USAID)contribute the remaining 51.6 percent. In all, thereare 34 discrete projects currently implemented bydonors (Table 18). The projects vary in size, thebiggest ones being DfID’s Malawi ReproductiveHealth Project; EU’s Health Reform and Decentral-
32 AFRICA REGION HUMAN DEVELOPMENT WORKING PAPER SERIES
Table 18Budget allocation and expenditures of donor projects: as of end-FY97/98 (in thousand U.S. dollars)
Donor/project name Life of project* Budget allocation Expenditures to date
CIDA
Family health project 4/96-3/98 1,032 1,032
Social sector grant 4/96-3/97 1,845 1,845
Southern Africa AIDS training 5/97-12/97 143 143
DfID
Contraceptive supply and reproductive health 7/93-12/97 1,416 1,369
Anesthetic training and support 10/93-3/98 700 692
Technical assistance to health sector reform 8/94-7/98 600 564
Malawi reproductive health project 9/94-3/01 16,518 6,912
Support to national AIDS coordination program 7/95-12/97 404 384
Interim contraceptive supply project 8/96-12/97 1,180 972
Support to national tuberculosis control program 8/97-7/99 1,771 1,055
European Union
Rural health program (building and equipment) 12/87-n.d. 8,882 7,078
STD prevention project 1/93-n.d. 1,104 995
Health sector project identification 8/94-n.d. 170 162
Technical assistance to MOHP 10/96-n.d. 481 108
Health reform and decentralization 10/96-n.d. 17,211 76
HIV/AIDS prevention 7/97-n.d. 718 0
Table 18 continues on next page

BETTER HEALTH OUTCOMES FROM LIMITED RESOURCES 33
Table 18 (continued)
Donor/project name Life of project* Budget allocation Expenditures to date
GTZ
Strengthening of Machinga district health services 1991-2000 12,000 8,521
Strengthening of Zomba district health services 1997-2000 2,000 0
JICA
Community health science project 1994-1999 3,500 3,500
USAID
PHICS 6/89-12/98 23,493 15,550
STAFH project 9/92-9/98 45,000 17,685
CHAPS project 9/95-9/00 15,000 53
COPE 1 project 7/95-9/97 539 538
IDA
PHN project 1991-1999 55,500 23,000
UNAIDS
Assistance to national AIDS control program 1/96-1/98 289 154
UNDP
Health component 1/93-12/98 980 980
UNFPA
Census: basic data collection 1992-2001 1,743 912
Demography training 1992-2001 849 512
Population policy 1992-2001 2,658 1,605
Family planning 1992-2001 9,355 5,974
IEC 1992-2001 5,213 3,985
UNICEF
Country program in health n.a. 3,732 3,732
World Food Program
Vulnerable group feeding 1996-1998 10,161 5,305
WHO
Technical cooperation 1997-1998 300 300
Total — 246,484 115,693
* Months of initiation and termination of projects given when known.
Source of basic data: Survey of donors.

ization Project; GTZ’s strengthening of districthealth services in Machinga and Zomba; USAID’sPHICS, STAFH, and CHAPS Projects; IDA’s PHNProject; and WFP’s Vulnerable Group FeedingProject.
Project pipeline
An analysis of the lives of these projects indicatesthat most of them were planned to end within FY98or in the next two fiscal years. However, due to theslower-than-planned disbursement rates, it is likelythat they will be extended beyond their currentclosing dates. To date, the ongoing projects havecollectively expended only US$115.7 million, or 46.9percent of the aggregate budget allocation ofUS$246.5 million. In the period FY94-FY97, donorswere able to spend only an average of 60.5 percentof their annual health sector allocation (Table 19).
For existing projects with closing dates beyondFY97, we calculated expected disbursements for FY98to FY01, and the results are shown in Table 20. Theanalysis shows that even under the most optimisticmanagement scenarios, there will be significantamounts of already-committed donor resources to bedisbursed: US$72.5 million in FY98, US$32.3 millionin FY99, US$15.5 million in FY00, and US$10.5 millionin FY01. Given the projects now in the pipeline, aswell as major projects being considered, designed, ornegotiated (such as those of DfID, IDA, JICA,USAID), the government and its donor-partnersshould begin serious discussions about how donorhealth expenditures can be expedited, especially inlight of the very tight government fiscal situation nowand in the foreseeable future. Donor resources shouldcome in handy during a budgetary crunch, but unlessthe government’s capacity to absorb and donors’ ownability to disburse are addressed, donor resourcesmay not be able to quickly cushion the impact of gov-ernment underspending in health.
The following issues hindering faster disburse-ments need to be addressed:
• GOM’s constrained ability to meet counterpartfunding requirements.
• Administrative bottlenecks at central MOHPHQ, especially the absence of signatories. Appro-
priate delegation authorities within governmentneed to be established for officials who are away.
• Slow compliance with legal, policy, program, oradministrative requirements and conditions fordisbursement.
• Weak capacity to manage and follow up requiredactions for donor funds to flow or for procure-ment to proceed; loose coordination between theMOHP, Ministry of Finance, and local govern-ments; miscommunication between donors andgovernment or NGO counterparts.
• Time-consuming and possibly onerous procure-ment procedures, lack of understanding of theseprocedures, or lack of qualified staff knowledge-able in these procedures.
• The sheer number of projects and activities – 34at present – that overburdens the alreadystrained capacity at central MOHP HQ.
Health service focus of donor projects
Donor projects focus principally on primary, pre-ventive, and promotive care. As Table 21 shows, 64.7percent of the total number of projects, 84.2 percentof their budgets, and 87.3 percent of their expendi-tures to date are oriented to primary health services.The most frequently cited objectives of these projectsare prevention of HIV/AIDS and other sexuallytransmitted infections, family planning, familyhealth, and central- and district-level support to pri-mary care interventions. In recent years, malaria andtuberculosis have received increasing focus.
Uses of donor resources
Donor response to the survey on the use of theirhealth expenditures was poor; as a result, as muchas a third of the recurrent and 7 percent of the capi-tal expenditures cannot be classified. Of their totalhealth expenditures in FY96 and FY97, donorsclaimed that around 87 percent were for recurrentand around 13 percent were for capital expenditures(Table 22). Thus, even though donor-funded projectsare reported in the Development Account of the
34 AFRICA REGION HUMAN DEVELOPMENT WORKING PAPER SERIES

BETTER HEALTH OUTCOMES FROM LIMITED RESOURCES 35
Table 19Donors’ budget allocation and expenditures in the health sector in Malawi: FY94/95-FY97/98 (in thousand U.S. dollars)
Annual averageDonors FY94/95 FY95/96 FY96/97 FY97/98 FY94-FY97
Budget allocation
CIDA 1,923 1,923 3,778 3,778 2,851
DfID 4,768 4,768 3,263 4,000 4,200
EU 9,572 9,572 27,520 28,560 18,806
GTZ 4,000 4,500 1,667 2,520 3,172
JICA 2,510 3,260 3,610 3,971 3,338
USAID 7,085 11,547 9,573 12,826 10,258
IDA 11,000 11,000 11,000 17,700 12,675
UNAIDS 0 0 69 220 72
UNDP 113 77 191 240 155
UNFPA 1,478 2,546 3,288 3,785 2,774
UNICEF 4,050 4.050 4,050 4,050 4,050
WFP 2,963 2,963 3,387 3,387 3,175
WHO 920 920 920 920 920
Total 50,383 57,126 72,316 85,956 66,445
Estimated expenditures
CIDA 1,923 1,923 3,778 3,778 2,851
DfID 1,716 1,716 2,542 2,900 2,219
EU 5,955 6,341 7,400 8,385 7,020
GTZ 2,000 2,500 2,000 2,000 2,125
JICA 2,510 3,260 3,610 3,971 3,338
USAID 2,878 5,103 6,731 9,277 5,997
IDA 2,300 4,770 12,633 5,827 6,383
UNAIDS 0 0 35 118 38
UNDP 113 77 191 240 155
UNFPA 1,478 2,546 3,288 3,784 2,774
UNICEF 3,732 3,732 3,732 3,732 3,732
WFP 2,593 2,770 3,177 2,128 2,667
WHO 920 920 920 920 920
Total 28,118 35,658 50,037 47,060 40,218
Ratio of annual expenditures to budget allocation (percent) 55.8 62.4 69.2 54.7 60.5
Source of basic data: Survey of donors.

government budget, most of these are really recur-rent rather than capital investment expenditures.
Of the US$43.6 million recurrent expenditures inFY96, as much as 16.6 percent was provided by sixdonors as departmental support to the MOHP, proj-
ect monitoring units, vertical disease programs(AIDS, tuberculosis, primary health care), ruralhealth units, and the Queen Elizabeth Hospital. Thelevel of this direct departmental and administrativesupport was maintained in FY97, and two more ver-
36 AFRICA REGION HUMAN DEVELOPMENT WORKING PAPER SERIES
Table 21Donor projects by health service focus in Malawi: as of end-FY97/98 (in thousand U.S. dollars)
Number of Percentage Expenditures Percentage of Health service focus projects Total budget of budget to date expenditures
Primary, preventive and promotive care 22 207,605 84.2 101,021 87.3
Basic curative care/district health services 2 14,000 5.7 8,521 7.4
Tertiary care 1 700 0.3 692 0.6
Health reform, decentralization, census,technical cooperation not classifiedelsewhere, and other activities 9 24,179 9.8 5,459 4.7
Total 34 246,484 100.0 115,693 100.0
Source of basic data: Survey of donors.
Table 20Pipeline analysis of major donor projects in the health sector in Malawi: FY98/99-FY01/02 (in million U.S. dollars)
Donor/project Closing date* Pipeline to date FY98/99 FY99/00 FY00/01 FY01/ 02
DfID’s Malawi reproductive health project 3/01 9.6 2.4 2.4 2.4 2.4
DfID’s other projects 1999 1.0 .5 .5 — —
EU’s health reform and decentralization project 2001 17.1 4.3 4.3 4.3 4.3
EU’s other projects 2001 3.0 .8 .8 .8 .8
GTZ’s strengthening of Machinga and Zomba district health services 2001 5.4 1.4 1.4 1.4 1.4
USAID’s PHICS project 12/98 7.9 7.9 — —- —
USAID’s STAFH project 9/98 27.3 27.3 — — —
USAID’s CHAPS project 9/00 14.9 5.0 5.0 5.0 —
IDA’s PHN project 1999 32.5 16.3 16.3 — —
UNAIDS’s assistance to NACP 11/98 .1 .1 — — —
UNFPA’s four population-related projects 2001 6.8 1.7 1.7 1.7 1.7
WFP’s vulnerable group feeding project 1998 4.9 4.9 — — —
Total — 130.8 72.5 32.3 15.5 10.5
* Month of termination given when known.Source of basic data: Survey of donors.
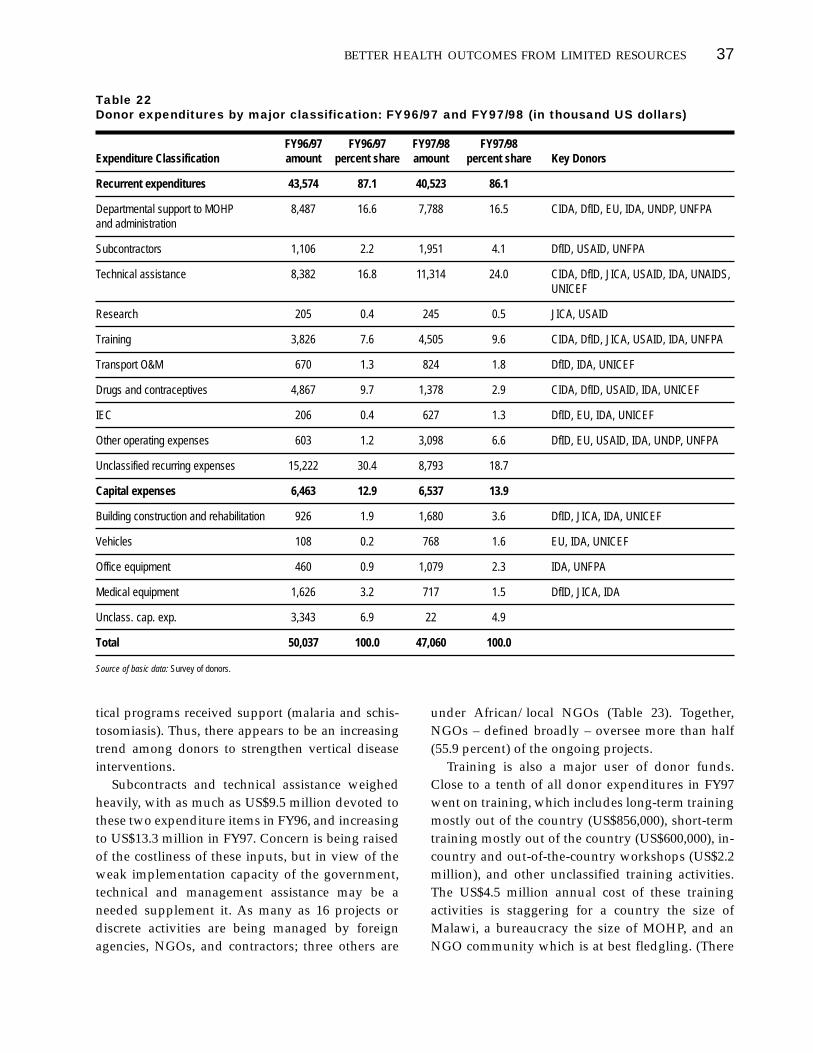
tical programs received support (malaria and schis-tosomiasis). Thus, there appears to be an increasingtrend among donors to strengthen vertical diseaseinterventions.
Subcontracts and technical assistance weighedheavily, with as much as US$9.5 million devoted tothese two expenditure items in FY96, and increasingto US$13.3 million in FY97. Concern is being raisedof the costliness of these inputs, but in view of theweak implementation capacity of the government,technical and management assistance may be aneeded supplement it. As many as 16 projects ordiscrete activities are being managed by foreignagencies, NGOs, and contractors; three others are
under African/local NGOs (Table 23). Together,NGOs – defined broadly – oversee more than half(55.9 percent) of the ongoing projects.
Training is also a major user of donor funds.Close to a tenth of all donor expenditures in FY97went on training, which includes long-term trainingmostly out of the country (US$856,000), short-termtraining mostly out of the country (US$600,000), in-country and out-of-the-country workshops (US$2.2million), and other unclassified training activities.The US$4.5 million annual cost of these trainingactivities is staggering for a country the size ofMalawi, a bureaucracy the size of MOHP, and anNGO community which is at best fledgling. (There
BETTER HEALTH OUTCOMES FROM LIMITED RESOURCES 37
Table 22Donor expenditures by major classification: FY96/97 and FY97/98 (in thousand US dollars)
FY96/97 FY96/97 FY97/98 FY97/98 Expenditure Classification amount percent share amount percent share Key Donors
Recurrent expenditures 43,574 87.1 40,523 86.1
Departmental support to MOHP 8,487 16.6 7,788 16.5 CIDA, DfID, EU, IDA, UNDP, UNFPAand administration
Subcontractors 1,106 2.2 1,951 4.1 DfID, USAID, UNFPA
Technical assistance 8,382 16.8 11,314 24.0 CIDA, DfID, JICA, USAID, IDA, UNAIDS,UNICEF
Research 205 0.4 245 0.5 JICA, USAID
Training 3,826 7.6 4,505 9.6 CIDA, DfID, JICA, USAID, IDA, UNFPA
Transport O&M 670 1.3 824 1.8 DfID, IDA, UNICEF
Drugs and contraceptives 4,867 9.7 1,378 2.9 CIDA, DfID, USAID, IDA, UNICEF
IEC 206 0.4 627 1.3 DfID, EU, IDA, UNICEF
Other operating expenses 603 1.2 3,098 6.6 DfID, EU, USAID, IDA, UNDP, UNFPA
Unclassified recurring expenses 15,222 30.4 8,793 18.7
Capital expenses 6,463 12.9 6,537 13.9
Building construction and rehabilitation 926 1.9 1,680 3.6 DfID, JICA, IDA, UNICEF
Vehicles 108 0.2 768 1.6 EU, IDA, UNICEF
Office equipment 460 0.9 1,079 2.3 IDA, UNFPA
Medical equipment 1,626 3.2 717 1.5 DfID, JICA, IDA
Unclass. cap. exp. 3,343 6.9 22 4.9
Total 50,037 100.0 47,060 100.0
Source of basic data: Survey of donors.

is also a separate line item for training in the MOHPbudget, in addition to the donor-funded trainingexpenditures; in addition, around 15 percent ofdonor allocations are for a separate HumanResources item, apart from these health-dedicatedtraining programs).
The continued sponsorship of these training pro-grams in the absence of a human-resource develop-ment plan in the MOHP and in the NGO commu-nity, as well as the absence of any mechanism tomeasure the impact of these programs on healthservice delivery, is a serious concern. It is commonknowledge that these training programs providestrong financial and other incentives to participants.If the objective of these training programs is implic-itly to reward civil servants, a better mechanism –
using the same level of resources – would be forsponsoring donors to provide these as direct salarysupplements. The US$4.5 million would translate toUS$473 salary increase for one year for each of the9,500 civil servants (about US$40 per month, or 50percent of the US$80 monthly salary of a typicalcivil servant). Salary supplements would probablyhave a more visible impact on health service deliv-ery compared to training, which takes serviceproviders away from their respective posts, some-times for prolonged and recurrent periods. (In thisregard, the greater use of on-site training programsis called for.)
Geographic distribution of donor projects
Absence of data precludes proper analysis of thegeographic distribution of donor-funded projects.The donor survey, however, yielded the followingillustrative information: Of the 34 donor-fundedprojects, 23 have nationwide application. Twelvedistricts host two or more donor-funded projectswhile six districts have at least one project each. Sixdistricts, however, do not host a single donor-funded project (their access to donor-funded activi-ties is limited to those donor projects that are nation-wide in application). Donors are prone to locate inrelatively nicer districts; it is also these districts thathave multiple donor projects: Mangochi, five proj-ects; Salima, four; Blantyre, two; Lilongwe, two;
38 AFRICA REGION HUMAN DEVELOPMENT WORKING PAPER SERIES
Table 23Implementing agencies of donor projects inMalawi: as of end-FY97/98
Number of Type of agency Implementing agency projects
National College of Medicine 1government District health offices 3agencies Family health unit 2
MOHP 210Ministry of Local Government 1Ministry of Works 1Nat’l AIDS Control Program 3Nat’l Statistics Office 2Nat’l Tuberculosis Control Program 1Population Unit 3
African/local Africare 1NGOs Banja la Mtsogolo 1
CHISU 1
Foreign agencies, Canadian Public Health Assn. 2NGOs, and Centers for Disease Control 1contractors Project HOPE 2
International Eye Foundation 2International Labour Org. 1John Snow, Inc. 1Marie Stopes International 1Population Services Int’l 2Save the Children (UK) 1Save the Children (US) 3
Total no. of projects/discrete activities 343
Note: Total does not tally with details due to double-counting, especially of MOHPinvolvement.
Source of basic data: Survey of donors.
Table 24District location of donor projects in Malawi:as of end-FY97/98
Type of Number of district Names of districts districts
Districts with Mangochi (5 projects), Salima (4), 12two or more Mzimba (4) Chikwawa (3), Kasungu (3),donor health Mulanje (3), Blantyre (2), Dowa (2), projects Lilongwe (2), Mwanza (2), Thyolo (2),
and Zomba (2)
Districts with Chiradzulu, Dedza, Karonga, Machinga, 6one donor Mchinji, and Rumphi health project
Districts with no Nsanje, Ntcheu, Nkhotakota, Ntchisi, 6donor health Nkhata Bay, and Chitipaprojects
Total 24
Zomba, two (See Table 24). Donors have much lesstendency to locate in the northern and/or fartherdistricts (such as Nkhotakota, Ntchisi, Nkhata Bay,and Chitipa in the north; Nsanje in the far south).
These results on locational patterns of donorhealth projects need to be examined further. Thegovernment must provide specific guidance andgeographic criteria to donors in order to provideaccess to health services for populations in the mostvulnerable areas, avoid duplication of donor activi-
ties in districts, and distribute donor healthresources more equitably.
1. In addition, the African Development Bank (ADB), theGerman Kreditanstalt fur Wiedenraufbau (KfW), and the Chi-nese government provide significant assistance, mostly incapital construction. The European Development Fund(EDF), under the Second Family Health Project, has providedfunds for functional literacy and IEC. Because they were notbased in Malawi, these donors were not included in thesurvey of Malawi-based donors; thus, their activities, alloca-tions, and expenditures were not quantified.
BETTER HEALTH OUTCOMES FROM LIMITED RESOURCES 39

he Fourth Malawi National Health Plan waslaunched in May 1999, but its implementationhas been delayed and ongoing services are
being provided on the basis of the last plan (1984-94).The NHP does not clearly lay out how it relates to therecurrent and development budgeting process, andindeed it continues to lack an implementationarrangement. Nevertheless, it is instructive to analyzeits implications on infrastructure, personnel, andoverall recurrent costs because, although it has notbeen formally implemented, the NHP with improve-ment could be used by the GOM to marshal govern-ment as well as donor resources under a SWAp.
Infrastructure implications
Table 25 lays out the current inventory of healthfacilities; the number of facilities identified by the
NHP as requiring upgrading, rehabilitation, or newconstruction; and standard facility/populationratios as established in Better Health for Africa(BHA). Using a population figure of 10 million forMalawi, it is clear that the Plan severely understatesthe need for health centers while giving relativepreference to district/rural hospitals. In fact, thecurrent number (82) of district/rural hospitalsalready exceeds the BHA standard of 66, if onecounts both GOM and CHAM facilities, which doreceive Government subvention and provide healthservices on behalf of the GOM. In contrast, the cur-rent number of health centers is more than 50 per-cent below the BHA standard. (Note, too, that the“current number” column excludes private andNGO clinics). Even if GOM-only facilities are con-sidered (excluding CHAM facilities), the NHP stillhas strong preference for district/rural hospitals (38
7
Analysis of the FourthMalawi National HealthPlan, 1999-2004
T
40
Table 25Currant vs. proposed vs. standard number of health facilities in Malawi
BHA facility Number needed per population in Malawi
Facility type standard ratio (Pop.= 10 M) Current number NHP proposed number
Central hospitals No standard No calculation made 3 3
District/rural hospitals 1 per 150,000 66 82 (38 GOM + 5744 CHAM)
Health centers 1 per 10,000 1,000 417 (201 GOM + 195216 CHAM)
Sources: (a) Tables 16 to 19 of the NHP; (b) Better Health in Africa.

existing vs. 66 needed, or 43 percent below stan-dard) relative to health centers (201 existing vs.1,000 needed, or 80 percent below standard).Clearly, the infrastructure focus of the NHP must bereexamined.
Of the total set of candidate facilities for upgrad-ing, rehabilitation, or new construction, the NHPidentifies the following “priorities” (52 facilities +support infrastructure) with their estimated costs(Table 26). Assuming that construction would bespread out over a five-year period, this means thatan average of 10 facilities will be upgraded, rehabil-itated, or constructed per year.
Personnel implications
Table 27 lays out the current and the proposedlevels of staff under the NHP. Note that the existing
and proposed number of personnel only considerGOM staff and exclude mission, NGO, and privatefor-profit health personnel. The proposed personneladditions would mean that the deficit in nurses(and probably medical assistants) would have beennarrowed (probably even exceeded) relative to therequired number if one counts similar personnel inthe private sector. However, it would appear thateven with the NHP additions, doctors would still bein short supply.
If one were to consider only the needs of healthcenters and rural/district hospitals, the estimatedhealth personnel levels using the BHA standards(three nurses and one support staff for one healthcenter serving 10,000 population, and three doctors,35 nurses, and 22 support staff for one district/ruralhospital serving 150,000 population) would be asshown in Table 28. The problem with this and the
BETTER HEALTH OUTCOMES FROM LIMITED RESOURCES 41
Table 26NHP’s “priority” infrastrucutre program and cost
Infrastructure program Cost (US$ m)
Type A: 164 boreholes, 12 health centers hooked to ESCOM, 206 solar paneling units installed, 185 radio communication units installed 5.45
Type B: 52 facilities (i.e., construct 2 new hospitals, replace 5 district hospitals, rehabilitate 9 district hospitals, rehabilitate 3 central hospitals, upgrade 9 dispensaries to full health centers, upgrade 17 health centers to community hospitals, rehabilitate 5 rural hospitals, construct 2 new health centers) and 5 new 20-unit apartment flats 178.75
Type C: Upgrade basic technology and equipment in all district and central hospitals 13.8
Total 198.0
Source: NHP.
Table 27Current vs. proposed vs. standard number of health personnel in Malawi
Current Population NHP proposed Total number Population Number needed Personnel type number per personnel addition of personnel per personnel in Malawi
(a) (b) (a+b) (*)
Doctors 315 31,746 251 566 17,668 1,111
Nurses 2,053 4,871 2,842 4,895 2,043 5,000
Medical assistants 442 22,624 383 3,825 2,614 —
Other staff 523 19,120 747 1,270 7,874 —
H.S.A.s 3,431 2,915 3,109 6,540 1,529 —
(*) Number of personnel needed is based on BHA standard population per personnel ratio of 9,000 for doctors and 2,000 for nurses. Assumed population of Malawi=10 million.
Source: NHP and this study.

other approach specified above, however, is thatthey do not consider the non-facility health pro-gram approaches (such as outreach, communitybased distribution, and mobile health teams) thatmay prove to be more cost-effective and have widerreach than facility-based approaches.
Recurrent cost implications
The NHP shies away from calculating the would-berecurrent cost implications of the health infrastruc-ture proposed for construction and rehabilitation aswell as the implied personnel complement. Instead,the NHP focuses on (a) the calculation of PE basedon the Management Change Agency Report of 1998,which assumes that two-thirds of the existingvacancies as of the report’s date would be filled inthe first year of the plan, and in the second year, theremainder of the vacancies would be filled; and(b) the calculation of GS based on district healthfacility standards set in the BHA, and using Malawipopulation figures. Thus, the so-called “recurrentcosts” were calculated outside (or independent of)the implied infrastructure network and personnelcomplement as proposed under the NHP. These arecritical shortcomings of the Plan (which means thatthe “development budget” implied in the infra-structure plan is divorced from the “recurrentbudget,” which was simply added using assump-tions from different studies). Thus, the NHP financ-ing calculations of the development and recurrentbudgets remain bifurcated.
An even more serious shortcoming of the NHPcalculation is that it probably double-counts thecost requirements of the health system by addingthe NHP infrastructure cost + GS cost estimatesderived by using the BHA standards + the PE costsderived from the Managed Change Agency Reportof 1998 (as explained above). At first blush, thissounds reasonable enough, but the BHA standardunit cost per capita already includes capital cost +salary costs + nonsalary recurrent costs.1 There issome “netting out” in the NHP’s application of theBHA costing standard, but it is not clear how it wasdone. In any case, the combined PE and GS for thefirst year of the NHP will reach US$57.69 million, astaggering increase of almost double the US$26.9million expenditure estimate for district/rural hos-pitals and health centers alone in FY98.
An alternative approach to calculating the recur-rent cost implication would be to base such calcula-tion itself on the proposed infrastructure programusing suitable r-ratios and add this figure to therecurrent budget of the existing health system.Unfortunately, the NHP’s infrastructure program ismerely a listing of the facilities and supporting civilworks and equipment, with no program phasing.For purposes of the r-analysis, it is assumed that theinfrastructure program is spread out evenly acrossfive years and, using very conservative r-ratios, areas indicated in Table 29. The resulting estimatesshow that annual recurrent costs for these newinvestments would rise from US$6.41 million inYear 1 to US$32.05 million in Year 5.
42 AFRICA REGION HUMAN DEVELOPMENT WORKING PAPER SERIES
Table 28Current vs. proposed number of personnel for health centers and district/rural hospitals in Malawi
Health centers District/rural hospitals
Personnel type Current number Needed number Current number Needed number
Doctors 0 0 158 200
Nurses 574 3,000 719 2,333
Medical assistants 236 — 159 —
Other staff 175 1,000 227 1,467
Source: NHP and this study.
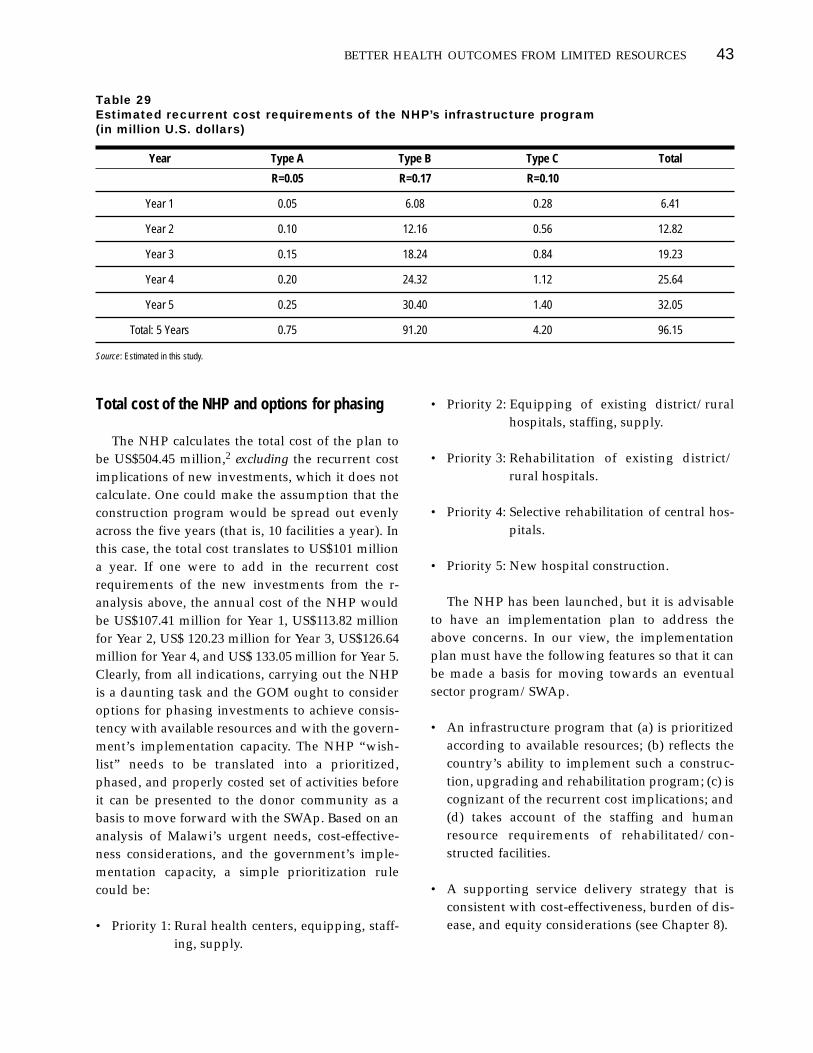
Total cost of the NHP and options for phasing
The NHP calculates the total cost of the plan tobe US$504.45 million,2 excluding the recurrent costimplications of new investments, which it does notcalculate. One could make the assumption that theconstruction program would be spread out evenlyacross the five years (that is, 10 facilities a year). Inthis case, the total cost translates to US$101 milliona year. If one were to add in the recurrent costrequirements of the new investments from the r-analysis above, the annual cost of the NHP wouldbe US$107.41 million for Year 1, US$113.82 millionfor Year 2, US$ 120.23 million for Year 3, US$126.64million for Year 4, and US$ 133.05 million for Year 5.Clearly, from all indications, carrying out the NHPis a daunting task and the GOM ought to consideroptions for phasing investments to achieve consis-tency with available resources and with the govern-ment’s implementation capacity. The NHP “wish-list” needs to be translated into a prioritized,phased, and properly costed set of activities beforeit can be presented to the donor community as abasis to move forward with the SWAp. Based on ananalysis of Malawi’s urgent needs, cost-effective-ness considerations, and the government’s imple-mentation capacity, a simple prioritization rulecould be:
• Priority 1: Rural health centers, equipping, staff-ing, supply.
• Priority 2: Equipping of existing district/ruralhospitals, staffing, supply.
• Priority 3: Rehabilitation of existing district/rural hospitals.
• Priority 4: Selective rehabilitation of central hos-pitals.
• Priority 5: New hospital construction.
The NHP has been launched, but it is advisableto have an implementation plan to address theabove concerns. In our view, the implementationplan must have the following features so that it canbe made a basis for moving towards an eventualsector program/SWAp.
• An infrastructure program that (a) is prioritizedaccording to available resources; (b) reflects thecountry’s ability to implement such a construc-tion, upgrading and rehabilitation program; (c) iscognizant of the recurrent cost implications; and(d) takes account of the staffing and humanresource requirements of rehabilitated/con-structed facilities.
• A supporting service delivery strategy that isconsistent with cost-effectiveness, burden of dis-ease, and equity considerations (see Chapter 8).
BETTER HEALTH OUTCOMES FROM LIMITED RESOURCES 43
Table 29Estimated recurrent cost requirements of the NHP’s infrastructure program (in million U.S. dollars)
Year Type A Type B Type C Total
R=0.05 R=0.17 R=0.10
Year 1 0.05 6.08 0.28 6.41
Year 2 0.10 12.16 0.56 12.82
Year 3 0.15 18.24 0.84 19.23
Year 4 0.20 24.32 1.12 25.64
Year 5 0.25 30.40 1.40 32.05
Total: 5 Years 0.75 91.20 4.20 96.15
Source: Estimated in this study.

• A more detailed and transparent costing that laysout all the assumptions used.
• A financing plan that has alternative scenarios ofresource availability from GOM+donors. Thefinancing plan must be consistent with theMedium-Term Expenditure Framework (seeChapter 8). In this regard, since the NHP upholdsuser fees as an alternative financing mechanism,the implementation plan should also state a time-frame for the development of a supportive policyframework on cost sharing.
• An explicit underlying logical framework withsuitable monitoring indicators.
1. “The overall cost was annualized by adding the yearlycosts of recurrent items, such as salaries and essential drugs,to the amortized costs of capital investments, such as build-ings and equipment. Amortization is required to translate ini-tial outlays of capital into an annual amount, thus yieldinginformation about the yearly cost of paying off the outlaysover time (assuming a loan was used to finance the capitaloutlay). Capital costs were annualized on the basis of the eco-nomic life of the assets at a 4 percent discount rate.” (BetterHealth in Africa 1994, p.129). 2. Our own calculations show US$486.45 million; it is difficultto check the accuracy of the figures because the NHP does notlay out the financing plan.
44 AFRICA REGION HUMAN DEVELOPMENT WORKING PAPER SERIES

n addition to reform proposals involvinggreater resource mobilization, discussions areongoing within GOM to improve health-sector
efficiency. These are not adequately dealt with inthe NHP, and it is useful to review some of the keyissues here. The initiatives involve hospital auton-omy, improving pharmaceutical procurement anddistribution, decentralization of health services,contracting of health services, and enhancing therole of NGOs in the health sector.
Hospital autonomy
There are 42 MOHP hospitals which, together withstand-alone government clinics/health centers andsubvented district-designated CHAM hospitals, areorganized nominally in a pyramidal structure ofreferral. At the apex are the three tertiary hospitalswhich also act as training institutions: LilongweCentral Hospital (with the attached LilongweSchool of Health Sciences which trains nurses,clinical officers, and hospital administrators);Queen Elizabeth Central Hospital (QECH) in Blan-tyre, the biggest of the three (with the attached Col-lege of Medicine which trains doctors and nurses);and Zomba Central Hospital (with the attachedZomba School of Nursing). The fourth central facil-ity is the Zomba Mental Hospital. Below these arethe 28 district hospitals (with the seven bigger andbusier ones at Rumphi, Mzimba, Kasungu, Dedza,Mangochi, Machinga, and Mulanje), and 10 ruralhospitals.
The major problems of the government hospitalsin Malawi concern structure, financing, and man-agement. Although a nominal pyramidal structureexists, the referral system operates inefficiently. Ter-tiary hospitals devote most of their resources tobasic or level I health care. It is estimated thatonly10 to 15 percent of patients at these facilitiesreceive level II or III. The Working Group on Hospi-tal Autonomy indicated that QECH is mainly pro-viding district health services to the Blantyre area(WGHA 1997). The poor state of primary-care serv-ices and the absence of “mid-level” regional hospi-tals between tertiary and district hospitals are majorbottlenecks in rationalizing the system of referral.
In recent years, the number and size of govern-ment hospitals have grown beyond what the gov-ernment budget can support. Such growth may bedue to faulty budget allocation criteria. Historically,budgetary allocations to hospitals have been basedon cost-per-bed, with little concern for quality out-comes, actual need, or efficient use of resources.This provides hospitals with the perverse incentiveeither to increase beds or to inflate costs; it does notprovide incentive for hospitals to be resource-effi-cient. Indeed lower cost-per-bed hospitals may bepenalized in the following year’s budget by receiv-ing smaller allocations while higher cost-per-bedhospitals may be unduly rewarded with bigger allo-cations. Though lack of data precludes rigorousanalysis of this phenomenon, the use of cost-per-bed as a budget allocation method certainly needsto be reformed.
8
Efficiency improvementin the health sector
I
45

Poor referral and overall underfinancing of hos-pital care may also be due to the absence of a formalfee system that can rationalize hospital use and gen-erate revenues for supplies, basic repairs, and otherimprovements. Though discussions on cost-sharingstarted in 1990, it has not been adopted as policy.Thus, fees have not been institutionalized even attertiary facilities, where there is the biggest scopefor revenue generation.
Hospital mismanagement is manifested in inade-quate control of funds, drugs, medical and othersupplies, and assets (building, equipment, andvehicles); low staff morale and poor attitude topatients; and generally poor standards of care.These symptoms originate from a deeper set ofcauses, including hospital managers’ lack of author-ity to make key decisions, poor accountability, lim-ited managerial capacity, ineffective structures andmanagement systems, and organizational culture oftop-down rules and regulations (WGHA 1997).
GOM is looking more closely at the problem ofhospitals and realizes the need to improve hospitalmanagement, increase their accountability, improvethe quality of hospital services, and increase the levelof internally-generated revenue. The MOHP has or-ganized the Working Group on Hospital Autonomy(WGHA) to come up with preliminary policy reformand hospital restructuring proposals to achieve theseobjectives. The second health sector vision 2007 inthe draft Strategic Health Plan is “to improve thequality of hospital care from central and large districthospitals by decentralizing their management toautonomous Hospital Boards.” In general, thereform proposals identified by Working Group onHospital Autonomy are in the right direction andshould be supported. These four proposals are:
1. Providing of legal autonomy to the three centralhospitals and seven “busy” district hospitals(Rumphi, Mzimba, Kasungu, Dedza, Mangochi,Machinga, and Mulanje) and enabling legal andpolicy environment for this purpose. Theautonomous hospital is defined in the context ofMalawi as a legal corporate entity under thedirection and control of a hospital board that isseparate from the MOHP but accountable to it, aswell as accountable to the communities it serves.The GOM’s goal is to make these hospitals self-
financing autonomous bodies, but the granting offull autonomy will require an Act of Parliament.
2. Reconfiguring the referral system, possibly byhaving feeder hospitals for the central hospitalsso that they can focus on real tertiary care ratherthan act as district hospitals.
3. Redefining the role of the MOHP with respect toautonomized hospitals. With autonomy grantedto key hospitals, MOHP’s role is expected tochange. Instead of instructing, regulating, con-trolling, and supervising most aspects of hospitalmanagement, the ministry will instead establishgoals, targets and policies for hospital servicesthat it wants provided, and then pay hospitals ifthey meet these requirements (WGHA 1997). Thespecific roles of MOHP under this scenario are:(a) to set national policies and plans for provid-ing equitable hospital care; (b) to determine thelevel, type, and quantity of services that the min-istry will pay the autonomous hospitals todeliver; (c) to determine hospital investmentsand capital works based on national priorities tobe developed; (d) to establish hospital standardsand to monitor compliance and performance;and (e) to provide incentives for quality and effi-ciency improvements. A key theme of the pro-posed reforms is the conversion of existingMOHP-hospital relationships into “contracts”that make a clear distinction between MOHP aspurchaser/regulator of services and theautonomous hospitals as providers of services.
4. Improving the governance of autonomous hospi-tals. Hospitals granted autonomy will be man-aged by individual boards, each of which is envi-sioned to be a legal corporate body. The Act ofParliament will have to define the roles, compo-sition and appointment, powers and authorities,accountabilities, and specific duties and respon-sibilities of these boards, as well as their relation-ship with the hospital management, with thecommunities they serve, and with MOHP. TheWorking Group also proposes the establishmentof a Council of Hospital Boards consisting of rep-resentatives from the individual hospital boards.The Council is envisioned as a “trade organiza-
46 AFRICA REGION HUMAN DEVELOPMENT WORKING PAPER SERIES

tion” acting in the interests of the autonomoushospitals vis-a-vis the MOHP in such aspects asstaff salaries, pensions, and benefits; hospital feeschedules; staff training; bulk procurement andequipment sharing; and coordination of manage-ment systems and procedures.
Hospital financing must also be reformed. This isthe weakest aspect of the proposed hospital restruc-turing in Malawi. While the Working Group recog-nizes the need to reform hospital financing, it pro-vides little guidance on how to do it. There is nodiscussion on reducing government subsidies goingto these facilities or the need to broaden their rev-enue base. The proposal implies that the same scopeand level of services will be provided and that thequality of services will be improved. This is moreoptimistic than realistic, given constraints in theGOM budget. A more thorough hospital restructur-ing is necessary, based on (a) a realistic assessmentof the budget and available extra-budgetaryresources, (b) the most essential and cost-effectiveclinical services that these hospitals should be pro-viding, and (c) the most cost-effective way to pro-vide ancillary services.
MOHP and hospital directors should exploreopportunities for broadening the revenue base ofthese hospitals. As GOM reduces its subsidy to thethree hospitals, they should be made more finan-cially viable through other financing mechanismssuch as (a) cost recovery programs; (b) health insur-ance reimbursements (an immediate activity shouldbe the review and updating of reimbursementschedules for health insurance firms and medicalaid schemes); (c) corporate contracts to providecare, including private amenity wings; (d) nonmed-ical revenue programs (parking fees, cafeteria,training fees, research, etc.); and (e) direct grantsfrom external sources.
MOHP and hospital directors should alsoexplore opportunities for cost-containment and effi-ciency enhancement at the hospitals. These includereduction in drug theft; much improved use ofdrugs through better physician prescription behav-ior; better supervision of food purchases and distri-bution (around 20 percent of hospital budget is allo-cated to food); better staffing; and bettersupervision of transport fleet. Hospital directors
should also consider the feasibility of privatizing orcontracting out hospital ancillary services (such aspreventive maintenance and repairs).
Finally, hospital statistical databases should bestrengthened. There is a serious lack of informationon the status and performance of these hospitals(bed capacity, other assets, personnel, budget allo-cations and spending, catchment area and origin ofpatients, inpatient census, case-mix, average lengthof confinement, outpatient attendance, other servicedelivery statistics, patients’ ability and willingnessto pay, and so on). While hospital autonomy isalmost universally prescribed in the existing docu-ments on health reform, no in-depth study can bedone unless these data are generated. From thesedata, rational decisions can be made.
To provide a more rational basis for developing astrategy of hospital reform, a study should be com-missioned to analyze the feasibility of extendinggreater autonomy to the tertiary hospitals (and pos-sibly the seven largest district hospitals). The scopeof the study should include analysis of (a) thedegree of autonomy these three Malawian hospitalscurrently have with respect to management,staffing and personnel; budgeting and financialresource base; procurement; and quality improve-ment; (b) legal, policy, organizational, management,and financial requirements for increasing/improv-ing their autonomy; (c) quantitative targets forreducing government subsidy and for increasingalternative revenue sources such as fees, insurancereimbursement, grants, nonmedical revenues, andso on; and (d) service delivery targets.
Improving pharmaceutical financing,distribution, and use
Financing and distribution
The Central Medical Stores (CMS) is set up as aTreasury Fund to procure, store, and supply phar-maceuticals and medical supplies and equipment toMOHP and CHAM health facilities. It has an annualbudget set in conjunction with the Treasury, and ituses these funds to tender for goods that are requi-sitioned by approved hospitals and clinics. Theoret-ically, CMS is zero-budgeted and is expected tocover its operating costs by appropriately charging
BETTER HEALTH OUTCOMES FROM LIMITED RESOURCES 47

its users (Norman and Dawbarn 1999). However,because of overall budget difficulties, poor dialoguebetween MOHP and MOF regarding the release offunds for drugs, and the absence of a sustainablefinancing mechanism (including fees), MOHP hos-pitals are substantially behind in reimbursing CMSfor approved purchases. In effect, CMS is treated byMOHP health facilities as a “bursary.” As a result,CMS is frequently in arrears. Delays in the release offunds, if not the general intermittent unavailabilityof funds, negate all potential benefits of bulk pro-curement. Aside from the core financing problem,CMS also suffers from mismanagement due toweak leadership, lack of qualified staff, poor logis-tics, and weak support systems. Poor MOHP staffmorale has also led to reported theft of drugs, eitherfrom CMS warehouses or within the health facilitiesthemselves. These factors lead to chronic shortagesof drugs all over the country.
Organizationally, CMS is part of the MOHP andtherefore lacks autonomy to make critical decisions.Absence of such autonomy has been seen to con-strain CMS’ ability to operate as a commercialenterprise. On the basis of this diagnosis, a series ofDfID-funded consultancies (first in 1995-96 byDeloitte and Touche, and later in 2000 by anotherset of independent experts) have proposed therestructuring or “transformation” of CMS, withconcomitant reforms in pharmaceutical financing,and multi-donor commitment to its recapitaliza-tion. Towards this end, MOHP submitted to Parlia-ment a draft CMS reform bill in 1996-97, but laterwithdrew it pending the resolution of certain legaltechnicalities raised at the Cabinet level. Thisreform program was not implemented, and lack ofprogress in this policy area has certainly con-tributed to drug shortages nationwide. A number ofdonors who are keen on providing drug financinghave deliberately stayed away due to the absence ofan enabling environment and political commitmentto CMS reforms.
Pharmaceutical sector reforms are being revivedwith more modest expectations, with DfID againproviding critical support. Cabinet endorsement torestructure and improve the governance and man-agement of the CMS is critical, and the consultantshave proposed the following principles for reform:(a) need-based and resource-based drug procure-
ment, which may require revision of the currentEssential Drug List; (b) cash-limited system whichensures that drug supplies can be paid for, that is,“cash and carry” system; (c) government commit-ment not to divert drugs to non-priority locationsfor any reason; (d) political acceptance of some formof fees (cost sharing) for drugs; and (e) a coherentinformation strategy for pharmaceutical planning,procurement, and distribution. In addition to thesesteps, the government must address all forms of pil-ferage and commit to a transparent external report-ing of the CMS reform process, especially to donorswho are financing drugs or providing them in-kind.
In FY2000, the government raised the spendingon drugs from the estimated FY98 level of US$0.80per capita to US$1.00, to be further increased inFY01. (The WHO/World Bank estimated require-ment is US$1.00 for district health services in Sub-Saharan Africa; US$1.60 inclusive of STD drugs;and US$2.00 if tertiary-level needs are included.)Though this increase in drug financing isadmirable, it should be underpinned by radicallyimproved management of CMS to ensure greateravailability of these inputs at the patient level.
Provider and consumer behavior
Compared to the drug supply problem, thisdemand problem is not as well recognized. How-ever, without corresponding reforms in the wayproviders and consumers behave, improvements inthe supply situation may not result in overall healthsector efficiency. In fact, readily available drugsmay just lead to over-consumption. The issues inthis area involve: (a) the manner of dispensingdrugs as most private doctors prefer to fill theirown prescriptions; (b) prescription drugs beingmade available in the open market and dispensedillegally; and (c) tendency of government physi-cians, especially at central hospitals, to aggressivelyprescribe medicines even when cheaper therapeuticalternatives are available. (“Over-prescription” ofantibiotics has been observed and reported anecdo-tally.) Given these problems, investigations areneeded on drug consumption and prescriptionbehavior. Specific interventions can include the for-mation of hospital therapeutic committees, thedevelopment or update of drug formularies, the
48 AFRICA REGION HUMAN DEVELOPMENT WORKING PAPER SERIES

requirement for hospitals to have drug and revenueregisters, and necessary training for hospital andclinic staff on the use of these registers and on betterprescription.
Health service decentralization
The government sees decentralization as bringinghealth resources and services closer to the periph-ery. However, the problem of pursuing decentral-ization of government and government-fundedhealth services in Malawi is that there are threestructures, not exactly parallel but often duplicativeand uncoordinated. These are MOHP’s healthsystem, MOLG-supported local authority healthservices focusing on preventive care, and CHAMsubvented health services. MOHP, the largestprovider, itself consists of the national office, fourcentral tertiary hospitals, and district health author-ities. In the late 1990s, the Ministry of Local Gov-ernment (MOLG) also funded health servicesthrough 22 local authorities (LA), 19 dispensaries,26 maternity units, and nine health centers in 22 dis-tricts, although most of these now seem to havebeen turned over to the MOHP. In addition, thecities of Blantyre, Lilongwe, Mzuzu, and Zombaprovide preventive services. Finally, CHAM oper-ates its own network of independently-managedhealth facilities, though these often receive govern-ment subvention. The relationship of these variousplayers under a decentralized arrangement remainsto be clarified.
Legal and administrative framework
The Local Government Act No. 42 was passed byParliament in December 1998. The demarcation ofwards has been completed, although these bound-aries do not always match those of the catchmentareas of health facilities. “Cross-jurisdictional”flows of patients will be a real issue in this regard.
Local elections were held in 2000, paving the wayfor the creation of 39 local assemblies, consisting ofan elected mayor and elected ward representatives.Ex-officio nonvoting members include the tradi-tional authorities, five persons to be appointed fromspecial interest groups (gender, minorities, andtechnical expertise), and the M.P.s from constituen-
cies in the local government area. It is expected thatlocal assemblies will take over the District Develop-ment Committees (DDCs), which were primarilyresponsible for social services at the local level priorto decentralization.
Fiscal framework
The main revenues for the local assemblies are to betraditional, locally generated revenues, central gov-ernment transfers, ceded nontax revenues, sectorgrants, and donor financing.
a. Traditional, locally generated revenues include prop-erty rates, ground rent, fees and licenses, com-mercial undertakings, and service chargesincluding user fees for health services. The issueof user fees in health is particularly relevant indiscussions on locally generated revenues. Thereis no formal MOHP user fee policy for healthservices in Malawi. However, according to theDecentralization Secretariat, with devolution, thelocal assemblies can impose user charges, evenwithout a national policy on this issue.
b. Under the decentralization law, the national gov-ernment is mandated to make available to dis-trict assemblies at least 3-5 percent of nationalrevenues, excluding grants, as central governmenttransfers. In FY00/01, the government will noteffect the transfer of the whole 5 percent, due tocapacity constraints in local assemblies. How-ever, MK 1 million for each assembly will beincluded in the budget. By the third year of thedecentralization process, it is anticipated that thenational government will make the 5 percenttransfer. It is not clear how much of theseresources will be devoted to health services. ADANIDA-funded study on inter-governmentaltransfer systems will assist in determining aneffective mechanism for the allocation of theserevenue to local assemblies.
c. The formula for the distribution of ceded (nontax)revenues will be formulated by Parliament.
d. Due to capacity constraints at local assemblies,sector grants (budgets) from FY00/01 to FY03/04
BETTER HEALTH OUTCOMES FROM LIMITED RESOURCES 49

for the assemblies will still be incorporated intothe line ministries’ budget. However, Treasurywould disburse funds directly to the assemblieswithout passing through the line ministries. Thekey issues that remain to be resolved include themechanisms for channeling these sector grants,management of sector grants, basic performanceindicators for these sector grants, and prepara-tion of sector standards.
e. Donor financing can be channeled through theDistrict Development Fund (DDF), which givesunconditional block grants for development pur-poses. The DDF is used by the U.N. CountryDevelopment Fund and UNDP and the govern-ment’s development budget. Individual donorfunds are accounted for separately through indi-vidual receipting accounts. Despite this conven-ience, other donors have been less enthusiastic inchanneling resources through DDF (or similar“uniform” channel). This is clearly an issue thatneeds to be resolved as there is a plethora ofdonors providing or planning to provideresources to districts including:
■ The African Development Bank, which plansto focus on five districts;
■ The Dutch: Lilongwe;
■ The European Union, which provides or plansto provide resources to four districts: Blantyre,Mulanje, Thyolo, and Chiradzulu;
■ GTZ: Machinga;
■ JICA rehabilitation of district hospitals: Dowa,Kasungu, and Dedza;
■ UNDP, which has been supporting six “localimpact area” districts since 1994: Nkhata Bay,Mangochi, Nsanje, Dedza, Thyolo, and Salima;
■ UNFPA training of family planning and repro-ductive health coordinators at the districts;
■ USAID, whose CHAPS Project1 partnersNGOs with four districts and eventually to 10
districts: Mangochi, Mzimba, Salima, Mulanje,Chikwawa, Polambe, Blantyre, Lilongwe,Thyolo, Chiradzulu, and Machinga;
■ WHO/UNICEF, which provide resources forIMCI in four “early use” districts: Kasungu,Mzimba, Mwanza, and Blantyre;
■ WHO support to reproductive health in eightdistricts:2 Chitipa, Karonga, Rumphi, Nkho-takhota, Nchisi, Salima, Dowa, and Ntcheu;and
■ The World Bank’s Population and FamilyPlanning Project operating in three districts:Chitipa, Ntchisi, and Chiradzulu.
f. Equalization grants are envisioned to correct dis-parities in districts, with the formula to be deter-mined by the central government.
In advance of actual devolution, the MOHP hasestablished each district as a “cost center” under theMTEF exercise. Thus, the recurrent budget is nowreflected for each district. However, the develop-ment budget remains outside the district “costcenter”; thus, the process of disentangling the dis-trict development budget from the MOHP develop-ment budget will be challenging.
Extent and pace of decentralization
The devolution of health assets and functions is cur-rently in Phase 1. As planned, in FY01, the “basicperipheral services” will be devolved, including:
• Hospital services (that is, rural hospitals) otherthan hospitals providing referral and medicaltraining – Under Phase 1, district hospitals willcontinue to be under the MOHP; thus, all doc-tors, dentists, most nurses, and most other tech-nical staff (lab technicians, and so on) wouldremain under MOHP in Phase 1. Under Phase 2,district hospitals and relevant staff will bedevolved to the local assemblies.
• Health centers, dispensaries, sub-dispensaries,and first-aid posts.
50 AFRICA REGION HUMAN DEVELOPMENT WORKING PAPER SERIES
• Maternity and child welfare services.
• The control of communicable diseases includingHIV/AIDS, leprosy, and tuberculosis; the controlof the spread of diseases in the local governmentarea.
• Ambulance services.
• Primary health care services, vector control, envi-ronmental sanitation, and health education.
For its part, the MOHP is expected to dispensefunctions related to health policy formulation andenforcement, standard setting, quality control andquality assurance, supervision and monitoring,training and curriculum development, internationaland regional representation in health fora, and for-mulation of the national health plan.
To carry out the devolved functions, the localassemblies will be responsible for hiring and firinghealth staff, planning for health programs at theirjurisdictions, and managing and inspecting healthfacilities within their purview. Toward this end, thefollowing administrative actions are being initiated:
• A District Local Development Planning System isbeing introduced to enable local people to plan,prioritize, and implement their own plans at thedistrict level.
• The District Development Plan is a constitutionalrequirement; it consolidates all sector initiativesin the district. According to the MLG, two dis-tricts (Nchinji and Dedza) have completed theirdistrict development plans while another district(Thyolo) is about to complete its plan.
• At varying rates, all districts are in the process offormulating their respective socioeconomic pro-files, which are the basis for their district plans.
• No health planning officers have been estab-lished at the district level. The understanding isthat the District Health Officer (DHO) will be thede facto health planner. Since the district hospi-tals will not be devolved in Phase 1, the DHOwill still be under the Ministry, but coordination
will be maintained between the DHO and thelocal assembly. In Phase 2, the district hospitalswill be devolved.
• MOHP is also working to strengthen financialmanagement systems at the district level. Bankaccounts have been opened for most districts.
Other overarching issues
How does decentralization affect MOHP’s plan tohave a National Health Service Commission (NHSC),as articulated in the Human Resource DevelopmentPlan? It appears that, since all district hospitals and allcentral hospitals will continue to be under theMOHP, a considerable number of health staff willcontinue to be central government employees underthe civil service. It is possible that these “retained”civil servants can be organized as the NHSC.
Devolved health staff are expected to becomeemployees of the local assemblies and cease to bemembers of the civil service. It is also expected thatdistrict assemblies would be required to pay a min-imum salary equivalent to the existing civil servicerate for the particular level of the devolved staff,and that devolved staff will convert from the exist-ing civil service pension program (noncontributory)to a contributory pension scheme under the localgovernment assemblies. How this can be broughtabout, given the limited revenues of districts, is aserious issue.
The role of CHAM facilities in decentralization isunclear, and this issue has not been properly takeninto account. CHAM’s 153 health units ( 21 of whichare hospitals) account for 30 to 35 percent of healthservices delivered in Malawi. In many districts, theCHAM facility is the only hospital, though suchfacilities have not been formally designated as “dis-trict hospital.” In the past, the government con-tributed as much as 30 percent of the CHAM budgetthrough subvention grants (now managed by theMinistry of Finance), though the size of the grantsdecreased in the 1990s. The lack of a formal agree-ment between the government and CHAM hascaused confusion, especially in years when the sub-vention grant was not forthcoming. Nevertheless,by tradition, the District Health Officer has beenexpected to supervise CHAM facilities.
BETTER HEALTH OUTCOMES FROM LIMITED RESOURCES 51

Contracting of health services
The government views contracting of health serv-ices, provision of autonomy to selected health facil-ities, and “privatization” of specified functions asinherent parts of the overall decentralization pro-gram. Under the World Bank’s Second FiscalRestructuring and Deregulation Program, the gov-ernment committed to contract out several healthfunctions, as laid out in Table 30. According toMOHP, contracting out these services will focus oncentral hospitals during the first phase of imple-mentation.
Responsibility for contracting out is handled bythe OPC with technical support provided by thePublic Sector Change Management Agency(PSCMA). According to PSCMA consultants, thecontracting out process has gone on for three years,the prolonged process due to Malawi’s lack of expe-rience in this new area. There were no governmentrules or procedures dealing specifically with health
services or ancillary health services. Appropriateprocedures had to be developed; the relevant direc-tive from the OPC Secretary has been forwarded tothe Implementation Committee on Civil ServiceReform for implementation.
A national competitive procurement process wasused. The Terms of References (TORs) and Requestsfor Proposals (RFPs) were prepared with MOHPsupport, especially on matters of standard require-ments. The short-list of firms (all Malawi firms) hasbeen developed and are as follows: (a) Cateringservices in the three central hospitals – three firms;(b) Laundry services – two firms; (c) Cleaning serv-ices – four firms; and (d) Ambulance services (onlyin Zomba Central Hospital) – one firm. Negotia-tions are ongoing, but the tendering committeeneeds to speed up the process. Contracts have beendrafted for each type of service.
Affected hospital staff will be handled by theOPC’s Rationalization Unit, which has the mandateto retrench staff, retrain and/or redeploy staff, or
52 AFRICA REGION HUMAN DEVELOPMENT WORKING PAPER SERIES
Table 30MOHP contracting out and rationalization of government functions
Current number of Expected date of Name of function civil servants affected Type of rationalization rationalization
Regional health offices* 70 Abolition of offices Dec. 31, 1998
Cleaning services 2,645 Contracting out Apr. 1, 1999
Transport services 415 Contracting out Apr. 1, 1999
Building and ground maintenance 1,132 Contracting out Dec. 31, 1998
Laundry services 159 Contracting out Apr. 1, 1999
Security services 740 Contracting out Dec. 31, 1998
Catering services 46 Contracting out Apr. 1, 1999
Audit services 5 Contracting out Apr. 1, 1999
Drama, band graphics 25 Contracting out and redeployment Dec. 31, 1998
Mortuary services 29 Contracting out July 1, 1999
All establishment changes 5,097 Creations, upgrading of posts especially Apr. 1, 1999field staff, e.g., nurses and doctors
Total 5,237
*This has been accomplished: All three regional health offices have been abolished and the functions transferred to the relevant district hospitals.
Source: World Bank, Second Fiscal Restructuring and Deregulation Program Technical Assistance Project. November 10, 1998.

have contractor(s) absorb affected staff. In the eval-uation of proposals, it is estimated that 25 percent ofaffected staff can potentially be absorbed by thecontractors.3 PSCMA has requested the OPC tomake adequate budgetary provision for the initial(upfront) payment to contractors as well as the fullcost of the contract.
The issue of “appropriate cost” of contractedservices is rather complicated, especially in a settingwhere these services are being poorly provided bythe central hospitals due to budgetary constraints ofthe government. As a result, current services andcurrent costs cannot be compared directly with con-tracted services (with standard specified require-ments) and their attendant costs.
The OPC’s Government Contracting Unit (GCU)will manage the contracts, but the MOHP and indi-vidual hospital management are expected to moni-tor the services provided. All of the contracts have atime-frame of one year, renewable for another year,based on acceptable performance. In the case ofcontracts with “asset specific” elements, the one-year timeframe may be a problem. The mission wasinformed that, in the case of the ambulance contractfor Zomba Hospital, the single contractor promisedto provide as many as five ambulances, in additionto the existing two ambulances of the hospital; thecontractor will then manage the entire fleet of sevenambulances. In the case of the catering and laundrycontracts, the central hospitals retain ownership ofthe relevant equipment. Repairs will be made by thehospital (government) or, if the repairs are made bythe contractor, the hospital (government) will reim-burse the contractor for expenses incurred.
The role of nongovernmental organizations in health
Subvention program
The Christian Hospital Association of Malawi(CHAM) operates 148 health units, mainly in ruralareas. Though primarily curative in orientation, 52percent or 77 of the health units provide primaryhealth care services (Gondwe: 1996). CHAM facilitiesget an estimated 30 percent of their operating fundsfrom GOM subvention. This is used mainly forsalaries of local staff. The fiscal crisis is drying up the
subvention program, so some CHAM facilities arereportedly closing down. In general, the MOHP-CHAM subvention program is drying up. GOM hasto make a fiscal commitment to support this program,especially in areas where government health servicesare unavailable and CHAM is left to provide them.
While MOHP services are free, CHAM servicesare chargeable, leading to an anomaly that has ledto persistent calls for the establishment of free-serv-ice MOHP units in CHAM areas. In spite ofCHAM’s fees, it continues to draw patronage. Ingeneral, CHAM facilities are reputed to be betterrun than MOHP facilities, and the quality of serv-ices are perceived to be better. The modest fees sup-port quality improvements.
As has been suggested, it would be wasteful forGOM to build hospitals in areas where CHAM isalready established. There is a clear need to syn-chronize fee policies of MOHP and CHAM, and towork towards a uniform fee policy.
Overall private sector policy environment
GOM’s policy is characterized as flexible; it allowsparticipation by different NGOs (CHAM, estates,industries, licensed practitioners, and for-profitproviders), and includes traditional health practi-tioners (Ngalande, and others 1994). Religious mis-sions preceded the government in health servicedelivery and remain a significant part of Malawi’shealth care system. Despite the flexible environ-ment, the private sector seems to have very littleinput in overall decisionmaking in the health sector.NGOs complain that the “government makes poli-cies and decisions on health issues with little or noinvolvement of other health providers,” and thathealth service goals are being made “the soleresponsibility and prerogative of small selectgroups” (Gondwe 1996).
NGO representatives recommend that (a) everyservice provider should play a role in policy formu-lation and decisionmaking; (b) MOHP should bemore consultative, for example, by inviting the pri-vate sector to technical committee sessions, discus-sions on health policies, and coordination meetings;and (c) district hospitals and the private sector ineach district should be organized as teams(Gondwe 1996).
BETTER HEALTH OUTCOMES FROM LIMITED RESOURCES 53

In view of the scanty management expertise inthe public sector, CHAM has suggested sharing itsmanagement expertise with the government.Specifically, it has recommended that the country bedivided into 39 health delivery areas (HDAs) to beheaded by 15 CHAM hospitals, 24 government dis-trict hospitals, and the three district health offices inBlantyre, Zomba, and Lilongwe, where the threetertiary central hospitals are located. These HDAhospitals would then be responsible for the admin-istration of health services in their areas (MOH:1992). The Health Policy Framework (MOHP 1995)recognizes the need to define the concept of HDAsin light of the review of the role of regional health
offices and the delay in introducing user fees at gov-ernment facilities.
1. USAID support to the first set of CHAPS districts ended inFY01, and an evaluation is being planned. Meanwhile,CHAPS II is being envisioned; new NGO proposals will besought. It is likely that CHAPS II will cover six districts –including, but not necessarily, the four original districts. Ifmore funds are available, as many as 10 districts will becovered.2. Support focuses on TBA (traditional birth attendant) shel-ters, provision of seeds, water, and sanitation.3. However, PSCMA informed the mission that the affectedstaff have not been informed, because, if the contracts do notmaterialize, the central hospitals would have to operate theservices “as usual” with the affected employees.
54 AFRICA REGION HUMAN DEVELOPMENT WORKING PAPER SERIES

his appendix provides information on theunit cost of providing health services to thetop 5 disease conditions for adults and chil-
dren in Malawi, namely, malaria, diarrhea, pneu-monia/respiratory conditions, tuberculosis, andHIV/AIDS. The study was conducted by KPMG/Blantyre for the MOHP’s PHN Project. It relied on1998 data from 15 sample health facilities:
• Private Hospitals (2) – Blantyre Adventist Hosp.,Chitawira Private Hospital
• CHAM Mission Hospitals (3) – Madisi MH,Ekwendedni MH, St. John MH
• Government Central Hospitals (2) – Queen Eliz-abeth CH, Lilongwe CH
• Government District Hospitals (2) – Salima DH,Kasungu DH
• Government Rural Hospitals and Health Centers(6) – Mponela RH, Mzuzu HC, Mitundu HC,Chileka HC, Mpemba HC, Kasiya HC operatedby the local authority
From these facilities, a purposive sample of 3,909patients suffering from one of the top five diseaseswas selected (excluding those with co-morbidities).Of these, 2,183 were inpatients and 1,726 were out-patients. The following costs were taken intoaccount: staff time, accommodation and food, x-ray
and lab, and other supplies. The study is an attemptto generate actual resource costs; hence they reflectscarcities experienced by government facilities aswell as wastage often reported in both governmentand private hospitals and clinics. No attempt wasmade to adjust for severity of illness.
The following observations can be can begleaned from the results: First, private for-profithospital costs exceed central government hospitalcosts by a substantial factor: as much as 120 timesfor inpatient malaria, 38 times for inpatient diar-rhea, 30 times for inpatient palliative HIV/AIDScare, 14 times for inpatient pneumonia, and eighttimes for inpatient tuberculosis. To be sure, thesecost differences can very well reflect quality differ-ences, but the orders of magnitude are such thatthey call attention to either or both of the following:
• Government facilities are severely underfunded.A detailed analysis of the cost structure of thesefacilities would indicate what specific items arescarcely being provided (drugs, lab tests, x-rays,other supplies, food), thus driving down theircost structures.
• Private for-profit facilities may very well becreaming off those with ability to pay. The KPMGstudy suggests that some private facilities maybe unduly prolonging length of stay to maximizeon patients’ accommodation fees. Insurance cov-erage worsens these moral hazard problems andthey need to be addressed.
Appendix
Unit cost of providinghealth services to the top five diseaseconditions in Malawi
T
55

Second, while outpatient care is in general lesscostly than inpatient care, the cost difference in pri-vate facilities between these two types of care is solarge that it raises questions about the type of inpa-tient services being given there. In other developingcountries, the cost of inpatient care is usually four tofive times that of outpatient care. In this study, theprivate-facility cost of inpatient care exceeds outpa-tient care by as much as 26 times for diarrhea, ninetimes for HIV/AIDS, and seven times for pneumo-nia. (See Table 30.) Such inflated inpatient costs cantempt private facilities to admit and confine patientsthat can otherwise be treated on an outpatient set-ting. This conjecture needs to be looked into.
Third, among government health facilities, thereare few marked differences between the costsincurred by central tertiary hospitals, district hospi-
tals, and rural hospitals and health centers. Costbeing a measure of quality, this finding raises theissue of the quality of health services being providedat central hospitals, as well as the types/severity ofpatients these apex hospitals treat. In the case of inpa-tient malaria and inpatient tuberculosis, district hos-pitals had costs exceeding those of central hospitals.
1. The cost levels between CHAM and governmentfacilities, by disease and by type of care, are nottoo different. If CHAM facilities indeed providebetter services, as is frequently claimed, and ifindeed these cost patterns reflect efficientresource use, then government facility managersneed to learn more from their CHAM coun-terparts on how to deliver services more cost-effectively.
56 AFRICA REGION HUMAN DEVELOPMENT WORKING PAPER SERIES
Table A-1Average cost of care per patient, by type of care, by type of disease, and by type of facility:1998 (in Malawi Kwacha)
Patient Central Rural hospitalssample Private CHAM government District and health
Disease type, by size hospitals hospitals hospitals hospitals centerstype of care provided (n) (MK) (MK) (MK) (MK) (MK)
Malaria
Inpatient care 595 3,012 61 25 56 26
Outpatient care 1,004 623 30 80 31 15
Diarrhea
Inpatient care 475 4,290 128 112 66 47
Outpatient care 203 167 18 n.d. 24 n.d.
Pneumonia
Inpatient care 629 2,723 167 199 138 126
Outpatient care 444 403 32 40 24 n.d.
Tuberculosis
Inpatient care 361 3,432 n.d. 407 654 n.d.
Outpatient care 58 n.d. n.d. n.d. 14 n.d.
HIV/AIDS
Inpatient care 123 5,931 246 197 111 74
Outpatient care 17 634 29 80 10 n.d.
Source of basic data: KPMG/Blantyre, Analysis of Hospital Facility Expenditures and Unit Costs of Health Services in Malawi. Draft dated Feb. 18, 1999.

2. Cost analysis is in its infancy in Malawi andshould be made a regular analytical activity forprogram managers in both government and pri-vate facilities. This type of analysis is critical for(a) program costing required by the annualMTEF budget exercise; (b) the development offee schedules for cost recovery or cost sharing
programs envisioned for government hospitals;(c) the development of reimbursement schedulesfor patients with health insurance coverage; and(d) the identification of problems associated withresource use of specific inputs, such as food anddrug supplies.
BETTER HEALTH OUTCOMES FROM LIMITED RESOURCES 57
Table A-2Average cost of care per inpatient and per OPD visit by disease: 1998 (in Malawi Kwacha)
Patient Central Rural hospitalsDisease type, by sample Private CHAM government District and healthtype of care size hospitals hospitals hospitals hospitals centers
Cost per inpatient
Malaria, adult 356 3,137 73 33 65 32
Malaria, child 239 2,887 48 16 47 19
Diarrhea, adult 295 4,076 191 132 85 33
Diarrhea, child 180 4,503 95 92 47 61
Pneumonia, adult 405 2,957 178 207 166 173
Pneumonia, child 224 2,489 156 190 110 78
Tuberculosis, adult 350 3,432 — 621 545 —
Tuberculosis, child 11 — — 193 762 —
HIV/AIDS, adult 117 7,481 246 237 111 74
HIV/AIDS, child 6 4,381 — 156 — —
Cost Per OPD Visit
Malaria, adult 616 601 33 80 35 15
Malaria, child 388 644 26 80 26 15
Diarrhea, adult 116 159 21 — 28 —
Diarrhea, child 87 175 15 — 20 —
Pneumonia, adult 301 240 45 40 28 —
Pneumonia, child 143 566 18 40 20 —
Tuberculosis, adult 55 — — — 18 —
Tuberculosis, child 3 — — — 10 —
HIV/AIDS, adult 10 — 29 — 10 —
HIV/AIDS, child 7 634 — 80 — —
Source of basic data: KPMG/Blantyre (1999).


Banda, Aleke K. March 24, 1995. “Budget Statement1995.” Delivered at the National Assembly, Zomba,Malawi.
Deloitte & Touche. June 1996. “Transformation Plan forthe Malawi Central Medical Stores.”
Ferster, Geoffrey; P.H. Van Kessel; and Yaw Adu-Boahene.March 27, 1991. “Strategic Framework of the Cost-Sharing Scheme for the Ministry of Health—Malawi.”Work Paper No. 1.
Franco-Miller, Lynne and others. March 1995. “Commu-nity Financing Experience and Options: A Study toProvide Baseline Information for Ministry of HealthDecision-Making.” Study funded by UNICEF andUSAID.
Gondwe, Regent L.M. June 30-July 2, 1996. “New Roles ofthe Christian Health Association of Malawi.” Work-shop on health planning issues. Mangochi, ClubMakokola.
Huddert, Jenny. February 19-March 10, 1990. “Health Per-sonnel.” Report of an assignment conducted withMOH/Malawi in preparation for the proposed WorldBank Health Sector Credit. Funded by ODA.
LATH (Liverpool Associates in Tropical Health). 1999.“Development of a Health Care Financing Strategy.”Visit report submitted to DfID.
Malawi Institute of Management (MIM). March 14, 1991.“A Study to Identify Options for Reducing theVacancy Rate of the Malawi Civil Service.”
______. May 1994. “A Report of Workshops on Decentral-isation of Health Services, Planning, Delivery andResources Management in the Ministry of Health.”Project No. 93031.
Marshall, N.R. June 1996. “Government Financing in theHealth Sector—Prospects and Constraints.” EU Tech-nical Assistance, Economic Affairs Unit, Ministry ofFinance.
Mbewe, Patrick, M.P. May 16, 2000. Speech delivered bythe Honourable Minister of Local Government at theConsultative Group Meeting, Le Meridien CapitalHotel, Lilongwe, Malawi.
Muva, T.D.C. 1996. “Health Sector Decentralization inMalawi.” Paper presented at the workshop on healthsector issues held June 30-July 2 at Nkopola Lodge,Mangochi.
Mwambaghi, F.R. July 1-2, 1996. “Public ExpenditureReview in the Health Sector: Critical Commentary.”Background paper for the workshop on health plan-ning issues in Malawi. Mangochi, Club Makokokla.
Ngalande, Elias E. and others. 1994.”The Public/PrivateMix in Health Care System in Malawi.” Health Policyand Planning 9(1): 63-71.
Norman and Dawbarn. June 1999. “Pre-InvestmentHealth Study Funded by the African DevelopmentFund.” Submitted to the Government of the Republic ofMalawi: Health Planning, Human Resources, Gender andEnvironment, Volume IV, Part 5.
Odala, T.R. July 1, 1996. “Management Realities in theHealth Sector in Malawi: A Discussion Paper.” ClubMakokola.
Price Waterhouse. October 1990. “A Study on Decentral-ization of Management Authority for Ministry ofHealth.”
Republic of Malawi Department of District and LocalGovernment Administration. May 2000. Decentraliza-tion Process in Malawi. Office of the President and Cab-inet. Lilongwe.
Republic of Malawi Ministry of Health (MOH). Novem-ber 1992a. Introduction of Cost Sharing in GovernmentHealth Facilities: Implementation Issues.
59
References
______. 1992b. “Strengthening of Health Services inMalawi: Report of a Study on Co-ordination and Col-laboration Between MOH and the Private HospitalAssociation of Malawi.” Lilongwe, Malawi.
______. March-April 1994. “MOH Workshops on ActionPlanning for Strengthening Decentralisation Process.”Club Makokola.
Republic of Malawi Ministry of Health and Population(MOHP). n.d. Decentralization in Malawi: The Case ofMinistry of Health and Population.
______. September 1995. Health Policy Framework. Lilongwe.______. July 1-2, 1996. “Planning the Health Sector.” Back-
ground paper for the workshop on health planningissues in Malawi. Mangochi, Club Makokola.
Soka, L.D. July 1-3, 1996. MOHP Workshop on HealthPlanning Issues in Malawi. Ministry of Local Govern-ment and Rural Development.
World Bank. March 19, 1996a. Malawi—Human Resourcesand Poverty: Profile and Priorities for Action. HumanResources Division, Southern Africa Department.Washington, D.C.
______. November 10-December 6, 1996b. “Aide Mem-oire: Population, Health and Nutrition Sector CreditImplementation Review Mission.”
60 AFRICA REGION HUMAN DEVELOPMENT WORKING PAPER SERIES

