bethel elementary school - welcome to greenville county
TRANSCRIPT

1
Bethel Elementary School 111 Bethel School Road Simpsonville, SC 29681
Brenda Byrd Principal
Greenville County Schools
W. Burke Royster
Superintendent
Action Plan 2013-14 through 2017-2018
2
2013 Calendar Year
SCHOOL RENEWAL PLAN COVER PAGE
SCHOOL: Bethel Elementary School SCHOOL DISTRICT: Greenville County Schools SCHOOL RENEWAL PLAN FOR YEARS: 2013-14 through 2017-18 (five years) SCHOOL RENEWAL ANNUAL UPDATE FOR: 2013-14 (one year)
Assurances The school renewal plan, or annual update of the school renewal plan, includes elements required by the Early Childhood Development and Academic Assistance Act of 1993 (Act 135) and the Education Accountability Act of 1998 (EAA) (S.C. Code Ann. §§ 59-18-1300 and 59-139-10 et seq. (Supp. 2004)). The signatures of the chairperson of the board of trustees, the superintendent, the principal, and the chairperson of the school improvement council are affirmation of active participation of key stakeholders and alignment with Act 135 and EAA requirements. CHAIRPERSON, BOARD OF TRUSTEES
Mr. Charles J. Saylors
PRINTED NAME SIGNATURE DATE
SUPERINTENDENT
Mr. W. Burke Royster
PRINTED NAME SIGNATURE DATE
CHAIRPERSON, SCHOOL IMPROVEMENT COUNCIL
Kristi Nelson
PRINTED NAME SIGNATURE DATE
PRINCIPAL
Brenda Byrd
PRINTED NAME SIGNATURE DATE
SCHOOL ADDRESS: 111 Bethel School Road, Simpsonville, SC 29681
SCHOOL TELEPHONE: (864) 355-4100
PRINCIPAL’S E-MAIL ADDRESS: [email protected]
3
STAKEHOLDER INVOLVEMENT FOR SCHOOL PLAN
List the name of persons who were involved in the development of the school renewal plan. A participant for each numbered category is required.
POSITION NAME
1. PRINCIPAL: Brenda Byrd
2. TEACHER: Jennifer King
3. PARENT/GUARDIAN: Stephanie Yearwood 4. COMMUNITY MEMBER: Michele Frazier
5. SCHOOL IMPROVEMENT COUNCIL: Kristi Nelson
6. OTHERS* (May include school board members, administrators, School Improvement
Council members, students, PTO members, agency representatives, university partners, etc.)
POSITION NAME Assistant Principal Susan Skelton Administrative Assistant Julie Cooke Instructional Coach Kim Brice *REMINDER: If state or federal grant applications require representation by other
stakeholder groups, it is appropriate to include additional stakeholders to meet those requirements and to ensure that the plans are aligned.
4
ASSURANCES FOR SCHOOL PLAN
Act 135 Assurances
Assurances, checked by the principal, attest that the district complies with all applicable Act 135 requirements. __X__ Academic Assistance, PreK–3 The school makes special efforts to assist children in PreK–3 who demonstrate a need
for extra or alternative instructional attention (e.g., after-school homework help centers, individual tutoring, and group remediation).
__X___ Academic Assistance, Grades 4–12 The school makes special efforts to assist children in grades 4–12 who demonstrate a
need for extra or alternative instructional attention (e.g., after-school homework help centers, individual tutoring, and group remediation).
__X__ Parent Involvement The school encourages and assists parents in becoming more involved in their
children’s education. Some examples of parent involvement initiatives include making special efforts to meet with parents at times more convenient for them, providing parents with their child’s individual test results and an interpretation of the results, providing parents with information on the district’s curriculum and assessment program, providing frequent, two-way communication between home and school, providing parents an opportunity to participate on decision-making groups, designating space in schools for parents to access educational resource materials, including parent involvement expectations as part of the principal’s and superintendent’s evaluations, and providing parents with information pertaining to expectations held for them by the school system, such as ensuring attendance and punctuality of their children.
__X__ Staff Development The school provides staff development training for teachers and administrators in the
teaching techniques and strategies needed to implement the school/district plan for the improvement of student academic performance. The staff development program reflects requirements of Act 135, the EAA, and the National Staff Development Council’s revised Standards for Staff Development.
__X__ Technology The school integrates technology into professional development, curriculum
development, and classroom instruction to improve teaching and learning.
__X___ Recruitment The district makes special and intensive efforts to recruit and give priority to serving
those parents or guardians of children, ages birth through five years, who are considered at-risk of school failure. “At-risk children are defined as those whose school readiness is jeopardized by any of, but no limited to, the following personal or family situation(s): Educational level of parent below high school graduation, poverty, limited English proficiency, significant developmental delays, instability or inadequate

5
basic capacity within the home and/or family, poor health (physical, mental, emotional) and/or child abuse and neglect.
__X__ Collaboration The school (regardless of the grades served) collaborates with health and human
services agencies (e.g., county health departments, social services departments, mental health departments, First Steps, and the family court system).
__X__ Developmental Screening The school ensures that the young child receives all services necessary for growth and
development. Instruments are used to assess physical, social, emotional, linguistic, and cognitive developmental levels. This program normally is appropriate at primary and elementary schools, although screening efforts could take place at any location.
_____ Half-Day Child Development The school provides half-day child development programs for four-year-olds (some
districts fund full-day programs). The programs usually function at primary and elementary schools, although they may be housed at locations with other grade levels or completely separate from schools.
__X__ Developmentally Appropriate Curriculum for PreK–3 The school ensures that the scope and sequence of the curriculum for PreK–3 are
appropriate for the maturation levels of students. Instructional practices accommodate individual differences in maturation level and take into account the student's social and cultural context.
__X__ Parenting and Family Literacy The school provides a four component program that integrates all of the following
activities: interactive literacy activities between parents and their children (Interactive Literacy Activities); training for parents regarding how to be the primary teachers for their children and full partners in the education of their children (parenting skills for adults, parent education); parent literacy training that leads to economic self-sufficiency (adult education); and an age-appropriated education to prepare children for success in school and life experiences (early childhood education). Family Literacy is not grade specific, but generally is most appropriate for parents of children at the primary and elementary school levels and below, and for secondary school students who are parents. Family Literacy program goals are to strengthen parent involvement in the learning process of preschool children ages birth through five years; promote school readiness of preschool children; offer parents special opportunities to improve their literacy skills and education, a chance to recover from dropping out of school; and identify potential developmental delays in preschool children by offering developmental screening.
__X__ Coordination of Act 135 Initiatives with Other Federal, State, and District Programs The district ensures as much program effectiveness as possible by developing a district-wide/school-wide coordinated effort among all programs and funding. Act 135 initiatives are coordinated with programs such as Head Start, First Steps, Title I, and programs for students with disabilities.

6
TABLE OF CONTENTS
Introduction .................................................................................... 7
Executive Summary ......................................................................... 9
School Profile ................................................................................ 12
Mission and Beliefs ....................................................................... 22
Data Analysis and Needs Assessment ........................................... 23
Action Plan .................................................................................... 33
School Report Card ....................................................................... 69

7
Introduction The Bethel Elementary School self-study was conducted to evaluate our strengths and weaknesses in order to develop goals and strategies. The portfolio provides our school with an ongoing means for self-assessment, communication, continuous improvement, and accountability. The staff was organized into committees to complete the self-assessment and to determine strategies for improvement. Parent groups, such as PTA Board and School Improvement Council, provided input regarding the school improvement plan.
Committee 1 Purpose and Direction
Jennifer King* Farrah Stephen Jennifer Foster Susan Arnold Laura Kennedy Jennifer Reynolds Christina Donohue Becky Poole Sherri Jackson Ronda Smith Carol Shinpoch
Committee 2 Governance and Leadership
Amanda Guest* Susan Skelton Holly Betsill Brittany Willis Mary Heaton Tara Richter Jessica Acor Hope Edlin Kim Phillips Barbara Douglas Diana Dailey
Committee 3 Teaching and Assessing
Learning April Roberts* Brenda Byrd Rosie Overby Sharon Davis Christine Hendrix Stephanie Wood Melissa Bahia Nick King Barbara Key Susan Sutton Dana Glenn Sarah Meekins Sara Beth Fuller
Committee 4 Resource and Support Systems
Vicki Williams* Kim Brice Tainaka Seabrook Patti Ellis Callie Sammons Jeanette Burdette Katie Beebe Kathi Peer Linda Manley Elizabeth Warde Julianne Kaye Karla Goodman Karen Newton
Committee 5 Using Results for Continuous
Improvement Leslie Cribb* Julie Cooke Lucie Snyder Chelsea Ford Melissa Fairbanks Ashleigh Gregory Wendy Rodgers Sue Irick Sherrie Brookie Cynthia Hudson Brooke Kleinfelter

8
PTA Board
Co-Presidents – Mandi Palmer & Stephanie Yearwood
Treasurer – Lindsey Wilkins
VP Volunteers – Lori Flaherty
VP Services – Kelly Radecki
VP Ways & Means – Kristi Nelson
Secretary – Amy Moore
Hospitality – Kerrie Ostrander
Historian – Joni Puckett
School Improvement Council
Elected Members Chairperson – Kristi Nelson Parent – Rick Reames Teacher – Callie Sammons Parent – Jodi Ware Parent – Lindsay Wilkins Teacher – Brittany Willis Appointed Members Community Member – Tyron Cotton Community Member – Michele Frazier Community Member – Lillie Lewis Ex-officio Members Principal – Brenda Byrd Assistant Principal – Susan Skelton Administrative Assistant – Julie Cooke Instructional Coach – Kim Brice Guidance Counselor – Barbara Douglas Parent/Teacher Organization – Mandi Palmer Parent/Teacher Organization – Stephanie Yearwood

9
Executive Summary
Central to everything we do is the belief that all children are capable of learning. High expectations challenge students to reach their greatest potential. We not only emphasize academic achievements, but also the importance of outstanding character and personal responsibility. Our daily goal is to facilitate learning in our students’ life-long journey to become responsible, caring individuals. Through the use of Continuous Quality Improvement, our students learn valuable problem solving techniques, enabling them to become productive citizens beyond the walls of our school. Students benefit from a nurturing environment that addresses their social and emotional needs while encouraging them to take an active part in a variety of school activities. Numerous clubs and school events are available in which students can participate, fostering school pride within a community of learners. Each year a school-wide theme promotes cohesiveness within our school family. This theme is woven into curricular experiences, visuals throughout the building, and school-wide events. A culinary motif accented the school environment throughout the year encouraging students, families, and staff to cook up “A Recipe for Success.” Needs Assessment Summary for Student Achievement
Received an Absolute rating of Excellent and an Overall rating of Excellent for the past three school years on the State of South Carolina Annual School Report Card
Obtained an A (93.7)for the ESEA/Federal Accountability Rating System
Earned a Palmetto Gold Award for Student Achievement on PASS testing
Needs Assessment Summary for Teacher and Administrator Quality The faculty is structured into teams and committees to involve all staff in decision making. These groups/committees are as follows:
Administrative Team o Consists of the principal, assistant principal, administrative assistant, and instructional coach o Reviews grade level minutes, information shared from the central office, lesson plans, student
achievement, teacher evaluations, and school activities and events o Discusses instructional and operational issues to be addressed with grade level leaders, PTA, and
SIC
Faculty Council o Consists of the administrative team, grade level leaders, special education, related arts, multiage,
and guidance/speech o Discusses instructional and operational aspects of the school o Disseminate information to grade level teams
Grade Level Teams o Consist of the team leader and teachers from the grade level o Collaborate to create lesson plans o Share best practices o Record minutes to be shared with the administrative team
Curriculum Committees (ELA, Math/Technology, Science/Health and Social Studies) o Consist of curriculum committee chairperson, administrator, and teachers from each grade level o Disseminate information received from the district Academic Specialists

10
o Discuss articles pertaining to their content area o Share best practices related to the curriculum content area
Needs Assessment Summary for School Climate As visitors enter our school each day, they observe an attractive exterior, adorned with freshly planted flowers, seasonal wreaths and flags. The lobby is welcoming and comfortable. A bulletin board outside the front office displays upcoming events, student work, and/or quality tools used to enhance classroom instruction. Students, teachers and parents spend each day in an inviting facility where there is space to provide instruction and encourage learning. Sixty-three developmentally appropriate classrooms support daily instruction. The administration outlines expectations and provides regular feedback to staff regarding classroom environment. Quality student work labeled with title and standard is attractively displayed in the hallways, and the class mission statement is posted by each door. Classroom data centers are posted to track the overall progress of each class. Eye-catching murals decorate the walls throughout the building. Recently, a local artist painted inviting outdoor scenes in our cafeteria to create a warm, friendly environment. Playground equipment is inspected regularly to comply with safety codes. Students, staff, and the community use the paved walking track to improve physical fitness. The school's greenhouse, an outdoor classroom, and a butterfly garden provide additional opportunities to enhance instruction. Our maintenance staff, including one plant engineer and six custodians, maintains our appealing building and grounds. This staff takes pride in keeping the building clean and all equipment in working order. Maintenance of the school grounds and landscaping are included in custodial duties. Inspection results from energy audits are provided to the staff to create an awareness of energy saving efforts. To further ensure all issues are addressed, we use custodial inspections and survey results on the overall cleanliness of the school to make necessary modifications and improvements. The custodial staff, as well as school personnel, immediately reports all safety concerns, both inside and outside the building. Our well maintained facility enables us to provide a safe learning environment for students and staff. Our school utilizes the district Crisis Response Plan as well as daily operating plans to ensure the safety and well-being of students and staff. Evacuation maps are clearly posted in each room. Fire, lockdown, tornado, earthquake, and bus evacuation drills are held on a regular basis. Procedures are emphasized during classroom instruction on topics such as fire, bus, drug, personal, home and playground safety. Our school has several communication devices which contribute to a safe environment. For constant access, the administration, custodial and office personnel use two-way radios. A telephone is available in each room as well as a two-way intercom system with an emergency call button. Security measures are used to ensure safety in our facility daily. A zoned officer from the Mauldin Police Department patrols the school campus on a regular basis. Signs on all exterior doors state visitors are to report to the main office where they are required to sign in and out through Simple Track and receive a visitor’s badge indicating a reason for the visit. Safety is assured with time-stamped video cameras, fire and motion detectors, security alarms, a weather radio, and a two-way radio linked directly to security at the central office. Establishing a safe, secure environment for our students and staff is a priority. As a result of our continued efforts, our school has continued to receive the Safe Schools Award. Challenges In an ever changing technological world, it is a challenge to provide the most current technology for our students. Due to the fact that we do not have wireless capabilities in our facility at this point, it limits our ability to provide the most up-to-date technology. We are fortunate to have Promethean boards in every classroom, multiple computer labs, ActivExpressions voting devices, Nooks, Hue cameras, Flip cameras, and
11
the capability to provide virtual field trips. We will continue to assess our needs and develop strategies to incorporate technology into the future. In addition to challenges with technology, we recently experienced a change in our population due to students being rezoned. Approximately 150 of our students were rezoned due to the opening of a new elementary school, and we received 80 students from surrounding elementary schools. We implemented new strategies to assist families in making the transition to a new school. Our school will continue to address the needs of our growing student population. Awards
2012-2013 Greenville County Administrator of the Year Award
2012-2013 Energy Star Rated Facility
2012-2013 Greenville County Elementary Healthy School of the Year Award
2012-2013 American Heart Association’s Fit-Friendly Worksite Gold Achievement
2010-2013 Palmetto Gold Award
2010-2013 South Carolina Red Carpet Award
2010-2013 Safe Kids Award
2010-2011 Palmetto’s Finest Award
2010-2011 Greenville County Assistant Administrator of the Year Award
2010-2012 100% PTA Membership
Six National Board Certified Teachers

12
School Profile
School Community School History Bethel Elementary School was established between 1801 and 1810, the original school was housed in a one-room logged building. In 1916, a two-room school replaced the original building, and the deed was transferred to the Board of Trustees. The school was built on its present site in 1964 to educate 477 students. Today, the school sits in the heart of the fastest growing region of South Carolina. Cornfields have given way to housing developments, country roads to highways. The tiny sand colored school was enlarged to three times its original size in a $6 million expansion in 1995.
Currently, our school is one of nearly 100 schools in the county. We are located in a growing suburb (population 23,000) in the Upstate of South Carolina. This area is served by four major universities and numerous private and charter schools. Some of the largest employers in our area include Cryovac Division of Sealed Air Corporation and KEMET Electronics. Other major industries in the area include Michelin Tire Corporation, General Electric, and BMW. Other occupations include management, professional, sales, office, service, construction, and maintenance positions.
Our reputation of providing a quality education, caring faculty, and outstanding student achievement is a reflection of the high expectations of our stakeholders. Parents and community value education as evidenced by 30 continuous years of 100% PTA membership and dedicated volunteers. In order to meet the transportation needs of our students, we have thirteen bus routes. In addition, over twenty local day care facilities pick up students each afternoon, and approximately 130 students attend our Extended Day Program to meet the needs of working families. While our community is comprised mostly of middle income families, we have 35.7% of our student population qualifying for free or reduced lunch. Student attendance continues to remain steady at 97.15%. We serve students from neighborhoods in close proximity to the school, a Hispanic community, a children’s group home, and three minority communities located outside of the immediate area of the school.
Our Leaders
Mrs. Brenda D. Byrd has been the principal at Bethel Elementary since 2006. She holds a Bachelor’s Degree in Elementary Education and a Master’s Degree in Administration and Supervision from Clemson University. Mrs. Byrd has twenty-five years of experience as a classroom teacher and administrator. She is a member of the South Carolina Association of School Administrators (SCASA) and the National Association of Elementary School Principals (NAESP). Mrs. Byrd was named as a finalist for the South Carolina PTA Principal of the Year in 2011, a finalist for the SCASA Elementary Principal of the Year in 2012, and she received the Greenville County Schools Administrator of the Year Award in 2013. She has presented at local, state, and national education conferences, and she enjoys mentoring new principals in Greenville County. Our assistant principal, Susan Skelton, has been at Bethel for twenty years. She has a Bachelor’s Degree in Elementary Education, a Master’s Degree in Curriculum and Instruction, and an Educational Specialist Degree in Elementary/Middle School Administration and Supervision. She has thirty years of experience in education, and fifteen of these have been in administration. She is a member of the South Carolina Association of School

13
Administrators. Ms. Skelton was named Greenville County Schools Assistant School Administrator of the Year in 2011. Our administrative assistant at Bethel Elementary School is Julie Cooke. Mrs. Cooke grew up in the Greenville area. She attended Taylors Elementary, Hillcrest Middle, and Mauldin High School. She went to the University of South Carolina Upstate for her Bachelor’s Degree in Elementary Education. She attended Clemson University, where she earned a Master’s Degree in School Administration and Supervision. Mrs. Cooke has taught for seven years. She is a member of South Carolina Association of School Administrators. She won Support Staff Person of the Year for 2012-2013 school year.
Parental Involvement
Our administrators, teachers, and community are involved in the process of gathering data that encourages continuous improvement. Community and parent volunteers are an ever-present source of support. The School Improvement Council (SIC) and PTA Board are both comprised of community members, parents, teachers, and administrators providing leadership through which many decisions are made that impact the school. Meeting dates are published for the community, and meetings are open to the public. Decisions and school events impacted by community involvement include a wellness initiative, Boosterthon, and the school carnival. The SIC assists with developing the school improvement plan, the School Report Card narrative, Report to the Parents, and identifying strengths and strategies for effective school improvement. School Report Card surveys are administered to students, teachers, and parents to evaluate all aspects of the school program. Results are used to monitor communication efforts, program effectiveness, and community input. Partnerships Partnerships are essential to our school’s mission by supporting “a nurturing learning environment and to provide a quality education.” Local retail stores (Bi-Lo, Publix, Target, Moe’s, Fuddruckers, Chick-fil-A) provide financial support. Numerous churches support our school, providing mentoring, food to disadvantaged students, use of their facilities and equipment, and support for teacher appreciation. Several area churches sponsor an after school Good News Club for students in first through fifth grades. Community speakers provide “Lunch and Learn” parenting workshops and classroom presentations related to the curriculum. Mauldin High School provides service learning students to work with our children who need extra assistance. We are fortunate to work alongside a supportive community to benefit our school. School Personnel Our staff consists of forty-two classroom teachers; two of those are self-contained classes for students with neurological disorders. We also have six related arts teachers, three of those are full time and three are part time. We have three resource teachers, two speech teachers, and two gifted and talented teachers. We also have two guidance counselors, one ESOL teacher, and a media specialist.

14
All of our teachers are highly qualified in the area in which they teach. We have 72% of our staff with advanced degrees, and there are six teachers that have received National Board Certification.
Teacher Attendance
2011-2012 95.7
2010-2011 94.5
2009-2010 96.6
Additional personnel include three office personnel, computer lab manager, two school nurses, a plant engineer, six custodians, eleven assistants, media center clerk, cafeteria manager, and seven food services workers. We have one person who provides autism services to students. We also have an extended day program with a director and ten additional workers. Bus drivers also provide services to our students. Other district personnel serve as support to the instructional program and are available to assist in meeting the needs of the Bethel Elementary population.
0 1 to 3 4 to 5 6 to 89 to10
11 to15
16 to20
21 to25
26+
Series1 1 7 3 11 4 10 5 7 13
0
2
4
6
8
10
12
14
Nu
mb
er
of
Teac
he
rs
Staff Years of Experience
Bachelors Bachelors + 18 Masters Masters + 30
Series1 13 5 43 4
0
5
10
15
20
25
30
35
40
45
50
Nu
mb
er
of
Teac
he
rs
Staff Degree Levels

15
Student Population
147 160
143 146
130
160
0
20
40
60
80
100
120
140
160
180
K5 First Second Third Fourth Fifth
School Enrollment 2012-2013
20.80%
8.50%
59.80%
10.90%
Ethnicity 2012-2013
African American
Hispanic
Caucasian
Other

16
Student Attendance
2011-2012 97.4
2010-2011 97.4
2009-2010 97.2
1048
993
886
800
850
900
950
1000
1050
1100
2010-2011 2011-2012 2012-2013
Enrollment Over Time 2010-2013
0%20%40%60%80%
100%
2010 2011 2012
Caucasian 66.50% 65.20% 59.80%
African American 19.90% 17.10% 20.70%
Hispanic 6.40% 7.50% 8.40%
Other 7.00% 10.20% 10.90%
Enrollment by Ethnicity Over Time 2010-2012

17
62
5
15
2
25
16
0
10
20
30
40
50
60
70
80
Special Education Placement 2012-2013
1048
993
886
800
850
900
950
1000
1050
1100
2010-2011 2011-2012 2012-2013
Enrollment Over Time 2010-2013

18
2010-2011 2011-2012 2012-2013
Series1 28.9 27.8 34
0
20
40
60
80
100
Percentage of Students Qualifying for Gifted & Talented
2010-2013
2010-2011 2011-2012 2012-2013
% Paid Lunch 69.6 70.1 64.3
% Free Lunch 26.9 25.5 30.2
% Reduced Lunch 3.5 4.4 5.5
0
20
40
60
80
100
Student Lunch Status 2010-2013

19
Curriculum, Instruction, and Assessment The core curriculum provides rigorous learning activities in the areas of reading, math, science, and social studies. Essential learning is facilitated through the use of the Common Core and South Carolina State Standards and correlating support documents, district-developed units of study, and supportive instructional materials. Students receive 30-45 minutes of weekly instruction in each of the following areas: art, music and physical education. Students attend classes in the media center and computer labs, where research and technology skills are reinforced. A wide variety of instructional materials are utilized to support the curriculum. In Reading, the Four-Blocks Literacy Model is used to provide instruction in Guided Reading, Self-Selected Reading, Writing, and Working with Words. Approximately two hours of instruction is allocated to the Four Blocks model each day. The Houghton-Mifflin Harcourt Basal Reading Series is used in grades 1-5 to support the curriculum and the development of strategic readers. Students are provided their Lexile range as a result of MAP testing, and they are encouraged to select books within their range. Beginning in the 2013-2014 school year, we will become a balanced literacy school, utilizing the Fountas and Pinnell model for language arts instruction. Writing is the tie that binds the curriculum and is integrated throughout other subject areas. The writing process is used to guide students from brainstorming to a published piece. Student work is published in individual or class books, on wall displays, in school-wide writing projects, and as a part of local and state contests. Twice a year all students respond to district writing prompts. The Wee Deliver postal system offers authentic ways to communicate with students and faculty throughout the school. Our mathematics program is academically challenging. It is active, relevant, and integrated with other curriculum areas. All teachers have received training in Everyday Counts Calendar Math, which provides lessons and activities to preview, review, practice, and discuss critical math concepts and skills. The Macmillan McGraw-Hill Mathematics series is used in grades K-5 to support the curriculum. Approximately one hour is scheduled for math each day. Students capitalize on previously learned knowledge, focusing on building number sense, basic numeric operations, and algebraic concepts, geometric patterns and relationships, measurement, logical reasoning, probability and statistics. Our instruction emphasizes problem-solving and hands-on strategies, which allow students the opportunity to make connections between classroom learning and real-life experiences. Daily Oral Math, Fantastic Five, Sunshine Math, Hands-On Equations, and manipulatives offer students the opportunity to work with computational procedures and reasoning skills. A wide variety of instructional materials are utilized to support the science curriculum. Our teachers channel student interests, aligned to South Carolina standards into inquiry-based lessons addressing physical science, earth science, and life science. The Macmillan McGraw-Hill series is used in grades K-5. District science kits are also incorporated to provide a more hands-on approach to science. Students are encouraged to showcase their knowledge of science through participation in our Science Fair. Teachers supplement science instruction through field trips to Roper Mountain Science Center, The Riverbanks Zoo, Paris Mountain, and Table Rock. The social studies curriculum integrates research, writing, and presentation skills as students are introduced to various aspects of our physical and social world. Teachers utilize the South Carolina standards, state support documents, and district curriculum guides to drive instruction. The Scott Foresman textbook is a valuable resource in the social studies classroom. Various publishing companies provide additional curriculum resources for social studies. The curriculum is also supplemented through the integration of novels and field

20
trips to Columbia, Charleston, and Washington, DC. The amount of time allocated for both science and social studies instruction varies by grade level due to integration into other subjects through thematic units. Counseling and Other Student Support Services Our counseling staff provides a high level of support services for students at Bethel. Such services include school-wide character education, parent education, classroom instruction, and small group and individual counseling. Our guidance counselors provide classroom and small group instruction in study skills.
School Initiatives
Our vision focuses on Continuous Quality Improvement (CQI) for the students and staff at our school. Eight years ago our staff was approached by the Carolina First Center for Excellence (CFCE) regarding the possibility of joining the Quality initiative. Staff members from CFCE provided professional development for our faculty, and they modeled the use of quality tools. Our school staff spent much of the 2006-2007 school year increasing our knowledge of Continuous Improvement and understanding the benefits it could provide. At the conclusion of this process, our principal asked all staff members to provide individual feedback regarding the use of Continuous Quality Improvement. As a result, our staff expressed strong support for this initiative. We agreed that CQI would provide a unified vision, and it would create a vehicle for increased student responsibility and achievement. Over the past several years, our school has grown in the use of Quality enabling our students to monitor their progress and set goals for continued success. Recently we established Bethel Elementary’s identity as A School of Quality to emphasize our use of CQI. Since 1997, multiage has been an innovative option to consider in lieu of a traditional classroom setting. Our Primary Multiage classroom consists of a combination of first and second graders, while our Intermediate Multiage classroom has third and fourth grade students. Admittance to the multiage program involves an application process and selection by lottery. Thematic projects, literature circles, and cooperative learning centers are incorporated based on curriculum standards. Assessment is often times open-ended and respects differences in learning abilities, as well as levels. Breakfast Club is a before school tutorial program offered to students scoring Not Met on PASS testing. Students attend forty-five minute sessions twice a week in the areas of math and/or reading, based on students’ PASS performance. PASS Practice sessions are open to all third through fifth graders and meet once a week after school during the ten weeks prior to PASS testing. Teachers emphasize test taking strategies in math, reading, and writing. Recently, Bethel has promoted a healthier school climate for students and employees. A team of staff members received training for CATCH (Coordinated Approach to Child Health). Strategies are implemented to support the CATCH program. A new Culinary Creations Menu was adopted in the cafeteria and students are encouraged to take advantage of the healthier options. Teachers infuse movement into their daily instruction. The PTA assists in our efforts by encouraging parents to provide healthier food options during class parties and student incentives. As a result our school has received numerous awards: American Heart Association’s Fit-Friendly Worksite Gold Achievement and Greenville County Elementary Healthy School of the Year Award. Along with the Healthy School Award, we received $1,250.00 to be used toward future wellness initiatives.
Enrichment Programs
Our school offers a wide variety of enrichment opportunities to enhance students’ academic skills and school experience. Academically, our program for the gifted and talented, serves 149 students in grades three through five. Students in kindergarten through fifth grades may participate in Sunshine Math, a take home

21
enrichment program, published by Creative Concern Publications. This program is designed to teach problem-solving skills, and critical and creative thinking, and responsibility. The SEEDS (Starting Early Enrichment Designs for Students) program exposes kindergarten through third grade students to a wide variety of authentic literature and encourages the development of higher order thinking skills. Through Junior Achievement, local business partners from our community provide students an understanding of our world through consumer awareness.
In addition, there is a variety of opportunities in place at Bethel Elementary to enhance the school experience.
Clubs for third through fifth grade are provided during school hours to ensure that all of our students can attend a club of their choice. Some examples of these clubs are gardening, drama, technology, and sign language.
Students in grades second through fifth may participate in Bethel’s Running Club. This club meets weekly to promote an active lifestyle through running, teach goal setting, encourage self-discipline, and give students opportunities to participate in local races.
Students in Cardinal Chorus were chosen through vocal auditions. They perform annually for special community events such as Spring Sing, the Greenville County all-district chorus, and Rotary Night.
To develop effective communication skills, fourth and fifth grade students may apply for jobs on the Broadcasting Team in our multimedia production center. Daily morning news is broadcast school-wide, with fifth grade students serving as news anchors.
Fifth grade students are chosen to help oversee the safety of our students as safety patrols.
Student Council provides fourth and fifth graders the opportunity to serve their school. We have a representative and alternate for each fourth and fifth grade class.
Instruction in all areas is enriched through the use of our computer labs. We currently have five computer labs. All labs serve kindergarten through fifth grade students on a rotating basis. Students learn keyboarding skills and use educational software programs to supplement basic skills. A global connection is made as our students access the Internet to acquire information on a variety of subjects and use that information to create reports and presentations.
Our media specialist emphasizes the joy of reading by discussing South Carolina Book nominees, hosting two book fairs each year, celebrating National Children’s Book Week, and inviting special authors to visit. During the 2012-2013 school year, Cynthia Lord, an award winning children’s book author, spoke to our students.
Instructional trips include traveling to the Peace Center, farms and orchards, Walnut Grove, Roper Mountain Science Center, the State Capitol in Columbia, Greenville Children’s Museum, Charleston, Camp Greenville, and Washington, DC.

22
Mission and Beliefs
Mission The mission of Bethel Elementary School is to engage children in a nurturing learning environment and to provide a quality education.
Beliefs We believe that:
All children can learn.
All children deserve equal educational opportunities.
All children have individual strengths and needs.
Children learn best in a stimulating and challenging environment that is safe and nurturing.
Students have the responsibility to be active learners and to achieve individual goals.
Students’ active use of technology prepares them for 21st century skills.
Successful students are good decision makers and critical thinkers.
Education is a partnership between home, school, and community.
A quality education creates responsible citizens, strong character, and a desire for life-long learning.

23
Data Analysis and Needs Assessment
Student Achievement Measures of Academic Progress (MAP) One method used by Bethel Elementary to track student progress is through MAP- Measures of Academic Progress. MAP is a district –wide assessment for second through fifth grade to assess student achievement. It is an optional assessment for first grade. Students are tested in the fall, winter, and spring in the areas of reading and math. Teachers meet in the fall, winter, and spring to analyze data obtained from these tests and to guide instruction. The scores are analyzed according to grade level norms and student growth. Teachers used the information obtained from the results to guide instruction and focus on student’s strengths and weaknesses. The following chart shows the percentage of students who met their target growth goals each year from 2009-2010 to 2012-2013.
As seen in the graph above, our school has shown continuous gains in MAP data in the area of math from 2010 to 2013. Reading scores declined for the 2012-2013 school year. This decline could be attributed to the current MAP test not being aligned to Common Core Standards.
2010-2011 2011-2012 2012-2013
Reading 57 67.3 51.8
Math 56.1 58.3 65
0102030405060708090
100
MAP Data 2010-2013

24
Grade Math 2010-2011
Percentage
Meeting Growth Target
Math 2011-2012
Percentage
Meeting Growth Target
Math 2012-2013
Percentage
Meeting Growth Target
Reading 2010-2011
Percentage
Meeting Growth Target
Reading 2011-2012
Percentage
Meeting Growth Target
Reading 2012-2013
Percentage
Meeting Growth Target
2 57.4 50.9 64.2 64.1 58.4 62.5
3 40.4 61.5 65.4 57.3 61.3 54.4
4 53.5 67.4 71.8 59.1 58.9 43.5
5 71.4 72.8 80.8 55.2 54.6 60.5
When following a cohort of students from third to fifth grade in math, 40.4% met Target RIT in 2011, 67.4% in 2012, and 80.8% in 2013, an increase of 40.4%. For the same cohort of students in reading, 57.3% met Target RIT in 2011, 58.9% in 2012, and 60.5% in 2013, an increase of 3.2%. Goal setting, student-teacher conferencing, CompassLearning, and quality tools have made a positive impact on student achievement. The use of the Des Cartes alignment with MAP testing is used to aide teachers in assessing and providing differentiation in their classrooms.

25
Palmetto Assessment of State Standards (PASS)
20102011
5th Grade Only2012
5th Grade Only
% Not Met 16.4 12 16.4
% Met 30 32.2 28.9
% Exemplary 53.6 55.8 54.6
0
20
40
60
80
100
Writing PASS Data
2010 2011 2012
% Not Met 10.2 10.1 11.7
% Met 29.6 31.2 28.1
% Exemplary 60.1 58.7 60.2
0
20
40
60
80
100
ELA PASS Data

26
2010 2011 2012
% Not Met 14.9 13.1 11.7
% Met 33.2 28.4 28.1
% Exemplary 51.9 58.5 60.2
0
20
40
60
80
100
Math PASS Data
2010 2011 2012
% Not Met 15.2 17.7 13.6
% Met 49.5 50.6 59.3
% Exemplary 35.3 31.7 27.2
0
20
40
60
80
100
Science PASS Data
2010 2011 2012
% Not Met 12.6 11.1 12.4
% Met 46.2 37 37.8
% Exemplary 41.2 51.9 49.8
0
20
40
60
80
100
Social Studies PASS Data

27
PASS Comparison 2011-2012
Writing 3rd 4th 5th Bethel Greenville SC Bethel Greenville SC Bethel Greenville SC
% Not Met n/a n/a n/a n/a n/a n/a 17.8 21.7 26.5
% Met n/a n/a n/a n/a n/a n/a 28.2 38.5 38.7
% Exemplary n/a n/a n/a n/a n/a n/a 54.0 39.8 34.9
English Language Arts (ELA)
3rd 4th 5th
Bethel Greenville SC Bethel Greenville SC Bethel Greenville SC
% Not Met 14 16.7 19.7 11.6 17.9 21.8 13 20.5 23.5
% Met 16.6 19.3 22.1 33.3 35.3 36.1 34.6 39.1 39.9
% Exemplary 69.4 64 58.2 55 46.9 42.1 52.5 40.3 36.6
Math 3rd
4th 5th
Bethel Greenville SC Bethel Greenville SC Bethel Greenville SC
% Not Met 18.5 22.7 27.4 10.1 16.8 21.6 10.5 18.6 23.9
% Met 28 28.3 29.5 28 37.5 38.5 29 41.2 41.9
% Exemplary 53.5 49 43 61.9 45.7 39.9 60.5 40.1 34.2
Science
3rd 4th 5th
Bethel Greenville SC Bethel Greenville SC Bethel Greenville SC
% Not Met 23.4 32.7 39.3 12.7 21.3 26.2 13.8 24.4 28.3
% Met 35.1 37.4 36.8 68.8 64.1 60.7 53.8 51.4 49.6
% Exemplary 41.6 29.9 23.9 18.5 14.5 13.1 32.5 24.2 22.1
Social Studies
3rd 4th 5th
Bethel Greenville SC Bethel Greenville SC Bethel Greenville SC
% Not Met 22.5 19.7 25.4 7.9 16.1 19.1 19.5 23.4 30.1
% Met 28.8 37.2 37.9 45.5 47.2 49.4 28 39.5 38.7
% Exemplary 48.8 43.1 36.7 46.6 36.7 31.5 52.4 37.1 31.2
This table shows a comparison of Bethel, Greenville County Schools, and South Carolina. Close examination reveals that Bethel students consistently outperform Greenville County and South Carolina. Test results are analyzed to identify strengths and weaknesses in order to meet the needs of our students.

28
Teacher and Administrator Quality Professional development is determined by student achievement, district initiatives, teacher evaluations, and staff surveys. Some offerings are required by the school and/or district, while others are optional in order to meet the needs of individual teachers. A professional development calendar is given to teachers indicating training opportunities offered at our school.
School-Based Professional Development Calendar 2012-2013
Bethel Professional Development Calendar 2012-2013
Principal- Brenda Byrd Assistant Principal- Susan Skelton Administrative Assistant- Julie Cooke Instructional Coach- Kim Brice
Date Time Title Presenter Description
Where Audience Points
8/14/2012 9:00-12:00
New Teacher Orientation
Brenda Byrd, Kim Brice, and April Roberts
Overview of school policies and procedures
Conference Room
New Teachers 2
8/14/2012 1:00-3:00
Quality Staff Development for New Teachers
Abbey Bell and Jennifer King
Overview of Quality Tools, Data Centers, and Data Notebooks
Media Center
New Teachers 2
8/16/2012 Staff Bus Tour of Bethel Neighborhoods
Susan Skelton and Julie Cooke
Tour attendance area Staff Members N/A
8/20/2012 9:00-10:00
Promethean Overview
Kim Brice Overview of basic tools to use on the Promethean Board
Room 319 New Teachers 1
8/21/2012 1:00-3:00
Paving the Way for Common Core
Paula Burgess
Common Core Overview Cafeteria Certified Staff Members
2
8/29/2012 3:00-4:00
MAP Training Kim Brice Overview of MAP testing and procedures
Cafeteria Teachers administering MAP
1
9/11/2012 3:00-5:00
Promethean Training
Monica Brackett
Teachers will learn how to utilize the Promethean Board for classroom instruction
Media Center
New Teachers 2
9/19/2012 3:00-4:00
Curriculum Committees
Curriculum Chairs
Discuss article, best practices, and pertinent information
Various Classrooms
Teachers, Administrators, and Instructional Coach
1
9/25/2012 3:00-5:00
Promethean Training
Monica Brackett
Teachers will learn how to utilize the Promethean Board for classroom instruction
Media Center
New Teachers 2
9/26/2012 3:00-4:00
Technology Tidbits
Chris Burras
Teachers will learn how to use Edmodo
Computer Lab
All Staff Members
1
10/2/2012 3:00-5:00
Promethean Training
Monica Brackett
Teachers will learn how to utilize the Promethean
Media Center
New Teachers 2

29
Board for classroom instruction
10/3/2012 3:00-4:00
Faculty Meeting
Kim Brice ELA Common Core Overview
Cafeteria All Staff Members
1
10/16/2012 3:00-5:00
Promethean Training
Monica Brackett
Teachers will learn how to utilize the Promethean Board for classroom instruction
Media Center
New Teachers 2
10/24/2012 3:00-4:00
Curriculum Committees
Curriculum Chairs
Discuss article, best practices, and pertinent information
Various Classrooms
Teachers, Administrators, and Instructional Coach
1
11/8/2012 3:00-4:00
Technology Tidbits
Kim Brice and Christina Donohue
Using Edmodo in the Classroom
Computer Lab
All Staff Members
1
11/28/2012 3:00-4:30
Pathways to Writing
Paula Burgess
Common Core Writing Cafeteria Certified Staff Members
2
12/5/2012 3:00-4:30
Faculty Meeting
Kim Brice Smarter Balanced Cafeteria and Computer Labs
All Staff Members
2
1/9/2013 3:00-4:00
Faculty Meeting
Kim Brice Building Academic Vocabulary
Cafeteria All Staff Members
1
1/23/2013 3:00-4:00
Curriculum Committees
Curriculum Chairs
Discuss article, best practices, and pertinent information
Various Classrooms
Teachers, Administrators, and Instructional Coach
1
1/30/2013 3:00-4:30
Pathways to Writing
Paula Burgess
Common Core Writing Cafeteria Certified Staff Members
2
2/6/2013 3:00-4:30
Faculty Meeting
Kim Brice and Jennifer King
Math Common Core and Mathematical Practices
Cafeteria All Staff Members
2
2/20/2013 3:00-4:30
Curriculum Committees
Greenbriar Elementary Faculty
Fountas and Pinnell Greenbriar Elementary Media Center
Teachers, Administrators, and Instructional Coach
2
2/26/2013 3:00-4:00
Technology Tidbits
Chris Burras
Power Teacher Computer Lab
Teachers who assign grades
1
3/6/2013 3:00-4:00
Faculty Meetings
Kim Phillips Accommodations and Modifications
Cafeteria All Staff Members
1
3/20/2013 3:00-4:00
Curriculum Committees
Curriculum Chairs
Discuss article, best practices, and pertinent information
Various Classrooms
Teachers, Administrators, and Instructional Coach
1
3/27/2013 3:00-4:00
Technology Tidbits
Brittany Willis, Jeanette Burdette, Wendy Rodgers
Share technology best practices
Various Classrooms
All Staff Members
1

30
4/10/2013 3:00-4:30
Pathways to Writing
Paula Burgess
Common Core Writing Cafeteria Certified Staff Members
2
Bethel Professional Development Calendar 2013-2014
Principal- Brenda Byrd Assistant Principal- Susan Skelton Administrative Assistant- Julie Cooke Instructional Coach- Kim Brice
Date Time Title Presenter Description
Where Audience Points
6/12/2013 8:00-2:30
Foundations of Balanced Literacy
Linda Scott Initial training for balanced literacy
Cafeteria Kindergarten- 2
nd grade
teachers
6
6/13/2013 8:00-2:30
Foundations of Balanced Literacy
Linda Scott Initial training for balanced literacy
Cafeteria 3rd
-5th
grade teachers
6
8/8/2013 9:00-11:00
Website Workshop
Kim Brice Main Computer Lab
All Teachers and Staff
8/15/2013 Technology Day
Kim Brice and Julianne Kaye
Technology Showcase and Presentation on Databases
Library All Teachers and Staff
N/A
9/17/2013 8:00-2:45
Implementing Balanced Literacy
Linda Scott Teachers will continue to learn about the key components of balanced literacy
TBA K – 5th
grade teachers
9/18/2013 3:00-4:00
Curriculum Committees
Curriculum Chairs
Various Classrooms
Teachers 1
9/25/2013 3:00-4:00
Technology Tidbits
TBA TBA 1
10/8/2013 8:00-2:45
Implementing Balanced Literacy
Linda Scott Teachers will continue to learn about the key components of balanced literacy
TBA K – 5th
grade teachers
10/16/2013 3:00-4:00
Curriculum Committees
Curriculum Chairs
Various Classrooms
Teachers 1
10/30/2013 3:00-4:00
Technology Tidbits
TBA TBA 1
11/6/2013 8:00-2:45
Implementing Balanced Literacy
Linda Scott Teachers will continue to learn about the key components of balanced literacy
TBA K – 5th
grade teachers
11/20/2013 3:00-4:00
Curriculum Committees
Curriculum Chairs
Various Classrooms
Teachers 1
12/18/2013 3:00-4:00
Curriculum Committees
Curriculum Chairs
Various Classrooms
Teachers 1
1/14/20134 8:00-2:45
Implementing Balanced Literacy
Linda Scott Teachers will continue to learn about the key components of balanced literacy
TBA K – 5th
grade teachers
1/22/2014 3:00- Curriculum Curriculum Various Teachers 1

31
4:00 Committees Chairs Classrooms 2/11/2014 8:00-
2:45 Implementing Balanced Literacy
Linda Scott Teachers will continue to learn about the key components of balanced literacy
TBA K – 5th
grade teachers
2/19/2014 3:00-4:00
Curriculum Committees
Curriculum Chairs
Various Classrooms
Teachers 1
2/26/2014 3:00-4:00
Technology Tidbits
TBA TBA 1
3/19/2014 3:00-4:00
Curriculum Committees
Curriculum Chairs
Various Classrooms
Teachers 1
4/23/2014 3:00-4:00
Curriculum Committees
Curriculum Chairs
Various Classrooms
Teachers 1
4/30/2014 3:00-4:00
Technology Tidbits
TBA TBA 1

32
School Climate
School Climate Needs Assessment Our school administers surveys to students, teachers, and parents for the yearly School Report Card. Below is a summary of the results from 2011-2012 survey.
*Only students at the highest elementary school grade level and their parents were surveyed.
Parents, students, and teachers all reported high levels of satisfaction in all areas of the survey. After looking closely at the data for 2012, the following statements had lower rates of satisfaction and could be viewed as challenges:
Parents My child's teachers invite me to visit my child's classrooms during the school day. (23.2% disagreed)
Students
Bathrooms are kept clean. (40.9% disagreed)
Students at my school behave well in the hallways, in the lunchroom, and on the playground. (30.9% disagreed)
Based on this data, strategies have been developed to address these areas of concern. The Action Plan that follows includes strategies that will be implemented.
Number of surveys returned (2011-2012) Teachers 59
Students* 139
Parents* 85
Percent satisfied with learning environment 100% 92.8% 96.4%
Percent satisfied with social and physical environment 100% 95.7% 97.6%
Percent satisfied with home-school relations 100% 95.6% 92.9%

33
PASS % WRITING
SCHOOL RENEWAL PLAN FOR 2013-14 through 2017-18
Student Achievement Teacher/Administrator Quality School Climate Other Priority
GOAL AREA 1: Raise the academic challenge and performance of each student.
PERFORMANCE STATEMENT: Meet the state and federal accountability objectives for all students and subgroups in writing and English
Language Arts each year.
FIVE YEAR PERFORMANCE GOAL: Increase the percentage of students meeting standard (Met and Exemplary) in writing as measured by
the Palmetto Assessment of State Standards (PASS) from 83.5% in 2012 to 88.5% in 2018.
ANNUAL OBJECTIVE: Annually increase by 1 percentage point(s) students meeting standard (Met and Exemplary) in writing as measured
by the Palmetto Assessment of State Standards (PASS).
DATA SOURCE(S): SDE School Report Card
Baseline
2011-12
Planning Year
2012-13 2013-14 2014-15 2015-16 2016-17 2017-18
School
Projected X X 84.5 85.5 86.5 87.5 88.5
School
Actual
83.5
District
Projected X X 78.8 79.8 80.8 81.8 82.8
District
Actual
77.8
Baseline data from 2011-12 is based upon 5th and 8th grade scores only. Projected performance is based upon 3rd through 8th grade scores.
*Information in the above tables is subject to change. Projected performance and actual performance are dependent upon which state
standardized assessment is administered as South Carolina begins full implementation of common core standards in 2013-2014.*

34
PASS % ELA
Student Achievement Teacher/Administrator Quality School Climate Other Priority
FIVE YEAR PERFORMANCE GOAL: Maintain the percentage of students meeting standard in English Language Arts (reading and research)
as measured by the Palmetto Assessment of State Standards (PASS) at 88.3%.
ANNUAL OBJECTIVE: Maintain 88.3% annually students meeting standard in English Language Arts (reading and research) as measured
by the Palmetto Assessment of State Standards (PASS).
DATA SOURCE(S): SDE School Report Card
Baseline
2011-12
Planning Year
2012-13 2013-14 2014-15 2015-16 2016-17 2017-18
School
Projected X X 88.3 88.3 88.3 88.3 88.3
School
Actual
88.3
District
Projected X X 79.0 80.0 81.0 82.0 83.0
District
Actual
78.0
*Information in the above tables is subject to change. Projected performance and actual performance are dependent upon which state
standardized assessment is administered as South Carolina begins full implementation of common core standards in 2013-2014.*

35
PASS AVG. ELA
Student Achievement Teacher/Administrator Quality School Climate Other Priority
FIVE YEAR PERFORMANCE GOAL: By grade band (elementary), meet the required annual measurable objectives (AMOs) in English
Language Arts (reading and research) as measured by the Palmetto Assessment of State Standards (PASS).
ANNUAL OBJECTIVE: Meet the required annual measurable objectives (AMOs) in English Language Arts (reading and research) as
measured by the Palmetto Assessment of State Standards (PASS).
DATA SOURCE(S): ESEA Federal Accountability and SDE School Report Card
ELA - School Baseline
2011-12
Planning
Year
2012-13 2013-14 2014-15 2015-16 2016-17 2017-18
Projected Performance 630 635 640 645 650 655 660
Actual Performance
All Students 682.4
Male 681.2
Female 683.4
White 694.9
African-American 644.6
Asian/Pacific Islander 702.2
Hispanic 655.1
American Indian/Alaskan N/A
Disabled 616.6

36
Limited English Proficient 652.9
Subsidized Meals 646.6

37
ELA - District - Grades 3-5 Baseline
2011-12
Planning
Year
2012-13 2013-14 2014-15 2015-16 2016-17 2017-18
Projected Performance 630 635 640 645 650 655 660
Actual Performance
All Students 671.1
Male 665.7
Female 676.8
White 685.1
African-American 644.4
Asian/Pacific Islander 696.1
Hispanic 650.8
American Indian/Alaskan 688.2
Disabled 614.9
Limited English Proficient 654.9
Subsidized Meals 649.2
*Information in the above tables is subject to change. Projected performance and actual performance are dependent upon which state
standardized assessment is administered as South Carolina begins full implementation of common core standards in 2013-2014.*

38
PASS % MATH
Student Achievement Teacher/Administrator Quality School Climate Other Priority
PERFORMANCE STATEMENT: Meet the state and federal accountability objectives for all students and subgroups in mathematics each year.
FIVE YEAR PERFORMANCE GOAL: Maintain the percentage of students meeting standard in mathematics as measured by the Palmetto
Assessment of State Standards (PASS) at 88.3%.
ANNUAL OBJECTIVE: Maintain 88.3 % annually of students meeting standard in mathematics as measured by the Palmetto Assessment of
State Standards (PASS).
DATA SOURCE(S): SDE School Report Card
Baseline
2011-12
Planning Year
2012-13 2013-14 2014-15 2015-16 2016-17 2017-18
School
Projected X X 88.3 88.3 88.3 88.3 88.3
School
Actual
88.3
District
Projected X X 78.4 79.4 80.4 81.4 82.4
District
Actual
77.4
*Information in the above tables is subject to change. Projected performance and actual performance are dependent upon which state
standardized assessment is administered as South Carolina begins full implementation of common core standards in 2013-2014.*

39
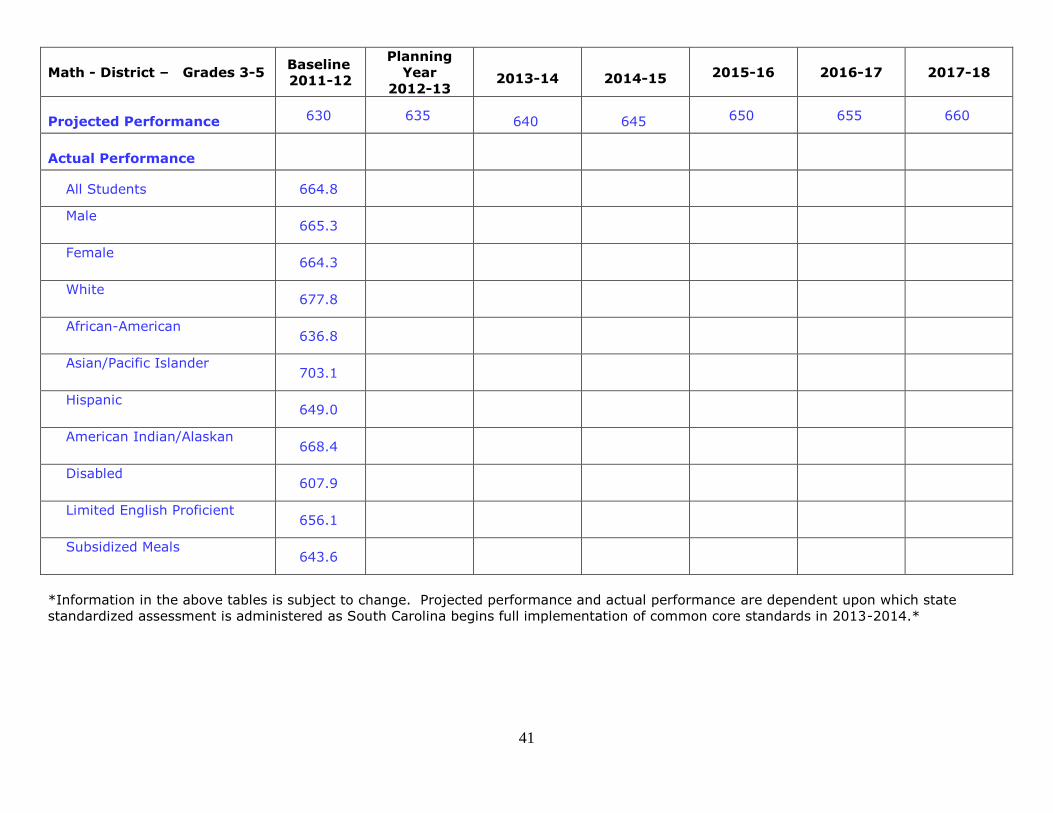
PASS AVG. MATH
Student Achievement Teacher/Administrator Quality School Climate Other Priority
FIVE YEAR PERFORMANCE GOAL: By grade band (elementary), meet the required annual measurable objectives (AMOs) in mathematics
as measured by the Palmetto Assessment of State Standards (PASS).
ANNUAL OBJECTIVE: Meet the required annual measurable objectives (AMOs) in mathematics as measured by the Palmetto Assessment of
State Standards (PASS).
DATA SOURCE(S): ESEA Federal Accountability and SDE School Report Card
Math - School Baseline
2011-12
Planning
Year
2012-13 2013-14 2014-15 2015-16 2016-17 2017-18
Projected Performance 630 635 640 645 650 655 660
Actual Performance
All Students 685.0
Male 688.9
Female 681.4
White 698.4
African-American 645.4
Asian/Pacific Islander 713.7
Hispanic 651.6
American Indian/Alaskan N/A
Disabled 611.7
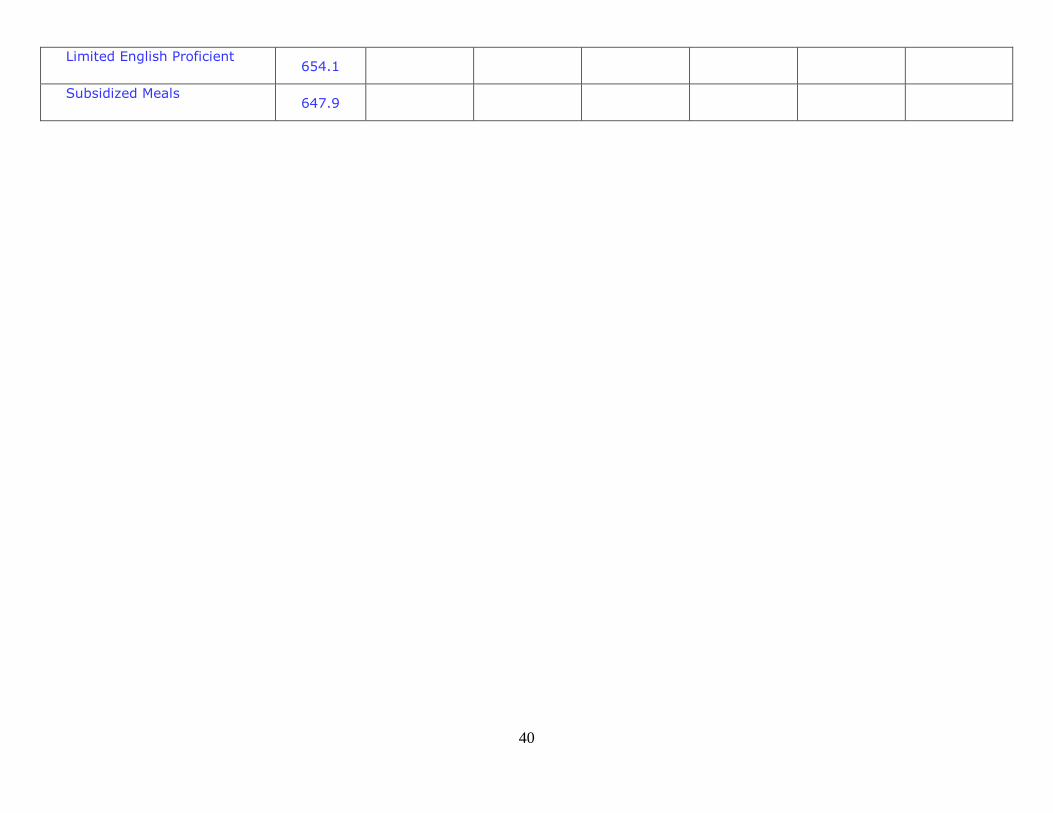
40
Limited English Proficient 654.1
Subsidized Meals 647.9
41
Math - District – Grades 3-5 Baseline
2011-12
Planning
Year
2012-13 2013-14 2014-15 2015-16 2016-17 2017-18
Projected Performance 630 635 640 645 650 655 660
Actual Performance
All Students 664.8
Male 665.3
Female 664.3
White 677.8
African-American 636.8
Asian/Pacific Islander 703.1
Hispanic 649.0
American Indian/Alaskan 668.4
Disabled 607.9
Limited English Proficient 656.1
Subsidized Meals 643.6
*Information in the above tables is subject to change. Projected performance and actual performance are dependent upon which state
standardized assessment is administered as South Carolina begins full implementation of common core standards in 2013-2014.*

42
PASS % TESTED
Student Achievement Teacher/Administrator Quality School Climate Other Priority
FIVE YEAR PERFORMANCE GOAL: Meet the annual measurable objective (AMO) of 95% of students tested for all ELA and math tests and
subgroups each year from 2014 through 2018.
ANNUAL OBJECTIVE: Meet the annual measurable objective (AMO) of 95% of students tested for all ELA and math tests and subgroups
annually.
DATA SOURCE(S): ESEA Federal Accountability and SDE School Report Card
% Tested ELA – School Baseline
2011-12
Planning
Year
2012-13 2013-14 2014-15 2015-16 2016-17 2017-18
Projected Performance 95.0 95.0 95.0 95.0 95.0 95.0 95.0
Actual Performance
All Students 100
Male 100
Female 100
White 100
African-American 100
Asian/Pacific Islander 100
Hispanic 100
American Indian/Alaskan N/Q
Disabled 100

43
Limited English Proficient 100
Subsidized Meals 100

44
% Tested ELA – District
Grades 3-5
Baseline
2011-12
Planning
Year
2012-13 2013-14 2014-15 2015-16 2016-17 2017-18
Projected Performance 95.0 95.0 95.0 95.0 95.0 95.0 95.0
Actual Performance
All Students 99.9
Male 99.9
Female 99.9
White 99.9
African-American 99.8
Asian/Pacific Islander 99.8
Hispanic 99.9
American Indian/Alaskan 100.0
Disabled 99.2
Limited English Proficient 99.8
Subsidized Meals 99.8

45
% Tested Math – School Baseline
2011-12
Planning
Year
2012-13 2013-14 2014-15 2015-16 2016-17 2017-18
Projected Performance 95.0 95.0 95.0 95.0 95.0 95.0 95.0
Actual Performance
All Students 100
Male 100
Female 100
White 100
African-American 100
Asian/Pacific Islander 100
Hispanic 100
American Indian/Alaskan N/A
Disabled 100
Limited English Proficient 100
Subsidized Meals 100

46
% Tested Math – District –
Grades 3-5
Baseline
2011-12
Planning
Year
2012-13 2013-14 2014-15 2015-16 2016-17 2017-18
Projected Performance 95.0 95.0 95.0 95.0 95.0 95.0 95.0
Actual Performance
All Students 100.0
Male 99.9
Female 100.0
White 100.0
African-American 99.9
Asian/Pacific Islander 100.0
Hispanic 99.9
American Indian/Alaskan 100.0
Disabled 99.8
Limited English Proficient 99.9
Subsidized Meals 99.9
*Information in the above tables is subject to change. Projected performance and actual performance are dependent upon which state
standardized assessment is administered as South Carolina begins full implementation of common core standards in 2013-2014.*

47
PASS % SCIENCE
Student Achievement Teacher/Administrator Quality School Climate Other Priority
PERFORMANCE STATEMENT: Meet the state and federal accountability objectives for all students and subgroups in science each year.
FIVE YEAR PERFORMANCE GOAL: Maintain the percentage of students meeting standard in science as measured by the Palmetto
Assessment of State Standards (PASS) at 86.5%.
ANNUAL OBJECTIVE: Maintain 86.5% annually of students meeting standard in science as measured by the Palmetto Assessment of State
Standards (PASS).
DATA SOURCE(S): SDE School Report Card
Baseline
2011-12
Planning Year
2012-13 2013-14 2014-15 2015-16 2016-17 2017-18
School
Projected X X 86.5 86.5 86.5 86.5 86.5
School
Actual
86.5
District
Projected X X 76.9 77.9 78.9 79.9 80.9
District
Actual
75.9
*Information in the above tables is subject to change. Projected performance and actual performance are dependent upon which state
standardized assessment is administered as South Carolina begins full implementation of common core standards in 2013-2014.*

48
PASS AVG. SCIENCE
Student Achievement Teacher/Administrator Quality School Climate Other Priority
FIVE YEAR PERFORMANCE GOAL: By grade band (elementary), meet the required annual measurable objectives (AMOs) in science as
measured by the Palmetto Assessment of State Standards (PASS).
ANNUAL OBJECTIVE: Meet the required annual measurable objectives (AMOs) in science as measured by the Palmetto Assessment of State
Standards (PASS).
DATA SOURCE(S): ESEA Federal Accountability and SDE School Report Card
Science - School Baseline
2011-12
Planning Year
2012-13
2013-14 2014-15 2015-16 2016-17 2017-18
Projected Performance 630 635 640 645 650 655 660
Actual Performance
All Students 645.8
Male 649.9
Female 642.1
White 656.2
African-American 621.0
Asian/Pacific Islander 646.6
Hispanic 616.4
American Indian/Alaskan N/A
Disabled 597.5

49
Limited English Proficient 615.0
Subsidized Meals 618.6

50
Science - District – Grades 3-
5
Baseline
2011-12
Planning
Year
2012-13 2013-14 2014-15 2015-16 2016-17 2017-18
Projected Performance 630 635 640 645 650 655 660
Actual Performance
All Students 632.8
Male 633.7
Female 631.8
White 645.2
African-American 607.3
Asian/Pacific Islander 655.9
Hispanic 617.0
American Indian/Alaskan 640.3
Disabled 585.9
Limited English Proficient 620.7
Subsidized Meals 614.1
*Information in the above tables is subject to change. Projected performance and actual performance are dependent upon which state
standardized assessment is administered as South Carolina begins full implementation of common core standards in 2013-2014.*

51
PASS % SOCIAL STUDIES
Student Achievement Teacher/Administrator Quality School Climate Other Priority
PERFORMANCE STATEMENT: Meet the state and federal accountability objectives for all students and subgroups in social studies each year.
FIVE YEAR PERFORMANCE GOAL: Maintain the percentage of students meeting standard in social studies as measured by the Palmetto
Assessment of State Standards (PASS) at 87.6%.
ANNUAL OBJECTIVE: Maintain 87.6% annually of students meeting standard in social studies as measured by the Palmetto Assessment of
State Standards (PASS).
DATA SOURCE(S): SDE School Report Card
Baseline
2011-12
Planning Year
2012-13 2013-14 2014-15 2015-16 2016-17 2017-18
School
Projected X X 87.6 87.6 87.6 87.6 87.6
School
Actual
87.6
District
Projected X X 79.9 80.9 81.9 82.9 83.9
District
Actual
78.9
*Information in the above tables is subject to change. Projected performance and actual performance are dependent upon which state
standardized assessment is administered as South Carolina begins full implementation of common core standards in 2013-2014.*
52
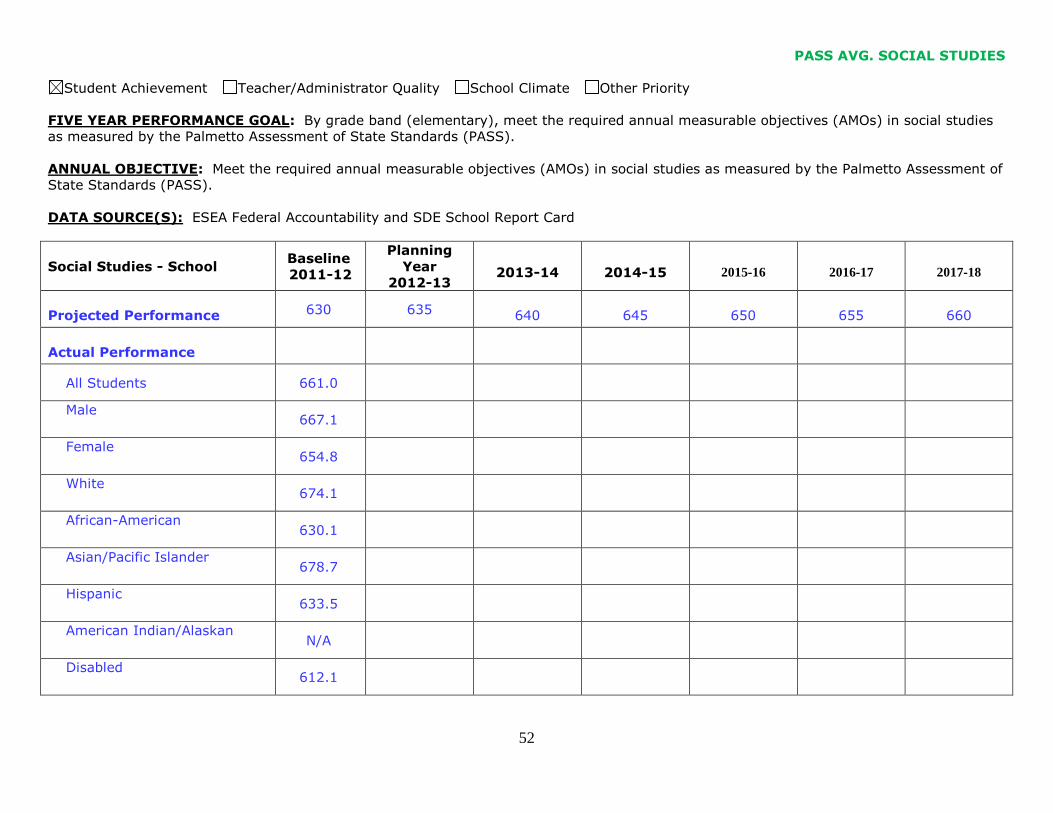
PASS AVG. SOCIAL STUDIES
Student Achievement Teacher/Administrator Quality School Climate Other Priority
FIVE YEAR PERFORMANCE GOAL: By grade band (elementary), meet the required annual measurable objectives (AMOs) in social studies
as measured by the Palmetto Assessment of State Standards (PASS).
ANNUAL OBJECTIVE: Meet the required annual measurable objectives (AMOs) in social studies as measured by the Palmetto Assessment of
State Standards (PASS).
DATA SOURCE(S): ESEA Federal Accountability and SDE School Report Card
Social Studies - School Baseline
2011-12
Planning
Year
2012-13 2013-14 2014-15 2015-16 2016-17 2017-18
Projected Performance 630 635 640 645 650 655 660
Actual Performance
All Students 661.0
Male 667.1
Female 654.8
White 674.1
African-American 630.1
Asian/Pacific Islander 678.7
Hispanic 633.5
American Indian/Alaskan N/A
Disabled 612.1

53
Limited English Proficient 637.2
Subsidized Meals 631.1

54
Social Studies - District
Grades 3-5
Baseline
2011-12
Planning
Year
2012-13 2013-14 2014-15 2015-16 2016-17 2017-18
Projected Performance 630 635 640 645 650 655 660
Actual Performance
All Students 649.2
Male 651.8
Female 646.6
White 661.3
African-American 626.1
Asian/Pacific Islander 676.9
Hispanic 632.8
American Indian/Alaskan 655.8
Disabled 605.3
Limited English Proficient 637.7
Subsidized Meals 629.0
*Information in the above tables is subject to change. Projected performance and actual performance are dependent upon which state
standardized assessment is administered as South Carolina begins full implementation of common core standards in 2013-2014.*

55
ITBS
Student Achievement Teacher/Administrator Quality School Climate Other Priority
PERFORMANCE STATEMENT: Increase student performance on state and national assessments, including the Iowa Test of Basic Skills
(ITBS).
FIVE YEAR PERFORMANCE GOAL: Annually meet or exceed the national norm of 50th percentile in each subtest of the Iowa Tests of Basic
Skills (ITBS) in grade 2.
ANNUAL OBJECTIVE: Annually meet or exceed the national norm of 50th percentile in each subtest of the Iowa Tests of Basic Skills (ITBS)
in grade 2.
DATA SOURCE(S): Fall 2011 and Fall 2012 ITBS/CogAT report produced by Riverside Publishing
School Baseline
2011-12
Planning
Year
2012-13 2013-14 2014-15 2015-16 2016-17 2017-18
Reading Comprehension
Projected 50th %tile 50th %tile 50th %tile 50th %tile 50th %tile
Reading Comprehension
Actual 80%tile 72%tile
Mathematics Concepts
Projected 50th %tile 50th %tile 50th %tile 50th %tile 50th %tile
Mathematics Concepts
Actual 64%tile 62%tile
Mathematics Problems
Projected 50th %tile 50th %tile 50th %tile 50th %tile 50th %tile
Mathematics Problems
Actual 76%tile 63%tile

56
District Baseline
2011-12
Planning
Year
2012-13 2013-14 2014-15 2015-16 2016-17 2017-18
Reading Comprehension
Projected 50th %tile 50th %tile 50th %tile 50th %tile 50th %tile
Reading Comprehension
Actual
67th %tile 66th %tile
Mathematics Concepts
Projected 50th %tile 50th %tile 50th %tile 50th %tile 50th %tile
Mathematics Concepts
Actual 52nd %tile 50th %tile
Mathematics Problems
Projected 50th %tile 50th %tile 50th %tile 50th %tile 50th %tile
Mathematics Problems
Actual
58th %tile 55th %tile

57
STRATEGY
Activity
Timeline Person
Responsible Estimated Cost Funding
Sources
Indicators of
Implementation
Implement Response to Intervention
(RtI) in K-2 to provide Tier 2
reading interventions for at-risk
students.
2013-2018
Teachers and
RtI Team
N/A
District
AIMS Web Data
Provide academic assistance for at-
risk students.(before school tutoring
programs)
2013-2018
Teachers
$30 per hour
District
Student Attendance
Documentation
Utilize technology
software/hardware for instructional
purposes. (Compass Learning,
NWEA/MAP, interactive whiteboards,
laptop carts, etc.)
2013-2018
Teachers
Varies
School, PTA,
District
Lesson Plans, Program
Reports
Incorporate Continuous
Improvement strategies school-
wide. (goal setting, data notebooks,
data centers, etc.)
2013-2018
Teachers and
Administration
N/A
N/A
Observations and Sample
Documentation
Implement Balanced Literacy
program in grades K-5.
2013-2018 Teachers and
Instructional Coach
School, PTA,
District Observations, Lesson Plans
MAP (Measures of Academic
Progress) data will be tracked and
utilized to enhance instruction.
2013-2018 Teachers,
Administration, and
Instructional Coach
N/A District
Data Reports
Incorporate Core Bites as a part of
math instruction.
2013-2018 Teachers $299 per teacher School Common Assessment Data
Promote the school-wide reading
challenge.
2013-2018 Teachers,
Administration, and
Media Specialist
N/A N/A Quarterly Data Reports

58
PROFESSIONAL DEVELOPMENT
Student Achievement Teacher/Administrator Quality School Climate Other Priority
GOAL AREA 2: Ensure quality personnel in all positions.
FIVE YEAR PERFORMANCE GOAL: The amount of time teachers and administrators are engaged in professional development activities will
meet or exceed the district minimum requirement of sixteen hours at the school level from 2013-14 to 2017-18.
ANNUAL OBJECTIVE: Teachers and administrators will participate in sixteen or more hours of professional development at the school level
during the 2013-14 school year.
DATA SOURCE(S): School wide professional development report from the district portal.
Baseline
2011-12
Planning Year
2012-13 2013-14 2014-15 2015-16 2016-17 2017-18
Projected x x 16 16 16 16 16
Actual 37 hours

59
STRATEGY
Activity
Timeline Person
Responsible Estimated Cost Funding
Sources
Indicators of
Implementation
Survey faculty to determine
professional development needs.
2013-2018 Instructional Coach N/A N/A Survey Results and
Professional Development
Plan
The leadership team will develop a
professional development plan
based on the results of the faculty
PD survey.
2013-2018 Administration N/A N/A Professional Development
Plan
Train all teachers on the Balanced
Literacy model.
2013-2018 District Personnel N/A N/A Certificate of Completion,
In-service credit,
Observations, Lesson Plans
Train new staff in Everyday Counts
Calendar Math.
2013-2018 District Personnel N/A N/A In-service credit,
Observations, Lesson Plans
Train new staff in A.L.I.V.E.
(technology recertification)
2013-2018 District Personnel N/A N/A Certificate of Completion
Provide training for new staff on
Promethean Boards.
2013-2018 District Personnel N/A N/A In-service credit
Provide technology training in
various areas indicated by teachers
on the survey. For example,
Promethean, Edmodo, Presentation
Tools, etc.
2013-2018 District Personnel,
Instructional Coach,
and Media Specialist
N/A N/A In-service credit
Provide ongoing staff development
in Continuous Improvement.
2013-2018 Teachers and
Instructional Coach
N/A N/A In-service credit,
Observations, Lesson Plans
Provide ongoing staff development
in Learning-Focused strategies.
2013-2018 Teachers and
Instructional Coach
N/A N/A In-service credit,
Observations, Lesson Plans
Provide ongoing staff development
on CompassLearning.
2013-2018 District Personnel N/A N/A In-service credit,
Observations, Lesson Plans
Curriculum committees will be used
to share best practices in each
major academic area.
2013-2018 Teachers,
Administration,
Instructional Coach
N/A N/A In-service credit, Meeting
Minutes

60

61
STUDENT ATTENDANCE
Student Achievement Teacher/Administrator Quality School Climate Other Priority
GOAL AREA 3: Provide a school environment supportive of learning.
FIVE YEAR PERFORMANCE GOAL: Achieve an annual student attendance rate of 95%.
ANNUAL OBJECTIVE: Maintain an annual student attendance rate of 95% or higher.
DATA SOURCE(S): SDE School Report Card
Baseline
2011-12
Planning Year
2012-13 2013-14 2014-15 2015-16 2016-17 2017-18
School
Projected X X 95.0 95.0 95.0 95.0 95.0
School
Actual
97.4
District
Projected X X 95.0 95.0 95.0 95.0 95.0
District
Actual
95.9

62
PARENT SATISFACTION – LEARNING ENV.
Student Achievement Teacher/Administrator Quality School Climate Other Priority
FIVE YEAR PERFORMANCE GOAL: Maintain the percentage of parents who are satisfied with the learning environment at 96.4% from
2012 to 2018.
ANNUAL OBJECTIVE: Beginning in 2013-14, maintain 96.4% of parents annually who are satisfied with the learning environment.
DATA SOURCE(S): SDE School Report Card Survey results – Question #5
Baseline
2011-12
Planning Year
2012-13 2013-14 2014-15 2015-16 2016-17 2017-18
School
Projected X X 96.4 96.4 96.4 96.4 96.4
School
Actual
96.4
District
Projected X X 89.0 89.5 90.0 90.5 91.0
District
Actual
88.0*
*SDE has not yet provided GCS with the District’s Parent Survey results for 2011-12. Info is from 2010-11.*

63
STUDENT SATISFACTION – LEARNING ENV.
Student Achievement Teacher/Administrator Quality School Climate Other Priority
FIVE YEAR PERFORMANCE GOAL: Maintain the percentage of students who are satisfied with the learning environment at 92.8% from
2012 to 2018.
ANNUAL OBJECTIVE: Beginning in 2013-14, maintain 92.8% of students who are satisfied with the learning environment.
DATA SOURCE(S): SDE School Report Card Survey results – Question #18
Baseline
2011-12
Planning
Year
2012-13 2013-14 2014-15 2015-16 2016-17 2017-18
School Projected X X 92.8 92.8 92.8 92.8 92.8
School Actual 92.8
District Projected
(ES, MS, and HS) X X 83.5 84.0 84.5 85.0 85.5
District Actual (ES
and MS) 83.8

64
TEACHER SATISFACTION – LEARNING ENV.
Student Achievement Teacher/Administrator Quality School Climate Other Priority
FIVE YEAR PERFORMANCE GOAL: Maintain the percentage of teachers who are satisfied with the learning environment at 100%.
ANNUAL OBJECTIVE: Beginning in 2013-14, maintain 100% annually of teachers who are satisfied with the learning environment.
DATA SOURCE(S): SDE School Report Card Survey results – Question #27
Baseline
2011-12
Planning
Year
2012-13 2013-14 2014-15 2015-16 2016-17 2017-18
School Projected X X 100 100 100 100 100
School
Actual
100
District
Projected X X 92.5 93.0 93.5 94.0 94.5
District
Actual
98.0
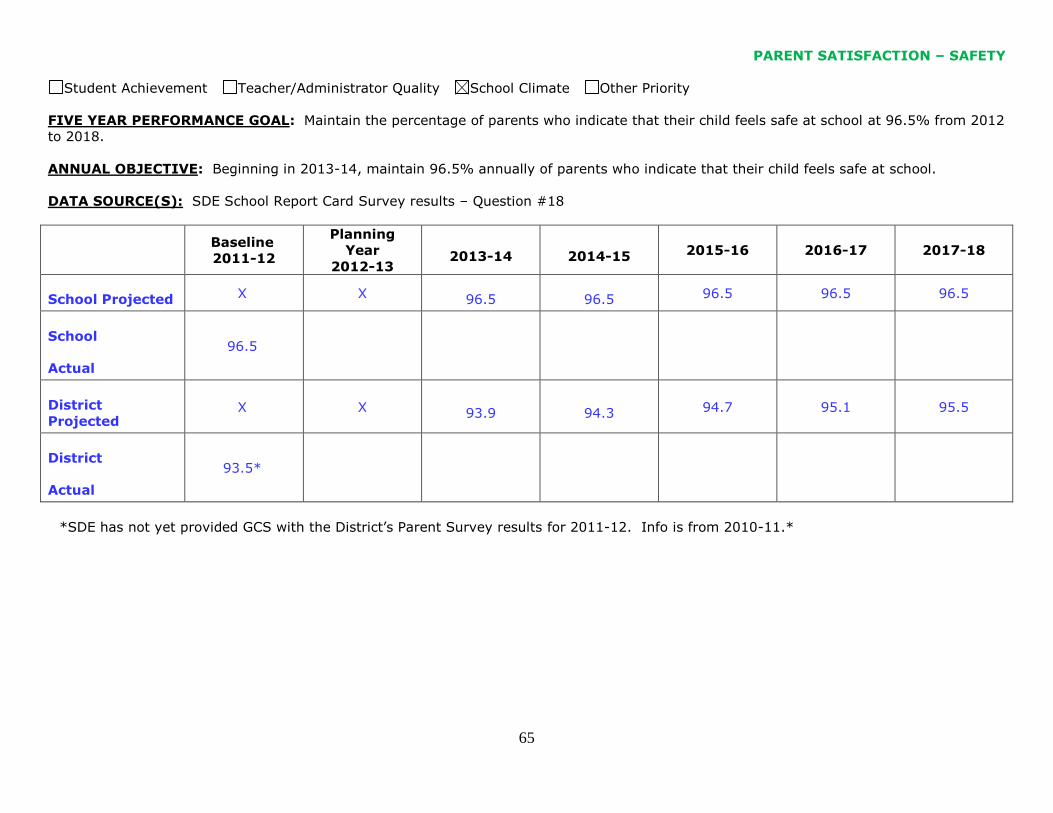
65
PARENT SATISFACTION – SAFETY
Student Achievement Teacher/Administrator Quality School Climate Other Priority
FIVE YEAR PERFORMANCE GOAL: Maintain the percentage of parents who indicate that their child feels safe at school at 96.5% from 2012
to 2018.
ANNUAL OBJECTIVE: Beginning in 2013-14, maintain 96.5% annually of parents who indicate that their child feels safe at school.
DATA SOURCE(S): SDE School Report Card Survey results – Question #18
Baseline
2011-12
Planning
Year
2012-13 2013-14 2014-15 2015-16 2016-17 2017-18
School Projected X X 96.5 96.5 96.5 96.5 96.5
School
Actual
96.5
District
Projected X X 93.9 94.3 94.7 95.1 95.5
District
Actual
93.5*
*SDE has not yet provided GCS with the District’s Parent Survey results for 2011-12. Info is from 2010-11.*

66
STUDENT SATISFACTION – SAFETY
Student Achievement Teacher/Administrator Quality School Climate Other Priority
FIVE YEAR PERFORMANCE GOAL: Maintain the percent of students who feel safe at school during the school day at 95% from 2012 to
2018.
ANNUAL OBJECTIVE: Beginning in 2013-14, maintain 95% annually of students who feel safe at school during the school day.
DATA SOURCE(S): SDE School Report Card Survey results – Question #30
Baseline
2011-12
Planning
Year
2012-13 2013-14 2014-15 2015-16 2016-17 2017-18
School Projected X X 95 95 95 95 95
School
Actual
95
District
Projected X X 91.9 92.3 92.7 93.1 93.5
District
Actual
90.9

67
TEACHER SATISFACTION – SAFETY
Student Achievement Teacher/Administrator Quality School Climate Other Priority
FIVE YEAR PERFORMANCE GOAL: Maintain the percentage of teachers who feel safe at school during the school day at 100%.
ANNUAL OBJECTIVE: Beginning in 2013-14, maintain 100% annually of teachers who feel safe at school during the school day.
DATA SOURCE(S): SDE School Report Card Survey results – Question #39
Baseline
2011-12
Planning
Year
2012-13 2013-14 2014-15 2015-16 2016-17 2017-18
School Projected X X 100 100 100 100 100
School
Actual
100
District
Projected X X 98.9 98.9 98.9 98.9 98.9
District
Actual
98.9
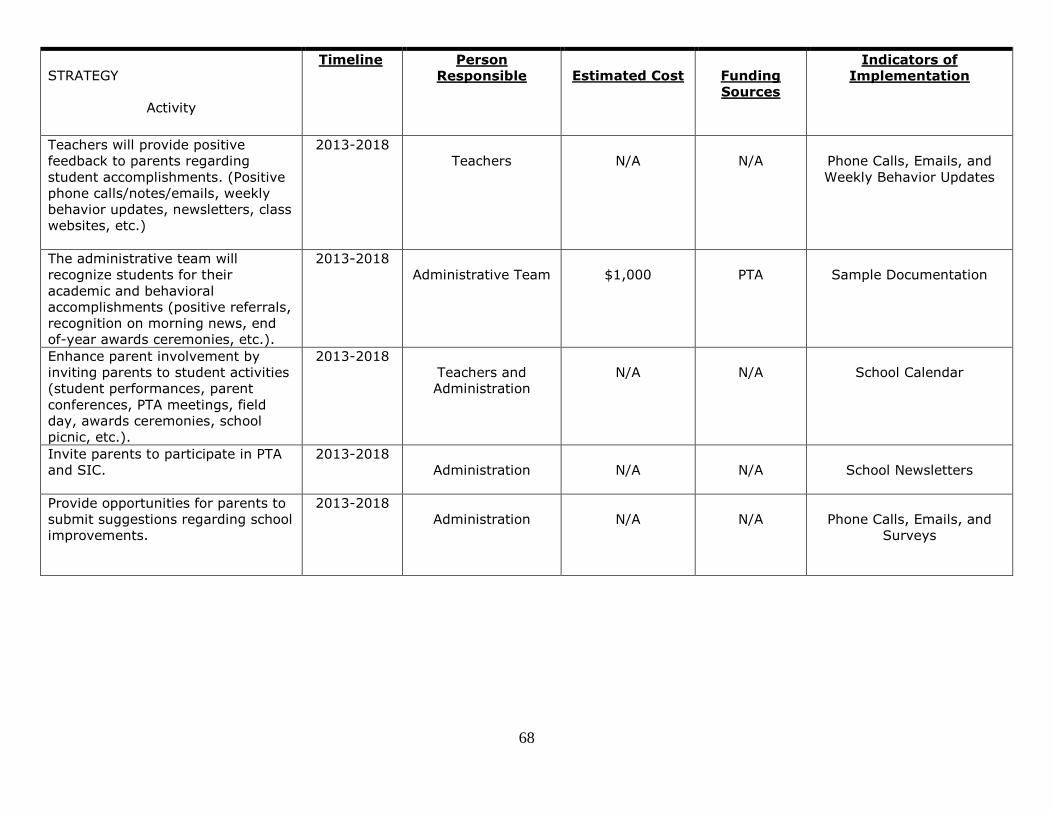
68
STRATEGY
Activity
Timeline Person
Responsible Estimated Cost Funding
Sources
Indicators of
Implementation
Teachers will provide positive
feedback to parents regarding
student accomplishments. (Positive
phone calls/notes/emails, weekly
behavior updates, newsletters, class
websites, etc.)
2013-2018
Teachers
N/A
N/A
Phone Calls, Emails, and
Weekly Behavior Updates
The administrative team will
recognize students for their
academic and behavioral
accomplishments (positive referrals,
recognition on morning news, end
of-year awards ceremonies, etc.).
2013-2018
Administrative Team
$1,000
PTA
Sample Documentation
Enhance parent involvement by
inviting parents to student activities
(student performances, parent
conferences, PTA meetings, field
day, awards ceremonies, school
picnic, etc.).
2013-2018
Teachers and
Administration
N/A
N/A
School Calendar
Invite parents to participate in PTA
and SIC.
2013-2018
Administration
N/A
N/A
School Newsletters
Provide opportunities for parents to
submit suggestions regarding school
improvements.
2013-2018
Administration
N/A
N/A
Phone Calls, Emails, and
Surveys

69
Please click on the picture below to be taken directly to our Annual School Report Card.