best practices for utilizing hmis data - alaeh.orgalaeh.org/clientimages/52738/4c best practices for...
TRANSCRIPT
BEST PRACTICES FOR
UTILIZING HMIS DATA

Presenters & Examples
Rita Flegel, Facilitator
Rusty Bennett & Chris Pitcher – Housing & Health Connection
CARES, Inc.
Cascade AIDS Project
River Region Human Services
Harris County, TX
Chris Pitcher – Coordinated Assessment
West Virginia
Mike Lindsey – Funding Solutions for HMIS
Allegheny County, PA

Overview
Housing and Health Connection
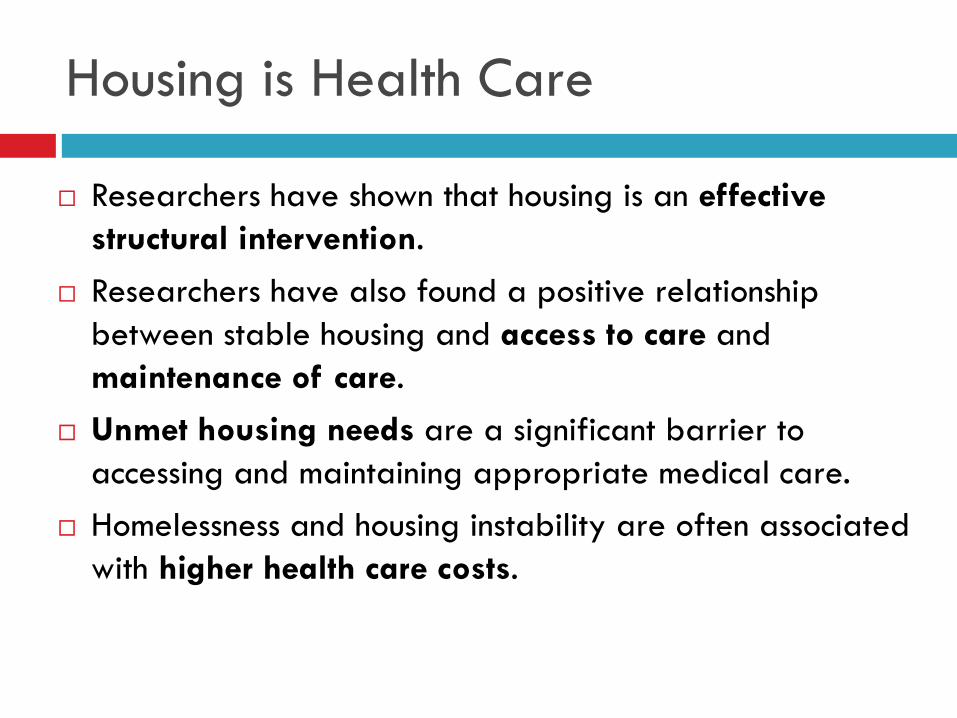
Housing is Health Care
Researchers have shown that housing is an effective
structural intervention.
Researchers have also found a positive relationship
between stable housing and access to care and
maintenance of care.
Unmet housing needs are a significant barrier to
accessing and maintaining appropriate medical care.
Homelessness and housing instability are often associated
with higher health care costs.

Housing is Health Care cont.
Homelessness both causes and
results from serious health care
issues, including
Addiction,
Psychological disorders,
HIV/AIDS, &
Various other ailments that require
long-term, consistent care.

Housing Is Health Care cont.
The HIV/AIDS Care
Continuum illustrates
housing’s effect along
the care continuum.
Housing increases
access, retention in
care, and health
outcomes.
82%
66%
37% 33%
25%
0%
10%
20%
30%
40%
50%
60%
70%
80%
90%
100%
Diagnosed Linked to Care Retained to Care Prescribed ART ViruallySuppressed
Perc
enta
ge o
f all P
eople
with H
IV
95% 87%
62%
99%
NYC
HOPWA
Program,
2011
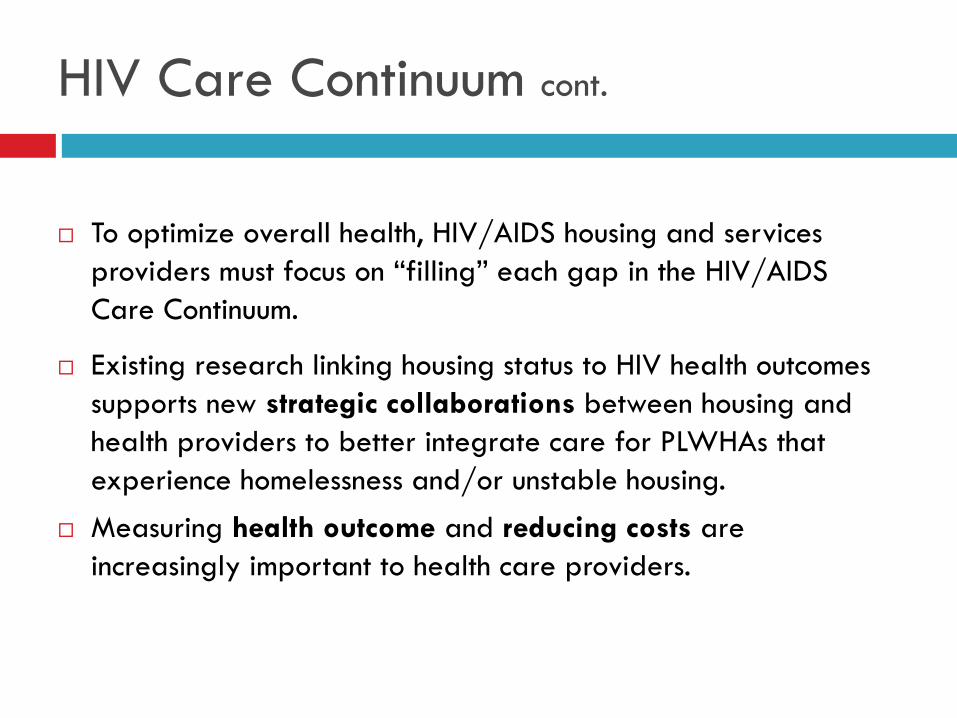
HIV Care Continuum cont.
To optimize overall health, HIV/AIDS housing and services
providers must focus on “filling” each gap in the HIV/AIDS
Care Continuum.
Existing research linking housing status to HIV health outcomes
supports new strategic collaborations between housing and
health providers to better integrate care for PLWHAs that
experience homelessness and/or unstable housing.
Measuring health outcome and reducing costs are
increasingly important to health care providers.

CARES, Inc., Albany, NY
Housing & Health Connection

CARES, Inc. 9
Strategy: Customize HMIS
Community Context: CARES, Inc. is a county-wide HOPWA
provider, CoC lead for Albany City and County, and HMIS
Administrator
Scope: IHHP pilot, scaling up to CoC
Strategy: Built all housing and health data points required for
HOPWA into HMIS

CARES, Inc. 10
Strategy: Customize HMIS
Barriers: Time management, software limitations (e.g. HMIS is
not a relational database), need to use Access to analyze
data and hire additional staff for analysis
Successes: Measure impact of housing and employment on
health using HMIS

CARES, Inc. 11
Strategy: Customize HMIS
Impact Measurement
Improved availability of data
on employment and health
indicators
Integrated health indicators. For example, track
income, viral load, and CD4 count.
Improved availability to
measure employment and
health outcomes
Ability to track changes in income and health
outcomes (viral load, CD-4 count, adherence to
treatment) over time.
Increased coordination of
housing and health systems
Ability to track housing and health outcomes of
PLWHA at client, agency, and community-level. For
example, CARES, Inc. is examining the relationship
between increased income, housing status, and
health. The intent is to lead to stronger connections
between housing and health providers and use
data to advocate for resources.
Cascade AIDS Project, Portland, OR
Housing & Health Connection

Cascade AIDS Project 13
Strategy: Build a Data Bridge
Community Context: CAP is a large HOPWA and RW
provider that uses HMIS for all housing and CAREWare for all
health data points required for HOPWA
Scope: Community-wide data bridge (EMSA/TGA); data
bridge utilizes housing specific info from entire agency
(HOPWA, CoC Supportive Housing, S+C, RW, privately funded
programs)
Strategy: Closer collaboration with community partners to
prevent double data entry, ensure more efficient client case
management services, and improve engagement in care.
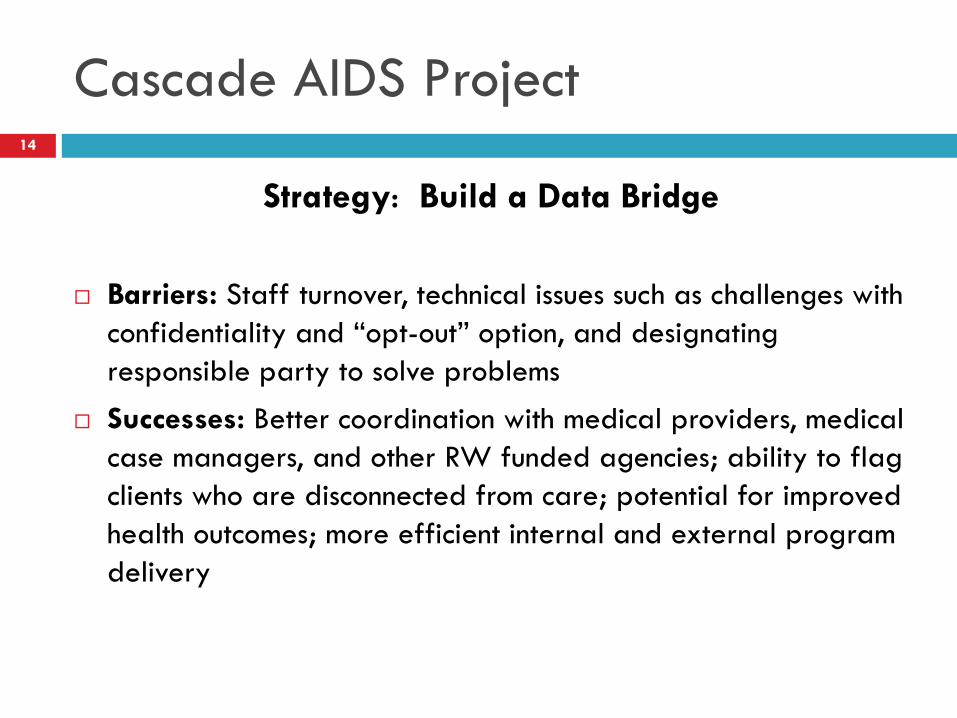
Cascade AIDS Project 14
Strategy: Build a Data Bridge
Barriers: Staff turnover, technical issues such as challenges with
confidentiality and “opt-out” option, and designating
responsible party to solve problems
Successes: Better coordination with medical providers, medical
case managers, and other RW funded agencies; ability to flag
clients who are disconnected from care; potential for improved
health outcomes; more efficient internal and external program
delivery

Cascade AIDS Project 15
Strategy: Build a Data Bridge
Impact Measurement
Increased engagement of
care for PLWHA
Number of individuals re-engaged in care through
analysis of joint client data.
Increased coordination of
housing and health systems
Ability to track housing and health outcomes of
PLWHA at client, agency, and community-level
without double data entry. The expectation is that
when complete, data integration will improve care
coordination and as a result, improve outcomes.
Increase in health outcomes
of PLWHA (In Progress)
Working towards measuring changes in health
outcomes compared to housing status at client,
agency, and community-level.

River Region Human Services, Jacksonville, FL
Housing & Health Connection
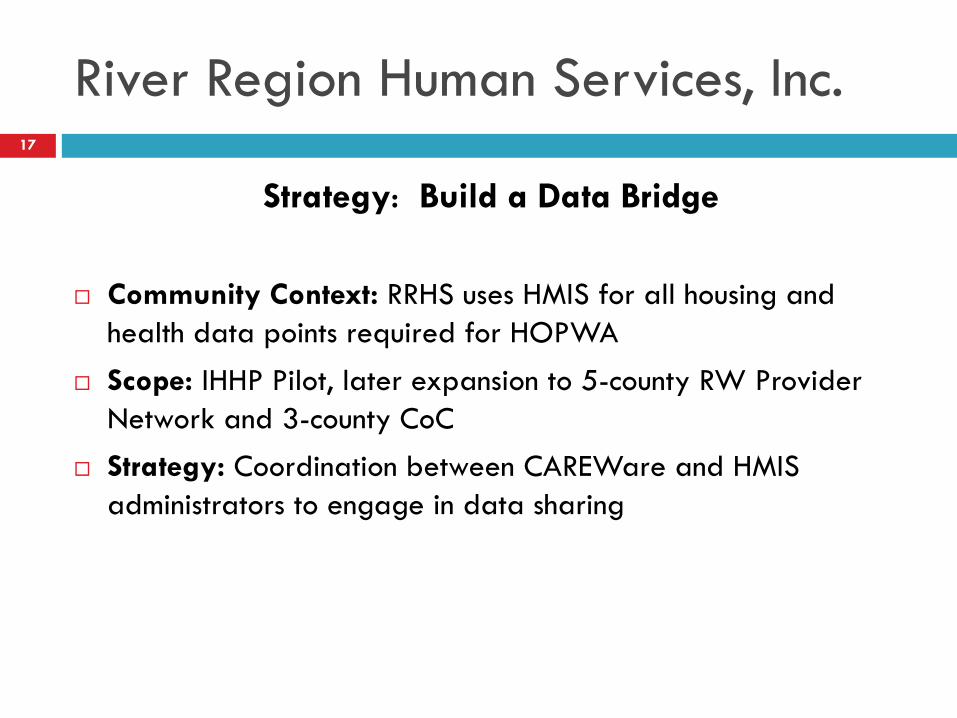
River Region Human Services, Inc. 17
Strategy: Build a Data Bridge
Community Context: RRHS uses HMIS for all housing and
health data points required for HOPWA
Scope: IHHP Pilot, later expansion to 5-county RW Provider
Network and 3-county CoC
Strategy: Coordination between CAREWare and HMIS
administrators to engage in data sharing

River Region Human Services, Inc. 18
Strategy: Build a Data Bridge
Barriers: Initial hesitation and reluctance on the part of the RW
Part A Program Manager and HMIS Database Manager;
coordination of schedules, resistance to change
Successes: Getting buy-in from relevant parties, coordinating
efforts, and laying the technical groundwork to complete data
bridge; addition of 50+ health-related fields from CAREWare
into HMIS; facilitation of re-engagement in care.

River Region Human Services, Inc. 19
Strategy: Build a Data Bridge
Impact Measurement
Increased engagement of
care for PLWHA
Number of individuals re-engaged in care through
analysis of joint client data.
Improved access of data
on housing and health
indicators
Ability to track client progress and provide
integrated care
Increased staff buy-in to
reporting
Staff are engaged in identifying data needs

Harris County, TX
Housing and Health Connection

Harris County, TX
Population
Harris County: 4.1 million
City of Houston: 2.2 million
2014 Point-in-Time
Total – 5,351
Sheltered – 3,060
Unsheltered – 2,291

Houston, TX
There was a Public Health Concern for all residents
of Harris County
The instances of Eastern Equine Encephalitis (EEE
commonly called Triple-E or West Nile Virus) were
increasing
The EEE risk to those sleeping outdoors and places
not meant for human habitation were much higher

Harris County, TX
Utilized Geographic Information System (GIS) and
health data to map the areas where EEE cases were
occurring
Added geographic homeless outreach data to the
health data to identify areas where persons
experiencing homelessness would be at the highest
risk of EEE
Harris County, TX
Using the GIS data map outreach teams targeted
the areas at highest risk and distributed EEE
prevention kits
These targeted efforts lead directly to fewer
instances of EEE among homeless persons

West Virginia
Coordinated Assessment

West Virginia Coordinated Assessment
26
Beyond federal reporting requirements, no process is sacred.
The process is geared toward housing.
Particular importance is placed on high-acuity/high need/chronically homeless.
Everyone is assessed, whether they are a contact or an engagement.
All outreach follows our coordinated access and prioritization procedures.
The Vulnerability Index-Service Prioritization Decision Assistance Tool (VI-SPDAT) is used.

VI-SPDAT
27
Wellness: Chronic health issues and substance use
Socialization and Daily Functioning: Meaningful daily activities, social supports, and income
History of Housing and Homelessness: Length of time experiencing homelessness and cumulative incidences of homelessness
Risks: Crisis, medical, and law enforcement interdictions Coercion, trauma, and most frequent place individual has slept
Family Unit (Family VI-SPDAT Only): School enrollment and attendance, familial interaction, family makeup, and childcare

Acuity Scoring with VI-SPDAT
28
Intervention
Recommendation VI-SPDAT Pre-Screen Score
Diversion 0-4
Rapid Re-Housing 5-9
Permanent Supportive
Housing/Housing First 10-16

Core Mindset
29
WV Balance of State Coordinated Access Process in HMIS (ServicePoint)
VI-SPDAT to Full SPDAT to Prioritization List for PATH Outreach
1 Encountered on the street
during outreach. 2 Contact, Engagement, and
VI-SPDAT performed.
Diversion if possible (VI-
SPDAT Score of 0-4). If
Diversion is not possible,
PATH entry and triage.
Score feeds to community
prioritization list.
3
5
Client moves in and
case management,
services, and housing
stability begin in
earnest, with full
SPDAT.
Community Accesses next
person on the list, by acuity. 7
6
Back to
Step 3
4
Communities then pull a
local Prioritization List, by
Acuity, from HMIS to
determine rapid placement
into housing.
Based on client choice, client is then
placed into housing based on acuity
score and program eligibility with the
following recommendations by score:
1. Permanent Supportive
Housing/Housing First: VI-
SPDAT Score of 10 or above.
2. Rapid Re-Housing: VI-SPDAT
Score of 5-9.
3. No Housing Support
Recommendation (Diversion):
VI-SPDAT Score of 0-4.
Referral is made to
appropriate housing
intervention in
HMIS.

Client Demographics and VI-SPDAT
30

VI-SPDAT Prescreen
31
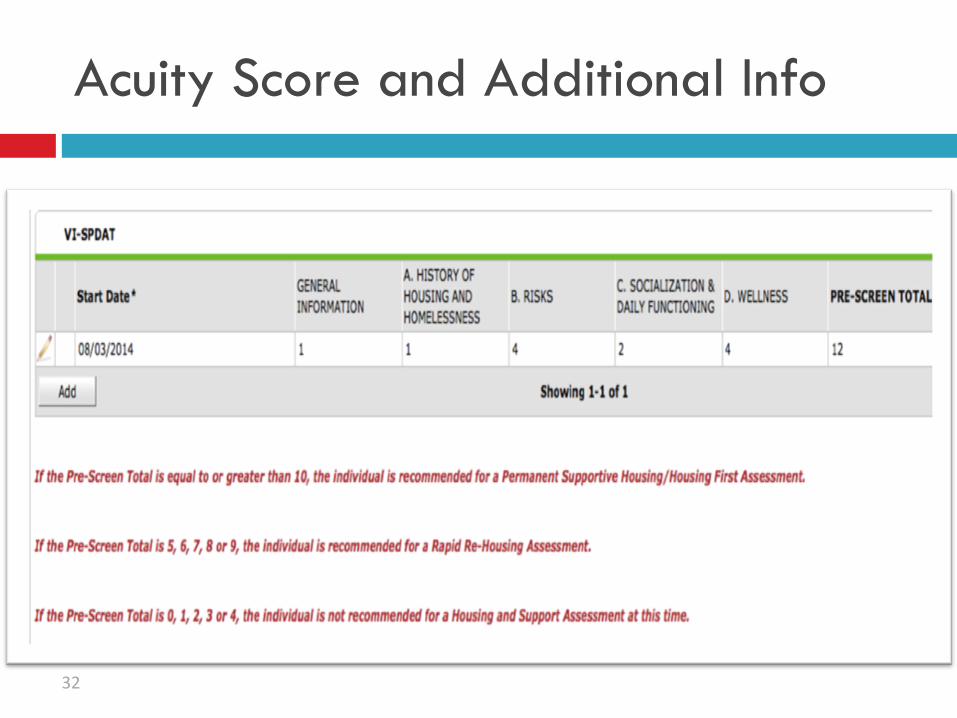
Acuity Score and Additional Info
32
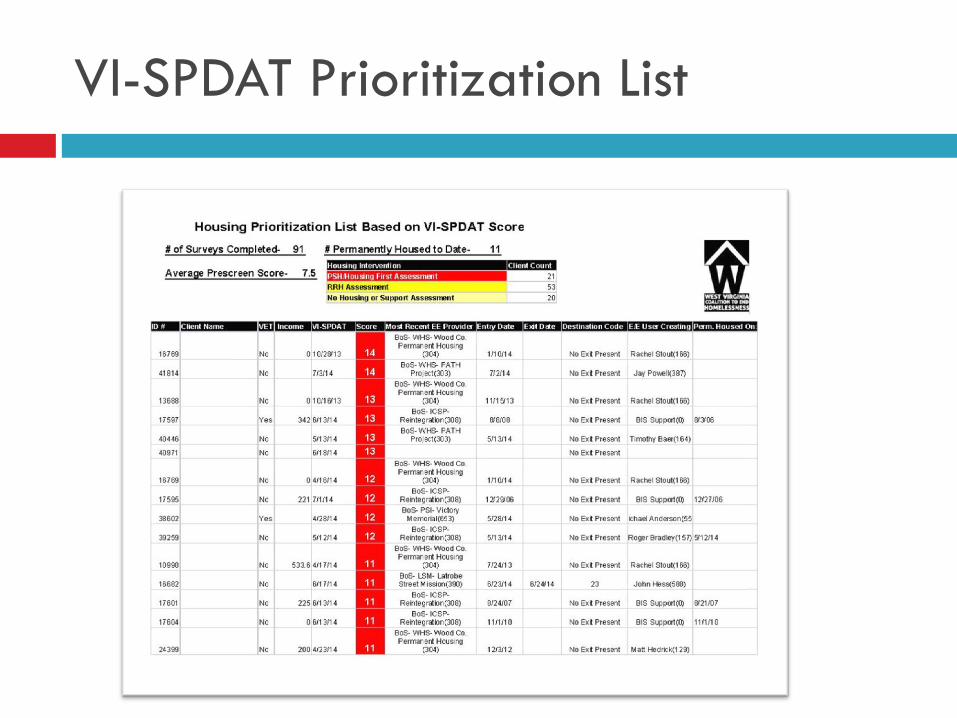
VI-SPDAT Prioritization List
33
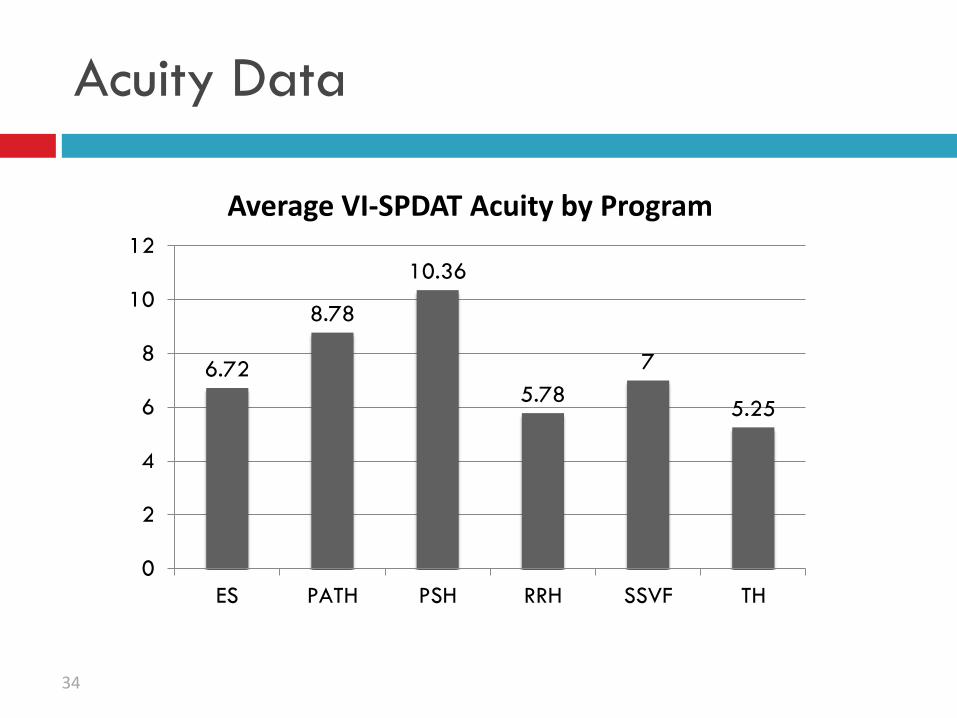
Acuity Data
6.72
8.78
10.36
5.78
7
5.25
0
2
4
6
8
10
12
ES PATH PSH RRH SSVF TH
Average VI-SPDAT Acuity by Program
34

Acuity Data
33.8
47.5
35.84
24.02
50
27.25
0
10
20
30
40
50
60
ES PATH PSH RRH SSVF TH
Average Days from VI-SPDAT Assessment to Housing by Program
35

Lessons Learned
Simplify the HMIS workflow whenever possible.
Train communities on prioritization with outreach at
the table, like any other program.
Have periodic re-training sessions for outreach
personnel across CoCs.
Ensure workflow is easy to use in the field, then data
quality and reporting will come.
Learn as you go, and modify as needed. The goal is
not prettier, but better.
36

Allegheny County, PA
Funding Strategies for HMIS
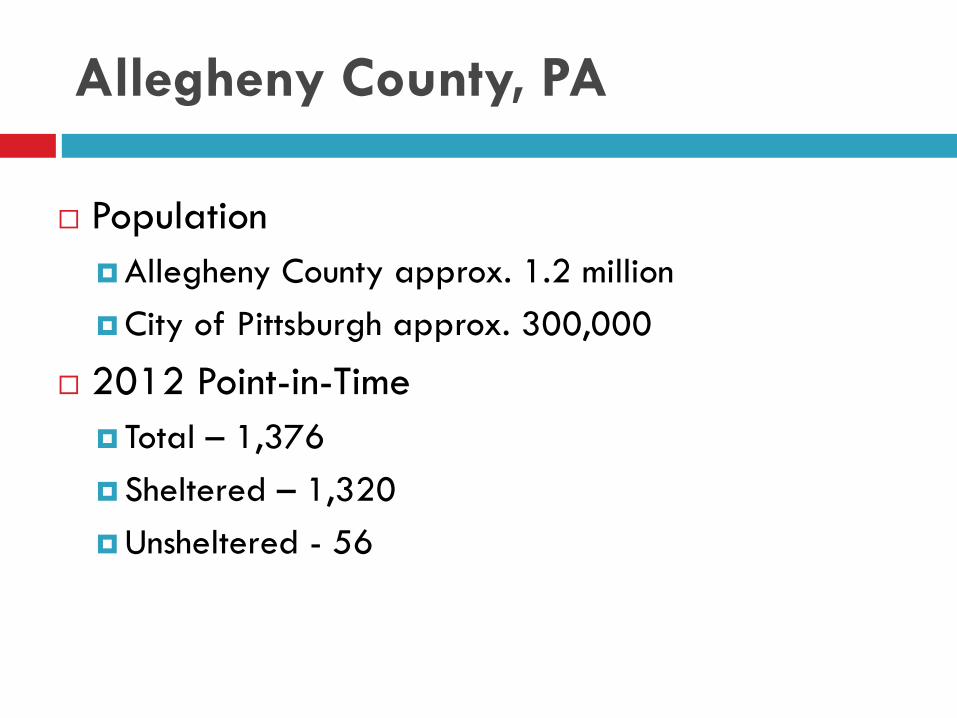
Allegheny County, PA
Population
Allegheny County approx. 1.2 million
City of Pittsburgh approx. 300,000
2012 Point-in-Time
Total – 1,376
Sheltered – 1,320
Unsheltered - 56

Allegheny County DHS
Department of Human Services
$800 million annual budget Children, Youth and Family
Area Agency on Aging
Office of Behavioral Health
Office of Community Services
Office of Information Management
Office of Administration
Office of Data Analysis and Research
Executive Office

Multi-System Consumers
40
Under 18 years 18 years and older
Served by one program office 60% 41%
Served by two program offices 23% 23%
Served by three program offices 11% 15%
Served by four or more program offices 6% 21%
Persons served by DHS in 2010,
approximately 202,000 (unduplicated)

Data Warehouse: Data Sources 41
External Sources
Allegheny County Housing Authority
Allegheny County Jail
Allegheny County Medical Examiner’s Office
Department of Public Welfare
Housing Authority City of Pittsburgh
Juvenile Probation
Pittsburgh Public Schools
10+ other school districts and counting
Potential Data Sources
“Place-based Data”
County Probation
Health Department
Employment & Training
Internal Sources
Aging
Children, Youth and Families
Community Service Block Grant
Drug & Alcohol
Early Intervention
Family Support Centers
HeadStart
Human Services Development Fund
Homeless/Housing
Low Income House Energy Assistance Program
Maximum Participation Project
Medical Assistance Transportation Program
Mental Health
Mental Retardation
System of Care Initiative
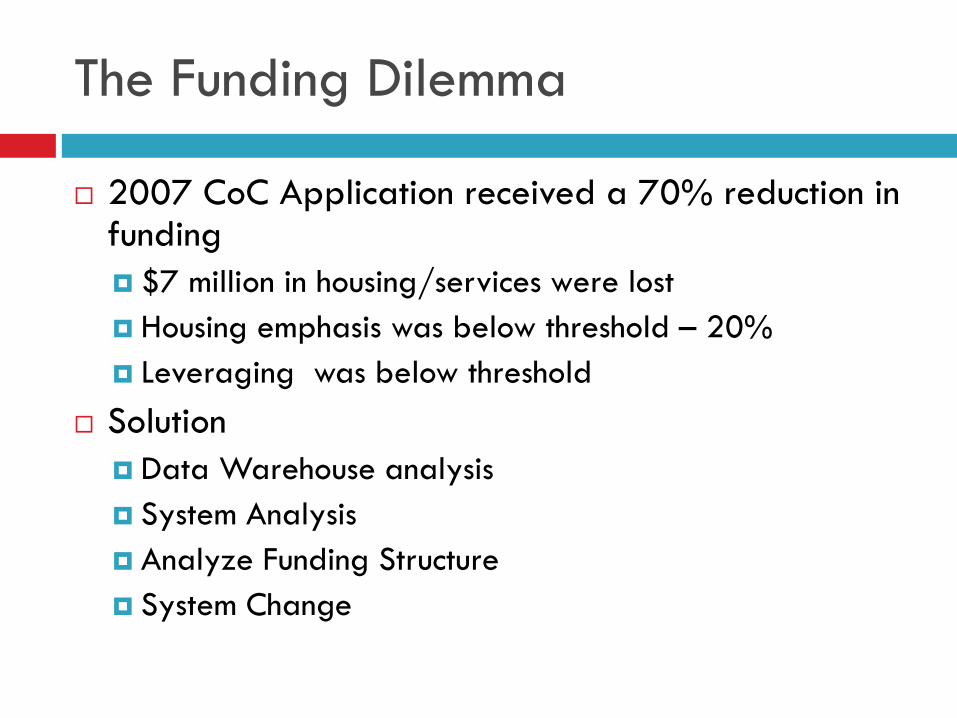
The Funding Dilemma
2007 CoC Application received a 70% reduction in funding
$7 million in housing/services were lost
Housing emphasis was below threshold – 20%
Leveraging was below threshold
Solution
Data Warehouse analysis
System Analysis
Analyze Funding Structure
System Change

Cross System Match of PH Clients
Have clients currently enrolled in Permanent Supportive
Housing ever receive any level of MH services?
61.37% have
Are clients currently enrolled in Permanent Supportive
Housing CURRENTLY receiving any level of MH services?
40.68% are
Continuum of Care Priority…establish new Shelter Plus
Care Permanent Housing Units for Allegheny County’s
homeless

Results
2008 Continuum of Care Priority…establish new
Shelter Plus Care Permanent Housing Units for
Allegheny County
Matched Data
• Results:
60% of homeless clients have also received MH
services
40% of homeless clients have also received D&A
services

Impact
• $4.4 million commitment of MH service dollars
• Leveraged 51 single S+C units & 50 family S+C units
• 15% direct increase in homeless units available in Allegheny County

Increase in S+C Units
Shelter + Care Capacity
0
100
200
300
400
2000 2004 2007 2010 2011

Housing vs. Services Over Time
Housing vs. Services
$-
$5,000,000
$10,000,000
$15,000,000
2000 2004 2007 2010 2011
Year
Sp
en
din
g b
y
Pro
vid
ers
Housing Services
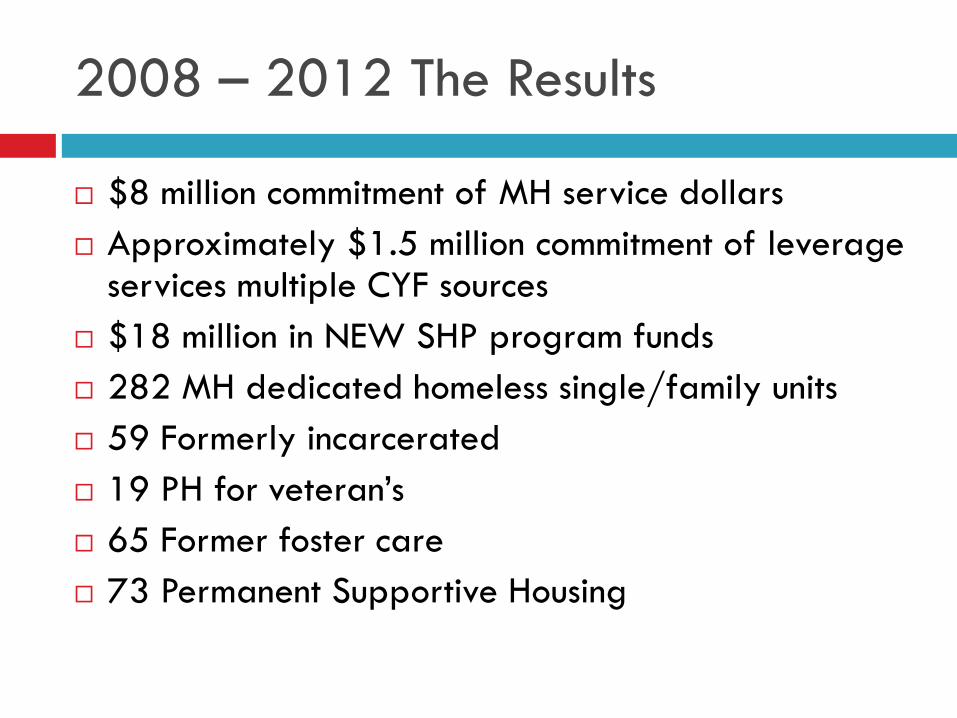
2008 – 2012 The Results
$8 million commitment of MH service dollars
Approximately $1.5 million commitment of leverage services multiple CYF sources
$18 million in NEW SHP program funds
282 MH dedicated homeless single/family units
59 Formerly incarcerated
19 PH for veteran’s
65 Former foster care
73 Permanent Supportive Housing

System Involvement
68%
60%
45%
38%
36%
23% 23% 23% 22%
10%
100%
85% 85%84%
63%
75%
23%
19%
32%
16%
0%
20%
40%
60%
80%
100%
120%
MH DPW (FS) DA MATP ACJ DPW (SSI) DPW (OM) DPW (GA) CYF
(parents)
CYF
System
Perc
en
t o
f P
op
ula
tio
n
Homeless Population (N=2033)
5% High-end (N=88)
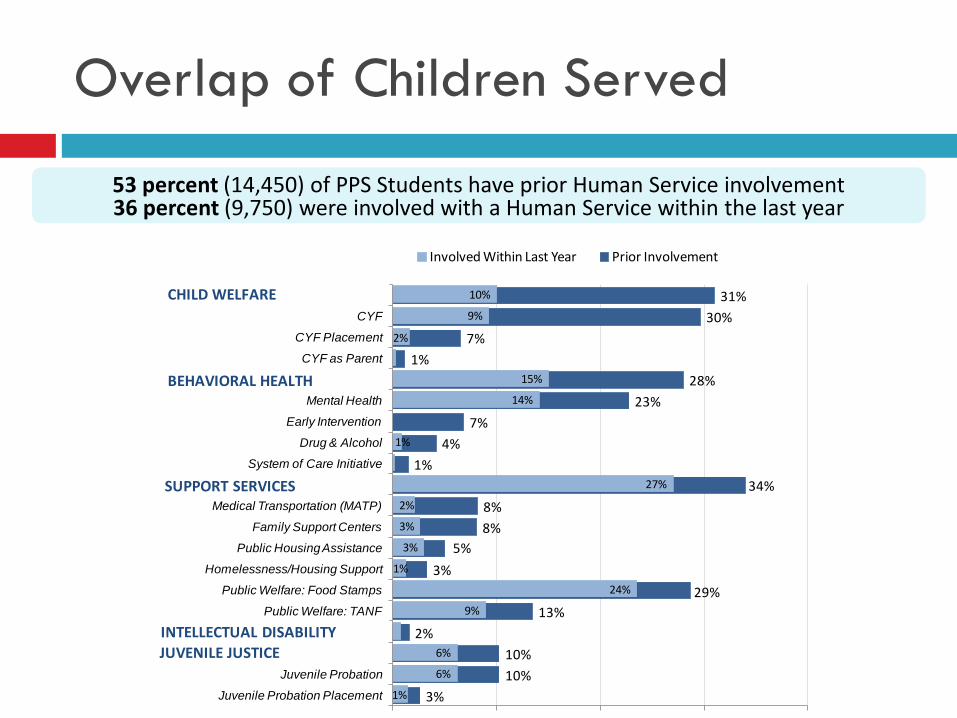
3%
10%
10%
2%
13%
29%
3%
5%
8%
8%
34%
1%
4%
7%
23%
28%
1%
7%
30%
31%
1%
6%
6%
9%
24%
1%
3%
3%
2%
27%
1%
14%
15%
2%
9%
10%
Juvenile Probation Placement
Juvenile Probation
JUVENILE JUSTICE
INTELLECTUAL DISABILITY
Public Welfare: TANF
Public Welfare: Food Stamps
Homelessness/Housing Support
Public Housing Assistance
Family Support Centers
Medical Transportation (MATP)
System of Care Initiative
Drug & Alcohol
Early Intervention
Mental Health
BEHAVIORAL HEALTH
CYF as Parent
CYF Placement
CYF
CHILD WELFARE
Involved Within Last Year Prior Involvement
CHILD WELFARE
BEHAVIORAL HEALTH
SUPPORT SERVICES
INTELLECTUAL DISABILITY
JUVENILE JUSTICE
Overlap of Children Served
53 percent (14,450) of PPS Students have prior Human Service involvement 36 percent (9,750) were involved with a Human Service within the last year

Questions?
Remember to sign up for one-one-one assistance
during the HMIS TA clinics!
If you have additional questions, or would like to
talk about strategies for your organization related
to HMIS....