best practices for dust control on aggregate roads … · best practices for dust control on...
TRANSCRIPT

Take the steps...
Transportation Research
Research...Knowledge...Innovative Solutions!
2009-04
Best Practices for Dust Control on Aggregate Roads

Technical Report Documentation Page 1. Report No. 2. 3. Recipients Accession No. MN/RC 2009-04 4. Title and Subtitle 5. Report Date
January 2009 6. Best Practices for Dust Control on Aggregate Roads
7. Author(s) 8. Performing Organization Report No. Eddie N. Johnson and Roger C. Olson 9. Performing Organization Name and Address 10. Project/Task/Work Unit No.
11. Contract (C) or Grant (G) No.
Minnesota Department of Transportation Office of Materials 1400 Gervais Avenue Maplewood, Minnesota 55109
(c) LRRB842
12. Sponsoring Organization Name and Address 13. Type of Report and Period Covered Final Report 14. Sponsoring Agency Code
Minnesota Department of Transportation 395 John Ireland Boulevard, Mail Stop 330 St. Paul, Minnesota 55155
15. Supplementary Notes http://www.lrrb.org/PDF/200904.pdf 16. Abstract (Limit: 200 words)
This study evaluated the performance and cost of commonly used dust palliatives using a mobile air sampling technique. Treatments of calcium chloride, magnesium chloride, and organic polymer-plus-binder were evaluated at standard application rates during the first year and at variable rates during the second year. The treatments were applied to a variety of subject roads that were located throughout Minnesota. Average daily traffic levels varied from 25 to 700 vehicles per day.
The overall data trend showed that treatments reduced dust levels and measurements showed that aggregate surface moisture content was the best predictor of dust control efficiency. Positive relationships were measured between dust control efficiency and other variables in the study, generally reinforcing the concept that higher application rates may be more successful on gravels containing greater amounts of material passing the #200 sieve. A negative relationship was measured between dust control efficiency and sand equivalency, showing that treatments on gravels containing more sand material were less effective.
In addition to dust control, study participants observed a secondary benefit of surface stabilization, which lasted for a period of time. Treated sections that developed surface stabilization were able to reduce maintenance activities to intersection areas only.
17. Document Analysis/Descriptors 18. Availability Statement Dust control efficiency, moisture content, mobile dust collector. No restrictions. Document available from:
National Technical Information Services, Springfield, Virginia 22161
19. Security Class (this report) 20. Security Class (this page) 21. No. of Pages 22. Price Unclassified Unclassified 54
Best Practices for Dust Control on Aggregate Roads
Final Report
Prepared by
Eddie N. Johnson Roger C. Olson
Office of Materials
Minnesota Department of Transportation
January 2009
Published by
Minnesota Department of Transportation Research Services Section
395 John Ireland Boulevard, MS 330 St. Paul, Minnesota 55155-1899
This report represents the results of research conducted by the authors and does not necessarily represent the views or policies of the Minnesota Department of Transportation and/or the Center for Transportation Studies. This report does not contain a standard or specified technique. The authors and the Minnesota Department of Transportation and/or Center for Transportation Studies do not endorse products or manufacturers. Trade or manufacturers’ names appear herein solely because they are considered essential to this report.

Acknowledgements
The authors would like to thank the following individuals and organizations for the assistance and support provided to this project: Minnesota Local Road Research Board, John McDonald, Bruce Hasbargen, Mike Flaagan, Kathy Schaefer, Courtney Kleven, Greg Isakson, Shawn Williams, Bill Eisenmenger, Alan Rindels, Shirlee Sherkow, Karen Parsons, John Pantelis, Kevin Rosaasen, and Professor Tom Sanders.

Table of Contents Chapter 1: Background ..............................................................................................................1 Chapter 2: Test Methods............................................................................................................2 Chapter 3: Evaluation Plan ........................................................................................................7 Chapter 4: Test Section Construction ........................................................................................9 Chapter 5: Test Results ............................................................................................................16 Chapter 6: Dust Control Performance and Value ....................................................................24 Chapter 7: Summary and Recommendations...........................................................................27 References................................................................................................................................30 Appendix A - Survey of Participating Engineers Appendix B - Project Data Tables Appendix C - Communication with Residents and Incdiental Observations

List of Tables Table 1 Testing Scenario – Without Replicate Sections........................................................... 7 Table 2 Testing and Replication Matrix ................................................................................... 7 Table 3 Summary of Dust Control Test Sections ................................................................... 12 Table 4 Statistical Performance of the Dust Collector............................................................ 16 Table 5 Dust Control Performance Correlations .................................................................... 23 Table 6 Project Close-out Survey of Participating Engineers ................................................ 26
List of Figures Figure 1 Sketch of plywood dust collection box. ......................................................................3 Figure 2 Ground clearance for hitch-mounted dust collection gear. .........................................4 Figure 3 Penetration index vs. depth: Faribault County gravel roads........................................8 Figure 4 Rolling treated aggregate surface, Pennington 72.....................................................10 Figure 5 Dust collection variability during the LRRB study...................................................17 Figure 6 Linear trends in Minnesota dust collection data........................................................18 Figure 7 Dust measurement vs. percent passing 0.075mm sieve (all sections). ......................18 Figure 8 Dust measurement vs. sand equivalency (all sections). ............................................19 Figure 9 Moisture content vs. treatment age (all sections). .....................................................19 Figure 10 Dust measurement vs. moisture content. .................................................................20 Figure 11 Dust control efficiency vs. moisture content efficiency..........................................20 Figure 12 Dust control efficiency vs. treatment age measured in year one. ............................21 Figure 13 Dust control efficiency vs. age for entire project. ...................................................21 Figure 14 Dust control efficiency vs. treatment age for treatment type. .................................22 Figure 15 2007-08 Dust control efficiency vs. treatment age for treatment type. ...................22 Figure 16 Dust control efficiency vs. application rate (all sections). ......................................24 Figure 17 Moisture content control efficiency vs. application rate (all sections)....................25 Figure 18 2007-08 Dust control efficiency per dollar vs. application rate. .............................25

Executive Summary
During a two-year study that included field validations, a set of dust control applications were evaluated using a mobile air sampling technique developed by Colorado State. Treatments of calcium chloride, magnesium chloride, and organic polymer-plus-binder were evaluated using standard rates during the first year and at variable rates during the second year. The treatments were applied to a variety of subject roads that were located in northwest, east-central, and southwest parts of Minnesota. Traffic levels varied from average daily traffic (ADT) of 25 to 700.
The use of uniform measurement procedures helped increase precision, but did not remove the effect of collecting data under variable service conditions, and weak correlations were obtained between the study variables.
The overall data trend showed that treatments reduced dust levels. Measurements showed that aggregate surface moisture content was the best predictor of dust control efficiency, and dust levels decreased with increased moisture. Weak positive relationships were measured between dust control efficiency and: application rate, ADT, conductivity, and the percent of particles passing the #200 sieve. The weak positive relationships generally reinforce the concept that higher application rates may be more successful on gravels containing greater amounts of material passing the #200 sieve. A negative relationship was measured between dust control efficiency and sand equivalency, showing that treatments on sandy gravel were less effective.
In addition to dust control, study participants observed a secondary benefit of surface stabilization, which lasted for a period of time. Treated sections that developed surface stabilization were able to reduce maintenance activities to intersection areas only.

1
Chapter 1: Background In 2006 The Minnesota Local Road Research Board (LRRB) funded Investigation 842, Best Practices for Dust Control, for the purpose of studying the effectiveness of commonly used dust control strategies employed on aggregate surfaced roads. In the year 2000 it was estimated that 53 percent of all roads in the United States were unpaved; totaling approximately 1.6 million miles [1]. Dust control strategies are sometimes used to increase visibility conditions for the traffic on aggregate surfaced roads and also to benefit residences located along those roads.
The objective of this study was to conduct a performance review of several commonly used dust control agents and recommend a set of best practices based on the outcome.
Roadway dust production has been measured by several methods: by static collection vessels, laser measurement, and vehicle mounted devices. Studies show that it is an advantage to have a collection tool that is easy to operate, produces consistent field measurements, is rugged, give results for continuous roadway sections, and can be adapted to a variety of field conditions [2, 3]. A vehicle mounted configuration was chosen as the primary research tool because of the need to study dust production of continuous roadway sections. Vehicle mounted devices have the potential to gather data in the field with consistent and repeatable results, showing coefficients of variation below 30 percent [2, 3].

2
Chapter 2: Test Methods A combination of field and lab work was performed to evaluate the in-place roadway sections, surface materials, and performance of dust palliative treatments. Dynamic Cone Penetrometer
The in-place roadway sections were evaluated using a dynamic cone penetrometer (DCP). The DCP is a portable device consisting of a 15-lb falling weight that strikes an anvil to drive an attached steel rod into the roadbed. The steel rod is tipped with a 60 degree cone. Penetration of the rod was measured for each drop of the falling weight. With the penetration data it was possible to identify changes in resistance to shear, signifying boundaries of material layers. The DCP results provided an estimate of the surface aggregate thickness. The device was used only in preliminary stages of the study.
Aggregate Testing
Aggregate samples were collected from the roadway for laboratory evaluation. Representative samples were acquired by shoveling a 1-ft wide path across the entire aggregate roadway. Tests were performed on those samples to determine gradation, plasticity index, and sand equivalency.
Dust Control Evaluation
The effectiveness of a given dust control treatment and control sections was assessed by sampling the surface aggregate for moisture content and by sampling the dust production of the roadway.
In order to determine moisture content approximately 0.5 – 1.0 lb of surface aggregate was sampled from the upper 2-in. of a wheel path and stored in an air-tight containers. The samples were later oven dried to constant mass.
Average dust production for the road segment was determined by performing three sampling runs with a mobile dust collection device. The device was mounted on a Dodge 1500 pickup and located below the rear bumper and behind the drivers-side rear tire. Sampling protocol specified that a sample should be obtained using a vehicle traveling at a constant rate of 40 mph across a one-mile distance. Samples were collected on pre-weighed 8 by 10-in. EPM 2000 glass microfiber filters. Manufacturer specifications state that the filters retain a minimum of 99.95 percent of particle size 0.3 μm. Filters are capable of a flow rate of 1.52 m3/min. Each one-mile sample was stored in a sealable plastic bag then returned to the laboratory for a final weighing. The dust production was reported in units of grams per mile of test (g/m).
Mobile Dust Collection Device The research staff built a mobile dust collection system based on a device developed by Addo and Sanders, called the “Colorado State Dustometer”. Major components of the Dustometer include: power plant, vacuum pump, screens, and collection box. Dust samples were captured on EPA quality filter paper.
In this case the researchers elected to use 5/8-in. plywood for the collection box carcass and fabricate an adjustable steel assembly capable of attaching to a receiver-type hitch. Major components of the steel assembly consisted of: steel angle material for holding the collection

3
box, steel tubing for a cantilever arm, and commercially available pintle plate mounting hardware. The wood and steel collection device was used reliably for two years, obtaining individual one-mile samples over approximately 317 miles of aggregate surfaced roads. The dimensions of the box were selected in order to be able to compare test results with the Colorado Dustometer design and also accommodate the ground clearance of a Dodge 1500 pickup with the dust box suspended just below the rear bumper.
Requirements were that the vertical collection area facing the dust source should equal one square foot, and that the interior volume of the collection chamber should equal one cubic foot. Dimensions of the 5/8-in. plywood shell were 9 in. height and 16 in. width and 12 in. depth. The box also included a 9 in. by 11 in. by 3 in. vacuum chamber below the collection chamber. A 2 in. diameter PVC connection was installed in the center of the rear vacuum chamber wall.
An 8 in. by 10 in. metal screen was installed to separate the bottom of the collection chamber from the top of the vacuum chamber. The wooden dust collection box was sealed during construction by applying expansive water-activated glue to the joined surfaces. The front of the box was made of a stainless steel wire cloth (200 micrometer square opening) filter behind a 5/8-in. square sieve screen. The front screens were attached to a wooden frame that could be slipped over the box opening. A sketch of the design is shown in figure 1.
Figure 1 Sketch of plywood dust collection box. The mounting system consisted of a length of rectangular steel tubing serving as a cantilever arm that bolts onto a medium capacity steel hitch mounting plate. The tube had exterior dimensions of 3-in. by 2-in. and a nominal thickness of 0.1-in. At the free end of the assembly threaded rods supported a basket made from 1.5-in. steel angles and 1-in. by 0.125-in. rectangular steel bars.
Once the mounting assembly was attached to the vehicle, the collection box was placed in the steel basket, and secured using a cross piece and wing nuts.
During the evaluation process it was found that a certain amount of undesirable vertical bounce was present at the free end of the mounting assembly. A ratchet-type nylon strap was used to prevent free-end movement during dust collection operations.
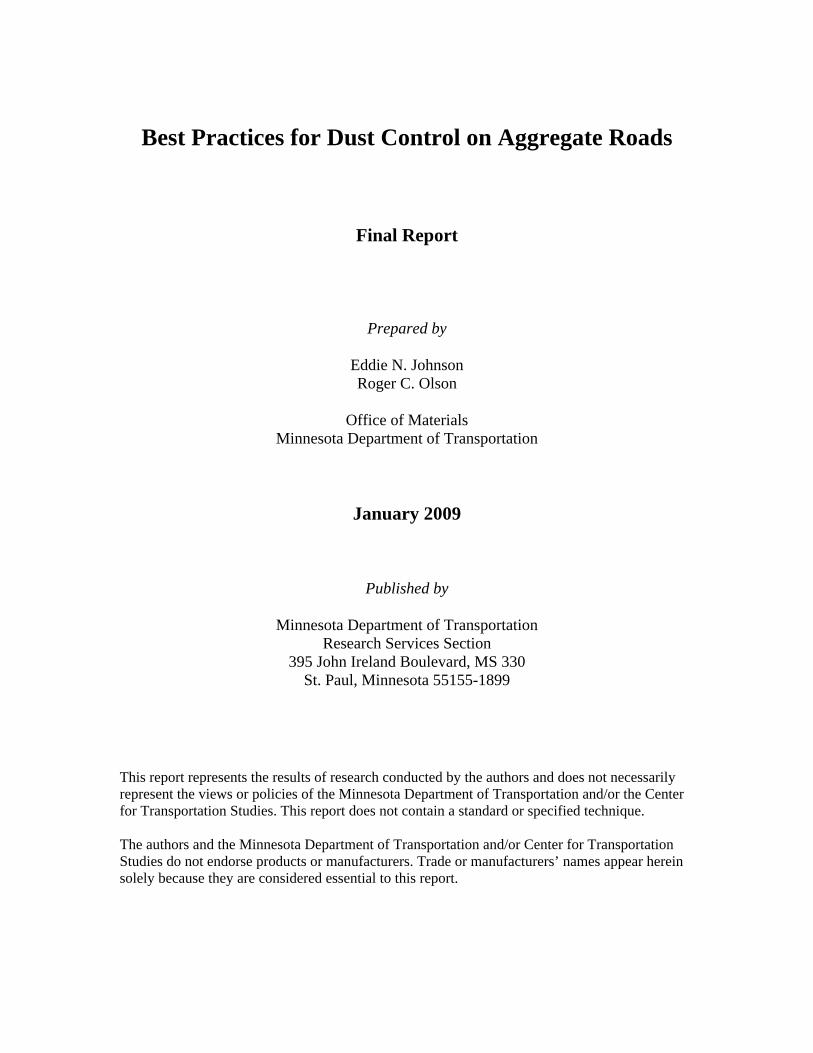
The mounting system provided five inches of ground clearance for the dust collection box (figure 2).
4
Figure 2 Ground clearance for hitch-mounted dust collection gear.
Fabrication and testing costs for the dust collection system, including cantilever-type hitch assembly, portable generator, and other items, totaled approximately $3,000.
Evaluation of the system demonstrated that, when traveling very dusty roads at a speed of 40 mph and the vacuum pump off, a certain amount of road dust will enter through the screen and be deposited throughout the dust box. In this version of the dustometer, the suction provided by the vacuum pump assisted in drawing in dust particles and also kept the them in contact with the filter paper, ensuring that a representative sampling is obtained.
Evaluation Parameters Performance evaluation protocol included analysis of samples obtained from treatment and control sections. Evaluation was performed for a number of parameters including moisture content, moisture content control efficiency, dustometer measurement, dust control efficiency, percent passing 0.075 mm (#200) sieve, sand equivalent, treatment age, and treatment application rate. Basic calculations for these parameters are shown in equations one through seven.
⎟⎠⎞
⎜⎝⎛=
MsMw100MC Equation 1
Where: MC = percentage moisture content Mw = mass of water present in a sample of aggregate material, g Ms = mass of soil present in a sample of oven dried aggregate material, g

5
⎟⎟⎟⎟⎟
⎠
⎞
⎜⎜⎜⎜⎜
⎝
⎛∑=
==N
ni
1iDi
D Equation 2
Where: D = mean value of road dust samples, g/mile Di = a discrete sample of road dust, g/mile N = number of samples
⎟⎟⎟⎟⎟
⎠
⎞
⎜⎜⎜⎜⎜
⎝
⎛∑=
==1-N
ni
1i2D)-(Di
Sd(D) Equation 3
Where St(D) = the standard deviation of road dust samples, g/mile It is also possible to calculate the coefficient of variation (COV) for each sampling
scenario where at least three readings are taken. The COV is useful in identifying the relative precision of the measurement procedure.
⎟⎠⎞
⎜⎝⎛=
DSd(D)100COV Equation 4
Where COV = percentage coefficient of variation.
⎟⎠⎞
⎜⎝⎛ −=
DcDt1100CEDust
Equation 5 Where: Dust CE = percentage dust control efficiency Dt = the mean value of dust sampled, g/mile Dc = the mean value of dust sampled, g/mile Values of Dust CE greater than zero and up to 100 percent indicate effective
performance. Dust CE values less than or equal to zero percent indicate ineffective performance.
⎟⎠⎞
⎜⎝⎛ −= 1
MCcMCt100CE MC Equation 6

6
Where: MC CE = percentage moisture content control efficiency MCt = the moisture content of treated surface aggregate MCc = the moisture content of an untreated surface aggregate The Sand Equivalency test is performed on a sample of fine aggregate. A quantity of the
material is agitated in a graduated cylinder containing a stock calcium chloride solution. Readings are obtained after the aggregate suspension is allowed to settle for a prescribed period.
⎟⎠⎞
⎜⎝⎛=
CS100y Equivalenc Sand Equation 7
Where: S = height of sand material in cylinder C = height of clay material in cylinder

7
Chapter 3: Evaluation Plan Objectives of the test section selection phase included finding roads having two aggregate surface types and apply two or three dust control products to these materials. The subject roads should have some potential for replicating test sections in order to provide a meaningful statistical analysis. Table 1 shows in ideal testing scenario where two soils, traffic levels, and application rates are used to evaluate three products. The minimum number of control sections (numbered 110 and 220) is two. Table 1 Testing Scenario – Without Replicate Sections
N = 26 Aggregate Type, Traffic, and Application Rate Product 1 110 111 112 121 122 220 211 212 221 222 Product 2 111 112 121 122 211 212 221 222 Product 3 111 112 121 122 211 212 221 222
The researchers opted to have at least one control section per location because of subtle
differences in material, traffic, and orientation between sections. Table 2 shows the testing matrix that was achieved over the project lifetime. During the first project year three product types and two application rates were used on mostly low traffic volume roads. During the second year several application rates were evaluated for several materials and traffic levels. Replication was achieved for general aggregate types in year one and for specific test sections between project year one and year two.
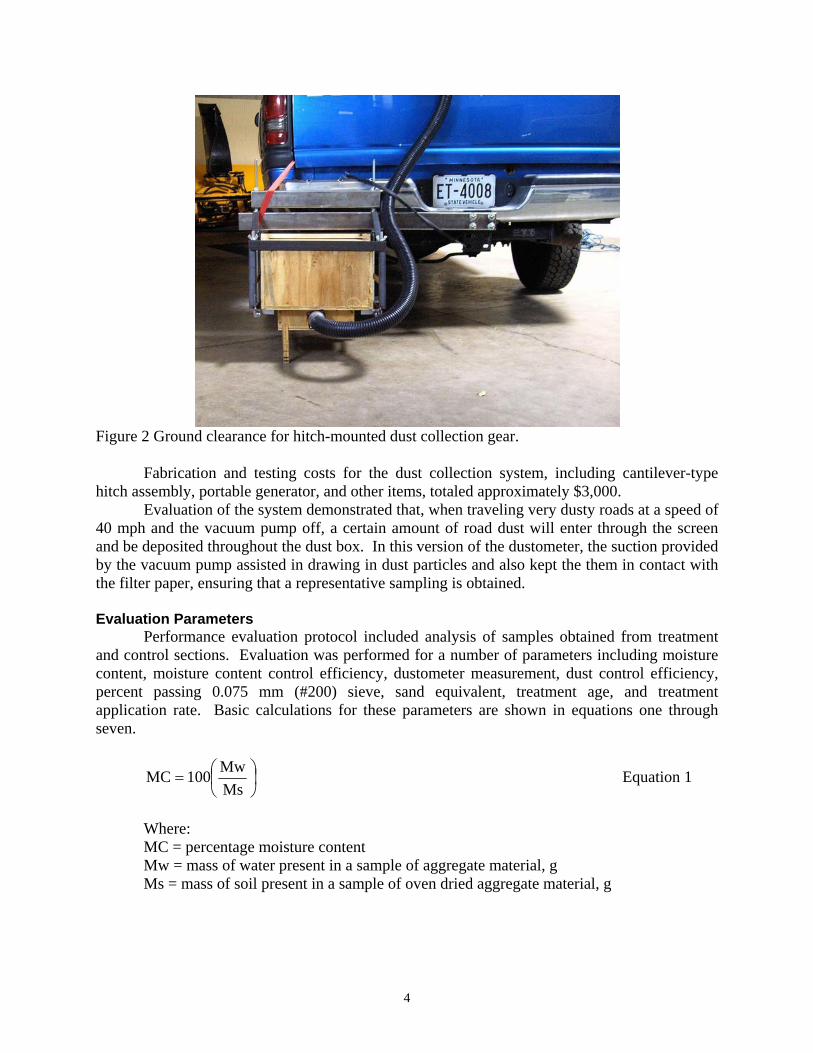
Preliminary evaluations used dynamic cone penetrometer (DCP) field testing. Materials were also sampled for laboratory testing of moisture content, gradation, and fines evaluation by either plasticity index (PI) or sand equivalency. Figure 3 shows a typical plot of DCP data, with the axes being depth and penetration index. These results were used to identify depths where material type was likely to change from aggregate surfacing to a secondary material.
Table 2 Testing and Replication Matrix
N = 45 Aggregate Type, Traffic, and Application Rate
Magnesium Chloride
Gravel L, H
Control*
L 0.2* 0.3*
L 0.3* 0.5 0.6
H 0.3*
H 0.3 0.4
Limestone L, H
Control*
L 0.3* - H
0.2 H
0.5
Calcium Chloride
Gravel L
Control*
L 03*
L 0.3 - -
Limestone H
Control* - - H
0.3 H
0.6
Organic Polymer
Gravel L
Control*
L 0.65*
L 0.65 - - - - - -
* multiple sections were evaluated L = Low traffic, less than 200 ADT
H = High traffic, greater than 200 ADT
8
0
100
200
300
400
5000 10 20 30 40
DPI for Each Blow (mm/blow)
Dep
th (m
m)
CR103 0.1m CR103 0.3m CR103 0.6m CR103 0.8m
Figure 3 Penetration index vs. depth: Faribault County gravel roads.

9
Chapter 4: Test Section Construction The research objectives during construction were to construct test sections in a controlled manner and monitor application rates and conditions. Appropriate test sections had a minimum length of one half mile. The project work plan identified construction tasks for both the first and second year of the study.
Year 1 Construction
Applications were sponsored by both local agencies and the Minnesota LRRB. LRRB sponsored applications were performed at the following sites:
Faribault County Road 103 near Blue Earth and County Pit Road near Bricelyn. A dust control product was applied to moist roads that had been prepared by blading.
o 0.3 gsy application of MgCl2 product began at the intersection with US 169 and extended east for approximately 0.5 miles.
o 0.3 gsy application of MgCl2 product began at the intersection with CSAH 2 and extended north for approximately 0.7 miles.
Lake of the Woods County near the intersection of CSAH 19 and CR 103 near Baudette. Applications of dust control products were applied to moist roads that had been prepared by blading. Roads were rolled with a compactor following application.
o 0.65 gsy application of an OPB began at the intersection with CR 103 and extended west for 0.5 miles. The solution was applied in three passes, the first at 0.25 gallons per square yard and the others at 0.20 gallons per square yard.
o 0.65 gsy application of an OPB began at the intersection with CR 103 and extended north for 0.5 miles. The solution was applied in three passes.
o 0.3 gsy application of MgCl2 product began at the intersection with CSAH 19 and extended east for 0.5 miles.
o A 0.6 gsy application of MgCl2 product began at the intersection with Minnesota Highway 11 and extended south on CSAH 19 for 0.5 miles. The solution was applied in two passes.
Pennington County Road 72 near Thief River Falls. Location is near the intersection with Minnesota Highway 1. A dust control product was applied to a moist road that had been prepared by blading. The road was rolled with a compactor following application (figure 4).
o 0.3 gsy application of MgCl2 product began 0.5 miles north of the intersection with Minnesota Highway 1 and extended north for 0.5 miles.
o 0.3 gsy application of MgCl2 product began 2.0 miles north of the intersection with Minnesota Highway 1 and extended north for 0.5 miles.

10
Figure 4 Rolling treated aggregate surface, Pennington 72.
Local agency test sections were also available for study, but applications on these sections were not monitored by researchers. Local agency sections were:
Pennington County Road 72 near Thief River Falls. Location is near the intersection with Minnesota Highway 1.
o Two separate 0.3 gsy applications of CaCl2 had been applied on an earlier date for the county. The first section began at the intersection with Minnesota Highway 1 and extended north for 0.5 miles. The second section began 2.5 miles north of Minnesota Highway 1 and extended north for 0.5 miles.
Goodhue CSAH 1 near Red Wing. During this time frame several miles of CSAH 1 were undergoing a pavement reconstruction project and a limestone base course had been left exposed between construction seasons. Two separate applications of CaCl2 had been applied to the base course for the county.
Red Lake County CAR 113 near Red Lake Falls. This short section of a dry CaCl2 treatment was applied by the county using a modified planting implement. The precise application rate is unknown, but because of the application method is estimated to be equal or greater than that achieved with applications of standard chloride solutions. Periodic applications also occurred after precipitation events.
Year 2 Construction
Decisions for project year two were based on performance observations in the previous year and consultation with the project technical advisory panel. It was determined that the following work would focus on readily available products used at a variety of application rates. Applications were sponsored by both local agencies and the Minnesota LRRB. LRRB sponsored applications were performed at the following sites:
Faribault County Road 103 near Blue Earth, County Pit Road near Bricelyn. And County Road 111 near Bricelyn. A dust control product was applied to roads that had been prepared by blading.
o 0.3 gsy application of MgCl2 product over previous years application began at the intersection with US 169 and extended east for approximately 0.5 miles.

11
o 0.3 gsy application of MgCl2 product 0.5 miles west and 0.5 miles north of the intersection with US 169 and extended north for approximately 0.5 miles.
o 0.4 gsy application of MgCl2 product 0.5 miles west and 1.0 miles north of the intersection with US 169 and extended north for approximately 0.5 miles.
o 0.3 gsy application of MgCl2 product over previous years application began at the intersection with CSAH 2 and extended north for approximately 0.5 miles.
o 0.3 gsy application of MgCl2 product at the intersection of County Road 111 with CSAH 2 and extending south for approximately 0.5 miles.
Lake of the Woods County Road 103 near the intersection of CSAH 19 near Baudette, and Lake of the Woods County Road 4 near the intersection with Minnesota Highway 11 near Williams. Applications of dust control products were applied to wet roads that had not been prepared by blading.
o 0.3 gsy application of MgCl2 product over previous years application began at the intersection with CSAH 19 and extended east for 0.5 miles.
o 0.3 gsy application of MgCl2 product began 1.0 mile east of the intersection with CSAH 19 and extended north for 1.0 miles.
o 0.2 gsy application of MgCl2 product began 0.5 mile north of the County Road 4 intersection with Minnesota Highway 11 and extended north for 0.5 miles.
o 0.2 gsy application of MgCl2 product began 1.5 mile north of the County Road 4 intersection with Minnesota Highway 11 and extended north for 0.5 miles.
Pennington County Road 72 near Thief River Falls. Location is near the intersection with Minnesota Highway 1. A dust control product was applied to a moist road that had been prepared by blading.
o 0.3 gsy application of MgCl2 product began 2.0 miles north of the intersection with Minnesota Highway 1 and extended north for 0.5 miles.
o 0.5 gsy application of MgCl2 product began 2.5 miles north of the intersection with Minnesota Highway 1 and extended north for 0.5 miles.
o No additional product was applied to the previous years 0.3 gsy application of MgCl2 product at 0.5 miles north of the intersection with Minnesota Highway 1, extending north for 0.5 miles.
o No additional product was applied to the previous years 0.3 gsy application of CaCl2 product beginning at the intersection with Minnesota Highway 1 and extending north for 0.5 miles.
Red Lake County Road 14 near Red Lake Falls. Location is near the intersection with Minnesota Highway 32. A dust control product was applied to a road that had been prepared by blading.
o 0.3 gsy application of MgCl2 product began 0.5 miles west of the intersection with Minnesota Highway 32 and extended west for 0.5 miles.
Kettle River Boulevard in the City of Wyoming. Location is near the intersection of Chisago County Road 22 with Interstate Highway 35 and is parallel to I-35. A dust control product was applied to a road that had been prepared by blading.

12
o 0.3 gsy application of MgCl2 product began 0.1 miles north of the intersection with Chisago County 22 and extended north for 0.5 miles.
410th Street in the City of North Branch. Location is near the intersection with US Highway 61. A dust control product was applied to a moist road that had been prepared by blading.
o 0.2 gsy application of MgCl2 product began at the intersection with US Highway 61 and extended east for 0.5 miles.
o 0.5 gsy application of MgCl2 product began 1.0 mile east of the intersection with US Highway 61 and extended east for 0.5 miles.
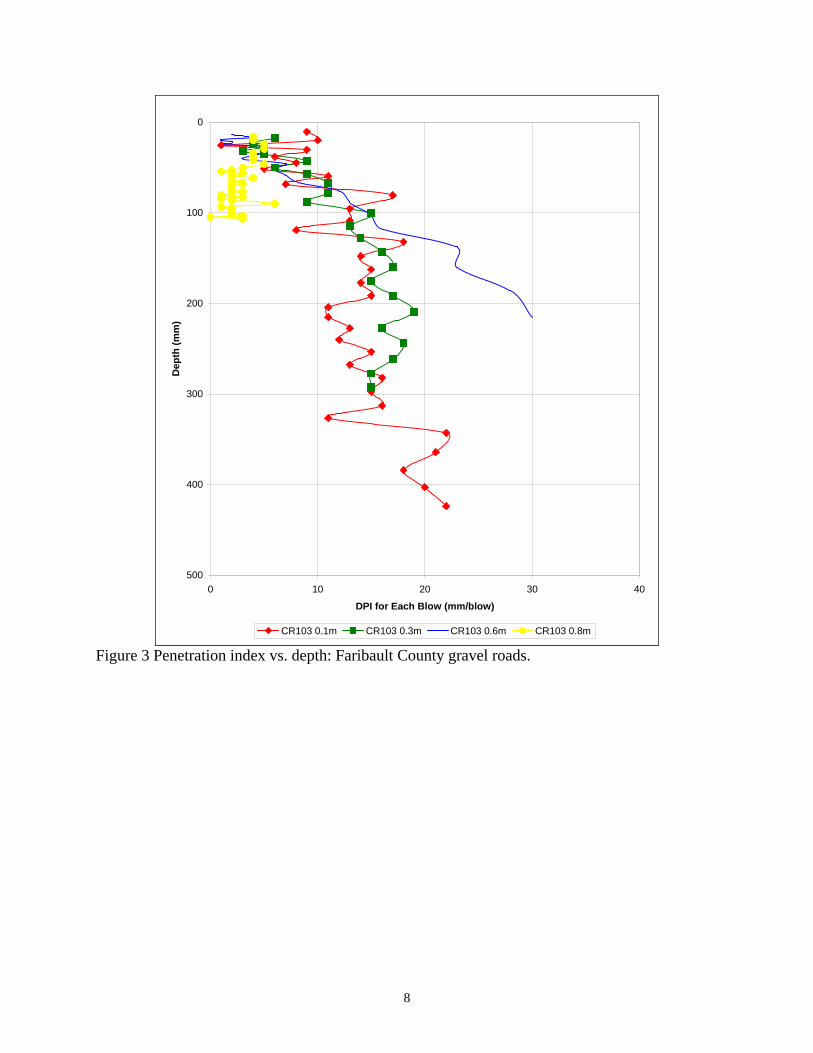
Table 3 shows that during the first project year 23 test sections were monitored and
during the second year 28 test sections were monitored, with several control sections utilized both years. The subject roads were in cities and counties located to include the northern or southern extremes of Minnesota. Traffic levels varied from 25 to 700 vehicles per day. Although the gravel materials possessed some differences, most were classified as a type of modified Class 2 or 5 gravel. The limestone materials originated from different sources around the state, but all possessed less than 5.2 percent passing the #200 sieve. Three dust control treatments were evaluated including: calcium chloride solution (CaCl2), magnesium chloride solution (MgCl2), a liquid formula of organic polymer plus binding agent (OPB), and control sections for each area.
Table 3 Summary of Dust Control Test Sections
No. Year County Road Treatment Mile Length Tests Material P200
Gravel in. AADT
1 1, 2 Faribault CSAH 103 Control 1 DCP, PI Gravel 5.5 4 – 7 100
2 1, 2 Faribault Pit Road Control 0.4 DCP, PI Sandy gravel 7.6 5 – 7 50
3 2 Faribault CSAH 111 Control 5 DCP, Sand Equiv
Gravel 5 11 75
4 1 Faribault CSAH 103 MgCl2 b 0.5 DCP, PI Gravel 5.5 3 – 9.5 100
5 2 Faribault CSAH 103 Mg Cl2 c 0.5 DCP, PI Gravel 5.5 3 – 9.5 100
6 2 Faribault CSAH 103 Mg Cl2 b 0.5 DCP, PI Gravel 5.5 3 – 9.5 100
7 2 Faribault CSAH 103 MgCl2 d 0.5 DCP, PI Gravel 5.5 3 – 9.5 100
8 1 Faribault Pit Road MgCl2 b 0.5 DCP, PI Sandy
gravel 7.6 5 – 7 50
9 2 Faribault Pit Road MgCl2 c 0.5 DCP, PI Sandy
gravel 7.6 5 – 7 50
10 2 Faribault CSAH 111 MgCl2 b 5
DCP, Sand Equiv
Gravel 5 11 75
11 1 LakeOfTheWoods CSAH 19 Control N/S 1
DCP, Sand Equiv
Sandy CL 5 gravel
11.3 12-15 60
12 2 LakeOfTheWoods CSAH 4 Control 0.5 Sand
Equiv
Sandy CL 5 gravel
50

13
No. Year County Road Treatment Mile Length Tests Material P200
Gravel in. AADT
13 1, 2 LakeOfTheWoods CR 103 Control 0.5
DCP, Sand Equiv
Sandy CL 5 gravel
6.1 4 40
14 1 LakeOfTheWoods CSAH 19 Control
E/W 0.5 DCP, Sand Equiv
Sandy CL 5 gravel
11.3 12-15 60
15 1 LakeOfTheWoods CSAH 19 Control N/S 0.5
DCP, Sand Equiv
Sandy CL 5 gravel
11.3 12-15 60
16 2 LakeOfTheWoods CSAH 4 MgCl2
a 0.5 Sand Equiv
Sandy CL 5 gravel
50
17 2 LakeOfTheWoods CSAH 4 MgCl2
a 0.5 Sand Equiv
Sandy CL 5 gravel
50
18 1 LakeOfTheWoods CSAH 19 MgCl2 N/S b 0.5
DCP, Sand Equiv
Sandy CL 5 gravel
11.3 12-15 60
19 1 LakeOfTheWoods CSAH 19 OPB E/W f 0.5
DCP, Sand Equiv
Sandy CL 5 gravel
11.3 12-15 60
20 1 LakeOfTheWoods CSAH 19 OPB N/S f 0.5
DCP, Sand Equiv
Sandy CL 5 gravel
11.3 12-15 60
21 1 LakeOfTheWoods CR 103 MgCl2
b 0.5 DCP, Sand Equiv
Sandy CL 5 gravel
6.1 4 40
22 2 LakeOfTheWoods CR 103 MgCl2
b 1 DCP, Sand Equiv
Sandy CL 5 gravel
6.1 4 40
23 2 LakeOfTheWoods CR 103 MgCl2
c 0.5 DCP, Sand Equiv
Sandy CL 5 gravel
6.1 4 40
24 1 Pennington CSAH 72 MgCl2 b 0.5
DCP, Sand Equiv
CL5 modified
gravel 10.3 8 125
25 1 Pennington CSAH 72 CaCl2 b 0.5
DCP, Sand Equiv
CL5 modified
gravel 4.5 8 125
26 1, 2 Pennington CSAH 72 CaCl2 b 0.5
DCP, Sand Equiv
CL5 modified
gravel 4.5 8 125
27 1 Pennington CSAH 72 Control 0.5 DCP, Sand Equiv
CL5 modified
gravel 3.5 7 125
28 1, 2 Pennington CSAH 72 Control 1 DCP, Sand Equiv
CL5 modified
gravel 3.5 7 125
29 1, 2 Pennington CSAH 72 MgCl2 b 0.5
DCP, Sand Equiv
CL5 modified
gravel 10.3 13 125
14
No. Year County Road Treatment Mile Length Tests Material P200
Gravel in. AADT
30 2 Pennington CSAH 72 MgCl2 a 0.5
DCP, Sand Equiv
CL5 modified
gravel 4.5 10 125
31 2 Pennington CSAH 72 MgCl2 e 0.5
DCP, Sand Equiv
CL5 modified
gravel 10.3 10 125
32 1 Goodhue CSAH 1 CaCl2 b 1 Sand
Equiv CL 5
limestone 5.2 - 1600
33 1 Goodhue 1 CSAH CaCl2 b 1 Sand
Equiv CL 5
limestone 5.2 - 1600
34 1 Goodhue CSAH 1 Control 0.25 Sand Equiv
CL 5 limestone 5.2 - 1600
35 1 Red Lake CAR 113 Control 0.5 - CL5
modified gravel
- - 25
36 1 Red Lake CAR 113 CaCl2 0.1 - CL5
modified gravel
- - 25
37 2 Red Lake CSAH 14 Control 0.5 Sand Equiv
CL5 modified
gravel 3.1 - 25
38 2 Red Lake CSAH 14 MgCl2 b 0.5 Sand
Equiv
CL5 modified
gravel 3.1 - 25
39 2 City of Wyoming
Kettle River Blvd. Control 0.5 Sand
Equiv
CL5 modified limestone
1.4 - 100
40 2 City of Wyoming
Kettle River Blvd. MgCl2
b 0.5 Sand Equiv
CL5 modified limestone
1.4 - 100
41 2 City of North
Branch Hemmingway Control 0.5 Sand
Equiv
CL5 modified limestone
4 - 700
42 2 City of North
Branch 410th St MgCl2
a 0.5 Sand Equiv
CL5 modified limestone
4 - 700
43 2 City of North
Branch 410th St MgCl2
e 0.5 Sand Equiv
CL5 modified limestone
4 - 700
44 2 City of North
Branch 410th St Control 0.5 Sand
Equiv
CL5 modified limestone
4 - 700
45 2 City of North
Branch Hemmingway MgCl2
b 0.5 Sand Equiv
CL5 modified limestone
4 - 700
With treatment rates: a) 0.2 b) 0.3 c) 0.3 plus residual from prior year d) 0.4 e) 0.5 f) 0.6 gsy

15
Alternative Dust Control Products During the construction process several locations were considered for application of
crude lactic acid (CLA) material, a byproduct of the corn plastic manufacturing industry. To date the only known source of CLA in the upper Midwest is a facility near Omaha, NE. The untreated CLA byproduct has a pH in the range of 1.0 and is very tacky. The material dries to a solid and has the ability to encapsulate aggregates. The supplier issued a material safety data sheet in 2007 at the request of the research team.
There were anecdotal reports of several CLA test sections applied on aggregate roads in Iowa. Due to the nature of the experiments no information was available on the tracking characteristics or actual dust control performance. Test sections in Lake of the Woods County and City of Wyoming were cancelled because of poor weather and because concerns about the material pH.
The CLA plant and brokers experimented with methods of raising pH. The most promising method was reportedly the introduction of sodium hydroxide. Change in pH and practicality of use is limited by the ability to keep the sodium hydroxide residue “in solution” since settling of material will adversely affect pumping and spraying operations.

16
Chapter 5: Test Results Aggregate Testing Results of aggregate testing are shown in Appendix B. The table includes percent passing the #200 sieve, sand equivalency, and results for plasticity testing. Plasticity evaluations were conducted for only one material, which was evaluated in the laboratory and found to be “non plastic”. The test was soon discontinued because of the assumption that materials from the remaining sites would also be rated “non plastic”. The sand equivalency test was used as an alternative because it quantifies proportions of sand within the material.
Conductivity testing was also performed on a random selection of surface aggregates that were sampled during years one and two. Conductivity is the ability of a material to conduct electrical current, and a proportional relationship exists between ion concentration and conductivity value. Conductivity values should therefore correspond to the presence of chloride-based dust control agents. The testing scenario used known weights of dried aggregate samples that were placed in equal weights of deionized water then measured with a laboratory grade conductivity meter.
Field Performance of Dust Device Performance of the dust collection device was evaluated for the period of the study. Over the course of obtaining more than 99 averages (three measurements each) the mean coefficient of variation (COV) was calculated to be near 20 percent, with a standard deviation of 13.1. Table 4 Statistical Performance of the Dust Collector
COV statistic Value Min 0.0 Q1 10.1
Med 17.8 Q3 27.3
Max 68.6 Mean 20.0 Stdev 13.1
N 99 During the course of the study researchers averaged approximately 13 individual dust evaluations per day of testing, or 4.3 test sections per day. During the construction process and subsequent evaluations it was observed that each section was in some way unique, and each section contained factors that may have influenced the dust sampling process. The variability of local weather conditions (especially wind), test section length and directional orientation, proximity to wooded areas or residences, and the presence of intersections or rail crossings all have the potential to affect sampling results. The following attempt was made to illustrate both the overall and daily testing variability that can be encountered during a study such at this. Figure 5 plots the running average of the COV versus the number of tests. The 5-point moving average was also included as an estimate of the variability that was present on a daily basis. The figure shows how the performance of the device fluctuated at various points of the study. The prominent increasing or decreasing trends

17
visible in the moving average are likely due to seasonal weather changes combined with variable wind speed or direction, or differences between moisture levels for sites visited on a given day.
0
10
20
30
40
50
0 50 100 150 200 250 300 350
Number of Tests
Dus
t Col
lect
ion
CO
V, %
Running Average 5-point Moving Average
Figure 5 Dust collection variability during the MN LRRB study. Field Performance of Dust Treatments
During the first year of the study road dust and moisture content performance was measured for aggregate roads subjected to conventional treatment levels of calcium and magnesium chloride types dust control product as well as one commercially available organic polymer binder. Second year data consisted primarily of dust and moisture performance for a greater variety of application rates using magnesium chloride-based products.
Dust collection data is tabulated in Appendix B. The linear trends in the collection data are graphed in figure 6. All lines were fitted using a program that computed least-squares. The dust production data was gathered over various conditions encountered during the course of the study. When data points from all sites were included there was much scatter, and it should be expected that the regression correlation coefficients (R2) of these lines are very small (all less than 0.07). Although the linear fit is poor the figure shows several things. First, the untreated control sections maintained a dust production level near 1.75 grams per mile during the course of the study; second, the average dust production of all sections increased (by nearly 0.06 percent) between 2006 and 2008; and third, the trend of the treated sections showed better performance for most of the study.

18
0
1
2
3
4
Dec-05 Oct-06 Aug-07 Jun-08 Mar-09
Date
Dus
t, g/
mile Linear (All Data)
Linear (Control)Linear (Treatment)
Figure 6 Linear trends in Minnesota dust collection data. Figures 7 and 8 are plots of dust measurements for treated and control sections. The figures show there is variability present in the material of the subject set. From figure 7 it is apparent that most of the gravel roads in the study were surfaced with material having less than 10 percent passing the 0.075 mm (#200) sieve. Figure 8 shows that the sand equivalency of the subject roads ranged from 40 to 90 percent.
Various aggregate road resources recommend that surface aggregate should have a sand equivalency percentage of 25 – 40 and a gradation with approximately 12 percent passing the 0.075 mm sieve.
01234567
0 2 4 6 8 10 12
Passing 0.075mm sieve, percent
Dus
tom
eter
, g/m
ile
Figure 7 Dust measurement vs. percent passing 0.075mm sieve (all sections).

19
01234567
0 20 40 60 80 100
Sand Equivalency, percent
Dus
tom
eter
, g/m
ile
Figure 8 Dust measurement vs. sand equivalency (all sections).
Figure 9 is a plot of moisture content versus treatment age. A spike in the moisture
content data is visible near 400 days, and is due to a period of wet weather that coincided with evaluations. These data points do not appear to be typical of the rest of the data set and, if disregarded, it appears that moisture content values are enhanced by treatment until the age reaches approximately 200 days. After 200 days a decline was observed in moisture content values for both treated and control sections, and treated sections do not exhibit an advantage.
0%2%4%6%8%
10%
0 200 400 600 800
Age, days
Moi
stur
e C
onte
nt
Treatment Control
Figure 9 Moisture content vs. treatment age (all sections).
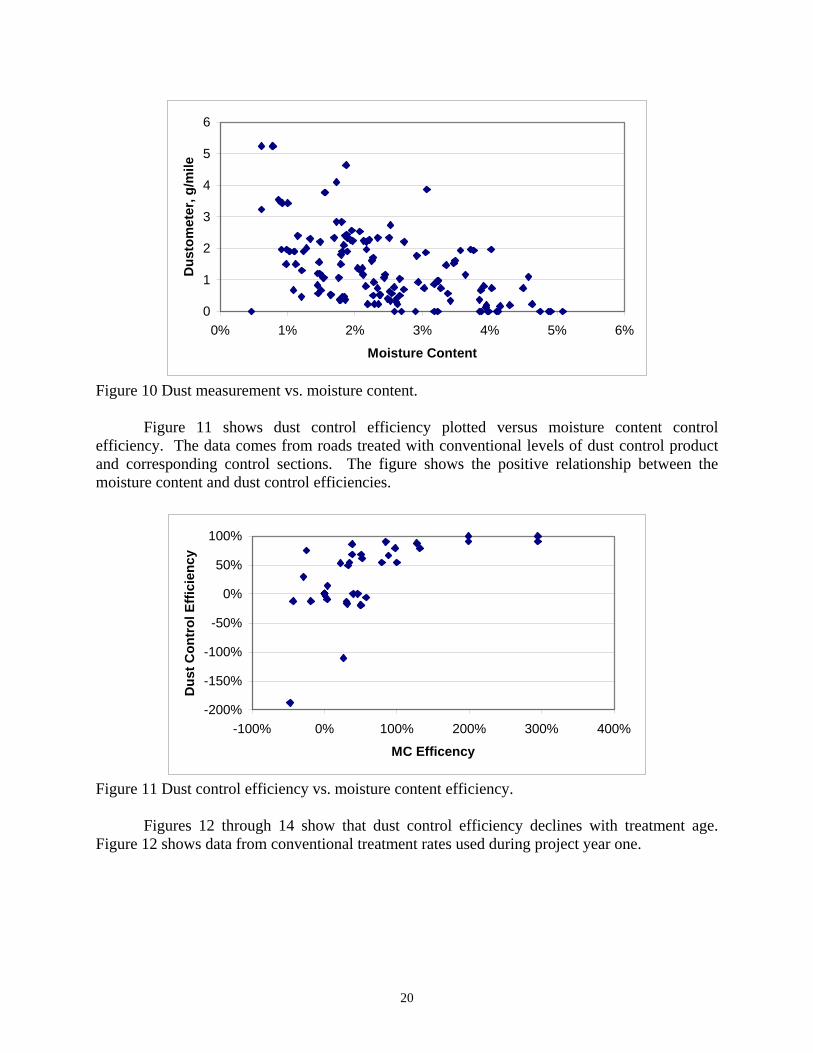
In Figure 10 average dust measurements are plotted versus moisture content. From the
figure it is apparent that the dust measurements decline rapidly between zero and three percent moisture, and that the rate appears to be somewhat less at moisture contents above three percent. Measurement data terminates near five percent moisture.
20
0
1
2
3
4
5
6
0% 1% 2% 3% 4% 5% 6%
Moisture Content
Dus
tom
eter
, g/m
ile
Figure 10 Dust measurement vs. moisture content.
Figure 11 shows dust control efficiency plotted versus moisture content control
efficiency. The data comes from roads treated with conventional levels of dust control product and corresponding control sections. The figure shows the positive relationship between the moisture content and dust control efficiencies.
-200%
-150%
-100%
-50%
0%
50%
100%
-100% 0% 100% 200% 300% 400%
MC Efficency
Dus
t Con
trol
Effi
cien
cy
Figure 11 Dust control efficiency vs. moisture content efficiency.
Figures 12 through 14 show that dust control efficiency declines with treatment age.
Figure 12 shows data from conventional treatment rates used during project year one.

21
-250%-200%-150%-100%-50%
0%50%
100%
0 50 100 150 200 250 300 350
Age, days
Dus
t Con
trol
Effi
cien
cy
Figure 12 Dust control efficiency vs. treatment age measured in year one.
Figure 13 presents similar data for the entire project, and includes the effects of varied application rates and several wet weather events. Although the best-fit line shows that dust control efficiency is expected to decrease to zero at 500 days, similarities between the figures suggest that a practical dust control efficiency lifetime is nearer to 200 days. Please direct your attention to the point (190 days, -300 percent). The point is considered an outlier because it was obtained for a dry application of calcium chloride over a 200-ft road section. Collection occurred during breezy conditions and it was observed that the treated area was sheltered by buildings and trees and there was no shelter along the corresponding mile of control section.
Figure 14 compares the control efficiency of several products that were applied at conventional application rates. Similar performance was recorded to an age near 200 days.
-400%
-300%
-200%
-100%
0%
100%
0 200 400 600 800
Age, days
Dus
t Con
trol
Effi
cien
cy
Figure 13 Dust control efficiency vs. age for entire project.

22
-250%-200%-150%-100%-50%
0%50%
100%
0 50 100 150 200 250 300 350
Age, days
Dus
t Con
trol
Effi
cien
cy
Control CaCl2 MgCl2 OPB
Figure 14 Dust control efficiency vs. treatment age for treatment type.
During the second year of construction several treated sections from year one were either
re-treated or left alone to investigate the presence of a residual effect. Figure 15 compares the performance of test sections having new chloride treatments with test sections having two treatments applied approximately one year apart. The performance of sections having residual chlorides was similar to those having new chloride treatments.
-100%-75%-50%-25%
0%25%50%75%
100%
0 200 400 600 800
Treatment Age, days
Dus
t Con
trol
Effi
cien
cy
NO TREATMENT NEW TREATMENT TREATED + RESIDUAL
Figure 15 2007-08 Dust control efficiency vs. treatment age for treatment type.
Data from a number of variables was generated by this study, but corresponding
conductivity (presence of control agent) measurements were not available for approximately 40 percent of the moisture and dust data. Pearson correlation coefficients were calculated for two versions of the data; the first including all data points, and the second that excluded data that was missing conductivity measurements. Comparison of the two coefficient sets found that values corresponded well with the exception of the conductivity variable, which was weaker in the set containing all data points.
23
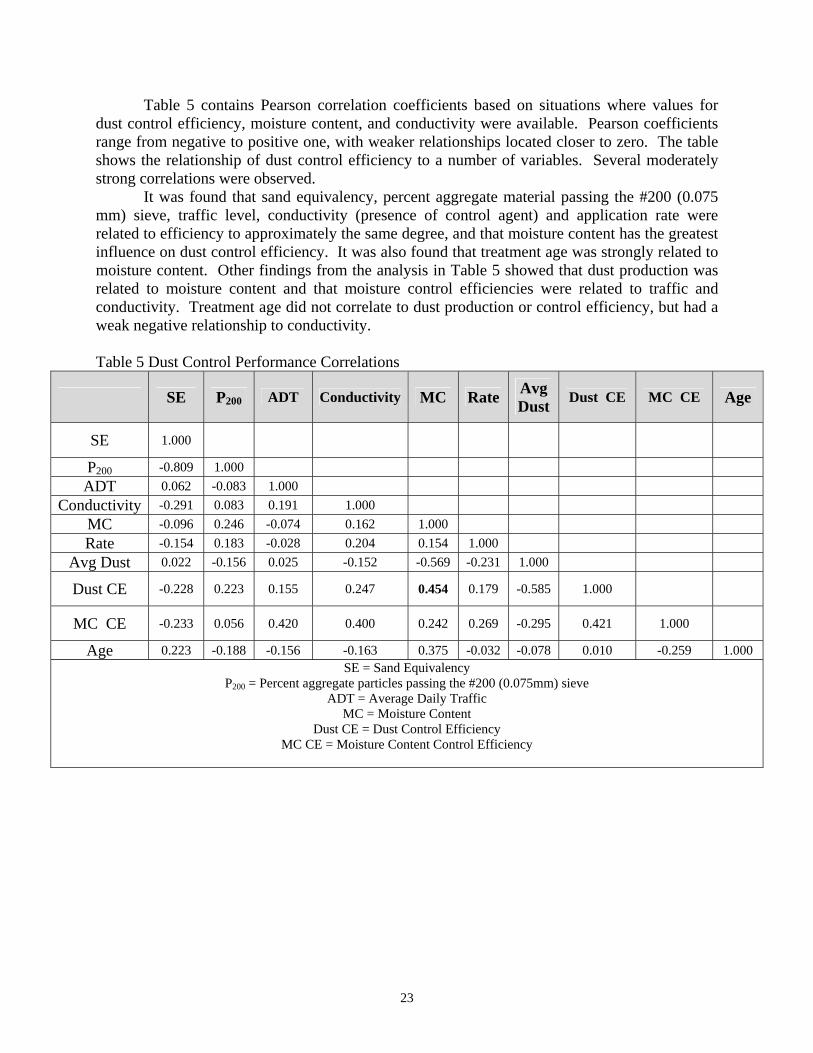
Table 5 contains Pearson correlation coefficients based on situations where values for dust control efficiency, moisture content, and conductivity were available. Pearson coefficients range from negative to positive one, with weaker relationships located closer to zero. The table shows the relationship of dust control efficiency to a number of variables. Several moderately strong correlations were observed.
It was found that sand equivalency, percent aggregate material passing the #200 (0.075 mm) sieve, traffic level, conductivity (presence of control agent) and application rate were related to efficiency to approximately the same degree, and that moisture content has the greatest influence on dust control efficiency. It was also found that treatment age was strongly related to moisture content. Other findings from the analysis in Table 5 showed that dust production was related to moisture content and that moisture control efficiencies were related to traffic and conductivity. Treatment age did not correlate to dust production or control efficiency, but had a weak negative relationship to conductivity.
Table 5 Dust Control Performance Correlations
SE P200 ADT Conductivity MC Rate Avg Dust Dust CE MC CE Age
SE 1.000
P200 -0.809 1.000 ADT 0.062 -0.083 1.000
Conductivity -0.291 0.083 0.191 1.000 MC -0.096 0.246 -0.074 0.162 1.000 Rate -0.154 0.183 -0.028 0.204 0.154 1.000
Avg Dust 0.022 -0.156 0.025 -0.152 -0.569 -0.231 1.000
Dust CE -0.228 0.223 0.155 0.247 0.454 0.179 -0.585 1.000
MC CE -0.233 0.056 0.420 0.400 0.242 0.269 -0.295 0.421 1.000
Age 0.223 -0.188 -0.156 -0.163 0.375 -0.032 -0.078 0.010 -0.259 1.000 SE = Sand Equivalency
P200 = Percent aggregate particles passing the #200 (0.075mm) sieve ADT = Average Daily Traffic
MC = Moisture Content Dust CE = Dust Control Efficiency
MC CE = Moisture Content Control Efficiency

24
Chapter 6: Dust Control Performance and Value Cost of Dust Suppression Material and Application
During the first year of the project the performance of several dust control agents were evaluated. The cost of application varied between $0.50 and $1.45 per gallon. The application cost translated to between $0.15 and $0.94 per square yard. Material cost was generally below $0.78 per gallon unless haul distance was exceptional. The mean cost for the treatments was $0.82 per gallon.
During the second year of the project the performance a single control agent was evaluated based on application rate alone. Cost of the product was $0.68 per gallon. Because of variable application rate the cost translated to between $0.12 and $0.37 per square yard. Performance Value of Dust Control
Figures 16 and 17 are plots of control efficiencies for dust and moisture versus product application rate for all the treated test sections in the study. The figures show that 0.4 gsy applications exhibited less variation in control efficiency than did other rates.
Efficiency values were calculated using a reference control section specific to the treatment site. An efficiency of zero percent means the treated section performs equal to the control section and positive efficiency values indicate performance superior to the control section. Negative dust control efficiencies were possible when greater sample masses are obtained on treated sections. This situation was likely to occur when treated and control roadways are moist, and produce less dust in general, or when the treatment had degraded past a useful point. It was observed that it was possible to recover from early negative efficiencies and attain periods of good performance. This recovery may be dependent on the remaining concentration of dust control agent and the availability of environmental conditions that are conducive to recovery. It is also relevant to remind the reader that efficiency is calculated on the performance of both the treated and control sections, and both are moving targets that are influenced by the service environment.
-100%
-50%
0%
50%
100%
0.00 0.10 0.20 0.30 0.40 0.50 0.60 0.70
Application rate, gsy
Dus
t Con
trol
Effi
cien
cy
Figure 16 Dust control efficiency vs. application rate (all sections).
25
-200%-100%
0%100%200%300%400%500%600%
0.00 0.10 0.20 0.30 0.40 0.50 0.60 0.70
Application rate, gsy
Moi
stur
e C
ontr
ol E
ffici
ency
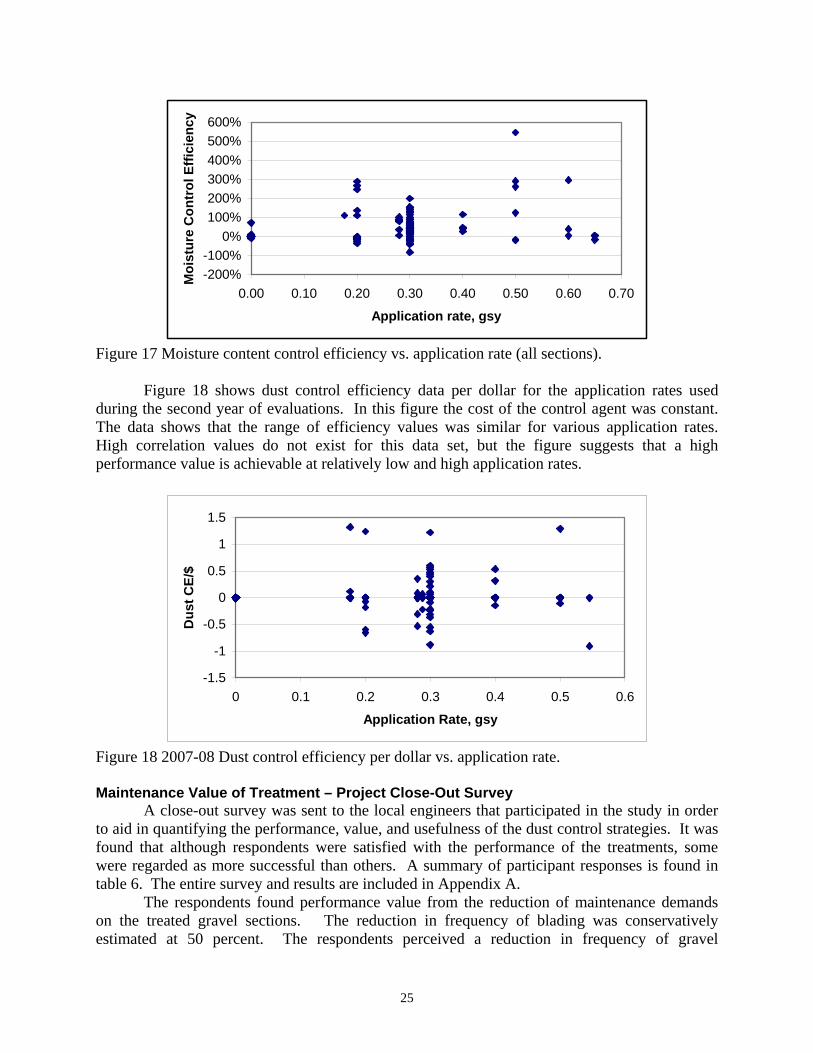
Figure 17 Moisture content control efficiency vs. application rate (all sections). Figure 18 shows dust control efficiency data per dollar for the application rates used during the second year of evaluations. In this figure the cost of the control agent was constant. The data shows that the range of efficiency values was similar for various application rates. High correlation values do not exist for this data set, but the figure suggests that a high performance value is achievable at relatively low and high application rates.
-1.5
-1
-0.5
0
0.5
1
1.5
0 0.1 0.2 0.3 0.4 0.5 0.6
Application Rate, gsy
Dus
t CE/
$
Figure 18 2007-08 Dust control efficiency per dollar vs. application rate.
Maintenance Value of Treatment – Project Close-Out Survey
A close-out survey was sent to the local engineers that participated in the study in order to aid in quantifying the performance, value, and usefulness of the dust control strategies. It was found that although respondents were satisfied with the performance of the treatments, some were regarded as more successful than others. A summary of participant responses is found in table 6. The entire survey and results are included in Appendix A.
The respondents found performance value from the reduction of maintenance demands on the treated gravel sections. The reduction in frequency of blading was conservatively estimated at 50 percent. The respondents perceived a reduction in frequency of gravel

26
replenishment, but were unable to fully quantify the level. A conservative estimate by one respondent was that dust control extends the replenishment interval by 50 percent.
Performance value may also be realized in the form of safety benefits due to treating surface aggregate at intersections and rail crossings. One participating county proposed using spot treatments at rail crossings near wooded areas to reduce the overall maintenance time that is required to reshape gravel-to-rail transitions. Table 6 Project Close-out Survey of Participating Engineers
Question Summary of Responses (% response)
1 Did the LRRB dust control treatments satisfactorily reduce dust?
Yes (100%)
2 Did the LRRB treatments perform better or worse than other treatments that were concurrently in service?
High rate better (25%) Standard rate equal (75%) MgCl2 = CaCl2 (50%) MgCl2 performed better than organic polymer w/binder (25%)
3 Were the treatments compatible or incompatible with your local surfacing aggregate compared to others you may have used?
Treatments compatible (100%)
4 Did each treatment affect the frequency of blading? By how much?
Yes (100%) Reduced frequency by 90% (25%) Reduced frequency by 50% (80%)
5 How did each treatment affect the surface gravel performance near intersections? Can you quantify the effect?
Reduced washboard (20%) Held gravel in place (40%) Depends on rate (20%) No difference (20%)
6 Did each treatment affect the frequency or quantity of gravel replenishment? By how much?
Yes, reduces (100%) Not enough data to quantify (75%) Extends interval by 50% (25%)

27
Chapter 7: Summary and Recommendations
During a two-year study that included field validations, a set of dust control agents were evaluated using a mobile air sampling technique. Treatments of calcium chloride, magnesium chloride, and organic polymer-plus-binder were evaluated using standard rates during the first year and at variable rates during the second year. The treatments were applied to a variety of subject roads that were located in northwest, east-central, and southwest parts of Minnesota. Traffic levels varied from average daily traffic (ADT) of 25 to 700.
Because of the variety of service conditions in the field test it was not practical to reproduce measurement conditions across the subject road set. The use of uniform measurement procedures helped increase precision, but did not remove the effect of collecting data under variable service conditions, including: application rates and methods, precipitation, wind conditions, and materials. The overall data trend showed that treatments reduced dust levels, but weak correlations were obtained between the study variables.
Measurements showed that aggregate surface moisture content was the best predictor of dust control efficiency, and dust levels decreased with increased moisture. Weak positive relationships were measured between dust control efficiency and: application rate, ADT, conductivity, and percent passing the #200 sieve. The weak positive relationships generally reinforce the concept that higher application rates may be more successful on materials that have greater amounts of material passing the #200 sieve. Standard specifications and information sources usually suggest that #200 levels should be above 10 percent. A negative relationship was measured between dust control efficiency and sand equivalency, showing that treatments on sandy gravel should be less effective.
The following summary is based on the data gathered from LRRB Investigation 842. Project Summary
Cost trends for 2006 – 2008 season: Haul distance was critical for some vendors. Costs were generally below $0.78 per gallon unless haul distance was
exceptional. Up to $0.94 per square yard for proprietary formula of organic polymer plus
binder. The material was not locally available. Variable rate treatments of chloride-based agents cost between $0.12 and $0.37
per square yard. Performance trends for 2006 – 2008 test sections:
Dust control treatments produced less measurable dust than did untreated control sections.
Dust control was related to moisture content. Efficiency was maximized when moisture was between three and four percent.
Treatments were visible for over two years, but that did not always translate to good control efficiency.
Performance was also influenced by the service environment. Traffic level, service time, and weather were linked to the quantity of control agent that remains in the gravel surface.

28
The benefits of having residual amounts of control agent were minimal with respect to chloride type products.
Good performance was attainable using application rates between 0.18 and 0.55 gallons per square yard.
Participating engineers found value in using dust control applications, commenting that frequency of maintenance operations was reduced by 50 percent.
Recommendations The objective of dust control treatment is to put control agents into the gravel in order to retain material on the road. Treatments should be used in situations where they are likely to be most beneficial. The following recommendations for best practices are based on the data and experience gathered from LRRB Investigation 842.
Dust control applications have the potential to improve visibility, air quality, and safety conditions on aggregate roads. Spot-treatment may be considered for problematic intersections and rail crossings.
Employ appropriate material specifications for the gravel road. The appropriate binder content (P200) for gravel road surfaces is higher than that for base materials. Consider improving the P200 quality prior to applying the control agent. Also consider potential benefits from blending a quantity of plastic P200 material with the surface aggregate.
Loosen the surface material with by blading prior to application of dust control treatments. This helps the gravel to incorporate the treatment.
Consult with vendors as to the material components of the control agent and obtain material safety data sheets for project records.
A hydrometer and pH meter are simple tools that can be used in the field to help answer material quality questions at the time of delivery.
Observe the treatment process. In some cases it may be useful to add a surfactant to the control agent to help incorporate the treatment into the gravel.
When in doubt, standard application rates are near 0.3 gallons per square yard for solutions at standard chloride concentrations.
Treated sections should receive blading and reshaping maintenance on an as-needed basis only. It was observed that winter plowing caused significant loss of treated surface aggregate.
Expected performance: although treatment performance can vary somewhat according to service conditions, the data shows that the performance of a treated system of roads should be better than that for corresponding untreated roads.
The maximum observed service life in this study was 200 days. Consider using 100 to 150 days to gauge successfulness of a single application.
Future Needs
There are many agencies in Minnesota that are responsible for maintaining aggregate roads. Specifications for aggregate surfacing material exist, as do local training courses for maintaining and designing aggregate roads. However, to the researchers’ knowledge, there are no local specifications for dust control materials or applications. It would be beneficial to reexamine the existing aggregate surfacing specifications with an eye toward developing dust control standard that could benefit all agencies.

29
Lastly, this study was limited to a small number of control agents. The number of agricultural and industrial byproducts that show potential as dust control agents continues to grow over time, as does the number of proprietary products that have received formulation upgrades. There is a need for future research on performance trends for these products.

30
References
1. K. Skorseth and A. A. Selim, Gravel Roads Maintenance and Design Manual. South Dakota Local Transportation Assistance Program, South Dakota State University, Brookings, SD (2000).
2. J. Q. Addo and T. G. Sanders, Effectiveness and Environmental Impact of Road Dust
Suppressants. MPC Rep. No. 92-28A, Mountain Plains Consortium, North Dakota State University, Fargo, ND (1993).
3. T. G. Sanders and J. Q. Addo, “Experimental Road Dust Measurement Device”. Journal
of Transportation Engineering (2000), Vol. 126, No. 6, pp 530 – 535.
4. K. Skorseth, “Keys to Successful Dust Control”. The Connection, South Dakota Local Transportation Assistance Program, South Dakota State University, Brookings, SD (2005), Vol. 18, No. 1.

Appendix A –
Survey of Participating Engineers

A-1
Survey Letter Hello, I am contacting you in regard to your participation in LRRB 843, Best Practices for Dust Control. First of all, thank you for your cooperation with the study. The study benefited greatly from the variety of materials, locations, and traffic levels that were made available. I hope that your agency has also benefited in some way. Secondly, since the project is nearly completed, I would like your evaluation of the treatments you are familiar with. Please try to answer the following six questions about dust control treatments. 1) Did the LRRB dust control treatments satisfactorily reduce dust? 2) Did the LRRB treatments perform better or worse than other treatments that were concurrently in service? 3) Were the treatments compatible or incompatible with your local surfacing aggregate compared to others you may have used? 4) Did each treatment affect the frequency of blading? By how much? 5) How did each treatment affect the surface gravel performance near intersections? Can you quantify the effect? 6) Did each treatment affect the frequency or quantity of gravel replenishment? By how much? Best regards, Ed Johnson Minnesota Department of Transportation Office of Materials - Mail Stop 645 1400 Gervais Avenue Maplewood, Minnesota 55109-2044 E-Mail: [email protected] Office: (651) 366-5465 Fax: (651) 366-5461

A-2
Individual Responses Question 1) Did the LRRB dust control treatments satisfactorily reduce dust? Yes (5/5) 1. First I would like to say thanks again for letting the city of North Branch benefit from this
test! The dust control was great on 410th St. Yes it did reduce the dust extremely well. 2. Yes, all treatments used in my County worked well. I did have an issue on our regular
contract for Calcium Chloride this year. We noticed a couple of areas did not get effective coverage. One spot was in front of my residence. I don't know if was the application or the fact that the roadway in front of my residence is sandy and short of binder.
3. yes, savings in reduced blading and graveling 4. yes 5. [yes] Our blade operator mentioned that he surely wished we'd have put it down at the gravel
/ Trunk Highway pavement interface. [He]said he probably put only half the blading on the treated section.
Question 2) Did the LRRB treatments perform better or worse than other treatments that were concurrently in service? High rate better, standard rate equal (3/3), Mag = Cal (2/2), Chloride better than organic polymer w/ binder (1/1). 1. The treatment on the west half of the road from Co. Rd. 30 to Guthrie Ave that was applied
at the rate of .3 gal/sqyd performed the same as previous treatments that we have done. The next test section from Guthrie Ave east to Hemingway where the application was doubled or increased performed much better than the previous treatments we do, I also think the timing helped it perform better as well since it was applied late fall, and we do ours the first week in June.
2. I typically use Calcium Chloride in the County, but Magnesium Chloride worked well also. I don't think I can say it worked better or worse.
3. X-hesion performed very poorly Mgcl performed the same as cacl 4. N/A as we don’t use anything for dust control Question 3) Were the treatments compatible or incompatible with your local surfacing aggregate compared to others you may have used? Treatments compatible (5/5) 1. The treatments worked very well with the surface aggregate that we use. The spec on the
gravel is a modified class 5 as specified in the MN/Dot construction manual under #3138 such that the 200 sieve is modified to 10-15%. We have found the higher % passing the 200 the better the chloride performs.
2. The treatments were compatible. Again, the Township road in front of my residence has screened gravel not meeting MnDOT's specification for gravel surfacing. I believe that the gravel surfacing used by the township in addition to a road made primarily out of sand, is not favorable for Chloride treatment.
3. no incompatibility was noticed with any of the products 4. The treatment worked fine with the our aggregate 5. [yes, the blade operator]often just lifted the blade and passed over [the treatment] since it
held so well and was stable

A-3
Question 4) Did each treatment affect the frequency of blading? By how much? Yes (4/4). Reduce ~90% (1/4), 50% (3/4) 1. Yes the treatment did affect the road grading frequency. It reduced it from two times per
week before the application was applied down to only grading it twice before freeze up that year.
2. Yes, blading was reduced from once every week and a half to 3 times a summer. 3. yes, less blading was required, lengthens the time between blading by at least 1/2 4. We bladed the treated areas half as often as the non treated areas Question 5) How did each treatment affect the surface gravel performance near intersections? Can you quantify the effect? Reduced washboard (1/5), held gravel in place (2/5), depends on rate (1/5), no difference (1/5). 1. The surface gravel performed extremely well near the intersections, however I did notice
where the application was nearly doubled it the intersections held together much better. 2. The treatment prevented washboarding in these areas. Eventually, washboards did occur,
and this is the cause for blading the 3 times a summer. 3. nothing was noticed 4. The treatment held the gravel inplace. 5. [Chloride treatment at rail and highway intersections] seems to have merit, more so from the
blading / transition touchup efficiency and safety than the "dust control". I'll bet a poll of the blade operators would tell you their gravel-to-pavement and gravel-to-rail intersections are more time and safety issue intensive than the majority of their other situations. We could use the Chloride as a treatment on both approaches to the rail, so an operator could frequently blow right on by instead of having to jockey so hard on the transition across the rail with every pass.
Question 6) Did each treatment affect the frequency or quantity of gravel replenishment? By how much? Yes, reduces (4/4). Not enough data to quantify (3/4), extends replenishment interval by 50% (1/4). 1. Yes we have found that the treatments do extend the time frame for re-graveling. For this
particular road having an ADT of 700 the time frame has been extended from re-graveling every two years to doing it every three years.
2. It does reduce the frequency of resurfacing, I am unable to say how much at this time. 3. yes, this is noticed over time on our other routes with dust control. This project was too
short in duration to notice the effect. 4. We didn’t have to place any gravel on the treated areas. I could see how treating aggregate
surfaced roads with chloride would reduce the amount of aggregate that would have to be placed.

Appendix B –
Project Data Tables

B-1
Table B1 Dust Measurements
Road Direction Test Section
Sand Equiv P#200
Length, mile
Treatment Date
Rate, gsy Test date
Dust, g/mile
Pen. 72 NS CaCl2 41 10.3 0.5 7/1/06 0.3 10/4/06 0.4 Pen. 72 NS CaCl2 41 10.3 0.5 7/1/06 0.3 10/4/06 0.5 Pen. 72 NS CaCl2 41 10.3 0.5 7/1/06 0.3 10/4/06 0.6 Pen. 72 NS CaCl2 68 4.5 0.5 7/1/06 0.3 10/4/06 0.7 Pen. 72 NS CaCl2 68 4.5 0.5 7/1/06 0.3 10/4/06 0.8 Pen. 72 NS CaCl2 68 4.5 0.5 7/1/06 0.3 10/4/06 0.9 Pen. 72 NS Control 78 3.5 1 9/18/06 0 10/4/06 1.6 Pen. 72 NS Control 78 3.5 1 9/18/06 0 10/4/06 2.2 Pen. 72 NS Control 62 6.1 0.5 9/18/06 0 10/4/06 2.3 Pen. 72 NS Control 62 6.1 0.5 9/18/06 0 10/4/06 2.5 Pen. 72 NS Control 62 6.1 0.5 9/18/06 0 10/4/06 2.6 Pen. 72 NS Control 78 3.5 1 9/18/06 0 10/4/06 3.2 Pen. 72 NS MgCl2 41 10.3 0.5 9/18/06 0.3 10/4/06 0.2 Pen. 72 NS MgCl2 41 10.3 0.5 9/18/06 0.3 10/4/06 0.3 Pen. 72 NS MgCl2 68 4.5 0.5 9/18/06 0.3 10/4/06 0.4 Pen. 72 NS MgCl2 68 4.5 0.5 9/18/06 0.3 10/4/06 0.4 Pen. 72 NS MgCl2 41 10.3 0.5 9/18/06 0.3 10/4/06 0.4 Pen. 72 NS MgCl2 68 4.5 0.5 9/18/06 0.3 10/4/06 0.7
LOW 103 EW Control 79 6.1 0.5 9/19/06 0 10/5/06 1.3 LOW 103 EW Control 79 6.1 0.5 9/19/06 0 10/5/06 1.7 LOW 103 EW Control 79 6.1 0.5 9/19/06 0 10/5/06 3.3 LOW 103 EW MgCl2 79 6.1 0.5 9/19/06 0.3 10/5/06 0.8 LOW 103 EW MgCl2 79 6.1 0.5 9/19/06 0.3 10/5/06 1.2 LOW 103 EW MgCl2 79 6.1 0.5 9/19/06 0.3 10/5/06 1.2 LOW 19 EW Control 91 3.1 1 9/19/06 0 10/5/06 1.9 LOW 19 NS Control 55 11.3 0.5 9/19/06 0 10/5/06 2.3 LOW 19 NS Control 55 11.3 0.5 9/19/06 0 10/5/06 3 LOW 19 NS Control 55 11.3 0.5 9/19/06 0 10/5/06 3.2 LOW 19 NS MgCl2 55 11.3 0.5 9/19/06 0.6 10/5/06 0.3 LOW 19 NS MgCl2 55 11.3 0.5 9/19/06 0.6 10/5/06 0.4 LOW 19 NS MgCl2 55 11.3 0.5 9/19/06 0.6 10/5/06 0.5 LOW 19 NS OPB 55 11.3 0.5 9/19/06 0.65 10/5/06 1.8 LOW 19 EW OPB 55 11.3 0.5 9/19/06 0.65 10/5/06 1.9 LOW 19 EW OPB 55 11.3 0.5 9/19/06 0.65 10/5/06 2.1 LOW 19 NS OPB 55 11.3 0.5 9/19/06 0.65 10/5/06 2.7 LOW 19 NS OPB 55 11.3 0.5 9/19/06 0.65 10/5/06 2.8 Pen. 72 NS MgCl2 68 4.5 0.5 9/18/06 0.3 11/1/06 0.7
Fblt. 103 NS Control 69 5.6 1 10/26/06 0 11/2/06 0.4 Fblt. 103 NS Control 69 5.6 1 10/26/06 0 11/2/06 0.5 Fblt. 103 NS Control 69 5.6 1 10/26/06 0 11/2/06 0.5 Fblt. 103 EW MgCl2 69 5.6 0.5 10/26/06 0.3 11/2/06 0.7 Fblt. 103 EW MgCl2 69 5.6 0.5 10/26/06 0.3 11/2/06 0.8 Fblt. 103 EW MgCl2 69 5.6 0.5 10/26/06 0.3 11/2/06 0.8 Fblt. Pit NS Control NP 7.6 0.4 10/26/06 0 11/2/06 1.3 Fblt. Pit NS Control NP 7.6 0.4 10/26/06 0 11/2/06 1.4

B-2
Road Cont. Direction
Test Section
Sand Equiv P#200
Length, mile
Treatment Date
Rate, gsy Test date
Dust, g/mile
Fblt. Pit NS Control NP 7.6 0.4 10/26/06 0 11/2/06 2.1 Fblt. Pit NS MgCl2 NP 7.6 0.6 10/26/06 0.28 11/2/06 0.3 Fblt. Pit NS MgCl2 NP 7.6 0.6 10/26/06 0.28 11/2/06 0.8 Fblt. Pit NS MgCl2 NP 7.6 0.6 10/26/06 0.28 11/2/06 1.1 Gdhue. 1 NS Control 79 5.2 0.25 10/23/06 0 11/8/06 3.3 Gdhue. 1 NS Control 79 5.2 0.25 10/23/06 0 11/8/06 3.5 Gdhue. 1 NS Control 79 5.2 0.25 10/23/06 0 11/8/06 3.8 Gdhue. 1 NS MgCl2 79 5.2 1 10/23/06 0.3 11/8/06 0 Gdhue. 1 NS MgCl2 79 5.2 1 10/23/06 0.3 11/8/06 0 Gdhue. 1 NS MgCl2 79 5.2 1 10/23/06 0.3 11/8/06 0 Gdhue. 1 NS MgCl2 79 5.2 1 10/23/06 0.6 11/8/06 0.3 Gdhue. 1 NS MgCl2 79 5.2 1 10/23/06 0.6 11/8/06 0.3 Gdhue. 1 NS MgCl2 79 5.2 1 10/23/06 0.6 11/8/06 0.4 Fblt. 103 NS Control 69 5.6 1 10/26/06 0 11/22/06 1.1 Fblt. 103 NS Control 69 5.6 1 10/26/06 0 11/22/06 1.5 Fblt. 103 NS Control 69 5.6 1 10/26/06 0 11/22/06 2.2 Fblt. 103 EW MgCl2 69 5.6 0.5 10/26/06 0.3 11/22/06 0.3 Fblt. 103 EW MgCl2 69 5.6 0.5 10/26/06 0.3 11/22/06 0.4 Fblt. 103 EW MgCl2 69 5.6 0.5 10/26/06 0.3 11/22/06 0.5 Fblt. Pit NS Control NP 7.6 0.4 10/26/06 0 11/22/06 1.5 Fblt. Pit NS Control NP 7.6 0.4 10/26/06 0 11/22/06 2.4 Fblt. Pit NS Control NP 7.6 0.4 10/26/06 0 11/22/06 3.1 Fblt. Pit NS MgCl2 NP 7.6 0.6 10/26/06 0.28 11/22/06 0.2 Fblt. Pit NS MgCl2 NP 7.6 0.6 10/26/06 0.28 11/22/06 0.2 Fblt. Pit NS MgCl2 NP 7.6 0.6 10/26/06 0.28 11/22/06 0.3 Fblt. 103 NS Control 69 5.6 1 10/26/06 0 3/20/07 0.7 Fblt. 103 NS Control 69 5.6 1 10/26/06 0 3/20/07 1.1 Fblt. 103 NS Control 69 5.6 1 10/26/06 0 3/20/07 1.3 Fblt. 103 EW MgCl2 69 5.6 0.5 10/26/06 0.3 3/20/07 1 Fblt. 103 EW MgCl2 69 5.6 0.5 10/26/06 0.3 3/20/07 1.3 Fblt. 103 EW MgCl2 69 5.6 0.5 10/26/06 0.3 3/20/07 1.4 Fblt. Pit NS Control NP 7.6 0.4 10/26/06 0 3/20/07 0.5 Fblt. Pit NS Control NP 7.6 0.4 10/26/06 0 3/20/07 0.5 Fblt. Pit NS Control NP 7.6 0.4 10/26/06 0 3/20/07 0.6 Fblt. Pit NS MgCl2 NP 7.6 0.6 10/26/06 0.28 3/20/07 0.5 Fblt. Pit NS MgCl2 NP 7.6 0.6 10/26/06 0.28 3/20/07 0.5 Fblt. Pit NS MgCl2 NP 7.6 0.6 10/26/06 0.28 3/20/07 0.8 Gdhue. 1 NS Control 79 5.2 0.25 10/23/06 0 4/17/07 0.6 Gdhue. 1 NS Control 79 5.2 0.25 10/23/06 0 4/17/07 0.6 Gdhue. 1 NS Control 79 5.2 0.25 10/23/06 0 4/17/07 0.7 Gdhue. 1 NS MgCl2 79 5.2 1 10/23/06 0.3 4/17/07 0.2 Gdhue. 1 NS MgCl2 79 5.2 1 10/23/06 0.3 4/17/07 0.2 Gdhue. 1 NS MgCl2 79 5.2 1 10/23/06 0.3 4/17/07 0.2 Gdhue. 1 NS MgCl2 79 5.2 1 10/23/06 0.6 4/17/07 0.2 Gdhue. 1 NS MgCl2 79 5.2 1 10/23/06 0.6 4/17/07 0.2 Gdhue. 1 NS MgCl2 79 5.2 1 10/23/06 0.6 4/17/07 0.2 LOW 103 EW Control 79 6.1 0.5 9/19/06 0 4/30/07 1.6 LOW 103 EW Control 79 6.1 0.5 9/19/06 0 4/30/07 1.7 LOW 103 EW Control 79 6.1 0.5 9/19/06 0 4/30/07 2.1

B-3
Road Cont. Direction
Test Section
Sand Equiv P#200
Length, mile
Treatment Date
Rate, gsy Test date
Dust, g/mile
LOW 103 EW MgCl2 79 6.1 0.5 9/19/06 0.3 4/30/07 0.5 LOW 103 EW MgCl2 79 6.1 0.5 9/19/06 0.3 4/30/07 0.8 LOW 103 EW MgCl2 79 6.1 0.5 9/19/06 0.3 4/30/07 0.8 LOW 19 EW Control 91 3.1 1 9/19/06 0 4/30/07 1.1 LOW 19 EW Control 91 3.1 1 9/19/06 0 4/30/07 1.6 LOW 19 NS Control 55 11.3 0.5 9/19/06 0 4/30/07 1.6 LOW 19 EW Control 91 3.1 1 9/19/06 0 4/30/07 1.8 LOW 19 NS Control 55 11.3 0.5 9/19/06 0 4/30/07 2.2 LOW 19 NS Control 55 11.3 0.5 9/19/06 0 4/30/07 2.8 LOW 19 NS MgCl2 55 11.3 0.5 9/19/06 0.6 4/30/07 0.6 LOW 19 NS MgCl2 55 11.3 0.5 9/19/06 0.6 4/30/07 0.9 LOW 19 NS MgCl2 55 11.3 0.5 9/19/06 0.6 4/30/07 1.6 LOW 19 EW OPB 55 11.3 0.5 9/19/06 0.65 4/30/07 1.4 LOW 19 EW OPB 55 11.3 0.5 9/19/06 0.65 4/30/07 1.5 LOW 19 NS OPB 55 11.3 0.5 9/19/06 0.65 4/30/07 1.7 LOW 19 EW OPB 55 11.3 0.5 9/19/06 0.65 4/30/07 2.2 LOW 19 NS OPB 55 11.3 0.5 9/19/06 0.65 4/30/07 2.5 LOW 19 NS OPB 55 11.3 0.5 9/19/06 0.65 4/30/07 3 Pen. 72 NS CaCl2 41 10.3 0.5 7/1/06 0.3 5/1/07 2.2 Pen. 72 NS CaCl2 41 10.3 0.5 7/1/06 0.3 5/1/07 2.5 Pen. 72 NS CaCl2 41 10.3 0.5 7/1/06 0.3 5/1/07 3 Pen. 72 NS CaCl2 68 4.5 0.5 7/1/06 0.3 5/1/07 3.8 Pen. 72 NS CaCl2 68 4.5 0.5 7/1/06 0.3 5/1/07 4.3 Pen. 72 NS CaCl2 68 4.5 0.5 7/1/06 0.3 5/1/07 5.8 Pen. 72 NS Control 78 3.5 0.5 9/18/06 0 5/1/07 1.7 Pen. 72 NS Control 78 3.5 0.5 9/18/06 0 5/1/07 2 Pen. 72 NS Control 78 3.5 0.5 9/18/06 0 5/1/07 2.9 Pen. 72 NS MgCl2 68 4.5 0.5 9/18/06 0.3 5/1/07 1.9 Pen. 72 NS MgCl2 41 10.3 0.5 9/18/06 0.3 5/1/07 2 Pen. 72 NS MgCl2 41 10.3 0.5 9/18/06 0.3 5/1/07 2.1 Pen. 72 NS MgCl2 41 10.3 0.5 9/18/06 0.3 5/1/07 2.5 Pen. 72 NS MgCl2 68 4.5 0.5 9/18/06 0.3 5/1/07 2.5 Pen. 72 NS MgCl2 68 4.5 0.5 9/18/06 0.3 5/1/07 2.6
RedLk 113 EW CaCl2 91 3.1 0.11 9/18/06 0 5/1/07 2.3 RedLk 113 EW Control 91 3.1 0.5 9/18/06 0 5/1/07 0.8 Fblt. Pit NS Control NP 7.6 0.4 10/26/06 0 10/4/07 1.3 Fblt. Pit NS Control NP 7.6 0.4 10/26/06 0 10/4/07 1.6 Fblt. Pit NS Control NP 7.6 0.4 10/26/06 0 10/4/07 1.7 Fblt. Pit NS MgCl2 NP 7.6 0.6 10/26/06 0.28 10/4/07 0.8 Fblt. Pit NS MgCl2 NP 7.6 0.6 10/26/06 0.28 10/4/07 1.3 Fblt. Pit NS MgCl2 NP 7.6 0.6 10/26/06 0.28 10/4/07 1.4 Fblt. 111 NS Control 81 5 0.5 10/4/07 0 10/29/07 1.6 Fblt. 111 NS Control 81 5 0.5 10/4/07 0 10/29/07 1.9 Fblt. 111 NS Control 81 5 0.5 10/4/07 0 10/29/07 2.4 Fblt. 111 NS MgCl2 81 5 0.5 10/4/07 0.3 10/29/07 0.3 Fblt. 111 NS MgCl2 81 5 0.5 10/4/07 0.3 10/29/07 0.3 Fblt. 111 NS MgCl2 81 5 0.5 10/4/07 0.3 10/29/07 0.4 Fblt. 117 NS Control 70 6.9 1 10/4/07 0.3 10/29/07 1.1 Fblt. 117 NS Control 70 6.9 1 10/4/07 0.3 10/29/07 1.2

B-4
Road Cont. Direction
Test Section
Sand Equiv P#200
Length, mile
Treatment Date
Rate, gsy Test date
Dust, g/mile
Fblt. 117 NS Control 70 6.9 1 10/4/07 0.3 10/29/07 1.2 Fblt. Pit NS MgCl2 NP 7.6 0.6 10/4/07 0.28 10/29/07 1 Fblt. Pit NS MgCl2 NP 7.6 0.6 10/4/07 0.28 10/29/07 1.1 Fblt. Pit NS MgCl2 NP 7.6 0.6 10/4/07 0.28 10/29/07 1.2
RedLk 14 EW Control 91 3.1 0.4 10/23/07 0 10/31/07 0.4 RedLk 14 EW Control 91 3.1 0.4 10/23/07 0 10/31/07 0.4 RedLk 14 EW Control 91 3.1 0.4 10/23/07 0 10/31/07 0.8 RedLk 14 EW MgCl2 91 3.1 0.5 10/23/07 0.3 10/31/07 0.5 RedLk 14 EW MgCl2 91 3.1 0.5 10/23/07 0.3 10/31/07 0.5 RedLk 14 EW MgCl2 91 3.1 0.5 10/23/07 0.3 10/31/07 0.7 LOW 4 NS Control 67 8.7 0.5 10/18/07 0 11/1/07 0.4 LOW 4 NS Control 67 8.7 1 10/18/07 0 11/1/07 0.7 LOW 4 NS Control 67 8.7 1 10/18/07 0 11/1/07 0.9 LOW 4 NS MgCl2 67 8.7 0.5 10/18/07 0.2 11/1/07 0.9 LOW 4 NS MgCl2 67 8.7 0.5 10/18/07 0.2 11/1/07 0.9 LOW 4 NS MgCl2 67 8.7 0.5 10/18/07 0.2 11/1/07 1.1 Pen. 72 NS Control 78 3.5 0.5 7/1/06 0 11/1/07 1 Pen. 72 NS Control 78 3.5 1 7/1/06 0 11/1/07 1 Pen. 72 NS Control 78 3.5 1 7/1/06 0 11/1/07 1.2 Pen. 72 NS MgCl2 68 10.3 0.5 10/23/07 0.2 11/1/07 0.1 Pen. 72 NS MgCl2 68 10.3 0.5 10/23/07 0.5 11/1/07 0.1 Pen. 72 NS MgCl2 68 10.3 0.5 10/23/07 0.5 11/1/07 0.1 Pen. 72 NS MgCl2 68 10.3 0.5 10/23/07 0.2 11/1/07 0.2 Pen. 72 NS MgCl2 68 10.3 0.5 10/23/07 0.5 11/1/07 0.2 Pen. 72 NS MgCl2 68 10.3 0.5 10/23/07 0.2 11/1/07 0.2 Pen. 72 NS MgCl2 41 10.3 0.5 9/18/06 0.3 11/1/07 1.3 Pen. 72 NS MgCl2 41 10.3 0.5 9/18/06 0.3 11/1/07 1.5 Pen. 72 NS MgCl2 41 10.3 0.5 9/18/06 0.3 11/1/07 1.6
LOW 103 EW Control 79 6.1 0.5 10/18/07 0 11/2/07 0.6 LOW 103 EW Control 79 6.1 0.5 10/18/07 0 11/2/07 0.8 LOW 103 EW Control 79 6.1 0.5 10/18/07 0 11/2/07 0.8 LOW 103 EW MgCl2 79 6.1 0.5 10/18/07 0.3 11/2/07 0.1 LOW 103 NS MgCl2 79 6.1 1 10/18/07 0.3 11/2/07 0.4 LOW 103 NS MgCl2 79 6.1 1 10/18/07 0.3 11/2/07 0.6 LOW 103 NS MgCl2 79 6.1 1 10/18/07 0.3 11/2/07 0.6 LOW 103 EW MgCl2 79 6.1 0.5 10/18/07 0.3 11/2/07 0.9 LOW 103 EW MgCl2 79 6.1 0.5 10/18/07 0.3 11/2/07 1.1 Fblt. 103 NS Control 69 5.6 1 10/26/06 0 11/9/07 0.5 Fblt. 103 NS Control 69 5.6 1 10/26/06 0 11/9/07 0.7 Fblt. 103 NS Control 69 5.6 1 10/26/06 0 11/9/07 0.8 Fblt. 103 NS MgCl2 69 6.8 0.5 10/4/07 0.3 11/9/07 0.4 Fblt. 103 NS MgCl2 69 6.8 0.5 10/4/07 0.3 11/9/07 0.5 Fblt. 103 NS MgCl2 69 6.8 0.5 10/4/07 0.3 11/9/07 0.5 Fblt. 103 NS MgCl2 69 6.8 0.5 10/4/07 0.4 11/9/07 0.5 Fblt. 103 EW MgCl2 69 5.6 0.5 10/26/06 0.3 11/9/07 0.8 Fblt. 103 EW MgCl2 69 5.6 0.5 10/26/06 0.3 11/9/07 0.8 Fblt. 103 NS MgCl2 69 6.8 0.5 10/4/07 0.4 11/9/07 0.8 Fblt. 103 EW MgCl2 69 5.6 0.5 10/26/06 0.3 11/9/07 0.9 Fblt. 103 NS MgCl2 69 6.8 0.5 10/4/07 0.4 11/9/07 0.9

B-5
Road Cont. Direction
Test Section
Sand Equiv P#200
Length, mile
Treatment Date
Rate, gsy Test date
Dust, g/mile
NBr 410 EW MgCl2 78 4 0.5 11/28/07 0.18 11/29/07 0.4 NBr 410 EW MgCl2 78 4 0.5 11/28/07 0.18 11/29/07 0.5 NBr 410 EW MgCl2 78 4 0.5 11/28/07 0.18 11/29/07 0.7 NBr Hem. NS Control 78 4 0.5 11/28/07 0 11/29/07 4.7 NBr Hem. NS Control 78 4 0.5 11/28/07 0 11/29/07 4.8 NBr Hem. NS Control 78 4 0.5 11/28/07 0 11/29/07 6.2 NBr 410 EW MgCl2 78 4 0.5 11/28/07 0.18 4/18/08 2.1 NBr 410 EW MgCl2 78 4 0.5 11/28/07 0.18 4/18/08 2.4 NBr 410 EW MgCl2 78 4 0.5 11/28/07 0.18 4/18/08 2.5 NBr 410 EW MgCl2 78 4 0.5 11/28/07 0.55 4/18/08 3.7 NBr 410 EW MgCl2 78 4 0.5 11/28/07 0.55 4/18/08 4.1 NBr 410 EW MgCl2 78 4 0.5 11/28/07 0.55 4/18/08 4.5 NBr Hem. NS Control 78 4 0.5 11/28/07 0 4/18/08 2 NBr Hem. NS Control 78 4 0.5 11/28/07 0 4/18/08 2.3 NBr Hem. NS Control 78 4 0.5 11/28/07 0 4/18/08 3.3 Wyo. KRB NS Control 88 1.4 0.5 11/28/07 0 4/18/08 2 Wyo. KRB NS Control 88 1.4 0.5 11/28/07 0 4/18/08 2.2 Wyo. KRB NS Control 88 1.4 0.5 11/28/07 0 4/18/08 2.8 Wyo. KRB NS MgCl2 88 1.4 0.5 11/28/07 0.29 4/18/08 1.7 Wyo. KRB NS MgCl2 88 1.4 0.5 11/28/07 0.29 4/18/08 2 Wyo. KRB NS MgCl2 88 1.4 0.5 11/28/07 0.29 4/18/08 3 Fblt. 103 NS Control 69 5.6 1 10/26/06 0 4/23/08 0.4 Fblt. 103 NS Control 69 5.6 1 10/26/06 0 4/23/08 0.4 Fblt. 103 NS Control 69 5.6 1 10/26/06 0 4/23/08 0.6 Fblt. 103 NS MgCl2 69 6.8 0.5 10/4/07 0.4 4/23/08 0.3 Fblt. 103 EW MgCl2 69 5.6 0.5 10/26/06 0.3 4/23/08 0.4 Fblt. 103 NS MgCl2 69 6.8 0.5 10/4/07 0.4 4/23/08 0.4 Fblt. 103 NS MgCl2 69 6.8 0.5 10/4/07 0.4 4/23/08 0.4 Fblt. 103 EW MgCl2 69 5.6 0.5 10/26/06 0.3 4/23/08 0.6 Fblt. 103 NS MgCl2 69 6.8 0.5 10/4/07 0.3 4/23/08 0.6 Fblt. 103 EW MgCl2 69 5.6 0.5 10/26/06 0.3 4/23/08 0.7 Fblt. 103 NS MgCl2 69 6.8 0.5 10/4/07 0.3 4/23/08 0.7 Fblt. 103 NS MgCl2 69 6.8 0.5 10/4/07 0.3 4/23/08 0.7 Fblt. 111 NS Control 81 5 0.5 10/4/07 0 4/23/08 0.9 Fblt. 111 NS Control 81 5 0.5 10/4/07 0 4/23/08 1.2 Fblt. 111 NS Control 81 5 0.5 10/4/07 0 4/23/08 1.4 Fblt. 111 NS MgCl2 81 5 0.5 10/4/07 0.3 4/23/08 1.8 Fblt. 111 NS MgCl2 81 5 0.5 10/4/07 0.3 4/23/08 1.9 Fblt. 111 NS MgCl2 81 5 0.5 10/4/07 0.3 4/23/08 1.9 Fblt. Pit NS Control NP 7.6 0.5 10/4/07 0 4/23/08 0.7 Fblt. Pit NS Control NP 7.6 0.5 10/4/07 0 4/23/08 0.8 Fblt. Pit NS Control NP 7.6 0.5 10/4/07 0 4/23/08 0.9 Fblt. Pit NS MgCl2 NP 7.6 0.5 10/4/07 0.28 4/23/08 0.7 Fblt. Pit NS MgCl2 NP 7.6 0.5 10/4/07 0.28 4/23/08 1 Fblt. Pit NS MgCl2 NP 7.6 0.5 10/4/07 0.28 4/23/08 1.2 Fblt. 103 NS Control 69 5.6 0.5 10/26/06 0 5/21/08 1.3 Fblt. 103 EW MgCl2 69 5.6 0.5 10/26/06 0.3 5/21/08 1.2 Fblt. 103 EW MgCl2 69 5.6 0.5 10/26/06 0.3 5/21/08 1.2 Fblt. 103 EW MgCl2 69 5.6 0.5 10/26/06 0.3 5/21/08 1.5

B-6
Road Cont. Direction
Test Section
Sand Equiv P#200
Length, mile
Treatment Date
Rate, gsy Test date
Dust, g/mile
Fblt. 111 NS Control 81 5 0.5 10/4/07 0 5/21/08 2.9 Fblt. 111 NS Control 81 5 0.5 10/4/07 0 5/21/08 3.2 Fblt. 111 NS Control 81 5 0.5 10/4/07 0 5/21/08 3.6 Fblt. 111 NS MgCl2 81 5 0.5 10/4/07 0.3 5/21/08 3.4 Fblt. 111 NS MgCl2 81 5 0.5 10/4/07 0.3 5/21/08 3.8 Fblt. 111 NS MgCl2 81 5 0.5 10/4/07 0.3 5/21/08 4.1 Fblt. Pit NS Control NP 7.6 0.5 10/4/07 0 5/21/08 2.4 Fblt. Pit NS Control NP 7.6 0.5 10/4/07 0 5/21/08 3 Fblt. Pit NS Control NP 7.6 0.5 10/4/07 0 5/21/08 3.1 Fblt. Pit NS MgCl2 NP 7.6 0.5 10/4/07 0.28 5/21/08 3.5 Fblt. Pit NS MgCl2 NP 7.6 0.5 10/4/07 0.28 5/21/08 3.9 Fblt. Pit NS MgCl2 NP 7.6 0.5 10/4/07 0.28 5/21/08 4.2 Fblt. 103 NS Control 69 5.6 0.5 10/26/06 0 5/23/08 0.3 Fblt. 103 NS Control 69 5.6 0.5 10/26/06 0 5/23/08 0.4 Fblt. 103 NS MgCl2 69 6.8 0.5 10/4/07 0.4 5/23/08 0.2 Fblt. 103 NS MgCl2 69 6.8 0.5 10/4/07 0.3 5/23/08 0.2 Fblt. 103 NS MgCl2 69 6.8 0.5 10/4/07 0.3 5/23/08 0.2 Fblt. 103 NS MgCl2 69 6.8 0.5 10/4/07 0.4 5/23/08 0.2 Fblt. 103 NS MgCl2 69 6.8 0.5 10/4/07 0.3 5/23/08 0.3 Fblt. 103 NS MgCl2 69 6.8 0.5 10/4/07 0.4 5/23/08 0.3 LOW 4 NS Control 67 8.7 0.5 10/18/07 0 6/17/08 0.9 LOW 4 NS Control 67 8.7 1 10/18/07 0 6/17/08 1.1 LOW 4 NS Control 67 8.7 1 10/18/07 0 6/17/08 1.2 LOW 4 NS MgCl2 67 8.7 0.5 10/18/07 0.2 6/17/08 1.1 LOW 4 NS MgCl2 67 8.7 0.5 10/18/07 0.2 6/17/08 1.2 LOW 4 NS MgCl2 67 8.7 0.5 10/18/07 0.2 6/17/08 1.3 LOW 4 NS MgCl2 67 8.7 0.5 10/18/07 0.2 6/17/08 1.5 LOW 4 NS MgCl2 67 8.7 0.5 10/18/07 0.2 6/17/08 1.5 LOW 4 NS MgCl2 67 8.7 0.5 10/18/07 0.2 6/17/08 1.5 Pen. 72 NS Control 78 3.5 0.5 7/1/06 0 6/17/08 1.2 Pen. 72 NS Control 78 3.5 1 7/1/06 0 6/17/08 1.3 Pen. 72 NS Control 78 3.5 0.5 7/1/06 0.3 6/17/08 2.1 Pen. 72 NS Control 78 3.5 1 7/1/06 0 6/17/08 3 Pen. 72 NS MgCl2 41 10.3 0.5 9/18/06 0.3 6/17/08 1.5 Pen. 72 NS MgCl2 41 10.3 0.5 9/18/06 0.3 6/17/08 1.6 Pen. 72 NS MgCl2 41 10.3 0.5 9/18/06 0.3 6/17/08 1.6 Pen. 72 NS MgCl2 68 10.3 0.5 10/23/07 0.5 6/17/08 1.9 Pen. 72 NS MgCl2 68 10.3 0.5 10/23/07 0.2 6/17/08 1.9 Pen. 72 NS MgCl2 68 10.3 0.5 10/23/07 0.2 6/17/08 1.9 Pen. 72 NS MgCl2 68 10.3 0.5 10/23/07 0.5 6/17/08 2 Pen. 72 NS MgCl2 68 10.3 0.5 10/23/07 0.5 6/17/08 2 Pen. 72 NS MgCl2 68 10.3 0.5 10/23/07 0.2 6/17/08 2
RedLk 14 EW Control 91 3.1 0.4 10/23/07 0 6/17/08 1.4 RedLk 14 EW Control 91 3.1 0.4 10/23/07 0 6/17/08 2 RedLk 14 EW Control 91 3.1 0.4 10/23/07 0 6/17/08 2.3 RedLk 14 EW MgCl2 91 3.1 0.5 10/23/07 0.3 6/17/08 1.3 RedLk 14 EW MgCl2 91 3.1 0.5 10/23/07 0.3 6/17/08 1.7 RedLk 14 EW MgCl2 91 3.1 0.5 10/23/07 0.3 6/17/08 2.3 LOW 103 EW Control 79 6.1 0.5 10/18/07 0 6/18/08 1.3

B-7
Road Cont. Direction
Test Section
Sand Equiv P#200
Length, mile
Treatment Date
Rate, gsy Test date
Dust, g/mile
LOW 103 EW Control 79 6.1 0.5 10/18/07 0 6/18/08 1.3 LOW 103 EW Control 79 6.1 0.5 10/18/07 0 6/18/08 1.5 LOW 103 NS MgCl2 79 6.1 1 10/18/07 0.3 6/18/08 0.7 LOW 103 NS MgCl2 79 6.1 1 10/18/07 0.3 6/18/08 0.7 LOW 103 EW MgCl2 79 6.1 0.5 10/18/07 0.3 6/18/08 0.9 LOW 103 EW MgCl2 79 6.1 0.5 10/18/07 0.3 6/18/08 0.9 LOW 103 EW MgCl2 79 6.1 0.5 10/18/07 0.3 6/18/08 1 LOW 103 NS MgCl2 79 6.1 1 10/18/07 0.3 6/18/08 1.1 NBr 410 NS MgCl2 78 4 1 5/28/08 0.3 6/19/08 2.1 NBr 410 NS MgCl2 78 4 1 5/28/08 0.3 6/19/08 2.6 NBr 410 NS MgCl2 78 4 1 5/28/08 0.3 6/19/08 3.5 NBr Hem. EW Control 78 4 1 5/28/08 0 6/19/08 3 NBr Hem. EW Control 78 4 1 5/28/08 0 6/19/08 3.6 NBr Hem. EW Control 78 4 1 5/28/08 0 6/19/08 3.7 Wyo. KRB NS Control 88 1.4 0.5 11/28/07 0 6/19/08 1.8 Wyo. KRB NS Control 88 1.4 0.5 11/28/07 0 6/19/08 2 Wyo. KRB NS Control 88 1.4 0.5 11/28/07 0 6/19/08 2.1 Wyo. KRB NS MgCl2 88 1.4 0.5 11/28/07 0.29 6/19/08 2.1 Wyo. KRB NS MgCl2 88 1.4 0.5 11/28/07 0.29 6/19/08 2.2 Wyo. KRB NS MgCl2 88 1.4 0.5 11/28/07 0.29 6/19/08 2.5 Fblt. 103 NS Control 69 5.6 0.5 10/26/06 0 5/23/08 0.4

B-8
Table B2 Moisture Content
Road Date
Sampled Treatment
date Sample # MC Treatment
Rate Pen 72 9/19/2006 9/19/2006 Control 3.3% 0.00 Pen 72 9/19/2006 9/19/2006 0.3gsy MgCl2 5.0% 0.30 Pen 72 10/4/2006 7/6/2006 CaCl2 2.3% 0.30 Pen 72 10/4/2006 7/6/2006 CaCl2 2.2% 0.30 Pen 72 10/4/2006 9/19/2006 Control 1.1% 0.00 Pen 72 10/4/2006 9/19/2006 0.3gsy MgCl2 2.6% 0.30 Pen 72 10/4/2006 9/19/2006 0.3gsy MgCl2 2.7% 0.30
LOW 103 10/5/2006 9/20/2006 Control 1.8% 0.00 LOW 103 10/5/2006 9/20/2006 0.3gsy MgCl2 2.4% 0.30 LOW 19 10/5/2006 9/20/2006 Control 1.2% 0.00 LOW 19 10/5/2006 9/20/2006 Control 1.8% 0.00 LOW 19 10/5/2006 9/20/2006 0.3gsy MgCl2 2.5% 0.60 LOW 19 10/5/2006 9/20/2006 OPB 1.3% 0.65 LOW 19 10/5/2006 9/20/2006 OPB 1.9% 0.65 Fblt. 103 11/2/2006 10/26/2006 Control 1.8% 0.00 Fblt. 103 11/2/2006 10/26/2006 0.3gsy MgCl2 2.6% 0.30 Fblt. Pit 11/2/2006 10/26/2006 Control 2.2% 0.00 Fblt. Pit 11/2/2006 10/26/2006 0.3gsy MgCl2 4.5% 0.28 Fblt. Pit 11/2/2006 10/26/2006 0.3gsy MgCl2 3.0% 0.28 Fblt. Pit 11/2/2006 10/26/2006 0.3gsy MgCl2 4.0% 0.28 Goodhue 11/8/2006 10/23/2006 CaCl2 3.4% 0.60 Goodhue 11/8/2006 10/23/2006 CaCl2 2.6% 0.30 Goodhue 11/8/2006 10/23/2006 Control 0.9% 0.00 Fblt. 103 11/22/2006 10/26/2006 Control 3.5% 0.00 Fblt. 103 11/22/2006 10/26/2006 0.3gsy MgCl2 2.6% 0.30 Fblt. Pit 11/22/2006 10/26/2006 Control 2.5% 0.00 Fblt. Pit 11/22/2006 10/26/2006 0.3gsy MgCl2 4.6% 0.28
Fblt. PitRoad 10/4/2007 10/26/2006 Control 3.5% 0 Fblt. PitRoad 10/4/2007 10/26/2006 0.3gsy MgCl2 3.6% 0.28
Fblt. 111 10/29/2007 10/4/2007 Control 2.2% 0 Fblt. 111 10/29/2007 10/4/2007 0.3gsy MgCl2 2.5% 0.3 Fblt. 117 10/29/2007 10/4/2007 Control 2.4% 0.3
Fblt. PitRoad 10/29/2007 10/4/2007 0.3gsy MgCl2 4.6% 0.28 Red Lake 14 10/31/2007 10/23/2007 Control 2.4% 0 Red Lake 14 10/31/2007 10/23/2007 0.3gsy MgCl2 3.4% 0.3
LOW 4 11/1/2007 10/18/2007 Control 3.9% 0 LOW 4 11/1/2007 10/18/2007 0.3gsy MgCl2 3.2% 0.2 Pen 72 11/1/2007 7/1/2006 Control 1.8% 0 Pen 72 11/1/2007 10/23/2007 0.3gsy MgCl2 4.2% 0.2 Pen 72 11/1/2007 9/18/2006 0.3gsy MgCl2 3.4% 0.3 Pen 72 11/1/2007 10/23/2007 0.3gsy MgCl2 3.9% 0.5
LOW 103 11/2/2007 10/18/2007 Control 3.3% 0 LOW 103 11/2/2007 10/18/2007 0.3gsy MgCl2 3.2% 0.3 LOW 103 11/2/2007 10/18/2007 0.3gsy MgCl2 3.9% 0.3 Fblt. 103 11/9/2007 10/26/2006 Control 1.1% 0 Fblt. 103 11/9/2007 10/26/2006 0.3gsy MgCl2 1.4% 0.3
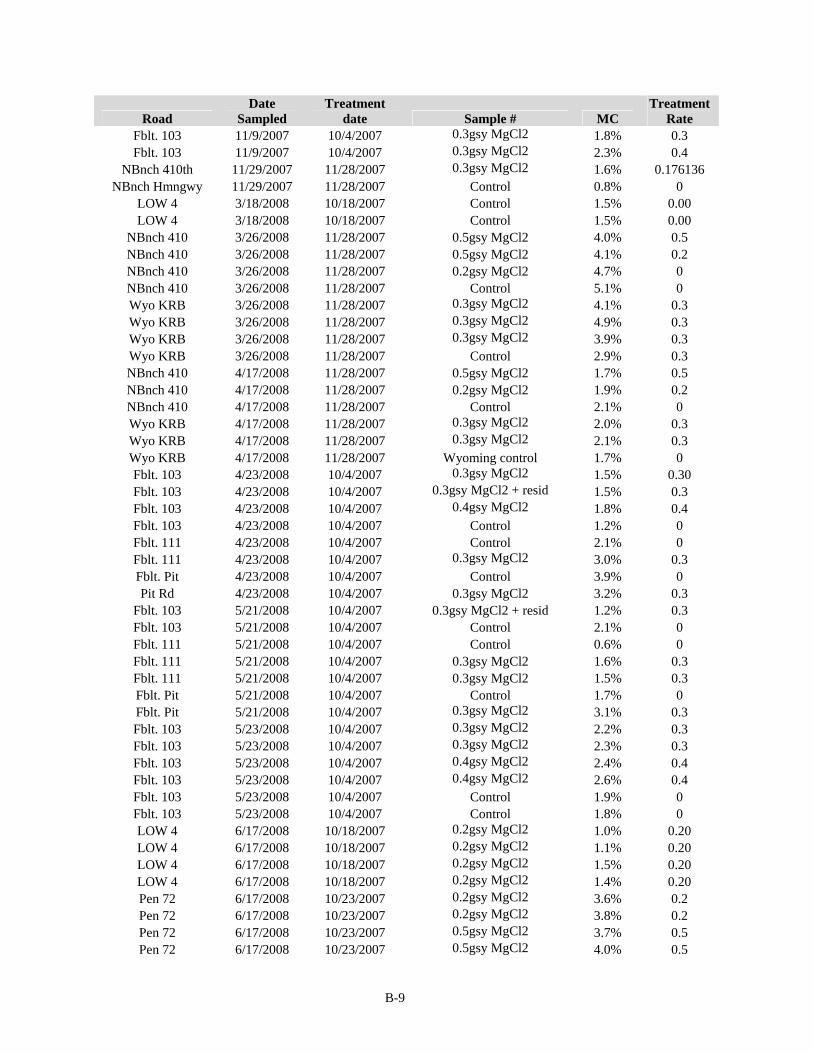
B-9
Road Date
Sampled Treatment
date Sample # MC Treatment
Rate Fblt. 103 11/9/2007 10/4/2007 0.3gsy MgCl2 1.8% 0.3 Fblt. 103 11/9/2007 10/4/2007 0.3gsy MgCl2 2.3% 0.4
NBnch 410th 11/29/2007 11/28/2007 0.3gsy MgCl2 1.6% 0.176136 NBnch Hmngwy 11/29/2007 11/28/2007 Control 0.8% 0
LOW 4 3/18/2008 10/18/2007 Control 1.5% 0.00 LOW 4 3/18/2008 10/18/2007 Control 1.5% 0.00
NBnch 410 3/26/2008 11/28/2007 0.5gsy MgCl2 4.0% 0.5 NBnch 410 3/26/2008 11/28/2007 0.5gsy MgCl2 4.1% 0.2 NBnch 410 3/26/2008 11/28/2007 0.2gsy MgCl2 4.7% 0 NBnch 410 3/26/2008 11/28/2007 Control 5.1% 0 Wyo KRB 3/26/2008 11/28/2007 0.3gsy MgCl2 4.1% 0.3 Wyo KRB 3/26/2008 11/28/2007 0.3gsy MgCl2 4.9% 0.3 Wyo KRB 3/26/2008 11/28/2007 0.3gsy MgCl2 3.9% 0.3 Wyo KRB 3/26/2008 11/28/2007 Control 2.9% 0.3 NBnch 410 4/17/2008 11/28/2007 0.5gsy MgCl2 1.7% 0.5 NBnch 410 4/17/2008 11/28/2007 0.2gsy MgCl2 1.9% 0.2 NBnch 410 4/17/2008 11/28/2007 Control 2.1% 0 Wyo KRB 4/17/2008 11/28/2007 0.3gsy MgCl2 2.0% 0.3 Wyo KRB 4/17/2008 11/28/2007 0.3gsy MgCl2 2.1% 0.3 Wyo KRB 4/17/2008 11/28/2007 Wyoming control 1.7% 0 Fblt. 103 4/23/2008 10/4/2007 0.3gsy MgCl2 1.5% 0.30 Fblt. 103 4/23/2008 10/4/2007 0.3gsy MgCl2 + resid 1.5% 0.3 Fblt. 103 4/23/2008 10/4/2007 0.4gsy MgCl2 1.8% 0.4 Fblt. 103 4/23/2008 10/4/2007 Control 1.2% 0 Fblt. 111 4/23/2008 10/4/2007 Control 2.1% 0 Fblt. 111 4/23/2008 10/4/2007 0.3gsy MgCl2 3.0% 0.3 Fblt. Pit 4/23/2008 10/4/2007 Control 3.9% 0 Pit Rd 4/23/2008 10/4/2007 0.3gsy MgCl2 3.2% 0.3
Fblt. 103 5/21/2008 10/4/2007 0.3gsy MgCl2 + resid 1.2% 0.3 Fblt. 103 5/21/2008 10/4/2007 Control 2.1% 0 Fblt. 111 5/21/2008 10/4/2007 Control 0.6% 0 Fblt. 111 5/21/2008 10/4/2007 0.3gsy MgCl2 1.6% 0.3 Fblt. 111 5/21/2008 10/4/2007 0.3gsy MgCl2 1.5% 0.3 Fblt. Pit 5/21/2008 10/4/2007 Control 1.7% 0 Fblt. Pit 5/21/2008 10/4/2007 0.3gsy MgCl2 3.1% 0.3 Fblt. 103 5/23/2008 10/4/2007 0.3gsy MgCl2 2.2% 0.3 Fblt. 103 5/23/2008 10/4/2007 0.3gsy MgCl2 2.3% 0.3 Fblt. 103 5/23/2008 10/4/2007 0.4gsy MgCl2 2.4% 0.4 Fblt. 103 5/23/2008 10/4/2007 0.4gsy MgCl2 2.6% 0.4 Fblt. 103 5/23/2008 10/4/2007 Control 1.9% 0 Fblt. 103 5/23/2008 10/4/2007 Control 1.8% 0 LOW 4 6/17/2008 10/18/2007 0.2gsy MgCl2 1.0% 0.20 LOW 4 6/17/2008 10/18/2007 0.2gsy MgCl2 1.1% 0.20 LOW 4 6/17/2008 10/18/2007 0.2gsy MgCl2 1.5% 0.20 LOW 4 6/17/2008 10/18/2007 0.2gsy MgCl2 1.4% 0.20 Pen 72 6/17/2008 10/23/2007 0.2gsy MgCl2 3.6% 0.2 Pen 72 6/17/2008 10/23/2007 0.2gsy MgCl2 3.8% 0.2 Pen 72 6/17/2008 10/23/2007 0.5gsy MgCl2 3.7% 0.5 Pen 72 6/17/2008 10/23/2007 0.5gsy MgCl2 4.0% 0.5

B-10
Road Date
Sampled Treatment
date Sample # MC Treatment
Rate Pen 72 6/17/2008 9/18/2006 2006 MgCl2 1.5% 0.30 Pen 72 6/17/2008 7/6/2006 CaCl2 + resid 1.6% 0.30 Pen 72 6/17/2008 10/23/2007 Control 1.0% 0.00 Pen 72 6/17/2008 10/23/2007 Control 1.1% 0.00
RdLk 14 6/17/2008 10/23/2007 Control 1.8% 0 RdLk 14 6/17/2008 10/23/2007 Control 1.9% 0 RdLk 14 6/17/2008 10/23/2007 MgCl2 2.9% 0.30
LOW 103 6/18/2008 10/18/2007 0.3 gsyMgCl2+R 2.9% 0.30 LOW 103 6/18/2008 10/18/2007 0.3gsy MgCl2 2.3% 0.30 LOW 103 6/18/2008 10/18/2007 Control 2.0% 0 LOW 103 6/18/2008 10/18/2007 Control 2.1% 0
NBnch 410 6/19/2008 6/1/2008 Control 1.0% 0.00 NBnch 410 6/19/2008 6/1/2008 Control 0.9% 0.00 NBnch 410 6/19/2008 6/1/2008 0.3gsy MgCl2 2.5% 0.30 Wyo KRB 6/19/2008 11/28/2007 Control 0.9% 0.00 Wyo KRB 6/19/2008 11/28/2007 Control 1.0% 0.00 Wyo KRB 6/19/2008 11/28/2007 0.3gsy MgCl2 1.9% 0.3 Wyo KRB 6/19/2008 11/28/2007 0.3gsy MgCl2 2.2% 0.30

Appendix C –
Communication with Residents and Incidental Observations
C-1
During the course of evaluations the staff was required to work with the test equipment located outside of the test vehicle. During these times it was possible to interact with local residents, who would occasionally stop to learn about the project or provide opinions about treatment performance. The following text summarizes the experience with local residents.
Faribault County Several truck drivers were interested in the dust control application located near a gravel
pit. Comments were generally positive. Several comments were received from travelers and residents along CR 103. CR 103
residents expressed appreciation for dust reduction. One unfavorable comment was received about the 2007 chloride treatment on CR 111,
which became soggy and showed poor performance in the spring of 2008. Researcher observation: The county highway department later commented that heavy
farm equipment frequently traveled on the road in 2008. Overloading may have contributed to the poor performance.
Goodhue County The sections were only evaluated a few times, and no comments were received from local
motorists. Lake Of The Woods County Several residents and other motorists stopped to ask about the work. Several comments
were received about the CR 4 treatments, all positive. One resident regretted being located outside of the treatment area, and was interested in obtaining dust control.
Lake Of The Woods CR 103 and CSAH 19 traffic stopped frequently, and the researcher displayed control and treatment samples for comparison. Several motorists from outside the treatment area expressed interest in having treatments applied by their homes.
Metro Area Several high-traffic roads were evaluated in 2007-2008. Residents on Kettle River
Boulevard thought the treatment was initially good, but did not retain effectiveness. During the winter of 2007-08 the project staff observed that winter plowing had removed a large quantity of treated surface material along the Kettle River Boulevard test section.
Researcher observation: The two metro sections received heavy snow plowing, and large quantities of aggregates were found in fresh snow in the ditches.
Pennington County Approximately five residents on CR 72 stopped to express interest in the treatments,
comment favorably, and ask questions about product safety. One resident felt the section from 0.5 - 1.0 miles north of TH 1 became too soggy after treatment. Another resident thought the entire three miles north of TH 1 could use treatment.
Red Lake County One resident commented favorably about the dust reduction over a 0.5-mile treatment on
CR 14.