best practice catalogue for hydropower
DESCRIPTION
For electrical engineeringTRANSCRIPT
Best Practice Catalog
Revision 1.0, 1/20/2012

HAP – Best Practice Catalog
Rev. 1.0, 1/20/2012 2
Prepared by
MESA ASSOCIATES, INC.
Chattanooga, TN 37402
Hydro Performance Processes Inc.
Doylestown, PA 18901-2963
and
OAK RIDGE NATIONAL LABORATORY
Oak Ridge, TN 37831-6283
managed by
UT-BATTELLE, LLC
for the
U. S. DEPARTMENT OF ENERGY
under contract DE-AC05-00OR22725

HAP – Best Practice Catalog
Rev. 1.0, 1/20/2012 3
Table of Contents
Trash Racks and Intakes ................................................................................................................................ 4
Penstocks and Tunnels ................................................................................................................................ 19
Flumes and Open Channels ........................................................................................................................ 39
Leakage and Releases ................................................................................................................................. 68
Francis Turbine ............................................................................................................................................ 78
Kaplan/Propeller Turbine .......................................................................................................................... 101
Pelton Turbine........................................................................................................................................... 126
Lubrication System .................................................................................................................................... 146
Governor ................................................................................................................................................... 165
Shut-Off Valves ......................................................................................................................................... 185
Raw Water System .................................................................................................................................... 197
Generator .................................................................................................................................................. 215
Main Power Transformer .......................................................................................................................... 240
Excitation System ...................................................................................................................................... 257
Instruments and Controls for Automation ............................................................................................... 272
Machine Condition Monitoring ................................................................................................................. 300
Francis Turbine Aeration ........................................................................................................................... 315

Best Practice Catalog
Trash Racks and Intakes
Revision 1.0, 12/01/2011

HAP – Best Practice Catalog – Trash Racks and Intakes
Rev. 1.0, 12/21/2011 5
Contents
1.0 Scope and Purpose ................................................................................................................... 6
1.1 Hydropower Taxonomy Position ..................................................................................... 6
1.1.1 Components............................................................................................................................. 6
1.2 Summary of Best Practices .............................................................................................. 8
1.2.1 Performance/Efficiency & Capability - Oriented Best Practices ............................... 8
1.2.2 Reliability/Operations & Maintenance - Oriented Best Practices .............................. 8
1.3 Best Practice Cross-References ........................................................................................ 8
2.0 Technology Design Summary .............................................................................................. 9
2.1 Material and Design Technology Evolution .................................................................... 9
2.2 State of the Art Technology .................................................................................................. 9
3.0 Operation and Maintenance Practices ................................................................................ 10
3.1 Condition Assessment .................................................................................................... 10
4.0 Metrics, Monitoring and Analysis ..................................................................................... 15
4.1 Measures of Performance, Condition, and Reliability ....................................................... 15
4.3 Integrated Improvements................................................................................................ 16
5.0 Information Sources: .......................................................................................................... 17
HAP – Best Practice Catalog – Trash Racks and Intakes
Rev. 1.0, 12/21/2011 6
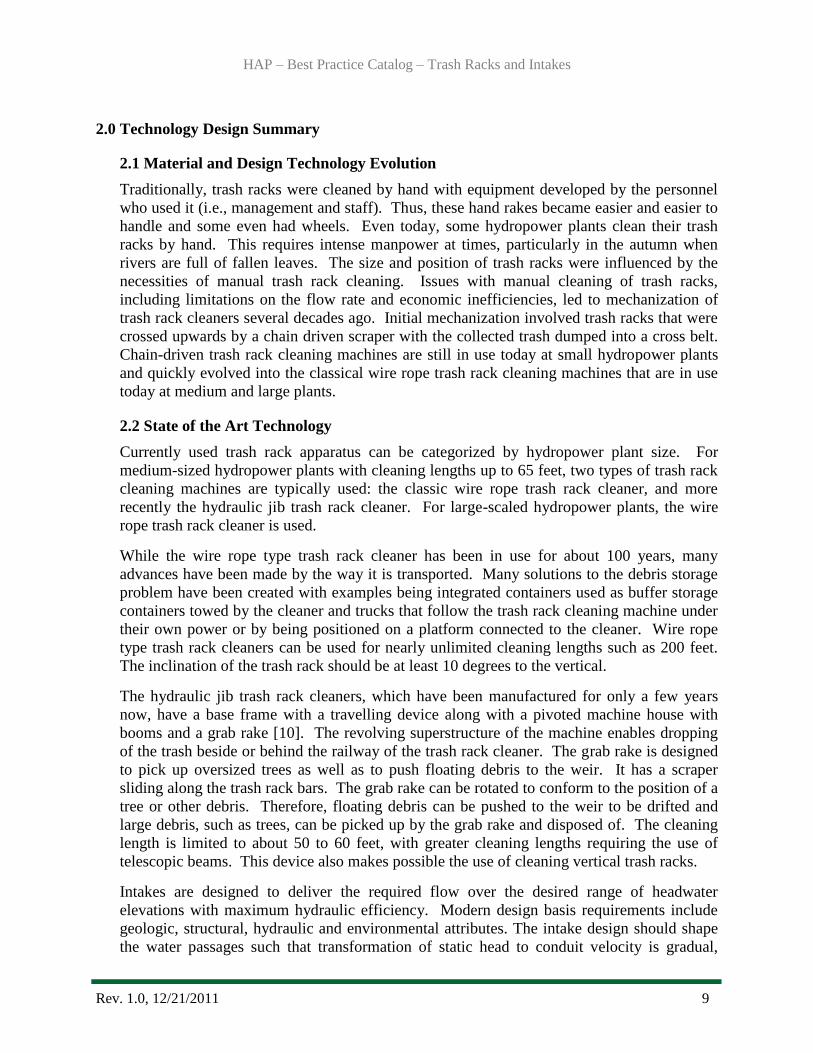
1.0 Scope and Purpose
This best practice for trash racks and intakes addresses the technology, condition assessment,
operations, and maintenance best practices with the objective to maximize performance and
reliability.
The primary purpose of the trash rack is to protect the equipment by keeping floating debris,
leaves, and trash from entering the turbines. The primary purpose of the intake is to divert water
at the river/reservoir source and deliver the required flow into the penstocks which in turn feed
the hydropower plant.
1.1 Hydropower Taxonomy Position
Hydropower Facility → Water Conveyances → Trash Racks and Intakes
1.1.1 Components
The components of the trash rack and intake systems are those features that directly or
indirectly contribute to the efficiency of water conveyance operations. The trash rack
system is made up of the trash rack itself along with its cleaning and monitoring
components. The intake system is comprised primarily of the intake structure, intake
gates, and hoisting machinery.
Trash Rack: The primary function of trash racks is to protect equipment, such as wicket
gates and turbines, from debris that is too large to pass through without causing harm.
The trash rack is probably the single most important debris control device [1]. Typically,
a trash rack consists of stationary rows of parallel carbon steel bars located at the dam
intake.
Trash Rake: The function of the trash rake is to remove any debris that accumulates on
the trash rack. By cleaning clogged racks, trash rakes reduce head differential. Rakes vary
in size to accommodate a variety of debris sizes. Rakes also vary in level of automation
with some plants using manual trash rakes and others using mechanical systems.
Trash Conveyor: The function of the trash conveyor is to remove trash cleaned from trash
racks. Trash conveyors reduce cost by eliminating the need for manual trash removal.
Monitoring System: The function of a monitoring system is to measure head differential
across a trash rack. The measurements can then be used to schedule trash cleaning or
justify improvements.
Intake: The function of an intake is to divert water from a source such as a river,
reservoir, or forebay under controlled conditions into the penstocks leading to the power
plant. Intakes are designed to deliver the required flow over the desired range of
headwater elevations with maximum hydraulic efficiency.
Intake Structures: Intake structures are commonly built into the forebay side of the dam
immediately adjacent to the turbine. Another common intake design is a tower structure
connected to a penstock. Tower intakes are often separate structures in the reservoir,
typically constructed of reinforced concrete. Intake structures commonly house (1) trash

HAP – Best Practice Catalog – Trash Racks and Intakes
Rev. 1.0, 12/21/2011 7
racks that prevent large debris and ice from entering the water passages and (2) gates or
valves for controlling the flow of water and for dewatering of the intake for maintenance
purposes.
Intake Gates: An intake gate is arranged to shut off the water delivery when the conduit
system has to be emptied. Types of gates include hydraulically operated slide gates,
roller and wheel-mounted gates, and radial gates.
Stoplogs/Bulkhead Gates: Stop logs and bulkhead gates are used to block water so that
construction, maintenance, or repair work can be accomplished in a dry environment.
Stop logs are stored in a secure storage yard, positioned by a crane and dropped into slots
on the pier of a dam to form a wall against the water.
Air Vents: Air vents are typically incorporated in the intake structure and configured to
prevent collapse of the penstock due to excessive vacuum when closing the intake gates.
Hoisting Machinery: Hoists are mechanical (electrically or manually driven), hydraulic
(oil or water), or pneumatically operated machines used to raise and lower in place heavy
water control features such as gates and stop logs.
Figure 1: Illustrations of submerged intakes built into the face of the dam

HAP – Best Practice Catalog – Trash Racks and Intakes
Rev. 1.0, 12/21/2011 8
Figure 2: Tower intake structures (Left: Blue Ridge Dam, Fannin County, Georgia; Right: Hoover Dam,
Clark County, Nevada/Mohave County, Arizona)
1.2 Summary of Best Practices
1.2.1Performance/Efficiency & Capability - Oriented Best Practices
Routinely monitor and record unit performance at CPL.
Periodically compare the CPL to the PPL to trigger feasibility studies of major
upgrades.
1.2.2Reliability/Operations & Maintenance - Oriented Best Practices
Routinely inspect trash racks for degradation.
Trend trash rack degradation and adjust life expectancy accordingly.
Routinely clean trash racks, regulated by visual inspection, timed intervals, or
head differential monitoring.
Routinely inspect and maintain trash rack cleaning systems (e.g. trash rakes,
conveyors).
Maintain documentation of IPL and update when modification to equipment is
made (e.g. trash rack replacement/repair, trash rake addition/upgrade).
Include industry knowledge for modern trash rack system components and
maintenance practices to plant engineering standards.
1.3 Best Practice Cross-References
Civil – Penstocks, Tunnels, and Surge Tanks
Civil – Flumes/Open Channels
Civil – Draft Tube Gates
Civil – Leakage and Releases
HAP – Best Practice Catalog – Trash Racks and Intakes
Rev. 1.0, 12/21/2011 9
2.0 Technology Design Summary
2.1 Material and Design Technology Evolution
Traditionally, trash racks were cleaned by hand with equipment developed by the personnel
who used it (i.e., management and staff). Thus, these hand rakes became easier and easier to
handle and some even had wheels. Even today, some hydropower plants clean their trash
racks by hand. This requires intense manpower at times, particularly in the autumn when
rivers are full of fallen leaves. The size and position of trash racks were influenced by the
necessities of manual trash rack cleaning. Issues with manual cleaning of trash racks,
including limitations on the flow rate and economic inefficiencies, led to mechanization of
trash rack cleaners several decades ago. Initial mechanization involved trash racks that were
crossed upwards by a chain driven scraper with the collected trash dumped into a cross belt.
Chain-driven trash rack cleaning machines are still in use today at small hydropower plants
and quickly evolved into the classical wire rope trash rack cleaning machines that are in use
today at medium and large plants.
2.2 State of the Art Technology
Currently used trash rack apparatus can be categorized by hydropower plant size. For
medium-sized hydropower plants with cleaning lengths up to 65 feet, two types of trash rack
cleaning machines are typically used: the classic wire rope trash rack cleaner, and more
recently the hydraulic jib trash rack cleaner. For large-scaled hydropower plants, the wire
rope trash rack cleaner is used.
While the wire rope type trash rack cleaner has been in use for about 100 years, many
advances have been made by the way it is transported. Many solutions to the debris storage
problem have been created with examples being integrated containers used as buffer storage
containers towed by the cleaner and trucks that follow the trash rack cleaning machine under
their own power or by being positioned on a platform connected to the cleaner. Wire rope
type trash rack cleaners can be used for nearly unlimited cleaning lengths such as 200 feet.
The inclination of the trash rack should be at least 10 degrees to the vertical.
The hydraulic jib trash rack cleaners, which have been manufactured for only a few years
now, have a base frame with a travelling device along with a pivoted machine house with
booms and a grab rake [10]. The revolving superstructure of the machine enables dropping
of the trash beside or behind the railway of the trash rack cleaner. The grab rake is designed
to pick up oversized trees as well as to push floating debris to the weir. It has a scraper
sliding along the trash rack bars. The grab rake can be rotated to conform to the position of a
tree or other debris. Therefore, floating debris can be pushed to the weir to be drifted and
large debris, such as trees, can be picked up by the grab rake and disposed of. The cleaning
length is limited to about 50 to 60 feet, with greater cleaning lengths requiring the use of
telescopic beams. This device also makes possible the use of cleaning vertical trash racks.
Intakes are designed to deliver the required flow over the desired range of headwater
elevations with maximum hydraulic efficiency. Modern design basis requirements include
geologic, structural, hydraulic and environmental attributes. The intake design should shape
the water passages such that transformation of static head to conduit velocity is gradual,
HAP – Best Practice Catalog – Trash Racks and Intakes
Rev. 1.0, 12/21/2011 10
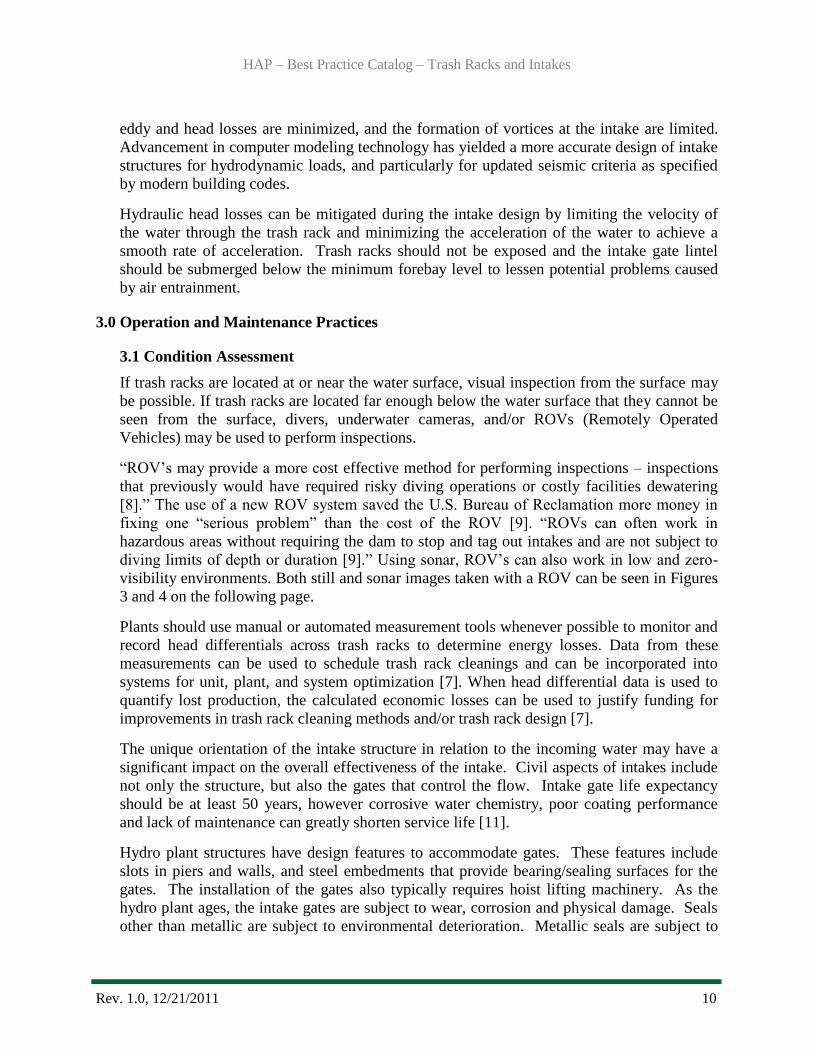
eddy and head losses are minimized, and the formation of vortices at the intake are limited.
Advancement in computer modeling technology has yielded a more accurate design of intake
structures for hydrodynamic loads, and particularly for updated seismic criteria as specified
by modern building codes.
Hydraulic head losses can be mitigated during the intake design by limiting the velocity of
the water through the trash rack and minimizing the acceleration of the water to achieve a
smooth rate of acceleration. Trash racks should not be exposed and the intake gate lintel
should be submerged below the minimum forebay level to lessen potential problems caused
by air entrainment.
3.0 Operation and Maintenance Practices
3.1 Condition Assessment
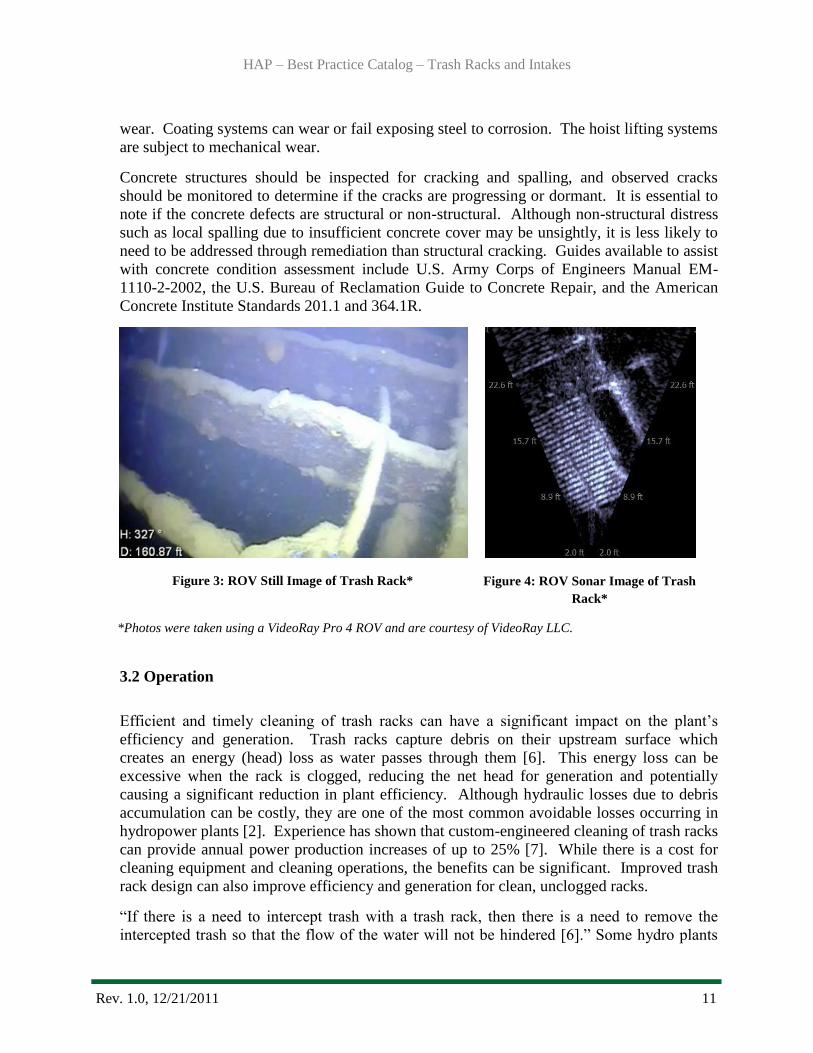
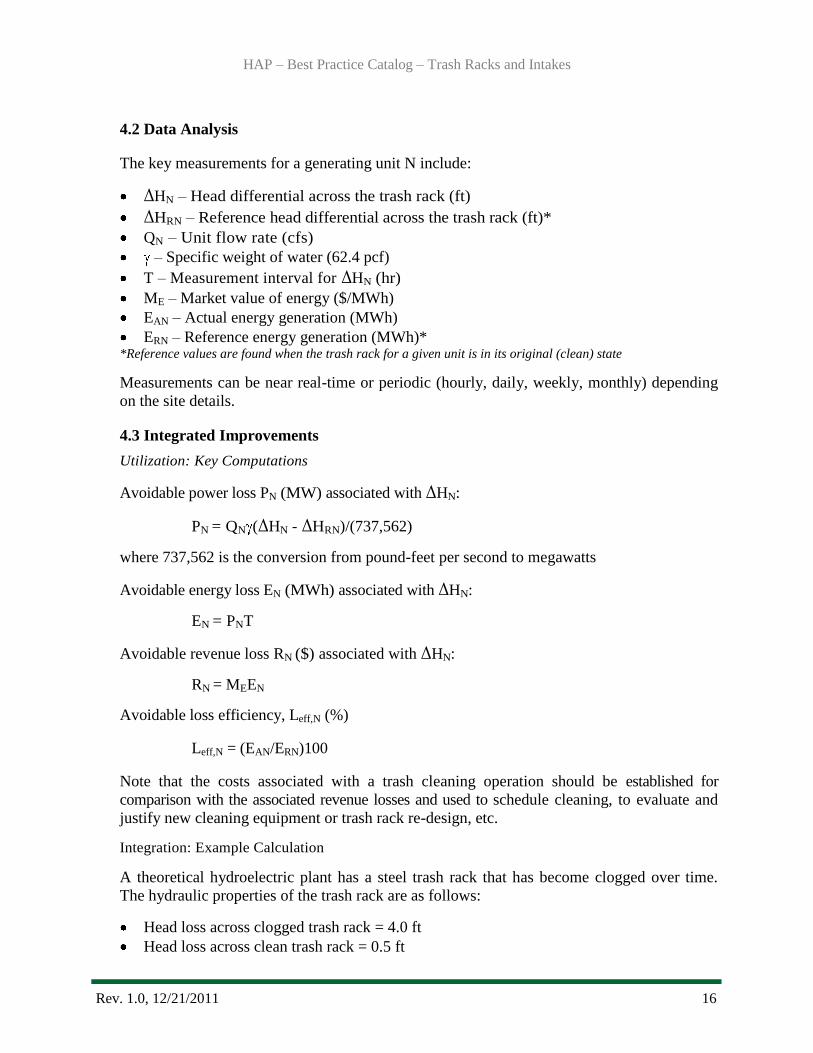
If trash racks are located at or near the water surface, visual inspection from the surface may
be possible. If trash racks are located far enough below the water surface that they cannot be
seen from the surface, divers, underwater cameras, and/or ROVs (Remotely Operated
Vehicles) may be used to perform inspections.
―ROV‘s may provide a more cost effective method for performing inspections – inspections
that previously would have required risky diving operations or costly facilities dewatering
[8].‖ The use of a new ROV system saved the U.S. Bureau of Reclamation more money in
fixing one ―serious problem‖ than the cost of the ROV [9]. ―ROVs can often work in
hazardous areas without requiring the dam to stop and tag out intakes and are not subject to
diving limits of depth or duration [9].‖ Using sonar, ROV‘s can also work in low and zero-
visibility environments. Both still and sonar images taken with a ROV can be seen in Figures
3 and 4 on the following page.
Plants should use manual or automated measurement tools whenever possible to monitor and
record head differentials across trash racks to determine energy losses. Data from these
measurements can be used to schedule trash rack cleanings and can be incorporated into
systems for unit, plant, and system optimization [7]. When head differential data is used to
quantify lost production, the calculated economic losses can be used to justify funding for
improvements in trash rack cleaning methods and/or trash rack design [7].
The unique orientation of the intake structure in relation to the incoming water may have a
significant impact on the overall effectiveness of the intake. Civil aspects of intakes include
not only the structure, but also the gates that control the flow. Intake gate life expectancy
should be at least 50 years, however corrosive water chemistry, poor coating performance
and lack of maintenance can greatly shorten service life [11].
Hydro plant structures have design features to accommodate gates. These features include
slots in piers and walls, and steel embedments that provide bearing/sealing surfaces for the
gates. The installation of the gates also typically requires hoist lifting machinery. As the
hydro plant ages, the intake gates are subject to wear, corrosion and physical damage. Seals
other than metallic are subject to environmental deterioration. Metallic seals are subject to
HAP – Best Practice Catalog – Trash Racks and Intakes
Rev. 1.0, 12/21/2011 11
wear. Coating systems can wear or fail exposing steel to corrosion. The hoist lifting systems
are subject to mechanical wear.
Concrete structures should be inspected for cracking and spalling, and observed cracks
should be monitored to determine if the cracks are progressing or dormant. It is essential to
note if the concrete defects are structural or non-structural. Although non-structural distress
such as local spalling due to insufficient concrete cover may be unsightly, it is less likely to
need to be addressed through remediation than structural cracking. Guides available to assist
with concrete condition assessment include U.S. Army Corps of Engineers Manual EM-
1110-2-2002, the U.S. Bureau of Reclamation Guide to Concrete Repair, and the American
Concrete Institute Standards 201.1 and 364.1R.
Figure 3: ROV Still Image of Trash Rack*
Figure 4: ROV Sonar Image of Trash
Rack*
*Photos were taken using a VideoRay Pro 4 ROV and are courtesy of VideoRay LLC.
3.2 Operation
Efficient and timely cleaning of trash racks can have a significant impact on the plant‘s
efficiency and generation. Trash racks capture debris on their upstream surface which
creates an energy (head) loss as water passes through them [6]. This energy loss can be
excessive when the rack is clogged, reducing the net head for generation and potentially
causing a significant reduction in plant efficiency. Although hydraulic losses due to debris
accumulation can be costly, they are one of the most common avoidable losses occurring in
hydropower plants [2]. Experience has shown that custom-engineered cleaning of trash racks
can provide annual power production increases of up to 25% [7]. While there is a cost for
cleaning equipment and cleaning operations, the benefits can be significant. Improved trash
rack design can also improve efficiency and generation for clean, unclogged racks.
―If there is a need to intercept trash with a trash rack, then there is a need to remove the
intercepted trash so that the flow of the water will not be hindered [6].‖ Some hydro plants

HAP – Best Practice Catalog – Trash Racks and Intakes
Rev. 1.0, 12/21/2011 12
have such a relatively small and/or infrequent debris load that cleaning can be carried out
manually. Other plants have large debris loads (Figure 5), which require mechanical
cleaning. Selection of trash rack cleaning equipment is site-specific.
Figure 5: Debris removed from trash racks can range in size from
aquatic milfoil to tree trunks, shown here [2]
Plants located in colder regions may have the additional problem of frazil ice accumulation
on trash racks. This ice affects trash rack efficiency in the same manner as debris, clogging
the trash rack and reducing the net generation head. In some cases frazil ice may be removed
by trash rakes, but in others, additional systems are needed to prevent the accumulation of
frazil ice [3]. See the discussion on frazil ice prevention in the following section for more
information.
The frequency of trash rack cleaning is site-specific and will vary from season to season at
each plant. Cleaning systems should be operated as frequently as needed to maintain plant
efficiency and capacity. Using head differential data as discussed in the above section, an
automated cleaning system can be installed. See the discussion on automated trash rakes in
the following section for more information.
3.3 Maintenance
As described in the system components, trash racks traditionally have been made of parallel
bars, and such installations have often served well for many decades. Carbon steel trash racks
typically need a protective coating, such as epoxy paint, to increase their life expectancy,
particularly if portions of the trash rack are periodically exposed to the atmosphere. In some
cases, it is cheaper to replace structurally weakened racks than it is to repaint them
periodically [6].
When trash racks are replaced, consideration should be given to improve trash rack design,
including modifications to bar shape and increased corrosion protection. Hydrodynamically
shaped bars have lower head losses, are less affected by flow-induced vibration, and are more

HAP – Best Practice Catalog – Trash Racks and Intakes
Rev. 1.0, 12/21/2011 13
easily cleaned [4]. To protect against corrosion, stainless steel, high density polyethylene
(HDPE), and fiber reinforced polymer (FRP) trash racks are available. The life expectancy of
steel trash racks is typically 15 to 35 years and 25 to 50 years for plastic or fiberglass trash
racks [3]. Some installations also use cathodic protection systems to combat corrosion. These
systems create a galvanic cell between the trash rack and an attached metal. The attached
metal suffers corrosion, thereby protecting the trash rack [6]. Additional guidance in the
replacement and detailed design of trash racks can be found in The Guide to Hydropower
Mechanical Design [6].
In colder regions where frazil ice accumulation is a problem, it may be cost effective to take
steps in preventing ice buildup. One approach is to install air bubblers or water circulating
pumps at the bottom of the racks providing a thermal change of water temperature. Another
approach is to alter the conductivity of the trash racks through replacement or modification.
Installing non-conductive racks (HDPE or FRP) can usually solve the problem. If metal racks
are used and they project above the surface of the water, a physical non-thermal conducting
break can be installed just below the water surface. This will prevent below freezing
temperatures from being transferred into the water through the trash rack. Electrically heating
the bars has also been used to prevent ice buildup, but the cost of doing so has not been
proven effective or economical [3].
―The main problem with trash removal is that it can be labor intensive. All improvements or
upgrades to the trash raking system that can help reduce costs and improve generation output
should be considered [3].‖ An estimated 5% to 25% increase in power production can be
seen with the addition of a custom engineered trash cleaning system, and the cost of these
upgrades is usually justifiable [7]. The efficiency gained can be quite significant [5]. One
utility determined that $500,000 per year could be recovered from trash-related problems at
one of their ―smaller‖ plants‘, and $250,000 per year at one of their ―larger‖ plants [7]. There
is a variety of trash rake systems currently available on the market (Figure 6). These systems
range in size as well as level of automation, so they are applicable to almost every plant
situation. The systems can be set to clean continuously, at a set interval, and/or whenever
differential head reaches a specified level. Conveyor systems can also be installed to reduce
the cost of trash removal (Figure 7). Due to the variety of trash rake options on the market,
each plant must evaluate the type of rake that will benefit them the most. ―Prior to selecting a
particular type of rake or manufacturer, the owner needs to consider the physical location of
the machine, the type of trash to be handled, and the complexity of the design and system
used to run the trash rake [3].‖

HAP – Best Practice Catalog – Trash Racks and Intakes
Rev. 1.0, 12/21/2011 14
Figure 6: Trash Rake System (courtesy of
Alpine Machine Co.)
Figure 7: Trash Rake Conveyer System (courtesy of
Atlas Polar Co.)
Surface roughness in the intake can contribute to head loss. Since the intake structure is a
relatively short portion of the water flow system, frictional head losses at the intake are
usually insignificant, unless the surface profile has been extensively altered or deteriorated.
The loss due to friction will increase as the intake walls roughen from cavitation or erosion in
high flow areas. Cavitation frequently causes severe damage to concrete or steel surfaces and
it may occur at sluice entrances and downstream from gate slots. Surface erosion resulting
from debris is sometimes mistaken for cavitation, and cavitation damage may be difficult to
determine from examination of the surface within the damaged area. Debris erosion may be
identified by grooves in the direction of flow. For both causes, a potential upgrade on an
intake having significant surface roughness or pitting would be to apply an epoxy concrete or
cementitious repair mortar to the concrete surface. A wide range of these repair mortars are
available having high bond strength and excellent workability likely to suit any concrete
intake surface. In the case where damage has already occurred, metal-liner plates can be used
to protect the concrete from the erosive action of cavitation. For heads above 150 feet, these
liner plates should extend five feet downstream from the gate and should not terminate at a
monolith joint or transition [10].
Another product that may be effective at reducing head loss at intakes is silicone based
coatings used to prevent organic growth. This product also provides a very smooth surface on
top of deteriorated areas on the interior intake surfaces. This coating system can be
considered in lieu of repair mortar and liner plates in most cases. The potential upgrade to
decrease the friction loss of an intake by applying a repair mortar, liner plate, or coating
system is highly dependent on accessibility and will vary on a site-specific basis.
Intakes can also introduce head loss to the system through geometric changes in the intake
wall structure. Intake walls may have slots to accommodate vertical gates or stoplogs. While
the plant is generating power and the stoplogs or gates are removed or raised, these slots
present irregular surfaces for flowing water. The void space of these slots will create minor
losses due to shape change. If the gates are not used as emergency closures in the conveyance

HAP – Best Practice Catalog – Trash Racks and Intakes
Rev. 1.0, 12/21/2011 15
system, slot fillers can be used to significantly reduce these losses. Slot fillers are often steel
or aluminum frames that fit snug inside the slots providing a smooth surface for flowing
water.
Other water conveyance issues that can negatively impact plant performance include valve
issues, restrictions in discharge channels, and sedimentation. Each of these issues affect
efficiency in proportion to the amount of head loss introduced to the conveyance system.
Efficiency can be gained by utilizing low-loss valves, such as gate valves, rather than higher-
loss butterfly valves. Additionally, a partially open valve will cause more loss than a fully
open valve. Therefore, care must be taken to ensure all valves are completely open when the
system is in operation.
Restrictions in discharge channels, such as weirs and bridge piers, can cause water to back up
behind them, increasing back pressure on the generation units and decreasing net available
head. The location of these structures plays a critical role in whether plant performance is
affected. Therefore, it is important to identify potential effects on generation when
considering the installation of such a structure. Additionally, natural obstructions
downstream from the dam, such as debris build-up or beaver dams, can cause similar
decreases in hydroelectric production. Care should be taken to maintain a clear discharge
channel, free of any major obstructions.
Plant efficiency can also be adversely affected by sedimentation in the reservoir behind the
dam. Upstream bed sedimentation can partially block an intake, reducing the effective flow
area and increasing the intake velocities, causing increased head loss at the intake. This issue
could be remediated by occasional dredging of the reservoir immediately upstream of the
dam.
4.0 Metrics, Monitoring and Analysis
4.1 Measures of Performance, Condition, and Reliability
Determination of the Potential Performance Level (PPL) typically requires reference to new
trash rack design information from vendors to establish the achievable unit loss
characteristics of replacement racks.
The Current Performance Level (CPL) is described by an accurate set of unit loss
characteristics determined by unit testing/monitoring.
The Installed Performance Level (IPL) is described by the unit loss characteristics at the time
of commissioning. This condition is used to determine the reference values in the
calculations detailed in this best practice. These characteristics may be determined from
vendor information and/or model testing conducted prior to or during unit commissioning.
The CPL should be compared with the IPL to determine decreases in trash rack efficiency
over time. Additionally, the PPL should be identified when considering plant upgrades. For
quantification of the PPL with respect to the CPL, see Quantification for Avoidable Losses
and/or Potential Improvements – Integration: Example Calculation
HAP – Best Practice Catalog – Trash Racks and Intakes
Rev. 1.0, 12/21/2011 16
4.2 Data Analysis
The key measurements for a generating unit N include:
ΔHN – Head differential across the trash rack (ft)
ΔHRN – Reference head differential across the trash rack (ft)*
QN – Unit flow rate (cfs)
– Specific weight of water (62.4 pcf)
T – Measurement interval for ΔHN (hr)
ME – Market value of energy ($/MWh)
EAN – Actual energy generation (MWh)
ERN – Reference energy generation (MWh)* *Reference values are found when the trash rack for a given unit is in its original (clean) state
Measurements can be near real-time or periodic (hourly, daily, weekly, monthly) depending
on the site details.
4.3 Integrated Improvements
Utilization: Key Computations
Avoidable power loss PN (MW) associated with ΔHN:
PN = QN (ΔHN - ΔHRN)/(737,562)
where 737,562 is the conversion from pound-feet per second to megawatts
Avoidable energy loss EN (MWh) associated with ΔHN:
EN = PNT
Avoidable revenue loss RN ($) associated with ΔHN:
RN = MEEN
Avoidable loss efficiency, Leff,N (%)
Leff,N = (EAN/ERN)100
Note that the costs associated with a trash cleaning operation should be established for
comparison with the associated revenue losses and used to schedule cleaning, to evaluate and
justify new cleaning equipment or trash rack re-design, etc.
Integration: Example Calculation
A theoretical hydroelectric plant has a steel trash rack that has become clogged over time.
The hydraulic properties of the trash rack are as follows:
Head loss across clogged trash rack = 4.0 ft
Head loss across clean trash rack = 0.5 ft

HAP – Best Practice Catalog – Trash Racks and Intakes
Rev. 1.0, 12/21/2011 17
Average flow across trash rack = 800 cfs
The avoidable power loss can be calculated as:
ΔP = (800 cfs)(62.4 pcf)(4.0 ft – 0.5 ft) / 737,562 = 0.24 MW
At an estimated market value of energy of $65/MWh, and assuming the plant produces
power 75% of the time, the market value of power loss can be calculated as:
0.75 (0.24 MW)($65/MWh)(8,760 hours/year) = $102, 500/year
This analysis indicates a significant avoidable energy and revenue loss over the performance
assessment interval.
5.0 Information Sources: Baseline Knowledge:
The United States Army Corps of Engineers, Debris Control at Hydraulic Structures in Selected
Areas of the United States and Europe, CHL-CR-97-4, December 1997.
Jones, R. K., P. A. March, D. B. Hansen, and C. W. Almquist, ―Reliability and Efficiency
Benefits of Online Trash Rack Monitoring,‖ Proceedings of Waterpower 97, August 1997.
American Society of Civil Engineers, Civil Works for Hydroelectric Facilities: Guidelines for
Life Extension and Upgrade, 2007.
Hydro Life Extension Modernization Guides: Volume 1 – Overall Process, EPRI, Palo Alto, CA:
1999. TR-112350-V1.
March, P. A., and P. J. Wolff, ―Component Indicators for an Optimization-Based Hydro
Performance Indicator,‖ HydroVision 2004, Montréal, Québec, Canada, August 2004.
State of the Art:
American Society of Mechanical Engineers, The Guide to Hydropower Mechanical Design,
Kansas City, Missouri: HCI Publications, July 1996.
EPRI, Hydropower Technology Roundup Report: Trash and Debris Management at
Hydroelectric Facilities, TR-113584-V10, March 2007.
EPRI, Remotely Operated Vehicle (ROV) Technology: Applications and Advancements at
Hydro Facilities, TR-113584-V7, December 2002.
VideoRay, ―US Bureau of Reclamation Reports Immediate Success with VideoRay Pro 4 ROV,‖
April 13, 2011, Retrieved from http://www.videoray.com/stories/278-us-bureau-of-reclamation-
reports-immediate-success-with-videoray-pro.
Radhuber W., ―Trash Rack Cleaning – The Past-The Present – The Future,‖ 15th
International
Seminar on Hydropower Plants, Vienna 2008.

HAP – Best Practice Catalog – Trash Racks and Intakes
Rev. 1.0, 12/21/2011 18
Benson B., J. Blasongame, B. Chu, J. Richter and D. Woodward, ―Aging Plants – Time for a
Physical‖: Conducting a Comprehensive Condition Assessment and the Issues Identified,‖
HydroVision 2008.

Best Practice Catalog
Penstocks and Tunnels
Revision 1.0, 12/06/2011

HAP – Best Practice Catalog – Penstocks and Tunnels
Rev. 1.0, 12/21/2011 20
Contents
1.0 Scope and Purpose …………………………………………………………...………….21
1.1 Hydropower Taxonomy Position ................................................................................... 21
1.1.1 Components........................................................................................................................... 21
1.2 Summary of Best Practices ............................................................................................ 24
1.2.1 Performance/Efficiency & Capability - Oriented Best Practices ................................... 24
1.2.2 Reliability/Operations & Maintenance - Oriented Best Practices ................................. 24
1.3 Best Practice Cross-references ....................................................................................... 25
2.0 Technology Design Summary…………………………………………………………... 25
2.1 Material and Design Technology Evolution .................................................................. 25
2.2 State of the Art Technology ........................................................................................... 26
3.0 Operation and Maintenance Practices………..…………………...………...………… .. 27
3.1 Condition Assessment .................................................................................................... 27
3.2 Operations ...................................................................................................................... 28
3.3 Maintenance ................................................................................................................... 29
4.0 Metrics, Monitoring and Analysis………………………………...………..…………....33
4.1 Measures of Performance, Condition, and Reliability ................................................... 33
4.2 Data Analysis ................................................................................................................. 34
4.3 Integrated Improvements................................................................................................ 34
5.0 Information Sources:…..……………………………...…………………….……………35

HAP – Best Practice Catalog – Penstocks and Tunnels
Rev. 1.0, 12/21/2011 21
1.0 Scope and Purpose
This best practice for penstocks, tunnels, and surge tanks addresses how innovations in
technology, proper condition assessments, and improvements in operation and maintenance
practices can contribute to maximizing overall plant performance and reliability. The primary
purpose of a penstock or tunnel is to transport water from the intake and deliver it to the
hydraulic turbine in the powerhouse. Once the water has been delivered to the turbine, it is then
released downstream into the discharge channel.
1.1 Hydropower Taxonomy Position
Hydropower Facility → Water Conveyances → Penstocks, Tunnels, & Surge Tanks
1.1.1 Components
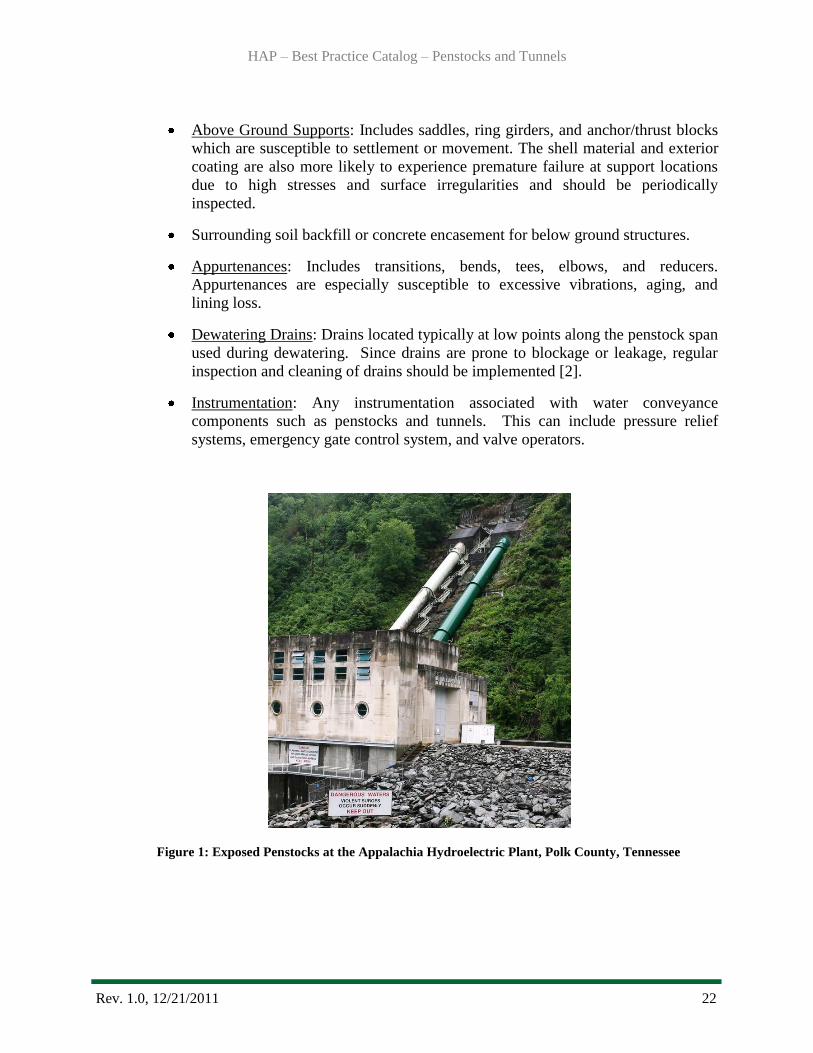
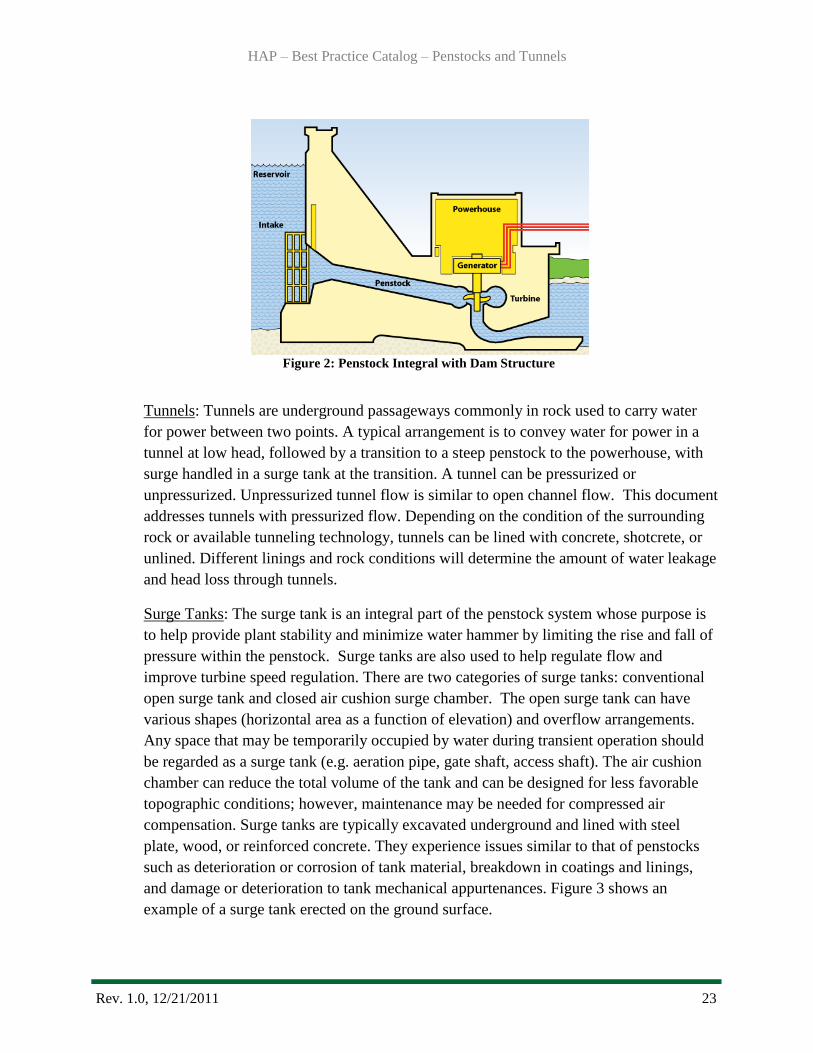
Penstocks: Penstocks are pressurized conduits that transport water from the first free
water surface to a turbine. Penstocks can be either exposed or built integral with the dam
structure as shown in Figure 1. Characteristics of functional penstocks are structural
stability, minimal water leakage, and maximum hydraulic performance. Specific features
of a penstock system include:
Main Shell Material: Typically penstock shells are constructed of large round
steel cross-sections. Fabricated welded steel is generally considered to be the
better option when dealing with larger heads and diameters; however, pre-stressed
or reinforced concrete, glass-reinforced plastic (GRP), and PVC plastic pipes are
also utilized.
Shell Linings and Coatings: The protective membrane applied to the interior
(linings) and exposed exterior surfaces (coatings) which provide corrosion
protection and water tightness.
Connection Hardware: Includes rivets, welds, bolts, etc.
Unrestrained Joints: Includes expansion joints or sleeve-type couplings spaced
along the penstock span to allow for longitudinal expansion of the pipe due to
changes in temperature.
Air Valves: The primary function of air valves is to vent air to and from the
penstock during both operating conditions and watering/dewatering of the
penstock.
Control Valves: Includes bypass, filling, shutoff valves, and gate valves used
during watering and dewatering, redirecting flows, emergency shutoff, etc [2].
Manholes and Other Penetrations: Includes items directly attached to the penstock
and exposed to the internal pressure such as manholes, air vents and, filling line
connections.
HAP – Best Practice Catalog – Penstocks and Tunnels
Rev. 1.0, 12/21/2011 22
Above Ground Supports: Includes saddles, ring girders, and anchor/thrust blocks
which are susceptible to settlement or movement. The shell material and exterior
coating are also more likely to experience premature failure at support locations
due to high stresses and surface irregularities and should be periodically
inspected.
Surrounding soil backfill or concrete encasement for below ground structures.
Appurtenances: Includes transitions, bends, tees, elbows, and reducers.
Appurtenances are especially susceptible to excessive vibrations, aging, and
lining loss.
Dewatering Drains: Drains located typically at low points along the penstock span
used during dewatering. Since drains are prone to blockage or leakage, regular
inspection and cleaning of drains should be implemented [2].
Instrumentation: Any instrumentation associated with water conveyance
components such as penstocks and tunnels. This can include pressure relief
systems, emergency gate control system, and valve operators.
Figure 1: Exposed Penstocks at the Appalachia Hydroelectric Plant, Polk County, Tennessee
HAP – Best Practice Catalog – Penstocks and Tunnels
Rev. 1.0, 12/21/2011 23
Figure 2: Penstock Integral with Dam Structure
Tunnels: Tunnels are underground passageways commonly in rock used to carry water
for power between two points. A typical arrangement is to convey water for power in a
tunnel at low head, followed by a transition to a steep penstock to the powerhouse, with
surge handled in a surge tank at the transition. A tunnel can be pressurized or
unpressurized. Unpressurized tunnel flow is similar to open channel flow. This document
addresses tunnels with pressurized flow. Depending on the condition of the surrounding
rock or available tunneling technology, tunnels can be lined with concrete, shotcrete, or
unlined. Different linings and rock conditions will determine the amount of water leakage
and head loss through tunnels.
Surge Tanks: The surge tank is an integral part of the penstock system whose purpose is
to help provide plant stability and minimize water hammer by limiting the rise and fall of
pressure within the penstock. Surge tanks are also used to help regulate flow and
improve turbine speed regulation. There are two categories of surge tanks: conventional
open surge tank and closed air cushion surge chamber. The open surge tank can have
various shapes (horizontal area as a function of elevation) and overflow arrangements.
Any space that may be temporarily occupied by water during transient operation should
be regarded as a surge tank (e.g. aeration pipe, gate shaft, access shaft). The air cushion
chamber can reduce the total volume of the tank and can be designed for less favorable
topographic conditions; however, maintenance may be needed for compressed air
compensation. Surge tanks are typically excavated underground and lined with steel
plate, wood, or reinforced concrete. They experience issues similar to that of penstocks
such as deterioration or corrosion of tank material, breakdown in coatings and linings,
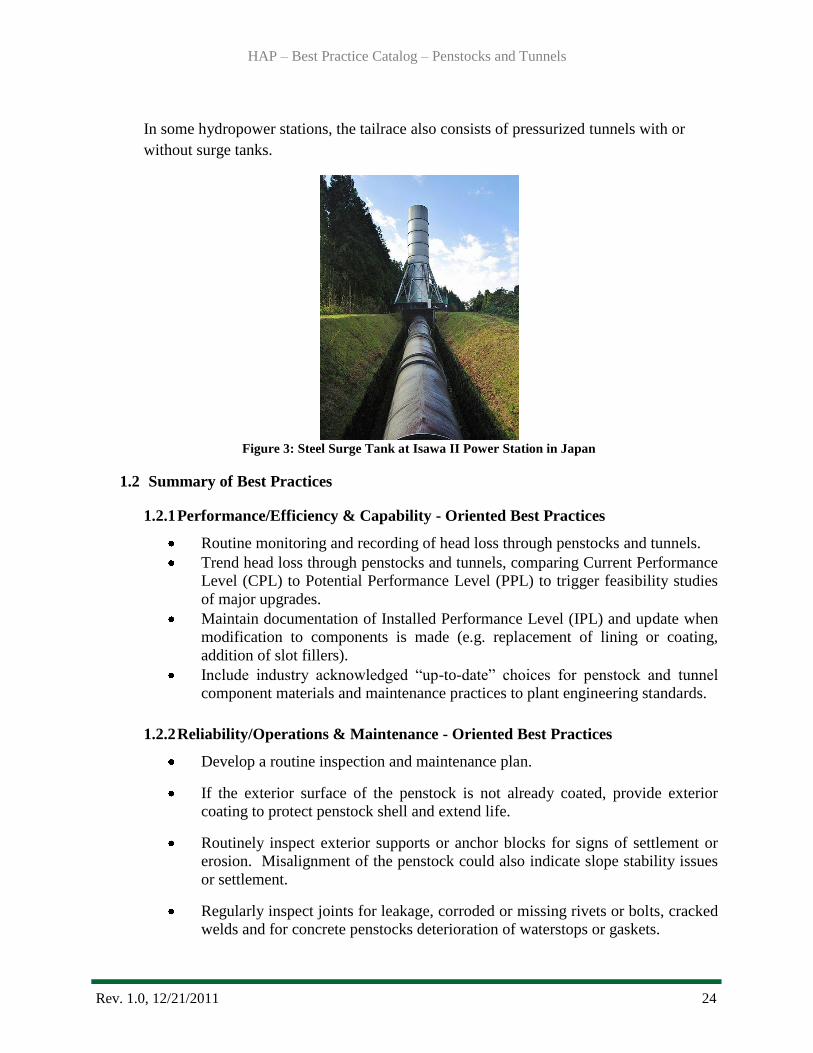
and damage or deterioration to tank mechanical appurtenances. Figure 3 shows an
example of a surge tank erected on the ground surface.
HAP – Best Practice Catalog – Penstocks and Tunnels
Rev. 1.0, 12/21/2011 24
In some hydropower stations, the tailrace also consists of pressurized tunnels with or
without surge tanks.
Figure 3: Steel Surge Tank at Isawa II Power Station in Japan
1.2 Summary of Best Practices
1.2.1 Performance/Efficiency & Capability - Oriented Best Practices
Routine monitoring and recording of head loss through penstocks and tunnels.
Trend head loss through penstocks and tunnels, comparing Current Performance
Level (CPL) to Potential Performance Level (PPL) to trigger feasibility studies
of major upgrades.
Maintain documentation of Installed Performance Level (IPL) and update when
modification to components is made (e.g. replacement of lining or coating,
addition of slot fillers).
Include industry acknowledged ―up-to-date‖ choices for penstock and tunnel
component materials and maintenance practices to plant engineering standards.
1.2.2 Reliability/Operations & Maintenance - Oriented Best Practices
Develop a routine inspection and maintenance plan.
If the exterior surface of the penstock is not already coated, provide exterior
coating to protect penstock shell and extend life.
Routinely inspect exterior supports or anchor blocks for signs of settlement or
erosion. Misalignment of the penstock could also indicate slope stability issues
or settlement.
Regularly inspect joints for leakage, corroded or missing rivets or bolts, cracked
welds and for concrete penstocks deterioration of waterstops or gaskets.
HAP – Best Practice Catalog – Penstocks and Tunnels
Rev. 1.0, 12/21/2011 25
If build-up within the penstock is present, recommend high-pressure cleaning.
If organic build-up is a persistent problem, recommend replacing liner with a
fouling release type product.
Repair/replace interior liners as required to prevent shell corrosion and extend
the penstock shell life.
Routinely inspect tunnels for signs of erosion or leakage.
Water hammer or transient flow is an unavoidable and critical issue in any
pressurized water conveyance system. Water hammer can result from any load
variations, load rejections, operating mode changes, unit startup and shutdown,
and operational errors. Water hammer and transient flow can cause major
problems ranging from noise and vibrations to pipe collapse and total system
failure. Therefore, water hammer protection devices such as surge tanks, air
chambers, air valves, and pressure relief valves should be routinely inspected to
ensure they are functioning properly. In addition, flow and load control devices
such as the governor, turbine wicket gates, and penstock control valves should
be routinely checked to prevent water hammer incidences. If found to be
suspicious, measurements and further investigation should be immediately
performed.
1.3 Best Practice Cross-references
Civil – Trash Racks and Intakes Best Practice
Civil – Leakage and Releases Best Practice
Civil – Flumes/Open Channels Best Practice
Civil – Draft Tube Gates Best Practice
2.0 Technology Design Summary
2.1 Material and Design Technology Evolution
Coatings and linings for penstocks provide protection for the shell material and are critical to
the performance and longevity of the penstock [6]. Coating and lining technology has rapidly
evolved in recent years. Penstocks in many hydroelectric facilities have not been re-lined in
several years or have only applied local repairs to the original linings. For this reason, it is
crucial that plants perform routine evaluations as to the condition of both linings and coatings
so as to avoid costly repairs or loss of revenue due to unscheduled shutdowns.
Historically, coal tar liners have been used to line the interior of penstocks. From the 1800‘s
to 1940 a molten coal tar was used with a 15 to 20 year expected life span. However, these
liners became brittle with time which led to cracking. Coal tar enamels became readily used
after 1940 with an expected life span of 20 to 30 years. These liners were discontinued after

HAP – Best Practice Catalog – Penstocks and Tunnels
Rev. 1.0, 12/21/2011 26
the 1960‘s due to health and environmental concerns over high Volatile Organic Compound
(VOC) levels. Between 1960 and 1980, coal tar epoxies were used; however, due to thinner
applications, these liners had only a 15 year life span. It was not till the 1980‘s that high
performance 100% epoxies were used (25 to 30 year life expectancy) [5]. Innovations in
epoxy liners are rapidly evolving. Liners were originally used only to provide corrosion
protection and water tightness; however, recent innovations in silicone and epoxy liners can
provide resistance to build-up due to organic growth, reduction in frictional resistance, and
an increase in water flow rate performance. Also, newer liners have longer life expectancies
and limit costly maintenance or repair expenses.
Tunneling technology has also evolved over the last decades. In the 1950‘s most pressurized
tunnels and shafts were steel lined. Today, there are specialized techniques and design
concepts for unlined, high-pressure tunnels, shafts, and air cushion surge chambers which
have been developed and well-practiced in Europe and China. The cost of lining a meter of
tunnel is often two to three times the cost of excavating the tunnel; therefore, new tunneling
technology significantly saves in cost and construction time. This allows for the design of a
larger cross-sectional area of tunnel with lower flow velocity. Larger tunnels are more
tolerant of falling rocks and minor blockage along the tunnel floor given there is a rock trap
at the end of the headrace tunnel. This trade-off in tunnel design and construction may not
increase the head loss or leakage; however, the condition of the tunnel should be routinely
inspected to prevent serious collapses or local tunnel blockages.
2.2 State of the Art Technology
Penstocks are pressurized conduits designed to transport water from the first free water
surface to the turbine with maximum hydraulic performance. By using state of the art
technology for new liners such as silicone-based fouling release systems, the surface
roughness of the penstock interior can be reduced (i.e. minimize frictional resistance) and
organic buildup can be limited thus reducing head loss through the system. Advancement in
computer modeling technology has also yielded more accurate penstock designs for
hydrodynamic loading limiting head loss, reducing water hammer effects, and extending life
expectancy of both liners and shell material. In addition computer modeling allows for more
accurate design for updated seismic criteria per modern building codes.
It is important to periodically collect performance data on penstocks, tunnels, surge tank and
associated components. Instrumentation technology is rapidly evolving and improving in
accuracy and reliability. By using state-of-the-art technology, hydroelectric facilities can
monitor pressure levels, movement, flow, temperature, stress, and strain. These
measurements can alert plant personnel to any changes in performance levels or required
maintenance. Also reliable performance data can be used to determine upgrade or
modernization opportunities for water conveyance systems such as penstocks and tunnels.
HAP – Best Practice Catalog – Penstocks and Tunnels
Rev. 1.0, 12/21/2011 27
State of the art tunneling technology allows for a larger excavation volume which reduces the
flow velocity and thus reduces hydraulic head losses. The innovative containment principles
and permeability control measures (e.g. grouting) used in tunnel design and construction can
minimize water leakage through the rock mass.
3.0 Operation and Maintenance Practices
3.1 Condition Assessment
Since penstocks, tunnels, and surge tanks are exposed to occasional severe service conditions
and are expected to perform reliably for extended periods of 50 years or more, they are prone
to the following maintenance issues:
Deterioration of linings and coatings
Corrosion/thinning of steel penstock shell and other steel components
Leaking at joints/couplings
Erosion or cavitation
Organic growth on interior surfaces
Localized buckling
Air vent blockage or pressure relief valve malfunction
Foundation settlement
Slope instabilities
Sedimentation
Condition assessments of penstocks, tunnels, and surge tanks are conducted primarily by
visual examination and physical measurements. The purpose of these inspections is to
determine structural integrity, life expectancy, and necessary improvements of the
conveyance components. Most parts of these components will be difficult to inspect.
Typically, the interior inspections will require dewatering and will present a hazardous
working environment, with poor ventilation, slippery surfaces, and steep inclines. Inspection
of some components may require the use of divers or remote-controlled video equipment
(e.g., remote-operated vehicles, or ROVs). If a penstock is buried or integral with the dam
structure, an exterior inspection is not possible. Where exposed, the penstock exterior should
be inspected during full operating pressure to detect any leakage [9]. Visual inspection
typically includes assessments of corrosion, coatings, rivets/joints, general alignment,

HAP – Best Practice Catalog – Penstocks and Tunnels
Rev. 1.0, 12/21/2011 28
foundation conditions, and stability of supporting and adjacent earth slopes. Non-destructive
examination (NDE) testing, which should be performed on penstocks where accessible,
includes shell thickness measurements and dimensional measurements for alignment,
ovalling, and bulging. Additionally, concrete structures must be inspected for excessive
cracking and pitting. Baseline crack maps should be prepared so that new or worsened
conditions can be observed and documented [1].
It is important to schedule routine and thorough inspections of all penstock, tunnel, and surge
tank components. This will help identify any defects or other maintenance issues. Through
proper inspection, any unscheduled shutdowns for maintenance or repair can be minimized.
When developing an inspection program, an important step in the planning phase is to
acquire critical design and operating histories. This can include, but is not limited to, the
initial design criteria, geotechnical/foundation information, as-built drawings, construction
information, operation history, and records of previous maintenance issues [5].
Once a comprehensive history of the penstock, tunnel, and surge tank performance has been
acquired, personnel can develop an inspection plan. A schedule should be implemented to
periodically monitor maintenance issues. These inspections should be conducted at least once
every five years [2].
Several factors can affect how often inspections of penstocks and tunnels should occur,
including age, accessibility, public safety or environmental concerns, construction, and
previous maintenance problems [2]. An efficient and comprehensive inspection plan, specific
for each facility, should be developed after carefully considering all contributing factors. As
previously noted, inspections of penstock and tunnel components generally require
dewatering of the system. Therefore, inspections would ideally occur during scheduled unit
outages to minimize system down time. See Tables 2-1 and 2-2 in Steel Penstock – Coating
and Lining Rehabilitation: A Hydropower Technology Round-Up Report [5] for additional
guidance in developing an inspection program.
3.2 Operations
Periodic flow measurements should be obtained to determine that the water conveyance
system is functioning optimally. It is also important to routinely monitor changes in pressure
within the water conveyance system.
Performing a hydraulic transient analysis consists of computer simulation of the water
conveyance system and turbine-generator units to calculate pressure at all critical locations in
the system [2]. The maximum operating pressures within the system can be determined
through load rejection testing. Testing should be performed for a full range of operating
conditions. The scope of measurement during the transient testing should include continuous
records for the following:

HAP – Best Practice Catalog – Penstocks and Tunnels
Rev. 1.0, 12/21/2011 29
Pressures at the chosen points along the tunnel, penstock, immediately upstream and
downstream of the turbine, and along the outlet tailrace tunnel;
Pressures within the turbines: spiral case, head cover, under runner, and in the draft
tube;
Wicket gate openings;
Angles of runner blades for the Kaplan turbines;
Strokes of penstock control valves;
Speed of turbine units;
Torques acting on the coupling;
Axial hydraulic thrust;
Displacement and vibration of bearings.
The recorded data is very important for transient investigation and analysis. In addition, the
following parameters are to be recorded intermittently during steady-state operations before
and after transient conditions. Note that these values should agree with the corresponding
values recorded continuously.
Water levels in head reservoir and tailrace;
Wicket gate openings and angle of runner blades for Kaplan turbines;
Pressures in penstock, upstream and downstream of the powerhouse, and the tailrace
tunnel;
Pressures within the turbines: spiral case, head cover, under runner, and in the draft
tube;
Electric current and voltage in the generator;
Angular speed of turbine units.
When observed and computer simulated values fit well with each other, the program of
measurements and investigations could be shortened or revised. By determining the
maximum and minimum operating pressures, a comparison to the original system design can
be made which can help to identify significant operational changes and potential upgrade
needs.
In addition, it is important to ensure that the penstock emergency gates are functioning
properly, i.e. gates open and close freely with no binding or leakage. Emergency gate tests at
balanced head should be performed on an annual basis and every 5 to 10 years for

HAP – Best Practice Catalog – Penstocks and Tunnels
Rev. 1.0, 12/21/2011 30
unbalanced head. Opening/closing times and operating pressure should be recorded for future
testing comparison [2].
During plant operations, it is important to routinely inspect the exterior surfaces of penstocks
for signs of leakage while penstock is under hydrostatic pressure. If any leaks are discovered,
the source should be promptly identified and repair performed. Leakage not only increases
head loss over time, it may be indicative of more severe issues such slope instability,
foundation movement, penstock misalignment, severe corrosion, or joint failure.
3.3 Maintenance
Penstocks and tunnels carry water from the intake to the generator and introduce head loss to
the system through hydraulic friction and geometric changes in the water passageway such as
bends, contractions, and expansions. Reduction of these losses through upgrades or
replacement can improve plant efficiency and generation. However, because of the relatively
small available efficiency improvements, these actions are unlikely to be justifiable on the
grounds of reducing head losses alone [8]. Therefore, upgrading or replacing penstock and
tunnel structures will typically be economically viable only if the plant is already scheduled
for a shutdown to address other related improvements or maintenance concerns.
Although upgrades to penstocks and tunnels will have a minor effect on generation
efficiency, maintenance and life-extending repairs of these structures are very important.
Since any unscheduled repair generally requires dewatering of the system with subsequent
loss of power production, any plant shutdowns to repair penstock and tunnel structures will
have a significant effect on plant availability and generation.
Evaluating head loss in penstocks and tunnels can point to ways of increased plant efficiency.
Head loss can be caused by joints and bends, changes in diameter, and roughness and
irregularities of conveyance structures. The geometry of a penstock or tunnel structure is not
easily modified. Therefore, decreasing head losses by removing or reducing the number of
existing joints and bends is not usually an economically viable undertaking. However, if
replacement of a penstock or tunnel structure is required for other maintenance reasons, a
detailed evaluation of rerouting the waterway to increase efficiency would be warranted. In
this case, the penstock or tunnel material and diameter should also be a design consideration.
Friction Factors for Large Conduits Flowing Full [3] gives Darcy friction factors for
different conduit materials and construction types as a function of Reynolds number (Re).
These friction coefficients are directly proportional to the total frictional head loss.
Therefore, if replacement is required, selection of lower friction material and construction
types would be integral in reducing head loss through the penstock or tunnel structure. Head
losses are also proportional to the square of the velocity, so the appropriate diameter should
be verified. This is particularly important at older facilities where the hydraulic capacity
requirements of the penstock or tunnel structure may have changed over time.
HAP – Best Practice Catalog – Penstocks and Tunnels
Rev. 1.0, 12/21/2011 31
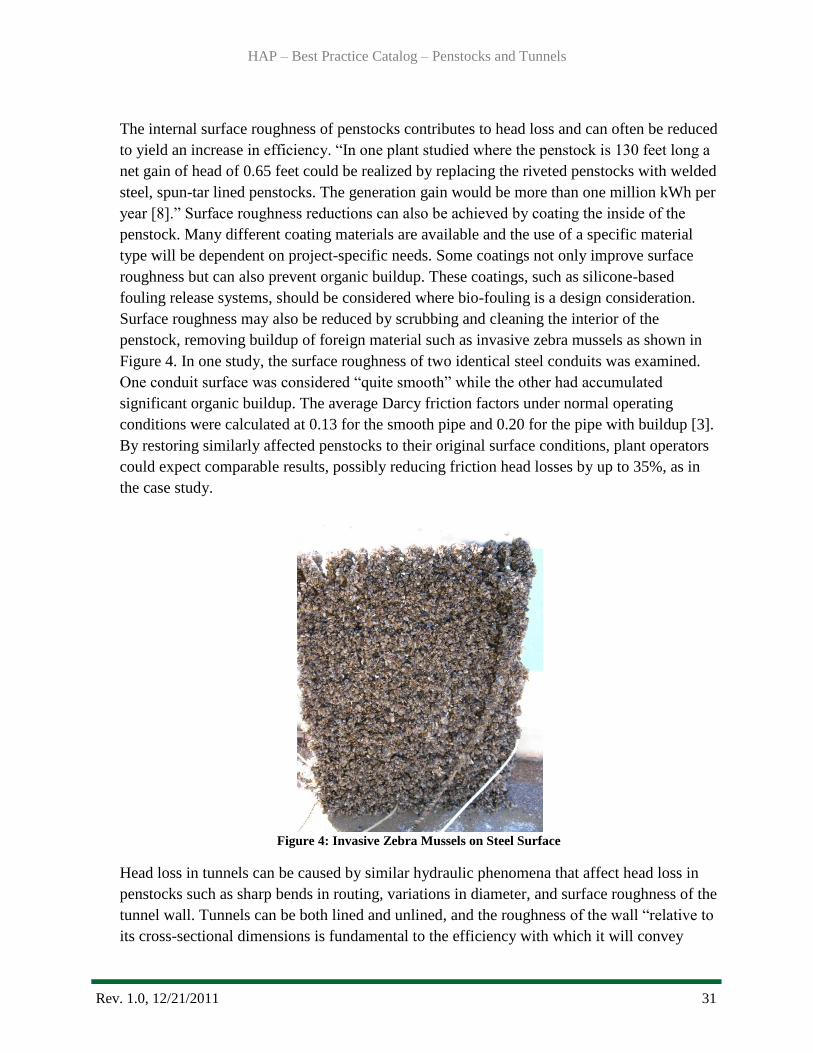
The internal surface roughness of penstocks contributes to head loss and can often be reduced
to yield an increase in efficiency. ―In one plant studied where the penstock is 130 feet long a
net gain of head of 0.65 feet could be realized by replacing the riveted penstocks with welded
steel, spun-tar lined penstocks. The generation gain would be more than one million kWh per
year [8].‖ Surface roughness reductions can also be achieved by coating the inside of the
penstock. Many different coating materials are available and the use of a specific material
type will be dependent on project-specific needs. Some coatings not only improve surface
roughness but can also prevent organic buildup. These coatings, such as silicone-based
fouling release systems, should be considered where bio-fouling is a design consideration.
Surface roughness may also be reduced by scrubbing and cleaning the interior of the
penstock, removing buildup of foreign material such as invasive zebra mussels as shown in
Figure 4. In one study, the surface roughness of two identical steel conduits was examined.
One conduit surface was considered ―quite smooth‖ while the other had accumulated
significant organic buildup. The average Darcy friction factors under normal operating
conditions were calculated at 0.13 for the smooth pipe and 0.20 for the pipe with buildup [3].
By restoring similarly affected penstocks to their original surface conditions, plant operators
could expect comparable results, possibly reducing friction head losses by up to 35%, as in
the case study.
Figure 4: Invasive Zebra Mussels on Steel Surface
Head loss in tunnels can be caused by similar hydraulic phenomena that affect head loss in
penstocks such as sharp bends in routing, variations in diameter, and surface roughness of the
tunnel wall. Tunnels can be both lined and unlined, and the roughness of the wall ―relative to
its cross-sectional dimensions is fundamental to the efficiency with which it will convey

HAP – Best Practice Catalog – Penstocks and Tunnels
Rev. 1.0, 12/21/2011 32
water [10].‖ Typical causes of head loss in tunnels that have the potential for efficiency
upgrades include rock fallout in unlined tunnels, significant and abrupt changes in rock
tunnel diameter, and organic buildup. ―Slime growth in tunnels can be a serious
problem…one plant is on record as losing 3% of maximum power due to this [8].‖ It should
be noted that by relieving one problem, others may emerge. Removing organic buildup can
expose rough linings or rock walls that have comparable head loss characteristics. Perhaps
the best technique for improving efficiencies in tunnels is to decrease surface roughness by
either filling in large cavities in the rock wall with grout or installing some type of lining. ―A
major modification for substantial reduction in head loss is the installation of concrete lining
(or to a lesser extent a paved invert) in a formerly unlined tunnel [8].‖ Lining or grouting the
tunnel wall can result in an increase in efficiency by reducing leakage into the surrounding
rock which can reduce the available generation flow.
Penstock shell thickness measurements need to be taken and monitored periodically to
identify losses in thickness, which must then be compared with minimum acceptable
thickness values. If shell thinning exceeds acceptable values for structural integrity,
corrective actions must be taken [9]. Deteriorated penstocks may be rehabilitated by patching
at localized areas of need, lining with a material such as fiberglass to reinforce the structure
of the penstock, or replacing the existing penstock [7].
Figure 5: Exposed Portion of Penstock at Center Hill Hydro Plant in DeKalb Co., Tennessee
Another concern for penstock structural integrity is ovalization or out-of-roundness due to
improper installation or design. If this occurs, the penstock diameter should be measured at
various locations along its length and recorded to help monitor any geometric changes. Other
HAP – Best Practice Catalog – Penstocks and Tunnels
Rev. 1.0, 12/21/2011 33
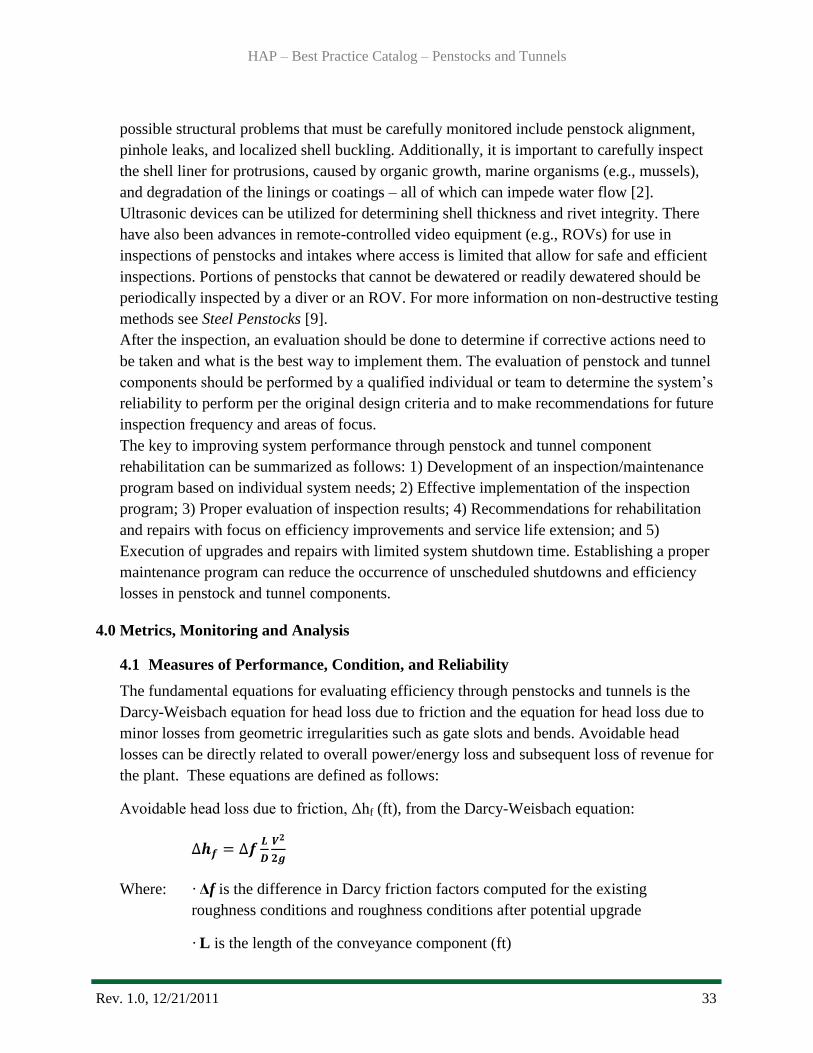
possible structural problems that must be carefully monitored include penstock alignment,
pinhole leaks, and localized shell buckling. Additionally, it is important to carefully inspect
the shell liner for protrusions, caused by organic growth, marine organisms (e.g., mussels),
and degradation of the linings or coatings – all of which can impede water flow [2].
Ultrasonic devices can be utilized for determining shell thickness and rivet integrity. There
have also been advances in remote-controlled video equipment (e.g., ROVs) for use in
inspections of penstocks and intakes where access is limited that allow for safe and efficient
inspections. Portions of penstocks that cannot be dewatered or readily dewatered should be
periodically inspected by a diver or an ROV. For more information on non-destructive testing
methods see Steel Penstocks [9].
After the inspection, an evaluation should be done to determine if corrective actions need to
be taken and what is the best way to implement them. The evaluation of penstock and tunnel
components should be performed by a qualified individual or team to determine the system‘s
reliability to perform per the original design criteria and to make recommendations for future
inspection frequency and areas of focus.
The key to improving system performance through penstock and tunnel component
rehabilitation can be summarized as follows: 1) Development of an inspection/maintenance
program based on individual system needs; 2) Effective implementation of the inspection
program; 3) Proper evaluation of inspection results; 4) Recommendations for rehabilitation
and repairs with focus on efficiency improvements and service life extension; and 5)
Execution of upgrades and repairs with limited system shutdown time. Establishing a proper
maintenance program can reduce the occurrence of unscheduled shutdowns and efficiency
losses in penstock and tunnel components.
4.0 Metrics, Monitoring and Analysis
4.1 Measures of Performance, Condition, and Reliability
The fundamental equations for evaluating efficiency through penstocks and tunnels is the
Darcy-Weisbach equation for head loss due to friction and the equation for head loss due to
minor losses from geometric irregularities such as gate slots and bends. Avoidable head
losses can be directly related to overall power/energy loss and subsequent loss of revenue for
the plant. These equations are defined as follows:
Avoidable head loss due to friction, Δhf (ft), from the Darcy-Weisbach equation:
Where: · Δf is the difference in Darcy friction factors computed for the existing
roughness conditions and roughness conditions after potential upgrade
· L is the length of the conveyance component (ft)

HAP – Best Practice Catalog – Penstocks and Tunnels
Rev. 1.0, 12/21/2011 34
· V is the average flow velocity or flow rate per cross-sectional area (ft/s)
· D is the hydraulic diameter (ft)
· g is the acceleration due to gravity (ft/s2)
Avoidable head loss due to minor losses (e.g., gate slots), Δhm (ft):
Where: · ΔK is the difference in minor head loss coefficients computed for existing wall
irregularities from gate slots and for conditions with irregularities removed by use
of slot fillers after potential upgrades.
· V is the average flow velocity or flow rate per cross-sectional area (ft/s)
· g is the acceleration due to gravity (ft/s2)
Other key values required to complete the computations for avoidable head losses include the
dimensionless Reynolds number, Re, Darcy friction factor, f, kinematic viscosity, v (ft2/s),
and equivalent roughness ε (ft). If the Reynolds number and relative roughness of the
penstock shell or tunnel interior are known, the Darcy friction factor can be determined using
either the Moody diagram or the associated Colebrook-White equation. If exact relative
roughness measurements are unavailable, an approximate Darcy friction factor can be
determined by comparing the existing conditions with charts found in publications such as
Friction Factors for Large Conduits Flowing Full [3], which provide data of measured Darcy
friction factors for various construction materials.
Avoidable power loss, ΔP (MW), associated with Δhf or Δhm:
ΔP = Q γ Δh / 737,562
Where: · Q is the average volumetric flow rate through the plant (ft3/sec)
· γ is the specific weight of water (62.4 lb/ft3)
· Δh is the avoidable head loss
· 737,562 is the conversion from pound-feet per second to megawatts
HAP – Best Practice Catalog – Penstocks and Tunnels
Rev. 1.0, 12/21/2011 35
Avoidable energy loss, ΔE (MWh), associated with Δhf or Δhm:
ΔE = ΔPT
Where: · ΔP is the avoidable power loss (MWh)
· T is the measurement interval (hrs.)
Avoidable revenue loss, ΔR ($), associated with Δhf or Δhm:
ΔR = ME ΔE
Where: · ME is the market value of energy ($/MWh)
· ΔE is the avoidable energy loss
4.2 Data Analysis
Determination of the Potential Performance Level (PPL) will require reference to the flow
characteristics of the modified geometry and/or surface roughness of the penstock or tunnel
components. The PPL will vary for each plant. However, the maximum PPL will be based on
the flow characteristics of the most efficient available upgrade.
The Current Performance Level (CPL) is described by an accurate set of water conveyance
component performance characteristics determined by flow and head measurements and/or
hydraulic modeling of the system.
The Installed Performance Level (IPL) is described by the water conveyance component
performance characteristics at the time of commissioning or at the point when an upgrade or
addition is made. These may be determined from reports and records of efficiency and/or
model testing at the time of commissioning or upgrade.
The CPL should be compared with the IPL to determine decreases in water conveyance
system efficiency over time. Additionally, the PPL should be identified when considering
plant upgrades. For quantification of the PPL with respect to the CPL, see Quantification for
Avoidable Losses and/or Potential Improvements – Integration: Example Calculation.
4.3 Integrated Improvements
The periodic field test results should be used to update the unit operating characteristics and
limits. Optimally, these would be integrated into an automatic system (e.g., Automatic
Generation Control), but if not, hard copies of the data should be made available to all
involved personnel – particularly unit operators, their importance emphasized, and their
ability to be understood confirmed. All necessary upgrades or maintenance (penstock re-

HAP – Best Practice Catalog – Penstocks and Tunnels
Rev. 1.0, 12/21/2011 36
lining, penstock cleaning, etc) and methods to routinely monitor unit performance should be
implemented.
Integration: Example Calculation
A theoretical hydroelectric plant has three girth-welded steel penstocks integral with the dam
structure. The interior of the penstocks has significantly corroded over time. The hydraulic
properties of each penstock are as follows:
Length = 600 ft
Diameter = 14 ft
Average flow = 2200 cfs
Average velocity = 14 ft/s
If the penstocks are treated with a silicone-based coating system, the decrease in head loss
can be calculated as follows:
Surface roughness of existing penstocks (corroded steel w/ welded girth joints) = 0.005 ft
Relative roughness of existing penstocks = (0.005 ft) / (14 ft) = 3.6 x 10⁻⁴
Surface roughness of silicone coating = 0.000005 ft
Relative roughness of silicone coating = (0.000005 ft) / (14 ft) = 3.6 x 10⁻⁷
Re = (14 ft/s)(14 ft) / (1.0 x 10⁻⁵
ft2/s) = 1.9 x 10
7
From the Moody diagram:
fexisting = 0.016
fsilicone = 0.008 → Δf = 0.016 – 0.008 = 0.008
The decrease in head loss per penstock:
Δhf = (0.008) [(600 ft) / (14 ft)] [(14 ft/s)2 / 2(32.2ft/s
2)] = 1.04 ft
The decrease in head loss in all three penstocks:
Δhf = 3 (1.04 ft) = 3.13 ft
The increase in power production can be calculated as:
ΔP = (2200 cfs)(62.4 pcf)(3.13 ft) / 737,562 = 0.583 MW
HAP – Best Practice Catalog – Penstocks and Tunnels
Rev. 1.0, 12/21/2011 37
At an estimated market value of energy of $65/MWh, and assuming the plant produces
power 75% of the time, the market value of increased power production can be calculated as:
0.75 (0.583 MW)($65/MWh)(8,760 hours/year) = $250,000/year
This analysis indicates an available energy and revenue increase over the performance assessment
interval.
5.0 Information Sources:
Baseline Knowledge:
Bureau of Reclamation, Veesaert, Chris J., Inspection of Spillways, Outlet Works and
Mechanical Equipment, National Dam Safety Program Technical Seminar Session XVI,
February 2007.
Bureau of Reclamation, McStraw, Bill, Inspection of Steel Penstocks and Pressure Conduits,
Facilities Instructions, Standards, and Techniques, Volumes 2-8, September 1996.
Bureau of Reclamation, Friction Factors for Large Conduits Flowing Full, A Water
Resources Technical Publication, Engineering Monograph No. 7, Reprinted 1992.
Pejovic, Boldy and Obradovic, Guidelines to Hydraulic Transient Analysis. Gower
Publishing Company, Brookfield, Vermont. 1987.
Hydro Life Extension Modernization Guide, Volume 3: Electromechanical Equipment, EPRI,
Palo Alto, CA: 2001. TR-112350-V3.
State of the Art:
Electric Power Research Institute (EPRI), Steel Penstock – Coating and Lining
Rehabilitation: A Hydropower Technology Round-Up Report, Volume 3, TR-113584-V3,
2000.
American Society of Civil Engineers (ASCE), Civil Works for Hydroelectric Facilities –
Guidelines for Life Extension and Upgrade, ASCE Hydropower Task Committee, 2007.
Kahl, Thomas L., Restoring Aging Penstocks, Hydro Review, December 1992.
Standards:
EPRI, Increased Efficiency of Hydroelectric Power, EM-2407, Research Project 1745-1,
Final Report, June 1982.
ASCE, Steel Penstocks, ASCE Manuals and Reports on Engineering Practice No. 79, 1993.
United States Army Corps of Engineers (USACE), Engineering and Design – Tunnels and
Shafts in Rock, EM 1110-2-2901, May 1997.

HAP – Best Practice Catalog – Penstocks and Tunnels
Rev. 1.0, 12/21/2011 38
USACE, Engineering and Design – Hydraulic Design of Reservoir Outlet Works, EM 1110-
2-1602, October 1980
Best Practice Catalog
Flumes and Open Channels
Revision 1.0, 12/02/2011

HAP – Best Practice Catalog – Flumes and Open Channels
Rev. 1.0, 12/08/2011 40
Contents 1.0 Scope and Purpose .................................................................................................................. 41
1.1 Hydropower Taxonomy Position ........................................................................................ 41
1.1.1 Components ................................................................................................................. 41
1.2 Summary of Best Practices ................................................................................................. 43
1.2.1 Performance/Efficiency & Capability - Oriented Best Practices ........................... 43
1.2.2 Reliability/Operations & Maintenance - Oriented Best Practices .......................... 43
1.3 Best Practice Cross-references ............................................................................................ 44
2.0 Technology Design Summary................................................................................................. 44
2.1 Material and Design Technology Evolution ....................................................................... 44
2.2 State of the Art Technology ................................................................................................ 45
3.0 Operation and Maintenance Practices ..................................................................................... 46
3.1 Condition Assessment......................................................................................................... 46
3.2 Operations ........................................................................................................................... 48
3.3 Maintenance ........................................................................................................................ 49
4.0 Metrics, Monitoring and Analysis .......................................................................................... 52
4.1 Measures of Performance, Condition, and Reliability ........................................................ 52
4.2 Data Analysis ...................................................................................................................... 54
4.3 Integrated Improvements .................................................................................................... 55
5.0 Information Sources: ............................................................................................................... 55
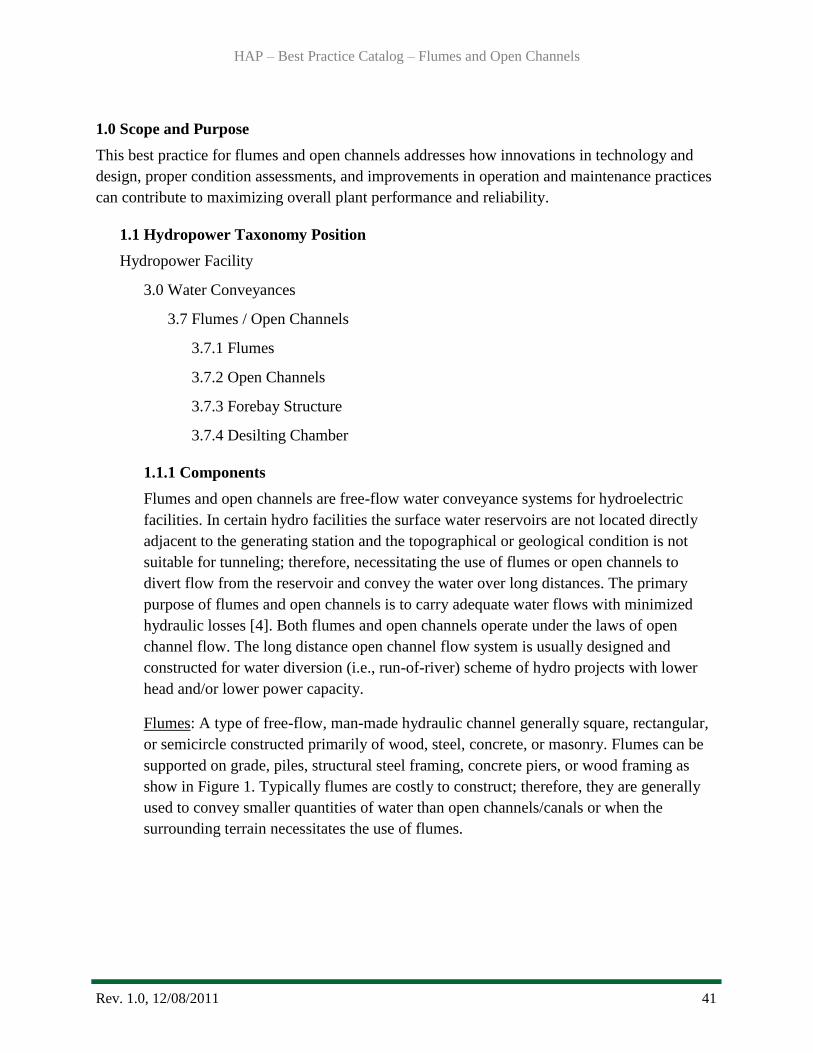
HAP – Best Practice Catalog – Flumes and Open Channels
Rev. 1.0, 12/08/2011 41
1.0 Scope and Purpose
This best practice for flumes and open channels addresses how innovations in technology and
design, proper condition assessments, and improvements in operation and maintenance practices
can contribute to maximizing overall plant performance and reliability.
1.1 Hydropower Taxonomy Position
Hydropower Facility
3.0 Water Conveyances
3.7 Flumes / Open Channels
3.7.1 Flumes
3.7.2 Open Channels
3.7.3 Forebay Structure
3.7.4 Desilting Chamber
1.1.1 Components
Flumes and open channels are free-flow water conveyance systems for hydroelectric
facilities. In certain hydro facilities the surface water reservoirs are not located directly
adjacent to the generating station and the topographical or geological condition is not
suitable for tunneling; therefore, necessitating the use of flumes or open channels to
divert flow from the reservoir and convey the water over long distances. The primary
purpose of flumes and open channels is to carry adequate water flows with minimized
hydraulic losses [4]. Both flumes and open channels operate under the laws of open
channel flow. The long distance open channel flow system is usually designed and
constructed for water diversion (i.e., run-of-river) scheme of hydro projects with lower
head and/or lower power capacity.
Flumes: A type of free-flow, man-made hydraulic channel generally square, rectangular,
or semicircle constructed primarily of wood, steel, concrete, or masonry. Flumes can be
supported on grade, piles, structural steel framing, concrete piers, or wood framing as
show in Figure 1. Typically flumes are costly to construct; therefore, they are generally
used to convey smaller quantities of water than open channels/canals or when the
surrounding terrain necessitates the use of flumes.
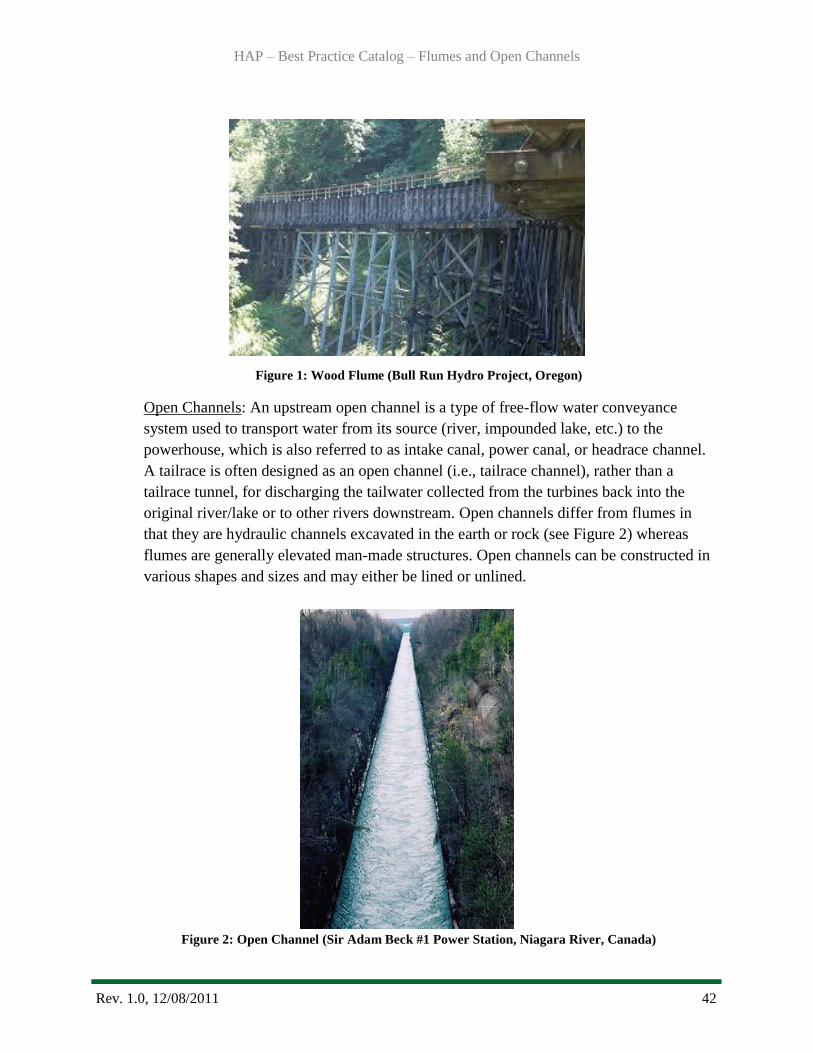
HAP – Best Practice Catalog – Flumes and Open Channels
Rev. 1.0, 12/08/2011 42
Figure 1: Wood Flume (Bull Run Hydro Project, Oregon)
Open Channels: An upstream open channel is a type of free-flow water conveyance
system used to transport water from its source (river, impounded lake, etc.) to the
powerhouse, which is also referred to as intake canal, power canal, or headrace channel.
A tailrace is often designed as an open channel (i.e., tailrace channel), rather than a
tailrace tunnel, for discharging the tailwater collected from the turbines back into the
original river/lake or to other rivers downstream. Open channels differ from flumes in
that they are hydraulic channels excavated in the earth or rock (see Figure 2) whereas
flumes are generally elevated man-made structures. Open channels can be constructed in
various shapes and sizes and may either be lined or unlined.
Figure 2: Open Channel (Sir Adam Beck #1 Power Station, Niagara River, Canada)
HAP – Best Practice Catalog – Flumes and Open Channels
Rev. 1.0, 12/08/2011 43
Forebay Structure: The primary function of a forebay structure is to provide limited
storage for hydroelectric facilities during operational changes. These structures are
typically sized to provide the initial water supply needed when increasing plant output
while water in conveyance components is being accelerated; as well as to accept the
rejection or surplus water due to a decrease in plant output. Forebay structures may be a
separate head pond or integral with the intake canal or open channel [4].
De-silting Chamber: A tank or chamber generally located upstream from water
conveyance systems used to trap suspended silt load, pebbles, etc. so as to minimize
erosion damage to the turbine runner.
1.2 Summary of Best Practices
1.2.1 Performance/Efficiency & Capability - Oriented Best Practices
Routine monitoring and recording of head loss through flumes and open channels.
Trend head loss through flumes and open channels comparing Current
Performance Level (CPL) to Potential Performance Level (PPL) to trigger
feasibility studies of major upgrades.
Maintain documentation of Installed Performance Level (IPL) and update when
modifications to components are made (e.g., replacement of liner).
Include industry acknowledged ―up-to-date‖ choices for flume and open channel
design component materials and maintenance practices to plant engineering
standards.
1.2.2 Reliability/Operations & Maintenance - Oriented Best Practices
Develop a routine inspection and maintenance plan.
Routinely inspect flume supports for signs of settlement or erosion.
Regularly inspect structural joints for leakage, corroded or missing rivets or
bolts, cracked welds, damage, etc.
Routinely clean and remove debris from flumes and open channels.
Routinely inspect and maintain debris removing systems (i.e. trash boom).
Periodically remove sedimentation by dredging, flushing, vacuum extraction, or
other available methods.
Document any operational changes such as an increase in the Probable
Maximum Flood (PMF), changes in flow requirements due to unit upgrades,
changes in seismic criteria, or changes in operational regimes to compare with
the original design criteria to ensure that the water conveyance component is
functioning optimally and safely.
HAP – Best Practice Catalog – Flumes and Open Channels
Rev. 1.0, 12/08/2011 44
As compared with a headrace channel, a tailrace channel is usually shorter and
flow velocities are slower; therefore, head loss and water loss are less of a
concern. However, flow capacity and safety of tailrace operations should not be
compromised (i.e., sudden blockage of the tailrace might cause a severe
accident).
1.3 Best Practice Cross-references
Civil – Trash Racks and Intakes Best Practice
Civil – Leakage and Releases Best Practice
Civil – Penstocks, Tunnels, and Surge Tanks Best Practice
Civil – Draft Tube Gates Best Practice
2.0 Technology Design Summary
2.1 Material and Design Technology Evolution
Channel liners can be used to increase the hydraulic performance of open channels and
flumes. Historically, open channels have been unlined or lined with erodible material such as
sand or gravel. Unlined channels are plagued by several operational and maintenance-related
issues such as erosion of embankment slope material, water seepage, hydraulic losses due to
frictional resistance, and loss of hydraulic area due to vegetation growth or buildup of eroded
material. Linings can improve hydraulic performance by improving discharging capacity,
reducing frictional head losses, improving operational efficiency, extending channel life
expectancy, preventing buildup due to vegetation such as weeds, reducing maintenance costs,
and reducing seepage losses [1]. There have been recent innovations in liner materials and
application processes. The use of geo-membranes has been used in recent years due to its
ease of application and water-tightness.
The US Bureau of Reclamation conducted a 10 year study of various channel lining
arrangements and their effectiveness on reducing seepage [5]. The three primary
arrangements included concrete, exposed geomembranes, and a combination of concrete with
a geomembrane under-liner. The concrete liner proved to have excellent durability; however,
the long term effectiveness of preventing seepage was poor due to cracking. The installation
and maintenance of a concrete liner is generally cost effective since plants are familiar with
concrete and better equipped to provide routine maintenance such as crack repair. Figure 3
shows an example of a canal concrete lining project. The exposed geomembrane liner proved
to be very effective in reducing or eliminating water losses due to seepage; however, they are
more susceptible to damage than concrete and have a shorter service life (15 to 20 years) [5].
Geomembranes have a lower initial installation and maintenance cost, but the long term
maintenance costs can be almost twice as much as concrete. This is due to the fact that plant
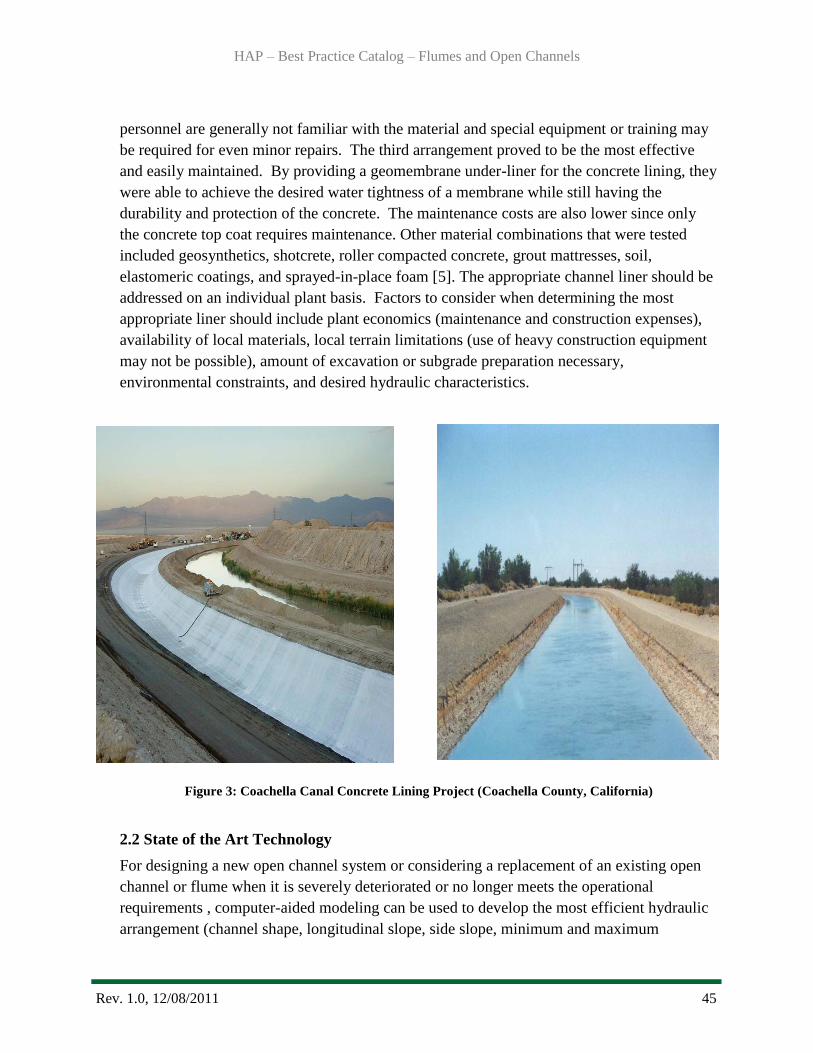
HAP – Best Practice Catalog – Flumes and Open Channels
Rev. 1.0, 12/08/2011 45
personnel are generally not familiar with the material and special equipment or training may
be required for even minor repairs. The third arrangement proved to be the most effective
and easily maintained. By providing a geomembrane under-liner for the concrete lining, they
were able to achieve the desired water tightness of a membrane while still having the
durability and protection of the concrete. The maintenance costs are also lower since only
the concrete top coat requires maintenance. Other material combinations that were tested
included geosynthetics, shotcrete, roller compacted concrete, grout mattresses, soil,
elastomeric coatings, and sprayed-in-place foam [5]. The appropriate channel liner should be
addressed on an individual plant basis. Factors to consider when determining the most
appropriate liner should include plant economics (maintenance and construction expenses),
availability of local materials, local terrain limitations (use of heavy construction equipment
may not be possible), amount of excavation or subgrade preparation necessary,
environmental constraints, and desired hydraulic characteristics.
Figure 3: Coachella Canal Concrete Lining Project (Coachella County, California)
2.2 State of the Art Technology
For designing a new open channel system or considering a replacement of an existing open
channel or flume when it is severely deteriorated or no longer meets the operational
requirements , computer-aided modeling can be used to develop the most efficient hydraulic
arrangement (channel shape, longitudinal slope, side slope, minimum and maximum
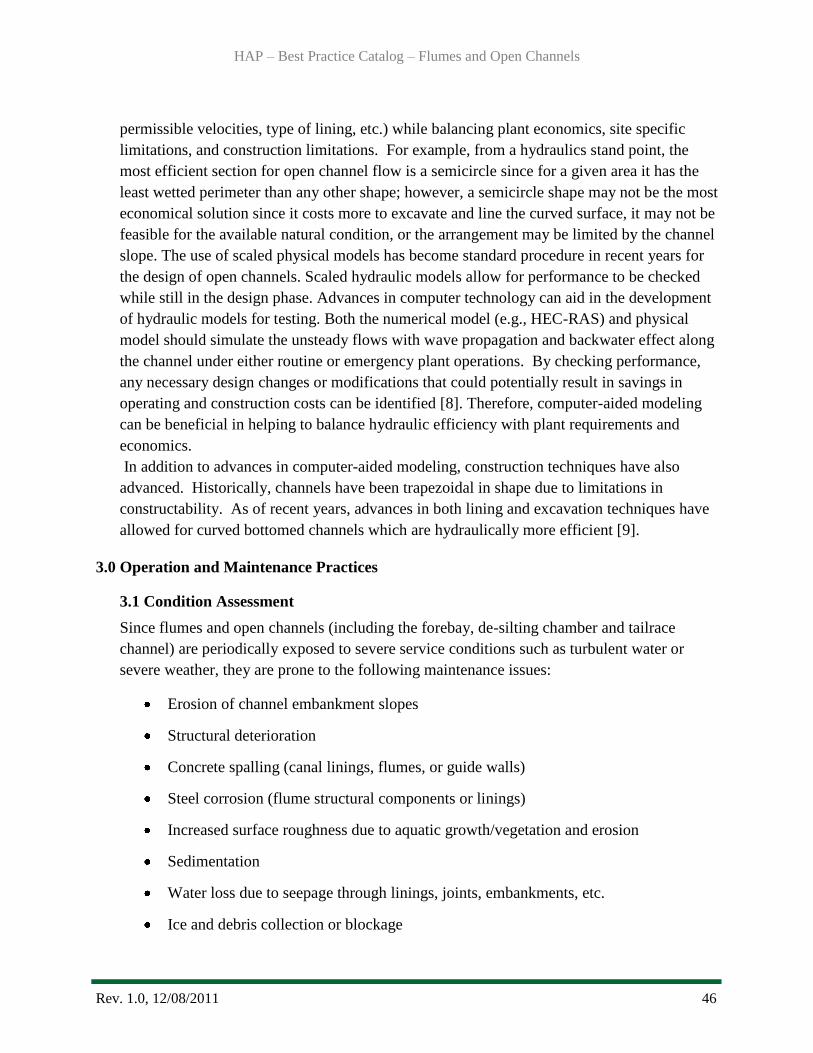
HAP – Best Practice Catalog – Flumes and Open Channels
Rev. 1.0, 12/08/2011 46
permissible velocities, type of lining, etc.) while balancing plant economics, site specific
limitations, and construction limitations. For example, from a hydraulics stand point, the
most efficient section for open channel flow is a semicircle since for a given area it has the
least wetted perimeter than any other shape; however, a semicircle shape may not be the most
economical solution since it costs more to excavate and line the curved surface, it may not be
feasible for the available natural condition, or the arrangement may be limited by the channel
slope. The use of scaled physical models has become standard procedure in recent years for
the design of open channels. Scaled hydraulic models allow for performance to be checked
while still in the design phase. Advances in computer technology can aid in the development
of hydraulic models for testing. Both the numerical model (e.g., HEC-RAS) and physical
model should simulate the unsteady flows with wave propagation and backwater effect along
the channel under either routine or emergency plant operations. By checking performance,
any necessary design changes or modifications that could potentially result in savings in
operating and construction costs can be identified [8]. Therefore, computer-aided modeling
can be beneficial in helping to balance hydraulic efficiency with plant requirements and
economics.
In addition to advances in computer-aided modeling, construction techniques have also
advanced. Historically, channels have been trapezoidal in shape due to limitations in
constructability. As of recent years, advances in both lining and excavation techniques have
allowed for curved bottomed channels which are hydraulically more efficient [9].
3.0 Operation and Maintenance Practices
3.1 Condition Assessment
Since flumes and open channels (including the forebay, de-silting chamber and tailrace
channel) are periodically exposed to severe service conditions such as turbulent water or
severe weather, they are prone to the following maintenance issues:
Erosion of channel embankment slopes
Structural deterioration
Concrete spalling (canal linings, flumes, or guide walls)
Steel corrosion (flume structural components or linings)
Increased surface roughness due to aquatic growth/vegetation and erosion
Sedimentation
Water loss due to seepage through linings, joints, embankments, etc.
Ice and debris collection or blockage

HAP – Best Practice Catalog – Flumes and Open Channels
Rev. 1.0, 12/08/2011 47
Deterioration of linings
Foundation settlement or deterioration
Instability of adjacent slopes
It is important that flumes and open channels be routinely inspected for not only efficiency
related maintenance issues but also safety, since failure of a flume or channel can have dire
consequences. Condition assessments are primarily conducted by visual examination and
physical measurements. The purpose of any water conveyance condition assessment is to
determine the structural integrity of the components, the remaining life expectancy, and any
necessary upgrades to improve overall efficiency. A visual inspection typically includes
assessments of corrosion, lining deterioration, joint conditions (bolts, weld, etc.), evidence of
embankment erosion or instability, foundation conditions, stability of supporting and
adjacent earth slopes, and flow blockage due to debris or ice accumulation. Since the
interiors of flumes and open channels are often underwater and difficult to inspect, it is
recommended that when components are required to be dewatered for other reasons, the plant
should inspect the interiors and remove any debris or buildup of sedimentation. Flume
exteriors should be visually inspected for any signs of leakage while in operation.
Data records from previous inspections, maintenance, and upgrades should be obtained. By
reviewing any previous records potential problems can more easily be identified such as
worsening conditions or chronic issues. It is important to identify any previous repairs or
repair recommendations that might not have been implemented. Another key to an effective
inspection plan is to review the original design documents. This can help to identify if: 1)
obsolete construction methods were used such as copper waterstops or unlined channels, 2)
there are any obsolete components, configurations, equipment, or other features in use such
as poor hydraulic shape for channels, 3) materials are nearing the end of their life
expectancy, 4) there were any problems encountered during construction such as a fault zone
across a channel or a soft zone in the foundation material, 5) inadequate inspection during
construction, and 6) foundation issues such as geologic faults or differential settlement [3].
Plants should schedule routine and thorough inspections of all flume and open channel
components. This will help to identify defects or other maintenance issues so that
unscheduled shutdowns for repairs can be minimized. When developing an inspection
program, it is also important to acquire information regarding operational records which
should show any changes in operation or upgrades. It will allow for comparison of current
operating conditions with the original design criteria.
The frequency and extent of condition assessments will be based on various plant and site
specific factors including accessibility, age of structure or component, previous maintenance
or reliability issues, public safety or environmental concerns, changes in operation, etc. An
efficient and comprehensive inspection plan should be developed after considering all
HAP – Best Practice Catalog – Flumes and Open Channels
Rev. 1.0, 12/08/2011 48
contributing factors. If significant issues are discovered during the condition assessment, then
the plant should have a qualified engineer perform a special inspection to determine what
repairs are necessary or if replacement is required. It is also recommended that plants
perform special inspections after floods, earthquakes, or any other unusual event (e.g., load
rejection) that may have resulted in damage [3].
3.2 Operations
Routine removal of debris and ice should be performed using trash/ice booms or similar. If
debris or ice buildup is a recurrent issue, it is recommended that the plant consider installing
permanent structures for aid in removal. Sedimentation can also have a negative impact on
plant operations. Sediment should be routinely removed using methods such as dredging,
vacuum extraction, flushing, mining dry while conveyance system is dewatered, or in more
severe instances the addition of a stilling basin upstream to allow settlement of sedimentation
or a sediment collection device. Also, increasing the flow velocity by reducing channel cross-
sectional area can help the flow achieve ‗flushing velocity‘; however, this is generally only a
consideration in new design. By achieving the ‗flushing velocity‘, accumulation of
sedimentation is reduced; however, the sediment is passed downstream where it might still
pose operational or maintenance issues such as turbine erosion. The addition of a de-silting
chamber can also be installed upstream to help trap suspended silt particles. Buildup of
sedimentation can increase surface roughness and reduce cross-sectional area, therefore
increasing head losses due to frictional resistance. In addition, the removal of debris or ice
buildup can increase flow. Thus routine cleaning practices can improve hydraulic
performance through water conveyance systems and increase overall plant efficiency. It is
important to note that not only does debris and ice buildup have a negative effect on
operation, they can also cause blockage and lead to failure as was the case with the forebay
skimmer wall failure at the Safe Harbor Hydroelectric Project in Pennsylvania as a result of
ice accumulation [4].
Plants should routinely evaluate any changes in the Probable Maximum Flood (PMF) from
the original design criteria. If the PMF increases, structures should be re-evaluated through
hydraulic model tests to determine that the existing conveyance system is still adequate.
Miscalculation of PMF in the original design or failure to account for changes in PMF from
recent hydrological analysis of watershed, may lead to overtopping of the canal embankment
or failure. If the structural integrity of the system is not compromised, an increase in PMF
can be addressed by raising channel embankments or constructing parapet walls; however, in
some cases construction of a new conveyance system may be necessary [4].
Another important phenomena to consider in channel operations is hydraulic jump or
hydraulic drop (fall). When high velocity flow (supercritical) is introduced to a section of
slow moving flow (subcritical) resulting in a rapid reduction of flow velocity over a short
HAP – Best Practice Catalog – Flumes and Open Channels
Rev. 1.0, 12/08/2011 49
length, the channel will experience an abrupt rise in water surface known as a hydraulic
jump. Alternatively, a hydraulic drop is caused by the introduction of subcritical flow to
supercritical flow causing a rapid increase in flow velocity and abrupt drop in water surface
level. Sudden changes in channel bed slope can result in hydraulic jumps or drops.
Hydraulic jumps and drops in the intake channel can negatively affect plant efficiency by
dissipating energy and leading to head loss. Hydraulic jumps can be avoided by ensuring that
transitions at the intake channel are gradual. Alternatively, hydraulic jumps may be desirable at the
discharge when erosion in the downstream channel or river is a concern. Through hydraulic jump
basins, the discharge energy can be dissipated before flow is returned to the downstream channel
limiting erosion problems [2]. If hydraulic jumps or drops are observed, plants should consider
further investigation into how the phenomena is impacting operations and if corrective action is
warranted. Generally, this occurrence is only considered during the initial design since any upgrades
to reduce jumps or drops are not economically feasible for improving efficiency alone.
Other operational considerations include increased flow requirements due to unit upgrades,
changes in seismic criteria, changes in operational regimes, or any condition changes
unaccounted for in the original design such as degradation conditions or increased surface
roughness; as well as potential emergency circumstances (e.g., load rejection causing wave
propagation and backwater effect) when the operational regimes and conditions have been
changed. Plant personnel should routinely evaluate flumes and open channels to ensure that
they are functioning properly and efficiently for the current operational characteristics.
3.3 Maintenance
Flumes and open channels are designed to convey water from its source (river, lake,
reservoir, etc.) over a long distance to the intake or pressurized conduit (penstock or tunnel)
or discharge water from the powerhouse to the downstream river/lake, while limiting losses
due to hydraulic friction, seepage, and leakage. Reduction of these losses through installation
or repair of a liner or replacement of the conveyance system can help improve plant
efficiency and generation; however, these upgrades can be costly and not likely justifiable on
the grounds of reducing head losses alone [7]. Therefore, upgrade or replacement of a water
conveyance component such as flumes or open channels is generally only viable if safety of
the structure is a concern, the component no longer satisfies the operating requirements, there
is significant seepage or erosion, or the water conveyance has severe degradation. Since
upgrades or replacement can be costly, it is important to routinely perform any necessary
maintenance or life-extending repairs so as to limit unscheduled shutdowns which can affect
plant availability and generation.
Foundations and supports should be regularly checked for signs of seepage. Seepage is the
slow percolation of water through an embankment or foundation [3]. Seepage not only
results in loss of water it can also saturate the supporting soil and either undermine the
foundation or cause it to shift or collapse. Other foundation issues can include erosion,

HAP – Best Practice Catalog – Flumes and Open Channels
Rev. 1.0, 12/08/2011 50
settlement which can lead to misalignment, foundation faults, heaving due to expansive
foundation material such as clay. Erosion and stability of surrounding slopes are also a
concern. Eroded material from surrounding slopes can cause blockages in channels or
increase the hydraulic roughness. Failure of a surrounding slope can also negatively impact
the structural integrity of flumes and channels, as was the case with the Ocoee River Flume
in Tennessee. In April 2010, a rock slide destroyed a 70 ft section of the historic wood
flume. The rock slope was stabilized using 90 bolts, some 40 ft long as shown in Figure 4
[6]. Other means of slope stabilization can include the addition of retaining structures or
shotcrete. If large amounts of sloughed materials from surrounding slopes are present in
flumes and channels, further investigation of slope stability is warranted.
Figure 4: Slope Stabilization (Ocoee River Flume, Ocoee, Tennessee)
Photo Courtesy of J. Miles Cary

HAP – Best Practice Catalog – Flumes and Open Channels
Rev. 1.0, 12/08/2011 51
Figure 5: Wood Flume Repair (Ocoee River Flume, Ocoee, Tennessee)
Photo Courtesy of Jason Huffine/TVA
It is critical that any obstructions within flumes or open channels be removed promptly so
that the flow capacity is not negatively impacted. Obstructions can result from overgrown
vegetation, aquatic growth, sloughed materials from adjacent slope failures, debris such as
dead trees or limbs, or ice accumulation [3]. Obstructions such as these will not only impede
the flow capacity, but can also lead to damage of the structure or liner, increased hydraulic
roughness, or sudden failure due to blockage. Debris should be routinely removed so as to
avoid buildup.
Since flumes and open channels are often subject to turbulent flow, concrete liners,
structures, or foundations are likely to experience a range of concrete problems. These issues
include cracking, surface defects, cavitation, erosion, and leakage at joints. Concrete cracking
is a common phenomenon in hydroelectric facilities and does not necessarily require
immediate action. Cracks should, however, be routinely monitored, measured, and
documented for future comparison. It is necessary to have ongoing records documenting any
cracks so that any significant changes can be identified. If new cracks suddenly appear or
existing cracks become more severe or extensive, then further investigation by a qualified
engineer is warranted [3]. Concrete surface defects may include shallow deficiencies in the
concrete surface, textural defects from improper installation, and localized damage caused by
debris [3]. Any surface defects should be recorded and any necessary repairs performed.
Concrete deterioration due to either cavitation or erosion should be routinely monitored and
repaired as necessary. Concrete repairs can include shotcrete applications, localized grouting
of cracks, replacement or patching, or overlays for concrete liners.
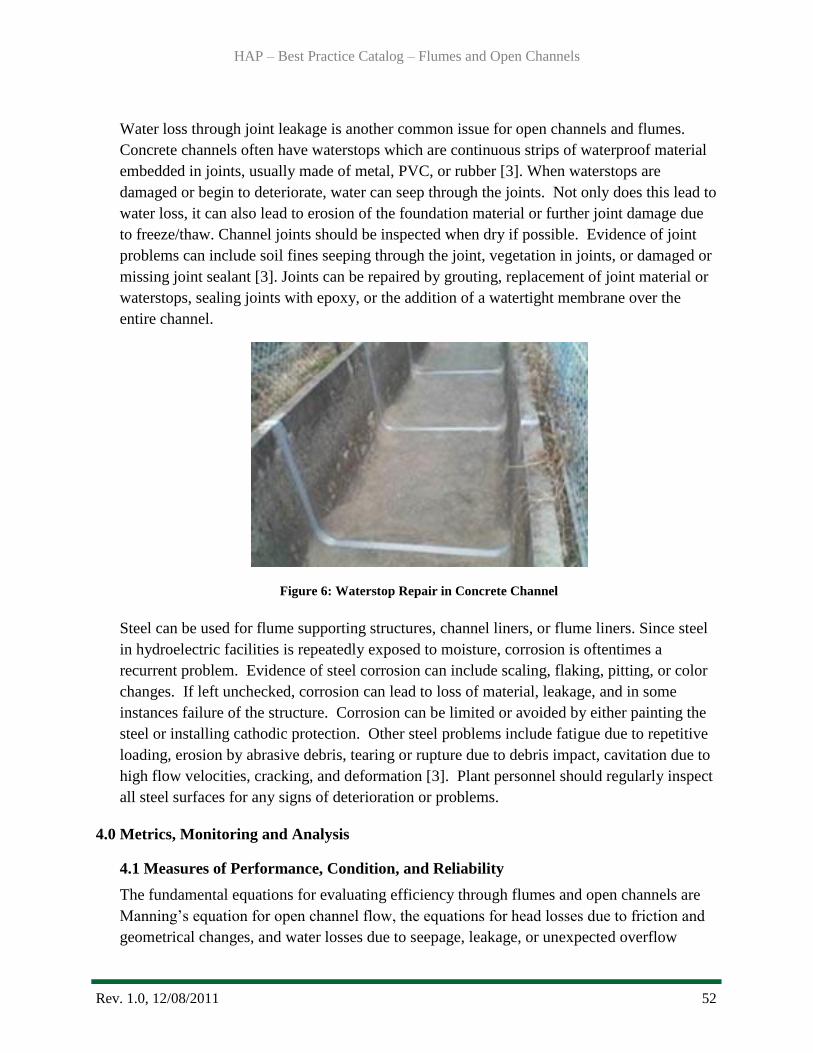
HAP – Best Practice Catalog – Flumes and Open Channels
Rev. 1.0, 12/08/2011 52
Water loss through joint leakage is another common issue for open channels and flumes.
Concrete channels often have waterstops which are continuous strips of waterproof material
embedded in joints, usually made of metal, PVC, or rubber [3]. When waterstops are
damaged or begin to deteriorate, water can seep through the joints. Not only does this lead to
water loss, it can also lead to erosion of the foundation material or further joint damage due
to freeze/thaw. Channel joints should be inspected when dry if possible. Evidence of joint
problems can include soil fines seeping through the joint, vegetation in joints, or damaged or
missing joint sealant [3]. Joints can be repaired by grouting, replacement of joint material or
waterstops, sealing joints with epoxy, or the addition of a watertight membrane over the
entire channel.
Figure 6: Waterstop Repair in Concrete Channel
Steel can be used for flume supporting structures, channel liners, or flume liners. Since steel
in hydroelectric facilities is repeatedly exposed to moisture, corrosion is oftentimes a
recurrent problem. Evidence of steel corrosion can include scaling, flaking, pitting, or color
changes. If left unchecked, corrosion can lead to loss of material, leakage, and in some
instances failure of the structure. Corrosion can be limited or avoided by either painting the
steel or installing cathodic protection. Other steel problems include fatigue due to repetitive
loading, erosion by abrasive debris, tearing or rupture due to debris impact, cavitation due to
high flow velocities, cracking, and deformation [3]. Plant personnel should regularly inspect
all steel surfaces for any signs of deterioration or problems.
4.0 Metrics, Monitoring and Analysis
4.1 Measures of Performance, Condition, and Reliability
The fundamental equations for evaluating efficiency through flumes and open channels are
Manning‘s equation for open channel flow, the equations for head losses due to friction and
geometrical changes, and water losses due to seepage, leakage, or unexpected overflow

HAP – Best Practice Catalog – Flumes and Open Channels
Rev. 1.0, 12/08/2011 53
(water loss from evaporation is minimal and unavoidable) [2 and 9]. Losses due to leakages
or unexpected overflow are more difficult to quantify and require more detailed analysis
based on a plant specific basis. Avoidable head losses can be directly related to overall
power/energy loss and subsequent loss of revenue for the plant. These equations are defined
as follows:
Flow quantity, Q (ft3/sec):
Where: · Q is the flow quantity (ft3/sec)
· n is the Manning roughness coefficient
· A is the cross-sectional area (ft2)
· R is the hydraulic radius (ft)
· S is the slope of energy line or energy gradient (ft/ft)
Head loss due to friction, hf (ft):
Where: · hf is the head loss due to friction through the conveyance component (ft)
· n is the difference in Manning roughness coefficients for existing roughness
conditions and roughness conditions after potential upgrades.
· L is the length of the conveyance component (ft)
· v is the average flow velocity or flow rate per cross-sectional area (ft/sec)
· R is the hydraulic radius (ft)
Head loss due to minor losses (e.g. channel bends, adjacent slopes), hm (ft):
Where: · hm is the head loss due to minor losses from geometrical changes (ft)
· Kb is the difference in the head loss coefficient for existing conditions and for
conditions after potential upgrades computed as follows for channel bends:
· W is the channel width (ft)
· Rc is the center-line radius of the channel curve (ft)

HAP – Best Practice Catalog – Flumes and Open Channels
Rev. 1.0, 12/08/2011 54
· V is the mean velocity or flow rate per cross-sectional area (ft/s)
· g is the acceleration due to gravity (ft/s2)
Moritz formula for water losses due to seepage in unlined channels, S (ft3/s/mile):
Where: · S is the losses due to seepage (ft3/s/mile)
· C is the rate of water loss (ft3/24 hours/1 ft
2 of wetted area). Average values of C
can range from 2.20 for sandy soils to 0.41 for clays.
· Q is the flow quantity (ft3/s)
· V is the mean velocity (ft/s)
Avoidable power loss, ΔP (MW), associated with head losses:
ΔP = (Q γ Δh+ ΔQ γ h) / 737,562
Where: · Q is the average volumetric flow rate through the water conveyance component
(ft3/sec)
· γ is the specific weight of water (62.4 lb/ft3)
· Δh is the avoidable head loss
· 737,562 is the conversion from pound-feet per second to megawatts
Avoidable energy loss, ΔE (MWh):
ΔE = ΔPT
Where: · ΔP is the avoidable power loss (MWh)
· T is the measurement interval (hrs.)
Avoidable revenue loss, ΔR ($):
ΔR = ME ΔE
Where: · ME is the market value of energy ($/MWh)
· ΔE is the avoidable energy loss
4.2 Data Analysis
Determination of the Potential Performance Level (PPL) will require reference to the flow
characteristics of the modified geometry and/or surface roughness of the flume or open
HAP – Best Practice Catalog – Flumes and Open Channels
Rev. 1.0, 12/08/2011 55
channel components. The PPL will vary for each plant. However, the maximum PPL will be
based on the flow characteristics of the most efficient available upgrade.
The Current Performance Level (CPL) is described by an accurate set of water conveyance
component performance characteristics determined by flow and head measurements and/or
hydraulic modeling of the system.
The Installed Performance Level (IPL) is described by the water conveyance component
performance characteristics at the time of commissioning or at the point when an upgrade or
addition is made. These may be determined from reports and records of efficiency and/or
model testing at the time of commissioning or upgrade.
The CPL should be compared with the IPL to determine decreases in water conveyance
system efficiency over time. Additionally, the PPL should be identified when considering
plant upgrades.
4.3 Integrated Improvements
The periodic field test results should be used to update the unit operating characteristics and
maintenance practices. Optimally, any test results or observations should be integrated into
an automated system, but if not, hard copies of the data should be made available to all
involved plant personnel (particularly unit operators). All necessary upgrades or maintenance
(channel lining, debris removal, slope stabilization, etc.) and methods to routinely monitor
unit performance should be implemented.
5.0 Information Sources:
Baseline Knowledge:
Professor B.S. Thandaveswara, Hydraulics: Design of Canals, Indian Institute of
Technology Madras.
Bureau of Reclamation, Design of Small Dams, A Water Resources Technical Publication,
3rd
Edition, 1987.
Bureau of Reclamation, Veesaert, Chris J., Inspection of Spillways, Outlet Works, and
Mechanical Equipment, National Dam Safety Program Technical Seminar Session XVI,
February 2007.
Hydro Life Extension Modernization Guide, Volume 4-5 Auxiliary Mechanical and
Electrical Systems, EPRI, Palo Alto, CA: 2001. TR-112350-V4.
State of the Art:
American Society of Civil Engineers (ASCE), Civil Works for Hydroelectric Facilities –
Guidelines for Life Extension and Upgrade, ASCE Hydropower Task Committee, 2007.
Bureau of Reclamation, Canal Lining Demonstration Project – Year 10 Final Report, R-02-
03, November 2002.

HAP – Best Practice Catalog – Flumes and Open Channels
Rev. 1.0, 12/08/2011 56
Tennessee Valley Authority (TVA), Ocoee Flume Resumes Operation, TVA News Release,
April 22, 2011.
Standards:
Electric Power Research Institute (EPRI), Increased Efficiency of Hydroelectric Power, EM-
2407, Research Project 1745-1, Final Report, June 1982.
United States Army Corps of Engineers (USACE), Engineering and Design – Hydraulic Design
of Flood Control Channels, EM 1110-2-1601, June 1994.
Zipparro, Vincent J. and Hans Hasen, Davis’ Handbook of Applied Hydraulics, 4th
Edition, 1993.

Best Practice Catalog
Draft Tube Gates
Revision 1.0, 12/08/2011

HAP – Best Practice Catalog – Draft Tube Gates
Rev. 1.0, 12/08/2011 58
1.0 Scope and Purpose .................................................................................................................. 59
1.1 Hydropower Taxonomy Position ........................................................................................ 59
1.1.1 Components ............................................................................................................. 59
1.2 Summary of Best Practices ................................................................................................. 60
1.2.1 Performance/Efficiency & Capability - Oriented Best Practices ....................... 60
1.2.2 Reliability/Operations & Maintenance - Oriented Best Practices ..................... 60
1.3 Best Practice Cross-References .......................................................................................... 60
2.0 Technology Design Summary ................................................................................................. 61
2.1 Material and Design Technology Evolution ....................................................................... 61
2.2 State of the Art Technology ................................................................................................ 62
3.0 Operation and Maintenance Practices ..................................................................................... 63
3.1 Condition Assessment......................................................................................................... 63
3.2 Operations ........................................................................................................................... 64
3.3 Maintenance ........................................................................................................................ 65
4.0 Metrics, Monitoring and Analysis .......................................................................................... 66
4.1 Measures of Performance, Condition, and Reliability ........................................................ 66
4.2 Data Analysis ...................................................................................................................... 66
4.3 Integrated Improvements .................................................................................................... 66
5.0 Information Sources: ............................................................................................................... 67
HAP – Best Practice Catalog – Draft Tube Gates
Rev. 1.0, 12/08/2011 59
1.0 Scope and Purpose
This best practice for draft tube gates addresses the technology, condition assessment,
operations, and maintenance best practices for the gates and associated operating equipment with
the objective to maximize performance and reliability of plant generating system.
The primary purpose of the draft tube gate is to protect the interior equipment of the hydropower
plant including the turbine by providing a barrier and blocking water flow during maintenance
and dewatering activities. Most draft tube gates fall under the category of “bulkhead gates or
stop logs” that are normally lifted vertically into place and installed under no flow conditions for
maintenance or emergency use. They typically spend a vast majority of their lifecycle in storage
rather than service. The gates may be sectioned or un-sectioned with the sectioned
subassemblies lifted into place individually and stacked vertically. Although different materials
have been used historically, draft tube gates are primarily made from carbon steel and therefore
will be the primary focus for this best practice.
1.1 Hydropower Taxonomy Position
Hydropower Facility → Water Conveyances → Draft Tube Gates
1.1.1 Components
The components of the draft tube gate system are those features that directly or indirectly
contribute to the effectiveness of the maintenance and dewatering operations. The
system is made up of the draft tube gates itself along with the gate operating equipment.
Draft Tube Gate: Also referred to as stop logs or bulkhead gates, these assemblies are
used to block water so that construction, maintenance, or repair work can be
accomplished in a dry environment. These gates are stored in a secure storage yard,
positioned by a crane, and dropped into slots on the pier, which is sometimes integrated
with the dam, to form a wall against the water.
Draft Tube Gate Seals: Gate seals function to close off the open gap between the edge of
a movable structure and a fixed sealing surface so as to prevent any water from passing
through the interface. The seals are typically rubber material, and formed from a flat
strip of rubber, or shaped by a molding or extrusion process.
Draft Tube Gate Hoists: Hoists are mechanical (electrically or manually driven),
hydraulic (oil or water), or pneumatically operated machines used to raise and lower in
place heavy water control features such as gates and stop logs. A lifting beam is
commonly a key component of the hoist system for draft tube gates.
Draft Tube Gate Bearing Structure: Openings are formed in reinforced concrete walls
with dedicated piers at the edge of the openings to hold the draft tube gates in place.
Slots are configured in the concrete piers to match the size and geometry at the edges of
the gate to allow for a tight fit.
HAP – Best Practice Catalog – Draft Tube Gates
Rev. 1.0, 12/08/2011 60
1.2 Summary of Best Practices
1.2.1Performance/Efficiency & Capability - Oriented Best Practices
Monitor leakage and functionality of the draft tube gates and include findings in
the plant’s unit performance records. The plant should rountinely monitor and
maintain a record of unit performance at the Current Performance Level (CPL).
1.2.2Reliability/Operations & Maintenance - Oriented Best Practices
Develop a routine inspection and maintenance plan.
Routinely inspect draft tube gates, seals, hoists, and bearing structure
components for degradation.
Trend draft tube gates, seals, hoists and bearing structure components for
degradation and adjust life expectancy accordingly to ensure that the system has
the appropriate degree of functional reliability.
Routinely inspect and maintain draft tube gate operating hoist and lift
equipment.
Maintain documentation of installed performance level (IPL) and update when
modification to equipment is made (e.g. gate seal replacement/repair, concrete
piers/slots upgrade).
Include industry knowledge for modern draft tube gate system components and
maintenance practices to plant engineering standards.
1.3 Best Practice Cross-References
Civil – Penstocks, Tunnels, and Surge Tanks
Civil – Leakage and Releases
Civil – Trash Racks and Intakes
Civil – Flumes/Open Channels

HAP – Best Practice Catalog – Draft Tube Gates
Rev. 1.0, 12/08/2011 61
2.0 Technology Design Summary
2.1 Material and Design Technology Evolution
Figure 1: Norris Dam – Anderson/Campbell County, TN
A wide variety of draft tube gate designs have been used at hydropower plants over the
course of the last century. Popular designs implemented include slide gates, roller gates, and
stoplogs (wood or steel). As mentioned previously, the most commonly used gate is
constructed of carbon steel members and plate. These steel gates have the advantage of
being relatively inexpensive to construct and can be positioned using standard equipment.
The Norris hydro plant had been in operation for nearly 60 years without dewatering
equipment for the draft tubes. But modernization of the plant could not be accomplished
without dewatering. Shown in Figure 1 is the initial installation of one of the new draft tube
gates supported by the overhead traveling gantry crane connected by the lifting beam. The
overhead gantry and crane rail girder is shown in Figure 2 while undergoing load
testing. Other system components included in the design but not shown are the dewatering
pumps, draft tube gate guides, and seal bearing plates.
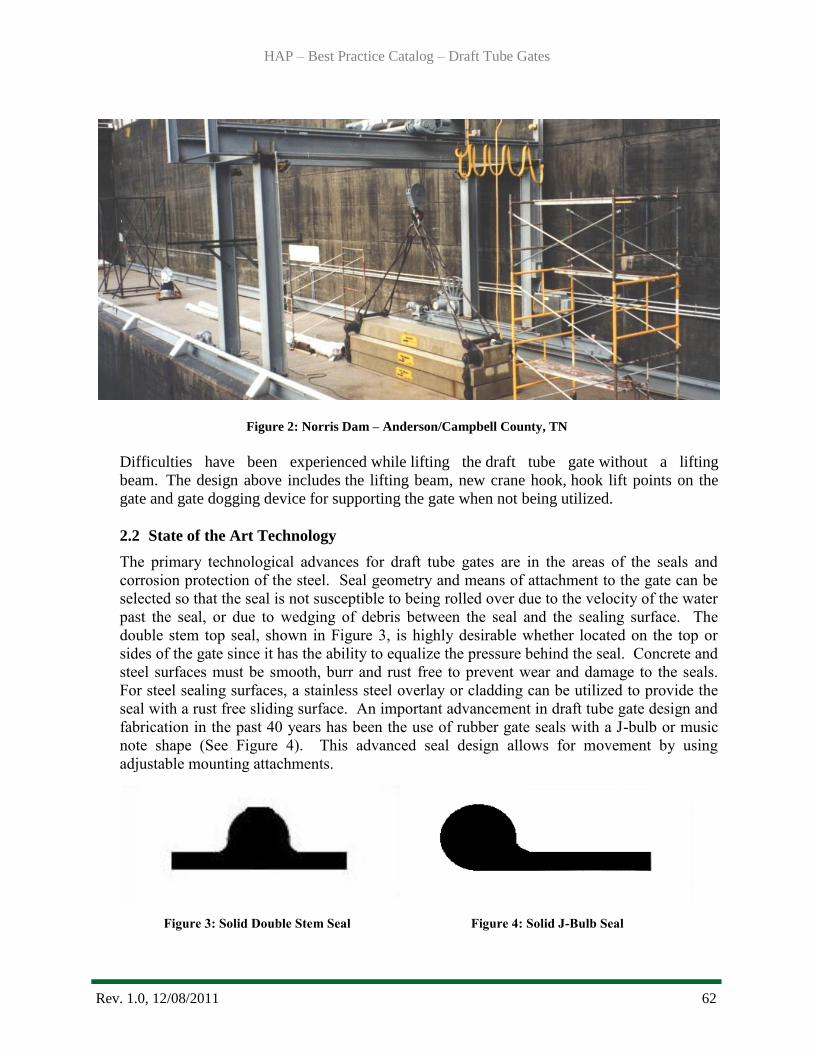
HAP – Best Practice Catalog – Draft Tube Gates
Rev. 1.0, 12/08/2011 62
Figure 2: Norris Dam – Anderson/Campbell County, TN
Difficulties have been experienced while lifting the draft tube gate without a lifting
beam. The design above includes the lifting beam, new crane hook, hook lift points on the
gate and gate dogging device for supporting the gate when not being utilized.
2.2 State of the Art Technology
The primary technological advances for draft tube gates are in the areas of the seals and
corrosion protection of the steel. Seal geometry and means of attachment to the gate can be
selected so that the seal is not susceptible to being rolled over due to the velocity of the water
past the seal, or due to wedging of debris between the seal and the sealing surface. The
double stem top seal, shown in Figure 3, is highly desirable whether located on the top or
sides of the gate since it has the ability to equalize the pressure behind the seal. Concrete and
steel surfaces must be smooth, burr and rust free to prevent wear and damage to the seals.
For steel sealing surfaces, a stainless steel overlay or cladding can be utilized to provide the
seal with a rust free sliding surface. An important advancement in draft tube gate design and
fabrication in the past 40 years has been the use of rubber gate seals with a J-bulb or music
note shape (See Figure 4). This advanced seal design allows for movement by using
adjustable mounting attachments.
Figure 3: Solid Double Stem Seal Figure 4: Solid J-Bulb Seal
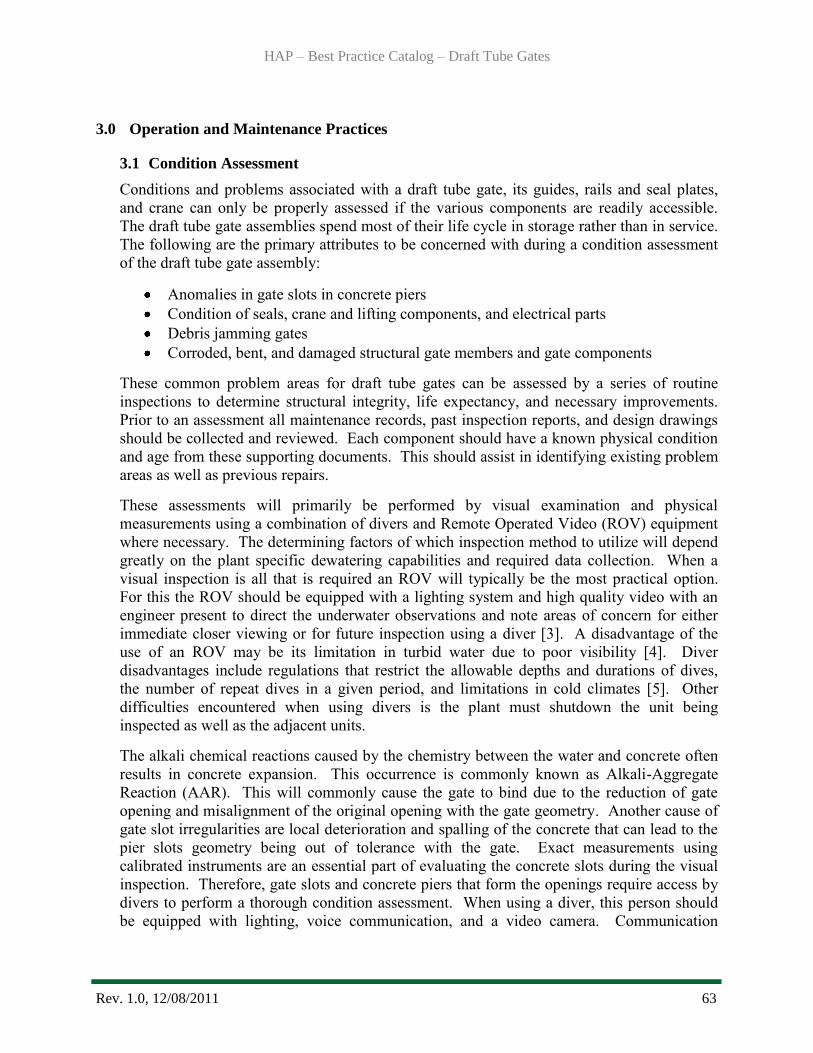
HAP – Best Practice Catalog – Draft Tube Gates
Rev. 1.0, 12/08/2011 63
3.0 Operation and Maintenance Practices
3.1 Condition Assessment
Conditions and problems associated with a draft tube gate, its guides, rails and seal plates,
and crane can only be properly assessed if the various components are readily accessible.
The draft tube gate assemblies spend most of their life cycle in storage rather than in service.
The following are the primary attributes to be concerned with during a condition assessment
of the draft tube gate assembly:
Anomalies in gate slots in concrete piers
Condition of seals, crane and lifting components, and electrical parts
Debris jamming gates
Corroded, bent, and damaged structural gate members and gate components
These common problem areas for draft tube gates can be assessed by a series of routine
inspections to determine structural integrity, life expectancy, and necessary improvements.
Prior to an assessment all maintenance records, past inspection reports, and design drawings
should be collected and reviewed. Each component should have a known physical condition
and age from these supporting documents. This should assist in identifying existing problem
areas as well as previous repairs.
These assessments will primarily be performed by visual examination and physical
measurements using a combination of divers and Remote Operated Video (ROV) equipment
where necessary. The determining factors of which inspection method to utilize will depend
greatly on the plant specific dewatering capabilities and required data collection. When a
visual inspection is all that is required an ROV will typically be the most practical option.
For this the ROV should be equipped with a lighting system and high quality video with an
engineer present to direct the underwater observations and note areas of concern for either
immediate closer viewing or for future inspection using a diver [3]. A disadvantage of the
use of an ROV may be its limitation in turbid water due to poor visibility [4]. Diver
disadvantages include regulations that restrict the allowable depths and durations of dives,
the number of repeat dives in a given period, and limitations in cold climates [5]. Other
difficulties encountered when using divers is the plant must shutdown the unit being
inspected as well as the adjacent units.
The alkali chemical reactions caused by the chemistry between the water and concrete often
results in concrete expansion. This occurrence is commonly known as Alkali-Aggregate
Reaction (AAR). This will commonly cause the gate to bind due to the reduction of gate
opening and misalignment of the original opening with the gate geometry. Another cause of
gate slot irregularities are local deterioration and spalling of the concrete that can lead to the
pier slots geometry being out of tolerance with the gate. Exact measurements using
calibrated instruments are an essential part of evaluating the concrete slots during the visual
inspection. Therefore, gate slots and concrete piers that form the openings require access by
divers to perform a thorough condition assessment. When using a diver, this person should
be equipped with lighting, voice communication, and a video camera. Communication
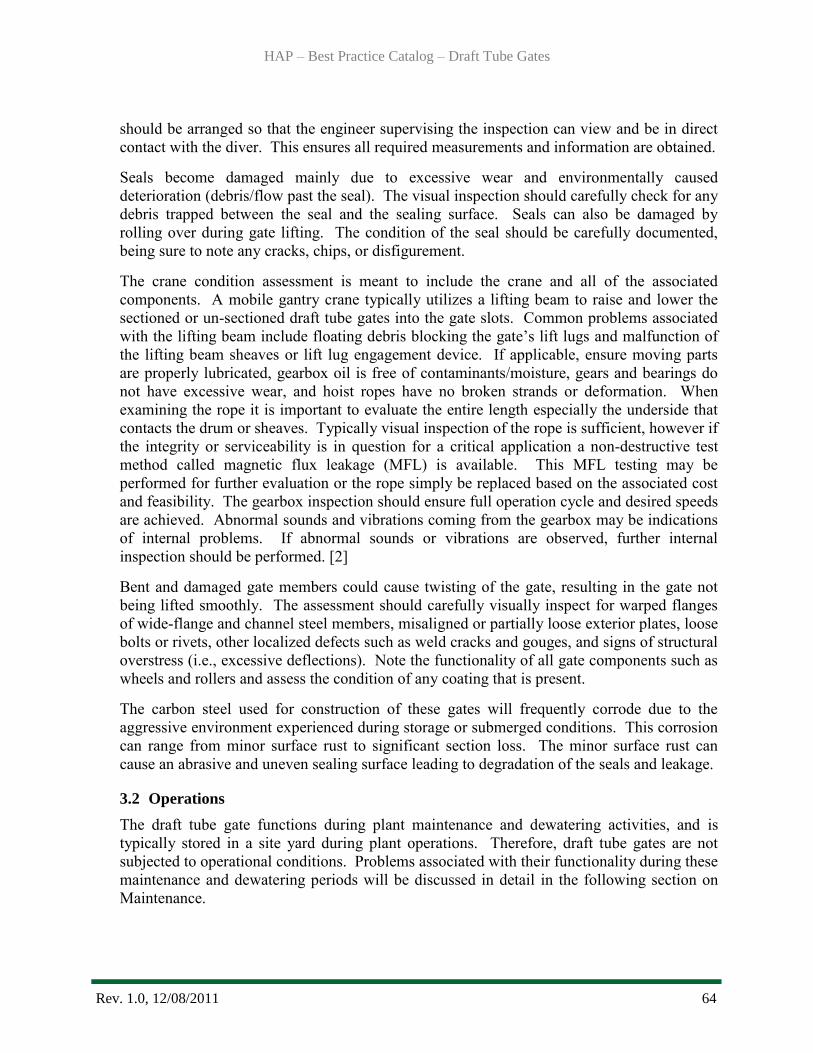
HAP – Best Practice Catalog – Draft Tube Gates
Rev. 1.0, 12/08/2011 64
should be arranged so that the engineer supervising the inspection can view and be in direct
contact with the diver. This ensures all required measurements and information are obtained.
Seals become damaged mainly due to excessive wear and environmentally caused
deterioration (debris/flow past the seal). The visual inspection should carefully check for any
debris trapped between the seal and the sealing surface. Seals can also be damaged by
rolling over during gate lifting. The condition of the seal should be carefully documented,
being sure to note any cracks, chips, or disfigurement.
The crane condition assessment is meant to include the crane and all of the associated
components. A mobile gantry crane typically utilizes a lifting beam to raise and lower the
sectioned or un-sectioned draft tube gates into the gate slots. Common problems associated
with the lifting beam include floating debris blocking the gate’s lift lugs and malfunction of
the lifting beam sheaves or lift lug engagement device. If applicable, ensure moving parts
are properly lubricated, gearbox oil is free of contaminants/moisture, gears and bearings do
not have excessive wear, and hoist ropes have no broken strands or deformation. When
examining the rope it is important to evaluate the entire length especially the underside that
contacts the drum or sheaves. Typically visual inspection of the rope is sufficient, however if
the integrity or serviceability is in question for a critical application a non-destructive test
method called magnetic flux leakage (MFL) is available. This MFL testing may be
performed for further evaluation or the rope simply be replaced based on the associated cost
and feasibility. The gearbox inspection should ensure full operation cycle and desired speeds
are achieved. Abnormal sounds and vibrations coming from the gearbox may be indications
of internal problems. If abnormal sounds or vibrations are observed, further internal
inspection should be performed. [2]
Bent and damaged gate members could cause twisting of the gate, resulting in the gate not
being lifted smoothly. The assessment should carefully visually inspect for warped flanges
of wide-flange and channel steel members, misaligned or partially loose exterior plates, loose
bolts or rivets, other localized defects such as weld cracks and gouges, and signs of structural
overstress (i.e., excessive deflections). Note the functionality of all gate components such as
wheels and rollers and assess the condition of any coating that is present.
The carbon steel used for construction of these gates will frequently corrode due to the
aggressive environment experienced during storage or submerged conditions. This corrosion
can range from minor surface rust to significant section loss. The minor surface rust can
cause an abrasive and uneven sealing surface leading to degradation of the seals and leakage.
3.2 Operations
The draft tube gate functions during plant maintenance and dewatering activities, and is
typically stored in a site yard during plant operations. Therefore, draft tube gates are not
subjected to operational conditions. Problems associated with their functionality during these
maintenance and dewatering periods will be discussed in detail in the following section on
Maintenance.
HAP – Best Practice Catalog – Draft Tube Gates
Rev. 1.0, 12/08/2011 65
3.3 Maintenance
Opportunities to improve draft tube gate performance involves properly diagnosing any of
the common problems noted above in the Condition Assessment section, determining the
apparent or root cause, and applying the most appropriate cost effective repair. It is
imperative that the required maintenance be performed on the gates and the associated
equipment. Performing the recommended maintenance will extend the life of the component
and will help avoid high costs encountered due to emergency repairs and lost revenue during
extended outages.
Problems with concrete openings not allowing the gates to be inserted properly are often due
to the expansive nature of the concrete and long term wear that reduces the clear opening
leading to gate binding. There are a few methods for alleviating this condition including
cutting back or trimming the concrete slots so as to enlarge the opening, trimming the edges
of the gates to restore proper clearance, and fabricating a new gate that allows for some
adjustments of its width. If concrete spalling is causing sealing difficulties because of
significant surface roughness and pitting, an epoxy concrete or cementitious repair mortar
may be used to restore the damaged surface.
Inadequate maintenance of seals and hoisting mechanisms can lead to several problems such
as seal damage/rolling, unequal hoisting chain length and loading, and motor overload.
When a gate is being lifted, seals can roll over and wedge the gate between the sealing
surfaces, thereby damaging the seal and increasing the lifting loads to be overcome by the
hoist. The corrective action involves replacing the gate seals and redesigning the means used
to attach the seal to the gate, or using reconfigured seal geometry. Most seals at today‘s
hydropower plants are made of rubber and can become worn or damaged over extended time
periods of use. Worn or damaged seals can cause excessive leakage which results not only in
loss of water, but can also lead to erosion of the concrete surfaces. Replacing the seals with
the current bulb type, which are adjustable, provides more allowance for movement in the
seal and provides capability to resist water pressures from either side. Bulb seals work best
when allowed to deflect rather than compressing the bulb against the sealing surface.
Motor overload results from a non-uniform torque transfer into the hoist’s gearbox.
Overload causes include motor undersizing, additional frictional or resisting gate loads, drive
shaft misalignment, old age and deterioration of the motor windings. Solutions include
replacing the motor, diagnosing the workings of the hoist machinery and replacing any
defective parts such as drive shafts, reduction gears, bearings and drive train. If the problem
cannot be shown to be directly related to the condition of the hoist, assess the gate to
determine the cause of the additional loads that the hoist must lift.
Other issues to look for at regular maintenance periods include debris that is jamming gates
and deformed/damaged gate structural members. Debris can readily get stuck between the
gate and support piers or guides, causing binding of the gate. A common solution is to
modify the gate to prevent debris from becoming wedged between the gate and gate supports.
Modifications may include extending plates from the upstream side of the gate to reduce the
width of the gap between the gate and the support piers or guides.
HAP – Best Practice Catalog – Draft Tube Gates
Rev. 1.0, 12/08/2011 66
Regarding the expected lifespan of the steel parts (plates, structural shapes, bolts, welds, etc.)
used for the draft tube gate assembly, 75 years is a reasonable service life when the proper
attention is given to the initial surface coating/protection and regularly scheduled
preventative maintenance. Often after 75 years of service, the area of the gate most in need
of major repair or replacement is around the perimeter of the gate adjacent to the gate seals.
Due to the gate seals being often inaccessible, this area is routinely not subjected to
inspection or preventative maintenance activities.
Bent and damaged gate structural members (i.e., steel wide flange and channel shapes) can
lead to warping of the gate, resulting in the gate not being lifted smoothly. The only viable
solution is to inspect the gate regularly, and remove and replace the damaged members as
necessary. If welds between steel members and plates look visually flawed ultrasonic testing
can be performed to determine if the weld needs to be reconstructed.
The damage caused by minor corrosion can be limited with minor preventative maintenance
such as coatings and the use of stainless steel overlays and cladding, as described in the State
of the Art Technology section of this report. If significant section loss is present due to
corrosion, complete or partial replacement may be justified for gate members and its
associated components.
4.0 Metrics, Monitoring and Analysis
4.1 Measures of Performance, Condition, and Reliability
For draft tube gates the measure for performance will be a direct result of its functionality.
The purpose of these gates is to protect and keep water away from the required portions of
the hydropower plant. It is important that these gates function properly not necessarily for
efficiency but for safety since failure can have dire consequences. Leakage of these gates
can be tolerated as long as safety and equipment protection are not compromised. The
leakage around the gate seals should be in the order of 0.01 gallons/minute per foot of wetted
perimeter for rubber seals. For metal on metal seals the allowable rate of leakage is 0.1
gallons/minute per foot of wetted perimeter. [1]
4.2 Data Analysis
Leakage of these gates can be tolerated as long as equipment protection and safety are not
compromised. Relatively small amounts of leakage can be tolerated and handled by pumping
water out of areas maintenance will be performed. However, if pumping becomes excessive
the cost of new seals or other corrective actions may be justified.
4.3 Integrated Improvements
The field test results for leakage should be included when updating the plant’s unit
performance records. These records shall be made available to all involved personnel and
distributed accordingly for upcoming inspections.
HAP – Best Practice Catalog – Draft Tube Gates
Rev. 1.0, 12/08/2011 67
5.0 Information Sources:
Baseline Knowledge:
American Society of Civil Engineers, Civil Works for Hydroelectric Facilities: Guidelines
for Life Extension and Upgrade, 2007.
US Army Corps of Engineers, Hydro Plant Risk Assessment Guide, Appendices E9 and E11,
September 2006.
HCI Publication Paper No. 072, Aging Plants – Time for a Physical: Conducting a
Comprehensive Condition Assessment and the Issues Identified, HydroVision 2008.
Bureau of Reclamation, McStraw, Bill, Inspection of Steel Penstocks and Pressure Conduits,
Facilities Instructions, Standards, and Techniques, Volume 2-8, September 1996.
US Army Corps of Engineers, Evaluation and Repair of Concrete Structures, Engineering
and Design, EM 1110-2-2002, 30 June 1995.
Hydro Life Extension Modernization Guides: Volume 1 – Overall Process, EPRI, Palo Alto,
CA: 1999. TR-112350-V1.
Best Practice Catalog
Leakage and Releases
Revision 1.0, 12/01/2011
HAP – Best Practice Catalog – Leakage and Releases
Rev. 1.0, 12/01/2011 69
1.0 Scope and Purpose…………………………………………………………………………………………………………….…..70
1.1 Hydropower Taxonomy Position ................................................................................... 70
1.1.1 Causes of Leakage & Releases ........................................................................................... 70
1.2 Summary of Best Practices ............................................................................................ 71
1.2.1 Performance/Efficiency & Capability - Oriented Best Practices ................................... 71
1.2.2 Reliability/Operations & Maintenance - Oriented Best Practices ................................. 72
1.3 Best Practice Cross-references ....................................................................................... 72
2.0 Technology Design Summary.………………………………………………………………………………………………72
2.1 Material and Design Technology Evolution .................................................................. 72
2.2 State of the Art Technology ........................................................................................... 73
3.0 Operation and Maintenance Practices.………………………………………………………………………………….73
3.1 Condition Assessment .................................................................................................... 73
3.2 Operations ...................................................................................................................... 74
3.3 Maintenance ................................................................................................................... 75
4.0 Metrics, Monitoring and Analysis……………….………………………………………..……………………………..76
4.1 Measures of Performance, Condition, and Reliability ................................................... 76
4.2 Data Analysis ................................................................................................................. 76
4.3 Integrated Improvements................................................................................................ 76
5.0 Information Sources…………………………………………………………………………………………………..……….….76
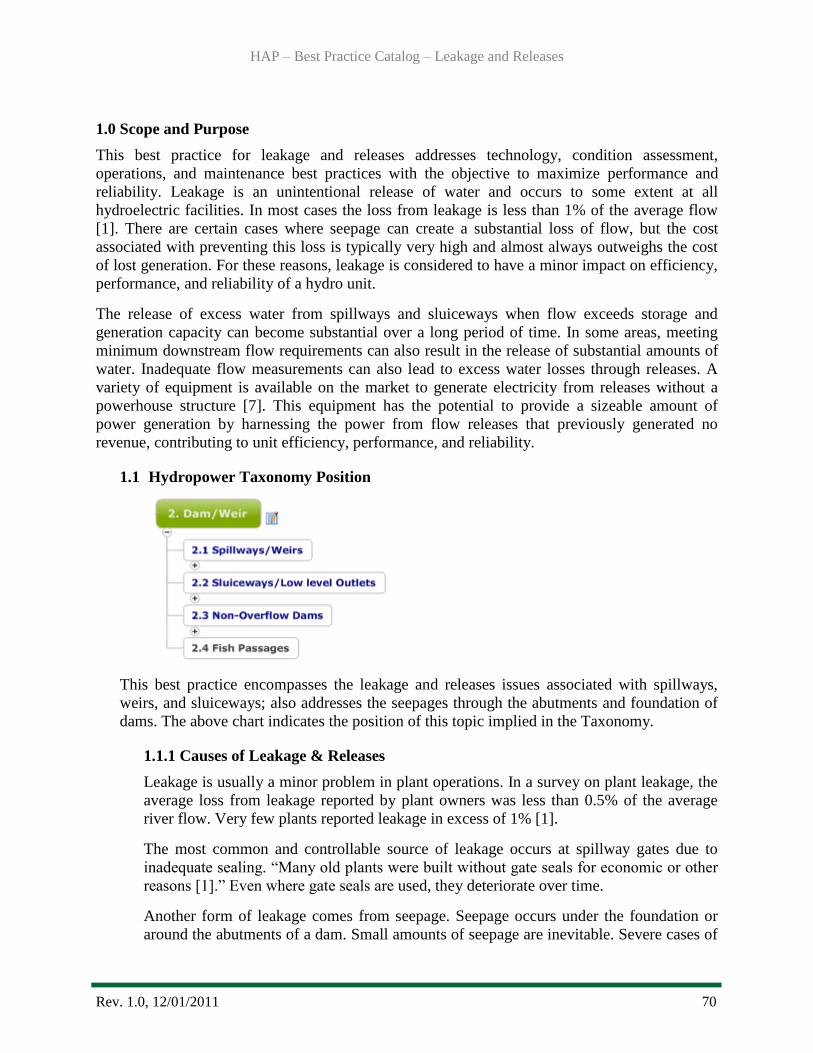
HAP – Best Practice Catalog – Leakage and Releases
Rev. 1.0, 12/01/2011 70
1.0 Scope and Purpose
This best practice for leakage and releases addresses technology, condition assessment,
operations, and maintenance best practices with the objective to maximize performance and
reliability. Leakage is an unintentional release of water and occurs to some extent at all
hydroelectric facilities. In most cases the loss from leakage is less than 1% of the average flow
[1]. There are certain cases where seepage can create a substantial loss of flow, but the cost
associated with preventing this loss is typically very high and almost always outweighs the cost
of lost generation. For these reasons, leakage is considered to have a minor impact on efficiency,
performance, and reliability of a hydro unit.
The release of excess water from spillways and sluiceways when flow exceeds storage and
generation capacity can become substantial over a long period of time. In some areas, meeting
minimum downstream flow requirements can also result in the release of substantial amounts of
water. Inadequate flow measurements can also lead to excess water losses through releases. A
variety of equipment is available on the market to generate electricity from releases without a
powerhouse structure [7]. This equipment has the potential to provide a sizeable amount of
power generation by harnessing the power from flow releases that previously generated no
revenue, contributing to unit efficiency, performance, and reliability.
1.1 Hydropower Taxonomy Position
This best practice encompasses the leakage and releases issues associated with spillways,
weirs, and sluiceways; also addresses the seepages through the abutments and foundation of
dams. The above chart indicates the position of this topic implied in the Taxonomy.
1.1.1 Causes of Leakage & Releases
Leakage is usually a minor problem in plant operations. In a survey on plant leakage, the
average loss from leakage reported by plant owners was less than 0.5% of the average
river flow. Very few plants reported leakage in excess of 1% [1].
The most common and controllable source of leakage occurs at spillway gates due to
inadequate sealing. ―Many old plants were built without gate seals for economic or other
reasons [1].‖ Even where gate seals are used, they deteriorate over time.
Another form of leakage comes from seepage. Seepage occurs under the foundation or
around the abutments of a dam. Small amounts of seepage are inevitable. Severe cases of
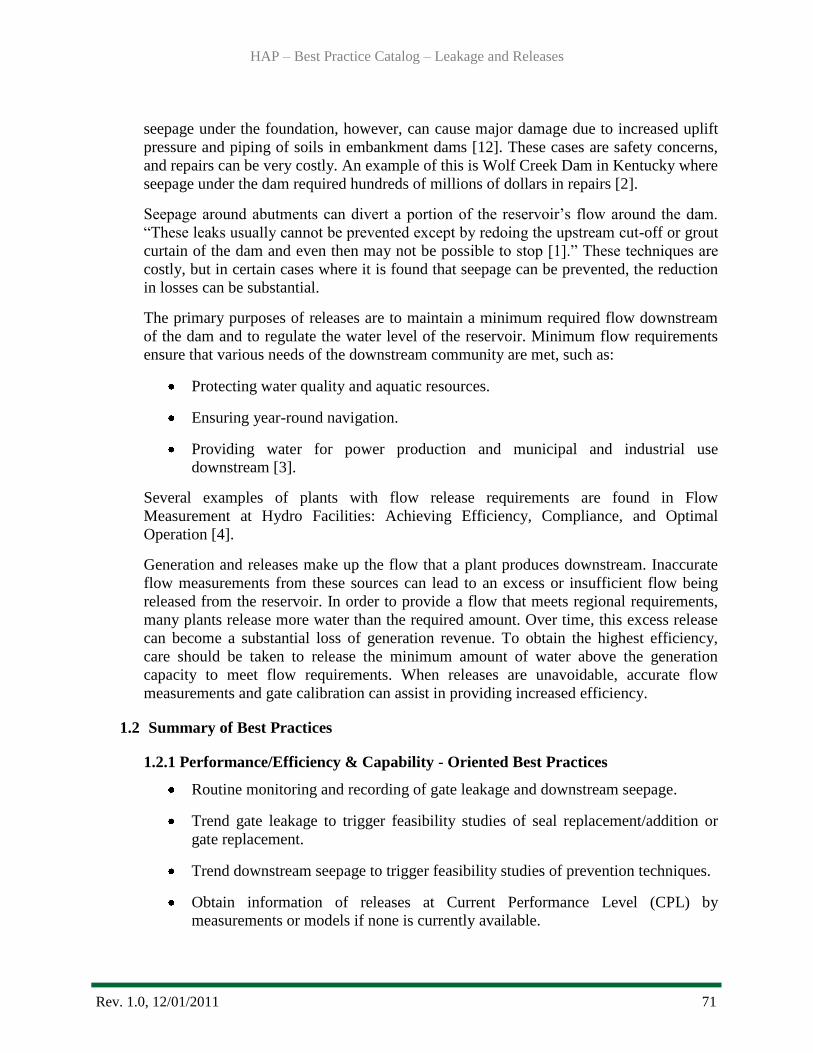
HAP – Best Practice Catalog – Leakage and Releases
Rev. 1.0, 12/01/2011 71
seepage under the foundation, however, can cause major damage due to increased uplift
pressure and piping of soils in embankment dams [12]. These cases are safety concerns,
and repairs can be very costly. An example of this is Wolf Creek Dam in Kentucky where
seepage under the dam required hundreds of millions of dollars in repairs [2].
Seepage around abutments can divert a portion of the reservoir‘s flow around the dam.
―These leaks usually cannot be prevented except by redoing the upstream cut-off or grout
curtain of the dam and even then may not be possible to stop [1].‖ These techniques are
costly, but in certain cases where it is found that seepage can be prevented, the reduction
in losses can be substantial.
The primary purposes of releases are to maintain a minimum required flow downstream
of the dam and to regulate the water level of the reservoir. Minimum flow requirements
ensure that various needs of the downstream community are met, such as:
Protecting water quality and aquatic resources.
Ensuring year-round navigation.
Providing water for power production and municipal and industrial use
downstream [3].
Several examples of plants with flow release requirements are found in Flow
Measurement at Hydro Facilities: Achieving Efficiency, Compliance, and Optimal
Operation [4].
Generation and releases make up the flow that a plant produces downstream. Inaccurate
flow measurements from these sources can lead to an excess or insufficient flow being
released from the reservoir. In order to provide a flow that meets regional requirements,
many plants release more water than the required amount. Over time, this excess release
can become a substantial loss of generation revenue. To obtain the highest efficiency,
care should be taken to release the minimum amount of water above the generation
capacity to meet flow requirements. When releases are unavoidable, accurate flow
measurements and gate calibration can assist in providing increased efficiency.
1.2 Summary of Best Practices
1.2.1 Performance/Efficiency & Capability - Oriented Best Practices
Routine monitoring and recording of gate leakage and downstream seepage.
Trend gate leakage to trigger feasibility studies of seal replacement/addition or
gate replacement.
Trend downstream seepage to trigger feasibility studies of prevention techniques.
Obtain information of releases at Current Performance Level (CPL) by
measurements or models if none is currently available.

HAP – Best Practice Catalog – Leakage and Releases
Rev. 1.0, 12/01/2011 72
Limit releases to minimum required flow, and only release when required.
Use information of releases at CPL to regulate releases.
Periodic comparison of the CPL of releases to the Potential Performance Level
(PPL) to trigger feasibility studies of major upgrades.
Maintain documentation of Installed Performance Level (IPL) and update when
modifications are made (e.g. replacement/addition of seals, prevention of
seepage, addition of generating equipment, changes in release control).
Include industry acknowledged ―up to date‖ choices, for leakage prevention and
release control practices to plant engineering standards.
1.2.2 Reliability/Operations & Maintenance - Oriented Best Practices
Monitor conveyance components and gates for signs of excessive leakage, and
repair or replace damaged or defective components causing the leakage.
1.3 Best Practice Cross-references
Civil – Penstocks, Tunnels, & Surge Tanks
Civil – Trash Racks & Intakes
2.0 Technology Design Summary
2.1 Material and Design Technology Evolution
Gate seals are used to close the gap between the edge of a movable gate and a fixed sealing
surface. Most gates of modern hydroelectric plants have seals that are made of rubber.
However, wood, plastic, and even leather have been utilized for gates, typically under low
head applications. Dissimilar metal was also a common pre-1950‘s seal material and was
seen as a more durable, longer-lasting option [14].
Performance levels for leakage and releases can be stated at three levels as follows:
The Installed Performance Level (IPL) is described as the loss characteristics at the
time of the plant‘s commissioning or at the point when an upgrade, addition, or
modification is made.
The Current Performance Level (CPL) is described by an accurate set of loss
characteristics encompassing all sources of leakage and releases. It is important to
locate and accurately quantify all sources of leakage and releases for this performance
level.
The Potential Performance Level (PPL) is ideally considered as the condition where
no power generation loss occurs from leakage or releases. However, this ideal
condition is never completely obtainable. Therefore, the PPL can be considered as the
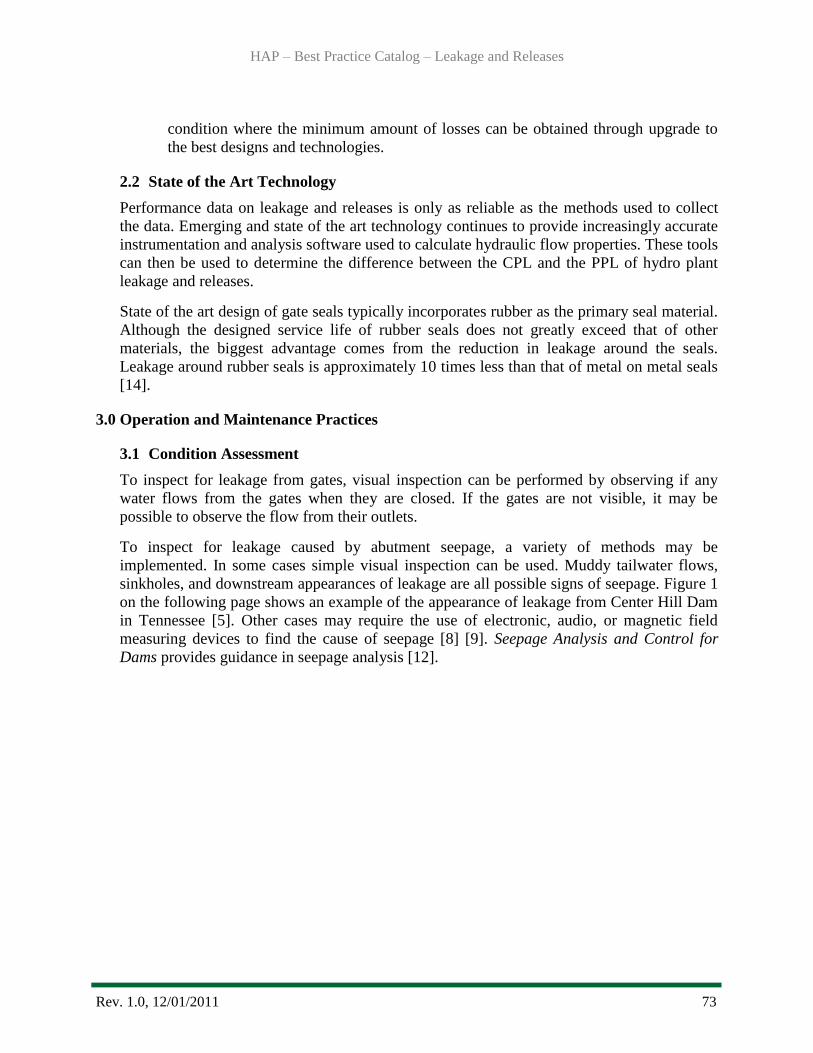
HAP – Best Practice Catalog – Leakage and Releases
Rev. 1.0, 12/01/2011 73
condition where the minimum amount of losses can be obtained through upgrade to
the best designs and technologies.
2.2 State of the Art Technology
Performance data on leakage and releases is only as reliable as the methods used to collect
the data. Emerging and state of the art technology continues to provide increasingly accurate
instrumentation and analysis software used to calculate hydraulic flow properties. These tools
can then be used to determine the difference between the CPL and the PPL of hydro plant
leakage and releases.
State of the art design of gate seals typically incorporates rubber as the primary seal material.
Although the designed service life of rubber seals does not greatly exceed that of other
materials, the biggest advantage comes from the reduction in leakage around the seals.
Leakage around rubber seals is approximately 10 times less than that of metal on metal seals
[14].
3.0 Operation and Maintenance Practices
3.1 Condition Assessment
To inspect for leakage from gates, visual inspection can be performed by observing if any
water flows from the gates when they are closed. If the gates are not visible, it may be
possible to observe the flow from their outlets.
To inspect for leakage caused by abutment seepage, a variety of methods may be
implemented. In some cases simple visual inspection can be used. Muddy tailwater flows,
sinkholes, and downstream appearances of leakage are all possible signs of seepage. Figure 1
on the following page shows an example of the appearance of leakage from Center Hill Dam
in Tennessee [5]. Other cases may require the use of electronic, audio, or magnetic field
measuring devices to find the cause of seepage [8] [9]. Seepage Analysis and Control for
Dams provides guidance in seepage analysis [12].
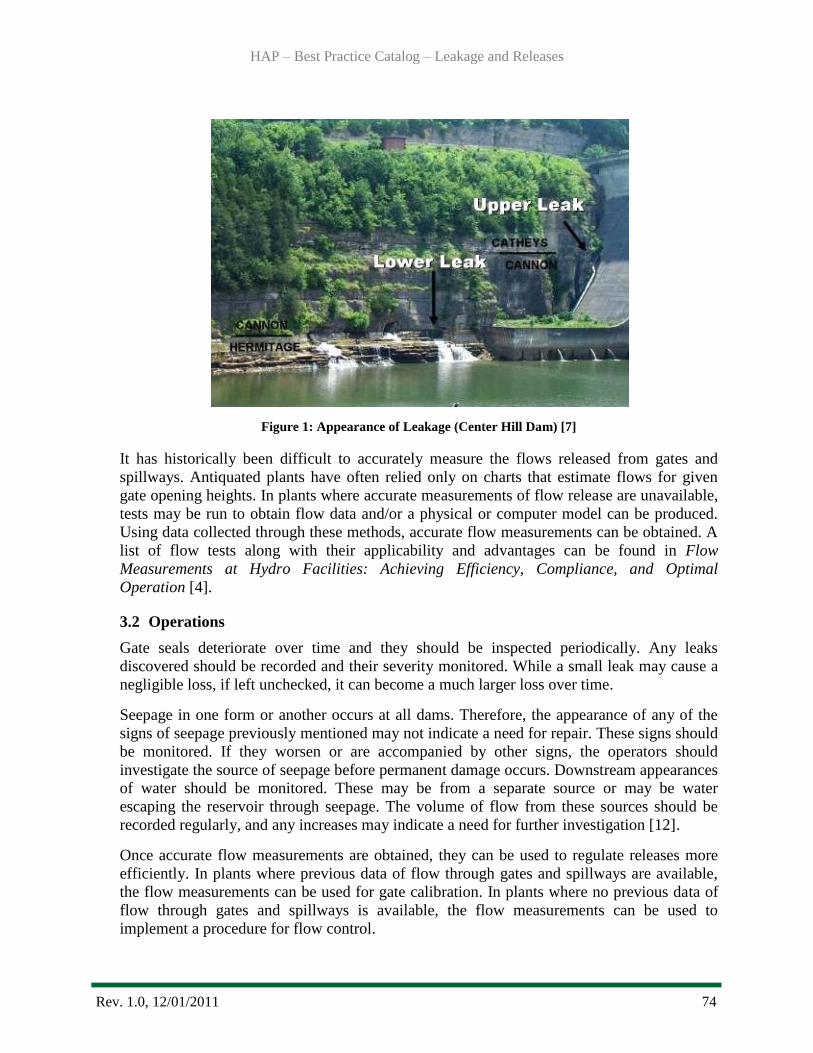
HAP – Best Practice Catalog – Leakage and Releases
Rev. 1.0, 12/01/2011 74
Figure 1: Appearance of Leakage (Center Hill Dam) [7]
It has historically been difficult to accurately measure the flows released from gates and
spillways. Antiquated plants have often relied only on charts that estimate flows for given
gate opening heights. In plants where accurate measurements of flow release are unavailable,
tests may be run to obtain flow data and/or a physical or computer model can be produced.
Using data collected through these methods, accurate flow measurements can be obtained. A
list of flow tests along with their applicability and advantages can be found in Flow
Measurements at Hydro Facilities: Achieving Efficiency, Compliance, and Optimal
Operation [4].
3.2 Operations
Gate seals deteriorate over time and they should be inspected periodically. Any leaks
discovered should be recorded and their severity monitored. While a small leak may cause a
negligible loss, if left unchecked, it can become a much larger loss over time.
Seepage in one form or another occurs at all dams. Therefore, the appearance of any of the
signs of seepage previously mentioned may not indicate a need for repair. These signs should
be monitored. If they worsen or are accompanied by other signs, the operators should
investigate the source of seepage before permanent damage occurs. Downstream appearances
of water should be monitored. These may be from a separate source or may be water
escaping the reservoir through seepage. The volume of flow from these sources should be
recorded regularly, and any increases may indicate a need for further investigation [12].
Once accurate flow measurements are obtained, they can be used to regulate releases more
efficiently. In plants where previous data of flow through gates and spillways are available,
the flow measurements can be used for gate calibration. In plants where no previous data of
flow through gates and spillways is available, the flow measurements can be used to
implement a procedure for flow control.

HAP – Best Practice Catalog – Leakage and Releases
Rev. 1.0, 12/01/2011 75
Operators should consider altering generating schedules if excess amounts of water are being
released through spillways and gates. Any water released from the reservoir that is not used
to generate electricity is ultimately a loss of revenue.
3.3 Maintenance
Over time, gate seals will deteriorate and will need to be replaced. If possible, seals should be
replaced when the gates are out of use, either from dewatering or seasonal reservoir level
drops. To reduce maintenance, the use of improved seals may be a cost effective solution. In
cases where no seals are present, it may be cost effective to install seals on the gates. In
extreme cases of leakage, particularly where gates are severely deteriorated or have an
outdated design, it may be cost effective to replace the gate entirely if the addition or
replacement of seals is not sufficient.
Seepage prevention is typically a costly improvement and doesn‘t always fix the problem.
Grout curtains are the most common form of seepage prevention [13]. Even after they are
installed, seepage water may still find a path around the grouting or may find an outlet
further downstream. In the case of Great Falls Dam in Tennessee, an extensive grouting
program was successful in stopping 98% of reservoir leakage [6], but the largest of the
uncorrected leakage, located a few hundred feet downstream from the powerhouse, has
increased since the grout curtain was installed. This leakage can be seen in Figure 2.
Operators must take care to ensure that seepage prevention is a cost effective endeavor. In
many cases the small amount of water lost cannot justify the cost of correcting the problem.
A variety of seepage control methods and their appropriate applications can be found in
Seepage Analysis and Control for Dams, EM 1110-2-1901 [12].
At some point every plant must release water due to the generator or reservoir capacity limit.
Some plants, however, require a large volume of releases for environmental purposes. There
is a variety of equipment that can be installed to generate power from these types of releases
without the need for a powerhouse. Some of the most recent hydro generation equipment can
be found in ―Top 5 Developments in Hydro‖ [7]. Among these are a fully-sealed combined
axial turbine and generator [10] and hydrokinetic technologies [11]. These options can utilize
previously unused generation potential from environmental releases.
Figure 2: Great Falls Leakage (powerhouse shown at left)
HAP – Best Practice Catalog – Leakage and Releases
Rev. 1.0, 12/01/2011 76
Additionally, some plants use releases to provide required dissolved oxygen concentrations
downstream of the dam. For these plants, the releases may not coincide with minimum flow
requirements and therefore contribute to decreased plant efficiency. Other means of
providing minimum dissolved oxygen, such as aeration weirs or aerating turbines, are
recommended in this case.
4.0 Metrics, Monitoring and Analysis
4.1 Measures of Performance, Condition, and Reliability
The fundamental process of a hydro plant can be described by the power equation. In the
case of leakage and releases, the power loss can be determined based of the following
calculation:
Where: · P is the power loss of the hydroelectric plant (MW)
· Q is the flow rate lost through leakage or releases (ft3/s)
· γ is the specific weight of water (62.4 lb/ft3)
· H is the effective pressure head across the system (ft)
The general expression for power loss (P):
4.2 Data Analysis
Analysis of performance data shall determine plant efficiency relative to power generation.
The results from the analysis (CPL) shall be compared to previous or original performance
data (IPL) as well as the efficiency gained from potential improvements to leakage and
releases (PPL). The cost of rehabilitation and internal rate of return must be calculated to
determine if improvements are justified.
4.3 Integrated Improvements
The periodic field test results should be used to update the unit operating characteristics and
limits. Optimally, these would be integrated into an automatic system (e.g., Automatic
Generation Control), but if not, hard copies of the data should be made available to all
involved personnel – particularly unit operators, their importance to be emphasized, and their
ability to be understood and confirmed. Justified projects a method to constantly monitor unit
performance should be implemented.
5.0 Information Sources
Baseline Knowledge:
Electric Power Research Institute (EPRI), Increased Efficiency of Hydroelectric Power, EM-
2407, June 1982
HAP – Best Practice Catalog – Leakage and Releases
Rev. 1.0, 12/01/2011 77
United States Army Corps of Engineers (USACE), Wolf Creek Dam Seepage Rehabilitation
Project, Retrieved from http://www.lrn. usace.army.mil/wolfcreek/, Page last updated on
April 19, 2011
Tennessee Valley Authority (TVA), Managing River System Flows, Retrieved from
http://www.tva.gov/river/lakeinfo/systemwide.htm
EPRI, Hydropower Technology Roundup Report: Flow Measurement at Hydro Facilities:
Achieving Efficiency, Compliance, and Optimal Operation, TR-113584-V5, January 2002
USACE, Seepage, Retrieved from http://www.lrn.usace.army.mil/centerhill/pdf/ seepage.pdf
TVA, Great Falls Hydro Plant - Dam Safety Instrumentation Project Performance Report,
EDMS J22060427001, 2005
Hydro Life Extension Modernization Guides: Volume 1 – Overall Processes, EPRI, Palo
Alto, CA: 1999. TR-112350-V1.
State of the Art
Top 5 Developments in Hydro, International Water Power and Dam Construction, January
26, 2011
Diagnosing Dam Seepage, International Water Power and Dam Construction, March 21,
2011
Montgomery, J. R., M. L. Jessop, M. J. Wallace, and V. O. Kofoed, Using Controlled Source
Audio Frequency Domain Magnetics for Seepage Diagnosis of Earthen Embankments,
SAGEEP 22, 785, March 2009
Opsahl, E., and Ø. Krøvel, Installing the Turbinator, International Water Power and Dam
Construction, December 22, 2010
Hydro Green Energy, LLC, Full Operations Initiated at Nation’s First Commercial
Hydrokinetic Power Station, Retrieved from http://www.hgenergy.com/ moellerrelease.pdf
Standards:
USACE, Seepage Analysis and Control for Dams, EM 1110-2-1901, April 30, 1993
USACE, Engineering and Design - Planning and Design of Navigation Dams, EM 1110-2-
2607, July 31, 1995
American Society of Civil Engineers, Civil Works for Hydroelectric Facilities: Guidelines
for Life Extension and Upgrade, 2007
Best Practice Catalog
Francis Turbine
Revision 1.0, 12/06/2011

HAP – Best Practice Catalog – Francis Turbine
Rev. 1.0, 12/06/2011 79
1.0 Scope and Purpose ............................................................................................................. 80
1.1 Hydropower Taxonomy Position ................................................................................... 80
1.1.1 Francis Turbine Components .................................................................................. 80
1.2 Summary of Best Practices ............................................................................................ 82
1.2.1 Performance/Efficiency & Capability - Oriented Best Practices ....................... 82
1.2.2 Reliability/Operations & Maintenance - Oriented Best Practices ..................... 83
1.3 Best Practice Cross-references ....................................................................................... 84
2.0 Technology Design Summary ............................................................................................ 84
2.1 Material and Design Technology Evolution .................................................................. 84
2.2 State of the Art Technology ........................................................................................... 85
3.0 Operation and Maintenance Practices ................................................................................ 86
3.1 Condition Assessment .................................................................................................... 86
3.2 Operations ...................................................................................................................... 92
3.3 Maintenance ................................................................................................................... 92
4.0 Metrics, Monitoring and Analysis ..................................................................................... 97
4.1 Measures of Performance, Condition, and Reliability ................................................... 97
4.2 Data Analysis ................................................................................................................. 98
4.3 Integrated Improvements................................................................................................ 99
5.0 Information Sources: .......................................................................................................... 99
HAP – Best Practice Catalog – Francis Turbine
Rev. 1.0, 12/06/2011 80
1.0 Scope and Purpose
This best practice for a Francis turbine addresses its technology, condition assessment,
operations, and maintenance best practices with the objective to maximize its performance and
reliability. The primary purpose of the turbine is to function as the prime mover providing direct
horsepower to the generator. It is the most significant system in a hydro unit. How the turbine is
designed, operated, and maintained provides the most impact to the efficiency, performance, and
reliability of a hydro unit.
1.1 Hydropower Taxonomy Position
Hydropower Facility → Powerhouse → Power Train Equipment → Turbine → Francis
Turbine
1.1.1 Francis Turbine Components
Performance and reliability related components of a Francis turbine consist of a spiral
case, stay ring/stay vanes, wicket gates, vacuum breaker, reaction type runner, aeration
device, and draft tube.
Spiral Case: The function of the spiral case (or scroll case) is to supply water from the
penstock to the stay vanes and through its unique shape of continual cross sectional area
reduction, maintain a near uniform velocity of water around the stay vanes and wicket
gates.
Stay Ring/Vanes: The function of the stay vanes (and stay ring) is to align the flow of
water from the spiral casing to the wicket gates. They also usually function as support
columns in vertical units for supporting the static weight of the unit‘s stationary
components and hydraulic thrust during turbine operation.
Wicket Gates: The function of the wicket gates is primarily to control the quantity of
water entering the turbine runner, thereby controlling power output. Secondarily, the
gates control the angle of the high tangential velocity water striking the runner bucket
surface. The optimum angle of attack will be at peak efficiency. The wicket gates also
function as a closure valve to minimize leakage through the turbine while it is shut down.
Leakage can also originate from water passing by the end seals on the gates between the
top end of the gates and the head cover, and the bottom end of the gates and the bottom
ring.
Runner: The function of the runner is to convert the potential energy of pressure (head)
and flow of water into mechanical energy or rotational horsepower which is supplied
directly to the turbine shaft. There are various types, from horizontal to vertical
orientation, single discharge, double discharge, and overhung designs. The most
prevalent type is a vertical unit.
Vacuum Breaker: The function of the vacuum breaker is to admit air to a zone near the
turbine runner [2]. It is usually an automatic device either spring loaded or cam operated
off the wicket gate shifting ring. For reaction turbines it is used for drawing in
atmospheric air at low gate openings, such as synchronizing and speed no load, to reduce

HAP – Best Practice Catalog – Francis Turbine
Rev. 1.0, 12/06/2011 81
vibration and rough operation. While this reduces rough operation, it also reduces turbine
efficiency by introducing vacuum and air vortex beneath the runner.
Aeration Device: The function of an aeration device is for inlet of air into the turbine to
provide for an increase in dissolved oxygen in the tailrace waterway for environmental
enhancements. The device can be either active or passive in design with the passive
designs being more common. An active design would include some type of motorized
blower or compressor to force air into the turbine for mixing with water in the turbine
and/or draft tube. A passive design would consist of some type of addition or
modification to a turbine runner to naturally draw in atmospheric air into the turbine.
This in its most basic form is done through adding baffles to vacuum breaker air
discharge ports in the crown or nose cone of the turbine runner and blocking the vacuum
breaker open. The latest and most efficient method is by an aerating turbine runner
designed and built to discharge the air through internal porting in the runner and out the
blade tips.
Draft Tube: The function of the draft tube is to gradually slow down the high discharge
velocity water capturing the kinetic energy from the water, which is usually below
atmospheric pressure. In most cases, it has an elbow in order to minimize excavation for
the unit. The head recovery from the draft tube is the difference between the velocity
head at the runner discharge and draft tube discharge overall, increasing the head across
the turbine. The larger the head differential is across the turbine, the higher the turbine
power output. The draft tube should be steel lined from the discharge ring to the point
where the water velocity reduces to about 20 ft/s, which is considered below concrete
scouring velocity [1].
Non-performance but reliability related components of a Francis turbine include the
wicket gate mechanism / servomotors, head cover, bottom ring, turbine shaft, guide
bearing, and mechanical seals / packing.
Wicket Gate Mechanism / Servomotors: The function of the wicket gate mechanism and
servomotors is to control the opening and closing of the wicket gate assembly. The
mechanism includes arms, linkages, pins, shear pins, turnbuckles or eccentric pins for
closure adjustment, operating ring (or shift ring, and bearing pads), and bushings either
greased bronze or greaseless type. Servomotors are usually hydraulically actuated using
high pressure oil from the unit governor. In some limited cases a very small unit may
have electro-mechanical servomotors.
Head Cover: The head cover is a pressurized structural member covering the turbine
runner chamber that functions as a water barrier to seal the turbine. It also serves as a
carrier for the upper wicket gate bushings, upper seal surface for the wicket gate vanes,
support for the gate operating ring, carrier for the runner stationary seal rings, and support
for the turbine guide bearing.
Bottom Ring: The bottom ring serves as a carrier for the bottom wicket gate bushings,
bottom seal surface for the wicket gate vanes, and a carrier for the bottom runner
stationary seal ring.
HAP – Best Practice Catalog – Francis Turbine
Rev. 1.0, 12/06/2011 82
Turbine Shaft: The function of the turbine shaft is to transfer the torque from the turbine
runner to the generator shaft and generator rotor. The shaft typically has a bearing journal
for oil lubricated hydrodynamic guide bearings on the turbine runner end or wearing
sleeve for water lubricated guide bearings. Shafts are usually manufactured from forged
steel, but some of the largest shafts can be fabricated.
Guide Bearing: The function of the turbine guide bearing is to resist the mechanical
imbalance and hydraulic side loads from the turbine runner thereby maintaining the
turbine runner in its centered position in the runner seals. It is typically mounted as close
as practical to the turbine runner and supported by the head cover. Turbine guide
bearings are usually either oil lubricated hydrodynamic (babbitted) bearings or water
lubricated (plastic, wood, or composite) bearings.
Mechanical Seals / Packing: Sealing components in the turbine includes the seal for the
turbine shaft and the wicket gate stem seals. Shaft seals are typically either packing
boxes with square braided packing or for high speed units a mechanical seal is required.
Wicket gate stem packing is usually either a square braided compression packing, a V
type or Chevron packing, or some type of hydraulic elastomer seal. Although in the
truest sense any sealing components on a turbine could be a performance issue, since any
leakage that by-passes the turbine runner is a loss of energy, the leakage into the wheel
pit is considered insignificant to the overall flow through the turbine.
1.2 Summary of Best Practices
1.2.1Performance/Efficiency & Capability - Oriented Best Practices
Periodic testing to establish accurate current unit performance characteristics
and limits.
Dissemination of accurate unit performance characteristics to unit operators,
local and remote control and decision support systems, and other personnel and
offices that influence unit dispatch or generation performance.
Real-time monitoring and periodic analysis of unit performance at Current
Performance Level (CPL) to detect and mitigate deviations from expected
efficiency for the Installed Performance Level (IPL) due to degradation or
instrument malfunction.
Periodic comparison of the CPL to the Potential Performance Level (PPL) to
trigger feasibility studies of major upgrades.
Maintain documentation of IPL and update when modification to equipment is
made (e.g., hydraulic profiling, draft tube slot fillers, unit upgrade).
Trend loss of turbine performance due to condition degradation for such causes
as metal loss (cavitation, erosion, and corrosion), opening of runner seal,
opening of wicket gate clearances, and increasing water passage surface
HAP – Best Practice Catalog – Francis Turbine
Rev. 1.0, 12/06/2011 83
roughness. Adjust maintenance and capitalization programs to correct
deficiencies.
Include industry acknowledged ―up to date‖ choices for turbine components
materials and maintenance practices.
1.2.2Reliability/Operations & Maintenance - Oriented Best Practices
Use ASTM A487 / A743 CA6NM stainless steel to manufacture Francis turbine
runners, wicket gates, and water lubricated bearing shaft sleeves to maximize
resistance to erosion, abrasive wear, and cavitation. [18, 19]
Bushing clearances greater than two times the design are considered excessive
and warrants replacement.
Wicket gate shear pins (mechanical fuse) are an engineered product designed to
prevent failures of more costly components in the mechanism. When replacing
pins or spares pins, it is best practice, to purchase the pin material from one
manufacturer to ensure material properties remain consistent. Prototype sample
pins are manufactured and tested to finalize the diameter for the final pin shop
drawing.
Turbine shaft areas near the shaft seal that are exposed to water should be sealed
with a robust coating such as an epoxy paint to prevent corrosion of the shaft.
Damage from erosion and cavitation on component wetted surfaces are repaired
using 309L stainless steel welding electrodes. The electrodes increase damage
resistance.
When turbine runner seal clearances reach twice the design value one should
consider rehabilitating or replacing the runner due to efficiency loss.
Francis turbines with heads above 100 feet should be considered as candidates
for embedded wicket gate vane end seals and wicket gates fabricated from
stainless steel to mitigate leakage and wear.
Adequate coating of the turbine wetted components not only prevents corrosion
but has added benefits of improved performance.
Vacuum breakers should be inspected routinely and adjusted for optimal
performance.
Discharge areas on a turbine runner for aeration devices should be clad with
stainless steel to mitigate cavitation.
Wicket gate mechanism linkage bushings should be of the greaseless type to
reduce grease discharge to the wheel pit and ultimately the station sump. Using
greaseless bushings in other applications possible; however, care must be taken
HAP – Best Practice Catalog – Francis Turbine
Rev. 1.0, 12/06/2011 84
in any retrofit to ensure that the servomotors are strong enough to operate even
after a 25% increase in long term friction.
For applications above 200 feet of head, stainless steel wearing plates embedded
into the head cover and bottom ring immediately above and below the wicket
gate vanes are recommended.
Kidney loop filtration should be installed on turbine guide bearing oil systems.
Automatic strainers with internal backwash should be installed to supply
uninterrupted supply of clean water to water lubricated turbine guide bearings.
Monitor trends of decrease in condition of turbine (decrease in Condition
Indicator (CI)) and decrease in reliability (an increase in Equivalent Forced
Outage Rate (EFOR), a decrease in Effective Availability Factor (EAF)).
Adjust maintenance and capitalization programs to correct deficiencies.
1.3 Best Practice Cross-references
I&C - Automation Best Practice
Mechanical - Lubrication Best Practice
Mechanical - Generator Best Practice
Mechanical – Governor Best Practice
Mechanical – Raw Water Best Practice
2.0 Technology Design Summary
2.1 Material and Design Technology Evolution
Francis turbine runners are typically manufactured as one piece, typically either as a casting
or as a welded fabrication. Very old runners, from the early 1900‘s or before, could have
been cast from cast iron or bronze, later replaced with cast carbon steel; and today either cast
or fabricated from carbon steel or stainless steel. Just as materials have improved for modern
turbine runners, so has the design and manufacturing to provide enhanced performance for
power, efficiency, and reduced cavitation damage.
Best practice for the turbine begins with a superior design to maximize and establish the
baseline performance while minimizing damage due to various factors, including cavitation,
pitting, and rough operation. The advent of computerized design and manufacturing occurred
in the late 1970‘s through 1980‘s and made many of the advancements of today possible.
Modern Computational Fluid Dynamics (CFD) flow analysis, Finite Element Analysis
techniques (FEA) for engineering, and Computer Numerically Controlled (CNC) in
manufacturing have significantly improved turbine efficiency and production accuracy.
Performance levels for turbine designs can be stated at three levels as follows:
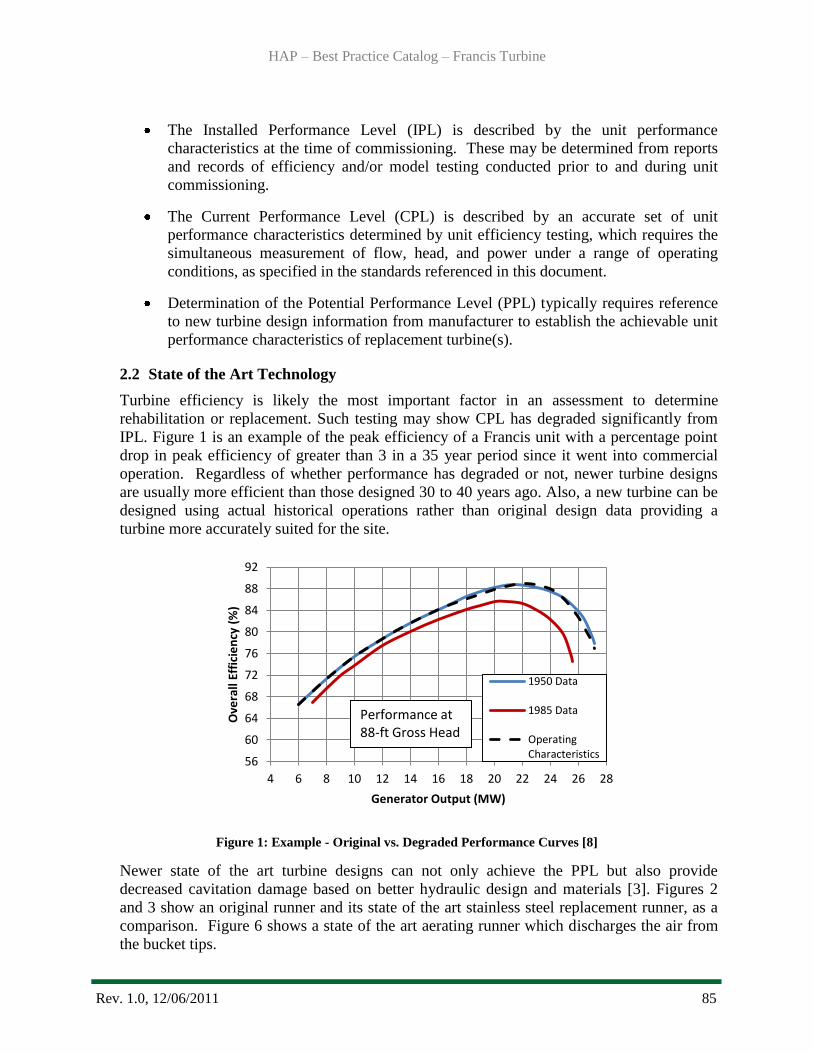
HAP – Best Practice Catalog – Francis Turbine
Rev. 1.0, 12/06/2011 85
The Installed Performance Level (IPL) is described by the unit performance
characteristics at the time of commissioning. These may be determined from reports
and records of efficiency and/or model testing conducted prior to and during unit
commissioning.
The Current Performance Level (CPL) is described by an accurate set of unit
performance characteristics determined by unit efficiency testing, which requires the
simultaneous measurement of flow, head, and power under a range of operating
conditions, as specified in the standards referenced in this document.
Determination of the Potential Performance Level (PPL) typically requires reference
to new turbine design information from manufacturer to establish the achievable unit
performance characteristics of replacement turbine(s).
2.2 State of the Art Technology
Turbine efficiency is likely the most important factor in an assessment to determine
rehabilitation or replacement. Such testing may show CPL has degraded significantly from
IPL. Figure 1 is an example of the peak efficiency of a Francis unit with a percentage point
drop in peak efficiency of greater than 3 in a 35 year period since it went into commercial
operation. Regardless of whether performance has degraded or not, newer turbine designs
are usually more efficient than those designed 30 to 40 years ago. Also, a new turbine can be
designed using actual historical operations rather than original design data providing a
turbine more accurately suited for the site.
Figure 1: Example - Original vs. Degraded Performance Curves [8]
Newer state of the art turbine designs can not only achieve the PPL but also provide
decreased cavitation damage based on better hydraulic design and materials [3]. Figures 2
and 3 show an original runner and its state of the art stainless steel replacement runner, as a
comparison. Figure 6 shows a state of the art aerating runner which discharges the air from
the bucket tips.
56
60
64
68
72
76
80
84
88
92
4 6 8 10 12 14 16 18 20 22 24 26 28
Ove
rall
Effi
cie
ncy
(%
)
Generator Output (MW)
1950 Data
1985 Data
OperatingCharacteristics
Performance at 88-ft Gross Head

HAP – Best Practice Catalog – Francis Turbine
Rev. 1.0, 12/06/2011 86
Figure 2: Original Runner
Figure 3: New Stainless Steel Replacement Runner
3.0 Operation and Maintenance Practices
3.1 Condition Assessment
After the commercial operation begins, how the turbine is operated and maintained will have
a huge impact on loss prevention of the IPL and CPL and maintaining reliability. Materials
for turbine runners are usually cast iron, steel, or stainless steel. As a best practice, the most
common material being used today for new state of the art runners is ASTM A487 / A743
CA6NM stainless steel [18, 19]. It is cavitation resistant, fairly easy to cast and fabricate,
and can usually be weld repaired without post heat treatment. The same is true for wicket
gate materials.
The other wetted turbine components such as stay vanes, spiral cases, and draft tubes are
usually constructed from steel due to strength requirements. Some components have
stainless steel cladding overlaid in critical areas. The most significant contributor to
performance loss for all wetted components is any metal loss due to cavitation, as shown in
Figure 4, abrasive erosion, surface finish degradation, and the poor quality of past repairs
which can distort the hydraulic design contours of components.
Condition assessment of those flow components must address any past damage, location of
damage, repeat damage, and resulting increase in surface roughness. Evaluating the overall
condition of a turbine and all its components may show that a new state of the art turbine
runner with enhanced power and efficiency may provide sufficient benefits to justify its
replacement, including rehabilitating related components, as compared to maintaining current
turbine with existing efficiency [3].

HAP – Best Practice Catalog – Francis Turbine
Rev. 1.0, 12/06/2011 87
Figure 4: Typical Cavitation Damage to Runner Blade
The vacuum breaker or air inlet valve is usually mounted directly to turbine head cover and
will probably require disassembly for a thorough condition assessment. A condition
assessment would include observing operation of the vacuum breaker during startup. Loose
operation or banging of the seals would indicate a misadjusted or worn device requiring
maintenance. Unit performance can also be checked with valve opened, closed, and in
normal operating position to measure and contrast any difference in unit performance that
would indicate a problem with the valve.
Aeration devices for the turbine can take the form of more complex active systems, such as
motorized blowers, to the less complex passive systems, such as baffles and self aspirating
runner designs. The passive designs are being the most common practices, as shown in
Figures 5 and 6.
Focusing on the most common designs, the condition assessment would include inspections
of the air discharge passages in the turbine and any observable cavitation or erosion damage
that might affect its normal operation. A decrease of normal dissolve oxygen uptake in the
waterway downstream could be an indicator of degradation of the condition of the aeration
device.
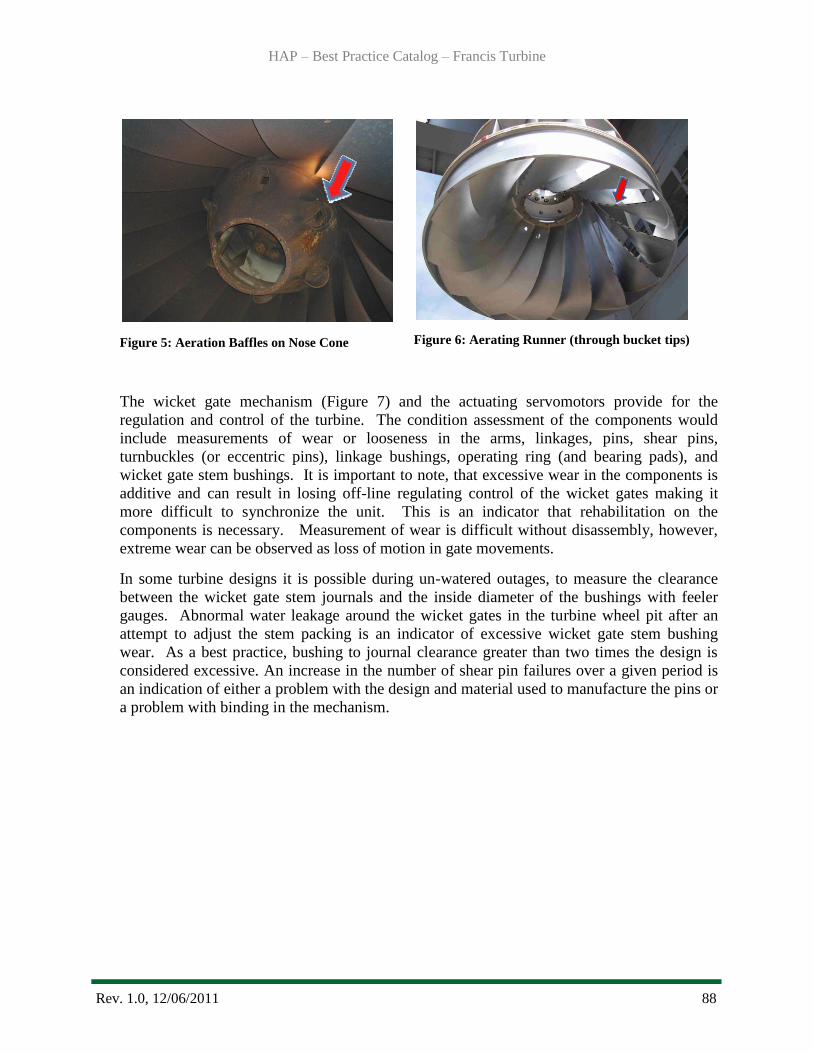
HAP – Best Practice Catalog – Francis Turbine
Rev. 1.0, 12/06/2011 88
Figure 5: Aeration Baffles on Nose Cone
Figure 6: Aerating Runner (through bucket tips)
The wicket gate mechanism (Figure 7) and the actuating servomotors provide for the
regulation and control of the turbine. The condition assessment of the components would
include measurements of wear or looseness in the arms, linkages, pins, shear pins,
turnbuckles (or eccentric pins), linkage bushings, operating ring (and bearing pads), and
wicket gate stem bushings. It is important to note, that excessive wear in the components is
additive and can result in losing off-line regulating control of the wicket gates making it
more difficult to synchronize the unit. This is an indicator that rehabilitation on the
components is necessary. Measurement of wear is difficult without disassembly, however,
extreme wear can be observed as loss of motion in gate movements.
In some turbine designs it is possible during un-watered outages, to measure the clearance
between the wicket gate stem journals and the inside diameter of the bushings with feeler
gauges. Abnormal water leakage around the wicket gates in the turbine wheel pit after an
attempt to adjust the stem packing is an indicator of excessive wicket gate stem bushing
wear. As a best practice, bushing to journal clearance greater than two times the design is
considered excessive. An increase in the number of shear pin failures over a given period is
an indication of either a problem with the design and material used to manufacture the pins or
a problem with binding in the mechanism.
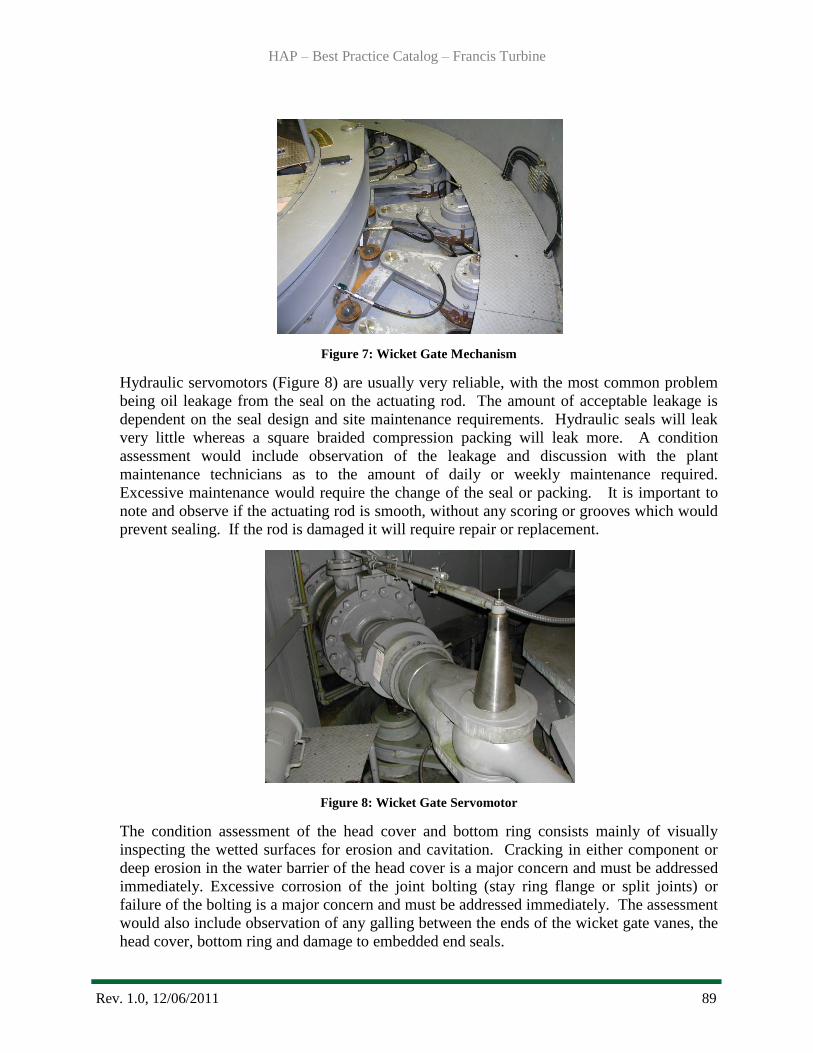
HAP – Best Practice Catalog – Francis Turbine
Rev. 1.0, 12/06/2011 89
Figure 7: Wicket Gate Mechanism
Hydraulic servomotors (Figure 8) are usually very reliable, with the most common problem
being oil leakage from the seal on the actuating rod. The amount of acceptable leakage is
dependent on the seal design and site maintenance requirements. Hydraulic seals will leak
very little whereas a square braided compression packing will leak more. A condition
assessment would include observation of the leakage and discussion with the plant
maintenance technicians as to the amount of daily or weekly maintenance required.
Excessive maintenance would require the change of the seal or packing. It is important to
note and observe if the actuating rod is smooth, without any scoring or grooves which would
prevent sealing. If the rod is damaged it will require repair or replacement.
Figure 8: Wicket Gate Servomotor
The condition assessment of the head cover and bottom ring consists mainly of visually
inspecting the wetted surfaces for erosion and cavitation. Cracking in either component or
deep erosion in the water barrier of the head cover is a major concern and must be addressed
immediately. Excessive corrosion of the joint bolting (stay ring flange or split joints) or
failure of the bolting is a major concern and must be addressed immediately. The assessment
would also include observation of any galling between the ends of the wicket gate vanes, the
head cover, bottom ring and damage to embedded end seals.
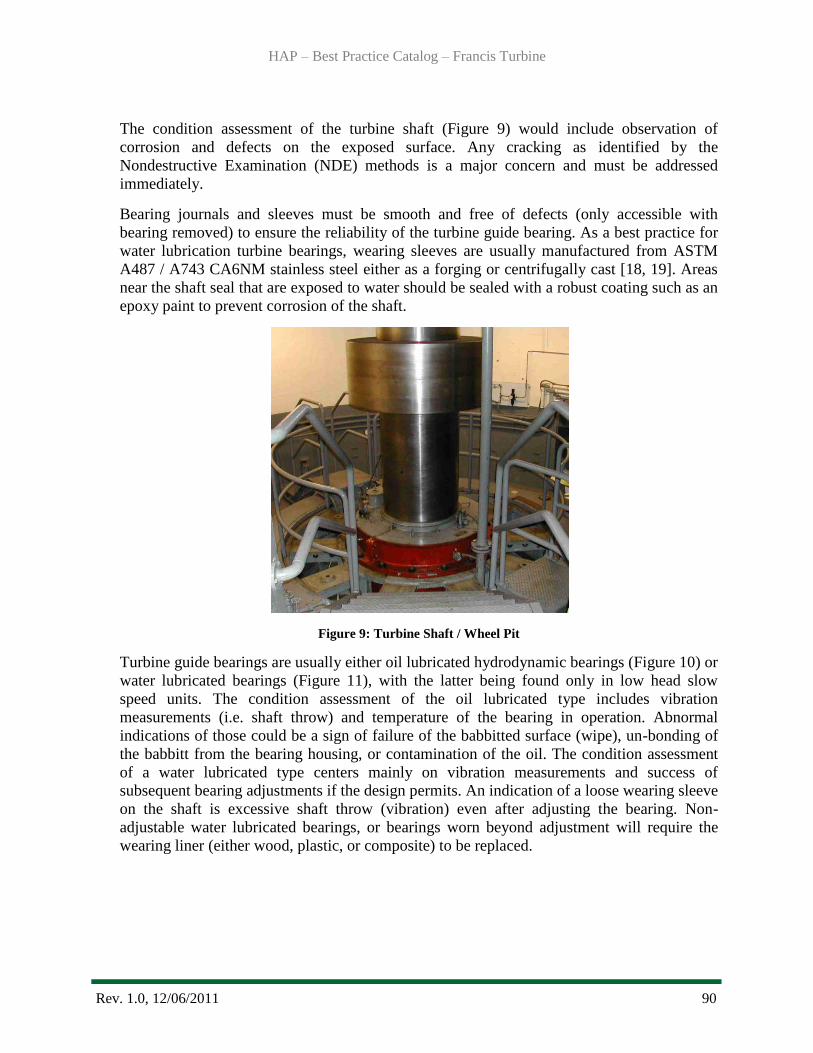
HAP – Best Practice Catalog – Francis Turbine
Rev. 1.0, 12/06/2011 90
The condition assessment of the turbine shaft (Figure 9) would include observation of
corrosion and defects on the exposed surface. Any cracking as identified by the
Nondestructive Examination (NDE) methods is a major concern and must be addressed
immediately.
Bearing journals and sleeves must be smooth and free of defects (only accessible with
bearing removed) to ensure the reliability of the turbine guide bearing. As a best practice for
water lubrication turbine bearings, wearing sleeves are usually manufactured from ASTM
A487 / A743 CA6NM stainless steel either as a forging or centrifugally cast [18, 19]. Areas
near the shaft seal that are exposed to water should be sealed with a robust coating such as an
epoxy paint to prevent corrosion of the shaft.
Figure 9: Turbine Shaft / Wheel Pit
Turbine guide bearings are usually either oil lubricated hydrodynamic bearings (Figure 10) or
water lubricated bearings (Figure 11), with the latter being found only in low head slow
speed units. The condition assessment of the oil lubricated type includes vibration
measurements (i.e. shaft throw) and temperature of the bearing in operation. Abnormal
indications of those could be a sign of failure of the babbitted surface (wipe), un-bonding of
the babbitt from the bearing housing, or contamination of the oil. The condition assessment
of a water lubricated type centers mainly on vibration measurements and success of
subsequent bearing adjustments if the design permits. An indication of a loose wearing sleeve
on the shaft is excessive shaft throw (vibration) even after adjusting the bearing. Non-
adjustable water lubricated bearings, or bearings worn beyond adjustment will require the
wearing liner (either wood, plastic, or composite) to be replaced.
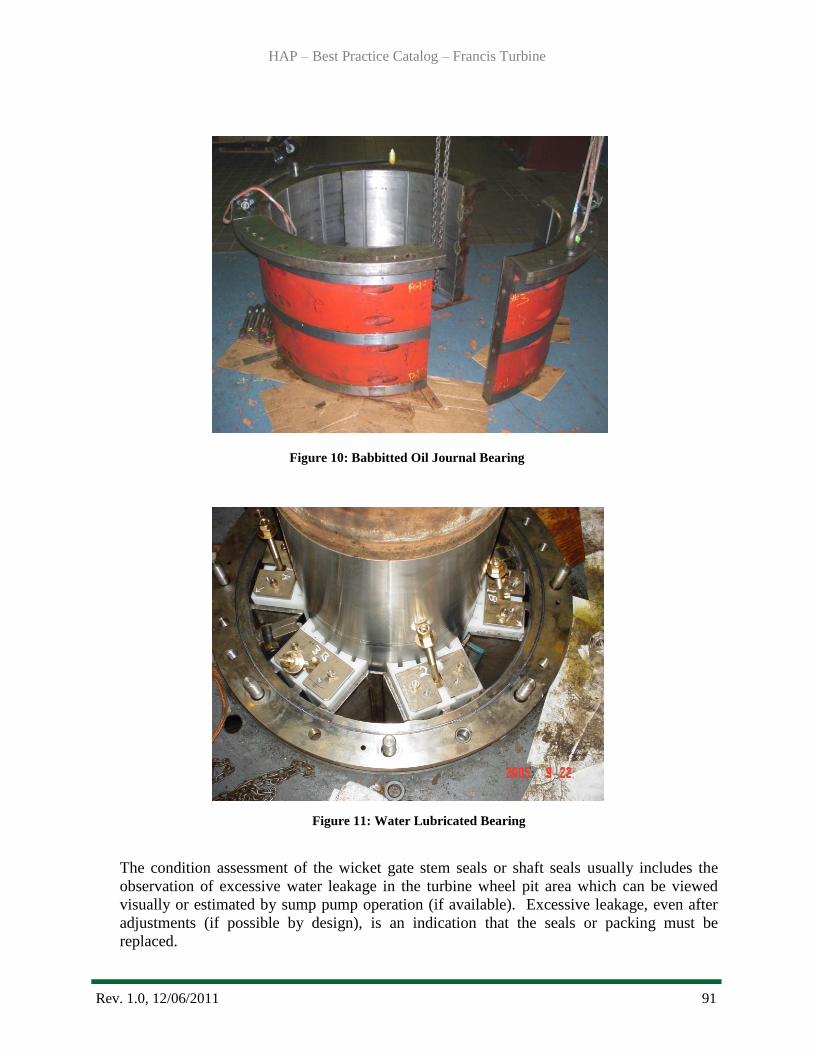
HAP – Best Practice Catalog – Francis Turbine
Rev. 1.0, 12/06/2011 91
Figure 10: Babbitted Oil Journal Bearing
Figure 11: Water Lubricated Bearing
The condition assessment of the wicket gate stem seals or shaft seals usually includes the
observation of excessive water leakage in the turbine wheel pit area which can be viewed
visually or estimated by sump pump operation (if available). Excessive leakage, even after
adjustments (if possible by design), is an indication that the seals or packing must be
replaced.
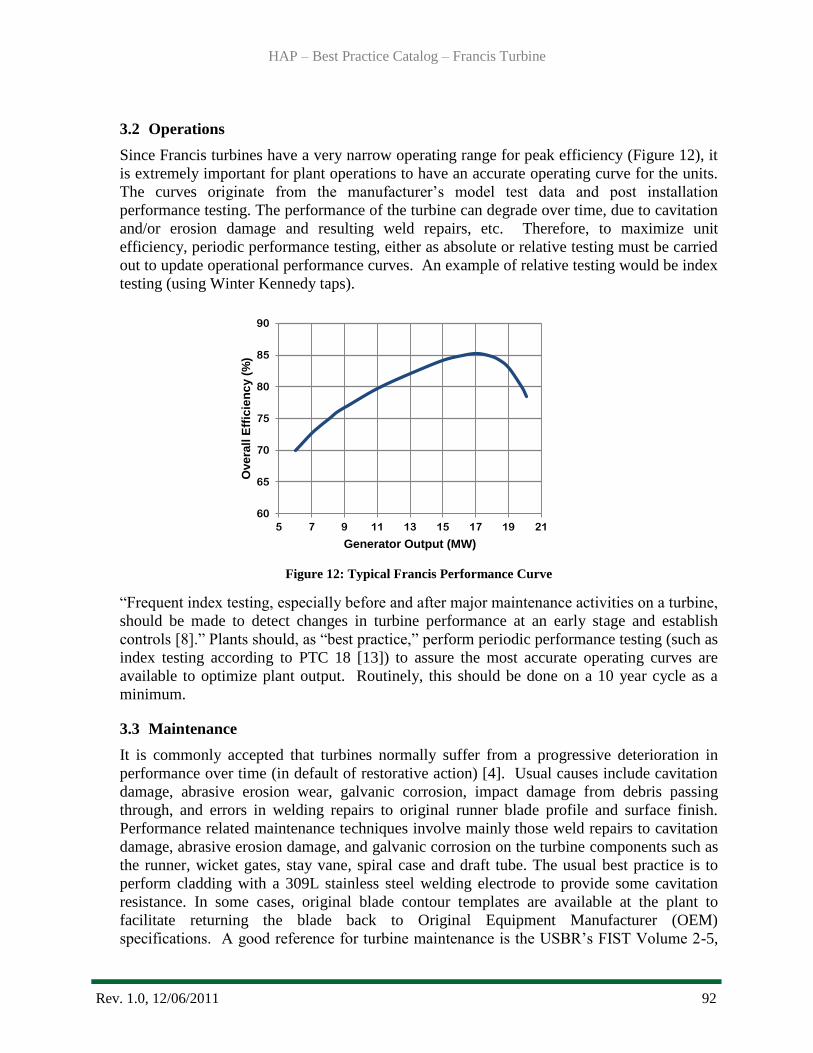
HAP – Best Practice Catalog – Francis Turbine
Rev. 1.0, 12/06/2011 92
3.2 Operations
Since Francis turbines have a very narrow operating range for peak efficiency (Figure 12), it
is extremely important for plant operations to have an accurate operating curve for the units.
The curves originate from the manufacturer‘s model test data and post installation
performance testing. The performance of the turbine can degrade over time, due to cavitation
and/or erosion damage and resulting weld repairs, etc. Therefore, to maximize unit
efficiency, periodic performance testing, either as absolute or relative testing must be carried
out to update operational performance curves. An example of relative testing would be index
testing (using Winter Kennedy taps).
Figure 12: Typical Francis Performance Curve
―Frequent index testing, especially before and after major maintenance activities on a turbine,
should be made to detect changes in turbine performance at an early stage and establish
controls [8].‖ Plants should, as ―best practice,‖ perform periodic performance testing (such as
index testing according to PTC 18 [13]) to assure the most accurate operating curves are
available to optimize plant output. Routinely, this should be done on a 10 year cycle as a
minimum.
3.3 Maintenance
It is commonly accepted that turbines normally suffer from a progressive deterioration in
performance over time (in default of restorative action) [4]. Usual causes include cavitation
damage, abrasive erosion wear, galvanic corrosion, impact damage from debris passing
through, and errors in welding repairs to original runner blade profile and surface finish.
Performance related maintenance techniques involve mainly those weld repairs to cavitation
damage, abrasive erosion damage, and galvanic corrosion on the turbine components such as
the runner, wicket gates, stay vane, spiral case and draft tube. The usual best practice is to
perform cladding with a 309L stainless steel welding electrode to provide some cavitation
resistance. In some cases, original blade contour templates are available at the plant to
facilitate returning the blade back to Original Equipment Manufacturer (OEM)
specifications. A good reference for turbine maintenance is the USBR‘s FIST Volume 2-5,
60
65
70
75
80
85
90
5 7 9 11 13 15 17 19 21
Ove
rall
Eff
icie
nc
y (
%)
Generator Output (MW)
HAP – Best Practice Catalog – Francis Turbine
Rev. 1.0, 12/06/2011 93
Turbine Repair [6] and Hydro Wheels: A Guide to Maintaining and Improving Hydro Units
by T. Spicher [13].
Francis turbine runners usually have replaceable seal rings or wear rings on the outside
diameter of the crown and band, or provision for adding such in the future. It is essential to
maintain adequate sealing to prevent excessive hydraulic thrust loads on the generator thrust
bearing (bearing carrying the unit‘s axial load, i.e., static weight plus hydraulic thrust) and
prevent excessive water leakage by-passing the runner.
The generator thrust bearing is designed to handle hydraulic loads from the seals worn to
twice the design value [1]. Therefore, as a best practice, when runner seal clearances reach
twice the design value one should consider rehabilitating or replacing the runner. Seal ring
clearances are usually measured with feeler gauges during routine maintenance and
documented for trending over time. For high head units, leakage by these seal rings may
affect the overall efficiency of the turbine by 1 to 3% [5].
Worn wicket gate end clearances can also contribute to a decline in unit performance since
leakage contributes to power generation loss, particularly by those units with a low service
factor (i.e., gates in closed position for a significant period of time). In a new unit, the
leakage through properly designed wicket gates may be markedly less than 1% of full gate
discharge, however, over years of operation this could be doubled due to eroded end
clearances, worn stem journal bushings, and improperly adjusted toe to heel closures [5]. As
a best practice, turbines with heads above 100 feet should be considered as candidates for
embedded wicket gate vane end seals and wicket gates fabricated from stainless steel to
mitigate leakage and wear.
Investigations by the US Army Corps of Engineers (USACE) show minor modifications to
the stay vane - wicket gate system could result in an operation efficiency increases of 0.5 to
0.7% for the units studied [10]. As shown in reference [10], the modification takes the form
of profile change on the stay vane leading and trailing edges modifying the wake relative to
the wicket gate. These changes have to be studied in a Computational Fluid Dynamics
(CFD) model and/or physical model. In addition, such modifications can reduce fish injury
as one environmental benefit.
In some cases, Von Karman vortices can trail off the wicket gates during high flow
operation, impinging on the runner band and blades with resulting cavitation damage. Flow
profile modifications, including a narrowing of the lower trailing edges (as shown in Figure
13) of the wicket gates, can reduce the formation of vortices, and thus allow higher flow rates
and power output. The exact profile change should be designed based on CFD and/or
physical modeling.

HAP – Best Practice Catalog – Francis Turbine
Rev. 1.0, 12/06/2011 94
Figure 13: Wicket Gate Modification
Further studies by the USACE to improve turbine efficiency have found some relationship
between surface roughness of the turbine components, and degradation of the unit
performance [9]. It is commonly known that surface roughness on flow surfaces robs a
moving fluid of energy; similar to what is found in piping systems. A higher relative
roughness will increase the friction loss usually expressed in the head.
Since the power generated by a turbine is directly related to head, logically, any loss in head
by frictional losses of the water flowing through the turbine will be a loss in performance.
Improvements in surface finish include grinding and coating (painting) the surfaces. In some
cases, the USACE tests found efficiency improvements of 0.1 to 0.8% comparing pre-coated
versus post-coating performance [9]. However, the level of uncertainty of field testing
measurement can range up to 1%, which makes it difficult to quantify results within testing
error. Common maintenance best practice of providing adequate coating of the turbine
components to prevent surface corrosion does have added benefits of improved performance,
however unquantifiable.
By design, a vacuum breaker introduces atmospheric air into the sub-atmospheric area below
the runner reducing the pressure across the runner, thereby reducing efficiency. The vacuum
breaker should be able to work at the smallest possible gate setting to avoid vibration and
rough operation, but not admit air at the higher operating gate settings. Best practice for the
vacuum breaker includes periodic maintenance (during routine inspections) to assure proper
operation and evaluation of the condition of the main seals to prevent leakage. It is important
that any stroke dampening devices built into the vacuum breaker be checked and adjusted
annually to avoid excessive cycling (banging) of the seal during operation. The vacuum
breaker, being a mechanical device subject to frictional wear, will require major maintenance
(overhauling) based on number of cycles of operation, but typically every 10 to 20 years.
Maintenance of any aeration device on the turbine includes periodic inspection (during
routine inspections) and testing of components to ensure the device is operating according to
design. Areas adjacent to the air discharge in the turbine must be monitored for damage due
HAP – Best Practice Catalog – Francis Turbine
Rev. 1.0, 12/06/2011 95
to erosion or cavitation. As a best practice, those areas if not stainless steel already should be
clad with stainless steel to mitigate damage.
Pressures in the draft tube increase as the water flows from the elbow to the exit. If the top
of the draft tube gate slots (close to the elbow) is submerged (under tail water), water can be
drawn down into the draft tube due to the lower pressure there, increasing the total flow in
the draft tube from that point to the exit, thereby increasing the head loss and reducing the
unit efficiency. The closer the gate slot is to the centerline of the unit, the greater the effect.
The use of slot fillers to plug the upper openings of the gate slots have been shown to remedy
this problem and in some cases, improve efficiency by as much as 1% is considered a best
practice.
The wicket gate mechanism consists of arms, linkages, pins, shear pins, turnbuckles (or
eccentric pins), linkage bushings, operating ring (and bearing pads), and wicket gate stem
bushings. For greased bushing designs it is essential that the greasing system is functioning
to original specification with metered grease flowing to all points. It is important to grease
the wicket gate stem bushings and observe if the grease is entering the bushing clearance and
visually discharging. If not, this will have to be repaired immediately.
Greaseless bushing designs require less routine maintenance than the greased designs;
however the most common maintenance issue is broken or loose anti-rotation devices on the
pins. The greaseless bushings will wear at a more rapid rate than the greased bushings,
requiring replacements more frequently, such as on a 10 to 20 year cycle in contrast to a 30
to 40 year cycle for greased bushings.
As a best practice, the bushings on the wicket gate linkages are usually the greaseless type in
order to reduce the amount of grease discharging into the wheel pit area and ultimately
flowing into the powerhouse sump. Bushing applications in other turbine areas, such as
wicket gate stem bushings, operating ring pads, and servomotors are usually chosen based on
the owner‘s preference when comparing bushing life and reliability versus the owner‘s desire
to minimize the use of grease lubrication. However, it is important that each greaseless
bushing is designed correctly for the application.
In some cases the friction in greaseless bushings increases over time due to trapped wear
debris and incursion of silt and debris from the water, as compared to the greased bushings
which are flushed by the movement of the grease. An increase in long term operating
friction in greaseless applications means the wicket gate servomotors must be over designed
(particularly in retrofits) with excess capacity of at least 25% in order to ensure reliable
operation [11].
Major maintenance of the wicket gate mechanism includes replacement of the pins, pads,
bushings, and true machining of wear surfaces. This will be required every 10 to 40 years
depending on the design and operating conditions. Shear pins (mechanical fuse) are an
engineered product designed to prevent failures of more costly components in the
mechanism. It is best practice to purchase the pin material from one manufacturer to ensure
material properties remain constant. Prototype sample pins are manufactured and then broken
HAP – Best Practice Catalog – Francis Turbine
Rev. 1.0, 12/06/2011 96
in a test stand to determine actual shear properties. This test data is used to finalize the shear
area diameter for the final pin shop drawing.
Routine maintenance of wicket gate servomotors is minimal and usually only requires
changing of the actuating rod seals or packing when leakage become excessive. Major
maintenance includes an overhaul of the servomotor, requiring disassembly, and replacement
of bushings, seals, and piston rings.
Head cover and bottom ring routine maintenance is usually to ensure that the protective
coating on the wetted surfaces is intact and any erosion or cavitation is repaired before it
progressively worsens. Any galling damage at or near the ends of the wicket gate vanes
must be removed by grinding to prevent further galling or damage to the wicket gate
vane end seals. For higher head units with heads above 200 feet and/or poor water
quality units it is best practice to embed stainless steel wearing plates in the head cover
and bottom ring immediately above and below the wicket gate vane ends to mitigate
erosion and cavitation damage.
It is also common to install wicket gate vane end seals (either elastomer or bronze) into
these areas to minimize leakage. Unfortunately, it is also best practice to manufacture
wicket gates from stainless steel. Since stainless steel in contact with stainless steel can
experience a high degree of galling, it is imperative that the design of wicket gate up
thrust device be robust to resist the axial movement of the gate and prevent these
surfaces from contacting. Wicket gate up thrust is generated either by the hydraulic
pressure of water under the bottom stem and/or grease application pressure. Major
maintenance of the head cover and bottom ring includes blasting and Nondestructive
Examination (NDE) for cracking inspection, recoating, replacing wear plates and runner
stationary seal rings, and replacing wicket gate bushings.
Routine turbine shaft maintenance consists of minimizing the corrosion of the shaft
surface with a light coat of oil in the non-water contact areas and periodic re-coating of
areas that come in contact with water with a robust paint such as epoxy. Major
maintenance includes refurbishment on bearing journals, replacement of wearing sleeve,
and re-truing coupling faces during a major unit overhaul.
Turbine guide bearings are usually either oil lubricated hydrodynamic bearings or water
lubricated bearings. Maintenance of an oil lubricated bearing and its reliability are
directly connected to the quality of the supplied oil used for lubrication and cooling.
Any contamination of the oil either with debris or water will increase the likelihood of a
bearing failure. A best practice is to install a kidney loop filtration system capable of
continuously removing debris and water from the bearing oil supply. Maintenance of a
water lubricated bearing and its reliability are also directly connected to the quality of
the supplied water used for lubrication and cooling. Although in this case, with the
viscosity of the water being so low, the water functions more as a coolant than as a
lubricant. A best practice is to install an automatic strainer with internal backwash for
uninterrupted supply of clean water to the bearing without need of routine maintenance
to change or clean the filters. An uninterrupted supply is essential since any loss of
water flow during turbine operation will quickly overheat the anti-friction contact
HAP – Best Practice Catalog – Francis Turbine
Rev. 1.0, 12/06/2011 97
surface of the internal liner (plastic, wood, or composite) of the bearing resulting in a
rapid failure.
Since water lubricated bearings inherently wear which results in an increase in shaft
vibration (shaft throw), periodic maintenance is required to adjust the bearing to tighten
the running clearance. Some poorly designed bearings are non-adjustable and require
the internal lining to be replaced to tighten clearance. Extreme shaft vibration (shaft
throw) can cause contact of the turbine runner‘s seal rings, resulting in wear and the
possible failure of the seal rings and extended unit outage. Major maintenance of either
bearing type requires the refurbishment of the bearings, such as re-babbitting of an oil
bearing or re-lining the water lubricated bearing. In addition, for water lubricated
bearing, the shaft wearing sleeve may have to be machined true or replaced.
Sealing components in the turbine include the wicket gate stem seals and the seal for the
turbine shaft. Routine maintenance will vary according to the type of seal and the
operating conditions. Generally the hydraulic type seals, such as PolyPak seals, on
wicket gate stems are maintenance free, however, like o-ring seals, once they leak there
are no adjustments and must be replaced. Adjustable seal designs, such as with packing,
can be tightened to reduce the leakage. Excessive leakage, even after adjustment, is an
indication that the seals or packing must be replaced.
Seals for the turbine shaft vary from simple packing in a packing box around the shaft to
higher speed applications with mechanical seals. It is important to note that a certain amount
of leakage is required in a turbine shaft seal for cooling the seal (or packing), therefore zero
leakage is not the objective. Routine maintenance includes replacement of the packing in the
packing box or replacement of the composite (sacrificial) wearing component in the
mechanical seal. Major maintenance of all the applications consists of the routine
maintenance replacements and additional replacement of any opposing hard face wear
elements such as wear sleeves for packing and hard face wear elements for the mechanical
seals.
4.0 Metrics, Monitoring and Analysis
4.1 Measures of Performance, Condition, and Reliability
The fundamental process for a hydro turbine is described by the efficiency equation, which is
defined as the ratio of the power delivered by the turbine to the power of the water passing
through the turbine.
Where: · η is the hydraulic efficiency of the turbine
· P is the mechanical power produced at the turbine shaft (MW)
· ρ is the density of water (1000 kg/m3)
· g is the acceleration due to gravity (9.81 m/s2)
· Q is the flow rate passing through the turbine (m3/s)
· H is the effective pressure head across the turbine (m)
HAP – Best Practice Catalog – Francis Turbine
Rev. 1.0, 12/06/2011 98
The general expression for this efficiency (η): [14]
Turbine performance parameters for Francis units are defined in ASME PTC-18 [13] and
IEC 60041 [14], and typically include the following: Generator Output, Turbine Discharge,
Headwater and Tailwater Elevations, Inlet Head, Discharge Head, Gate Position, and Water
Temperature.
Typical vibration measurements may include: shaft displacement (x and y) at turbine and
generator bearings, and headcover and thrust bridge displacements (z). Acoustic emission (on
the draft tube access door or liner) may be measured to track relative cavitation noise.
The condition of the Francis turbine can be monitored by the Condition Indicator (CI) as
defined according to HAP Condition Assessment Manual, ORNL, October 2011 [12].
Unit reliability characteristics, as judged by its availability for generation, can be monitored
by use of the North American Electric Reliability Corporation‘s (NERC) performance
indicators, such Equivalent Availability Factor (EAF) and Equivalent Forced Outage Factor
(EFOR). These are used universally by the power industry. Many utilities supply data to the
Generating Availability Data System (GADS) maintained by NERC. This database of
operating information is used for improving the performance of electric generating
equipment. It can be used to support equipment reliability and availability analysis and
decision-making by GADS data users.
4.2 Data Analysis
Analysis of test data is defined in ASME PTC-18 [15] and IEC 60041 [16]. Basically,
determine unit efficiency and available power output relative to turbine discharge, head, gate
opening position, and determine operating limits based on vibration and acoustic emission
measurements (CPL). Compare results to previous or original unit test data (IPL), and
determine efficiency, capacity, annual energy, and revenue loss. Compare results to new unit
design data (from turbine manufacturer), and determine potential efficiency, capacity, annual
energy, and revenue gain (PPL). For the latter, calculate the installation/rehabilitation cost
and internal rate of return to determine upgrade justification. Separately, determine the
justification of draft tube profile modification using turbine manufacturer‘s data.
Trend runner seal clearances (top and bottom) relative to OEM design values. If
rehabilitation is required (resulting in complete unit disassembly), consider the value of
installing new design unit.
Trend wicket gate end clearances (top and bottom), and toe to heel closures relative to OEM
design values. If rehabilitation is required (resulting in complete unit disassembly), consider
the value of installing new design unit. If the turbine does not already have wicket gate end
seals (either spring loaded bronze or elastomer), analytically determine the annual energy and
revenue gain associated with their use. Calculate the implementation cost and internal rate of
return.
HAP – Best Practice Catalog – Francis Turbine
Rev. 1.0, 12/06/2011 99
Monitor the operation of vacuum breaker based on routine maintenance program and through
performance testing. Consider rehabilitating the vacuum breaker if it is leaking.
Analytically or using field test data, determine the efficiency, annual energy, and revenue
gain associated with the use of draft tube gate slot fillers. Calculate the implementation cost
and internal rate of return.
The condition assessment of a Francis turbine is quantified through the CI as derived
according to HAP Condition Assessment Manual, ORNL, October 2011 [12]. The overall CI
is a composite of the CI derived from each component of the turbine. This methodology can
be applied periodically to derive a CI snapshot of the current turbine condition such that it
can be monitored over time and studied to determine condition trends that can impact
performance and reliability.
The reliability of a unit as judged by its availability to generate can be monitored through
reliability indexes or performance indicators as derived according to NERC‘s Appendix F,
Performance Indexes and Equations [17].
4.3 Integrated Improvements
The periodic field test results should be used to update the unit operating characteristics and
limits. Optimally, these would be integrated into an automatic system (e.g., Automatic
Generation Control), but if not, hard copies of the curves and limits should be made available
to all involved personnel – particularly unit operators, their importance to be emphasized,
and their ability to be understood and confirmed.
Justified projects (hydraulic re-profiling, slot fillers, unit upgrade), and a method to
constantly monitor unit performance should be implemented.
As the condition of the turbine changes, the CI and reliability indexes are trended and
analyzed. Using this data, projects can be ranked and justified in the maintenance and capital
programs to bring the turbine back to an acceptable condition and performance level.
5.0 Information Sources:
Baseline Knowledge:
Thomas C. Elliott, Standard Handbook of Powerplant Engineering, McGraw Hill Publishing,
1989
NEMA Standard for Hydraulic Turbines and Governors, Pub. No. HT1-1949
US Corps of Engineers, Hydro Plant Risk Assessment Guide, September 2006
EPRI, Increased Efficiency of Hydroelectric Power, EM 2407, June 1992
Hydroelectric Handbook, William P. Creager, John Wiley & Sons, 1950
USBR, FIST Volume 2-5, Turbine Repair, September 2000
HAP – Best Practice Catalog – Francis Turbine
Rev. 1.0, 12/06/2011
100
Hydro Life Extension Modernization Guide, Volume 2: Hydromechanical Equipment, EPRI,
Palo Alto, CA: 2000. TR-112350-V2.
State of the Art
March, P.A. and Wolff, P.J., Component Indicators for an Optimization-Based Hydro
Performance Indicator: HydroVision 2004, Montreal, Quebec, Canada, August 2004.
Brice, T.A. and Kirkland, J.E., Checking Turbine Performance by Index Testing, Hydro
Review, Vol. V, No. V, Winter, 1986
USACE, Turbine Surface Roughness Improvement, HDC-P, December, 2003
USACE, Stay Vane and Wicket Gate Relationship Study, CENWP- HDC-P, January 19, 2005
J.C. Jones, Wicket Gates – Grease vs. Greaseless, USBR O&M Workshop, April 10, 2001
ORNL, HAP Condition Assessment Manual, October, 2011
Spicher, T., Hydro Wheels: A Guide to Maintaining and Improving Hydro Units, HCI
Publications, 3rd
Edition 2004
Cateni, A., Margri, L., Grego, G.: Optimization of Hydro Power Plants Performance
importance of Rehabilitation and Maintenance in Particular for Runner – 2008
Standards:
ASME 2011, Hydraulic Turbines and Pump-Turbines, PTC 18-2011
IEC, 1991, Field Acceptance Tests to Determine the Hydraulic Performance of Hydraulic
Turbines, Storage Pumps and Pump-Turbines, IEC-60041
NERC, Appendix F, Performance Indexes and Equations, January, 2011
ASTM A487, Standard Specification for Steel Castings Suitable for Pressure Service
ASTM A743, Standard Specification for Castings, Iron-Chromium, Iron-Chromium-Nickel,
Corrosion Resistant, for General Application
Best Practice Catalog
Kaplan/Propeller Turbine
Revision 1.0, 12/06/2011
HAP – Best Practice Catalog –Kaplan/Propeller Turbine
Rev. 1.0, 12/06/2011 102
1.0 Scope and Purpose ........................................................................................................... 103
1.1 Hydropower Taxonomy Position ................................................................................. 103
1.1.1 Propeller/Kaplan Turbine Components ................................................................ 103
1.2 Summary of Best Practices .......................................................................................... 105
1.2.1 Performance/Efficiency & Capability - Oriented Best Practices ..................... 105
1.2.2 Reliability/Operations & Maintenance - Oriented Best Practices ................... 106
1.3 Best Practice Cross-references ..................................................................................... 107
2.0 Technology Design Summary .......................................................................................... 107
2.1 Material and Design Technology Evolution ................................................................ 107
2.2 State of the Art Technology ......................................................................................... 108
3.0 Operational & Maintenance Best Practices ..................................................................... 109
3.1 Condition Assessment .............................................................................................. 109
3.2 Operations .................................................................................................................... 114
3.3 Maintenance ................................................................................................................. 116
4.0 Metrics, Monitoring and Analysis ................................................................................... 122
4.1 Measures of Performance, Condition, and Reliability ................................................. 122
4.2 Data Analysis ............................................................................................................... 123
4.3 Integrated Improvements.............................................................................................. 123
5.0 Information Sources ......................................................................................................... 124
HAP – Best Practice Catalog –Kaplan/Propeller Turbine
Rev. 1.0, 12/06/2011 103
1.0 Scope and Purpose
This best practice for a Propeller/Kaplan turbine addresses its technology, condition assessment,
operations, and maintenance best practices with the objective to maximize its performance and
reliability. The primary purpose of the turbine is to function as the prime mover providing direct
horsepower to the generator. It is the most significant system in a hydro unit. How the turbine is
designed, operated, and maintained provides the most impact to the efficiency, performance, and
reliability of a hydro unit. The Propeller/Kaplan type turbine is typically used in a low head and
high flow application. Fixed-blade propeller types have a very narrow range of high efficiency
operation, while adjustable-blade types can operate at high efficiency over a wide flow and
power output range.
1.1 Hydropower Taxonomy Position
Hydropower Facility → Powerhouse → Power Train Equipment → Turbine →
Propeller/Kaplan Turbine
1.1.1 Kaplan/Propeller Turbine Components
Performance and reliability related components of a Propeller/Kaplan turbine consist of a
reaction type axial-flow runner with adjustable-blade mechanism, wicket gates and
controlling mechanism, spiral case, stay ring/stay vanes, and draft tube.
Spiral Case: The function of the spiral case (or scroll case) is to supply water from the
intake to the stay vanes, directly to the upstream portion of the turbine, and through a
unique shape of continual cross sectional area reduction to the downstream portion of the
turbine; maintaining a near uniform velocity of water around the stay vanes and wicket
gates.
Stay Ring/Vanes: The function of the stay vanes (and stay ring) is to align the flow of
water from the spiral casing to the wicket gates. They also function as support columns in
vertical units for supporting the static weight of the unit‘s stationary components and
hydraulic thrust during turbine operation.
Wicket Gates: The function of the wicket gates is primarily to control the quantity of
water entering the turbine runner, thereby controlling power output. Secondarily, the
gates control the angle of the high tangential velocity water striking the runner blades.
The optimum angle of attack will be at peak efficiency. In an adjustable-blade unit, the
tilt of the blades and opening of the gates are synchronized to maximize efficiency over
as much of the operating range as possible. The wicket gates also function as a closure
valve to minimize leakage through the turbine while it is shut down.
Runner: The function of the runner is to convert the potential energy of pressure (head)
and flow of water into mechanical energy or rotational horsepower. The Kaplan runner is
comprised of a hub, nosecone, blades, and an internal blade tilting mechanism - typically
a hydraulically-driven piston with linkage and seals. Oil pressure is provided by the
governor hydraulic system.
HAP – Best Practice Catalog –Kaplan/Propeller Turbine
Rev. 1.0, 12/06/2011 104
Draft Tube: The function of the draft tube, which is initially conically shaped and
attached to the turbine discharge, is to gradually slow down the high discharge velocity
water, capturing kinetic energy from the water, which is usually below atmospheric
pressure. In most cases, it has an elbow in order to minimize excavation for the unit. The
head recovery from the draft tube is the difference between the velocity head at the
runner discharge and draft tube discharge, overall increasing the head across the turbine.
The larger the head differential is across the turbine, the higher the turbine power output.
The throat ring of the draft tube should be steel lined from the discharge ring to the point
where the water velocity reduces to about 20 ft/s, which is considered below concrete
scouring velocity [1].
Non-performance but reliability related components of a Propeller/Kaplan turbine include
the wicket gate mechanism/servomotors, head cover, bottom ring, turbine shaft, guide
bearing, mechanical seals/packing and discharge/throat ring.
Wicket Gate Mechanism/Servomotors: The function of the wicket gate mechanism and
servomotors is to control the opening and closing of the wicket gate assembly. The
mechanism includes arms, linkages, pins, shear pins, turnbuckles or eccentric pins for
closure adjustment, operating ring (or shift ring, and bearing pads), and bushings either
greased bronze or greaseless type. Servomotors are usually hydraulically actuated using
high pressure oil from the unit governor. In some limited cases a very small unit may
have electro-mechanical servomotors.
Turbine Shaft: The function of the turbine shaft is to transfer the torque from the turbine
runner to the generator shaft and generator rotor. The shaft typically has a bearing journal
for oil lubricated hydrodynamic guide bearings on the turbine runner end or wearing
sleeve for water lubricated guide bearings. Shafts are usually manufactured from forged
steel, but some of the largest shafts can be fabricated.
Guide Bearing: The function of the turbine guide bearing is to resist the mechanical
imbalance and hydraulic side loads from the turbine runner thereby maintaining the
turbine runner in its centered position in the runner seals. It is typically mounted as close
as practical to the turbine runner and supported by the head cover. Turbine guide bearings
are usually either oil lubricated hydrodynamic (babbitted) bearings or water lubricated
(plastic, wood, or composite) bearings.
Mechanical Seals / Packing: Water retaining sealing components in the turbine includes
the seal for the turbine shaft and the wicket gate stem seals. Shaft seals are typically
either packing boxes with square braided packing or for high speed units a mechanical
seal is required. Wicket gate stem packing is usually either a square braided
compression packing, a V type or Chevron packing, or some type of hydraulic elastomer
seal. Although in the truest sense any sealing components on a turbine could be a
performance issue, since any leakage that by-passes the turbine runner is a loss of energy,
the leakage into the wheel pit is considered insignificant to the overall flow through the
turbine.
HAP – Best Practice Catalog –Kaplan/Propeller Turbine
Rev. 1.0, 12/06/2011 105
Oil filled Kaplan hubs have seals around the blade trunnions to prevent oil leakage and to
prevent water leakage into the oil. These trunnions seals are usually either double
opposing or chevron packing type.
Head Cover / Bottom Ring: The head cover is a pressurized structural member covering
the turbine runner chamber that functions as a water barrier to seal the turbine. It also
serves as a carrier for the upper wicket gate bushings, upper seal surface for the wicket
gate vanes, support for the gate operating ring, carrier for the runner stationary seal rings,
and support for the turbine guide bearing. The bottom ring serves as a carrier for the
bottom wicket gate bushings, bottom seal surface for the wicket gate vanes, and a carrier
for the bottom runner stationary seal ring.
Discharge / Throat Ring: The discharge ring serves as the steel housing of the runner
which is the transitional piece to the expanding draft tube.
1.2 Summary of Best Practices
1.2.1Performance/Efficiency & Capability - Oriented Best Practices
Periodic testing to establish accurate current unit performance characteristics and
limits.
Dissemination of accurate unit performance characteristics to unit operators, local
and remote control and decision support systems, and other personnel and offices
that influence unit dispatch or generation performance.
Real-time monitoring and periodic analysis of unit performance at Current
Performance Level (CPL) to detect and mitigate deviations from expected
efficiency for the Installed Performance Level (IPL) due to degradation or
instrument malfunction.
Periodic comparison of the CPL to the Potential Performance Level (PPL) to
trigger feasibility studies of major upgrades.
Maintain documentation of IPL and update when modification to equipment is
made (e.g., hydraulic profiling, slot fillers, unit upgrade).
Trend loss of turbine performance due to condition degradation for such causes of
metal loss (cavitation, erosion and corrosion), opening of runner seal and wicket
gate clearances, increasing water passage surface roughness.
Adjust maintenance and capitalization programs to correct deficiencies.
Include industry acknowledged ―up to date‖ choices for turbine components
materials and maintenance practices to plant engineering standards.
HAP – Best Practice Catalog –Kaplan/Propeller Turbine
Rev. 1.0, 12/06/2011 106
1.2.2 Reliability/Operations & Maintenance - Oriented Best Practices
Use ASTM A487 / A743 CA6NM stainless steel to manufacture
Propeller/Kaplan turbine runners, wicket gates, and water lubricated bearing
shaft sleeves to maximize resistance to erosion, abrasive wear, and cavitation.
Bushing clearances greater than two times the design are considered excessive
and warrants replacement.
Wicket gate shear pins (mechanical fuse) are an engineered product designed to
prevent failures of more costly components in the mechanism. When replacing
pins or spares pins, it is best practice, to purchase the pin material from one
manufacturer to ensure material properties remain consistent. Prototype sample
pins are manufactured and tested to finalize the diameter for the final pin shop
drawing.
Turbine shaft areas near the shaft seal that are exposed to water should be sealed
with a robust coating such as an epoxy paint to prevent corrosion of the shaft.
Damage from erosion and cavitation on component wetted surfaces are repaired
using 309L stainless steel welding electrodes. The electrodes increase damage
resistance.
Propeller/Kaplan turbines with heads above 100 feet should be considered as
candidates for embedded wicket gate vane end seals and wicket gates fabricated
from stainless steel to mitigate leakage and wear.
Adequate coating of the turbine wetted components not only prevents corrosion
but has added benefits of improved performance.
Vacuum breakers should be inspected routinely and adjusted for optimal
performance.
Discharge areas on a turbine runner for aeration devices should be clad with
stainless steel to mitigate cavitation.
Wicket gate mechanism linkage bushings should be of the greaseless type to
reduce grease discharge to the wheel pit and ultimately the station sump. Using
greaseless bushings in other applications possible; however, care must be taken
in any retrofit to ensure that the servomotors are of sufficient strength to operate
even after a 25% increase in long term friction.
Kidney loop filtration should be installed on turbine guide bearing oil systems.
Automatic strainers with internal backwash should be installed to supply
uninterrupted supply of clean water to water lubricated turbine guide bearings.

HAP – Best Practice Catalog –Kaplan/Propeller Turbine
Rev. 1.0, 12/06/2011 107
1.3 Best Practice Cross-references
I&C - Automation Best Practice
Mechanical - Lubrication Best Practice
Mechanical - Generator Best Practice
Mechanical – Governor Best Practice
Mechanical – Raw Water Best Practice
2.0 Technology Design Summary
2.1 Material and Design Technology Evolution
Propeller/Kaplan turbine blades and internal parts are typically cast; whereas the hub and
nose cone are either cast or rolled and welded. Very old runners, from the early 1900‘s or
before, could have been cast from cast iron, later replaced with cast carbon steel. Today‘s
casting would involve casting or fabrication from carbon steel or stainless steel. As a best
practice, the most common material used for the blades is ASTM A487/A743 CA6NM
stainless steel [18, 17]. It is cavitation-resistant, fairly easy to cast and fabricate, and can
usually be weld-repaired without post heat treatment.
Best practice for the turbine begins with a superior design to maximize and establish the
baseline performance while minimizing damage due to various factors, including cavitation,
pitting, and rough operation. The advent of computerized design and manufacturing occurred
in the late 1970‘s through 1980‘s and made many of the advancements of today possible.
Modern Computational Fluid Dynamics (CFD) flow analysis, Finite Element Analysis
techniques (FEA) for engineering, and Computer Numerically Controlled (CNC) in
manufacturing have significantly improved turbine efficiency and production accuracy.
Performance levels for turbine designs can be stated at three levels as follows:
The Installed Performance Level (IPL) is described by the unit performance
characteristics at the time of commissioning. These may be determined from reports
and records of efficiency and/or model testing conducted prior to and during unit
commissioning.
The Current Performance Level (CPL) is described by an accurate set of unit
performance characteristics determined by unit efficiency testing, which requires the
simultaneous measurement of flow, head, and power under a range of operating
conditions, as specified in the standards referenced in this document.
Determination of the Potential Performance Level (PPL) typically requires reference
to new turbine design information from manufacturers to establish the achievable unit
performance characteristics of replacement turbine(s).

HAP – Best Practice Catalog –Kaplan/Propeller Turbine
Rev. 1.0, 12/06/2011 108
2.2 State of the Art Technology
Turbine efficiency is likely the most important factor in a condition assessment to determine
rehabilitation or replacement. Testing may show performance has degraded significantly. For
example the efficiency of a Kaplan unit has experienced steady degradation amounting to a
total of 4 percentage points over a 19 year period (Figure 1).
Figure 1: Kaplan Performance Degradation
Regardless of whether performance has degraded or not, newer turbine designs are usually
more efficient than those designed 30 to 40 years ago. Also, a new turbine can be designed
using actual historical data rather than original design data providing a turbine more
accurately suited for the site. Newer turbine designs also provide decreased cavitation based
on better hydraulic design and materials [2]. For comparison, Figures 2 and 3 show an
original runner and its stainless steel replacement runner.
2,000
6,000
10,000
14,000
18,000
22,000
26,000
30,000
34,000
55
60
65
70
75
80
85
90
95
5,000 10,000 15,000 20,000 25,000 30,000 35,000 40,000 45,000 50,000
Tu
rbin
e D
isch
arg
e -
cfs
Tu
rbin
e E
ffic
ien
cy -
%
Turbine Output - hp
Off-Cam 2004
Optimum Cam 2004
1985
1997
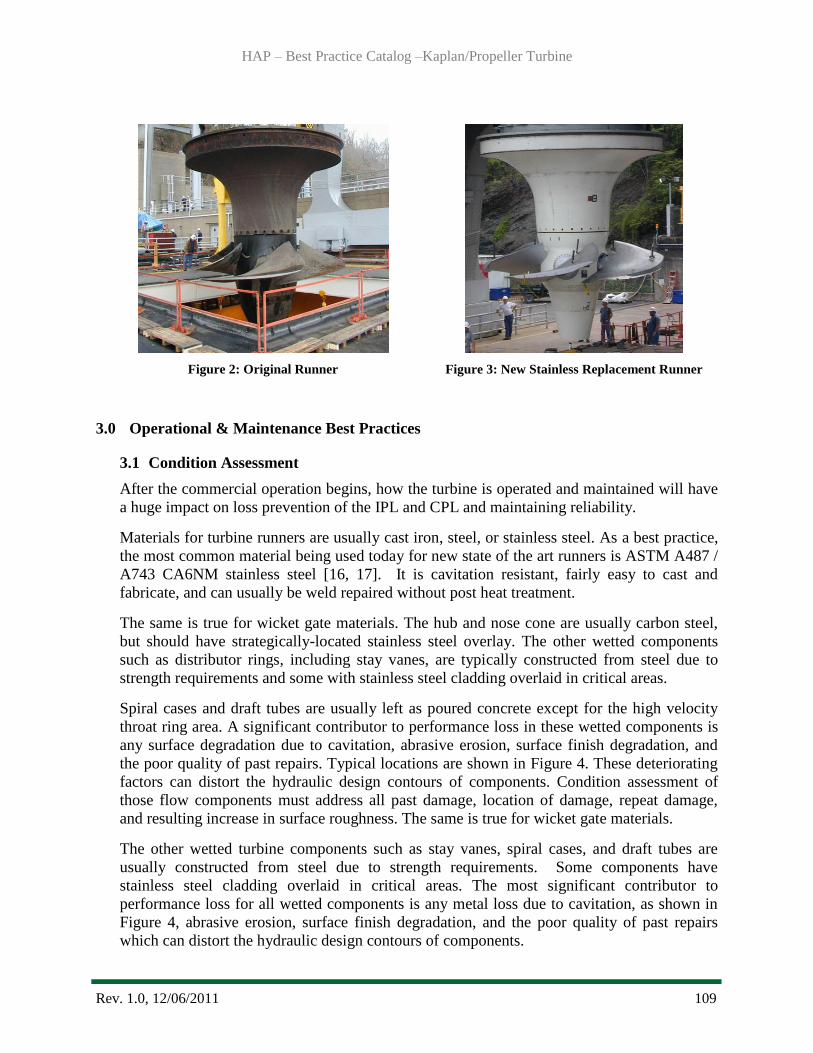
HAP – Best Practice Catalog –Kaplan/Propeller Turbine
Rev. 1.0, 12/06/2011 109
3.0 Operational & Maintenance Best Practices
3.1 Condition Assessment
After the commercial operation begins, how the turbine is operated and maintained will have
a huge impact on loss prevention of the IPL and CPL and maintaining reliability.
Materials for turbine runners are usually cast iron, steel, or stainless steel. As a best practice,
the most common material being used today for new state of the art runners is ASTM A487 /
A743 CA6NM stainless steel [16, 17]. It is cavitation resistant, fairly easy to cast and
fabricate, and can usually be weld repaired without post heat treatment.
The same is true for wicket gate materials. The hub and nose cone are usually carbon steel,
but should have strategically-located stainless steel overlay. The other wetted components
such as distributor rings, including stay vanes, are typically constructed from steel due to
strength requirements and some with stainless steel cladding overlaid in critical areas.
Spiral cases and draft tubes are usually left as poured concrete except for the high velocity
throat ring area. A significant contributor to performance loss in these wetted components is
any surface degradation due to cavitation, abrasive erosion, surface finish degradation, and
the poor quality of past repairs. Typical locations are shown in Figure 4. These deteriorating
factors can distort the hydraulic design contours of components. Condition assessment of
those flow components must address all past damage, location of damage, repeat damage,
and resulting increase in surface roughness. The same is true for wicket gate materials.
The other wetted turbine components such as stay vanes, spiral cases, and draft tubes are
usually constructed from steel due to strength requirements. Some components have
stainless steel cladding overlaid in critical areas. The most significant contributor to
performance loss for all wetted components is any metal loss due to cavitation, as shown in
Figure 4, abrasive erosion, surface finish degradation, and the poor quality of past repairs
which can distort the hydraulic design contours of components.
Figure 2: Original Runner
Figure 3: New Stainless Replacement Runner
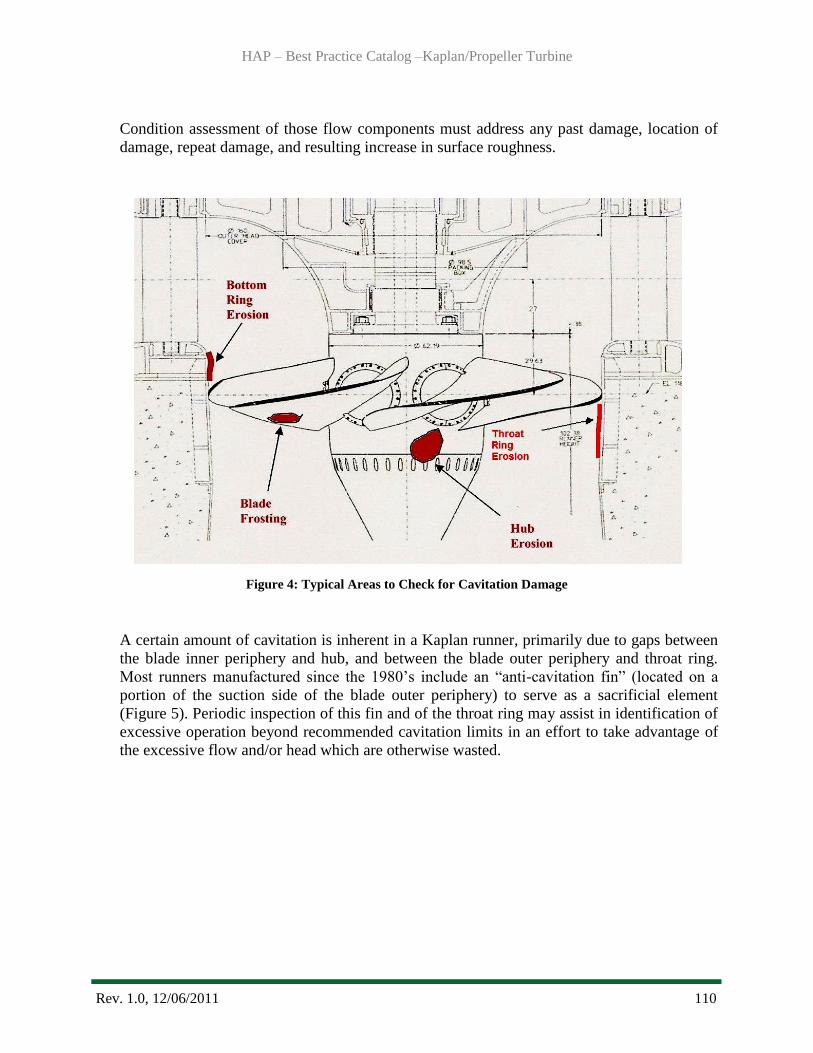
HAP – Best Practice Catalog –Kaplan/Propeller Turbine
Rev. 1.0, 12/06/2011 110
Condition assessment of those flow components must address any past damage, location of
damage, repeat damage, and resulting increase in surface roughness.
Figure 4: Typical Areas to Check for Cavitation Damage
A certain amount of cavitation is inherent in a Kaplan runner, primarily due to gaps between
the blade inner periphery and hub, and between the blade outer periphery and throat ring.
Most runners manufactured since the 1980‘s include an ―anti-cavitation fin‖ (located on a
portion of the suction side of the blade outer periphery) to serve as a sacrificial element
(Figure 5). Periodic inspection of this fin and of the throat ring may assist in identification of
excessive operation beyond recommended cavitation limits in an effort to take advantage of
the excessive flow and/or head which are otherwise wasted.

HAP – Best Practice Catalog –Kaplan/Propeller Turbine
Rev. 1.0, 12/06/2011 111
Figure 5: Anti-Cavitation Fin & Throat Ring Overlay
A comparison of the blade tip clearances to original installation measurements will provide
an indication of the condition of the mechanism (bushings/bearings) securing the blade
trunnions. Increased play in the securing mechanism of the trunnions can result in sagging
blade tips which essentially creates a modified hydraulic profile from that designed, and
consequent reduction in performance.
Drifting of the blade position over time and excessive oil usage may indicate the need to
replace piston rings or other oil seals in the system. Maintaining blade position is paramount
for optimizing performance. A periodic check should be made of the blade position on the
hub versus the indicated position outside the unit, since original manufacturer‘s data (usually
model) is often required to develop the optimum gate-blade relationship over the full head
range.
Evaluating the condition of a turbine and its components may show that a new, state of the
art designed runner with enhanced power and efficiency may provide sufficient benefits to
justify its replacement, including rehabilitating related components, as compared to
maintaining the current turbine with its existing efficiency [2].
The wicket gate mechanism (Figure 6) and the actuating servomotors provide for the
regulation and control of the turbine. The condition assessment of the components would
include measurements of wear or looseness in the arms, linkages, pins, shear pins,
turnbuckles (or eccentric pins), linkage bushings, operating ring (and bearing pads), and
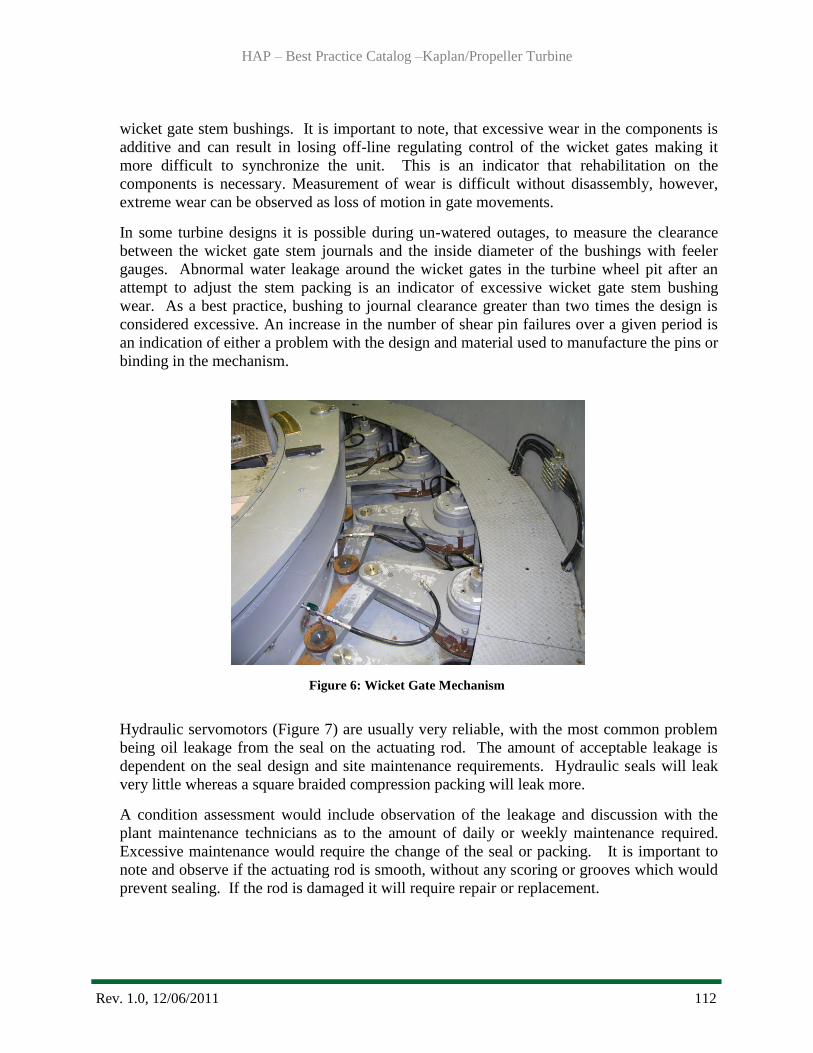
HAP – Best Practice Catalog –Kaplan/Propeller Turbine
Rev. 1.0, 12/06/2011 112
wicket gate stem bushings. It is important to note, that excessive wear in the components is
additive and can result in losing off-line regulating control of the wicket gates making it
more difficult to synchronize the unit. This is an indicator that rehabilitation on the
components is necessary. Measurement of wear is difficult without disassembly, however,
extreme wear can be observed as loss of motion in gate movements.
In some turbine designs it is possible during un-watered outages, to measure the clearance
between the wicket gate stem journals and the inside diameter of the bushings with feeler
gauges. Abnormal water leakage around the wicket gates in the turbine wheel pit after an
attempt to adjust the stem packing is an indicator of excessive wicket gate stem bushing
wear. As a best practice, bushing to journal clearance greater than two times the design is
considered excessive. An increase in the number of shear pin failures over a given period is
an indication of either a problem with the design and material used to manufacture the pins or
binding in the mechanism.
Figure 6: Wicket Gate Mechanism
Hydraulic servomotors (Figure 7) are usually very reliable, with the most common problem
being oil leakage from the seal on the actuating rod. The amount of acceptable leakage is
dependent on the seal design and site maintenance requirements. Hydraulic seals will leak
very little whereas a square braided compression packing will leak more.
A condition assessment would include observation of the leakage and discussion with the
plant maintenance technicians as to the amount of daily or weekly maintenance required.
Excessive maintenance would require the change of the seal or packing. It is important to
note and observe if the actuating rod is smooth, without any scoring or grooves which would
prevent sealing. If the rod is damaged it will require repair or replacement.
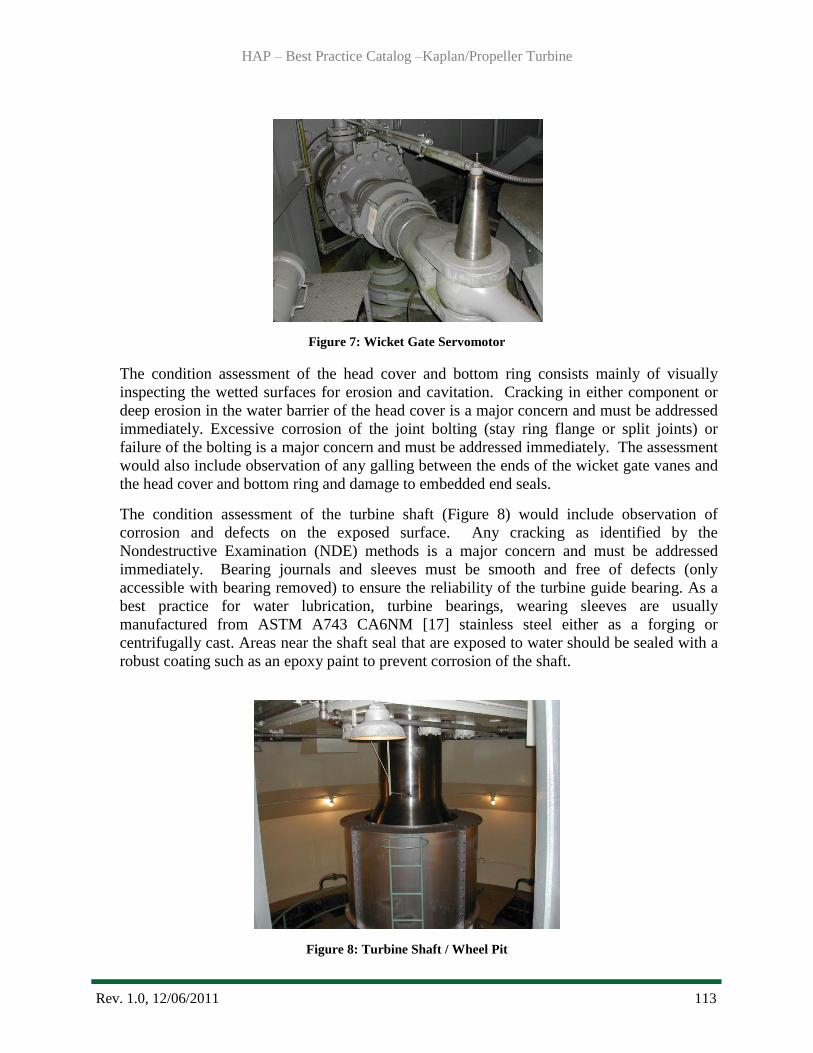
HAP – Best Practice Catalog –Kaplan/Propeller Turbine
Rev. 1.0, 12/06/2011 113
Figure 7: Wicket Gate Servomotor
The condition assessment of the head cover and bottom ring consists mainly of visually
inspecting the wetted surfaces for erosion and cavitation. Cracking in either component or
deep erosion in the water barrier of the head cover is a major concern and must be addressed
immediately. Excessive corrosion of the joint bolting (stay ring flange or split joints) or
failure of the bolting is a major concern and must be addressed immediately. The assessment
would also include observation of any galling between the ends of the wicket gate vanes and
the head cover and bottom ring and damage to embedded end seals.
The condition assessment of the turbine shaft (Figure 8) would include observation of
corrosion and defects on the exposed surface. Any cracking as identified by the
Nondestructive Examination (NDE) methods is a major concern and must be addressed
immediately. Bearing journals and sleeves must be smooth and free of defects (only
accessible with bearing removed) to ensure the reliability of the turbine guide bearing. As a
best practice for water lubrication, turbine bearings, wearing sleeves are usually
manufactured from ASTM A743 CA6NM [17] stainless steel either as a forging or
centrifugally cast. Areas near the shaft seal that are exposed to water should be sealed with a
robust coating such as an epoxy paint to prevent corrosion of the shaft.
Figure 8: Turbine Shaft / Wheel Pit
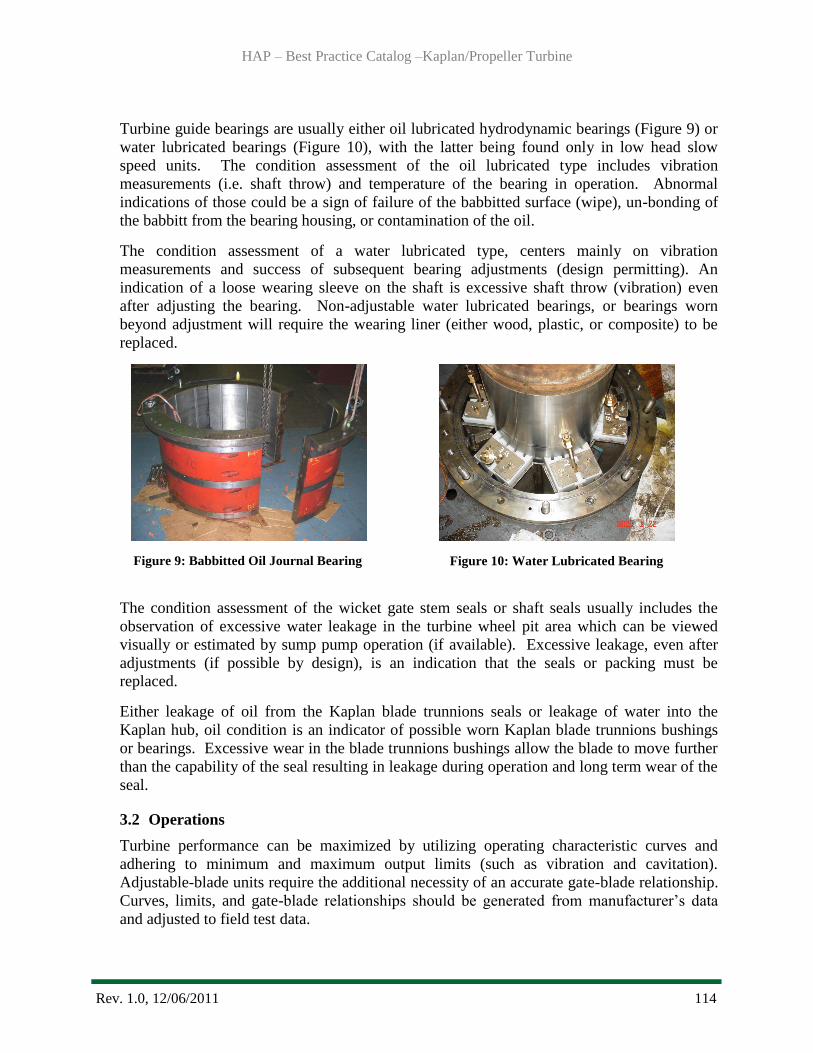
HAP – Best Practice Catalog –Kaplan/Propeller Turbine
Rev. 1.0, 12/06/2011 114
Turbine guide bearings are usually either oil lubricated hydrodynamic bearings (Figure 9) or
water lubricated bearings (Figure 10), with the latter being found only in low head slow
speed units. The condition assessment of the oil lubricated type includes vibration
measurements (i.e. shaft throw) and temperature of the bearing in operation. Abnormal
indications of those could be a sign of failure of the babbitted surface (wipe), un-bonding of
the babbitt from the bearing housing, or contamination of the oil.
The condition assessment of a water lubricated type, centers mainly on vibration
measurements and success of subsequent bearing adjustments (design permitting). An
indication of a loose wearing sleeve on the shaft is excessive shaft throw (vibration) even
after adjusting the bearing. Non-adjustable water lubricated bearings, or bearings worn
beyond adjustment will require the wearing liner (either wood, plastic, or composite) to be
replaced.
Figure 9: Babbitted Oil Journal Bearing
Figure 10: Water Lubricated Bearing
The condition assessment of the wicket gate stem seals or shaft seals usually includes the
observation of excessive water leakage in the turbine wheel pit area which can be viewed
visually or estimated by sump pump operation (if available). Excessive leakage, even after
adjustments (if possible by design), is an indication that the seals or packing must be
replaced.
Either leakage of oil from the Kaplan blade trunnions seals or leakage of water into the
Kaplan hub, oil condition is an indicator of possible worn Kaplan blade trunnions bushings
or bearings. Excessive wear in the blade trunnions bushings allow the blade to move further
than the capability of the seal resulting in leakage during operation and long term wear of the
seal.
3.2 Operations
Turbine performance can be maximized by utilizing operating characteristic curves and
adhering to minimum and maximum output limits (such as vibration and cavitation).
Adjustable-blade units require the additional necessity of an accurate gate-blade relationship.
Curves, limits, and gate-blade relationships should be generated from manufacturer‘s data
and adjusted to field test data.

HAP – Best Practice Catalog –Kaplan/Propeller Turbine
Rev. 1.0, 12/06/2011 115
Operation will only be as good as this information is accurate. Plus, the performance of the
turbine can degrade over time due to cavitation and/or erosion damage and resulting weld
repairs, etc. Periodic performance checks, through absolute or relative (e.g., index) testing,
are necessary for maintaining accuracy, and must be made comprehensively at a number of
operating heads. If a 2-dimensional (2D) cam is used in the governor for blade tilt control, it
must be adjusted periodically to changing head conditions. If an electronic 3-dimensional
(3D) cam is used, the database must be updated as needed, and the head inputs must checked
against independent measurements particularly if the permanent measurement location can be
affected by trash buildup.
Figure 11 shows typical performance curves for fixed and adjustable-blade units (in this case,
from the same plant). The very narrow range of high efficiency in the fixed blade units must
be defined accurately to optimize performance. In contrast, the adjustable-blade units offer a
much wider range of high efficiency; however, the absolute peaks of the individual blade tilt
efficiency curves (Figure 1) must be defined accurately in order to develop the optimum
gate-blade relationships required to realize optimum performance.
Figure 11: Typical Fixed and Adjustable-Blade Unit Efficiency Curves
Frequent index testing, especially before and after major maintenance activities on a turbine,
should be made to detect changes in turbine performance at an early stage and establish
controls. [5] Plants should, ―as best practice‖, perform periodic performance testing (such as
index testing according to PTC 18 [14] to assure the most accurate operating curves are
available to optimize plant output. This should be done on a 10 year cycle, as a minimum.
Pressures in the draft tube increase as the water flows from the elbow to the exit. If the top of
the draft tube gate slots are submerged (under tailwater), water can be drawn down into the
65
70
75
80
85
5 10 15 20 25 30
Ov
era
ll E
ffic
ien
cy (
%)
Generator Output (MW)
Fixed Blade 1 Fixed Blade 1 Adjustable Blade 1
Adjustable Blade 2
Fixed Blade 1
Fixed Blade 2
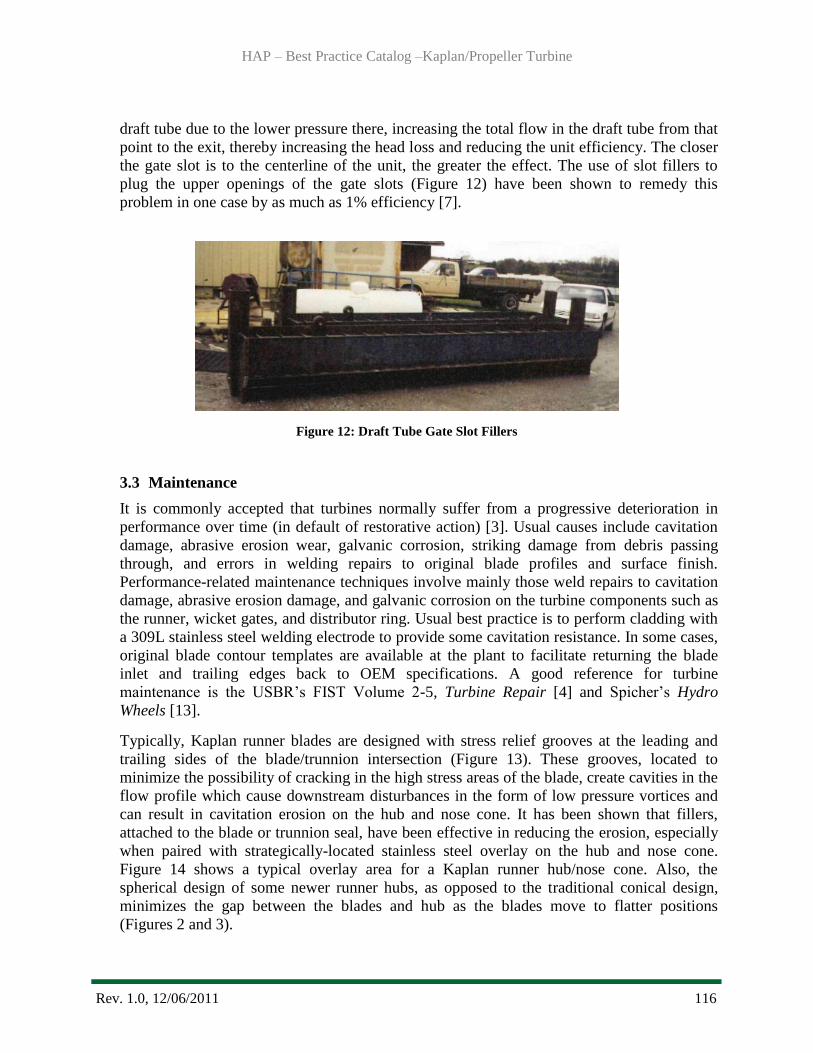
HAP – Best Practice Catalog –Kaplan/Propeller Turbine
Rev. 1.0, 12/06/2011 116
draft tube due to the lower pressure there, increasing the total flow in the draft tube from that
point to the exit, thereby increasing the head loss and reducing the unit efficiency. The closer
the gate slot is to the centerline of the unit, the greater the effect. The use of slot fillers to
plug the upper openings of the gate slots (Figure 12) have been shown to remedy this
problem in one case by as much as 1% efficiency [7].
Figure 12: Draft Tube Gate Slot Fillers
3.3 Maintenance
It is commonly accepted that turbines normally suffer from a progressive deterioration in
performance over time (in default of restorative action) [3]. Usual causes include cavitation
damage, abrasive erosion wear, galvanic corrosion, striking damage from debris passing
through, and errors in welding repairs to original blade profiles and surface finish.
Performance-related maintenance techniques involve mainly those weld repairs to cavitation
damage, abrasive erosion damage, and galvanic corrosion on the turbine components such as
the runner, wicket gates, and distributor ring. Usual best practice is to perform cladding with
a 309L stainless steel welding electrode to provide some cavitation resistance. In some cases,
original blade contour templates are available at the plant to facilitate returning the blade
inlet and trailing edges back to OEM specifications. A good reference for turbine
maintenance is the USBR‘s FIST Volume 2-5, Turbine Repair [4] and Spicher‘s Hydro
Wheels [13].
Typically, Kaplan runner blades are designed with stress relief grooves at the leading and
trailing sides of the blade/trunnion intersection (Figure 13). These grooves, located to
minimize the possibility of cracking in the high stress areas of the blade, create cavities in the
flow profile which cause downstream disturbances in the form of low pressure vortices and
can result in cavitation erosion on the hub and nose cone. It has been shown that fillers,
attached to the blade or trunnion seal, have been effective in reducing the erosion, especially
when paired with strategically-located stainless steel overlay on the hub and nose cone.
Figure 14 shows a typical overlay area for a Kaplan runner hub/nose cone. Also, the
spherical design of some newer runner hubs, as opposed to the traditional conical design,
minimizes the gap between the blades and hub as the blades move to flatter positions
(Figures 2 and 3).
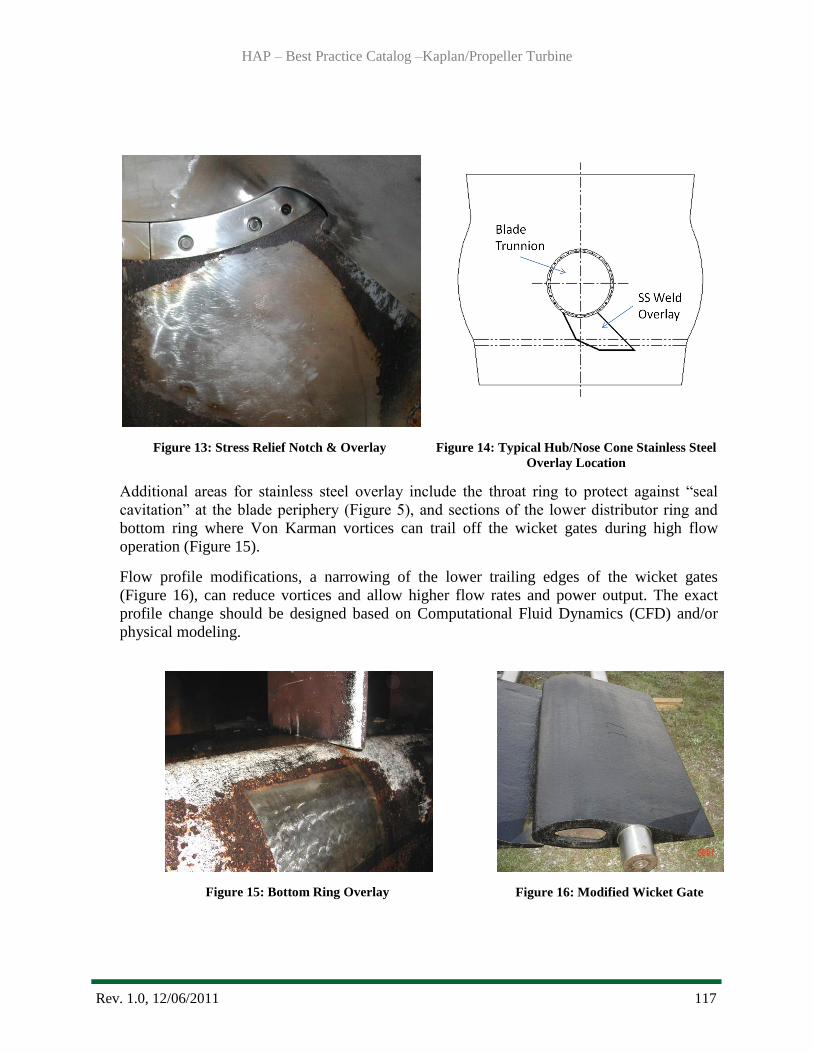
HAP – Best Practice Catalog –Kaplan/Propeller Turbine
Rev. 1.0, 12/06/2011 117
Additional areas for stainless steel overlay include the throat ring to protect against ―seal
cavitation‖ at the blade periphery (Figure 5), and sections of the lower distributor ring and
bottom ring where Von Karman vortices can trail off the wicket gates during high flow
operation (Figure 15).
Flow profile modifications, a narrowing of the lower trailing edges of the wicket gates
(Figure 16), can reduce vortices and allow higher flow rates and power output. The exact
profile change should be designed based on Computational Fluid Dynamics (CFD) and/or
physical modeling.
Figure 15: Bottom Ring Overlay
Figure 16: Modified Wicket Gate
Figure 13: Stress Relief Notch & Overlay
Figure 14: Typical Hub/Nose Cone Stainless Steel
Overlay Location
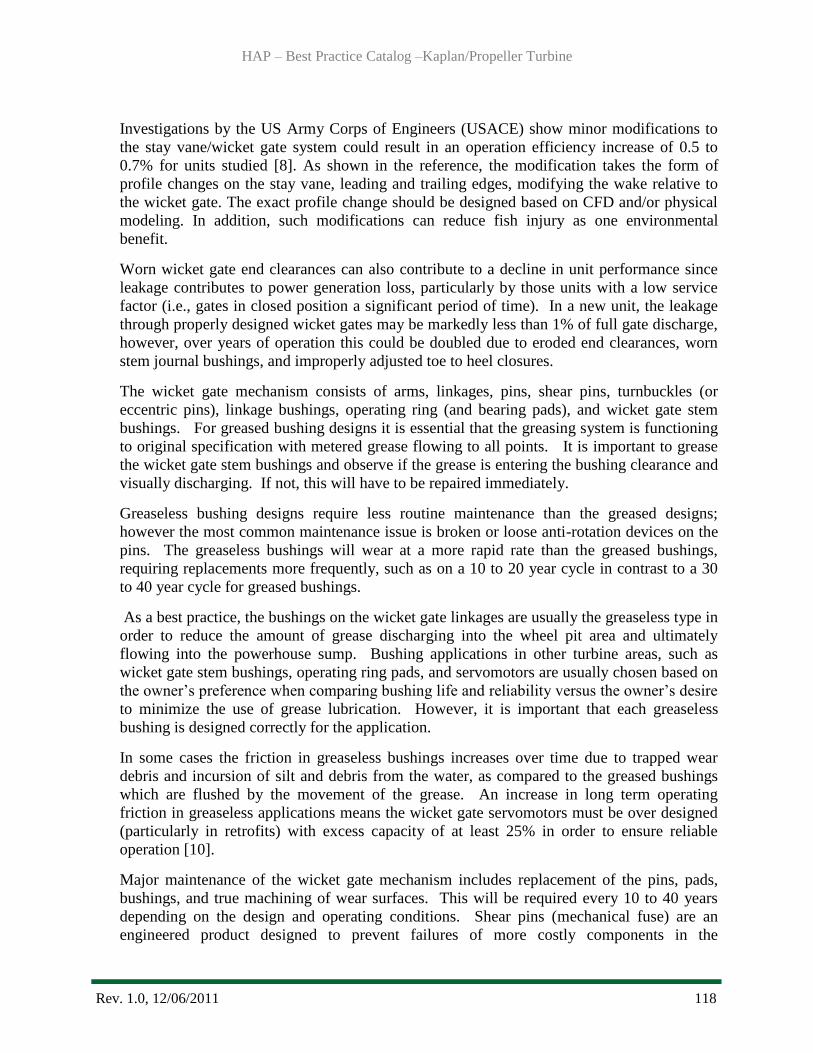
HAP – Best Practice Catalog –Kaplan/Propeller Turbine
Rev. 1.0, 12/06/2011 118
Investigations by the US Army Corps of Engineers (USACE) show minor modifications to
the stay vane/wicket gate system could result in an operation efficiency increase of 0.5 to
0.7% for units studied [8]. As shown in the reference, the modification takes the form of
profile changes on the stay vane, leading and trailing edges, modifying the wake relative to
the wicket gate. The exact profile change should be designed based on CFD and/or physical
modeling. In addition, such modifications can reduce fish injury as one environmental
benefit.
Worn wicket gate end clearances can also contribute to a decline in unit performance since
leakage contributes to power generation loss, particularly by those units with a low service
factor (i.e., gates in closed position a significant period of time). In a new unit, the leakage
through properly designed wicket gates may be markedly less than 1% of full gate discharge,
however, over years of operation this could be doubled due to eroded end clearances, worn
stem journal bushings, and improperly adjusted toe to heel closures.
The wicket gate mechanism consists of arms, linkages, pins, shear pins, turnbuckles (or
eccentric pins), linkage bushings, operating ring (and bearing pads), and wicket gate stem
bushings. For greased bushing designs it is essential that the greasing system is functioning
to original specification with metered grease flowing to all points. It is important to grease
the wicket gate stem bushings and observe if the grease is entering the bushing clearance and
visually discharging. If not, this will have to be repaired immediately.
Greaseless bushing designs require less routine maintenance than the greased designs;
however the most common maintenance issue is broken or loose anti-rotation devices on the
pins. The greaseless bushings will wear at a more rapid rate than the greased bushings,
requiring replacements more frequently, such as on a 10 to 20 year cycle in contrast to a 30
to 40 year cycle for greased bushings.
As a best practice, the bushings on the wicket gate linkages are usually the greaseless type in
order to reduce the amount of grease discharging into the wheel pit area and ultimately
flowing into the powerhouse sump. Bushing applications in other turbine areas, such as
wicket gate stem bushings, operating ring pads, and servomotors are usually chosen based on
the owner‘s preference when comparing bushing life and reliability versus the owner‘s desire
to minimize the use of grease lubrication. However, it is important that each greaseless
bushing is designed correctly for the application.
In some cases the friction in greaseless bushings increases over time due to trapped wear
debris and incursion of silt and debris from the water, as compared to the greased bushings
which are flushed by the movement of the grease. An increase in long term operating
friction in greaseless applications means the wicket gate servomotors must be over designed
(particularly in retrofits) with excess capacity of at least 25% in order to ensure reliable
operation [10].
Major maintenance of the wicket gate mechanism includes replacement of the pins, pads,
bushings, and true machining of wear surfaces. This will be required every 10 to 40 years
depending on the design and operating conditions. Shear pins (mechanical fuse) are an
engineered product designed to prevent failures of more costly components in the
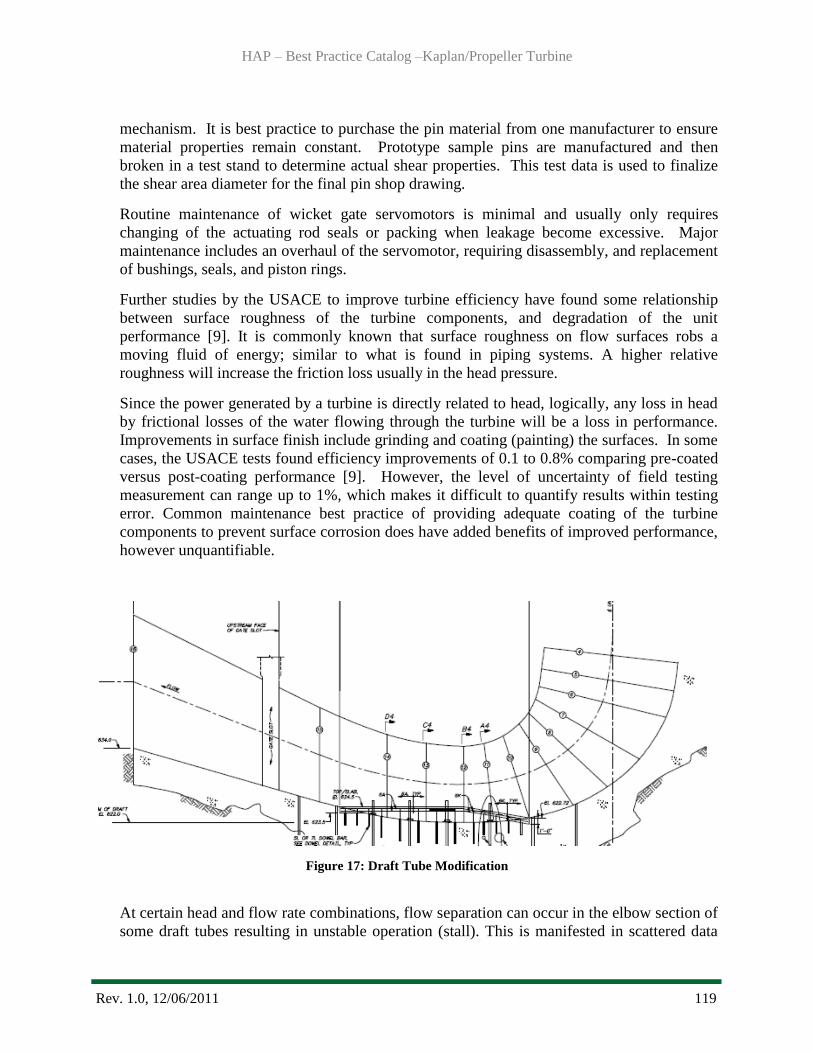
HAP – Best Practice Catalog –Kaplan/Propeller Turbine
Rev. 1.0, 12/06/2011 119
mechanism. It is best practice to purchase the pin material from one manufacturer to ensure
material properties remain constant. Prototype sample pins are manufactured and then
broken in a test stand to determine actual shear properties. This test data is used to finalize
the shear area diameter for the final pin shop drawing.
Routine maintenance of wicket gate servomotors is minimal and usually only requires
changing of the actuating rod seals or packing when leakage become excessive. Major
maintenance includes an overhaul of the servomotor, requiring disassembly, and replacement
of bushings, seals, and piston rings.
Further studies by the USACE to improve turbine efficiency have found some relationship
between surface roughness of the turbine components, and degradation of the unit
performance [9]. It is commonly known that surface roughness on flow surfaces robs a
moving fluid of energy; similar to what is found in piping systems. A higher relative
roughness will increase the friction loss usually in the head pressure.
Since the power generated by a turbine is directly related to head, logically, any loss in head
by frictional losses of the water flowing through the turbine will be a loss in performance.
Improvements in surface finish include grinding and coating (painting) the surfaces. In some
cases, the USACE tests found efficiency improvements of 0.1 to 0.8% comparing pre-coated
versus post-coating performance [9]. However, the level of uncertainty of field testing
measurement can range up to 1%, which makes it difficult to quantify results within testing
error. Common maintenance best practice of providing adequate coating of the turbine
components to prevent surface corrosion does have added benefits of improved performance,
however unquantifiable.
Figure 17: Draft Tube Modification
At certain head and flow rate combinations, flow separation can occur in the elbow section of
some draft tubes resulting in unstable operation (stall). This is manifested in scattered data
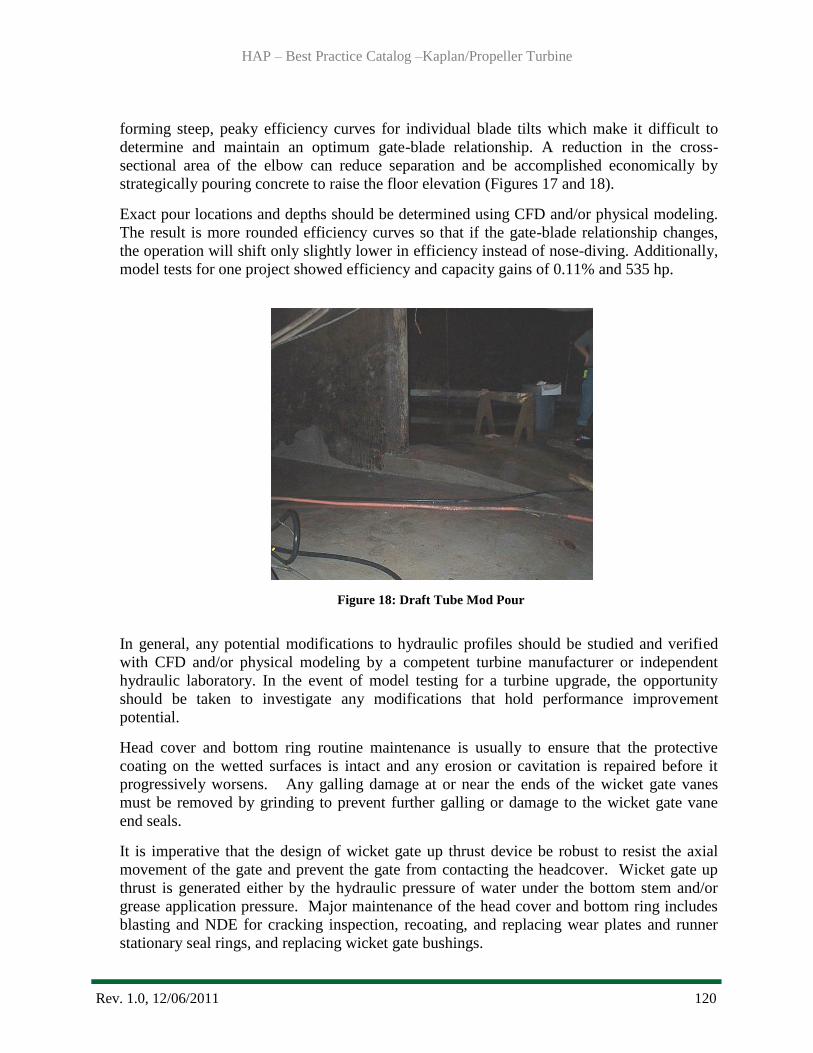
HAP – Best Practice Catalog –Kaplan/Propeller Turbine
Rev. 1.0, 12/06/2011 120
forming steep, peaky efficiency curves for individual blade tilts which make it difficult to
determine and maintain an optimum gate-blade relationship. A reduction in the cross-
sectional area of the elbow can reduce separation and be accomplished economically by
strategically pouring concrete to raise the floor elevation (Figures 17 and 18).
Exact pour locations and depths should be determined using CFD and/or physical modeling.
The result is more rounded efficiency curves so that if the gate-blade relationship changes,
the operation will shift only slightly lower in efficiency instead of nose-diving. Additionally,
model tests for one project showed efficiency and capacity gains of 0.11% and 535 hp.
Figure 18: Draft Tube Mod Pour
In general, any potential modifications to hydraulic profiles should be studied and verified
with CFD and/or physical modeling by a competent turbine manufacturer or independent
hydraulic laboratory. In the event of model testing for a turbine upgrade, the opportunity
should be taken to investigate any modifications that hold performance improvement
potential.
Head cover and bottom ring routine maintenance is usually to ensure that the protective
coating on the wetted surfaces is intact and any erosion or cavitation is repaired before it
progressively worsens. Any galling damage at or near the ends of the wicket gate vanes
must be removed by grinding to prevent further galling or damage to the wicket gate vane
end seals.
It is imperative that the design of wicket gate up thrust device be robust to resist the axial
movement of the gate and prevent the gate from contacting the headcover. Wicket gate up
thrust is generated either by the hydraulic pressure of water under the bottom stem and/or
grease application pressure. Major maintenance of the head cover and bottom ring includes
blasting and NDE for cracking inspection, recoating, and replacing wear plates and runner
stationary seal rings, and replacing wicket gate bushings.
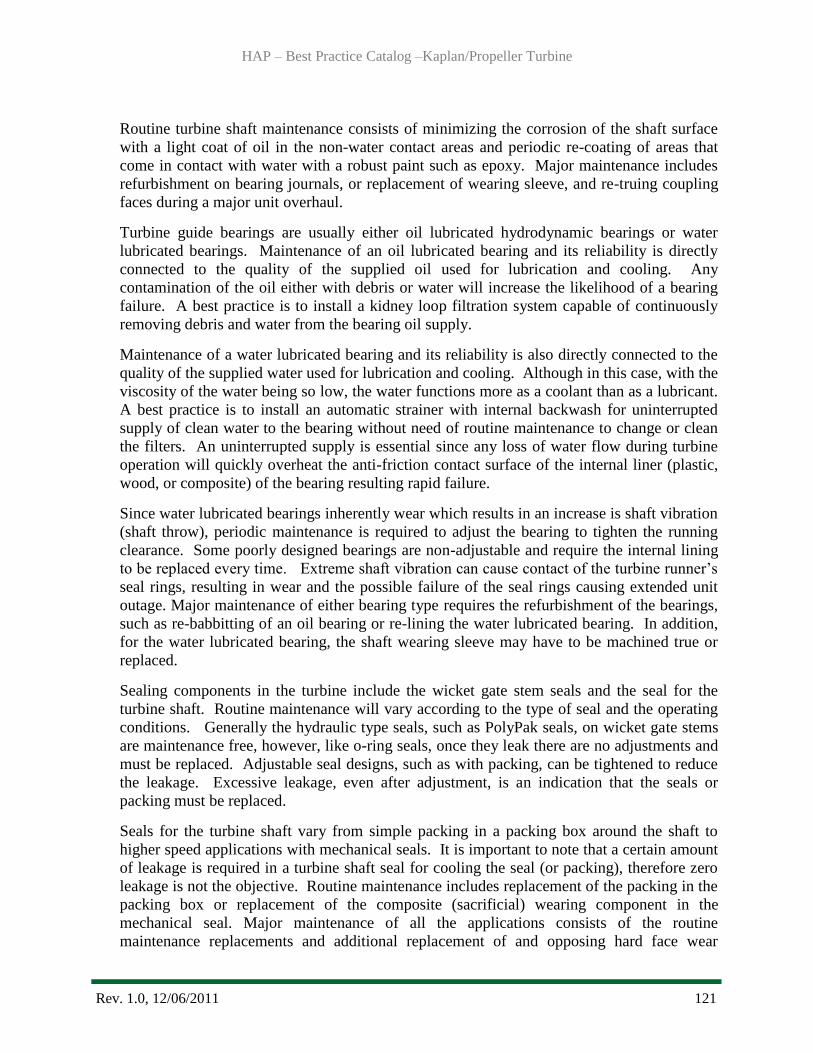
HAP – Best Practice Catalog –Kaplan/Propeller Turbine
Rev. 1.0, 12/06/2011 121
Routine turbine shaft maintenance consists of minimizing the corrosion of the shaft surface
with a light coat of oil in the non-water contact areas and periodic re-coating of areas that
come in contact with water with a robust paint such as epoxy. Major maintenance includes
refurbishment on bearing journals, or replacement of wearing sleeve, and re-truing coupling
faces during a major unit overhaul.
Turbine guide bearings are usually either oil lubricated hydrodynamic bearings or water
lubricated bearings. Maintenance of an oil lubricated bearing and its reliability is directly
connected to the quality of the supplied oil used for lubrication and cooling. Any
contamination of the oil either with debris or water will increase the likelihood of a bearing
failure. A best practice is to install a kidney loop filtration system capable of continuously
removing debris and water from the bearing oil supply.
Maintenance of a water lubricated bearing and its reliability is also directly connected to the
quality of the supplied water used for lubrication and cooling. Although in this case, with the
viscosity of the water being so low, the water functions more as a coolant than as a lubricant.
A best practice is to install an automatic strainer with internal backwash for uninterrupted
supply of clean water to the bearing without need of routine maintenance to change or clean
the filters. An uninterrupted supply is essential since any loss of water flow during turbine
operation will quickly overheat the anti-friction contact surface of the internal liner (plastic,
wood, or composite) of the bearing resulting rapid failure.
Since water lubricated bearings inherently wear which results in an increase is shaft vibration
(shaft throw), periodic maintenance is required to adjust the bearing to tighten the running
clearance. Some poorly designed bearings are non-adjustable and require the internal lining
to be replaced every time. Extreme shaft vibration can cause contact of the turbine runner‘s
seal rings, resulting in wear and the possible failure of the seal rings causing extended unit
outage. Major maintenance of either bearing type requires the refurbishment of the bearings,
such as re-babbitting of an oil bearing or re-lining the water lubricated bearing. In addition,
for the water lubricated bearing, the shaft wearing sleeve may have to be machined true or
replaced.
Sealing components in the turbine include the wicket gate stem seals and the seal for the
turbine shaft. Routine maintenance will vary according to the type of seal and the operating
conditions. Generally the hydraulic type seals, such as PolyPak seals, on wicket gate stems
are maintenance free, however, like o-ring seals, once they leak there are no adjustments and
must be replaced. Adjustable seal designs, such as with packing, can be tightened to reduce
the leakage. Excessive leakage, even after adjustment, is an indication that the seals or
packing must be replaced.
Seals for the turbine shaft vary from simple packing in a packing box around the shaft to
higher speed applications with mechanical seals. It is important to note that a certain amount
of leakage is required in a turbine shaft seal for cooling the seal (or packing), therefore zero
leakage is not the objective. Routine maintenance includes replacement of the packing in the
packing box or replacement of the composite (sacrificial) wearing component in the
mechanical seal. Major maintenance of all the applications consists of the routine
maintenance replacements and additional replacement of and opposing hard face wear

HAP – Best Practice Catalog –Kaplan/Propeller Turbine
Rev. 1.0, 12/06/2011 122
elements such as wear sleeves for packing and hard face wear elements for the mechanical
seals.
Kaplan blade trunnions seals usually require replacing every 15 to 20 years. However, after
40 to 50 years the Kaplan blade trunnions bushing or bearings may be worn to the extent that
seal replacements will not retain oil or water. At this point the Kaplan turbine will require
refurbishment or replacement.
4.0 Metrics, Monitoring and Analysis
4.1 Measures of Performance, Condition, and Reliability
The fundamental process for a hydro turbine is described by the efficiency equation, defined
as the ratio of the power delivered by the turbine to the power of the water passing through
the turbine.
Where: · η is the hydraulic efficiency of the turbine
· P is the mechanical power produced at the turbine shaft (MW)
· ρ is the density of water (1000 kg/m3)
· g is the acceleration due to gravity (9.81 m/s2)
· Q is the flow rate passing through the turbine (m3/s)
· H is the effective pressure head across the turbine (m)
The general expression for this efficiency (η): [11]
Turbine performance parameters for Propeller/Kaplan units are defined in ASME PTC-18
[14] and IEC 60041 [15], and typically include the following: Generator Output, Turbine
Discharge, Headwater and Tailwater Elevations, Inlet Head, Discharge Head, Gate Position,
Blade position, and Water Temperature.
Typical vibration measurements may include: shaft displacement (x and y) at turbine and
generator bearings, and headcover and thrust bridge displacements (z). Acoustic emission (on
the draft tube man-door or liner) may be measured to track relative cavitation noise.
During unit outages: Blade tip clearances.
The condition of the Propeller/Kaplan turbine can be monitored by the Condition Indicator
(CI) as defined according to HAP Condition Assessment Manual [12].
Unit reliability characteristics, as judged by its availability for generation, can be monitored
by use of the North American Electric Reliability Corporation‘s (NERC) performance
indicators, such Equivalent Availability Factor (EAF) and Equivalent Forced Outage Factor
(EFOR). These are universally used by the power industry. Many utilities supply data to the
Generating Availability Data System (GADS) maintained by NERC. This database of
operating information is used for improving the performance of electric generating
equipment. It can be used to support equipment reliability and availability analysis and
decision-making by GADS data users.
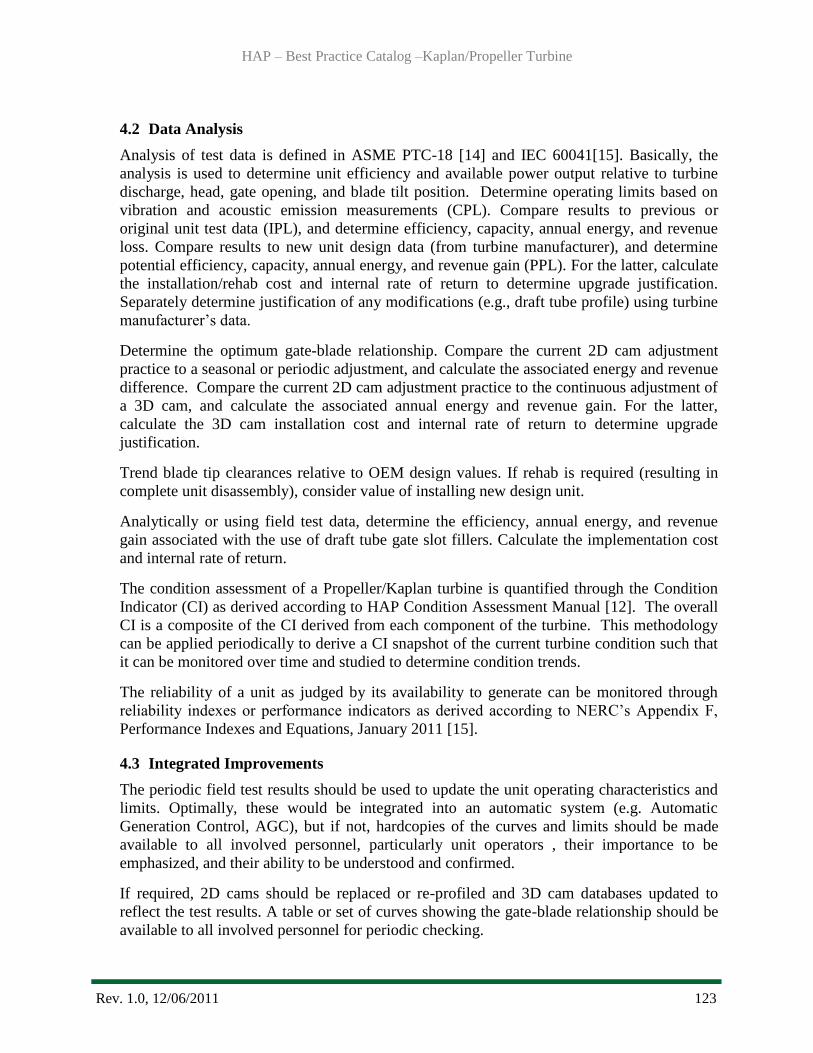
HAP – Best Practice Catalog –Kaplan/Propeller Turbine
Rev. 1.0, 12/06/2011 123
4.2 Data Analysis
Analysis of test data is defined in ASME PTC-18 [14] and IEC 60041[15]. Basically, the
analysis is used to determine unit efficiency and available power output relative to turbine
discharge, head, gate opening, and blade tilt position. Determine operating limits based on
vibration and acoustic emission measurements (CPL). Compare results to previous or
original unit test data (IPL), and determine efficiency, capacity, annual energy, and revenue
loss. Compare results to new unit design data (from turbine manufacturer), and determine
potential efficiency, capacity, annual energy, and revenue gain (PPL). For the latter, calculate
the installation/rehab cost and internal rate of return to determine upgrade justification.
Separately determine justification of any modifications (e.g., draft tube profile) using turbine
manufacturer‘s data.
Determine the optimum gate-blade relationship. Compare the current 2D cam adjustment
practice to a seasonal or periodic adjustment, and calculate the associated energy and revenue
difference. Compare the current 2D cam adjustment practice to the continuous adjustment of
a 3D cam, and calculate the associated annual energy and revenue gain. For the latter,
calculate the 3D cam installation cost and internal rate of return to determine upgrade
justification.
Trend blade tip clearances relative to OEM design values. If rehab is required (resulting in
complete unit disassembly), consider value of installing new design unit.
Analytically or using field test data, determine the efficiency, annual energy, and revenue
gain associated with the use of draft tube gate slot fillers. Calculate the implementation cost
and internal rate of return.
The condition assessment of a Propeller/Kaplan turbine is quantified through the Condition
Indicator (CI) as derived according to HAP Condition Assessment Manual [12]. The overall
CI is a composite of the CI derived from each component of the turbine. This methodology
can be applied periodically to derive a CI snapshot of the current turbine condition such that
it can be monitored over time and studied to determine condition trends.
The reliability of a unit as judged by its availability to generate can be monitored through
reliability indexes or performance indicators as derived according to NERC‘s Appendix F,
Performance Indexes and Equations, January 2011 [15].
4.3 Integrated Improvements
The periodic field test results should be used to update the unit operating characteristics and
limits. Optimally, these would be integrated into an automatic system (e.g. Automatic
Generation Control, AGC), but if not, hardcopies of the curves and limits should be made
available to all involved personnel, particularly unit operators , their importance to be
emphasized, and their ability to be understood and confirmed.
If required, 2D cams should be replaced or re-profiled and 3D cam databases updated to
reflect the test results. A table or set of curves showing the gate-blade relationship should be
available to all involved personnel for periodic checking.
HAP – Best Practice Catalog –Kaplan/Propeller Turbine
Rev. 1.0, 12/06/2011 124
Justified projects (hydraulic profiling, slot fillers, unit upgrade), and a method to constantly
monitor unit performance should be implemented.
As the condition of the turbine changes, the CI and reliability indexes are trended and
analyzed. Using this data, projects can be ranked and justified in the maintenance and capital
programs to bring the turbine back to an acceptable condition and performance level.
5.0 Information Sources
Baseline Knowledge:
Thomas C. Elliott, Standard Handbook of Powerplant Engineering, McGraw Hill Publishing,
1989.
US Army Corps of Engineers, Hydro Plant Risk Assessment Guide, September 2006.
EPRI, Increased Efficiency of Hydroelectric Power, EM 2407, June 1992.
USBR, FIST Volume 2-5, Turbine Repair, September 2000
Hydro Life Extension Modernization Guide, Volume 2: Hydromechanical Equipment, EPRI,
Palo Alto, CA: 2000. TR-112350-V2.
State of the Art:
Brice T.A. and Kirkland J.E., Checking Turbine Performance by Index Testing, Hydro
Review, Vol. V, No. V, Winter 1986.
March, P.A. and P.J. Wolff, Component Indicators for an Optimization-Based Hydro
Performance Indicator, HydroVision 2004, Montreal, Quebec, Canada, August 2004.
TVA and Principia Research Corporation, Hydroturbine Acceptance Tests for the Unit
Replacement Runner at Ft. Patrick Henry Hydro Plant, November, 1999.
USACE, Stay Vane and Wicket Gate Relationship Study, CENWP- HDC-P, January 19,
2005.
USACE, Turbine Surface Roughness Improvement HDC-P, December, 2003.
Jones, J.C. Wicket Gates – Grease vs. Greaseless, USBR O&M Workshop, April 10, 2001
Cateni, A., Margri, L., Grego, G.: Optimization of Hydro Power Plants Performance
importance of Rehabilitation and Maintenance in Particular for Runner – 2008
ORNL, HAP Condition Assessment Manual, October, 2011
Spicher, T., Hydro Wheels: A Guide to Maintaining and Improving Hydro Units, HCI
Publications, 3rd
Edition 2004
Standards:
ASME PTC 18, Hydraulic Turbines and Pump-Turbines, Performance Test codes – 2002

HAP – Best Practice Catalog –Kaplan/Propeller Turbine
Rev. 1.0, 12/06/2011 125
IEC International standard 60041, Field Acceptance Tests to Determine the Hydraulic
Performance of Hydraulic Turbines, Storage Pumps and Pump-Turbines - 1991 3rd Ed.
NERC, Appendix F, Performance Indexes and Equations, January, 2011
ASTM A743, Standard Specification for Castings, Iron-Chromium, Iron-Chromium-Nickel,
Corrosion Resistant, for General Application
ASTM A487, Standard Specification for Steel Castings Suitable for Pressure Service

Best Practice Catalog
Pelton Turbine
Revision 1.0, 12/06/2011
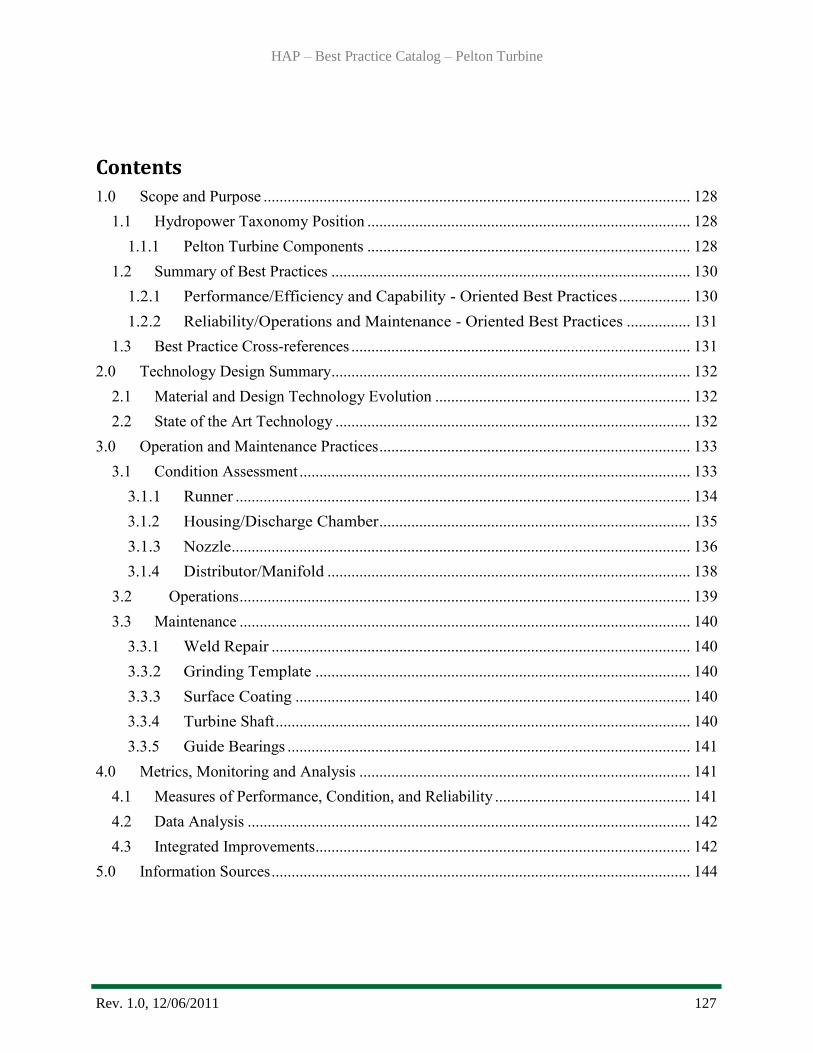
HAP – Best Practice Catalog – Pelton Turbine
Rev. 1.0, 12/06/2011 127
1.0 Scope and Purpose ........................................................................................................... 128
1.1 Hydropower Taxonomy Position ................................................................................. 128
1.1.1 Pelton Turbine Components ................................................................................. 128
1.2 Summary of Best Practices .......................................................................................... 130
1.2.1 Performance/Efficiency and Capability - Oriented Best Practices .................. 130
1.2.2 Reliability/Operations and Maintenance - Oriented Best Practices ................ 131
1.3 Best Practice Cross-references ..................................................................................... 131
2.0 Technology Design Summary .......................................................................................... 132
2.1 Material and Design Technology Evolution ................................................................ 132
2.2 State of the Art Technology ......................................................................................... 132
3.0 Operation and Maintenance Practices .............................................................................. 133
3.1 Condition Assessment .................................................................................................. 133
3.1.1 Runner .................................................................................................................. 134
3.1.2 Housing/Discharge Chamber .............................................................................. 135
3.1.3 Nozzle ................................................................................................................... 136
3.1.4 Distributor/Manifold ........................................................................................... 138
3.2 Operations ................................................................................................................. 139
3.3 Maintenance ................................................................................................................. 140
3.3.1 Weld Repair ......................................................................................................... 140
3.3.2 Grinding Template .............................................................................................. 140
3.3.3 Surface Coating ................................................................................................... 140
3.3.4 Turbine Shaft ........................................................................................................ 140
3.3.5 Guide Bearings ..................................................................................................... 141
4.0 Metrics, Monitoring and Analysis ................................................................................... 141
4.1 Measures of Performance, Condition, and Reliability ................................................. 141
4.2 Data Analysis ............................................................................................................... 142
4.3 Integrated Improvements.............................................................................................. 142
5.0 Information Sources ......................................................................................................... 144
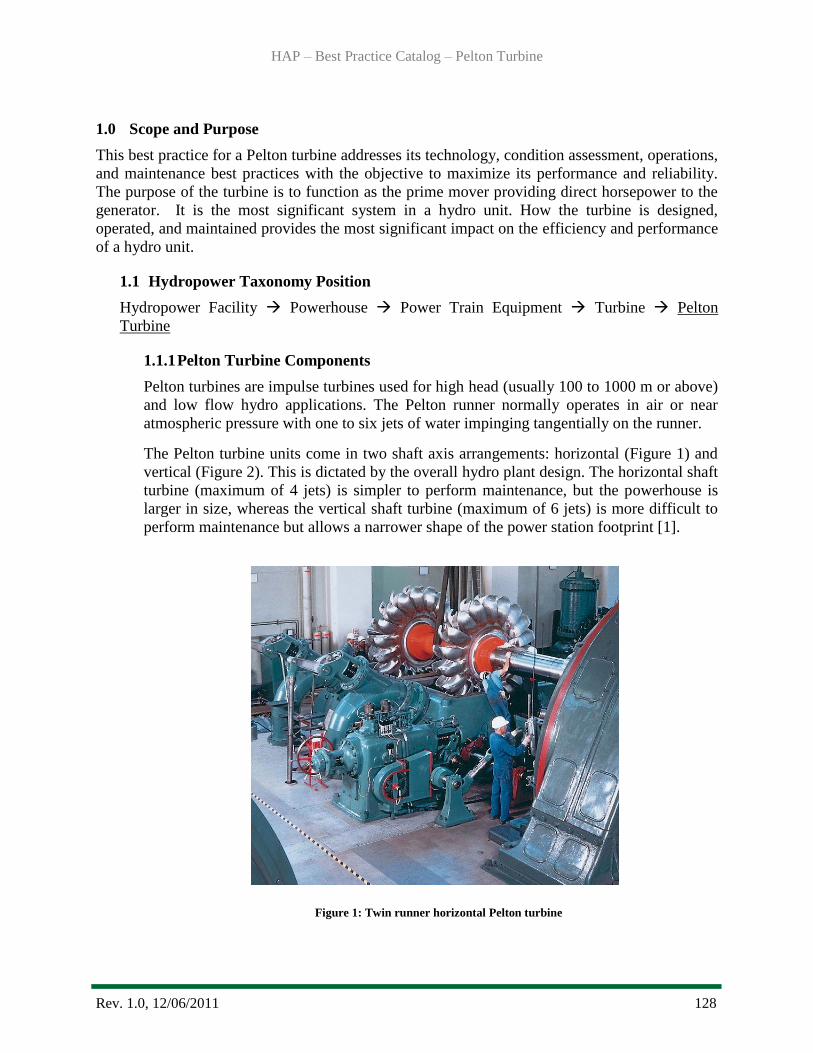
HAP – Best Practice Catalog – Pelton Turbine
Rev. 1.0, 12/06/2011 128
1.0 Scope and Purpose
This best practice for a Pelton turbine addresses its technology, condition assessment, operations,
and maintenance best practices with the objective to maximize its performance and reliability.
The purpose of the turbine is to function as the prime mover providing direct horsepower to the
generator. It is the most significant system in a hydro unit. How the turbine is designed,
operated, and maintained provides the most significant impact on the efficiency and performance
of a hydro unit.
1.1 Hydropower Taxonomy Position
Hydropower Facility Powerhouse Power Train Equipment Turbine Pelton
Turbine
1.1.1 Pelton Turbine Components
Pelton turbines are impulse turbines used for high head (usually 100 to 1000 m or above)
and low flow hydro applications. The Pelton runner normally operates in air or near
atmospheric pressure with one to six jets of water impinging tangentially on the runner.
The Pelton turbine units come in two shaft axis arrangements: horizontal (Figure 1) and
vertical (Figure 2). This is dictated by the overall hydro plant design. The horizontal shaft
turbine (maximum of 4 jets) is simpler to perform maintenance, but the powerhouse is
larger in size, whereas the vertical shaft turbine (maximum of 6 jets) is more difficult to
perform maintenance but allows a narrower shape of the power station footprint [1].
Figure 1: Twin runner horizontal Pelton turbine
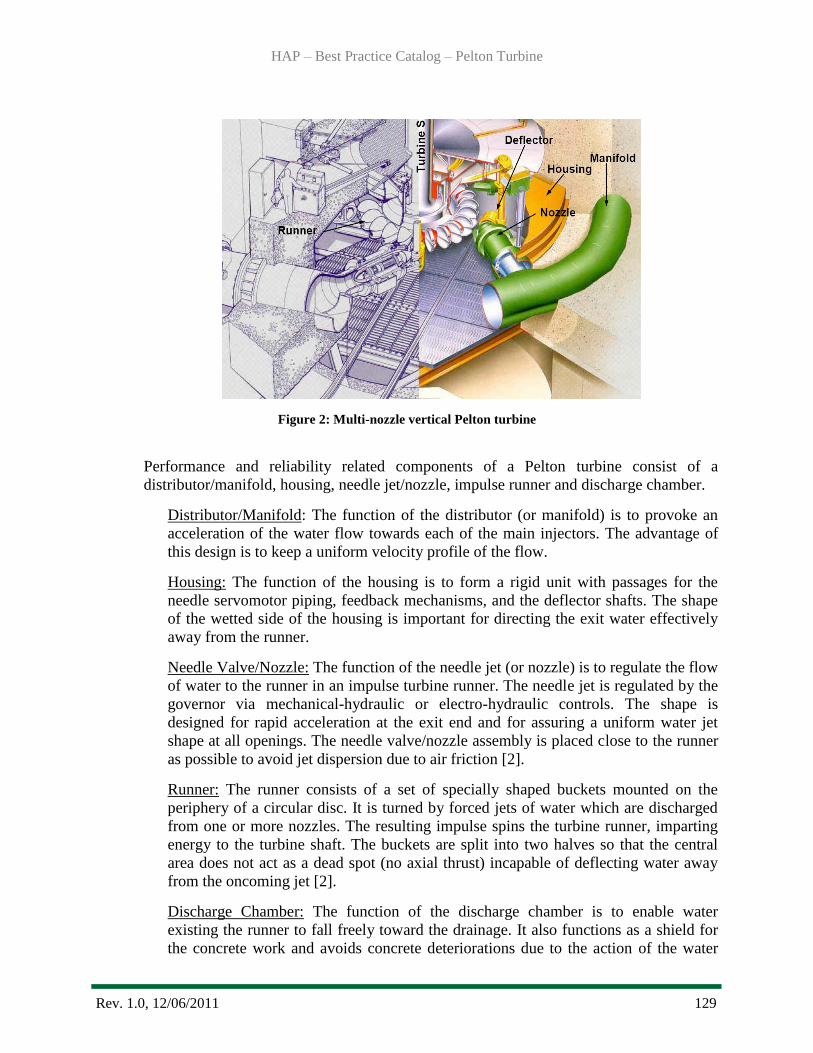
HAP – Best Practice Catalog – Pelton Turbine
Rev. 1.0, 12/06/2011 129
Figure 2: Multi-nozzle vertical Pelton turbine
Performance and reliability related components of a Pelton turbine consist of a
distributor/manifold, housing, needle jet/nozzle, impulse runner and discharge chamber.
Distributor/Manifold: The function of the distributor (or manifold) is to provoke an
acceleration of the water flow towards each of the main injectors. The advantage of
this design is to keep a uniform velocity profile of the flow.
Housing: The function of the housing is to form a rigid unit with passages for the
needle servomotor piping, feedback mechanisms, and the deflector shafts. The shape
of the wetted side of the housing is important for directing the exit water effectively
away from the runner.
Needle Valve/Nozzle: The function of the needle jet (or nozzle) is to regulate the flow
of water to the runner in an impulse turbine runner. The needle jet is regulated by the
governor via mechanical-hydraulic or electro-hydraulic controls. The shape is
designed for rapid acceleration at the exit end and for assuring a uniform water jet
shape at all openings. The needle valve/nozzle assembly is placed close to the runner
as possible to avoid jet dispersion due to air friction [2].
Runner: The runner consists of a set of specially shaped buckets mounted on the
periphery of a circular disc. It is turned by forced jets of water which are discharged
from one or more nozzles. The resulting impulse spins the turbine runner, imparting
energy to the turbine shaft. The buckets are split into two halves so that the central
area does not act as a dead spot (no axial thrust) incapable of deflecting water away
from the oncoming jet [2].
Discharge Chamber: The function of the discharge chamber is to enable water
existing the runner to fall freely toward the drainage. It also functions as a shield for
the concrete work and avoids concrete deteriorations due to the action of the water
HAP – Best Practice Catalog – Pelton Turbine
Rev. 1.0, 12/06/2011 130
jets. Correct water level regulation (surge chambers) inside this chamber is critical for
maximum efficiency.
Non-performance but reliability related components of a Pelton turbine include the
deflector, turbine shaft, and guide bearing.
Deflectors: The deflectors have the function to bend the jet away from the runner at
load rejections to avoid too high of a speed increase. Moreover it protects the jet
against exit water spray from the runner. The deflector arc is bolted to the deflector
support structure frame with the control valve of the needle servomotors. A seal ring
around the deflector shaft bearing housing prevents water and moisture from
penetrating into the bearing.
Turbine Shaft: The function of the turbine shaft is to transfer the torque from the
turbine runner to the generator shaft and rotor. The shaft typically has a bearing
journal for oil lubricated hydrodynamic guide bearings on the turbine runner end.
Shafts are usually manufactured from forged steel, but some of the larger shafts can
be fabricated.
Guide Bearing: The function of the turbine guide bearing is to resist the mechanical
imbalance and hydraulic side loads from the turbine runner, thereby maintaining the
turbine runner in its centered position in the runner seals. It is typically mounted as
close as practical to the turbine runner and supported by the head cover. Turbine
guide bearings are usually oil lubricated hydrodynamic (babbitted) bearings.
1.2 Summary of Best Practices
1.2.1Performance/Efficiency and Capability - Oriented Best Practices
Periodic testing to establish accurate current unit performance characteristics
and limits.
Dissemination of accurate unit performance characteristics to unit operators,
local and remote control and decision support systems, and other personnel and
offices that influence unit dispatch or generation performance.
Real-time monitoring and periodic analysis of unit performance at Current
Performance Level (CPL) to detect and mitigate deviations from expected
efficiency for the Installed Performance Level (IPL) due to degradation or
instrument malfunction.
Periodic comparison of the CPL to the Potential Performance Level (PPL) to
trigger feasibility studies of major upgrades.
Maintain documentation of IPL and update when modification to equipment is
made (e.g., hydraulic profiling, unit upgrade, etc.).
HAP – Best Practice Catalog – Pelton Turbine
Rev. 1.0, 12/06/2011 131
Trend loss of turbine performance due to condition degradation for such causes
as metal loss (cavitation, erosion, and corrosion), opening of runner seal, and
increasing water passage surface roughness.
Include industry acknowledged advances for updated turbine component
materials and maintenance practices.
Adjust maintenance and capitalization programs to correct deficiencies.
1.2.2Reliability/Operations and Maintenance - Oriented Best Practices
Use ASTM A743 CA6NM stainless steel to manufacture Pelton turbine runners,
and water lubricated bearing shaft sleeves to maximize resistance to erosion,
abrasive wear, and cavitation. [15]
Damage from erosion and cavitation on component wetted surfaces are repaired
using 309L stainless steel welding electrodes to increase damage resistance.
The electrodes increase damage resistance.
Adequate coating of the turbine wetted components not only prevents corrosion
but has added benefits of improved performance.
Kidney loop filtration should be installed on turbine guide bearing oil systems.
Automatic strainers with internal backwash should be installed to supply
uninterrupted supply of clean water to water lubricated turbine guide bearings.
Monitor trends for the condition of turbine for decreasing Condition Indicator
(CI) and decrease in reliability, that is to say an increase in Equivalent Forced
Outage Rate (EFOR) and a decrease in Effective Availability Factor (EAF).
Adjust maintenance and capitalization programs to correct deficiencies.
1.3 Best Practice Cross-references
I&C - Automation Best Practice
Mechanical - Lubrication System Best Practice
Mechanical - Generator Best Practice
Mechanical – Governor Best Practice
Mechanical – Raw Water Best Practice

HAP – Best Practice Catalog – Pelton Turbine
Rev. 1.0, 12/06/2011 132
2.0 Technology Design Summary
2.1 Material and Design Technology Evolution
Pelton turbine runners are typically manufactured as one piece, either as a casting or as a
welded fabrication. Very old runners, from the early 1900‘s or before, could have been cast
from cast iron or bronze, later replaced with cast carbon steel. Today they are either cast or
fabricated from carbon steel or stainless steel. Just as materials have improved for modern
turbine runners, so has the design and manufacturing to provide enhanced performance for
power, efficiency, and reduced cavitation damage.
Best practice for the turbine begins with a superior design to maximize and establish the
baseline performance while minimizing damage due to various factors, including cavitation,
pitting, and rough operation. The advent of computerized design and manufacturing occurred
in the late 1970‘s through 1980‘s and made many of the advancements of today possible.
Modern Computational Fluid Dynamics (CFD) flow analysis, Finite Element Analysis
techniques (FEA) for engineering, and Computer Numerically Controlled (CNC) in
manufacturing have significantly improved turbine efficiency and production accuracy.
Performance levels for turbine designs can be stated at three levels as follows:
The Installed Performance Level (IPL) is described by the unit performance
characteristics at the time of commissioning. These may be determined from reports
and records of efficiency and/or model testing conducted prior to and during unit
commissioning.
The Current Performance Level (CPL) is described by an accurate set of unit
performance characteristics determined by unit efficiency testing, which requires the
simultaneous measurement of flow, head, and power under a range of operating
conditions, as specified in the standards referenced in this document.
Determination of the Potential Performance Level (PPL) typically requires reference
to new turbine design information from manufacturers to establish the achievable unit
performance characteristics of replacement turbine(s).
2.2 State of the Art Technology
Turbine efficiency is likely the most important factor in an assessment to determine
rehabilitation or replacement of the turbine. Such testing may show CPL has degraded
significantly from IPL. Figure 3 is an example of the relative efficiency gains of a Pelton
unit. Regardless of whether performance has degraded or not, newer turbine designs are
usually more efficient than those designed 30 to 40 years ago. Also, a new turbine can be
designed using actual historical data rather than original design data providing a turbine more
accurately suited for the site.
Newer ―state of the art‖ turbine designs can not only achieve the PPL but also provide
decreased cavitation damage based on better hydraulic design and materials.
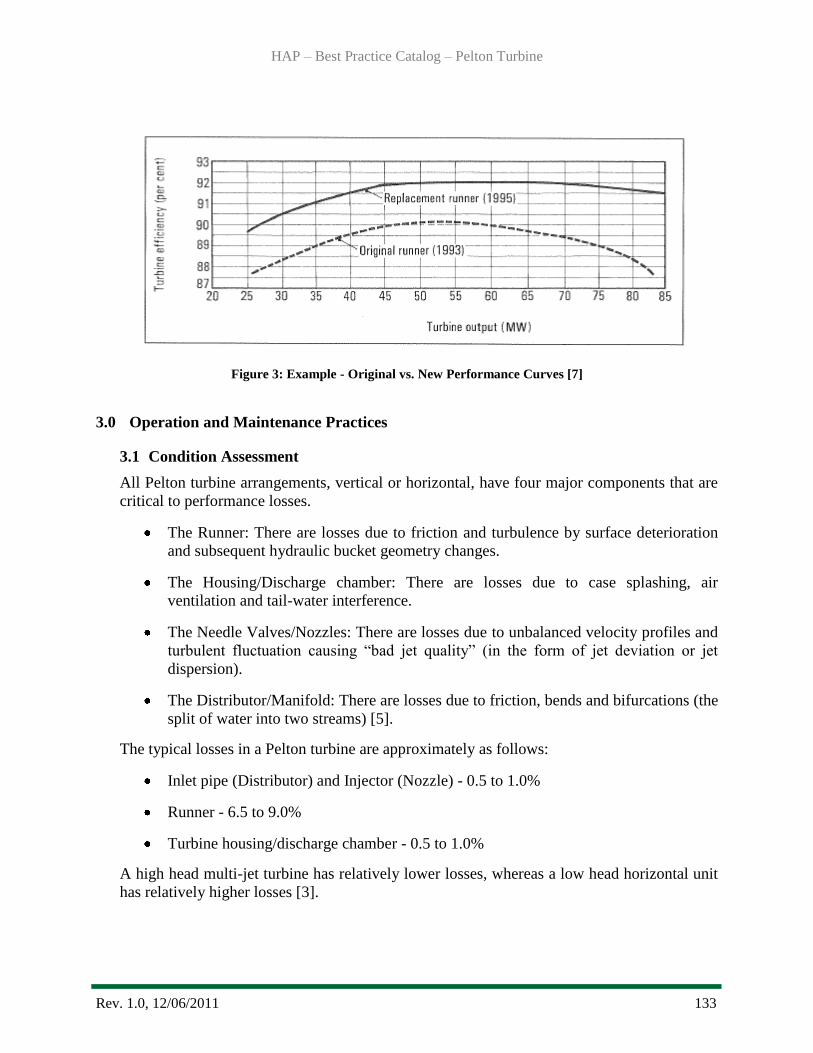
HAP – Best Practice Catalog – Pelton Turbine
Rev. 1.0, 12/06/2011 133
Figure 3: Example - Original vs. New Performance Curves [7]
3.0 Operation and Maintenance Practices
3.1 Condition Assessment
All Pelton turbine arrangements, vertical or horizontal, have four major components that are
critical to performance losses.
The Runner: There are losses due to friction and turbulence by surface deterioration
and subsequent hydraulic bucket geometry changes.
The Housing/Discharge chamber: There are losses due to case splashing, air
ventilation and tail-water interference.
The Needle Valves/Nozzles: There are losses due to unbalanced velocity profiles and
turbulent fluctuation causing ―bad jet quality‖ (in the form of jet deviation or jet
dispersion).
The Distributor/Manifold: There are losses due to friction, bends and bifurcations (the
split of water into two streams) [5].
The typical losses in a Pelton turbine are approximately as follows:
Inlet pipe (Distributor) and Injector (Nozzle) - 0.5 to 1.0%
Runner - 6.5 to 9.0%
Turbine housing/discharge chamber - 0.5 to 1.0%
A high head multi-jet turbine has relatively lower losses, whereas a low head horizontal unit
has relatively higher losses [3].
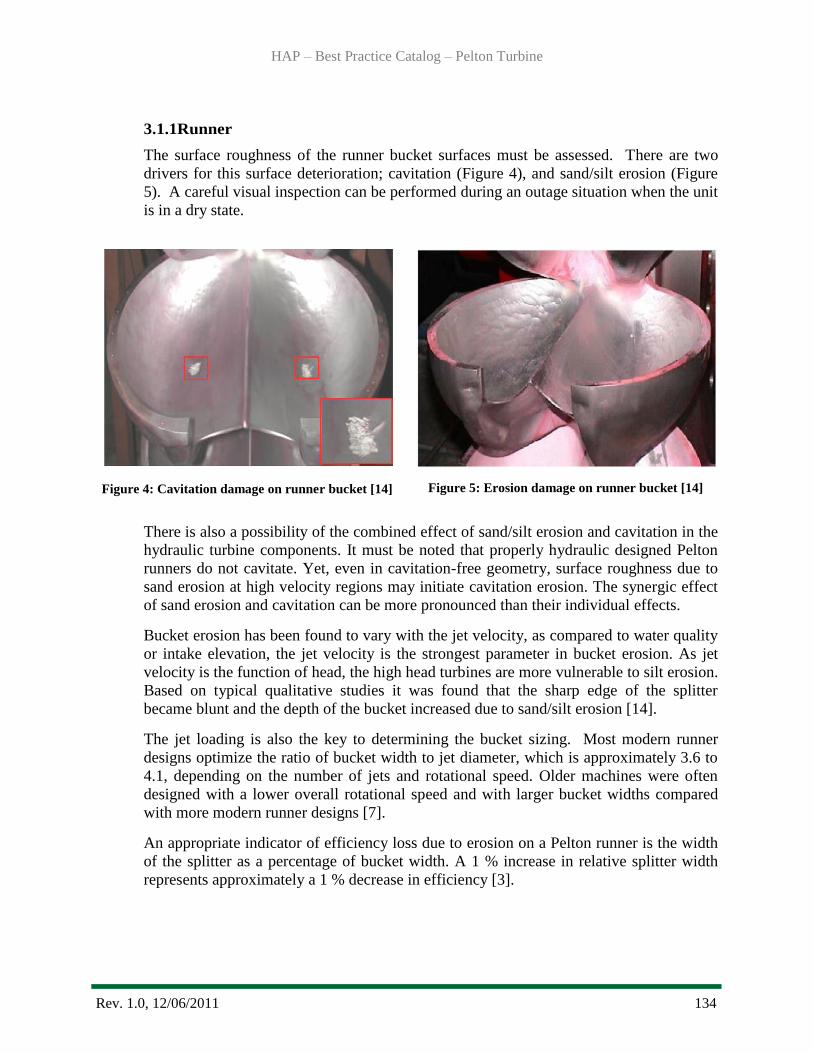
HAP – Best Practice Catalog – Pelton Turbine
Rev. 1.0, 12/06/2011 134
3.1.1Runner
The surface roughness of the runner bucket surfaces must be assessed. There are two
drivers for this surface deterioration; cavitation (Figure 4), and sand/silt erosion (Figure
5). A careful visual inspection can be performed during an outage situation when the unit
is in a dry state.
Figure 4: Cavitation damage on runner bucket [14]
Figure 5: Erosion damage on runner bucket [14]
There is also a possibility of the combined effect of sand/silt erosion and cavitation in the
hydraulic turbine components. It must be noted that properly hydraulic designed Pelton
runners do not cavitate. Yet, even in cavitation-free geometry, surface roughness due to
sand erosion at high velocity regions may initiate cavitation erosion. The synergic effect
of sand erosion and cavitation can be more pronounced than their individual effects.
Bucket erosion has been found to vary with the jet velocity, as compared to water quality
or intake elevation, the jet velocity is the strongest parameter in bucket erosion. As jet
velocity is the function of head, the high head turbines are more vulnerable to silt erosion.
Based on typical qualitative studies it was found that the sharp edge of the splitter
became blunt and the depth of the bucket increased due to sand/silt erosion [14].
The jet loading is also the key to determining the bucket sizing. Most modern runner
designs optimize the ratio of bucket width to jet diameter, which is approximately 3.6 to
4.1, depending on the number of jets and rotational speed. Older machines were often
designed with a lower overall rotational speed and with larger bucket widths compared
with more modern runner designs [7].
An appropriate indicator of efficiency loss due to erosion on a Pelton runner is the width
of the splitter as a percentage of bucket width. A 1 % increase in relative splitter width
represents approximately a 1 % decrease in efficiency [3].

HAP – Best Practice Catalog – Pelton Turbine
Rev. 1.0, 12/06/2011 135
3.1.2 Housing/Discharge Chamber
Appropriate venting prevents the runner discharge water from building up (in the
housing) [7]. The housing ventilation points need to be assessed to ensure that they are
clear, allowing full ventilation. The tail water levels below the runner must not interfere
with the jet flow. These water levels must remain within the OEM designed range. Jet
interference prevents the regular flow in the buckets and results in the sharp deterioration
of turbine output power with cavitation and vibration [8]. Figures 6 and 7 illustrate the
negative effects of jet interference splash on the turbine performance.
Figure 6: Modeling of jet interference within housing [8]
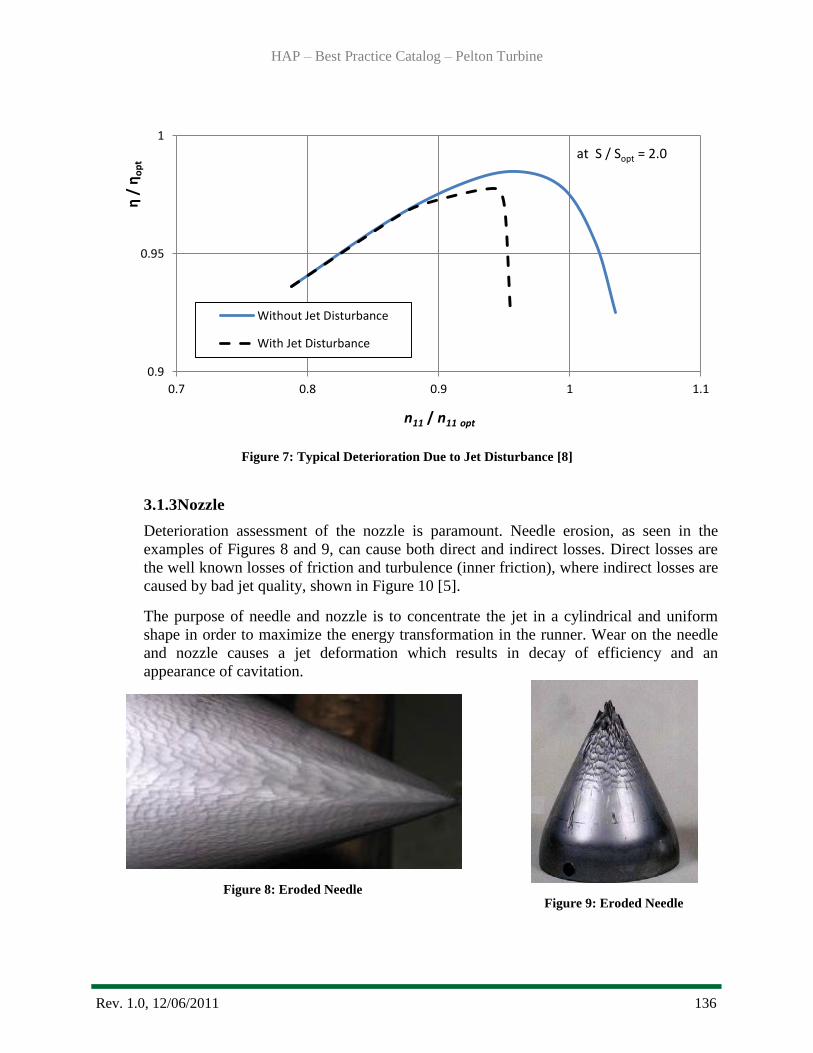
HAP – Best Practice Catalog – Pelton Turbine
Rev. 1.0, 12/06/2011 136
Figure 7: Typical Deterioration Due to Jet Disturbance [8]
3.1.3Nozzle
Deterioration assessment of the nozzle is paramount. Needle erosion, as seen in the
examples of Figures 8 and 9, can cause both direct and indirect losses. Direct losses are
the well known losses of friction and turbulence (inner friction), where indirect losses are
caused by bad jet quality, shown in Figure 10 [5].
The purpose of needle and nozzle is to concentrate the jet in a cylindrical and uniform
shape in order to maximize the energy transformation in the runner. Wear on the needle
and nozzle causes a jet deformation which results in decay of efficiency and an
appearance of cavitation.
Figure 8: Eroded Needle
Figure 9: Eroded Needle
0.9
0.95
1
0.7 0.8 0.9 1 1.1
η /
ηo
pt
n11 / n11 opt
Without Jet Disturbance
With Jet Disturbance
at S / Sopt = 2.0
Fig 5. Simulation of Housing Flow [12]
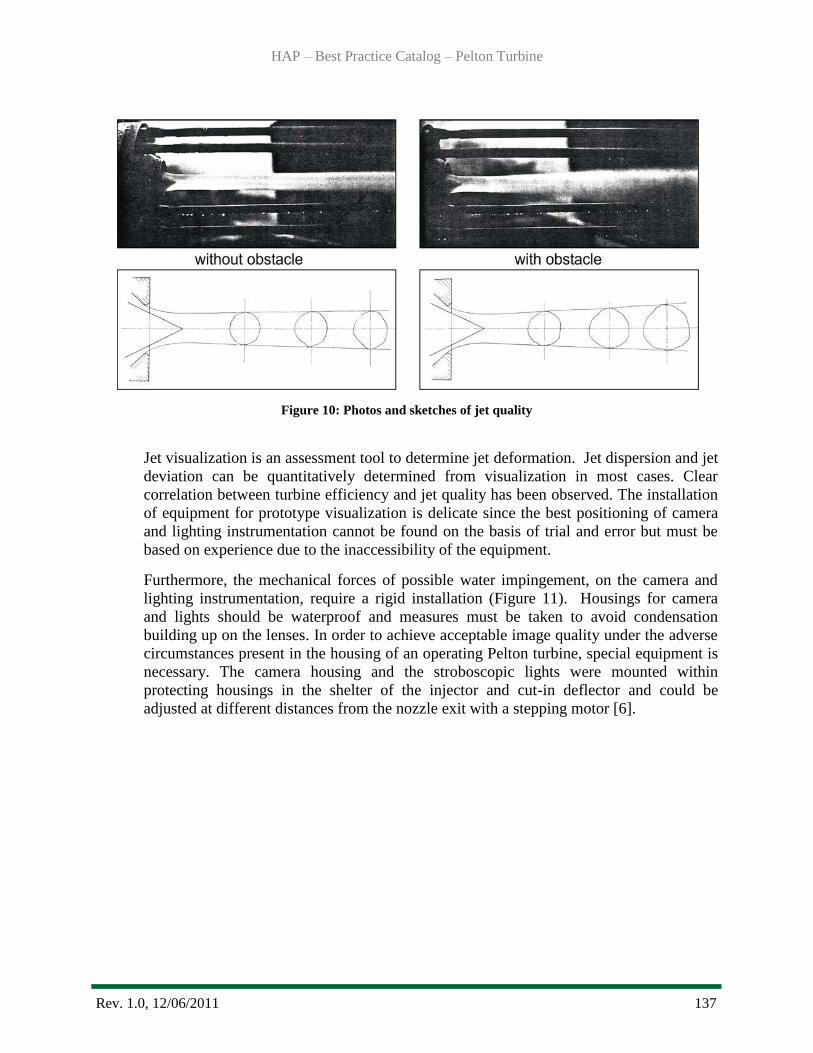
HAP – Best Practice Catalog – Pelton Turbine
Rev. 1.0, 12/06/2011 137
Figure 10: Photos and sketches of jet quality
Jet visualization is an assessment tool to determine jet deformation. Jet dispersion and jet
deviation can be quantitatively determined from visualization in most cases. Clear
correlation between turbine efficiency and jet quality has been observed. The installation
of equipment for prototype visualization is delicate since the best positioning of camera
and lighting instrumentation cannot be found on the basis of trial and error but must be
based on experience due to the inaccessibility of the equipment.
Furthermore, the mechanical forces of possible water impingement, on the camera and
lighting instrumentation, require a rigid installation (Figure 11). Housings for camera
and lights should be waterproof and measures must be taken to avoid condensation
building up on the lenses. In order to achieve acceptable image quality under the adverse
circumstances present in the housing of an operating Pelton turbine, special equipment is
necessary. The camera housing and the stroboscopic lights were mounted within
protecting housings in the shelter of the injector and cut-in deflector and could be
adjusted at different distances from the nozzle exit with a stepping motor [6].

HAP – Best Practice Catalog – Pelton Turbine
Rev. 1.0, 12/06/2011 138
Figure 11: Internal view of bracket with camera supports for visualization
3.1.4 Distributor/Manifold
Depending on the age of the turbine unit and original hydraulic design, the distributor
size may contribute to losses and turbulence. A good rule of thumb is to size the unit so
that at full load, the spiral velocity head is 10 % or less of the total unit‘s velocity head.
Older spiral distributors were often constructed in large curved cast sections as compared
with newer units that are usually constructed of shorter mitred ring sections [7].
The ring sections must be assessed routinely for friction increasing internal surface
deterioration. This can take the form of a visual inspection carefully performed during an
outage situation when the unit is in a dry state. For examples of distributor arrangements
see Figures 12 and 13.
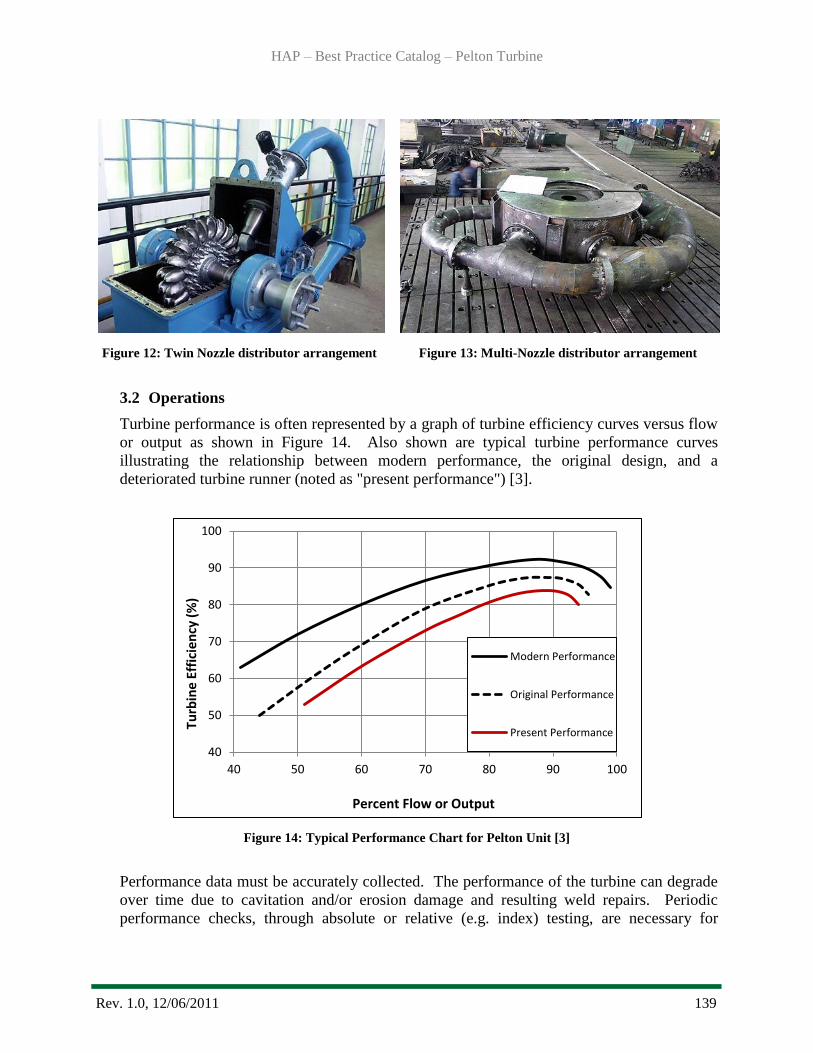
HAP – Best Practice Catalog – Pelton Turbine
Rev. 1.0, 12/06/2011 139
Figure 12: Twin Nozzle distributor arrangement
Figure 13: Multi-Nozzle distributor arrangement
3.2 Operations
Turbine performance is often represented by a graph of turbine efficiency curves versus flow
or output as shown in Figure 14. Also shown are typical turbine performance curves
illustrating the relationship between modern performance, the original design, and a
deteriorated turbine runner (noted as "present performance") [3].
Figure 14: Typical Performance Chart for Pelton Unit [3]
Performance data must be accurately collected. The performance of the turbine can degrade
over time due to cavitation and/or erosion damage and resulting weld repairs. Periodic
performance checks, through absolute or relative (e.g. index) testing, are necessary for
40
50
60
70
80
90
100
40 50 60 70 80 90 100
Turb
ine
Effi
cie
ncy
(%
)
Percent Flow or Output
Modern Performance
Original Performance
Present Performance
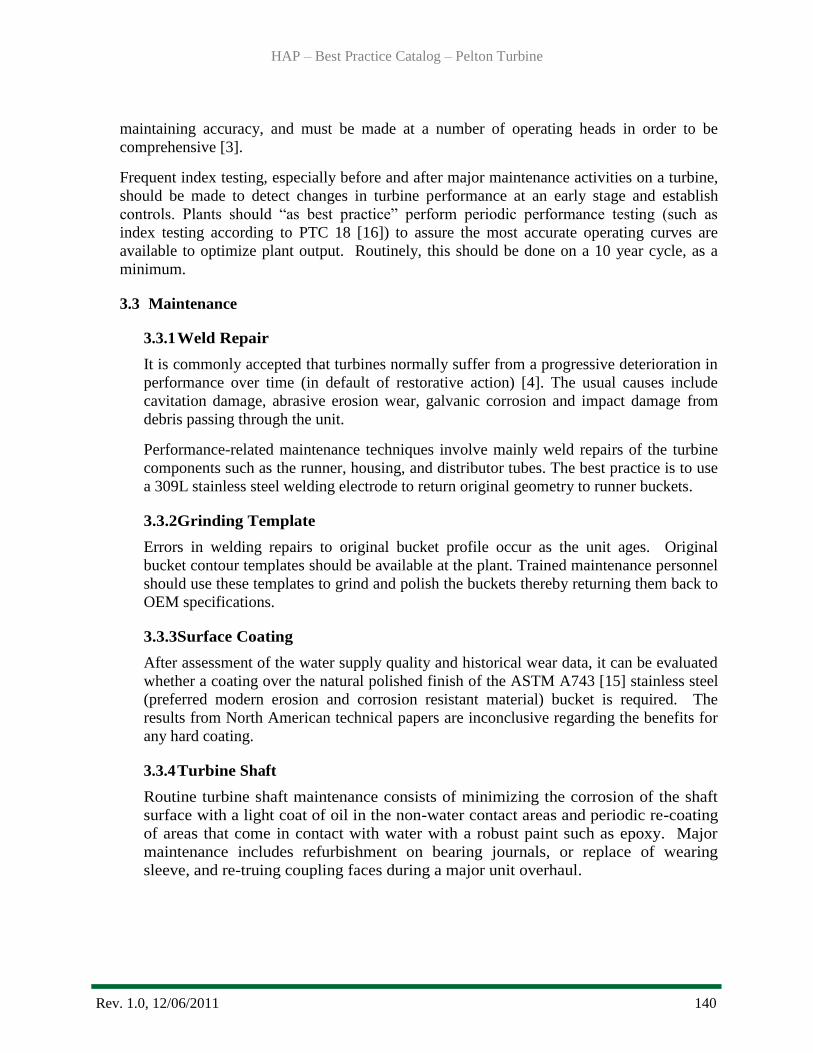
HAP – Best Practice Catalog – Pelton Turbine
Rev. 1.0, 12/06/2011 140
maintaining accuracy, and must be made at a number of operating heads in order to be
comprehensive [3].
Frequent index testing, especially before and after major maintenance activities on a turbine,
should be made to detect changes in turbine performance at an early stage and establish
controls. Plants should ―as best practice‖ perform periodic performance testing (such as
index testing according to PTC 18 [16]) to assure the most accurate operating curves are
available to optimize plant output. Routinely, this should be done on a 10 year cycle, as a
minimum.
3.3 Maintenance
3.3.1 Weld Repair
It is commonly accepted that turbines normally suffer from a progressive deterioration in
performance over time (in default of restorative action) [4]. The usual causes include
cavitation damage, abrasive erosion wear, galvanic corrosion and impact damage from
debris passing through the unit.
Performance-related maintenance techniques involve mainly weld repairs of the turbine
components such as the runner, housing, and distributor tubes. The best practice is to use
a 309L stainless steel welding electrode to return original geometry to runner buckets.
3.3.2Grinding Template
Errors in welding repairs to original bucket profile occur as the unit ages. Original
bucket contour templates should be available at the plant. Trained maintenance personnel
should use these templates to grind and polish the buckets thereby returning them back to
OEM specifications.
3.3.3Surface Coating
After assessment of the water supply quality and historical wear data, it can be evaluated
whether a coating over the natural polished finish of the ASTM A743 [15] stainless steel
(preferred modern erosion and corrosion resistant material) bucket is required. The
results from North American technical papers are inconclusive regarding the benefits for
any hard coating.
3.3.4 Turbine Shaft
Routine turbine shaft maintenance consists of minimizing the corrosion of the shaft
surface with a light coat of oil in the non-water contact areas and periodic re-coating
of areas that come in contact with water with a robust paint such as epoxy. Major
maintenance includes refurbishment on bearing journals, or replace of wearing
sleeve, and re-truing coupling faces during a major unit overhaul.

HAP – Best Practice Catalog – Pelton Turbine
Rev. 1.0, 12/06/2011 141
3.3.5 Guide Bearings
Turbine guide bearings are usually oil lubricated hydrodynamic bearings.
Maintenance of an oil lubricated bearing and its reliability is directly connected to the
quality of the supplied oil used for lubrication and cooling. Any contamination of
the oil either with debris or water will increase the likelihood of a bearing failure. A
best practice is to install a kidney loop filtration system capable of continuously
removing debris and water from the bearing oil supply.
Extreme shaft vibration can cause contact of the turbine runner‘s seal rings resulting
in wear and the possible failure of the seal rings and subsequent major extended unit
outage. Major maintenance requires the refurbishment of the bearings, such as re-
babbitting of an oil bearing.
4.0 Metrics, Monitoring and Analysis
4.1 Measures of Performance, Condition, and Reliability
The fundamental process for a hydro turbine is described by the efficiency equation, which is
defined as the ratio of the power delivered by the turbine to the power of the water passing
through the turbine.
Where: · η is the hydraulic efficiency of the turbine
· P is the mechanical power produced at the turbine shaft (MW)
· ρ is the density of water (1000 kg/m3)
· g is the acceleration due to gravity (9.81 m/s2)
· Q is the flow rate passing through the turbine (m3/s)
· H is the effective pressure head across the turbine (m)
The general expression for this efficiency (η): [10]
Turbine performance parameters for Pelton units are defined in ASME PTC-18 [16] and IEC
60041 [17], and typically include the following: Generator Output, Turbine Discharge,
Headwater and Tailwater Elevations, Inlet Head, Discharge Head, Gate Position, and Water
Temperature.
Typical vibration measurements may include: shaft displacement (x and y) at turbine and
generator bearings and thrust bridge displacements (z). Acoustic emission (on the draft tube
access door or liner) may be measured to track relative cavitation noise.
The condition of the Pelton turbine can be monitored by the Condition Indicator (CI) as
defined according to HAP Condition Assessment Manual [11].
Unit reliability characteristics, as judged by its availability for generation, can be monitored
by use of the North American Electric Reliability Corporation‘s (NERC) performance
indicators, such Equivalent Availability Factor (EAF) and Equivalent Forced Outage Factor
(EFOR). These are universally used by the power industry. Many utilities supply data to the
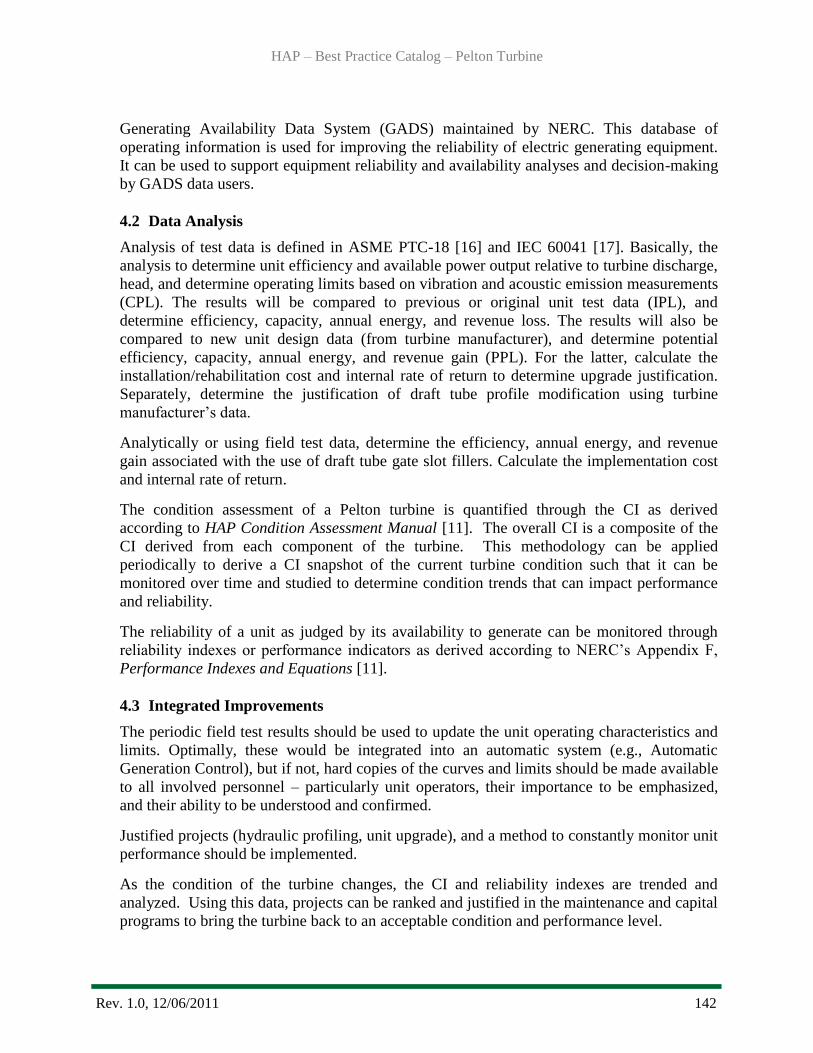
HAP – Best Practice Catalog – Pelton Turbine
Rev. 1.0, 12/06/2011 142
Generating Availability Data System (GADS) maintained by NERC. This database of
operating information is used for improving the reliability of electric generating equipment.
It can be used to support equipment reliability and availability analyses and decision-making
by GADS data users.
4.2 Data Analysis
Analysis of test data is defined in ASME PTC-18 [16] and IEC 60041 [17]. Basically, the
analysis to determine unit efficiency and available power output relative to turbine discharge,
head, and determine operating limits based on vibration and acoustic emission measurements
(CPL). The results will be compared to previous or original unit test data (IPL), and
determine efficiency, capacity, annual energy, and revenue loss. The results will also be
compared to new unit design data (from turbine manufacturer), and determine potential
efficiency, capacity, annual energy, and revenue gain (PPL). For the latter, calculate the
installation/rehabilitation cost and internal rate of return to determine upgrade justification.
Separately, determine the justification of draft tube profile modification using turbine
manufacturer‘s data.
Analytically or using field test data, determine the efficiency, annual energy, and revenue
gain associated with the use of draft tube gate slot fillers. Calculate the implementation cost
and internal rate of return.
The condition assessment of a Pelton turbine is quantified through the CI as derived
according to HAP Condition Assessment Manual [11]. The overall CI is a composite of the
CI derived from each component of the turbine. This methodology can be applied
periodically to derive a CI snapshot of the current turbine condition such that it can be
monitored over time and studied to determine condition trends that can impact performance
and reliability.
The reliability of a unit as judged by its availability to generate can be monitored through
reliability indexes or performance indicators as derived according to NERC‘s Appendix F,
Performance Indexes and Equations [11].
4.3 Integrated Improvements
The periodic field test results should be used to update the unit operating characteristics and
limits. Optimally, these would be integrated into an automatic system (e.g., Automatic
Generation Control), but if not, hard copies of the curves and limits should be made available
to all involved personnel – particularly unit operators, their importance to be emphasized,
and their ability to be understood and confirmed.
Justified projects (hydraulic profiling, unit upgrade), and a method to constantly monitor unit
performance should be implemented.
As the condition of the turbine changes, the CI and reliability indexes are trended and
analyzed. Using this data, projects can be ranked and justified in the maintenance and capital
programs to bring the turbine back to an acceptable condition and performance level.

HAP – Best Practice Catalog – Pelton Turbine
Rev. 1.0, 12/06/2011 143
The improvement of any hydraulic machinery performance can basically come from three
types of intervention:
Replacement of obsolete runner (the profiled machinery parts) with new ones
Replacement/Improvement of nozzles with new nozzle components
Repair for surface restoration and for improvement of wear resistance.
It is clear that these interventions are not alternative but complementary, depending on the
actual problems of hydraulic design obsolescence of turbine parts and corrosion, erosion, or
cavitation of turbine parts.[10]
Runner Replacement
The modeling of the modern Pelton turbine runner geometry can be carried out with
Computational Fluid Dynamics (CFD) analysis of the jet/bucket interaction. For Pelton
runners, both the flow field itself and the influence of water on the structural properties are
more difficult to determine than for Francis or Kaplan turbines because Pelton buckets are
moving through the jets, filling and emptying continuously. The bucket unsteady loading
analysis requires knowing the unsteady pressure loading in the rotating buckets [9].
Figure 15: Typical results for new runner upgrade [13]
Needle Seat Enlargement
A detailed study showed that the turbine jets could be easily enlarged up to 6 % in diameter
with minor negative effects on efficiency but with a substantial increase in output. This
study details a six-jet Pelton unit with rated head of 675.7 m and an output of 75.2 MW at a
rated jet of 152 mm diameter with a discharge of 12.6 m3/s. The new rated power capacity
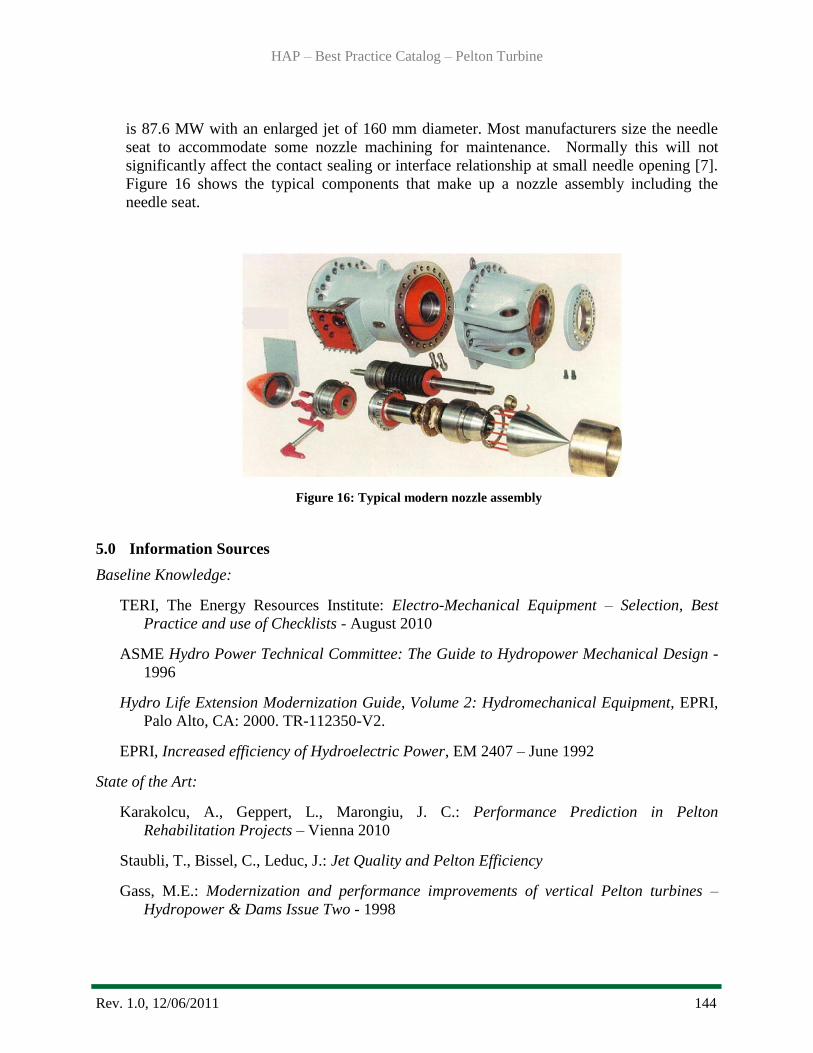
HAP – Best Practice Catalog – Pelton Turbine
Rev. 1.0, 12/06/2011 144
is 87.6 MW with an enlarged jet of 160 mm diameter. Most manufacturers size the needle
seat to accommodate some nozzle machining for maintenance. Normally this will not
significantly affect the contact sealing or interface relationship at small needle opening [7].
Figure 16 shows the typical components that make up a nozzle assembly including the
needle seat.
Figure 16: Typical modern nozzle assembly
5.0 Information Sources
Baseline Knowledge:
TERI, The Energy Resources Institute: Electro-Mechanical Equipment – Selection, Best
Practice and use of Checklists - August 2010
ASME Hydro Power Technical Committee: The Guide to Hydropower Mechanical Design -
1996
Hydro Life Extension Modernization Guide, Volume 2: Hydromechanical Equipment, EPRI,
Palo Alto, CA: 2000. TR-112350-V2.
EPRI, Increased efficiency of Hydroelectric Power, EM 2407 – June 1992
State of the Art:
Karakolcu, A., Geppert, L., Marongiu, J. C.: Performance Prediction in Pelton
Rehabilitation Projects – Vienna 2010
Staubli, T., Bissel, C., Leduc, J.: Jet Quality and Pelton Efficiency
Gass, M.E.: Modernization and performance improvements of vertical Pelton turbines –
Hydropower & Dams Issue Two - 1998

HAP – Best Practice Catalog – Pelton Turbine
Rev. 1.0, 12/06/2011 145
Kubota, T., Kawakami, H.: Observation of Jet interference in 6-Nozzle Pelton Turbine -FUJI
Electric Review 1990
Keck, H., Wolfgang, M., Weiss, T., Sick, M.: Recent Developments in the Dynamic Analysis
of Water Turbines - 2007
Cateni, A., Margri, L., Grego, G.: Optimization of Hydro Power Plants Performance
importance of Rehabilitation and Maintenance in Particular for Runner – 2008
ORNL, HAP Condition Assessment Manual, October, 2011
Spicher, T., Hydro Wheels: A Guide to Maintaining and Improving Hydro Units, HCI
Publications, 3rd
Edition 2002
Vesely, J., Varner, M.: A case study of upgrading of 62.5MW Pelton Turbine – 2000
Thapa, B., Chaudhary, P., Dahlhaug, O., Upadhyay, P.: Study of Combined Effect of Sand
Erosion and Cavitation in Hydraulic Turbines -2007
Standards:
ASTM A743: Standard Specification for Castings, Iron-Chromium-Nickel, Corrosion
Resistant for General Application - 2006
ASME PTC 18, Hydraulic Turbines and Pump-Turbines, Performance Test codes - 2011
IEC 60041 Field Acceptance Tests to Determine the Hydraulic Performance of Hydraulic
Turbines, Storage Pumps and Pump-Turbines, 1991
NERC, Appendix F, Performance Indexes and Equations, January, 2011

Best Practice Catalog
Lubrication System
Revision 1.0, 12/20/2011
HAP – Best Practice Catalog – Lubrication System
Rev. 1.0, 12/20/2011 147
1.0 Scope and Purpose ........................................................................................................... 148
1.1 Hydropower Taxonomy Position ................................................................................. 148
1.1.1 Lubrication System Components.............................................................................. 148
1.2 Summary of Best Practices .......................................................................................... 150
1.2.1 Performance/Efficiency & Capability - Oriented Best Practices ............................. 150
1.2.2 Reliability/Operations & Maintenance - Oriented Best Practices ............................ 150
1.3 Best Practice Cross-references ..................................................................................... 151
2.0 Technology Design Summary .......................................................................................... 151
2.1 Material and Design Technology Evolution ................................................................ 151
2.2 State of the Art Technology ......................................................................................... 151
3.0 Operation & Maintenance Practices ................................................................................ 154
3.1 Condition Assessment .................................................................................................. 154
3.2 Operations .................................................................................................................... 156
3.3 Maintenance ................................................................................................................. 159
4.0 Metrics, Monitoring and Analysis ................................................................................... 160
4.1 Measures of Performance, Condition, and Reliability ................................................. 160
4.2 Analysis of Data ........................................................................................................... 161
4.3 Integrated Improvements.............................................................................................. 163
5.0 Information Sources: ........................................................................................................ 164
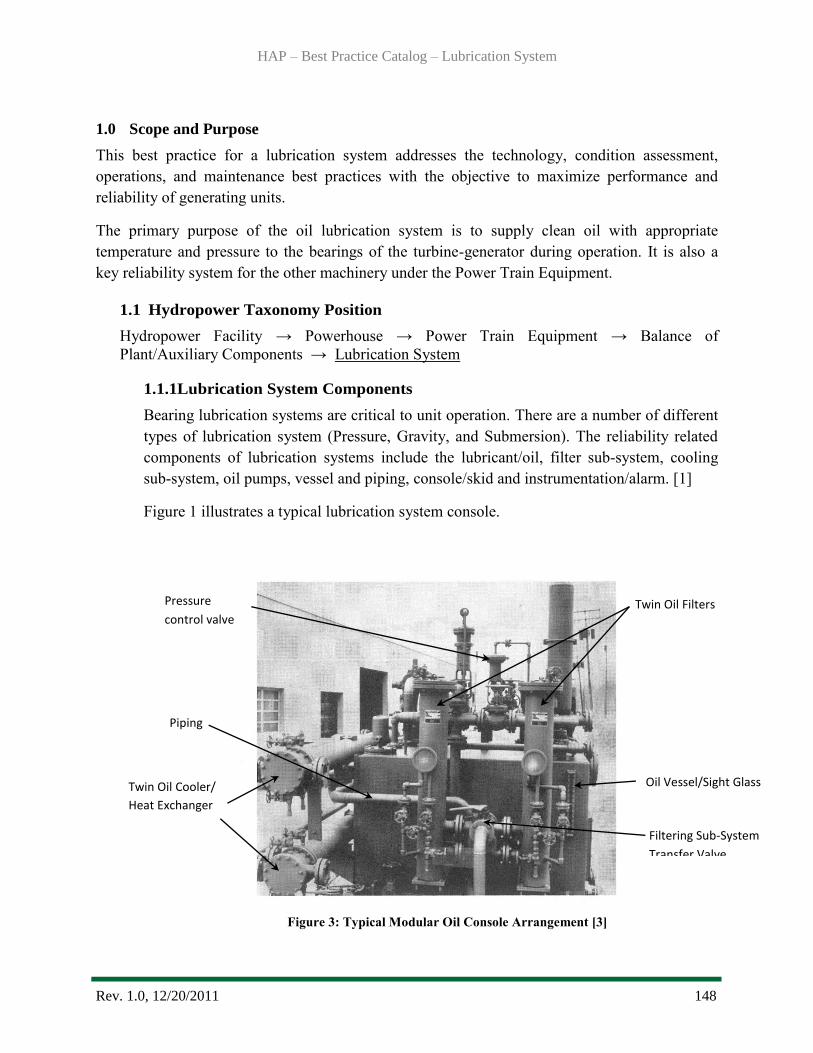
HAP – Best Practice Catalog – Lubrication System
Rev. 1.0, 12/20/2011 148
1.0 Scope and Purpose
This best practice for a lubrication system addresses the technology, condition assessment,
operations, and maintenance best practices with the objective to maximize performance and
reliability of generating units.
The primary purpose of the oil lubrication system is to supply clean oil with appropriate
temperature and pressure to the bearings of the turbine-generator during operation. It is also a
key reliability system for the other machinery under the Power Train Equipment.
1.1 Hydropower Taxonomy Position
Hydropower Facility → Powerhouse → Power Train Equipment → Balance of
Plant/Auxiliary Components → Lubrication System
1.1.1Lubrication System Components
Bearing lubrication systems are critical to unit operation. There are a number of different
types of lubrication system (Pressure, Gravity, and Submersion). The reliability related
components of lubrication systems include the lubricant/oil, filter sub-system, cooling
sub-system, oil pumps, vessel and piping, console/skid and instrumentation/alarm. [1]
Figure 1 illustrates a typical lubrication system console.
Figure 3: Typical Modular Oil Console Arrangement [3]
Twin Oil Cooler/
Heat Exchanger
Twin Oil Filters
Piping
Oil Vessel/Sight Glass
Filtering Sub-System
Transfer Valve
Pressure
control valve
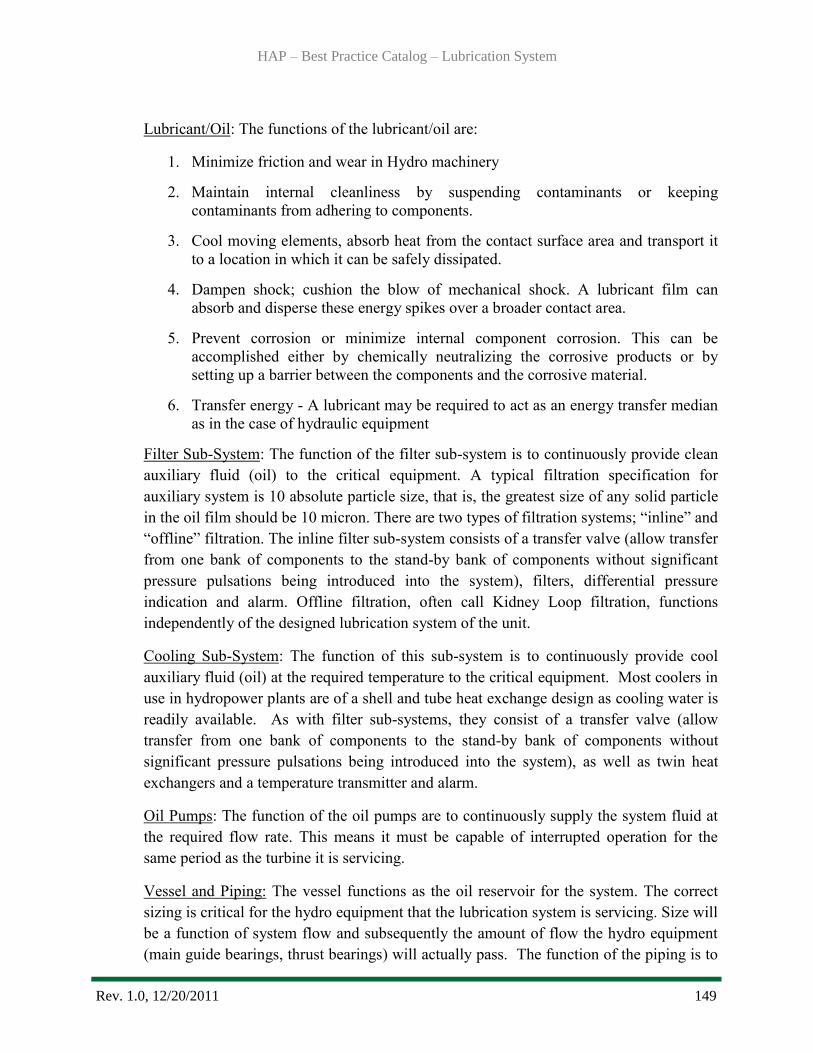
HAP – Best Practice Catalog – Lubrication System
Rev. 1.0, 12/20/2011 149
Lubricant/Oil: The functions of the lubricant/oil are:
1. Minimize friction and wear in Hydro machinery
2. Maintain internal cleanliness by suspending contaminants or keeping
contaminants from adhering to components.
3. Cool moving elements, absorb heat from the contact surface area and transport it
to a location in which it can be safely dissipated.
4. Dampen shock; cushion the blow of mechanical shock. A lubricant film can
absorb and disperse these energy spikes over a broader contact area.
5. Prevent corrosion or minimize internal component corrosion. This can be
accomplished either by chemically neutralizing the corrosive products or by
setting up a barrier between the components and the corrosive material.
6. Transfer energy - A lubricant may be required to act as an energy transfer median
as in the case of hydraulic equipment
Filter Sub-System: The function of the filter sub-system is to continuously provide clean
auxiliary fluid (oil) to the critical equipment. A typical filtration specification for
auxiliary system is 10 absolute particle size, that is, the greatest size of any solid particle
in the oil film should be 10 micron. There are two types of filtration systems; “inline” and
“offline” filtration. The inline filter sub-system consists of a transfer valve (allow transfer
from one bank of components to the stand-by bank of components without significant
pressure pulsations being introduced into the system), filters, differential pressure
indication and alarm. Offline filtration, often call Kidney Loop filtration, functions
independently of the designed lubrication system of the unit.
Cooling Sub-System: The function of this sub-system is to continuously provide cool
auxiliary fluid (oil) at the required temperature to the critical equipment. Most coolers in
use in hydropower plants are of a shell and tube heat exchange design as cooling water is
readily available. As with filter sub-systems, they consist of a transfer valve (allow
transfer from one bank of components to the stand-by bank of components without
significant pressure pulsations being introduced into the system), as well as twin heat
exchangers and a temperature transmitter and alarm.
Oil Pumps: The function of the oil pumps are to continuously supply the system fluid at
the required flow rate. This means it must be capable of interrupted operation for the
same period as the turbine it is servicing.
Vessel and Piping: The vessel functions as the oil reservoir for the system. The correct
sizing is critical for the hydro equipment that the lubrication system is servicing. Size will
be a function of system flow and subsequently the amount of flow the hydro equipment
(main guide bearings, thrust bearings) will actually pass. The function of the piping is to

HAP – Best Practice Catalog – Lubrication System
Rev. 1.0, 12/20/2011 150
connect the console/skid auxiliary equipment (pumps, vessel, etc.) to the Hydro units it
services. The typical oil velocities are in the order of 4 to 6 feet per second.
Console/Skid: The function of the console/skid is to house most of the Lubrication
System components (pumps, vessel, etc.). Since auxiliary equipment must be maintained
and calibrated during operation, it is important for the console/skid to be sized with
ample space for maintenance personal.
Instrumentation/Alarms: The function of the instrumentation is to measure and regulate
the process variables of the auxiliary fluid (oil) such as flow, temperature, level and
pressure. Pressure indicators, temperature indicators, and differential pressure
transmitters are examples of key instrumentation.
1.2 Summary of Best Practices
1.2.1Performance/Efficiency & Capability - Oriented Best Practices
There are no best practices directly associated with the unit efficiency and capacity.
1.2.2Reliability/Operations & Maintenance - Oriented Best Practices
Maintain clean, dry oil by periodic analysis of oil condition and regular
sampling for visual and laboratory examination.
Monitor oil filter change time interval (when the filter differential pressure
alarm is activated) to clean oil tank and rundown tanks. This will involve
maintaining operating and temperature records of hydro plant oil system.
Stainless steel reservoir, vessels and piping can be used to ensure minimum oil
flushing time, optimum machinery component life and unit reliability.
High pressure lubrication system can be used on thrust bearings to reduce
friction during start-up and shut down.
System pumps having mechanical seals are recommended instead of shaft
packing.
Follow correct oil flushing procedures will produce an oil system that does not
require frequent on-line filter changeover.
The use of centrifugal pumps eliminates the need for relief and backpressure
(bypass) control valves within the lubrication system.
Monitor turbine vibration. Setting the shaft vibration alarm at 50% of the initial
field value will allow early detection of rotor condition change, and initiate
investigation and an action plan for corrective action before a rotor or
component failure occurs.

HAP – Best Practice Catalog – Lubrication System
Rev. 1.0, 12/20/2011 151
Ensure continuous venting of the non-operating cooler and filter in cold ambient
applications.
Kidney loop filtration should be installed on turbine guide bearing oil systems to
remove debris and water continuously.
Require a Factory Acceptance Test (FAT) for any new oil consoles to duplicate
field conditions as closely as possible and record response times for transients.
Install sight glasses in the drain lines of positive displacement pump relief valve
to confirm that the relief valve is not passing.
Label oil system piping with colored tape to help personnel to understand
system operation and how to take corrective action quickly to prevent unit
damage.
1.3 Best Practice Cross-references
I&C - Automation Best Practice
Mechanical – Francis Turbine Best Practice
Mechanical – Kaplan Turbine Best Practice
Mechanical – Pelton Turbine Best Practice
Mechanical – Generator Best Practice
Mechanical – Governor Best Practice
2.0 Technology Design Summary
2.1 Material and Design Technology Evolution
Early designs for oil lubricating systems, for vertical hydro turbine-generator bearings,
consisted of pumps driven by gears or belts from the main shaft or by simple viscosity pumps
which move oil by hydrodynamic action. Horizontal hydro turbine-generator bearings were
often lubricated by oil rings riding on top of the shaft. Modern designs have evolved into
systems which move the oil by electric motor driven pumps. This has many advantages
such as providing electrical controls, backup pumps (AC and DC), and flexible capacities
such as flow rates and pressures.
2.2 State of the Art Technology
There are number of designs for Lubrication Sub-Systems that have become state of the art
technology. Lube and seal oil overhead tanks that are not stainless steel will reduce bearing,
oil seal and/or driver control and protection Mean Time before Failure (MTBF), since there
cannot be a filter between these tanks and these components. This is due to iron sulfide
building up in the small clearances of the unit components, which has resulted in premature
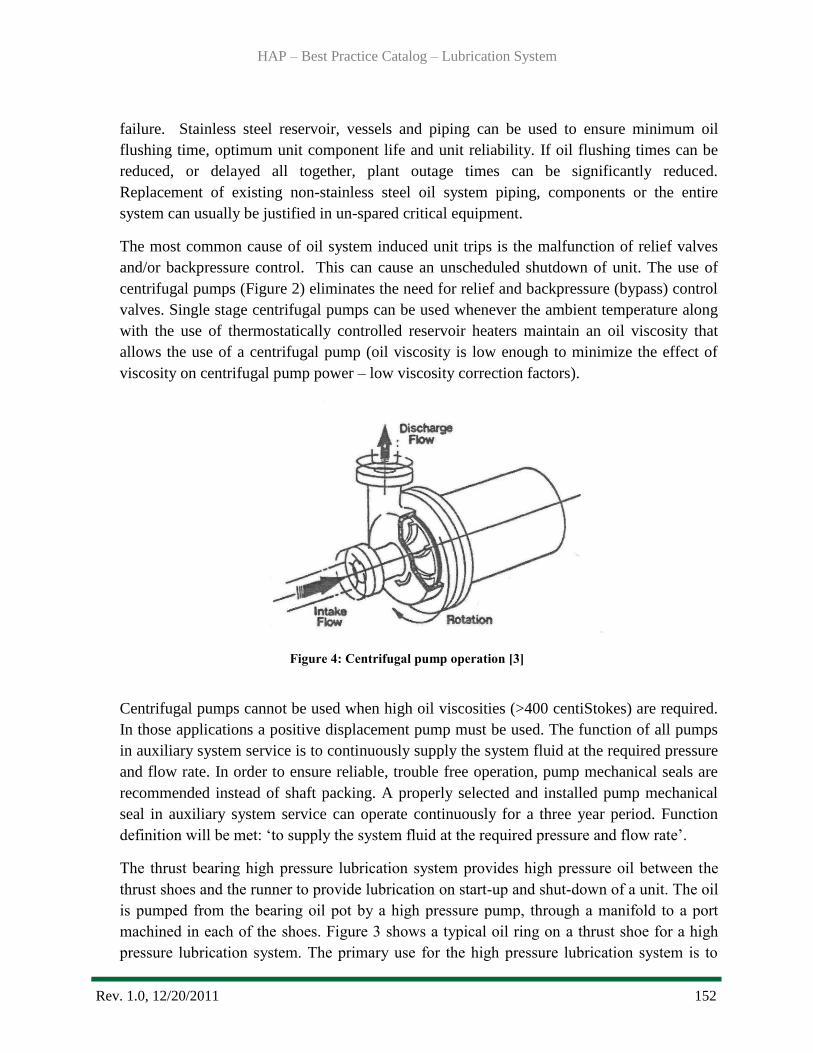
HAP – Best Practice Catalog – Lubrication System
Rev. 1.0, 12/20/2011 152
failure. Stainless steel reservoir, vessels and piping can be used to ensure minimum oil
flushing time, optimum unit component life and unit reliability. If oil flushing times can be
reduced, or delayed all together, plant outage times can be significantly reduced.
Replacement of existing non-stainless steel oil system piping, components or the entire
system can usually be justified in un-spared critical equipment.
The most common cause of oil system induced unit trips is the malfunction of relief valves
and/or backpressure control. This can cause an unscheduled shutdown of unit. The use of
centrifugal pumps (Figure 2) eliminates the need for relief and backpressure (bypass) control
valves. Single stage centrifugal pumps can be used whenever the ambient temperature along
with the use of thermostatically controlled reservoir heaters maintain an oil viscosity that
allows the use of a centrifugal pump (oil viscosity is low enough to minimize the effect of
viscosity on centrifugal pump power – low viscosity correction factors).
Figure 4: Centrifugal pump operation [3]
Centrifugal pumps cannot be used when high oil viscosities (>400 centiStokes) are required.
In those applications a positive displacement pump must be used. The function of all pumps
in auxiliary system service is to continuously supply the system fluid at the required pressure
and flow rate. In order to ensure reliable, trouble free operation, pump mechanical seals are
recommended instead of shaft packing. A properly selected and installed pump mechanical
seal in auxiliary system service can operate continuously for a three year period. Function
definition will be met: ‗to supply the system fluid at the required pressure and flow rate‘.
The thrust bearing high pressure lubrication system provides high pressure oil between the
thrust shoes and the runner to provide lubrication on start-up and shut-down of a unit. The oil
is pumped from the bearing oil pot by a high pressure pump, through a manifold to a port
machined in each of the shoes. Figure 3 shows a typical oil ring on a thrust shoe for a high
pressure lubrication system. The primary use for the high pressure lubrication system is to

HAP – Best Practice Catalog – Lubrication System
Rev. 1.0, 12/20/2011 153
reduce friction during start-up and shut down, but it is also a very useful system during
alignment. With the system on, it is possible for a couple of people to rotate a unit by hand or
move the rotating components laterally on the thrust bearing [2].
Figure 5: Lubrication Ports on Thrust Bearing [2]
Supplementary oil cleaning can be achieved by a separate system (Kidney Loop Oil
Filtration System) in series with the existing lubrication system. (Figure 4)
Figure 6: Kidney Loop Oil Filtration
System [L&S Electric, Inc.]
HAP – Best Practice Catalog – Lubrication System
Rev. 1.0, 12/20/2011 154
This system can reduces failures caused by dirty oil thus increased life and performance
of pumps, valves, servos, oil heads and other various hydraulic mechanisms. It can
promote extended oil life and help eliminate moisture in oil.
3.0 Operation & Maintenance Practices
3.1 Condition Assessment
Samples of oil or any deposits need to be taken at regular intervals for visual examination
and laboratory analysis. Best practice includes daily visual examinations, monthly laboratory
examinations for general system and oil conditions, and six-month laboratory examinations
for a more in-depth determination of future oil life. By doing this, detection can be made at
the start of deterioration, contamination or other troubles early and corrective action can be
taken [4]. Figure 5 illustrates the oil film and the testing involved.
Lubricant/oil condition assessment testing [5]:
Viscosity ASTM D445
RPVOT (Rotary Pressure Vessel Oxidation Test) ASTM D2272
Water Content ASTM D1744
Acid Number ASTM D664, ASTM D974
ISO Cleanliness ISO 4406
Rust ASTM D665
Water Separability (Demulsibility) ASTM D1401
Foam ASTM D892
ICP Metals ASTM D6130
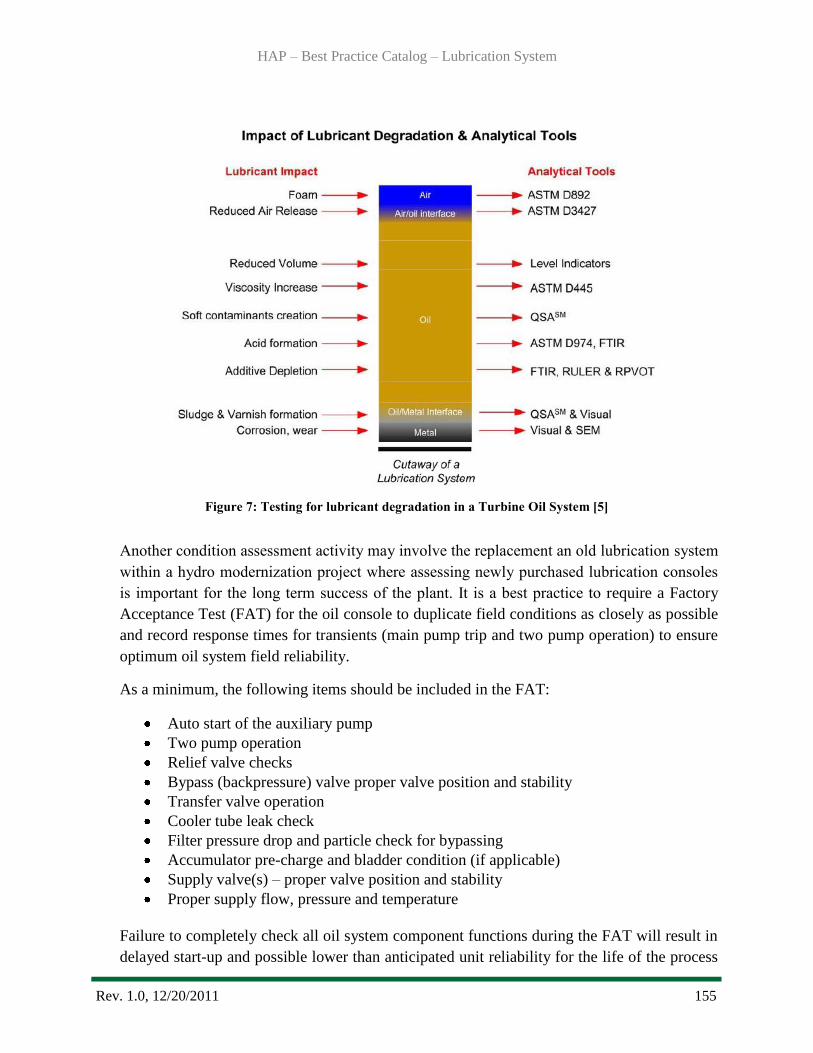
HAP – Best Practice Catalog – Lubrication System
Rev. 1.0, 12/20/2011 155
Figure 7: Testing for lubricant degradation in a Turbine Oil System [5]
Another condition assessment activity may involve the replacement an old lubrication system
within a hydro modernization project where assessing newly purchased lubrication consoles
is important for the long term success of the plant. It is a best practice to require a Factory
Acceptance Test (FAT) for the oil console to duplicate field conditions as closely as possible
and record response times for transients (main pump trip and two pump operation) to ensure
optimum oil system field reliability.
As a minimum, the following items should be included in the FAT:
Auto start of the auxiliary pump
Two pump operation
Relief valve checks
Bypass (backpressure) valve proper valve position and stability
Transfer valve operation
Cooler tube leak check
Filter pressure drop and particle check for bypassing
Accumulator pre-charge and bladder condition (if applicable)
Supply valve(s) – proper valve position and stability
Proper supply flow, pressure and temperature
Failure to completely check all oil system component functions during the FAT will result in
delayed start-up and possible lower than anticipated unit reliability for the life of the process
HAP – Best Practice Catalog – Lubrication System
Rev. 1.0, 12/20/2011 156
unit. Chart recorder data for all transient checks (pump trip and two pump operation) and
transfer valve check, are required to be supplied for confirmation that oil supply pressure
during the transient event does not fall to the trip setting.
3.2 Operations
All gravity drain oil systems accumulate debris (oil sludge, etc.) in the oil reservoir over
time. Increasing frequency of oil filter change (significant increase – say from once per year
to once every six months) indicates a need to clean the oil reservoir and rundown tanks at the
next turnaround. It is a best practice to monitor oil filter change time (when the filter
differential pressure alarm is activated) to clean oil tank and rundown tanks. This is a
predictive approach that will minimize oil reservoir and overhead tank cleaning cycles while
still ensuring unit reliability. Every time the unit is shut down, any oil contained in the tank
and all associated debris enters the seal without the benefit of filtration. Therefore, attention
should be given to any overhead seal oil tanks that have never been cleaned, but are exposed
to the process gas and associated process debris.
In cold climates (ambient temperatures below 15° C at any time of the year), cool, static oil
in the non-operating cooler and filter will cause a transient pressure drop when it is comes
on-line. Low oil pressure alarms will occur for critical equipment (e.g., when auxiliary pump
does not start or does not start in time). It is a best practice to continuously vent the non-
operating cooler and filter in cold ambient applications. An enable reliable operational
transfer (cooler or filter) always maintains this non-operating equipment with open
ventilation and at the same temperature as the operating equipment. Where an alarms/trip has
been caused by the issue noted above, operating procedure should be revised and orificed
vents installed if required.
Since only the oil film keeps gear and screw components from contacting each other, a
plugged main pump suction strainer will rapidly increase pump clearance and cause the
auxiliary pump to start. It is a best practice to install differential pressure transmitters to
alarm on high differential pressure, for control room monitoring, around pump suction
strainers – especially screw and gear pumps. The source of the main pump strainer blockage
will eventually plug the auxiliary strainer and result in auxiliary pump damage.
It is very difficult to confirm that a positive displacement pump relief valve is not passing. A
friction-bound relief valve can cause an unexpected shutdown of an oil system by passing an
additional amount of oil that can force the start-up of an auxiliary pump, thus exposing the
unit to a shutdown if the auxiliary pump does not start in time. It is a best practice to install
sight glasses in the drain lines of positive displacement pump relief valve to confirm that the
relief valve is not passing.
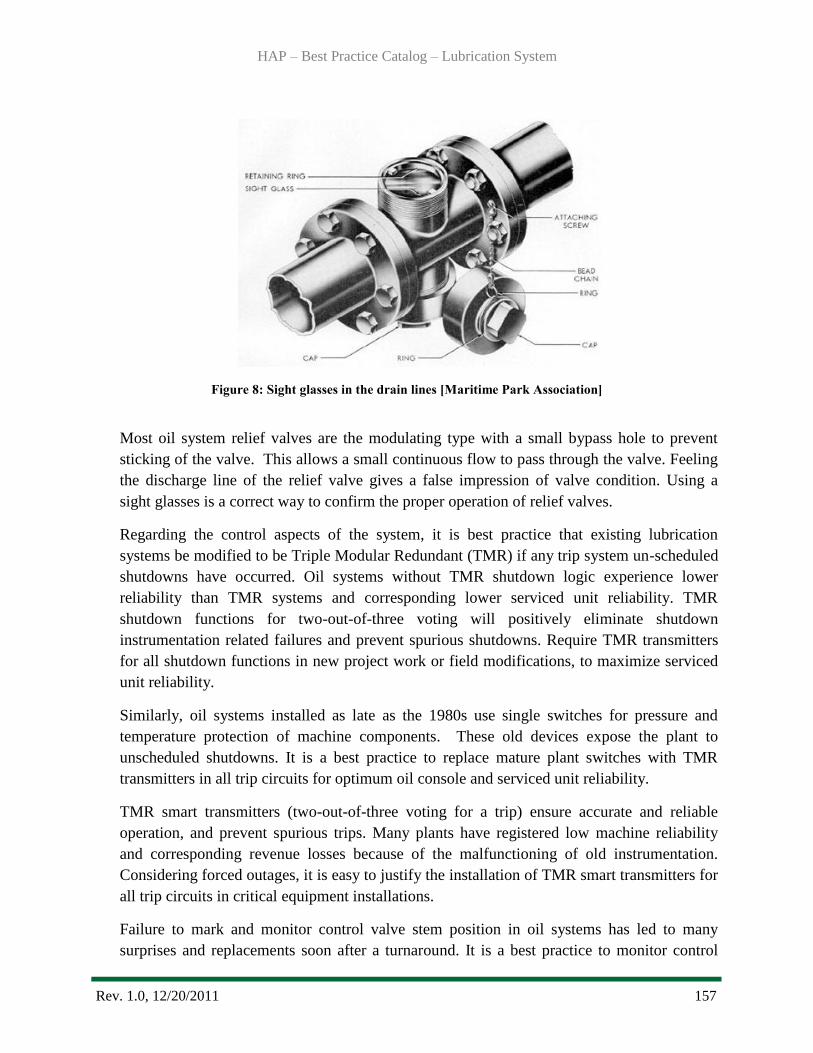
HAP – Best Practice Catalog – Lubrication System
Rev. 1.0, 12/20/2011 157
Figure 8: Sight glasses in the drain lines [Maritime Park Association]
Most oil system relief valves are the modulating type with a small bypass hole to prevent
sticking of the valve. This allows a small continuous flow to pass through the valve. Feeling
the discharge line of the relief valve gives a false impression of valve condition. Using a
sight glasses is a correct way to confirm the proper operation of relief valves.
Regarding the control aspects of the system, it is best practice that existing lubrication
systems be modified to be Triple Modular Redundant (TMR) if any trip system un-scheduled
shutdowns have occurred. Oil systems without TMR shutdown logic experience lower
reliability than TMR systems and corresponding lower serviced unit reliability. TMR
shutdown functions for two-out-of-three voting will positively eliminate shutdown
instrumentation related failures and prevent spurious shutdowns. Require TMR transmitters
for all shutdown functions in new project work or field modifications, to maximize serviced
unit reliability.
Similarly, oil systems installed as late as the 1980s use single switches for pressure and
temperature protection of machine components. These old devices expose the plant to
unscheduled shutdowns. It is a best practice to replace mature plant switches with TMR
transmitters in all trip circuits for optimum oil console and serviced unit reliability.
TMR smart transmitters (two-out-of-three voting for a trip) ensure accurate and reliable
operation, and prevent spurious trips. Many plants have registered low machine reliability
and corresponding revenue losses because of the malfunctioning of old instrumentation.
Considering forced outages, it is easy to justify the installation of TMR smart transmitters for
all trip circuits in critical equipment installations.
Failure to mark and monitor control valve stem position in oil systems has led to many
surprises and replacements soon after a turnaround. It is a best practice to monitor control
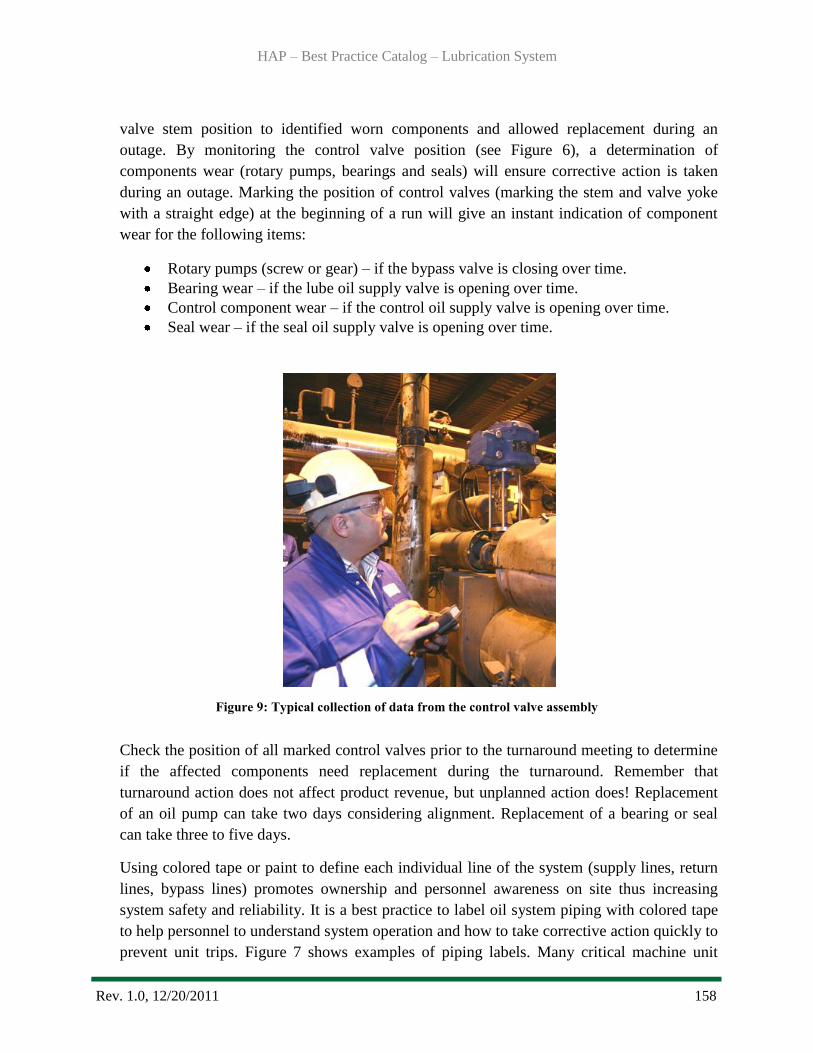
HAP – Best Practice Catalog – Lubrication System
Rev. 1.0, 12/20/2011 158
valve stem position to identified worn components and allowed replacement during an
outage. By monitoring the control valve position (see Figure 6), a determination of
components wear (rotary pumps, bearings and seals) will ensure corrective action is taken
during an outage. Marking the position of control valves (marking the stem and valve yoke
with a straight edge) at the beginning of a run will give an instant indication of component
wear for the following items:
Rotary pumps (screw or gear) – if the bypass valve is closing over time.
Bearing wear – if the lube oil supply valve is opening over time.
Control component wear – if the control oil supply valve is opening over time.
Seal wear – if the seal oil supply valve is opening over time.
Figure 9: Typical collection of data from the control valve assembly
Check the position of all marked control valves prior to the turnaround meeting to determine
if the affected components need replacement during the turnaround. Remember that
turnaround action does not affect product revenue, but unplanned action does! Replacement
of an oil pump can take two days considering alignment. Replacement of a bearing or seal
can take three to five days.
Using colored tape or paint to define each individual line of the system (supply lines, return
lines, bypass lines) promotes ownership and personnel awareness on site thus increasing
system safety and reliability. It is a best practice to label oil system piping with colored tape
to help personnel to understand system operation and how to take corrective action quickly to
prevent unit trips. Figure 7 shows examples of piping labels. Many critical machine unit

HAP – Best Practice Catalog – Lubrication System
Rev. 1.0, 12/20/2011 159
shutdowns are the result of not monitoring the local instrument and components in the
system. Failure to properly label piping, instruments and components leads to neglect and
corresponding low oil system reliability.
Figure 10: Typical Piping Labels
3.3 Maintenance
Maintenance of an oil lubricated bearing and its reliability is directly connected to the
quality of the supplied oil used for lubrication and cooling. Any contamination of the oil
either with debris or water will increase the likelihood of a bearing failure.
Oil filters are usually positioned downstream of the oil coolers to prevent carbon steel (iron
sulfide) particles from entering the machinery components and causing pre-mature
wear/failure. Shell and tube oil coolers typically have the water in the tubes and oil in the
shell and are made of carbon steel for cost reasons. It is a best practice to use of stainless
steel coolers and filters. This can easily be justified and will ensure maximum life of
machine components.
Lubrication system flushing may be either a displacement flush after a drain and fill, or a
high velocity flush for initial turbine oil fills. A displacement flush is performed concurrently
during turbine oil replacement, and a high velocity flush is designed to remove contaminants
entering from transport and commissioning of a new turbine. Displacement flushes, using
separate flush oil, are to remove residual oil oxidation product that cannot be removed by
draining or vacuum. A displacement flush is conducted by utilizing lubrication system
circulation pumps without any modification to normal oil circulation flow paths, except for
potential kidney loop filtration. This flush is typically done based on a time interval vs.

HAP – Best Practice Catalog – Lubrication System
Rev. 1.0, 12/20/2011 160
cleanliness (particle levels) to facilitate the removal of soluble and insoluble contaminants
that would not typically be removed by system filters.
Best practices in high-velocity flushing are as follows:
Supply and storage tanks should be clean, dry and odor-free. Diesel flushing is not
acceptable.
Two to three times’ normal fluid velocity achieved with external high-volume pumps,
or by sequential segmentation flushing through bearing jumpers.
Removal of oil after flush is completed to inspect and manually clean (lint-free rags)
turbine lube oil system internal surfaces.
High-efficiency bypass system hydraulics to eliminate the risk of fine particle damage
[5].
4.0 Metrics, Monitoring and Analysis
4.1 Measures of Performance, Condition, and Reliability
In standard ASTM D4378-08 [7], an equation was developed for turbine severity, B, is as
follows:
B = M (1 - X/100)/(1 - e-Mt/100
)
Where: B is the turbine severity
M is the fresh oil makeup expressed as the percent of total charge per year
t is the years of oil use
X is the used oil oxidation resistance in the Test Method D 2722 rotary pressure
vessel text expressed as % of fresh oil
In standard ISO 4406, oil cleanliness levels are defined by three numbers divided by slashes
(/). The example below illustrates the use of ISO 4406 code chart.
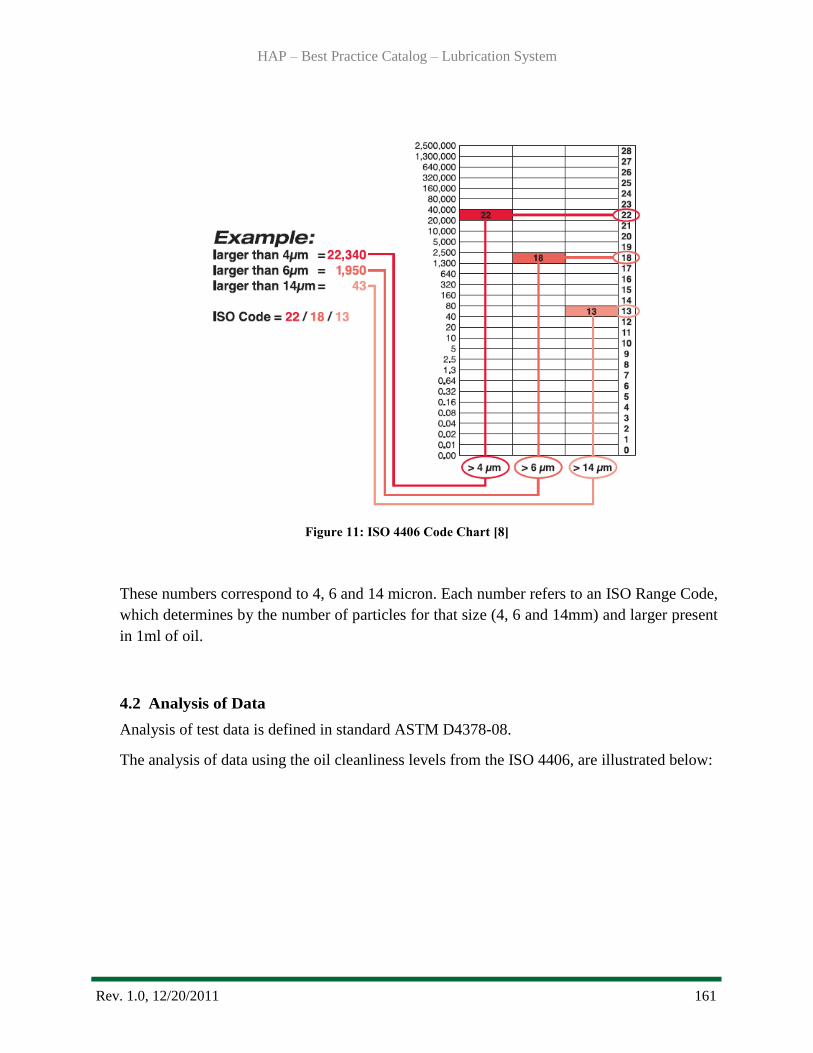
HAP – Best Practice Catalog – Lubrication System
Rev. 1.0, 12/20/2011 161
Figure 11: ISO 4406 Code Chart [8]
These numbers correspond to 4, 6 and 14 micron. Each number refers to an ISO Range Code,
which determines by the number of particles for that size (4, 6 and 14mm) and larger present
in 1ml of oil.
4.2 Analysis of Data
Analysis of test data is defined in standard ASTM D4378-08.
The analysis of data using the oil cleanliness levels from the ISO 4406, are illustrated below:
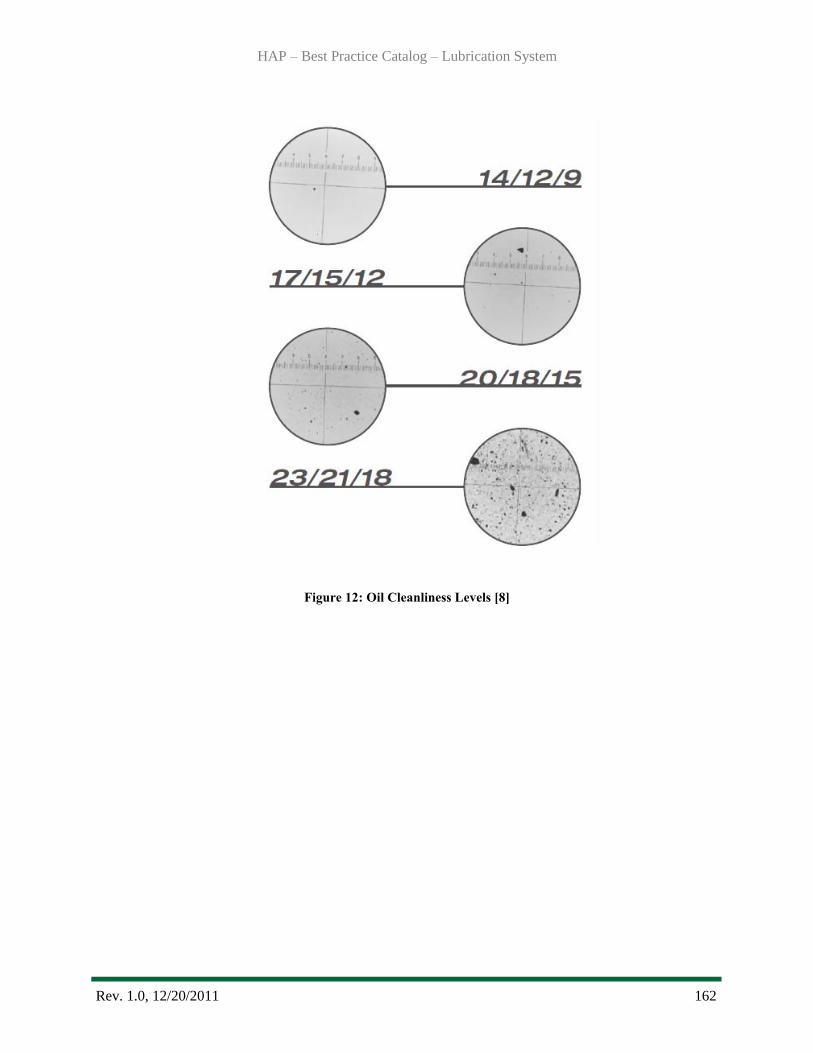
HAP – Best Practice Catalog – Lubrication System
Rev. 1.0, 12/20/2011 162
Figure 12: Oil Cleanliness Levels [8]
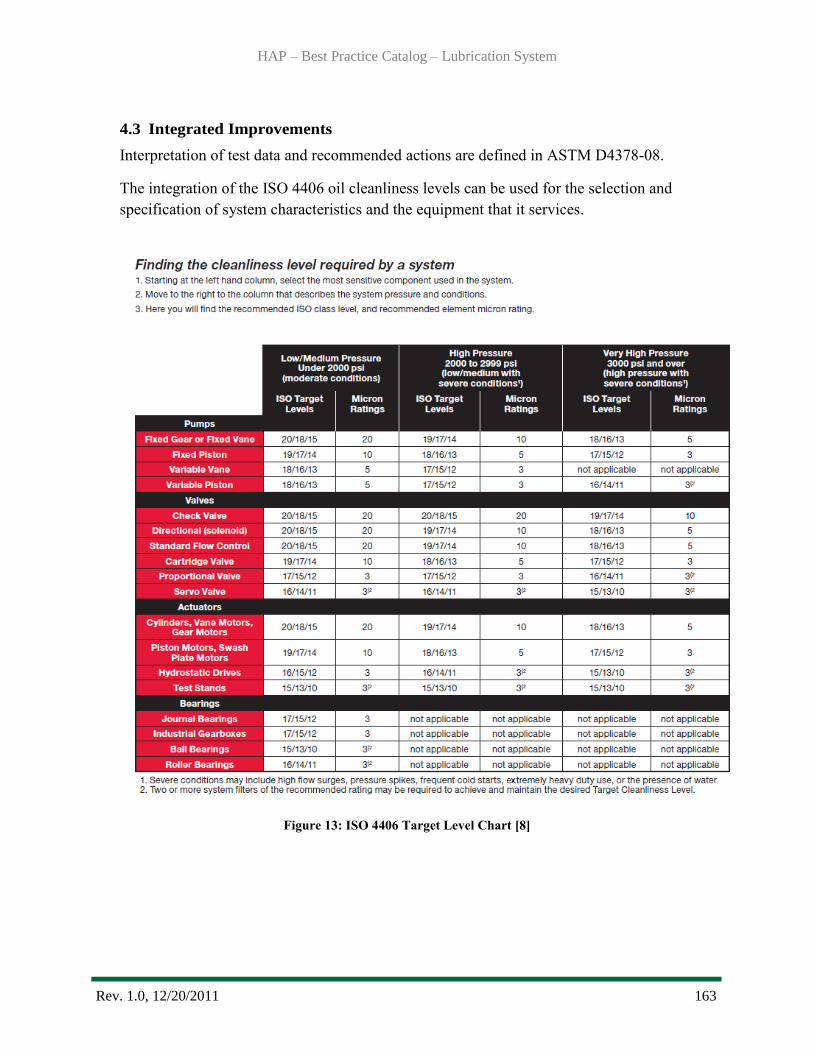
HAP – Best Practice Catalog – Lubrication System
Rev. 1.0, 12/20/2011 163
4.3 Integrated Improvements
Interpretation of test data and recommended actions are defined in ASTM D4378-08.
The integration of the ISO 4406 oil cleanliness levels can be used for the selection and
specification of system characteristics and the equipment that it services.
Figure 13: ISO 4406 Target Level Chart [8]

HAP – Best Practice Catalog – Lubrication System
Rev. 1.0, 12/20/2011 164
5.0 Information Sources:
Baseline Knowledge:
EPRI, Hydro Life Extension Modernization Guides: Volume 4-5 Auxiliary Mechanical and
Electrical Systems TR-112350-V4 – Palo Alto, CA – 2001
USBR, Alignment of Vertical Shaft Hydro Units, Facilities, Instructions, Standards and
Techniques Volume 2-1 – Colorado - 2000
State of the Art:
Forsthoffer, W., E., Best Practice Handbook for Rotating Machinery – 2011
McKenna, K., P. E., Turbines and Their Lubrication -The Engineered Difference, Spring
2001
Hannon, J., B., How to Select and Service Turbine Oils - Machinery Lubrication, July 2001
ANALYSTS, INC, Vitalpoint Advanced Fluids Assessment - Form 40601208 – 2008
Standards:
ASTM D4304, Standard Specification for Mineral Lubricating Oil used in Steam and Gas
turbines -2006
ISO 4406 Code, HYDAC Innovative Fluid Power: Overview Brochure – 1999

Best Practice Catalog
Governor
Revision 1.0, 12/15/2011
HAP – Best Practice Catalog – Governor
Rev. 1.0, 12/15/2011 166
1.0 Scope and Purpose .......................................................................................................... 167
1.1 Hydropower Taxonomy Position ................................................................................. 167
1.1.1 Governor Components ........................................................................................ 167
1.2 Summary of Best Practices .......................................................................................... 169
1.2.1 Performance/Efficiency & Capability - Oriented Best Practices ................... 169
1.2.2 Reliability/Operations & Maintenance - Oriented Best Practices ................. 169
1.3 Best Practice Cross-references ..................................................................................... 170
2.0 Technology Design Summary ......................................................................................... 170
2.1 Material and Design Technology Evolution ................................................................ 170
2.2 State of the Art Technology ......................................................................................... 173
3.0 Operation and Maintenance Practices ............................................................................. 176
3.1 Condition Assessment .................................................................................................. 176
3.2 Operations .................................................................................................................... 177
3.3 Maintenance ................................................................................................................. 179
4.0 Metrics, Monitoring and Analysis .................................................................................. 181
4.1 Measures of Performance, Condition, and Reliability ................................................. 181
4.2 Data Analysis ............................................................................................................... 182
4.3 Integrated Improvements.............................................................................................. 183
5.0 Information Sources ........................................................................................................ 183
HAP – Best Practice Catalog – Governor
Rev. 1.0, 12/15/2011 167
1.0 Scope and Purpose
This best practice for a hydraulic turbine governor addresses the technology, condition
assessment, operations, and maintenance best practices with the objective to maximize
performance and reliability of generating units. The primary purpose of the governor is to control
the turbine servomotors which adjust the flow of water through the turbine regulating unit speed
and power. How the governor is designed, operated, and maintained will directly impact the
reliability of a hydro unit.
1.1 Hydropower Taxonomy Position
Hydropower Facility → Powerhouse → Power Train Equipment → Governor
1.1.1 Governor Components
A governor is a combination of devices that monitor speed deviations in a hydraulic
turbine and converts that speed variation into a change of wicket gate servomotor
position which changes the wicket gate opening. This assembly of devices would be
known as a ―governing system‖. In a hydro plant this system is simply called the
―governor‖ or ―governor equipment‖. For a single regulating turbine (Francis and
Propeller), a governor is used to start a hydro unit, synchronize the unit to the grid, load,
and shut down the unit. For a double regulating turbine (Kaplan), a governor would also
add control to the runner blade servomotor which changes the pitch of the runner blades
to maintain optimal efficiency of the turbine for a given wicket gate opening. This is
usually done through a mechanical cam or digitally through an electronic controller.
Double regulating is also used for dual control of a Pelton‘s nozzle opening and deflector
position. This double regulation establishes an exact relationship between the position of
the needle valve and the deflector to allow the deflector to intercept the jet of water flow
before closure of the needle valve thereby reducing the water hammer effect in the
penstock.
A governor is usually not considered as an efficiency component of a hydro unit, except
for a Kaplan unit‘s double regulation of blade angle versus wicket gate position which is
an important driver for performance and efficiency. For a Kaplan turbine governor, a 2D
or 3D cam (or electronic equal) for blade positioning and the Kaplan feedback/restoring
mechanism, together supply the double regulating function. The details are described as
follows:
Double Regulating Device: The function of the double regulating device for a Kaplan
turbine is to provide a predetermined relationship between the blade tilt angle and the
wicket gate opening. This is done by a 2 dimensional (2D) or a 3 dimensional (3D) cam.
A 2D mechanical cam provides a relationship between blade tilt angle and wicket gate
opening. A 3D cam adds the third dimension of head usually by means of an electronic
or digital controller. A 2D cam has to be manually adjusted for different head ranges
whereas a 3D cam automatically adjusts for head changes.
Kaplan Blade Position Feedback: The restoring mechanism is a ―feedback‖ device that
feeds back the current blade tilt angle and the post movement command position to the
HAP – Best Practice Catalog – Governor
Rev. 1.0, 12/15/2011 168
control system. In a mechanical governor this is typically a pulley cable system, and with
digital governors it may be a linear potentiometer or linear magnetostrictive (non-contact)
electrical positioning system.
The non-performance but reliability related components of a governor include the oil
pressure system, flow distributing valves, control system, Permanent Magnet Generator
(PMG) or speed sensor, control system, wicket gate restoring mechanism, and creep
detector. As a note, many references consider the wicket gate servomotors as part of the
governor system. However for HAP, the servomotors are considered part of the turbines
and are addressed in the turbine best practices.
Oil Pressure System: The oil pressure system consists of oil pump/s, oil accumulator
tank/s, oil sump, and the necessary valves, piping, and filtering required (pressure
tanks/accumulators are not addressed in this best practice document).
Flow Distributing Valves: The distributing valve system varies in design depending on
the type of governor. For a common mechanical governor, the system consists of a
regulating valve (that moves the servomotors) that is controlled by the valve actuator,
which is in turn controlled by the pilot valve. These valves coupled with the oil pressure
system provides power amplification in which small low force movements are amplified
into large high forces movements of the servomotors.
Control System: The control system can be mechanical, analog, or digital depending on
the type of governor. In the truest sense, the control system is the ―governor‖. The
purpose of all other components in a governor system is to carry out the instructions of
the control system (governor). For mechanical governors, the control system consists of
the fly-ball/motor assembly (ball-head or governing head) driven by the PMG, linkages,
compensating dashpot, and speed droop device.
Speed Sensor: Mechanical governors use a permanent magnet generator (PMG) as
rotating speed sensor which is driven directly by the hydro unit. It is basically a multi-
phase PMG that is electrically connected to a matching multi-phase motor (ball head
motor) inside the governor cabinet that drives the fly-ball assembly (or governing head)
which is part of the control system. Analog and Digital governors use a Speed Signal
Generator (SSG) driven directly by the unit which provides a frequency signal
proportional to the unit speed usually through a zero velocity magnetic pickup monitoring
rotating gear teeth or through generator bus frequency measured directly by a Potential
Transformer (PT).
Double Regulating Device for Pelton Turbine: Double regulation for a Pelton turbine
provides for an exact relationship between the position of the needle valve and the
deflector to allow the deflector to intercept the jet of water before closure of the needle
valve thereby reducing any water hammer in the penstock. This is done by a mechanical
connection between the needle valve and deflector.
Wicket Gate Position Feedback: The restoring mechanism is a ―feedback‖ device that
feeds back the current wicket gate position and the post movement command position to
the control system. In a mechanical governor this is typically a pulley cable system, and
HAP – Best Practice Catalog – Governor
Rev. 1.0, 12/15/2011 169
with digital governors it may be a linear potentiometer or linear magnetostrictive (non-
contact) electrical positioning system.
Creep Detector: The creep detector is a device, usually mounted on the PMG or part of
speed sensor that is capable of measuring very slow shaft revolutions. Its purpose is to
detect the beginning of shaft rotation that might occur from leakage of the wicket gates
while the unit is shut down. The system detects movement and turns on auxiliary
equipment, such as bearing oil pumps, to prevent damage.
In addition to the above devices, some auxiliary equipment associated closely with the
governing system and often found in, on, or near the governor cabinet which is not
addressed in this Best Practice, such as: synchronizer, shutdown solenoid, tachometer,
over speed switch, generator brake applicator, governor air compressor, and various
gages and instruments. These can vary greatly in design depending on the type of
governor or turbine.
1.2 Summary of Best Practices
1.2.1Performance/Efficiency & Capability - Oriented Best Practices
The governor performance refers to the ability of off-line and on-line responses,
sensitivity to hunting, accuracy of frequency, synchronization time, and the
ability to start remotely. These performances can affect the unit generation
performance directly or indirectly. One best practice is periodic testing to
establish accurate current governor performance characteristics and limits.
Periodic analysis of governor performance at Current Performance Level (CPL)
to detect and mitigate deviations of expected performance from the Installed
Performance Level (IPL) due to degradation or wear.
Periodic comparison of the CPL to the Potential Performance Level (PPL) to
trigger feasibility studies of major upgrades.
Maintain documentation of the IPL and update when modifications to equipment
are made.
Index testing of Kaplan turbines following ASME PTC 18-2011 [19], must be
done periodically (10 year cycle minimum) or after major maintenance activities
on the turbine, to establish the best blade angle to the gate opening relationship
and update the 2D or 3D cam.
1.2.2Reliability/Operations & Maintenance - Oriented Best Practices
Digital governors are the state of the art technology for hydro turbine governing
system, use digital type governor for new installation. They can be either
proprietary controllers or controllers based on industrial PLCs.
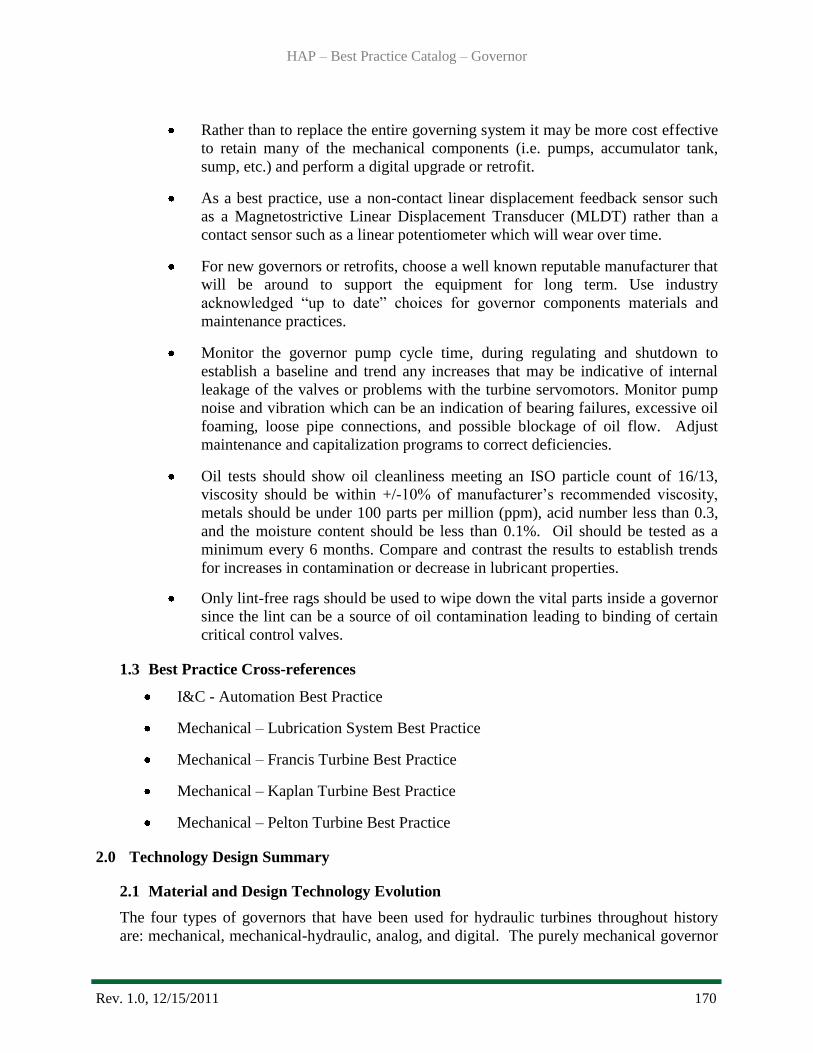
HAP – Best Practice Catalog – Governor
Rev. 1.0, 12/15/2011 170
Rather than to replace the entire governing system it may be more cost effective
to retain many of the mechanical components (i.e. pumps, accumulator tank,
sump, etc.) and perform a digital upgrade or retrofit.
As a best practice, use a non-contact linear displacement feedback sensor such
as a Magnetostrictive Linear Displacement Transducer (MLDT) rather than a
contact sensor such as a linear potentiometer which will wear over time.
For new governors or retrofits, choose a well known reputable manufacturer that
will be around to support the equipment for long term. Use industry
acknowledged ―up to date‖ choices for governor components materials and
maintenance practices.
Monitor the governor pump cycle time, during regulating and shutdown to
establish a baseline and trend any increases that may be indicative of internal
leakage of the valves or problems with the turbine servomotors. Monitor pump
noise and vibration which can be an indication of bearing failures, excessive oil
foaming, loose pipe connections, and possible blockage of oil flow. Adjust
maintenance and capitalization programs to correct deficiencies.
Oil tests should show oil cleanliness meeting an ISO particle count of 16/13,
viscosity should be within +/-10% of manufacturer‘s recommended viscosity,
metals should be under 100 parts per million (ppm), acid number less than 0.3,
and the moisture content should be less than 0.1%. Oil should be tested as a
minimum every 6 months. Compare and contrast the results to establish trends
for increases in contamination or decrease in lubricant properties.
Only lint-free rags should be used to wipe down the vital parts inside a governor
since the lint can be a source of oil contamination leading to binding of certain
critical control valves.
1.3 Best Practice Cross-references
I&C - Automation Best Practice
Mechanical – Lubrication System Best Practice
Mechanical – Francis Turbine Best Practice
Mechanical – Kaplan Turbine Best Practice
Mechanical – Pelton Turbine Best Practice
2.0 Technology Design Summary
2.1 Material and Design Technology Evolution
The four types of governors that have been used for hydraulic turbines throughout history
are: mechanical, mechanical-hydraulic, analog, and digital. The purely mechanical governor
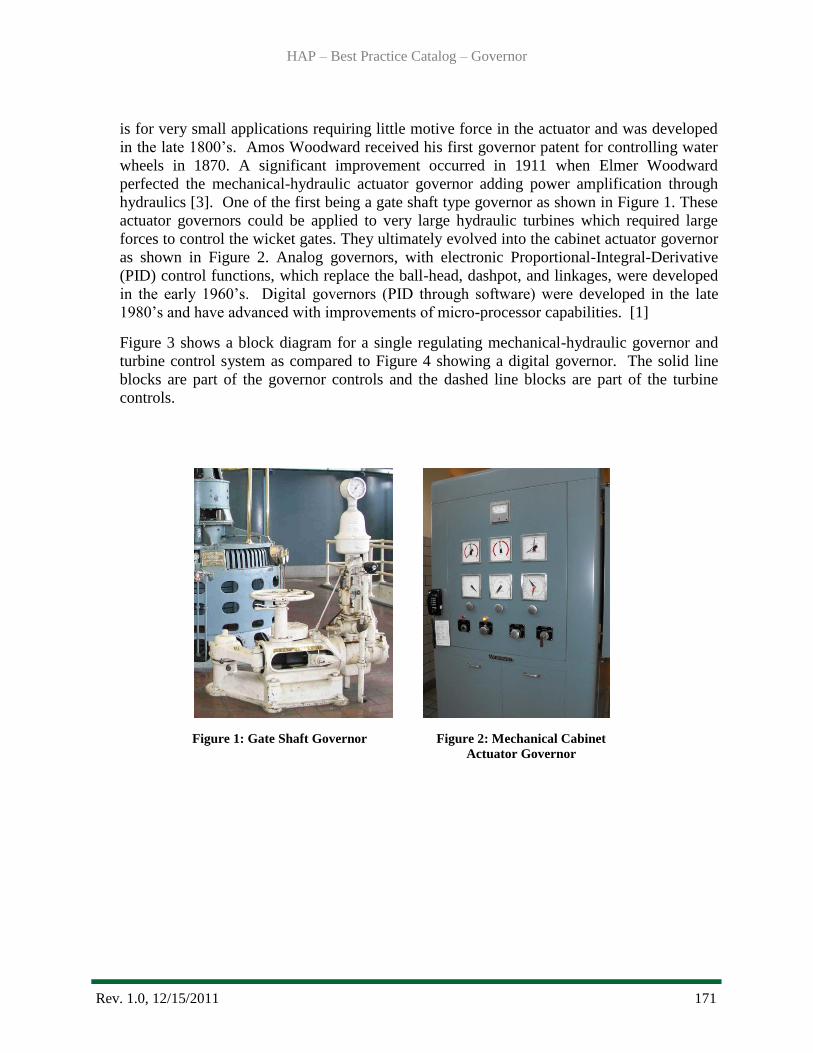
HAP – Best Practice Catalog – Governor
Rev. 1.0, 12/15/2011 171
is for very small applications requiring little motive force in the actuator and was developed
in the late 1800‘s. Amos Woodward received his first governor patent for controlling water
wheels in 1870. A significant improvement occurred in 1911 when Elmer Woodward
perfected the mechanical-hydraulic actuator governor adding power amplification through
hydraulics [3]. One of the first being a gate shaft type governor as shown in Figure 1. These
actuator governors could be applied to very large hydraulic turbines which required large
forces to control the wicket gates. They ultimately evolved into the cabinet actuator governor
as shown in Figure 2. Analog governors, with electronic Proportional-Integral-Derivative
(PID) control functions, which replace the ball-head, dashpot, and linkages, were developed
in the early 1960‘s. Digital governors (PID through software) were developed in the late
1980‘s and have advanced with improvements of micro-processor capabilities. [1]
Figure 3 shows a block diagram for a single regulating mechanical-hydraulic governor and
turbine control system as compared to Figure 4 showing a digital governor. The solid line
blocks are part of the governor controls and the dashed line blocks are part of the turbine
controls.
Figure 1: Gate Shaft Governor
Figure 2: Mechanical Cabinet
Actuator Governor

HAP – Best Practice Catalog – Governor
Rev. 1.0, 12/15/2011 172
Figure 3: Mechanical-Hydraulic Governor (Solid line) and Turbine Control System
(Dashed line) [7]
Figure 4: Digital Governor (Solid line) and Turbine Control System (Dashed line)
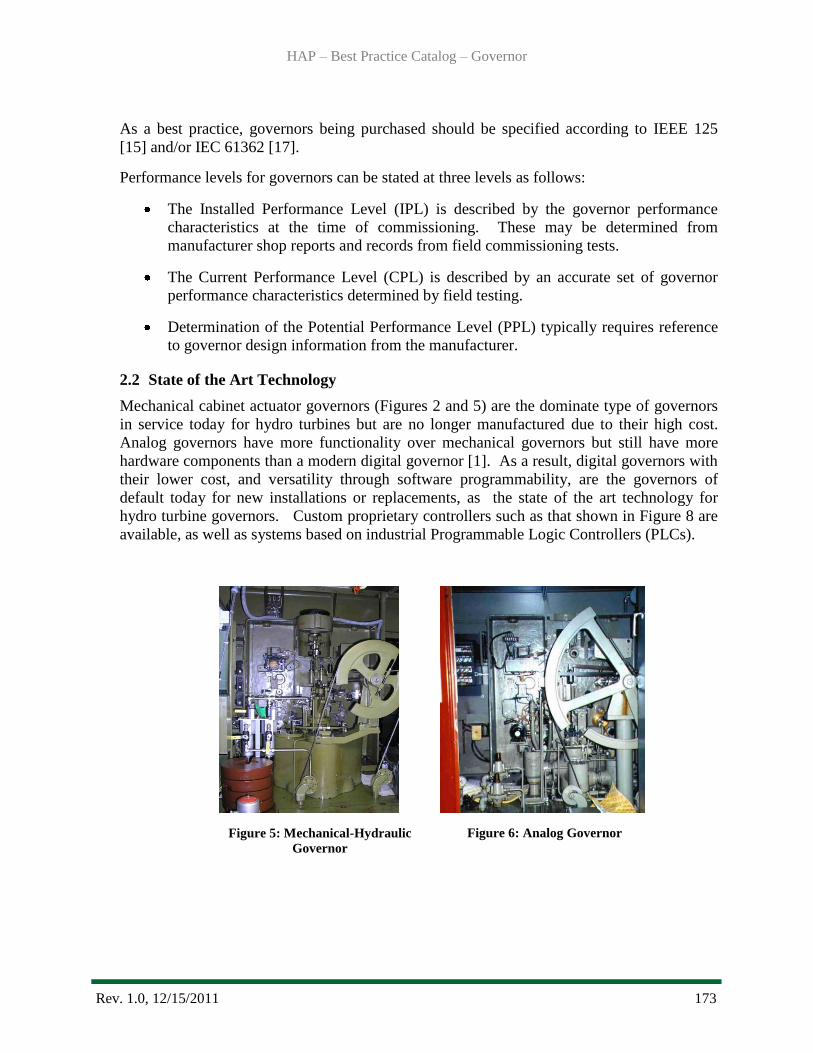
HAP – Best Practice Catalog – Governor
Rev. 1.0, 12/15/2011 173
As a best practice, governors being purchased should be specified according to IEEE 125
[15] and/or IEC 61362 [17].
Performance levels for governors can be stated at three levels as follows:
The Installed Performance Level (IPL) is described by the governor performance
characteristics at the time of commissioning. These may be determined from
manufacturer shop reports and records from field commissioning tests.
The Current Performance Level (CPL) is described by an accurate set of governor
performance characteristics determined by field testing.
Determination of the Potential Performance Level (PPL) typically requires reference
to governor design information from the manufacturer.
2.2 State of the Art Technology
Mechanical cabinet actuator governors (Figures 2 and 5) are the dominate type of governors
in service today for hydro turbines but are no longer manufactured due to their high cost.
Analog governors have more functionality over mechanical governors but still have more
hardware components than a modern digital governor [1]. As a result, digital governors with
their lower cost, and versatility through software programmability, are the governors of
default today for new installations or replacements, as the state of the art technology for
hydro turbine governors. Custom proprietary controllers such as that shown in Figure 8 are
available, as well as systems based on industrial Programmable Logic Controllers (PLCs).
Figure 5: Mechanical-Hydraulic
Governor
Figure 6: Analog Governor
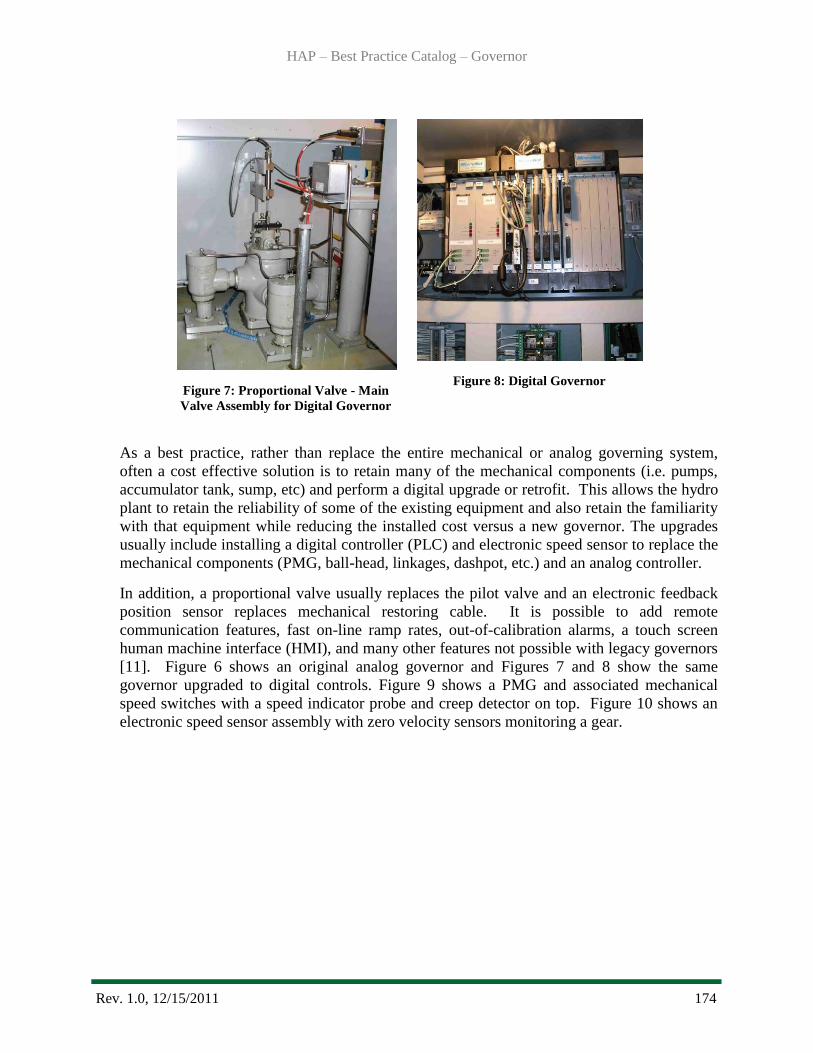
HAP – Best Practice Catalog – Governor
Rev. 1.0, 12/15/2011 174
Figure 7: Proportional Valve - Main
Valve Assembly for Digital Governor
Figure 8: Digital Governor
As a best practice, rather than replace the entire mechanical or analog governing system,
often a cost effective solution is to retain many of the mechanical components (i.e. pumps,
accumulator tank, sump, etc) and perform a digital upgrade or retrofit. This allows the hydro
plant to retain the reliability of some of the existing equipment and also retain the familiarity
with that equipment while reducing the installed cost versus a new governor. The upgrades
usually include installing a digital controller (PLC) and electronic speed sensor to replace the
mechanical components (PMG, ball-head, linkages, dashpot, etc.) and an analog controller.
In addition, a proportional valve usually replaces the pilot valve and an electronic feedback
position sensor replaces mechanical restoring cable. It is possible to add remote
communication features, fast on-line ramp rates, out-of-calibration alarms, a touch screen
human machine interface (HMI), and many other features not possible with legacy governors
[11]. Figure 6 shows an original analog governor and Figures 7 and 8 show the same
governor upgraded to digital controls. Figure 9 shows a PMG and associated mechanical
speed switches with a speed indicator probe and creep detector on top. Figure 10 shows an
electronic speed sensor assembly with zero velocity sensors monitoring a gear.

HAP – Best Practice Catalog – Governor
Rev. 1.0, 12/15/2011 175
Figure 9: Top of PMG
Figure 10: Digital Speed Sensor/s
Figures 11 and 12 show the contrast between a typical wicket gate servomotor mechanical
restoring cable for a mechanical governor feedback versus an electronic MLDT for feedback
to a digital governor. As a best practice, use a non-contact linear displacement feedback
sensor such as a MLDT rather than a contact sensor such as a linear potentiometer which will
wear over time.
Figure 11: Restoring Cable – Mechanical
Feedback
Figure 12: MLDT Electronic
Feedback
As a general cautionary note, one should be aware that the product life cycle of digital
governors is relatively short, as with most computerized technology of today. Therefore,
over time, spare parts can become difficult to procure. The software and the hardware
running it can be obsolete in as little as 10 years [11]. A best practice would be to choose a
well known reputable manufacturer that will be around to support the equipment for long
term. Use industry acknowledged ―up to date‖ choices for governor components materials
and maintenance practices.
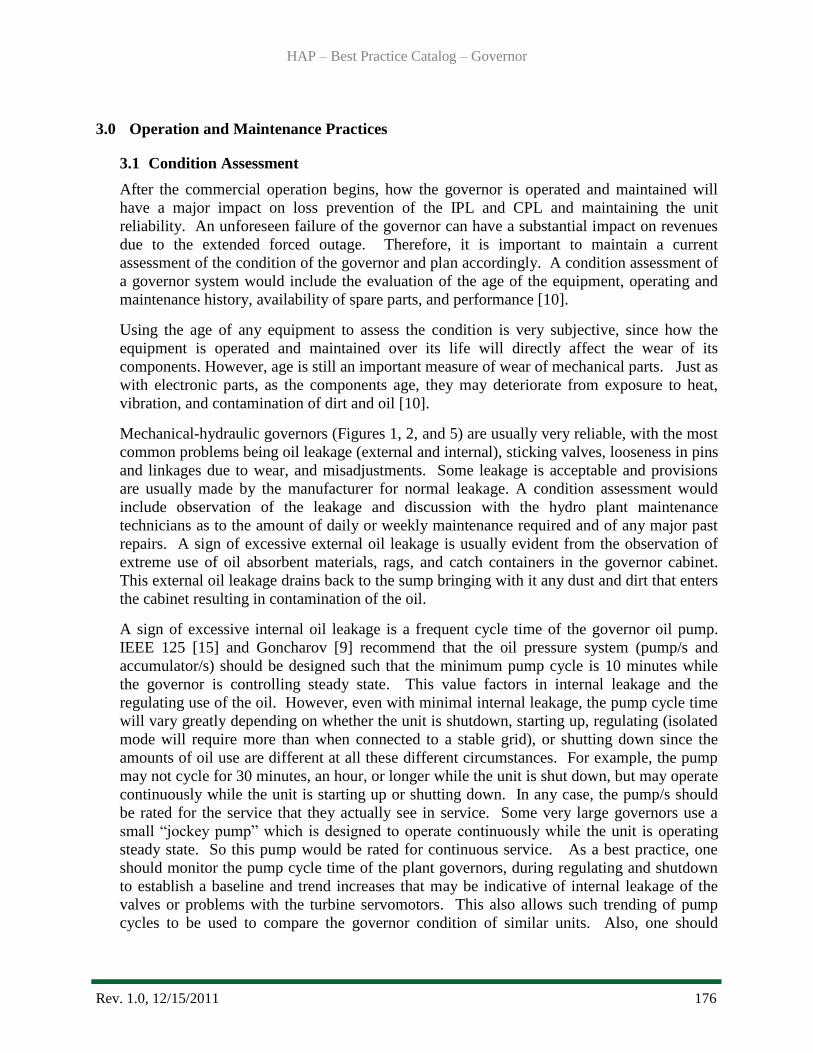
HAP – Best Practice Catalog – Governor
Rev. 1.0, 12/15/2011 176
3.0 Operation and Maintenance Practices
3.1 Condition Assessment
After the commercial operation begins, how the governor is operated and maintained will
have a major impact on loss prevention of the IPL and CPL and maintaining the unit
reliability. An unforeseen failure of the governor can have a substantial impact on revenues
due to the extended forced outage. Therefore, it is important to maintain a current
assessment of the condition of the governor and plan accordingly. A condition assessment of
a governor system would include the evaluation of the age of the equipment, operating and
maintenance history, availability of spare parts, and performance [10].
Using the age of any equipment to assess the condition is very subjective, since how the
equipment is operated and maintained over its life will directly affect the wear of its
components. However, age is still an important measure of wear of mechanical parts. Just as
with electronic parts, as the components age, they may deteriorate from exposure to heat,
vibration, and contamination of dirt and oil [10].
Mechanical-hydraulic governors (Figures 1, 2, and 5) are usually very reliable, with the most
common problems being oil leakage (external and internal), sticking valves, looseness in pins
and linkages due to wear, and misadjustments. Some leakage is acceptable and provisions
are usually made by the manufacturer for normal leakage. A condition assessment would
include observation of the leakage and discussion with the hydro plant maintenance
technicians as to the amount of daily or weekly maintenance required and of any major past
repairs. A sign of excessive external oil leakage is usually evident from the observation of
extreme use of oil absorbent materials, rags, and catch containers in the governor cabinet.
This external oil leakage drains back to the sump bringing with it any dust and dirt that enters
the cabinet resulting in contamination of the oil.
A sign of excessive internal oil leakage is a frequent cycle time of the governor oil pump.
IEEE 125 [15] and Goncharov [9] recommend that the oil pressure system (pump/s and
accumulator/s) should be designed such that the minimum pump cycle is 10 minutes while
the governor is controlling steady state. This value factors in internal leakage and the
regulating use of the oil. However, even with minimal internal leakage, the pump cycle time
will vary greatly depending on whether the unit is shutdown, starting up, regulating (isolated
mode will require more than when connected to a stable grid), or shutting down since the
amounts of oil use are different at all these different circumstances. For example, the pump
may not cycle for 30 minutes, an hour, or longer while the unit is shut down, but may operate
continuously while the unit is starting up or shutting down. In any case, the pump/s should
be rated for the service that they actually see in service. Some very large governors use a
small ―jockey pump‖ which is designed to operate continuously while the unit is operating
steady state. So this pump would be rated for continuous service. As a best practice, one
should monitor the pump cycle time of the plant governors, during regulating and shutdown
to establish a baseline and trend increases that may be indicative of internal leakage of the
valves or problems with the turbine servomotors. This also allows such trending of pump
cycles to be used to compare the governor condition of similar units. Also, one should

HAP – Best Practice Catalog – Governor
Rev. 1.0, 12/15/2011 177
monitor pump noise and vibration which can be an indication of bearing failures, excessive
oil foaming, loose pipe connections, and possible blockage of oil flow [12].
The importance of clean oil cannot be understated, so any condition assessment would
analyze oil test reports to ensure the oil suspended particulate is low and moisture content is
low. Excessive metal particulate is a sign of major wear of valve internals (pilot, valve
actuator, proportional, or distributor) and should be addressed as soon as possible. As a best
practice, results from oil tests should show oil cleanliness meeting an ISO 4406 particle
count of 16/13, viscosity should be within +/-10% of manufacturer‘s recommended viscosity,
metals should be under 100 parts per million (ppm), acid number less than 0.3, and the
moisture content should be less than 0.1%. Oil should be tested as a minimum every 6
months.
Analog and digital governors (Figures 6, 7, and 8) have mechanical components so they
share many of the same maintenance requirements as a mechanical-hydraulic governor. A
condition assessment would include the same approach, as stated above, with the mechanical
inspection generally limited to the hydraulic governor head assembly, which consists of the
proportional valve and associated control components [10]. Electronic components should
be inspected for any signs of looseness in connections, overheating, and any contamination
of dirt or oil on the components. Overheating of the oil in the sump, from an extended unit
operation or excessive internal leakage in the system, can cause the release of oil vapors into
the governor cabinet which will condense on the cooler surfaces. Also, oil leakage will
increase with oil temperature. This oil vapor condensation can cause major problems with
electronic components if they happen to be located within the cabinet.
Any condition assessment should also include an inventory of spare parts. All necessary
mechanical and electronic parts required to keep the governor operational should be available
in plant inventory, or on short notice depending on the criticality of the unit to the system.
The measured performance of a governor is a major indicator for the condition assessment.
Performance measures should include off-line and on-line response, sensitivity to hunting,
accuracy of frequency, synchronization time, and the ability to start remotely. ASME
Performance Test Code, PTC 29 [14] provides the rules and procedures for executing
governor performance tests.
3.2 Operations
Mechanical-hydraulic governor for a hydraulic turbine is a simple and reliable device for
controlling speed and power output. Stabilization of the unit is provided by a compensating
dashpot while the same function is provided electronically or digitally in an analog or digital
governor. Governor dead time is defined as the elapsed time from the initial speed change to
the first movement of the wicket gates for a rapid change of more than 10 percent of load.
The dead time for a mechanical-hydraulic governor is 0.25 seconds whereas the dead time
for an analog or digital governor is less than 0.2 seconds which enables to governor to
provide accurate stable speed control [2]. Through the operation of a governor a unit is
started up, synchronized to the grid, loaded, and then shut down. Also, its function is
coordinated with the operation of various other types of auxiliary equipment in the unit such
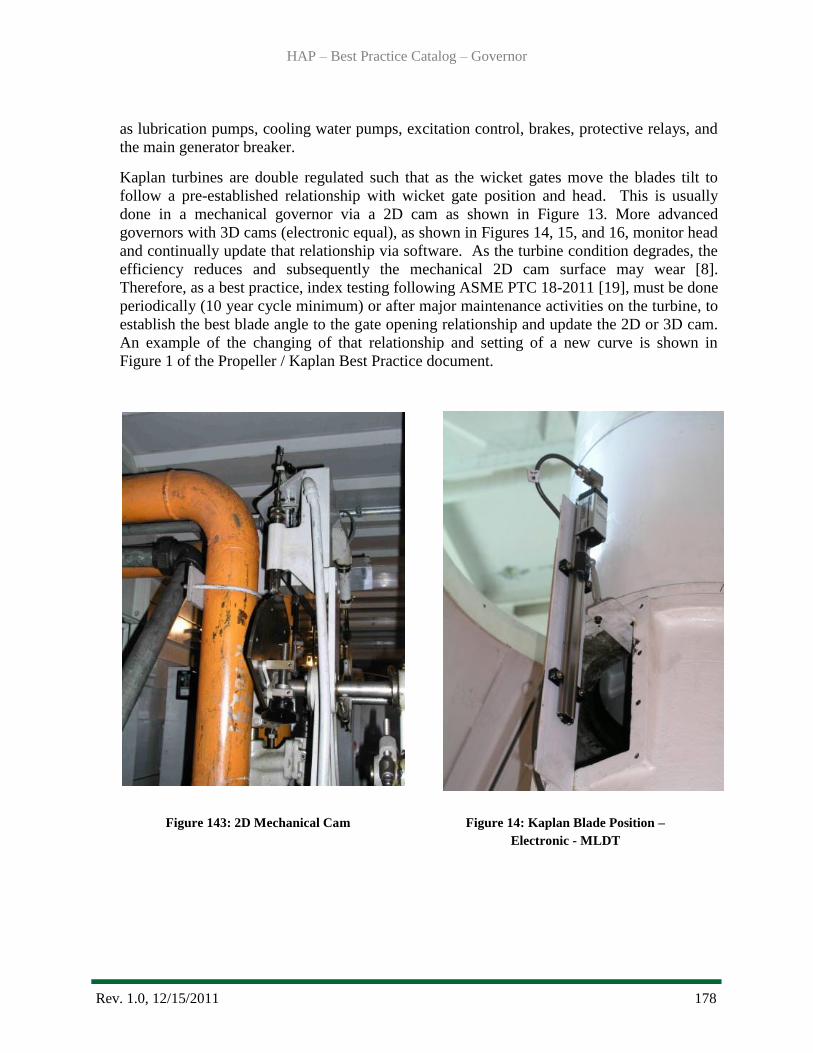
HAP – Best Practice Catalog – Governor
Rev. 1.0, 12/15/2011 178
as lubrication pumps, cooling water pumps, excitation control, brakes, protective relays, and
the main generator breaker.
Kaplan turbines are double regulated such that as the wicket gates move the blades tilt to
follow a pre-established relationship with wicket gate position and head. This is usually
done in a mechanical governor via a 2D cam as shown in Figure 13. More advanced
governors with 3D cams (electronic equal), as shown in Figures 14, 15, and 16, monitor head
and continually update that relationship via software. As the turbine condition degrades, the
efficiency reduces and subsequently the mechanical 2D cam surface may wear [8].
Therefore, as a best practice, index testing following ASME PTC 18-2011 [19], must be done
periodically (10 year cycle minimum) or after major maintenance activities on the turbine, to
establish the best blade angle to the gate opening relationship and update the 2D or 3D cam.
An example of the changing of that relationship and setting of a new curve is shown in
Figure 1 of the Propeller / Kaplan Best Practice document.
Figure 143: 2D Mechanical Cam Figure 14: Kaplan Blade Position –
Electronic - MLDT
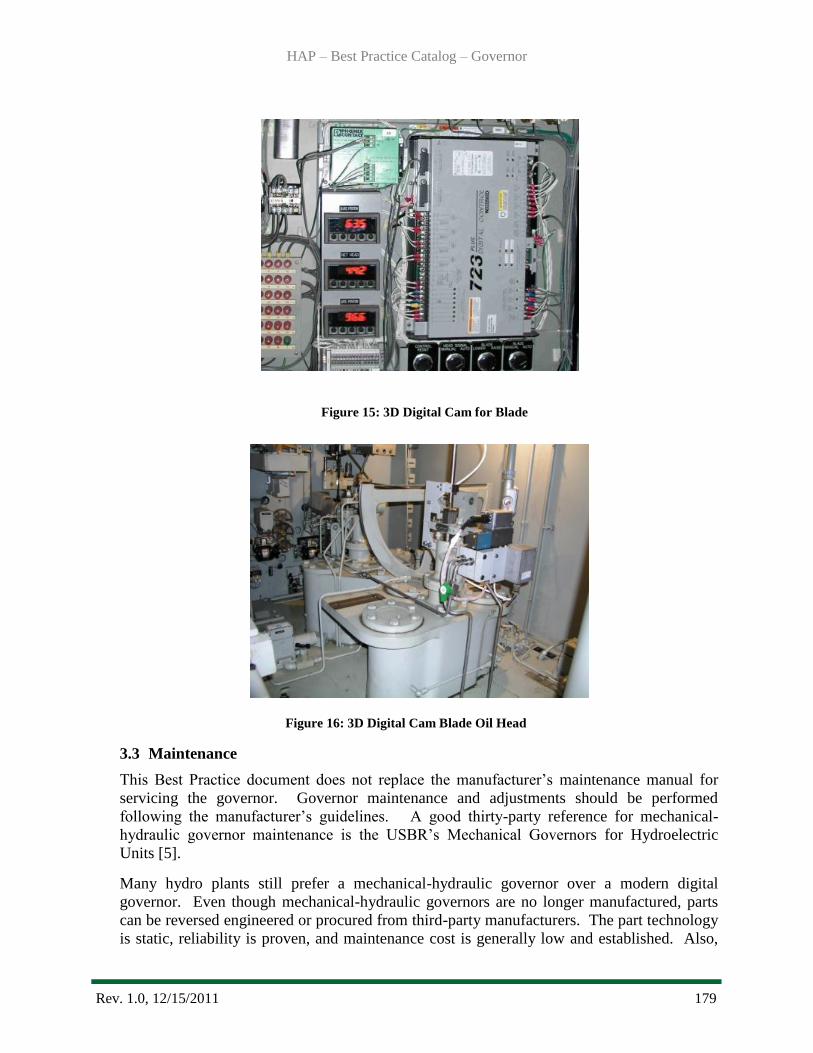
HAP – Best Practice Catalog – Governor
Rev. 1.0, 12/15/2011 179
3.3 Maintenance
This Best Practice document does not replace the manufacturer‘s maintenance manual for
servicing the governor. Governor maintenance and adjustments should be performed
following the manufacturer‘s guidelines. A good thirty-party reference for mechanical-
hydraulic governor maintenance is the USBR‘s Mechanical Governors for Hydroelectric
Units [5].
Many hydro plants still prefer a mechanical-hydraulic governor over a modern digital
governor. Even though mechanical-hydraulic governors are no longer manufactured, parts
can be reversed engineered or procured from third-party manufacturers. The part technology
is static, reliability is proven, and maintenance cost is generally low and established. Also,
Figure 16: 3D Digital Cam Blade Oil Head
Figure 15: 3D Digital Cam for Blade
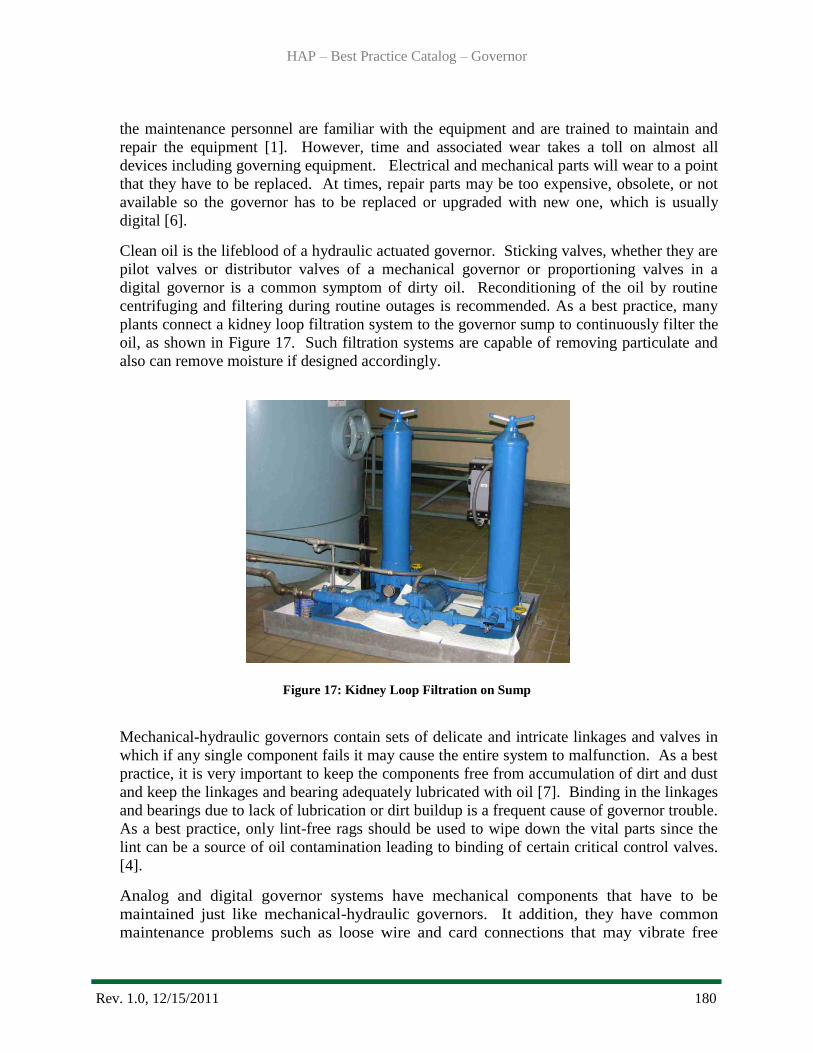
HAP – Best Practice Catalog – Governor
Rev. 1.0, 12/15/2011 180
the maintenance personnel are familiar with the equipment and are trained to maintain and
repair the equipment [1]. However, time and associated wear takes a toll on almost all
devices including governing equipment. Electrical and mechanical parts will wear to a point
that they have to be replaced. At times, repair parts may be too expensive, obsolete, or not
available so the governor has to be replaced or upgraded with new one, which is usually
digital [6].
Clean oil is the lifeblood of a hydraulic actuated governor. Sticking valves, whether they are
pilot valves or distributor valves of a mechanical governor or proportioning valves in a
digital governor is a common symptom of dirty oil. Reconditioning of the oil by routine
centrifuging and filtering during routine outages is recommended. As a best practice, many
plants connect a kidney loop filtration system to the governor sump to continuously filter the
oil, as shown in Figure 17. Such filtration systems are capable of removing particulate and
also can remove moisture if designed accordingly.
Figure 17: Kidney Loop Filtration on Sump
Mechanical-hydraulic governors contain sets of delicate and intricate linkages and valves in
which if any single component fails it may cause the entire system to malfunction. As a best
practice, it is very important to keep the components free from accumulation of dirt and dust
and keep the linkages and bearing adequately lubricated with oil [7]. Binding in the linkages
and bearings due to lack of lubrication or dirt buildup is a frequent cause of governor trouble.
As a best practice, only lint-free rags should be used to wipe down the vital parts since the
lint can be a source of oil contamination leading to binding of certain critical control valves.
[4].
Analog and digital governor systems have mechanical components that have to be
maintained just like mechanical-hydraulic governors. It addition, they have common
maintenance problems such as loose wire and card connections that may vibrate free
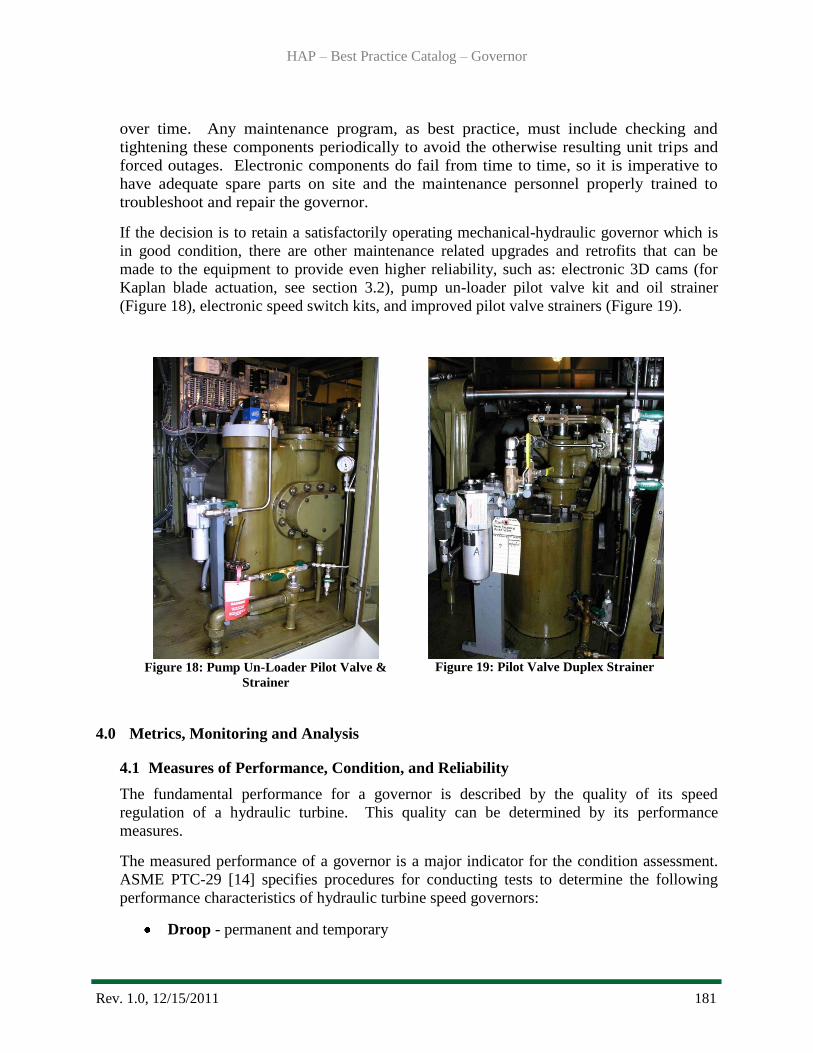
HAP – Best Practice Catalog – Governor
Rev. 1.0, 12/15/2011 181
over time. Any maintenance program, as best practice, must include checking and
tightening these components periodically to avoid the otherwise resulting unit trips and
forced outages. Electronic components do fail from time to time, so it is imperative to
have adequate spare parts on site and the maintenance personnel properly trained to
troubleshoot and repair the governor.
If the decision is to retain a satisfactorily operating mechanical-hydraulic governor which is
in good condition, there are other maintenance related upgrades and retrofits that can be
made to the equipment to provide even higher reliability, such as: electronic 3D cams (for
Kaplan blade actuation, see section 3.2), pump un-loader pilot valve kit and oil strainer
(Figure 18), electronic speed switch kits, and improved pilot valve strainers (Figure 19).
Figure 18: Pump Un-Loader Pilot Valve &
Strainer
Figure 19: Pilot Valve Duplex Strainer
4.0 Metrics, Monitoring and Analysis
4.1 Measures of Performance, Condition, and Reliability
The fundamental performance for a governor is described by the quality of its speed
regulation of a hydraulic turbine. This quality can be determined by its performance
measures.
The measured performance of a governor is a major indicator for the condition assessment.
ASME PTC-29 [14] specifies procedures for conducting tests to determine the following
performance characteristics of hydraulic turbine speed governors:
Droop - permanent and temporary
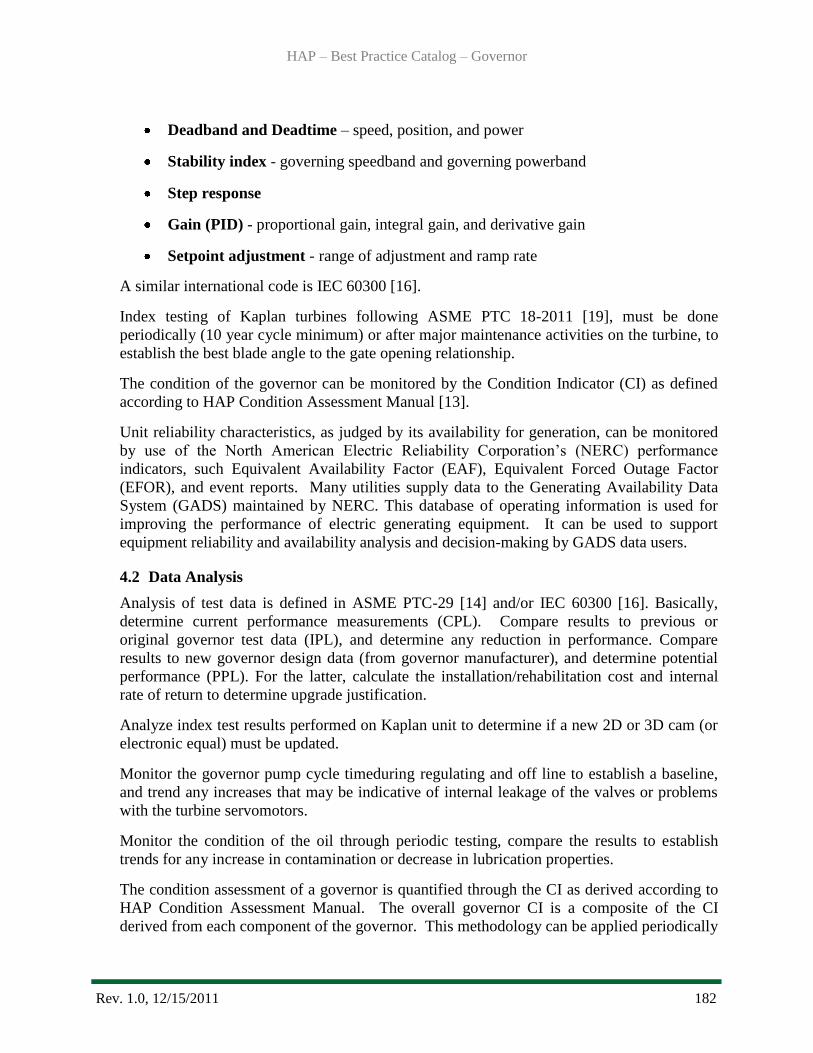
HAP – Best Practice Catalog – Governor
Rev. 1.0, 12/15/2011 182
Deadband and Deadtime – speed, position, and power
Stability index - governing speedband and governing powerband
Step response
Gain (PID) - proportional gain, integral gain, and derivative gain
Setpoint adjustment - range of adjustment and ramp rate
A similar international code is IEC 60300 [16].
Index testing of Kaplan turbines following ASME PTC 18-2011 [19], must be done
periodically (10 year cycle minimum) or after major maintenance activities on the turbine, to
establish the best blade angle to the gate opening relationship.
The condition of the governor can be monitored by the Condition Indicator (CI) as defined
according to HAP Condition Assessment Manual [13].
Unit reliability characteristics, as judged by its availability for generation, can be monitored
by use of the North American Electric Reliability Corporation‘s (NERC) performance
indicators, such Equivalent Availability Factor (EAF), Equivalent Forced Outage Factor
(EFOR), and event reports. Many utilities supply data to the Generating Availability Data
System (GADS) maintained by NERC. This database of operating information is used for
improving the performance of electric generating equipment. It can be used to support
equipment reliability and availability analysis and decision-making by GADS data users.
4.2 Data Analysis
Analysis of test data is defined in ASME PTC-29 [14] and/or IEC 60300 [16]. Basically,
determine current performance measurements (CPL). Compare results to previous or
original governor test data (IPL), and determine any reduction in performance. Compare
results to new governor design data (from governor manufacturer), and determine potential
performance (PPL). For the latter, calculate the installation/rehabilitation cost and internal
rate of return to determine upgrade justification.
Analyze index test results performed on Kaplan unit to determine if a new 2D or 3D cam (or
electronic equal) must be updated.
Monitor the governor pump cycle timeduring regulating and off line to establish a baseline,
and trend any increases that may be indicative of internal leakage of the valves or problems
with the turbine servomotors.
Monitor the condition of the oil through periodic testing, compare the results to establish
trends for any increase in contamination or decrease in lubrication properties.
The condition assessment of a governor is quantified through the CI as derived according to
HAP Condition Assessment Manual. The overall governor CI is a composite of the CI
derived from each component of the governor. This methodology can be applied periodically
HAP – Best Practice Catalog – Governor
Rev. 1.0, 12/15/2011 183
to derive a CI snapshot of the current governor condition such that it can be monitored over
time and studied to determine condition trends that can impact performance and reliability.
The reliability of a unit as judged by its availability to generate can be monitored through
reliability indexes or performance indicators as derived according to NERC‘s Appendix F,
Performance Indexes and Equations [18]. Event reports can be analyzed for outages or
deratings by equipment cause codes to ascertain the impact of governor related events
(governor cause codes 7050 and 7053).
4.3 Integrated Improvements
Periodic index test results should be used to update the Kaplan 2D or 3D cams to maximize
efficiency of the turbine.
Projects such as digital governor conversions, retrofits, mechanical upgrades that are justified
by a poor CI or poor reliability indices should be implemented.
As the condition of the governor changes, the CI and reliability indices are trended and
analyzed. Using this data, projects can be ranked and justified in the maintenance and capital
programs to bring the governor back to an acceptable condition and performance level.
5.0 Information Sources
Baseline Knowledge:
ASME, The Guide to Hydropower Mechanical Design, HCI Publications Inc., 1996
Elliott, Thomas C., Standard Handbook of Powerplant Engineering, McGraw Hill
Publishing, 1989
Woodward Governor Company, The Woodward Way, 1977
Creager, William P., Hydroelectric Handbook, John Wiley & Sons, 1950
USBR, FIST Volume 2-3, Mechanical Governors for Hydroelectric Units, September 1990
Woodward Governor Company, Top Performance Through Conversion, Bulletin 09026
Woodward Governor Company, Equipment Maintenance Practices, Bulletin PMCC-24
EPRI, Increased Efficiency of Hydroelectric Power, EM 2407, June 1992
Goncharov, A., Hydropower Stations – Generating Equipment, Moskva, 1972
State of the Art
US Corps of Engineers, Hydro Plant Risk Assessment Guide, September 2006
Clarke-Johnson, R., & Ginesin, S., Overhaul or Upgrade: Governor Decision Factors,
HydroVision 2007
Fox, A., Governor Oil Pump Condition Assessment, HydroVision 2008
HAP Condition Assessment Manual 2011, prepared by ORNL, Mesa and HPPi

HAP – Best Practice Catalog – Governor
Rev. 1.0, 12/15/2011 184
Standards:
ASME PTC 29- 2005, Speed-Governing Systems for Hydraulic Turbine-Generator Units
IEEE 125, 2007, Recommended Practice for Preparation of Equipment Specifications for
Speed-Governing of Hydraulic Turbines Intended to Drive Electric Generators
IEC 60308, 2005, International Code for Testing of Speed Governing Systems for Hydraulic
Turbines
IEC 61362, 2000, Guide for Specification of Hydraulic Turbine Control Systems
NERC, Appendix F, Performance Indexes and Equations, January, 2011
ASME PTC 18-2011, Hydraulic Turbines and Pump-Turbines,

Best Practice Catalog
Shut-Off Valves
Revision 1.0, 1/20/2012
HAP – Best Practice Catalog – Shut-Off Valves
Rev. 1.0, 1/20/2012 186
1.0 Scope and Purpose ........................................................................................................... 187
1.1 Hydropower Taxonomy Position ................................................................................. 188
1.1.1 Butterfly Valve Components ................................................................................ 188
1.1.2 Spherical Valve Components ................................................................................ 189
1.1.3 Cone Valve Components ...................................................................................... 190
1.1.4 Knife Gate Valve Components ............................................................................. 190
1.2 Summary of Best Practices .......................................................................................... 191
1.2.1 Performance/Efficiency & Capability-Oriented Best Practices ....................... 191
1.2.2 Reliability/Operations & Maintenance-Oriented Best Practices ..................... 192
1.3 Best Practice Cross-references ..................................................................................... 192
2.0 Technology Design Summary .......................................................................................... 192
2.1 Material and Design Technology Evolution ................................................................ 192
2.2 State of the Art Technology ......................................................................................... 193
3.0 Operation and Maintenance Practices .............................................................................. 193
3.1 Condition Assessment .................................................................................................. 193
3.2 Operations .................................................................................................................... 194
3.3 Maintenance ................................................................................................................. 194
4.0 Metrics, Monitoring and Analysis ................................................................................... 194
4.1 Measures of Performance, Condition, and Reliability ................................................. 194
4.2 Data Analysis ............................................................................................................... 195
4.3 Integrated Improvements.............................................................................................. 195
5.0 Information Sources: ........................................................................................................ 195
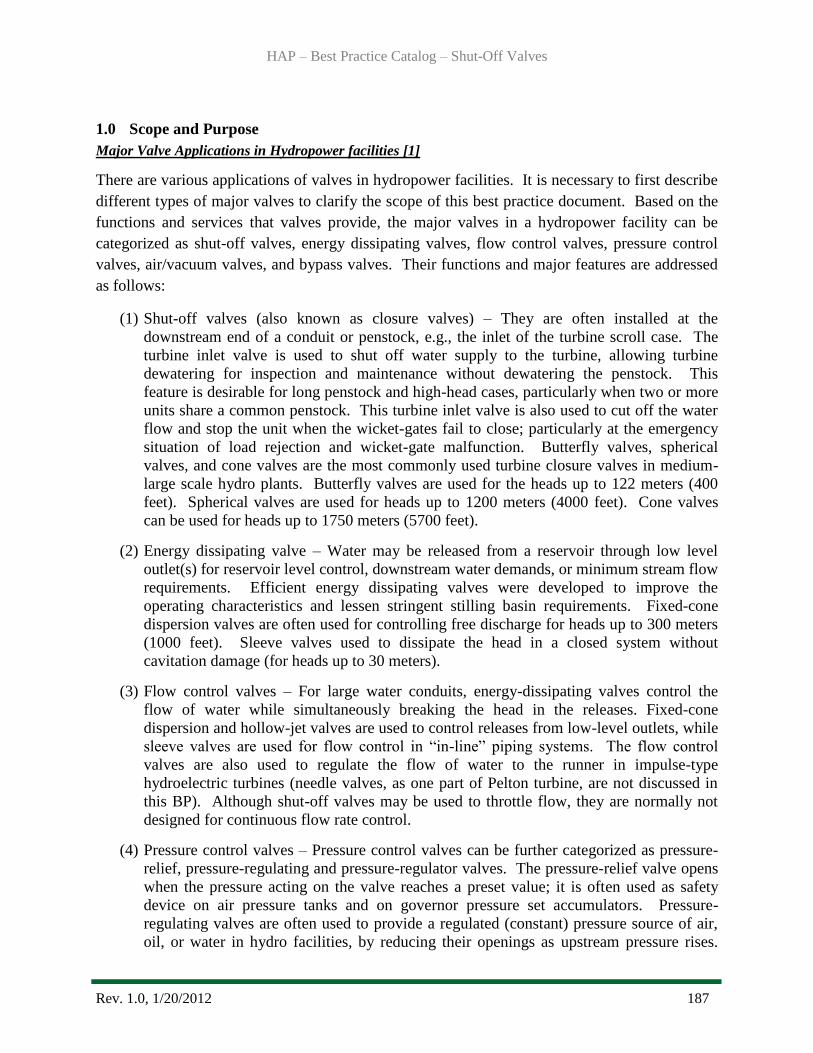
HAP – Best Practice Catalog – Shut-Off Valves
Rev. 1.0, 1/20/2012 187
1.0 Scope and Purpose
Major Valve Applications in Hydropower facilities [1]
There are various applications of valves in hydropower facilities. It is necessary to first describe
different types of major valves to clarify the scope of this best practice document. Based on the
functions and services that valves provide, the major valves in a hydropower facility can be
categorized as shut-off valves, energy dissipating valves, flow control valves, pressure control
valves, air/vacuum valves, and bypass valves. Their functions and major features are addressed
as follows:
(1) Shut-off valves (also known as closure valves) – They are often installed at the
downstream end of a conduit or penstock, e.g., the inlet of the turbine scroll case. The
turbine inlet valve is used to shut off water supply to the turbine, allowing turbine
dewatering for inspection and maintenance without dewatering the penstock. This
feature is desirable for long penstock and high-head cases, particularly when two or more
units share a common penstock. This turbine inlet valve is also used to cut off the water
flow and stop the unit when the wicket-gates fail to close; particularly at the emergency
situation of load rejection and wicket-gate malfunction. Butterfly valves, spherical
valves, and cone valves are the most commonly used turbine closure valves in medium-
large scale hydro plants. Butterfly valves are used for the heads up to 122 meters (400
feet). Spherical valves are used for heads up to 1200 meters (4000 feet). Cone valves
can be used for heads up to 1750 meters (5700 feet).
(2) Energy dissipating valve – Water may be released from a reservoir through low level
outlet(s) for reservoir level control, downstream water demands, or minimum stream flow
requirements. Efficient energy dissipating valves were developed to improve the
operating characteristics and lessen stringent stilling basin requirements. Fixed-cone
dispersion valves are often used for controlling free discharge for heads up to 300 meters
(1000 feet). Sleeve valves used to dissipate the head in a closed system without
cavitation damage (for heads up to 30 meters).
(3) Flow control valves – For large water conduits, energy-dissipating valves control the
flow of water while simultaneously breaking the head in the releases. Fixed-cone
dispersion and hollow-jet valves are used to control releases from low-level outlets, while
sleeve valves are used for flow control in ―in-line‖ piping systems. The flow control
valves are also used to regulate the flow of water to the runner in impulse-type
hydroelectric turbines (needle valves, as one part of Pelton turbine, are not discussed in
this BP). Although shut-off valves may be used to throttle flow, they are normally not
designed for continuous flow rate control.
(4) Pressure control valves – Pressure control valves can be further categorized as pressure-
relief, pressure-regulating and pressure-regulator valves. The pressure-relief valve opens
when the pressure acting on the valve reaches a preset value; it is often used as safety
device on air pressure tanks and on governor pressure set accumulators. Pressure-
regulating valves are often used to provide a regulated (constant) pressure source of air,
oil, or water in hydro facilities, by reducing their openings as upstream pressure rises.
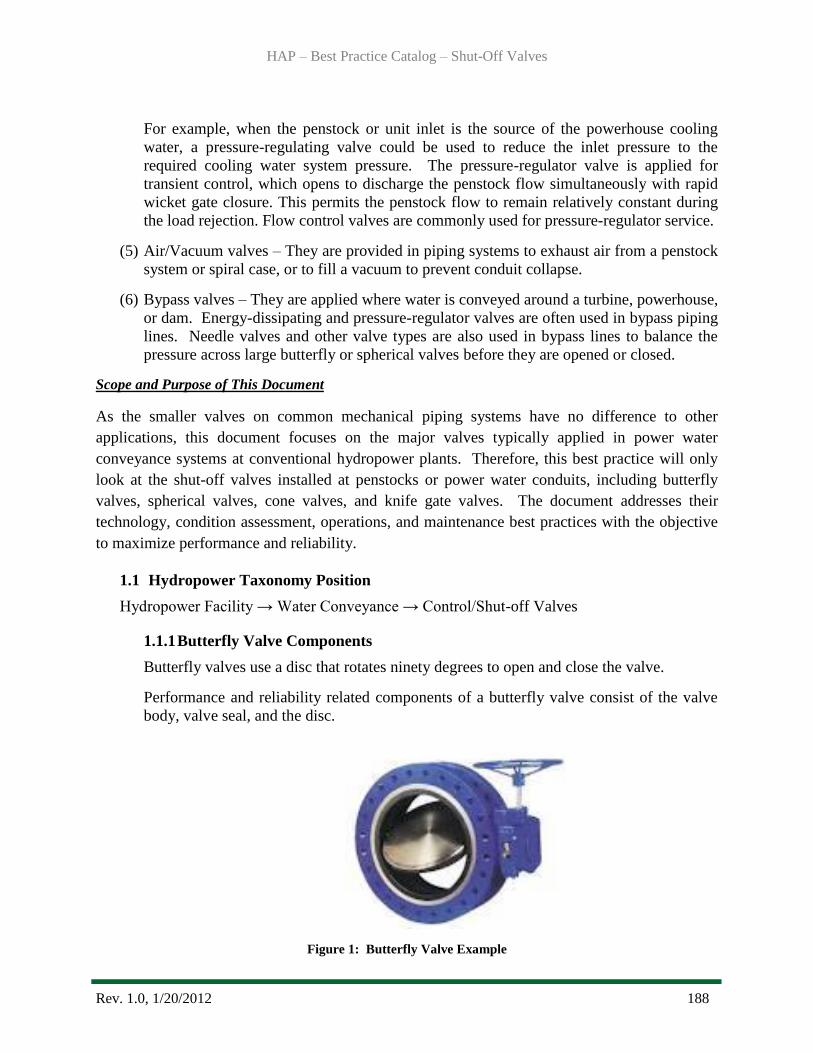
HAP – Best Practice Catalog – Shut-Off Valves
Rev. 1.0, 1/20/2012 188
For example, when the penstock or unit inlet is the source of the powerhouse cooling
water, a pressure-regulating valve could be used to reduce the inlet pressure to the
required cooling water system pressure. The pressure-regulator valve is applied for
transient control, which opens to discharge the penstock flow simultaneously with rapid
wicket gate closure. This permits the penstock flow to remain relatively constant during
the load rejection. Flow control valves are commonly used for pressure-regulator service.
(5) Air/Vacuum valves – They are provided in piping systems to exhaust air from a penstock
system or spiral case, or to fill a vacuum to prevent conduit collapse.
(6) Bypass valves – They are applied where water is conveyed around a turbine, powerhouse,
or dam. Energy-dissipating and pressure-regulator valves are often used in bypass piping
lines. Needle valves and other valve types are also used in bypass lines to balance the
pressure across large butterfly or spherical valves before they are opened or closed.
Scope and Purpose of This Document
As the smaller valves on common mechanical piping systems have no difference to other
applications, this document focuses on the major valves typically applied in power water
conveyance systems at conventional hydropower plants. Therefore, this best practice will only
look at the shut-off valves installed at penstocks or power water conduits, including butterfly
valves, spherical valves, cone valves, and knife gate valves. The document addresses their
technology, condition assessment, operations, and maintenance best practices with the objective
to maximize performance and reliability.
1.1 Hydropower Taxonomy Position
Hydropower Facility → Water Conveyance → Control/Shut-off Valves
1.1.1 Butterfly Valve Components
Butterfly valves use a disc that rotates ninety degrees to open and close the valve.
Performance and reliability related components of a butterfly valve consist of the valve
body, valve seal, and the disc.
Figure 1: Butterfly Valve Example
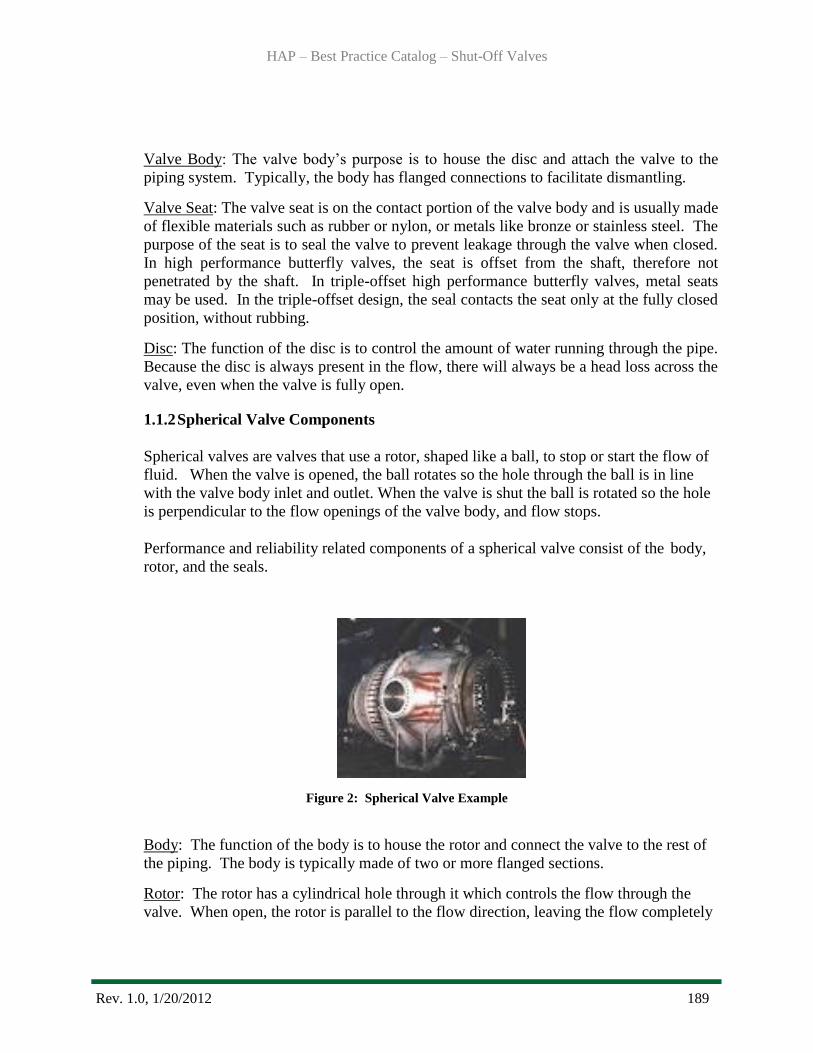
HAP – Best Practice Catalog – Shut-Off Valves
Rev. 1.0, 1/20/2012 189
Valve Body: The valve body‘s purpose is to house the disc and attach the valve to the
piping system. Typically, the body has flanged connections to facilitate dismantling.
Valve Seat: The valve seat is on the contact portion of the valve body and is usually made
of flexible materials such as rubber or nylon, or metals like bronze or stainless steel. The
purpose of the seat is to seal the valve to prevent leakage through the valve when closed.
In high performance butterfly valves, the seat is offset from the shaft, therefore not
penetrated by the shaft. In triple-offset high performance butterfly valves, metal seats
may be used. In the triple-offset design, the seal contacts the seat only at the fully closed
position, without rubbing.
Disc: The function of the disc is to control the amount of water running through the pipe.
Because the disc is always present in the flow, there will always be a head loss across the
valve, even when the valve is fully open.
1.1.2 Spherical Valve Components
Spherical valves are valves that use a rotor, shaped like a ball, to stop or start the flow of
fluid. When the valve is opened, the ball rotates so the hole through the ball is in line
with the valve body inlet and outlet. When the valve is shut the ball is rotated so the hole
is perpendicular to the flow openings of the valve body, and flow stops.
Performance and reliability related components of a spherical valve consist of the body,
rotor, and the seals.
Figure 2: Spherical Valve Example
Body: The function of the body is to house the rotor and connect the valve to the rest of
the piping. The body is typically made of two or more flanged sections.
Rotor: The rotor has a cylindrical hole through it which controls the flow through the
valve. When open, the rotor is parallel to the flow direction, leaving the flow completely
HAP – Best Practice Catalog – Shut-Off Valves
Rev. 1.0, 1/20/2012 190
unrestricted. To cut off the flow through the valve, the rotor is turned 90° perpendicular
to the flow.
Seals: The seals reduce leakage through the valve. Spherical valves are recommended to
have both upstream and downstream seals, where the downstream seal is the service seal.
The upstream seal is used for maintenance, such as replacing the service seal. Typically,
the seals are actuated with penstock water pressure.
1.1.3 Cone Valve Components
Cone valves are similar to spherical valves in that they have a plug which contains a full-
bore passage when open. The plug is cone shaped and is lifted from the seats and turned
ninety degrees to actuate. Metal-to-metal seats are standard.
Figure 3: Cone Valve Example
Performance and reliability related components of a cone valve consist of the body, plug,
and the seals.
Body: The function of the body is to house the plug and connect the valve to the rest of
the piping. The body is typically cast of iron or steel. The body contains two seat rings.
Plug: The plug is cast in the shape of a frustrum of a cone and has a full bore passage
with seats which mate to the body in either the open or closed position.
Operator: (not shown in Figure 3) The operator may be manual, electric powered,
hydraulic powered, or pneumatic powered.
1.1.4 Knife Gate Valve Components
Knife gate valves use a plate which moves linearly into and out of the flow path to close
and open the valve.
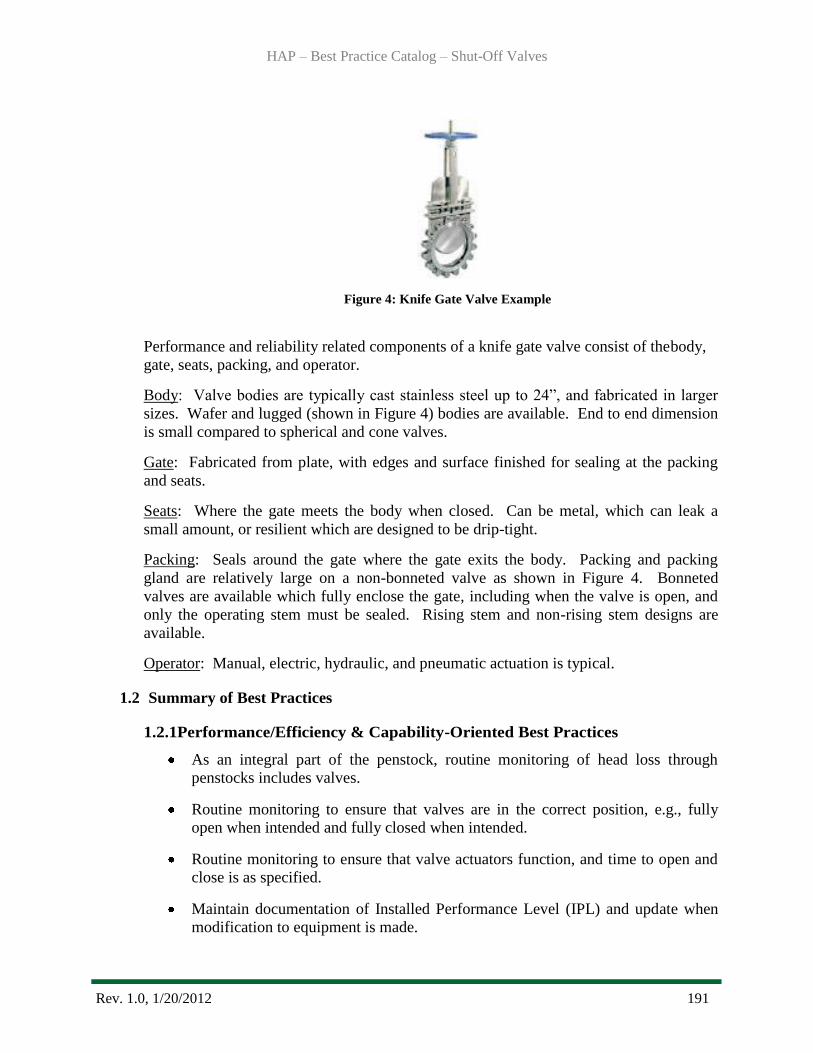
HAP – Best Practice Catalog – Shut-Off Valves
Rev. 1.0, 1/20/2012 191
Figure 4: Knife Gate Valve Example
Performance and reliability related components of a knife gate valve consist of the body,
gate, seats, packing, and operator.
Body: Valve bodies are typically cast stainless steel up to 24‖, and fabricated in larger
sizes. Wafer and lugged (shown in Figure 4) bodies are available. End to end dimension
is small compared to spherical and cone valves.
Gate: Fabricated from plate, with edges and surface finished for sealing at the packing
and seats.
Seats: Where the gate meets the body when closed. Can be metal, which can leak a
small amount, or resilient which are designed to be drip-tight.
Packing: Seals around the gate where the gate exits the body. Packing and packing
gland are relatively large on a non-bonneted valve as shown in Figure 4. Bonneted
valves are available which fully enclose the gate, including when the valve is open, and
only the operating stem must be sealed. Rising stem and non-rising stem designs are
available.
Operator: Manual, electric, hydraulic, and pneumatic actuation is typical.
1.2 Summary of Best Practices
1.2.1Performance/Efficiency & Capability-Oriented Best Practices
As an integral part of the penstock, routine monitoring of head loss through
penstocks includes valves.
Routine monitoring to ensure that valves are in the correct position, e.g., fully
open when intended and fully closed when intended.
Routine monitoring to ensure that valve actuators function, and time to open and
close is as specified.
Maintain documentation of Installed Performance Level (IPL) and update when
modification to equipment is made.

HAP – Best Practice Catalog – Shut-Off Valves
Rev. 1.0, 1/20/2012 192
Include industry acknowledged ―up to date‖ choices for valve components‘
materials and maintenance practices.
1.2.2Reliability/Operations & Maintenance-Oriented Best Practices
Develop a routine inspection and maintenance plan.
Regularly inspect joints for leakage.
Valves should be used within the specified pressure-temperature range. Spherical
valves are capable of entrapping fluid in the internal cavity, which if heated can
cause a rise in pressure. It must be ensured that in this condition, the pressure in
the valve does not exceed the rated pressure for the attained temperature.
1.3 Best Practice Cross-references
I&C - Automation Best Practice
Civil – Penstock/Tunnel/Surge Tank best Practice
Mechanical - Lubrication Best Practice
Mechanical - Generator Best Practice
Mechanical – Governor Best Practice
Mechanical – Raw Water System Best Practice
2.0 Technology Design Summary
2.1 Material and Design Technology Evolution
Butterfly valves are from a family of valves called quarter-turn valves and it derives its name
from the way that a ―butterfly-shape image‖ appears to form as it turns. The "butterfly" is a
metal disc mounted on a shaft. When the valve is closed, the disc is turned so that it is tightly
pressed against the seats, sealing off the passageway. When the valve is fully open, the disc
is rotated a quarter turn so that it allows an almost unrestricted passage of the process fluid.
The valve may also be opened incrementally to regulate flow. Unlike a ball valve, the disc is
always present within the flow; therefore a pressure drop is always induced in the flow
regardless of valve position [3].
Resilient seated butterfly valves were developed first. High performance butterfly valves, in
which the shaft and seat are offset, were the next. Triple-offset high performance butterfly
valves are the most advanced design. Triple-offset butterfly valves are utilized for high
pressure and temperature conditions, and can have resilient or metal seats.

HAP – Best Practice Catalog – Shut-Off Valves
Rev. 1.0, 1/20/2012 193
Spherical valves are specialty items, typically designed for the individual application. They
are made for high pressure, high velocity, and large diameter applications found in
hydroelectric facilities.
Spherical valves, on the other hand, have not been around nearly so long. A spherical ball-
type, all-brass valve patented in 1871 led to the invention of the modern ball valve.
Unfortunately, the valve was not successful and was not even mentioned in valve catalogs of
the late 1800s. Nearly 75 years later, the first resilient seated ball valve patent was issued in
April 1945. However, ball valves were not commercially available until the late 60s [6].
2.2 State of the Art Technology
In order to enhance the performance of valves, computer aided design (CAD) software is
now used throughout the design process. Companies utilize top-of-the-line solid modeling
software and finite element analysis programs to calculate stress and deflection of the valve
components. With this information, developers can include proper relief and stress factors to
assure a long valve life.
Another advantage to CAD software is that it can then be loaded onto a computer numerical
controlled (CNC) machine. These machines can fabricate valves with tremendous precision
and consistency.
3.0 Operation and Maintenance Practices
3.1 Condition Assessment
After the commercial operation begins, how the valves are operated and maintained will have
a huge impact on maintaining reliability. Condition assessment of the valves must address
any past damage, location of damage, and repeat damage.
Typical valve distresses include the following:
Shaft assembly wear, indicated by displacement between the shaft and bushing
Seal condition
Corrosion, usually caused by environmental factors, is suggested by loss of steel
Cracking, found during dry inspection
Abnormal noise/jumping/vibration, discovered during valve operation [7]
For spherical valves, close attention should be given to the condition of the seals.
HAP – Best Practice Catalog – Shut-Off Valves
Rev. 1.0, 1/20/2012 194
3.2 Operations
Butterfly valves cause a head loss in the flow through the valve. Head loss increases as
design pressure or head increases because the disc and shaft size increase with pressure.
Although head can be significantly reduced across partially open butterfly valves, prolonged
throttling operation is not recommended as it can result in cavitation damage to the disc, seal,
or body [1].
On spherical valves, moveable seals reduce leakage when the valve is closed. Valve opening
and closing sequencing controls should preclude seal damage by valve rotation when seals
are extended. It is recommended that spherical valves have both upstream and downstream
seals. The upstream seal should be used as the maintenance/emergency seal and the
downstream seal should be used as the service/working seal.
Rapid valve closure can result in damaging pressure transients. Opening/closing times and
operating pressures should be recorded for future testing comparison.
During plant operations, it is important to routinely inspect the exterior surfaces of valves for
signs of leakage while the valves are under hydrostatic pressure. If any leaks are discovered,
the source should be promptly identified and repair performed.
3.3 Maintenance
In order to avoid valve failure during operation, all valves should be periodically inspected to
determine wear of the components and replace parts accordingly. The working conditions
and location of the valves should determine the frequency of the inspection and maintenance.
The valve manufacturer should have information on how to best maintain their valves.
For spherical valves equipped with both upstream and downstream seals, the upstream
maintenance seal allows replacement or maintenance of the working seal when the valve is
closed under full pressure. However, the upstream seal should have a positive mechanical
locking system on the seals to prevent accidental opening while working on the downstream
seal [1].
4.0 Metrics, Monitoring and Analysis
4.1 Measures of Performance, Condition, and Reliability
For shut-off valves, the measure of performance is a direct result of their functionality. The
purpose of the valves is to stop the flow of water and keep water away from the portions of
the system being isolated. Each valve and its associated actuator must be able to fully open
and close within the intended time.
Plant efficiency is not greatly affected by shut-off valves because the valves are normally a
small fraction of the total water delivery system. It is important that these valves function
HAP – Best Practice Catalog – Shut-Off Valves
Rev. 1.0, 1/20/2012 195
properly not necessarily for efficiency, but for safety. Equipment and workers performing
tasks in dewatered portions of the plant must be protected. Valve leakage can be tolerated as
long as safety and equipment protection are not compromised.
Leakage rates should be measured and recorded. Large valves, even those designed to be
drip tight when they are new, may leak after years of service.
4.2 Data Analysis
Leakage through shut-off valves can be tolerated as long as equipment protection and safety
are not compromised. Relatively small amounts of leakage can be tolerated and handled by
pumping water out of areas where maintenance will be performed. However, if pumping
becomes excessive, the cost of new seals or other corrective actions may be justified.
4.3 Integrated Improvements
The field test results for leakage and actuator stroke time should be included when updating
the plant‘s unit performance records. These records shall be made available to all involved
personnel and distributed accordingly for upcoming inspections.
5.0 Information Sources:
Baseline Knowledge:
ASME, The Guide to Hydropower Mechanical Design, HCI Publications Inc., 1996
State of the Art:
―Valve Types.‖
Integrated Publishing, n.d. Web. 20 Dec. 2011.
http://www.tpub.com/fireman/69.htm
―Butterfly Valve.‖
Grundfos.com. n.d. Web. 20 Dec. 2011.
<http://www.cbs.grundfos.com/CBS_Master/lexica/AC_Butterfly_valve.html>
Konigsmark, Hugh. ―A Review of Butterfly Valve Components and Operation.‖
ChemicalProcessing.com. n.d. Web. 20 Dec. 2011.
<http://www.chemicalprocessing.com/articles/1998/300.html>
Sundaram, Kannan. ―Why a Butterfly Valve.‖
Piping and Valve Engineering. 4 June 2008. Web. 20 Dec. 2011.
<http://piping-valves.blogspot.com/2008/06/why-butterfly-valve.html>

HAP – Best Practice Catalog – Shut-Off Valves
Rev. 1.0, 1/20/2012 196
Mayer, Johnny. ―Ball Valve History and Mystery.‖
EzineArticles.com. 5 Jan. 2006. Web. 20 Dec. 2011.
<http://ezinearticles.com/?Ball-Valve-History-and-Mystery&id=123681>.
―REMR Management System for Tainter and Butterfly Valves.‖
REMR Technical Note OM-MS-1.11. 1998. Web. 20 Dec. 2011.
http://www.wes.army.mil/REMR/pdf/om/ms-1-11.pdf
Standards:
ASME B31.1. 2010. ―Power Piping.‖
ASME International. New York, NY. 2010
ASME B16.34. 2009. ―Valves—Flanged, Threaded, and Welding End.‖
ASME International. New York, NY. 2009

Best Practice Catalog
Raw Water System
Revision 1.0, 1/19/2012
HAP – Best Practice Catalog – Raw Water System
Rev. 1.0, 1/19/2012 198
1.0 Scope and Purpose ........................................................................................................... 199
1.1 Hydropower Taxonomy Position ................................................................................. 199
1.1.1 Raw Water System Components .......................................................................... 199
1.2 Summary of Best Practices ........................................................................................ 202
1.2.1 Performance/Efficiency & Capability - Oriented Best Practices ..................... 202
1.2.2 Reliability/Operations & Maintenance - Oriented Best Practices ................... 202
1.3 Best Practice Cross-references ..................................................................................... 203
2.0 Technology Design Summary .......................................................................................... 204
2.1 Material and Design Technology Evolution ................................................................ 204
2.2 State of the Art Technology ......................................................................................... 204
3.0 Operation & Maintenance Practices ................................................................................ 207
3.1 Condition Assessment .................................................................................................. 207
3.2 Operations .................................................................................................................... 208
3.3 Maintenance ................................................................................................................. 211
4.0 Metrics, Monitoring and Analysis ................................................................................... 213
4.1 Measures of Performance, Condition, and Reliability ................................................. 213
4.2 Analysis of Data ........................................................................................................... 213
4.3 Integrated Improvements.............................................................................................. 213
5.0 Information Sources: ........................................................................................................ 214
HAP – Best Practice Catalog – Raw Water System
Rev. 1.0, 1/19/2012 199
1.0 Scope and Purpose
This best practice addresses the technology, condition assessment, operations, and maintenance
best practices for raw water systems, focusing on cooling raw water, with the objective to
maximize performance and reliability. The raw water cooling system is a once–through (open
loop) system, in which water flows are discharged back to the tailwater. The primary purpose of
the raw water system is to supply water sources to any or all of the following cooling and other
water systems:
Turbine and generator bearing coolers
Turbine shaft seal
Generator air coolers
Generator fire deluge
Transformer and/or exciter coolers
Heating, ventilation and air conditioning
Service Water
Source for potable water treatment equipment
Fire protection [1]
1.1 Hydropower Taxonomy Position
Hydropower Facility → Powerhouse → Power Train Equipment → Balance of
Plant/Auxiliary Components → Raw Water System
1.1.1 Raw Water System Components
The raw water system is critical to unit operation in its global plant cooling function. The
reliability related components of raw water systems include the supply intake, strainers,
pumps, valves, generator air coolers, piping and instrumentation/monitoring. The raw
water system is fed either from the units‘ forebay, penstock, or scroll case or pumped
from the tailrace/tailwater. Tailrace/tailwater is normally the source for lower head
plants. Forebays, penstocks or scroll cases is normally the source for higher head plants.
The water source is therefore defined as either gravity or pumped type cooling system. In
all plants, an intake for unit cooling, sealing and lubrication water is provided for each
unit with the supply lines between units manifolded or cross connected for flexibility.
Figure 1 is a typical schematic of the raw water system and it shows the comprehensive
nature as it services a wide variety of other hydropower systems.
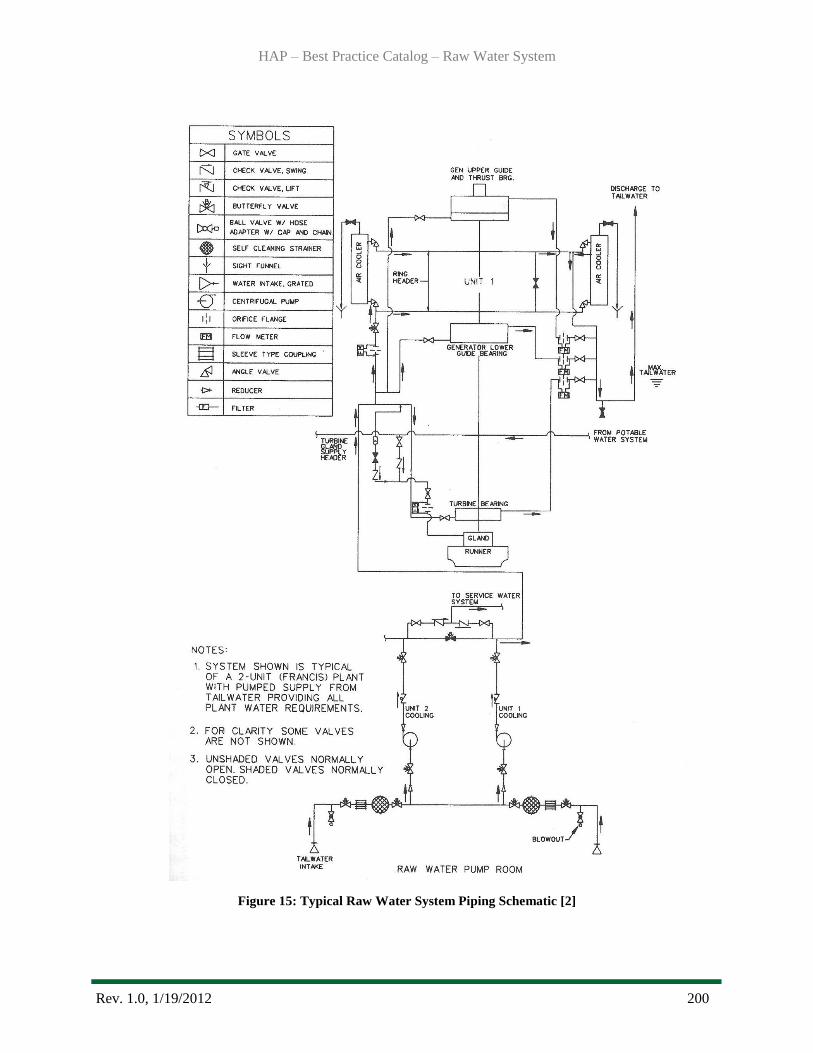
HAP – Best Practice Catalog – Raw Water System
Rev. 1.0, 1/19/2012 200
Figure 15: Typical Raw Water System Piping Schematic [2]
HAP – Best Practice Catalog – Raw Water System
Rev. 1.0, 1/19/2012 201
Supply Intake: The function of the supply intake is to feed the raw water system with
river, dam or untreated water. Unit cooling, lubricating and sealing water pressure is
usually supplied at a maximum pressure of 40 pounds per square inch (around 28 m of
water) to prevent damage to the generator air coolers and other equipment.
Strainers: The function of the strainer is to remove suspended solid material (wood,
rocks, sand, biological matter, etc) from the raw water to minimize fouling of the
generator air coolers and oil cooler heat exchangers. The strainer must be back flushed
when the differential pressure across the strainer reached a set point value to ensure the
raw water flow rate is not reduced due to blockage of the strainer.
Pumps: The function of the raw (cooling) water pumps, if so equipped, is to develop
sufficient flow and head to meet the requirements of the equipment it services. This
ensures the water in the piping, strainer, valves and air coolers will be supplied at
required flow and pressure. The design must allow for the operation of the raw water
component in a fouled condition. Higher head plants/units normally do not require
pumps.
Valves: The function of the valves within a raw water cooling system is to route,
regulate, or isolate as required, the flow of water. There are multiple types of valves and
designs based on their specific application. Chief among these are gate, butterfly, globe,
control, ball and check valves. In the high head plants pressure must be reduced by
pressure regulating valves for most raw water services. A relief valve on the low-pressure
side of each pressure regulating valve protects against piping or equipment damage which
might result from over pressurization resulting from faulty operation of the valve. A
proportioning valve is used to control the flow of cooling water to the generator air
coolers.
Generator air coolers: Generator air coolers, which are considered as part of the
Generator (see Best Practice Catalog - Generator), are heat exchangers located in the
generator air housings which employ raw water to cool circulating air which in turn cools
the generator. Cooling water is delivered to a header serving all air coolers. This header is
sized by the generator manufacturer to distribute approximately equal flow to each
cooler. From the air cooler water returns via another header to a discharge chamber
designed to keep the air coolers full of water at all times. The cooling water headers are
normally circular.
Piping: The function of the piping is to connect supply water from the forebay/
penstock/scroll case/tailwater to rest of the system at the design water flow rate and
pressure to achieve optimum cooling of system components.
HAP – Best Practice Catalog – Raw Water System
Rev. 1.0, 1/19/2012 202
Instrumentation/Monitoring: The function of the instrumentation is to measure, monitor
and regulate the process variables of the raw water, such as flow, temperature and
pressure. Pressure indicators, flow meters, temperature indicators, differential pressure
transmitters, and/or sightglasses are examples of key instruments.
1.2 Summary of Best Practices
1.2.1Performance/Efficiency & Capability - Oriented Best Practices
Please cross reference to the associated best practices that have been identified
for the generators, turbines and transformer that served by the raw water
system.
1.2.2Reliability/Operations & Maintenance - Oriented Best Practices
Follow the best practices in the Best Practice Catalog - Trash Racks and
Intakes for the raw water supply.
Use Remote Operated Vehicle for internal condition inspection on large size
pipe (> Ø4‖).
Install isolation valves at selected locations for raw water pipeline so key
equipment can be isolated and removed for internal inspection as necessary.
Develop, implement and maintain a raw water instrumentation calibration and
verification program for instrumentation such as generator air cooler
thermocouples, flow meters, and proportioning valve controllers and
differential pressure gages.
When replacing raw water piping, select materials of construction for generator
cooling water (such as carbon steel or stainless steel) and base decisions on
specific generating units requirement (such as water quality and plant
economics).
Observe the strainer unit; it will give the operator a good indication of the
quality of the raw water supply.
Operate centrifugal pumps within the Equipment Reliability Operating
Envelope (EROE) to achieve maximum Mean Time Between Failures
(MTBF).
Change impeller diameter, if required, to ensure that every raw water
centrifugal pump operates inside its EROE.
Keep EROE range between + 10% to –50% in flow from the pump best
efficiency point.
HAP – Best Practice Catalog – Raw Water System
Rev. 1.0, 1/19/2012 203
Keep raw water centrifugal pump curves in the control room. Operators should
be trained and instructed on their use for optimizing centrifugal pump safety
and MTBF.
Monitor the raw water pump flow range by inputting the pump shop test curve
and collecting transmitter signals (inlet pressure, discharge pressure and flow)
into spreadsheets to calculate the pump head and flow.
Adjust head of the raw water supply as required to facilitate the pumps
operation within the EROE.
Label raw water system piping with colored tape to help personnel to
understand system operation and how to take corrective action quickly to
prevent unit performance or availability issues.
Installation of raw water strainers with automatic backwash capabilities will
reduce labor intensity associated with maintaining acceptable strainer pressure
differentials especially at locations that are not continuously staffed.
Place a higher priority on removal of generator air cooler bio-fouling than the
bio-fouling of the raw water pipe unless it has reduced the flow to a level
below the design flow.
1.3 Best Practice Cross-references
I&C - Automation Best Practice
Mechanical – Francis Turbine Best Practice
Mechanical – Kaplan Turbine Best Practice
Mechanical – Pelton Turbine Best Practice
Mechanical – Generator Best Practice
Civil – Trash racks and Intakes Best Practice

HAP – Best Practice Catalog – Raw Water System
Rev. 1.0, 1/19/2012 204
2.0 Technology Design Summary
2.1 Material and Design Technology Evolution
Early designs for raw water systems consisted mainly of carbon steel and cast iron pipe
fittings, pumps, valves and other fixture components. Controls and instrumentation were
rudimental, analog and predominately manually operated. Piping embedded in concrete was
cast iron with bell and spigot joints requiring leaded joints at connection points with external
piping. Piping insulation (where used) contained asbestos fibers.
Valves used for isolation and routing were predominately manually operated gate or globe
type valves. An air operated thermostatically controlled proportioning valve was used to
regulate flow through the generator air coolers to control generator temperature. A single
strainer that was manually operated served the entire raw water system. For lower head
plants, centrifugal pumps were used to provide forced circulation to generator air and oil
coolers.
Generally few provisions were made for back-flushing air or oil coolers. Water for fighting
fires was provided by elevated storage tanks. Fire protection systems were manually
actuated.
2.2 State of the Art Technology
The basic design concepts for raw water systems at hydro plants have not changed
substantially. However, there are a number of component design improvements for raw
water systems that have become state of the art. Most of these changes have been driven by
technical improvements in materials of construction and the cost of materials such as
stainless steel and copper/copper alloys.
Materials of construction selection for raw water piping systems and components is based on
the specific characteristics of the system including water quality of the raw water supply
(suspended solids, tendencies to scale, potential bio-fouling, potential for corrosion, etc.) .
Exposed larger bore piping (> Ø4‖) can be flanged or butt welded carbon steel or stainless
steel. (Flanged piping allows disassembly of piping systems for internal build-up cleaning
out.) Small bore piping is non-corrosive material such as stainless steel. Embedded piping is
stainless steel or cement lined ductile iron (for larger bore piping) with flanged joints for
external piping connections.
Valves larger than Ø6‖ are normally gate valves. Isolation valves Ø2½‖ to Ø6‖ are normally
butterfly valves. Stainless steel ball valves are normally used for Ø2‖ and smaller valves.
Valves are manually operated or automated based on the process requirements, staffing
levels, and etc. Closed cell foam piping insulation systems for eliminating external piping
condensation have replaced asbestos containing systems. Raw cooling water pump design
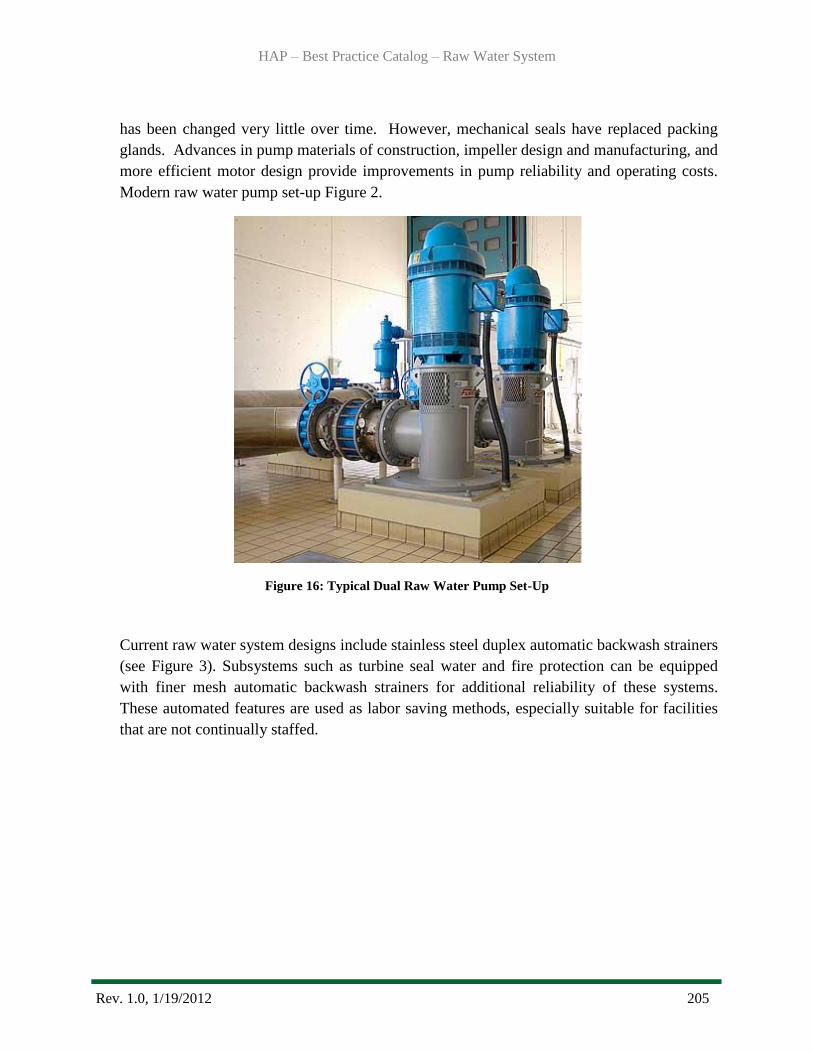
HAP – Best Practice Catalog – Raw Water System
Rev. 1.0, 1/19/2012 205
has been changed very little over time. However, mechanical seals have replaced packing
glands. Advances in pump materials of construction, impeller design and manufacturing, and
more efficient motor design provide improvements in pump reliability and operating costs.
Modern raw water pump set-up Figure 2.
Figure 16: Typical Dual Raw Water Pump Set-Up
Current raw water system designs include stainless steel duplex automatic backwash strainers
(see Figure 3). Subsystems such as turbine seal water and fire protection can be equipped
with finer mesh automatic backwash strainers for additional reliability of these systems.
These automated features are used as labor saving methods, especially suitable for facilities
that are not continually staffed.

HAP – Best Practice Catalog – Raw Water System
Rev. 1.0, 1/19/2012 206
Figure 17: Section View of Typical Automatic Backwash strainer [SERFILCO]
The automated backwash strainers include instrumentation and controls to initiate strainer
cleaning based on a time cycle or a pre-established strainer pressure differential.
Fire protection systems are equipped with diesel driven booster pumps which replace the
traditional elevated fire water storage tanks. Depending on the individual hydro plant
economics, booster pumps may be able to provide increased volume and pressure in fire
fighting situations than elevated water storage tanks. Fire protection systems are automated
with designs mandated by fire codes that were nonexistent in the early twenty century.
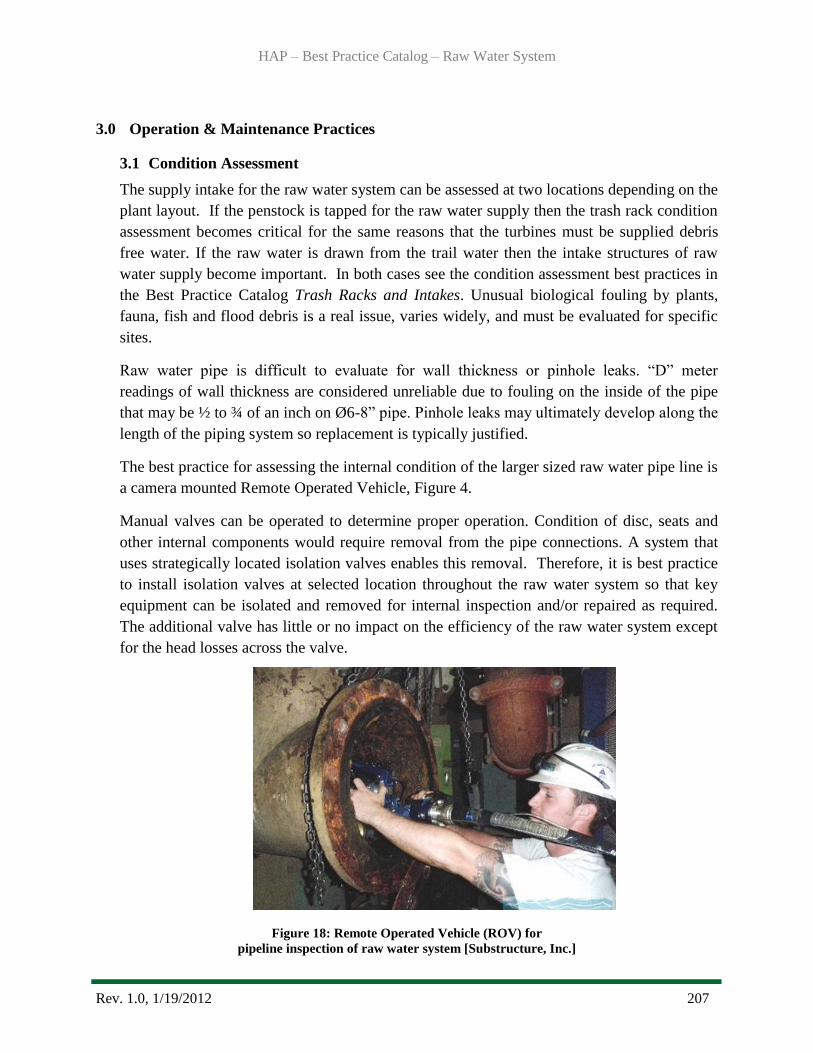
HAP – Best Practice Catalog – Raw Water System
Rev. 1.0, 1/19/2012 207
3.0 Operation & Maintenance Practices
3.1 Condition Assessment
The supply intake for the raw water system can be assessed at two locations depending on the
plant layout. If the penstock is tapped for the raw water supply then the trash rack condition
assessment becomes critical for the same reasons that the turbines must be supplied debris
free water. If the raw water is drawn from the trail water then the intake structures of raw
water supply become important. In both cases see the condition assessment best practices in
the Best Practice Catalog Trash Racks and Intakes. Unusual biological fouling by plants,
fauna, fish and flood debris is a real issue, varies widely, and must be evaluated for specific
sites.
Raw water pipe is difficult to evaluate for wall thickness or pinhole leaks. ―D‖ meter
readings of wall thickness are considered unreliable due to fouling on the inside of the pipe
that may be ½ to ¾ of an inch on Ø6-8‖ pipe. Pinhole leaks may ultimately develop along the
length of the piping system so replacement is typically justified.
The best practice for assessing the internal condition of the larger sized raw water pipe line is
a camera mounted Remote Operated Vehicle, Figure 4.
Manual valves can be operated to determine proper operation. Condition of disc, seats and
other internal components would require removal from the pipe connections. A system that
uses strategically located isolation valves enables this removal. Therefore, it is best practice
to install isolation valves at selected location throughout the raw water system so that key
equipment can be isolated and removed for internal inspection and/or repaired as required.
The additional valve has little or no impact on the efficiency of the raw water system except
for the head losses across the valve.
Figure 18: Remote Operated Vehicle (ROV) for
pipeline inspection of raw water system [Substructure, Inc.]
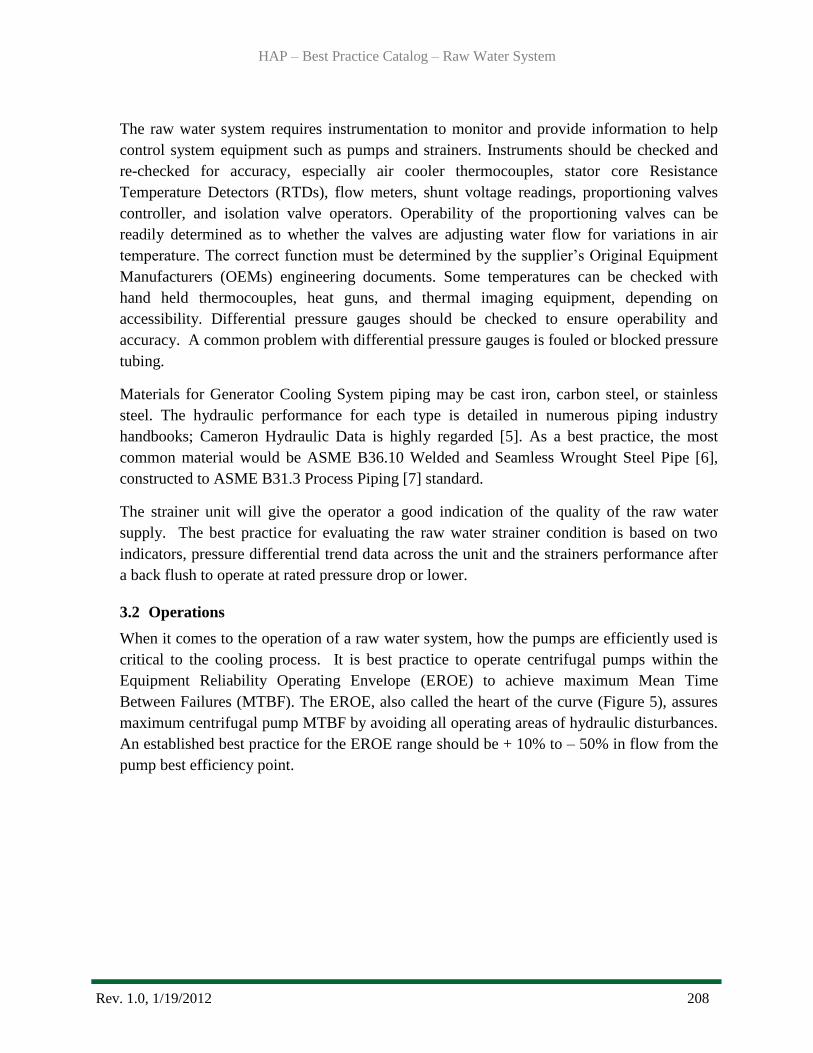
HAP – Best Practice Catalog – Raw Water System
Rev. 1.0, 1/19/2012 208
The raw water system requires instrumentation to monitor and provide information to help
control system equipment such as pumps and strainers. Instruments should be checked and
re-checked for accuracy, especially air cooler thermocouples, stator core Resistance
Temperature Detectors (RTDs), flow meters, shunt voltage readings, proportioning valves
controller, and isolation valve operators. Operability of the proportioning valves can be
readily determined as to whether the valves are adjusting water flow for variations in air
temperature. The correct function must be determined by the supplier‘s Original Equipment
Manufacturers (OEMs) engineering documents. Some temperatures can be checked with
hand held thermocouples, heat guns, and thermal imaging equipment, depending on
accessibility. Differential pressure gauges should be checked to ensure operability and
accuracy. A common problem with differential pressure gauges is fouled or blocked pressure
tubing.
Materials for Generator Cooling System piping may be cast iron, carbon steel, or stainless
steel. The hydraulic performance for each type is detailed in numerous piping industry
handbooks; Cameron Hydraulic Data is highly regarded [5]. As a best practice, the most
common material would be ASME B36.10 Welded and Seamless Wrought Steel Pipe [6],
constructed to ASME B31.3 Process Piping [7] standard.
The strainer unit will give the operator a good indication of the quality of the raw water
supply. The best practice for evaluating the raw water strainer condition is based on two
indicators, pressure differential trend data across the unit and the strainers performance after
a back flush to operate at rated pressure drop or lower.
3.2 Operations
When it comes to the operation of a raw water system, how the pumps are efficiently used is
critical to the cooling process. It is best practice to operate centrifugal pumps within the
Equipment Reliability Operating Envelope (EROE) to achieve maximum Mean Time
Between Failures (MTBF). The EROE, also called the heart of the curve (Figure 5), assures
maximum centrifugal pump MTBF by avoiding all operating areas of hydraulic disturbances.
An established best practice for the EROE range should be + 10% to – 50% in flow from the
pump best efficiency point.

HAP – Best Practice Catalog – Raw Water System
Rev. 1.0, 1/19/2012 209
Figure 19: Centrifugal Raw Water Pump - component damage as function of operating point
Many new raw water pumps are selected with impeller diameters that are incorrectly sized
for field operation parameters. The hydraulic calculations used to determine the pump head
required for centrifugal pumps will only approximate the field conditions, and can be
conservative, which will result in different field head required than noted on the pump data
sheet. This can result in driver overload/underload and possible cavitation. Failure to
establish EROE limits will lead to low MTBF of centrifugal pumps. Approximately 80% of
centrifugal pump reliability reductions (causes of low MTBF) are due to process changes,
which cause the pump to operate in either a high flow or low flow range. This exposes the
pump to hydraulic disturbances resulting in low MTBF. Establishing operator EROE targets
for all critical site pumps and all ―bad actor‖ pumps (pumps with one or more components
failures per year) will ensure optimum centrifugal pump safety and MTBFs.
It is best practice to ensure that every raw water centrifugal pump operates inside the EROE
and change impeller diameter if required. Lower pump head required can force centrifugal
pumps to operate at greater flow than the design point. Most centrifugal pump drivers are
sized for +10% power and can be overloaded if the pump flow is greater than the design
flow. The most cost effective solution to prevent driver overload is to reduce (cut or trim) the
pump impeller diameter, to arrive at the desired pump flow under the required conditions of
actual field process head.
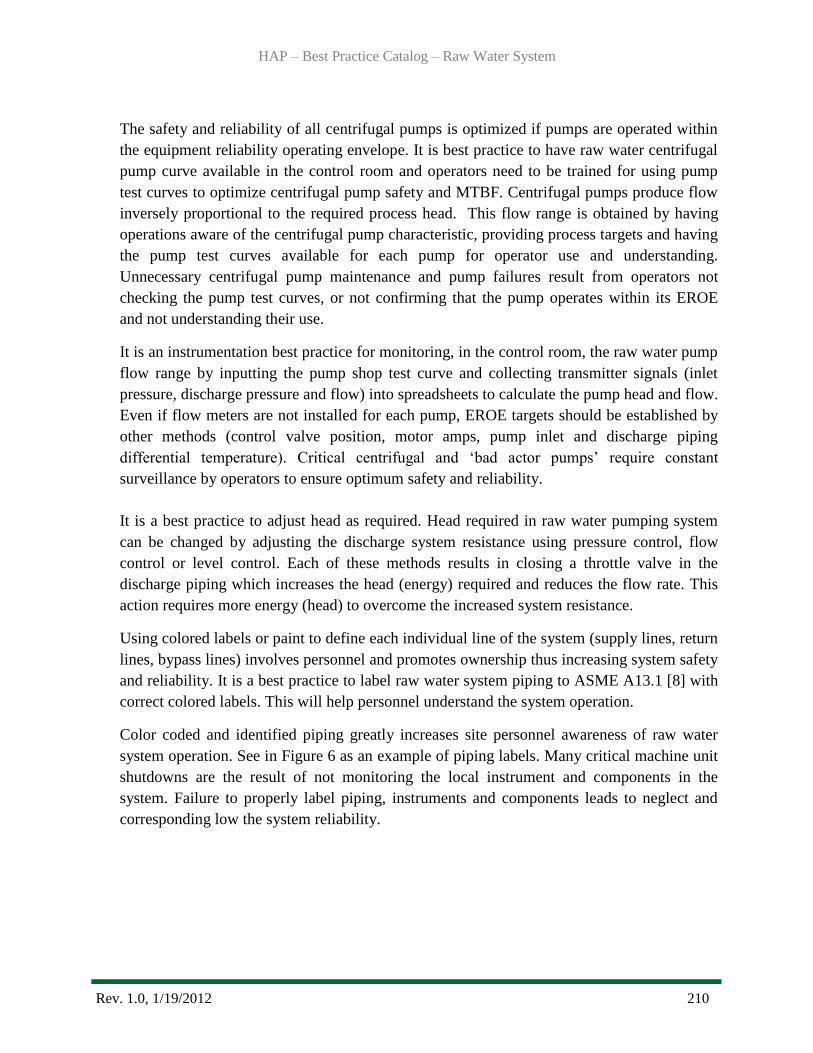
HAP – Best Practice Catalog – Raw Water System
Rev. 1.0, 1/19/2012 210
The safety and reliability of all centrifugal pumps is optimized if pumps are operated within
the equipment reliability operating envelope. It is best practice to have raw water centrifugal
pump curve available in the control room and operators need to be trained for using pump
test curves to optimize centrifugal pump safety and MTBF. Centrifugal pumps produce flow
inversely proportional to the required process head. This flow range is obtained by having
operations aware of the centrifugal pump characteristic, providing process targets and having
the pump test curves available for each pump for operator use and understanding.
Unnecessary centrifugal pump maintenance and pump failures result from operators not
checking the pump test curves, or not confirming that the pump operates within its EROE
and not understanding their use.
It is an instrumentation best practice for monitoring, in the control room, the raw water pump
flow range by inputting the pump shop test curve and collecting transmitter signals (inlet
pressure, discharge pressure and flow) into spreadsheets to calculate the pump head and flow.
Even if flow meters are not installed for each pump, EROE targets should be established by
other methods (control valve position, motor amps, pump inlet and discharge piping
differential temperature). Critical centrifugal and ‗bad actor pumps‘ require constant
surveillance by operators to ensure optimum safety and reliability.
It is a best practice to adjust head as required. Head required in raw water pumping system
can be changed by adjusting the discharge system resistance using pressure control, flow
control or level control. Each of these methods results in closing a throttle valve in the
discharge piping which increases the head (energy) required and reduces the flow rate. This
action requires more energy (head) to overcome the increased system resistance.
Using colored labels or paint to define each individual line of the system (supply lines, return
lines, bypass lines) involves personnel and promotes ownership thus increasing system safety
and reliability. It is a best practice to label raw water system piping to ASME A13.1 [8] with
correct colored labels. This will help personnel understand the system operation.
Color coded and identified piping greatly increases site personnel awareness of raw water
system operation. See in Figure 6 as an example of piping labels. Many critical machine unit
shutdowns are the result of not monitoring the local instrument and components in the
system. Failure to properly label piping, instruments and components leads to neglect and
corresponding low the system reliability.
HAP – Best Practice Catalog – Raw Water System
Rev. 1.0, 1/19/2012 211
Figure 20: Piping Labeling from ASME 13.1 [8]
Proportioning valves control the raw water flow to the generator air coolers for maintaining
proper generator air temperature. The benefit of the proportioning valve is in a situation
where the generator is operating in load following mode with significant changes in MVA
output. The valve controller would be set to the desired air temperature. Generator air cooler
flow balancing is a common operational procedure and should be readily accomplished by
plant staff. Air cooler discharge temperature should be checked from each cooler to ensure
uniform cooling.
3.3 Maintenance
The raw cooling water to the strainer performance condition is typically judged by the
differential pressure across the strainer (Figure 7).

HAP – Best Practice Catalog – Raw Water System
Rev. 1.0, 1/19/2012 212
Figure 21: Typical differential pressure gauge with feedback switch [EATON]
However, high differential is due to fouling of the strainer which can be corrected by
installing a back flush feature. Most strainers are designed with a 1/16‖ to 1/32‖ screen
size to allow small particles to pass for scouring action in the pipes and heat exchanger
tubes. If the strainer elements are failed, the strainer is essentially a piece of pipe which
does not remove the larger and detrimental debris. Unusual biological fouling, including
small fish (shad) and flood debris, can present a problem, but should normally be
corrected with a well designed back flush system. The strainer should require minimal
maintenance except to replace the internal elements that may degrade with time.
The generator raw water pipe and generator air cooler tubes foul in any system. The
cleaning of the raw water pipe is probably of minimum value unless the fouling actually
reduces raw water flow to below design value. The generator air cooler tubes are much
more of an issue and require periodic cleaning to maintain acceptable performance.
With modern air cooler design, the efficiency of the air cooler will be very similar to a
counter flow heat exchanger. The old generator air coolers were similar to a cross flow
heat exchanger with a much reduced thermal efficiency. The best measure is the
difference between the raw water cold inlet temperature, and the cold air discharge
temperature. The raw water temperature is the theoretical temperature as to how much
the cold air temperature can be lowered.
HAP – Best Practice Catalog – Raw Water System
Rev. 1.0, 1/19/2012 213
Typical efficient coolers will have a cold air discharge temperature of approximately 5°C
above the raw water inlet temperature. In the case of badly fouled tubes and degraded
fins, the air temperature approach to the raw water temperature may be 15°C to 20°C. In
the case of 30°C water inlet temperature, the maximum design air temperature of 40°C
would be exceeded and the cold air temperature would be 45°C to 50°C.
4.0 Metrics, Monitoring and Analysis
4.1 Measures of Performance, Condition, and Reliability
The Raw Water System includes cooling water pumps (for plants/units that are so equipped),
piping, valves, strainers, instrumentation and controls. As an auxiliary system, the condition
of the Raw Cooling Water system components can affect the performance and reliability of
the generating plant/unit(s).
Plant/unit performance measures include Equivalent Availability Factor (EAF) and
Equivalent Forced Outage Factor (EFOR), Maintenance Outage Rate (MOR) and Planned
Outage rate (POR). These indicators are used universally by the power industry. Many
utilities supply data to the Generating Availability Data System (GADS) maintained by
NERC. This database of operating information is used for improving the performance of
electric generating equipment. It can be used to support equipment reliability and availability
analysis and decision-making by GADS data users.
Periodic fielding testing/evaluation of Raw Cooling Water system components that are noted
as contributors to decreases in plant/unit availability should be conducted. Periodic testing
includes cooling water pump flow tests, pipe/cooler fouling investigations, internal valve
and/or strainer inspections or other tests identified.
4.2 Analysis of Data
The reliability of a generating unit, including its auxiliary support systems, can be monitored
through reliability indexes or performance indicators as derived according to NERC‘s
Appendix F, Performance Indexes and Equations [9].
4.3 Integrated Improvements
As raw water system components are identified as contributors to decreases in plant
performance and availability or increases in maintenance costs, field testing of the
specifically identified raw water system component(s) is (are) performed. The field test
results are trended and analyzed. Using the data collected and analyzed, projects to eliminate
or mitigate any identified degradation or high maintenance component issues are developed,
ranked and justified in the Capital and Maintenance funding programs. Capital and
Maintenance projects that are approved are implemented to return the component to an
acceptable condition and performance level. Post implementation testing of components that
HAP – Best Practice Catalog – Raw Water System
Rev. 1.0, 1/19/2012 214
are replaced/modified or otherwise repaired is conducted to verify that issues that resulted in
decreased unit/plant performance and/or reliability have been addressed.
5.0 Information Sources:
Baseline Knowledge:
EPRI, TR-112350-V4 Hydro Life Extension Modernization Guides: Volume 4-5 Auxiliary
Mechanical and Electrical Systems– Palo Alto, CA – 2001
ASME, The Guide to Hydropower Mechanical Design, HCI Publications Inc., 1996
TVA, Technical report No.24 Mechanical Design of Hydro Plants, US Government Printing
Office – Washington - 1960
State of the Art:
Forsthoffer, W., E., Best Practice Handbook for Rotating Machinery – 2011
Heald, C., C., Cameron Hydraulic Data – Nineteenth Edition -2002
Standards:
ASME A36.10, Welded and Seamless Wrought Steel Pipe - 2004
ASME B31.3, Process Piping ASME Code for Pressure Piping – 2008
ASME A13.1, Scheme for Identification of Piping Systems -2007
NERC, Appendix F, Performance Indexes and Equations - January, 2011
Best Practice Catalog
Generator
Revision 1.0, 12/20/2011

HAP – Best Practice Catalog – Generator
Rev. 1.0, 12/20/2011 216
Contents 1.0 Scope and Purpose .................................................................................................... 217
1.1 Hydropower Taxonomy Position .......................................................................... 217
1.1.1 GeneratorComponents ....................................................................................... 217
1.2 Summary of Best Practices ................................................................................... 227
1.2.1 Performance/Efficiency & Capability – Oriented Best Practices ..................... 227
1.2.2 Reliability/Operations & Maintenance Oriented Best Practices ....................... 228
1.3 Best Practice Cross-references .............................................................................. 229
2.0 Technology Design Summary .................................................................................. 229
2.1 Material and Design Technology Evolution ......................................................... 229
2.2 State of the Art Technology .................................................................................. 230
3.0 Operation and Maintenance Practices ...................................................................... 232
3.1 Condition Assessment ........................................................................................... 232
3.2 Operations ............................................................................................................. 234
3.3 Maintenance .......................................................................................................... 235
4.0 Metrics, Monitoring and Analysis ............................................................................ 236
4.1 Measures of Performance, Condition, and Reliability .......................................... 236
4.2 Data Analysis ........................................................................................................ 237
4.3 Integrated Improvements ...................................................................................... 238
5.0 Information Sources ................................................................................................. 238
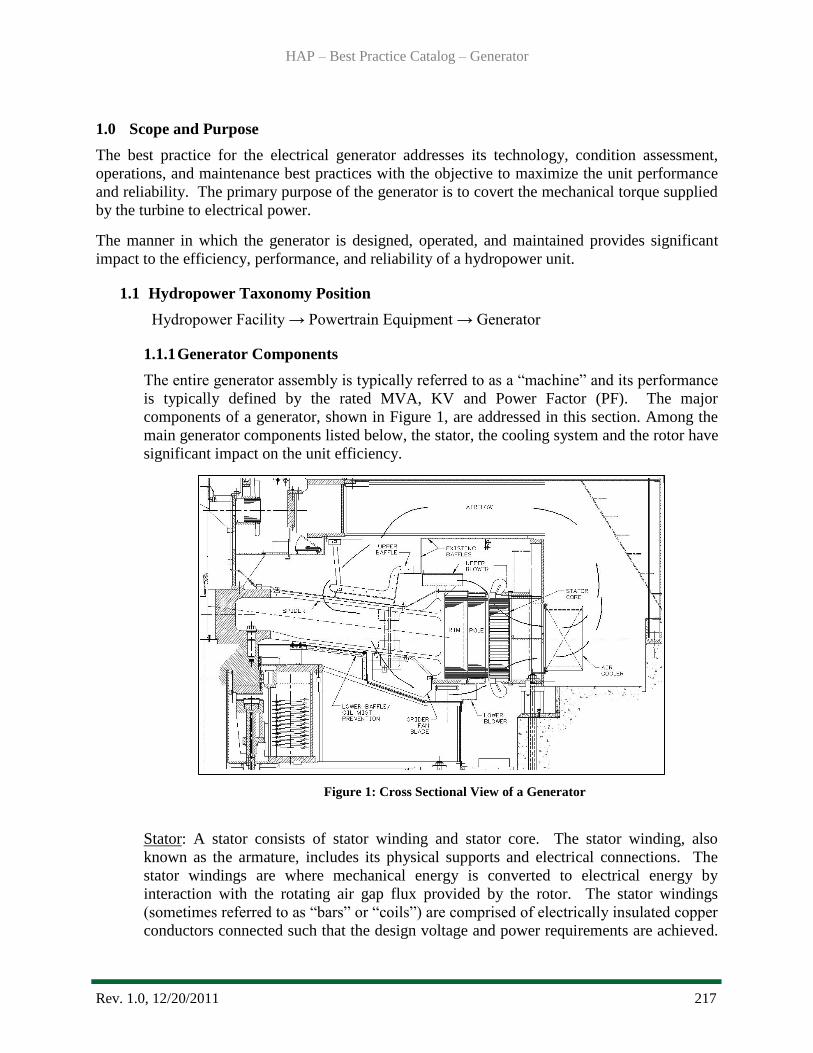
HAP – Best Practice Catalog – Generator
Rev. 1.0, 12/20/2011 217
1.0 Scope and Purpose
The best practice for the electrical generator addresses its technology, condition assessment,
operations, and maintenance best practices with the objective to maximize the unit performance
and reliability. The primary purpose of the generator is to covert the mechanical torque supplied
by the turbine to electrical power.
The manner in which the generator is designed, operated, and maintained provides significant
impact to the efficiency, performance, and reliability of a hydropower unit.
1.1 Hydropower Taxonomy Position
Hydropower Facility → Powertrain Equipment → Generator
1.1.1 Generator Components
The entire generator assembly is typically referred to as a ―machine‖ and its performance
is typically defined by the rated MVA, KV and Power Factor (PF). The major
components of a generator, shown in Figure 1, are addressed in this section. Among the
main generator components listed below, the stator, the cooling system and the rotor have
significant impact on the unit efficiency.
Figure 1: Cross Sectional View of a Generator
Stator: A stator consists of stator winding and stator core. The stator winding, also
known as the armature, includes its physical supports and electrical connections. The
stator windings are where mechanical energy is converted to electrical energy by
interaction with the rotating air gap flux provided by the rotor. The stator windings
(sometimes referred to as ―bars‖ or ―coils‖) are comprised of electrically insulated copper
conductors connected such that the design voltage and power requirements are achieved.
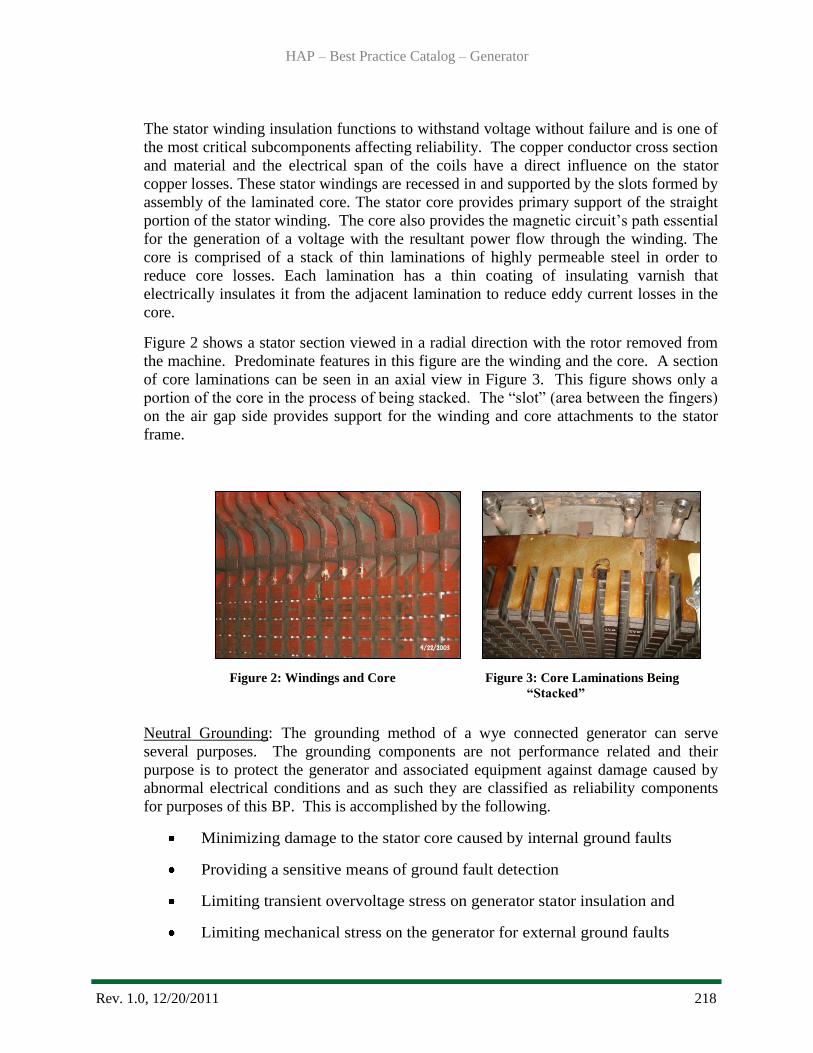
HAP – Best Practice Catalog – Generator
Rev. 1.0, 12/20/2011 218
The stator winding insulation functions to withstand voltage without failure and is one of
the most critical subcomponents affecting reliability. The copper conductor cross section
and material and the electrical span of the coils have a direct influence on the stator
copper losses. These stator windings are recessed in and supported by the slots formed by
assembly of the laminated core. The stator core provides primary support of the straight
portion of the stator winding. The core also provides the magnetic circuit‘s path essential
for the generation of a voltage with the resultant power flow through the winding. The
core is comprised of a stack of thin laminations of highly permeable steel in order to
reduce core losses. Each lamination has a thin coating of insulating varnish that
electrically insulates it from the adjacent lamination to reduce eddy current losses in the
core.
Figure 2 shows a stator section viewed in a radial direction with the rotor removed from
the machine. Predominate features in this figure are the winding and the core. A section
of core laminations can be seen in an axial view in Figure 3. This figure shows only a
portion of the core in the process of being stacked. The ―slot‖ (area between the fingers)
on the air gap side provides support for the winding and core attachments to the stator
frame.
Figure 2: Windings and Core Figure 3: Core Laminations Being
“Stacked”
Neutral Grounding: The grounding method of a wye connected generator can serve
several purposes. The grounding components are not performance related and their
purpose is to protect the generator and associated equipment against damage caused by
abnormal electrical conditions and as such they are classified as reliability components
for purposes of this BP. This is accomplished by the following.
Minimizing damage to the stator core caused by internal ground faults
Providing a sensitive means of ground fault detection
Limiting transient overvoltage stress on generator stator insulation and
Limiting mechanical stress on the generator for external ground faults
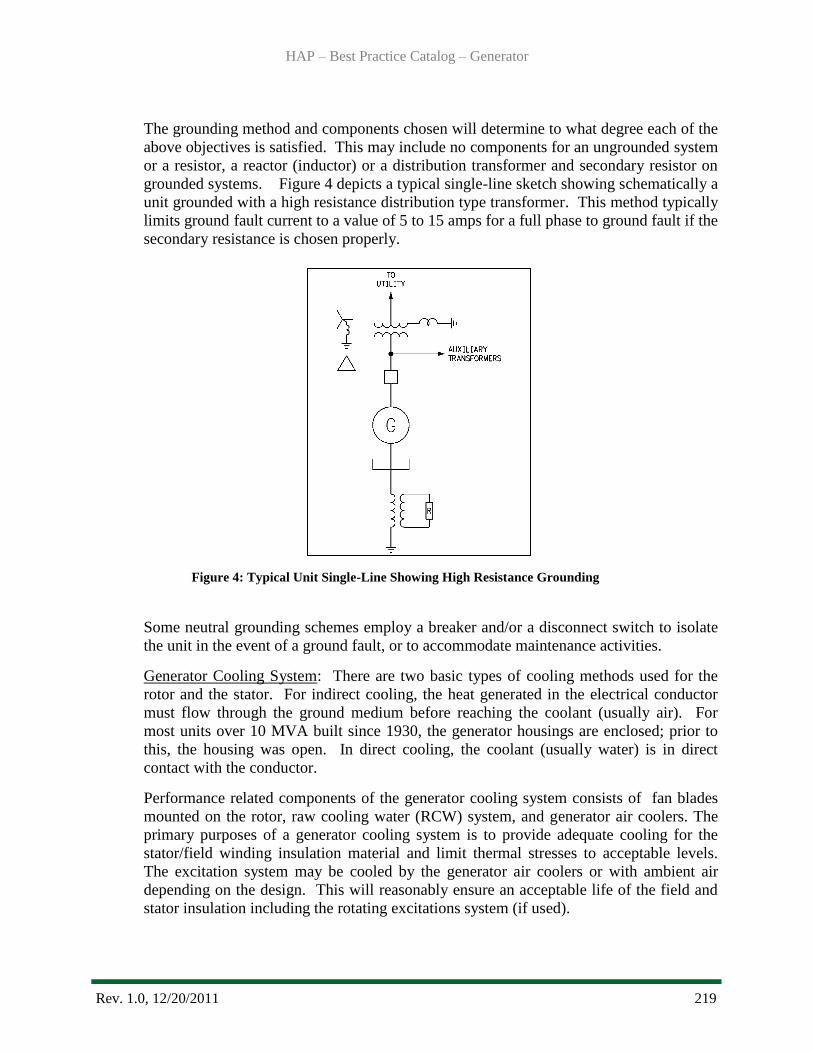
HAP – Best Practice Catalog – Generator
Rev. 1.0, 12/20/2011 219
The grounding method and components chosen will determine to what degree each of the
above objectives is satisfied. This may include no components for an ungrounded system
or a resistor, a reactor (inductor) or a distribution transformer and secondary resistor on
grounded systems. Figure 4 depicts a typical single-line sketch showing schematically a
unit grounded with a high resistance distribution type transformer. This method typically
limits ground fault current to a value of 5 to 15 amps for a full phase to ground fault if the
secondary resistance is chosen properly.
Figure 4: Typical Unit Single-Line Showing High Resistance Grounding
Some neutral grounding schemes employ a breaker and/or a disconnect switch to isolate
the unit in the event of a ground fault, or to accommodate maintenance activities.
Generator Cooling System: There are two basic types of cooling methods used for the
rotor and the stator. For indirect cooling, the heat generated in the electrical conductor
must flow through the ground medium before reaching the coolant (usually air). For
most units over 10 MVA built since 1930, the generator housings are enclosed; prior to
this, the housing was open. In direct cooling, the coolant (usually water) is in direct
contact with the conductor.
Performance related components of the generator cooling system consists of fan blades
mounted on the rotor, raw cooling water (RCW) system, and generator air coolers. The
primary purposes of a generator cooling system is to provide adequate cooling for the
stator/field winding insulation material and limit thermal stresses to acceptable levels.
The excitation system may be cooled by the generator air coolers or with ambient air
depending on the design. This will reasonably ensure an acceptable life of the field and
stator insulation including the rotating excitations system (if used).
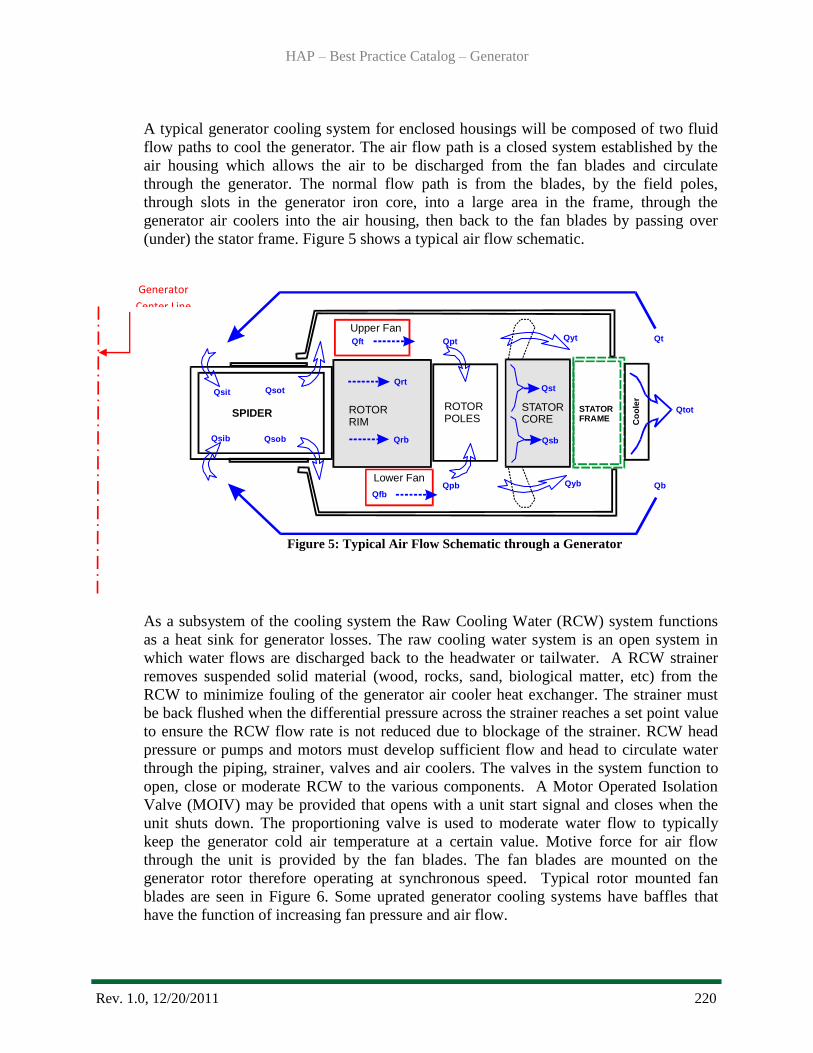
HAP – Best Practice Catalog – Generator
Rev. 1.0, 12/20/2011 220
SPIDER ROTORRIM
Upper Fan
ROTORPOLES
Lower Fan
STATORCORE
STATORFRAME C
oo
ler
Qft
Qrt
Qpt Qt
Qb
Qtot
Qst
Qyt
Qyb
Qsb
Qpb
Qrb
Qsit Qsot
Qsib Qsob
Qfb
A typical generator cooling system for enclosed housings will be composed of two fluid
flow paths to cool the generator. The air flow path is a closed system established by the
air housing which allows the air to be discharged from the fan blades and circulate
through the generator. The normal flow path is from the blades, by the field poles,
through slots in the generator iron core, into a large area in the frame, through the
generator air coolers into the air housing, then back to the fan blades by passing over
(under) the stator frame. Figure 5 shows a typical air flow schematic.
Figure 5: Typical Air Flow Schematic through a Generator
As a subsystem of the cooling system the Raw Cooling Water (RCW) system functions
as a heat sink for generator losses. The raw cooling water system is an open system in
which water flows are discharged back to the headwater or tailwater. A RCW strainer
removes suspended solid material (wood, rocks, sand, biological matter, etc) from the
RCW to minimize fouling of the generator air cooler heat exchanger. The strainer must
be back flushed when the differential pressure across the strainer reaches a set point value
to ensure the RCW flow rate is not reduced due to blockage of the strainer. RCW head
pressure or pumps and motors must develop sufficient flow and head to circulate water
through the piping, strainer, valves and air coolers. The valves in the system function to
open, close or moderate RCW to the various components. A Motor Operated Isolation
Valve (MOIV) may be provided that opens with a unit start signal and closes when the
unit shuts down. The proportioning valve is used to moderate water flow to typically
keep the generator cold air temperature at a certain value. Motive force for air flow
through the unit is provided by the fan blades. The fan blades are mounted on the
generator rotor therefore operating at synchronous speed. Typical rotor mounted fan
blades are seen in Figure 6. Some uprated generator cooling systems have baffles that
have the function of increasing fan pressure and air flow.
Generator
Center Line
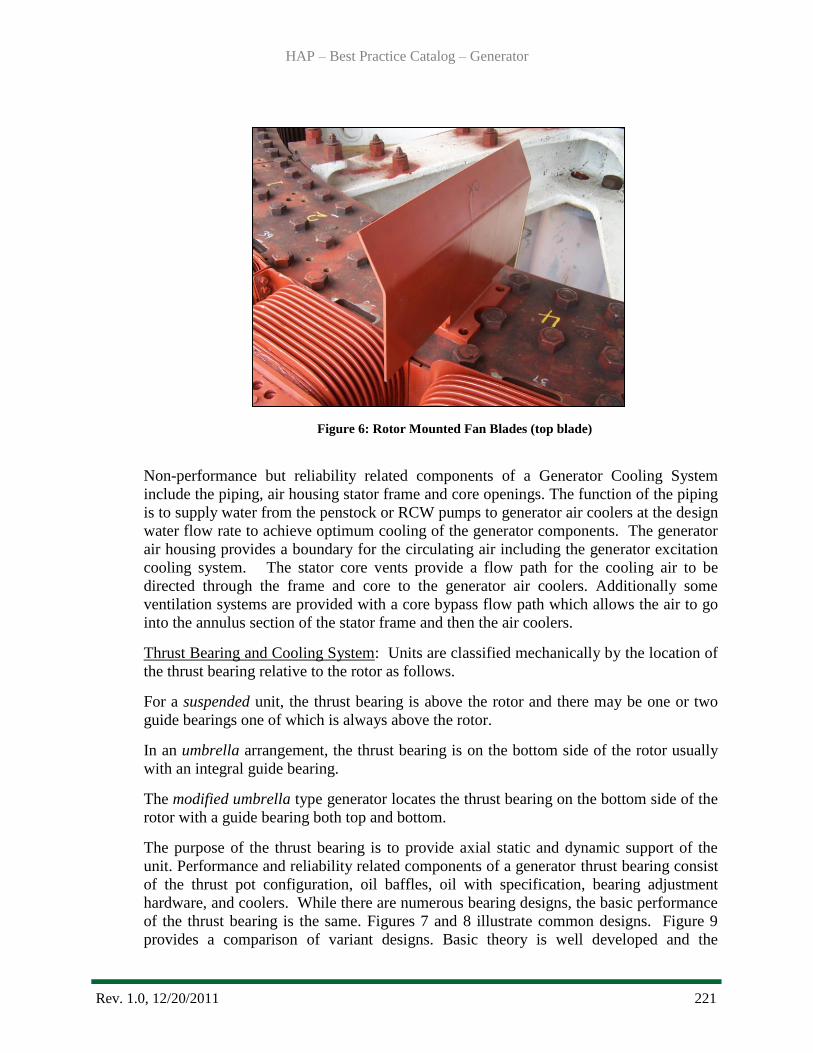
HAP – Best Practice Catalog – Generator
Rev. 1.0, 12/20/2011 221
Figure 6: Rotor Mounted Fan Blades (top blade)
Non-performance but reliability related components of a Generator Cooling System
include the piping, air housing stator frame and core openings. The function of the piping
is to supply water from the penstock or RCW pumps to generator air coolers at the design
water flow rate to achieve optimum cooling of the generator components. The generator
air housing provides a boundary for the circulating air including the generator excitation
cooling system. The stator core vents provide a flow path for the cooling air to be
directed through the frame and core to the generator air coolers. Additionally some
ventilation systems are provided with a core bypass flow path which allows the air to go
into the annulus section of the stator frame and then the air coolers.
Thrust Bearing and Cooling System: Units are classified mechanically by the location of
the thrust bearing relative to the rotor as follows.
For a suspended unit, the thrust bearing is above the rotor and there may be one or two
guide bearings one of which is always above the rotor.
In an umbrella arrangement, the thrust bearing is on the bottom side of the rotor usually
with an integral guide bearing.
The modified umbrella type generator locates the thrust bearing on the bottom side of the
rotor with a guide bearing both top and bottom.
The purpose of the thrust bearing is to provide axial static and dynamic support of the
unit. Performance and reliability related components of a generator thrust bearing consist
of the thrust pot configuration, oil baffles, oil with specification, bearing adjustment
hardware, and coolers. While there are numerous bearing designs, the basic performance
of the thrust bearing is the same. Figures 7 and 8 illustrate common designs. Figure 9
provides a comparison of variant designs. Basic theory is well developed and the
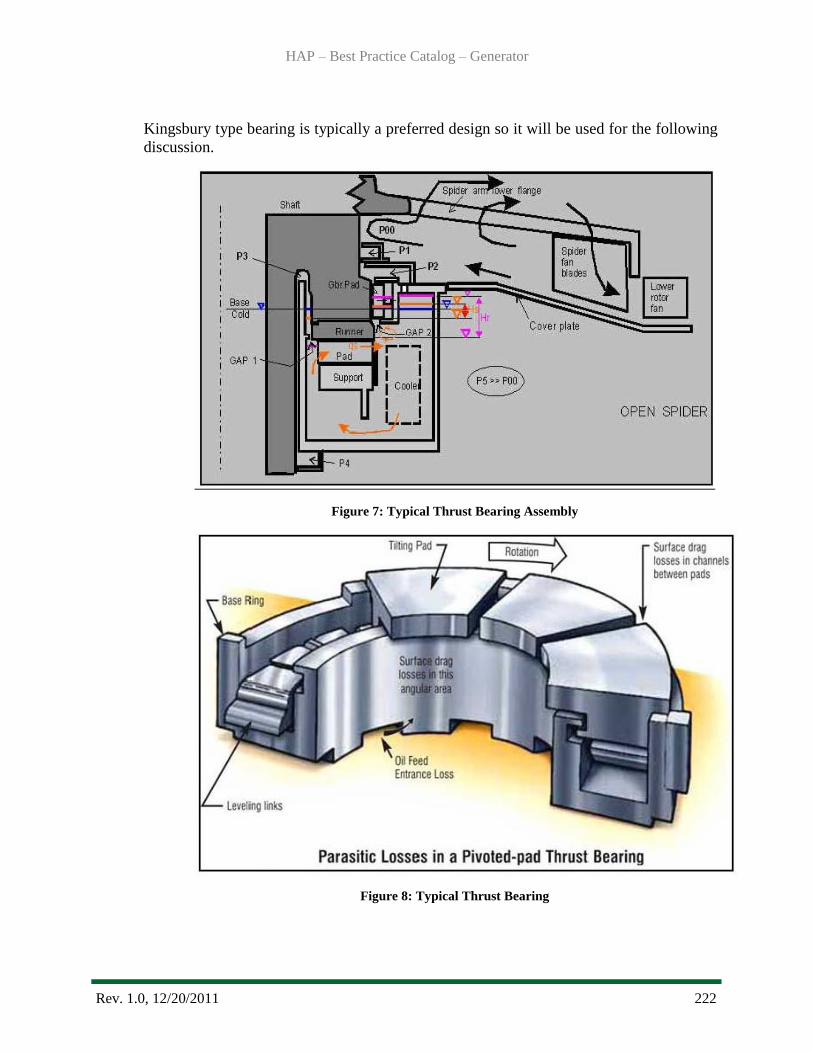
HAP – Best Practice Catalog – Generator
Rev. 1.0, 12/20/2011 222
Kingsbury type bearing is typically a preferred design so it will be used for the following
discussion.
Figure 7: Typical Thrust Bearing Assembly
Figure 8: Typical Thrust Bearing
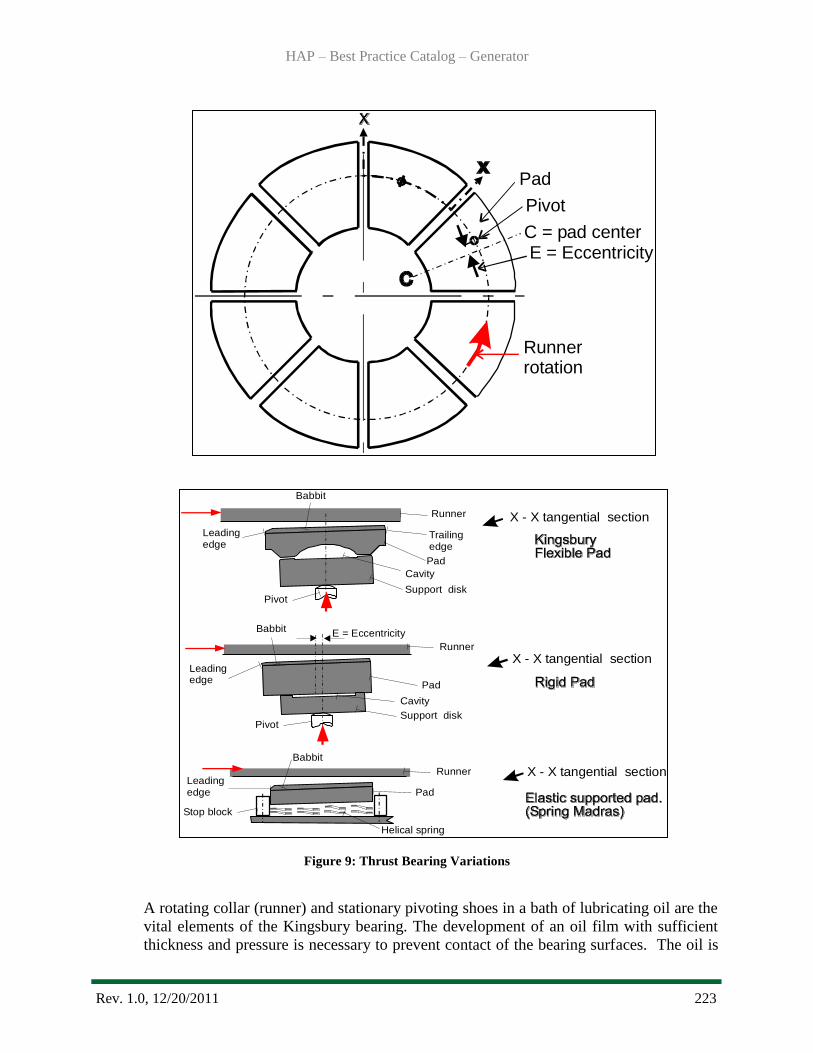
HAP – Best Practice Catalog – Generator
Rev. 1.0, 12/20/2011 223
C = pad center
Pivot
Pad
E = Eccentricity
Runnerrotation
Figure 9: Thrust Bearing Variations
A rotating collar (runner) and stationary pivoting shoes in a bath of lubricating oil are the
vital elements of the Kingsbury bearing. The development of an oil film with sufficient
thickness and pressure is necessary to prevent contact of the bearing surfaces. The oil is
Leadingedge
Leadingedge
Leadingedge
Babbit
Babbit
Babbit
Trailingedge
Pad
Pad
Pad
Support disk
Support disk
Pivot
Pivot
Runner
Runner
Runner
Cavity
Cavity
E = Eccentricity
Helical spring
Stop block
X - X tangential section
X - X tangential section
X - X tangential section

HAP – Best Practice Catalog – Generator
Rev. 1.0, 12/20/2011 224
drawn between the shoes and the runner in operation, possible because the shoes are
pivoted and free to tilt, forming an oil wedge with the required load carrying capacity.
The thrust bearing shoes are babbitt surfaced segmental elements (usually 6 to 8 each)
with hardened pivotal shoe supports on the backside that transmit the load to the housing.
This load is distributed between the shoes either by manual adjustment or automatically
by equalizers. In the Kingsbury design an adjusting screw contacts the support disk and
allows for adjustment to load the bearing and compensate for misalignment. The shoes
are usually instrumented for temperature monitoring.
The thrust bearing bracket connects the thrust pot to the powerhouse. The addition of a
static oil pressurization system, commonly called lift oil, is one of the ways babbitt to
runner contact is eliminated on a unit start before relative motion can establish the
hydrodynamic film. This eliminates a contact of these surfaces during start of the unit.
The structural component of the thrust pot is necessary to circulate the oil in a pattern
through the thrust and guide bearing. The cold oil from the thrust pot cooler must be
supplied to the bearing and then the warm oil returned to the cooler. The thrust and guide
bearing oil system is designed for specific ISO oil with associated properties. The
Bearing OEM oil specification should be considered a requirement for the system. A
filtration system will assist in the removal of debris and water.
The coolers are typically helically coiled, configured around the thrust pot and
submerged in oil to a design level. The coolers must remove the heat load from the thrust
and guide bearing and maintain the design circulating path. Coolers external to the thrust
pot have also been employed.
Except for very minor rotational friction losses the thrust bearing is basically a non-
performance but reliability related component. Additional thrust and guide bearing details
can be found in the turbine BPs.
Guide Bearing and Cooling System: The guide bearing provides support for radial load.
Both pivoted and sleeve type bearings, as shown in Figure 10, are common and in more
modern designs sleeves are adjustable similar to the thrust bearing shoes. The guide shoe
or sleeve is manufactured from forged steel with a babbitted contact surface. The sleeve
designs have structural castings typically in halves with babbitted sleeve surfaces. Guide
bearings are usually instrumented for temperature measurement.
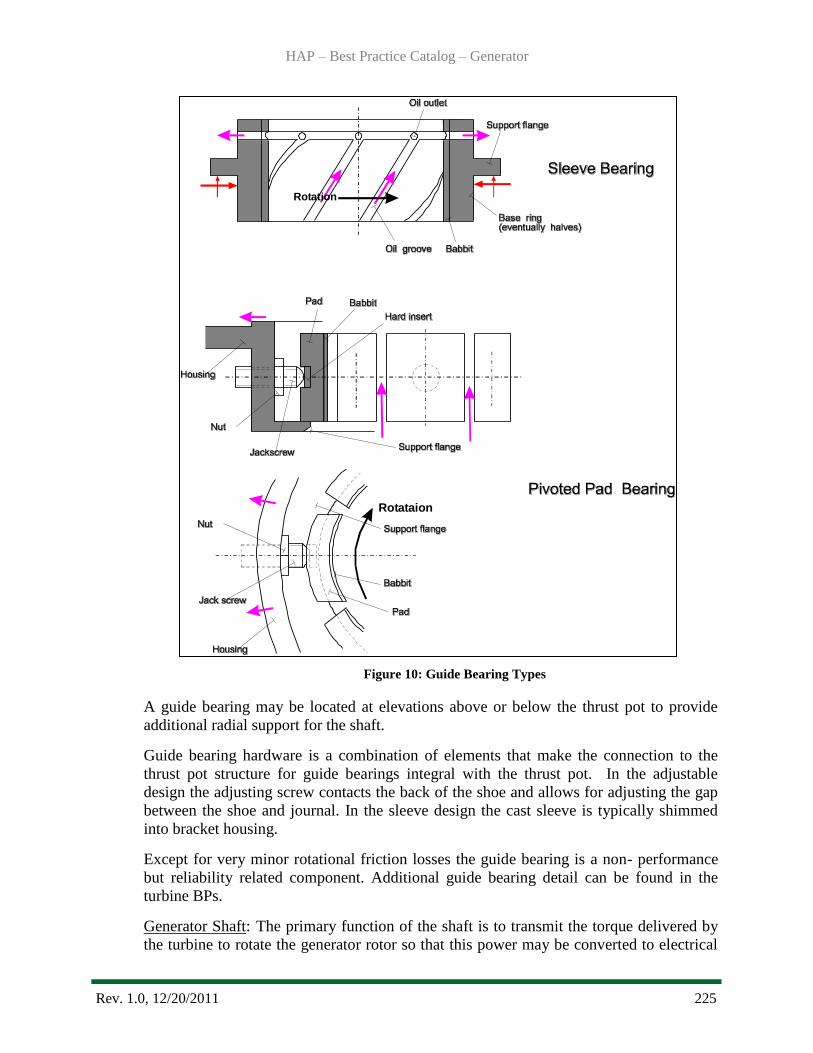
HAP – Best Practice Catalog – Generator
Rev. 1.0, 12/20/2011 225
Figure 10: Guide Bearing Types
A guide bearing may be located at elevations above or below the thrust pot to provide
additional radial support for the shaft.
Guide bearing hardware is a combination of elements that make the connection to the
thrust pot structure for guide bearings integral with the thrust pot. In the adjustable
design the adjusting screw contacts the back of the shoe and allows for adjusting the gap
between the shoe and journal. In the sleeve design the cast sleeve is typically shimmed
into bracket housing.
Except for very minor rotational friction losses the guide bearing is a non- performance
but reliability related component. Additional guide bearing detail can be found in the
turbine BPs.
Generator Shaft: The primary function of the shaft is to transmit the torque delivered by
the turbine to rotate the generator rotor so that this power may be converted to electrical
Rotataion
Rotation

HAP – Best Practice Catalog – Generator
Rev. 1.0, 12/20/2011 226
energy. The Generator Shaft must effectively make all the mechanical connections for
the various attached components and carry all loads without unacceptable vibration. The
operational torque (power input) to the shaft, rotating components dead weight, turbine
unbalanced hydraulic thrust and the unbalanced magnetic pull of the generator must be
structurally carried by the generator shaft.
Shafts may be a single piece manufactured from forged steel but some of large shafts can
be fabricated.
The connection of the turbine shaft to the generator shaft is made with a bolted
connection. Alignment/fitting up of the generator and turbine shafts, attachments and
assemblies is necessary to create and maintain air gap, turbine clearances and bearing
loading.
Generator shaft hardware is typically a combination of studs/bolts/keys and dowels that
make the assembly and their connection to the generator shaft.
Also it should be noted the generator shaft may have a rotating exciter mounted on top of
the generator rotor which provides excitation current and voltage to the field poles.
Typically a Permanent Magnet Generator (PMG) is attached to the top of the rotating
exciter. The details refer to Exciter Best Practice.
The generator shaft is a non-performance but a reliability related component of the
generator.
Generator Rotor: The primary function of generator rotor is to carry the field poles
necessary for excitation of the stator winding. The generator rotor must effectively
make all the mechanical connections for the various attached components and carry all
loads without creating unacceptable vibration. The operational torque (power input) to
the rotor, centrifugal loads created by the mass of the rotor components and other rotating
components (dead weight, rim shrink), and the unbalanced magnetic pull of the generator
must be structurally carried by the generator rotor.
The structural part of the rotor assembly is typically a cast structure, sometimes called a
spider, machined to allow bolting/keying to the generator shaft at the center and the rotor
rim to be installed on the arms with keys.
The rotor rim assembly is a laminated cylindrical structure that stacks on a horizontal
machined surface at the end of the spider arm. The rim is typically shrunk on shrink keys
that that may also transmit the operational torque to the generator. The poles consist of
copper windings that are electrically insulated between turns and establish the electrical
circuit which provides the rotor flux for the air gap. Excitation current is provided to the
field poles by the field leads mounted on the rotor arm which are electrically and
mechanically connect to the collector (slip) rings. The field poles are electrically
connected in series. Figure 11 shows typical field poles mounted on the rotor.
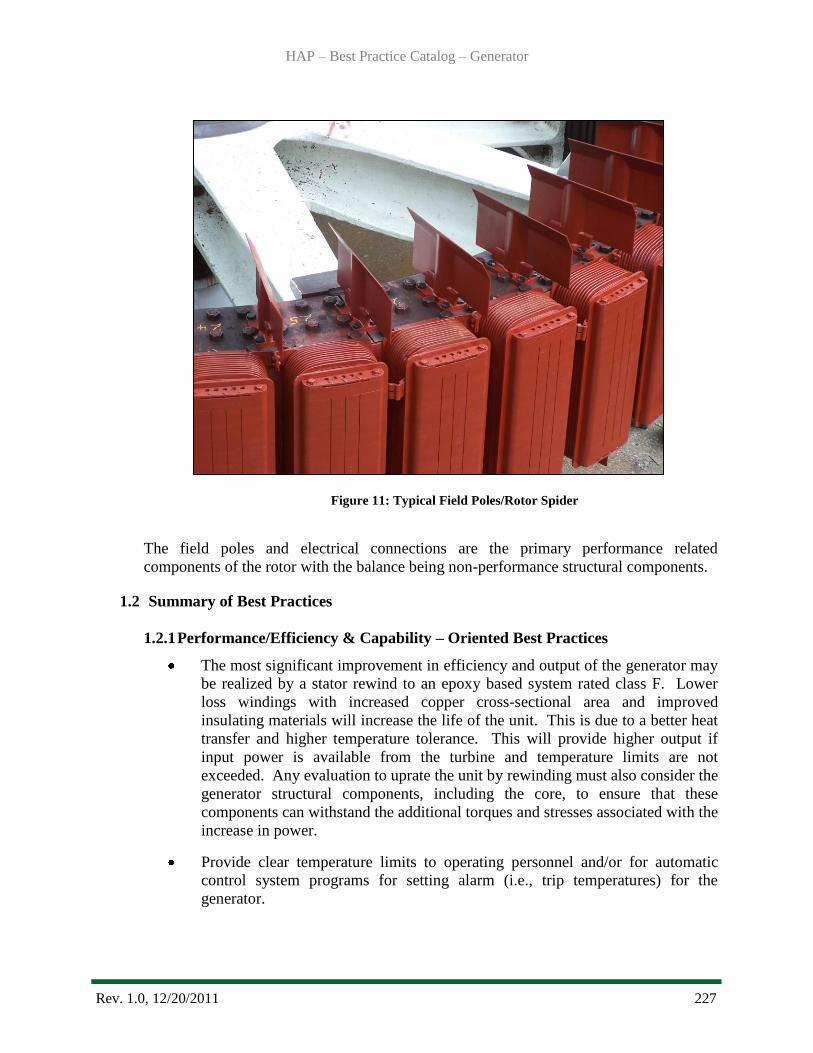
HAP – Best Practice Catalog – Generator
Rev. 1.0, 12/20/2011 227
Figure 11: Typical Field Poles/Rotor Spider
The field poles and electrical connections are the primary performance related
components of the rotor with the balance being non-performance structural components.
1.2 Summary of Best Practices
1.2.1 Performance/Efficiency & Capability – Oriented Best Practices
The most significant improvement in efficiency and output of the generator may
be realized by a stator rewind to an epoxy based system rated class F. Lower
loss windings with increased copper cross-sectional area and improved
insulating materials will increase the life of the unit. This is due to a better heat
transfer and higher temperature tolerance. This will provide higher output if
input power is available from the turbine and temperature limits are not
exceeded. Any evaluation to uprate the unit by rewinding must also consider the
generator structural components, including the core, to ensure that these
components can withstand the additional torques and stresses associated with the
increase in power.
Provide clear temperature limits to operating personnel and/or for automatic
control system programs for setting alarm (i.e., trip temperatures) for the
generator.
HAP – Best Practice Catalog – Generator
Rev. 1.0, 12/20/2011 228
Trending of stator, field and hot/cold air temperatures will establish accurate
performance of current generator cooling system. Limited IEEE 115 test can
provide high quality data and establish the CPL parameters.
Stator winding temperature limits should be continually monitored. Any trends
indicating increased operating temperatures for the same load and ambient
conditions should be investigated for issues with the cooling system.
Periodic comparison of the CPL to the IPL to detect and mitigate degradation
that may impact efficiency or capacity.
Periodic comparison of the CPL to the PPL to trigger feasibility studies for
major upgrades.
1.2.2 Reliability/Operations & Maintenance Oriented Best Practices
Monitor generator temperatures under operating conditions of load and cooling.
Increasing temperatures under these conditions may be indicative of dirt and
dust contamination. Dust and dirt will impede heat transfer characteristics,
block cooling flow passages, and degrade electrical insulation. Cleaning of
generator windings and air slots to remove oil, dirt, and debris will improve the
heat transfer coefficient of those components. Cleaning of the core slots in
machines with an unusually large amount of blockage may result in
improvements of 5°C to 10°C. The preferred cleaning method is to vacuum
rather than to blow debris unless it is reasonably assured that the dislodged
debris will not simply be relocated in the unit. Dry compressed air may be used
in areas not accessible to vacuum cleaning. Oil and other solvent based
contaminates will attract and capture dirt and debris and should be removed by
approved solvent cleaning, and the source of the contamination, i.e. oil leak,
should be repaired.
The generator air cooler tubes require periodic cleaning to maintain acceptable
heat transfer performance. A major problem in generator air cooler manufacture
was the baffles that created an effective heat transfer flow path for the RCW
becoming totally degraded or lost, resulting in a heat exchanger with poor
performance. Repairs to the coolers may correct some of the problems with
degraded coolers.
A reduction in the air temperature of the generator air cooler by 5°C is common
by cleaning fouled coolers. Efficient coolers will have a cold air discharge
temperature of approximately 5°C above the RCW inlet temperature. In the
case of badly fouled tubes and degraded fins, the air discharge temperature may
be 15°C to 20°C higher than the RCW.
RCW strainer performance is typically judged by the differential pressure across
the strainer which is improved by a well-designed back flush system that
maintains design RCW flow rates.
HAP – Best Practice Catalog – Generator
Rev. 1.0, 12/20/2011 229
The use of proportioning valves may limit thermal cycling of the generator
based on cold air temperature. .
RCW piping leaks due to wall corrosion will degrade cooling system
performance. Leaks of this nature are generally corrected by replacing the
section(s) of pipe affected. Leaks inside the unit air housing should be corrected
promptly to prevent water contamination of electrical or structural components
in the housing.
While overall age is a factor, units cycled frequently are subject to increased
thermal stresses that ultimately affect total generation. Likewise, units operated
outside their capability curves by exceeding recommended temperatures, will
have increased losses, reduced time to failure, and consequently reduced total
generation. Cyclic operations and operations outside the recommended limits
should be minimized.
Shaft vibration should be monitored. Levels of shaft vibration that reach alarm
or trip levels will obviously impact operations, and maintenance will be required
in this case. IEEE 492 Section 7.9 addresses ―Vibration Detection and
Correction‖. Acceptable vibration and Shaft Run out are indicated in Section
8.3.7.1 and it is noted ―No standards for acceptable maximum vibration have
been developed ―. This is partly due to the fact that there are numerous machine
designs with different generator thrust and guide bearings and likewise for the
turbine guide bearings. Develop root cause of vibration problems and schedule
maintenance repairs or modification.
Monitor bearing temperatures to alarm and trip when recommended temperature
limits are exceeded. Multiple shoes of each bearing should be monitored to
preclude the possibility of a single failed temperature detector allowing an
undetected bearing over temperature event.
1.3 Best Practice Cross-references
I&C - Automation
Mechanical - Francis Turbine
Mechanical – Kaplan Turbine
Mechanical – Pelton Turbine
Electrical - Exciter
2.0 Technology Design Summary
2.1 Material and Design Technology Evolution
The underlying technology of generators has not changed appreciably since the 1900‘s. The
basic principal of a rotating flux produced by a DC current circulating in the rotor and
HAP – Best Practice Catalog – Generator
Rev. 1.0, 12/20/2011 230
generating an AC voltage is unchanged. Improved materials as well as enhanced monitoring,
assessment and design tools have facilitated improved reliability and efficiency.
Generator shafts were typically manufactured from a forging with a material similar to
ASME 668 as a single piece shaft. Early casting technology limited the economic diameter of
the shafts to around 36 inches. As technology developed, larger diameter and better quality of
shafts were possible allowing integral thrust runners. Thrust runners from the early 1900‘s
were often cast iron which was difficult to modify due to porosity slightly below the runner
surface.
Generator rotors from the 1930s to 1970s were designed with significant margin for
operational torque (input turbine horsepower) by the generator OEM. Thus the rotor may
readily be rehabilitated and be adequate for increased capacity without replacement. The
design fatigue life of the generator rotor will be established by material condition and loads.
The first part of the 1900‘s, generators were open air cooled machines that utilized ambient
air for the cooling system from the powerhouse area. This cooling system resulted in high
operating temperatures due to some amount of recirculated cooling air and possible high
ambient air temperature. By the 1930‘s most designs utilized enclosed air housings with air
coolers that utilized RCW heat exchangers as the heat sink.
Electrical insulation technology has seen improvements that allow for longer life and
operation at higher temperatures, with higher reliability, and equivalent insulation levels with
less material (i.e. thinner ground wall). Early units were likely to use an asphalt or bitumen
varnish with mica tape insulating system for the stator winding. Current technology still
utilizes a mica tape but with a synthetic epoxy or polyester resin as a binder. Insulation
classes as defined by National Electrical Manufacturers Association (NEMA) establish the
operating temperature limits for each ―class‖ of insulation.
Performance levels for the generator can be stated at three levels as follows:
The Installed Performance Level (IPL) is defined by the unit performance
characteristics at the time of commissioning. For the generator this is primarily
related to guaranteed losses, as provided by the manufacturer and measured to the
extent possible during performance testing.
The Current Performance Level (CPL) is described by an accurate set of unit
performance characteristics as determined by unit efficiency testing.
The Potential Performance Level (PPL) typically requires reference and comparison
of the IPL (and CPL) to design data for a new unit.
2.2 State of the Art Technology
A typical generator will have an efficiency of about 96.5%. Approximately 2.5% of the
losses must be removed from the machine by the cooling system to provide adequate cooling.
Table 1 shows losses associated with a rotating exciter that are not necessarily influenced by
the cooling system due to the location of the excitation components. Improvements in the
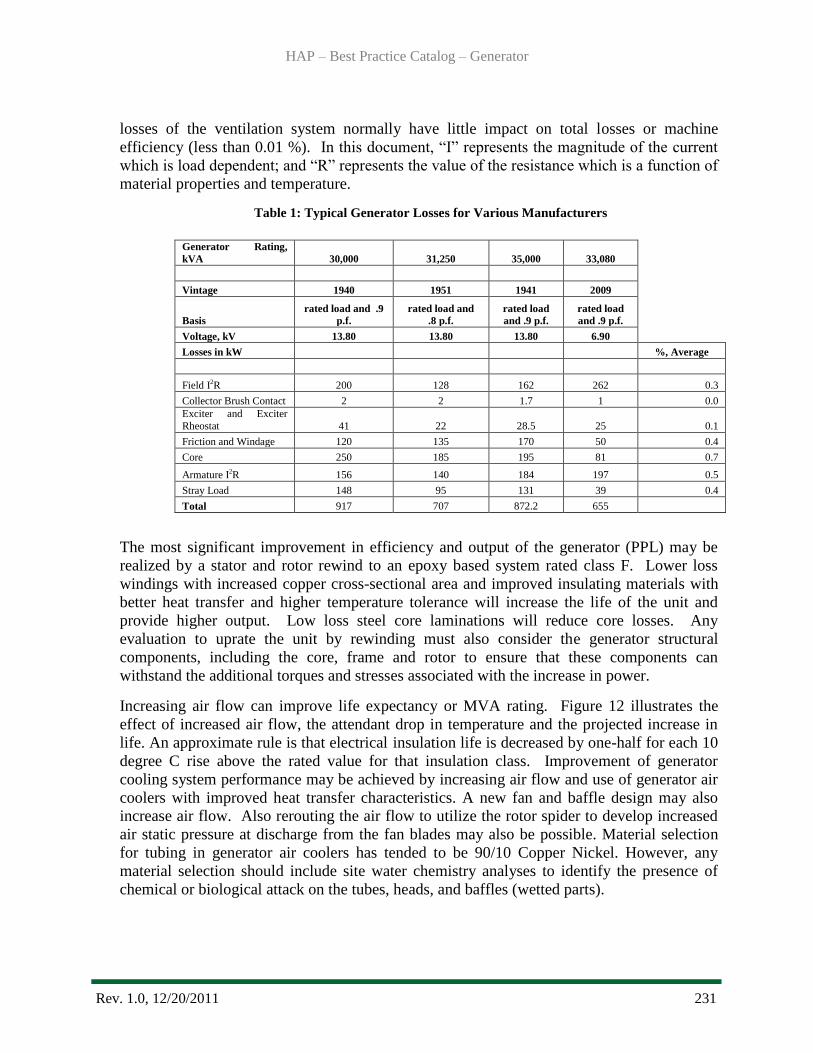
HAP – Best Practice Catalog – Generator
Rev. 1.0, 12/20/2011 231
losses of the ventilation system normally have little impact on total losses or machine
efficiency (less than 0.01 %). In this document, ―I‖ represents the magnitude of the current
which is load dependent; and ―R‖ represents the value of the resistance which is a function of
material properties and temperature.
Table 1: Typical Generator Losses for Various Manufacturers
The most significant improvement in efficiency and output of the generator (PPL) may be
realized by a stator and rotor rewind to an epoxy based system rated class F. Lower loss
windings with increased copper cross-sectional area and improved insulating materials with
better heat transfer and higher temperature tolerance will increase the life of the unit and
provide higher output. Low loss steel core laminations will reduce core losses. Any
evaluation to uprate the unit by rewinding must also consider the generator structural
components, including the core, frame and rotor to ensure that these components can
withstand the additional torques and stresses associated with the increase in power.
Increasing air flow can improve life expectancy or MVA rating. Figure 12 illustrates the
effect of increased air flow, the attendant drop in temperature and the projected increase in
life. An approximate rule is that electrical insulation life is decreased by one-half for each 10
degree C rise above the rated value for that insulation class. Improvement of generator
cooling system performance may be achieved by increasing air flow and use of generator air
coolers with improved heat transfer characteristics. A new fan and baffle design may also
increase air flow. Also rerouting the air flow to utilize the rotor spider to develop increased
air static pressure at discharge from the fan blades may also be possible. Material selection
for tubing in generator air coolers has tended to be 90/10 Copper Nickel. However, any
material selection should include site water chemistry analyses to identify the presence of
chemical or biological attack on the tubes, heads, and baffles (wetted parts).
Generator Rating,
kVA 30,000 31,250 35,000 33,080
Vintage 1940 1951 1941 2009
Basis
rated load and .9
p.f.
rated load and
.8 p.f.
rated load
and .9 p.f.
rated load
and .9 p.f.
Voltage, kV 13.80 13.80 13.80 6.90
Losses in kW
%, Average
Field I2R 200 128 162 262 0.3
Collector Brush Contact 2 2 1.7 1 0.0
Exciter and Exciter
Rheostat 41 22 28.5 25 0.1
Friction and Windage 120 135 170 50 0.4
Core 250 185 195 81 0.7
Armature I2R 156 140 184 197 0.5
Stray Load 148 95 131 39 0.4
Total 917 707 872.2 655
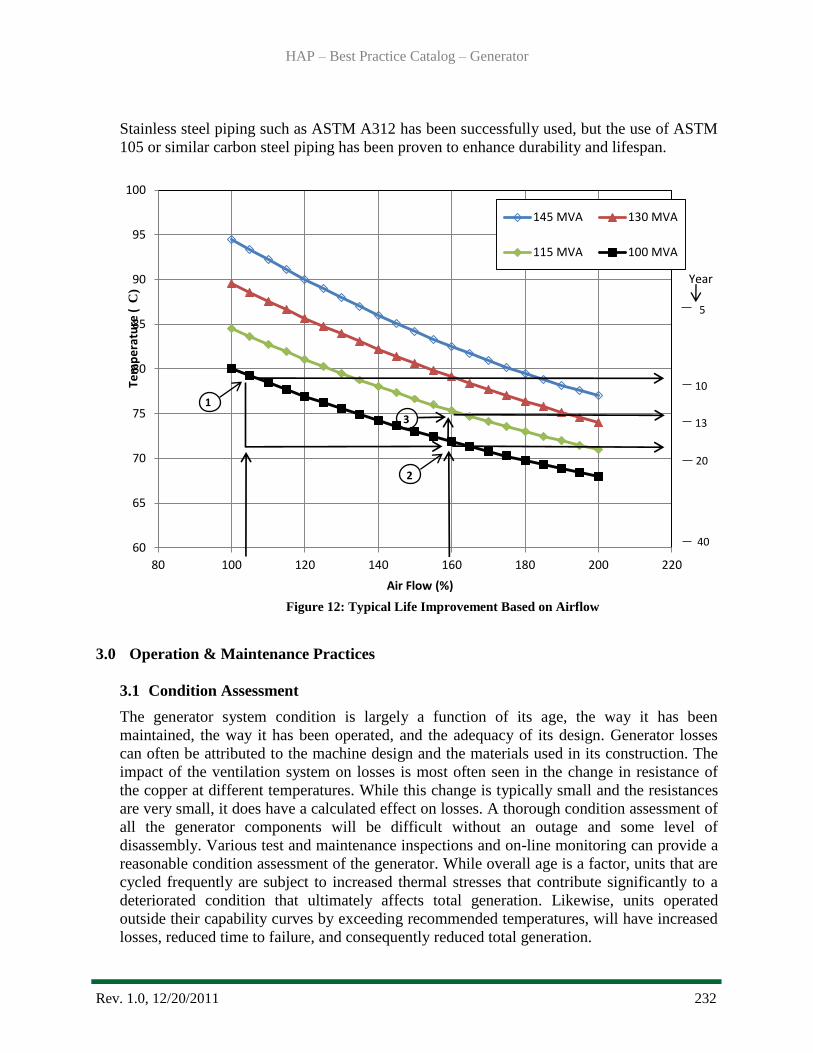
HAP – Best Practice Catalog – Generator
Rev. 1.0, 12/20/2011 232
60
65
70
75
80
85
90
95
100
80 100 120 140 160 180 200 220
Tem
pe
ratu
re (
C
)
Air Flow (%)
145 MVA 130 MVA
115 MVA 100 MVA
13
20
40
5
10
1
2
3
Year
Stainless steel piping such as ASTM A312 has been successfully used, but the use of ASTM
105 or similar carbon steel piping has been proven to enhance durability and lifespan.
Figure 12: Typical Life Improvement Based on Airflow
3.0 Operation & Maintenance Practices
3.1 Condition Assessment
The generator system condition is largely a function of its age, the way it has been
maintained, the way it has been operated, and the adequacy of its design. Generator losses
can often be attributed to the machine design and the materials used in its construction. The
impact of the ventilation system on losses is most often seen in the change in resistance of
the copper at different temperatures. While this change is typically small and the resistances
are very small, it does have a calculated effect on losses. A thorough condition assessment of
all the generator components will be difficult without an outage and some level of
disassembly. Various test and maintenance inspections and on-line monitoring can provide a
reasonable condition assessment of the generator. While overall age is a factor, units that are
cycled frequently are subject to increased thermal stresses that contribute significantly to a
deteriorated condition that ultimately affects total generation. Likewise, units operated
outside their capability curves by exceeding recommended temperatures, will have increased
losses, reduced time to failure, and consequently reduced total generation.
HAP – Best Practice Catalog – Generator
Rev. 1.0, 12/20/2011 233
The design and capacity of the system should match the operational requirements, i.e. turbine
input power. The generator rating should be adequate for the available turbine power.
The RCW Motor Operated Isolation Valve opens when a unit starts and closes when a unit
stops. The motor and valve condition can largely established by operation history and age.
The RCW pump and motor is normally a centrifugal pump with an induction motor.
Developed pressure across the pump with rated flow (from a RCW flow meter) is usually
sufficient to determine if the pump is operating acceptably. The RCW strainer condition can
be evaluated based on pressure differential across the strainer and its performance after a
back flush to operate at rated pressure drop or lower.
RCW pipe is difficult to evaluate for wall thickness due to fouling on the inside of the pipe
that may be ½ to ¾ of an inch on 6-8‖ pipe. Pinhole leaks may ultimately develop along the
length of the piping system so replacement is typically justified.
The manual valves can be operated to determine if it is properly operated. Condition of disc,
seats and other internal components would require removal from the pipe connections. Age is
the major factor in the manual valve‘s life.
RCW cooling systems instrumentation should be routinely checked for accuracy, especially
air cooler thermocouples/resistance temperature detectors (rtd‘s), pressure gages and flow
meters. Some temperatures can be checked with hand held pyrometers or thermal imaging
equipment, depending on the accessibility. Instrumentation accuracy is subject to
deterioration due to corrosion, loose connections, electrical deterioration, obstructed or
blocked flow passages or mechanical damage.
Generator air cooler condition can be evaluated by checking cold air temperature variations
in the vertical and horizontal directions across the face of the cooler and the overall
temperature drop/rise of the coolants. Significant variations across the horizontal and vertical
dimensions (> 8° F) may be due to air gap problems or localized hot spots in the armature.
Fins should be inspected for contact with the tubes. It is possible to check air pressure drop
across the coolers depending on the accessibility. Degradation/loss of generator air cooler
head baffles will result in poor cooling efficiency and cold air temperatures that are 20°C
above the RCW temperature.
Condition of the proportioning valves can be readily determined as to whether the valves are
adjusting water flow for the variations in air temperature.
The generator fan blades are fabricated assemblies that are typically attached to the top and
bottom of the rotor rim. Inspections can identify fatigue cracks, defective welds, loose
hardware or mechanical damage that may impact cooling.
Although the system stator‘s electrical insulation integrity has no correlation with losses, it is
important to note that insulation failure will result in lost generation. Insulation integrity is
reduced with age increasing. Increased age exposes insulation to the cumulative effects of
thermal stress and cycling, vibration and mechanical damage, and deleterious contaminates.
A variety of electrical tests may be performed to aid in assessing insulation condition, and the
majority of accepted industrial techniques for generator condition assessment are associated

HAP – Best Practice Catalog – Generator
Rev. 1.0, 12/20/2011 234
with testing and monitoring of the insulation system. A number of these tests and techniques
are identified in Information Sources [10 and 17].
The generator rotor can be inspected on a periodic basis for loose hardware, pole
overheating, pole electrical connection integrity, air gap, rotor roundness, loose fans, loose
shrink keys, brake ring heating or deformation. Structural components can be non
destructively examined (NDE) for cracks or failures. During operation, vibration should be
trended, and apparent causes for excessive levels of vibration include eccentricity between
the rotor and stator, bearing issues, air gap anomalies, or alignment. While no standards
identify acceptable levels of vibration, IEEE 492 addresses ―Vibration Detection and
Correction‖. Trip and alarm setpoints for a specific unit should be established by the
Original Equipment Manufacturer (OEM) or by operating experience.
The condition assessment of the oil lubricated thrust and guide bearing includes vibration
measurements and temperature of the bearing in operation. Abnormal indications could be a
sign of failure of the babbitted surface (wipe), un-bonding of the babbitt from the bearing
shoe, or contamination of the oil which can be established by oil sample analyses.
3.2 Operations
It is recognized that the rating of the generator may not be matched to the load capability of
the turbine. However, loading of the generator should be maintained within the
manufacturer‘s capability curve.
Stator and rotor winding temperature limits are based on NEMA insulation class, and should
be continually monitored. Any trends indicating increased operating temperatures under the
same load and ambient conditions should be investigated for issues with the cooling system.
Output of the unit is limited in the ―overexcited‖ region by the operating temperature of the
field (excitation system) and may be limited by core end heating in the ―under excited‖
region. Generally, measurements of the field and core temperature are collected using
embedded resistance temperature detectors or indirect methods. The limits must be
maintained for rated output of the unit.
It is not unusual for a hydro generator to be operated with failed coils cut out of the winding
path. This is generally done to minimize repair cost and to expedite the return to service
following a coil failure. The manufacturer should be consulted in these cases to determine
deratings and remediation measures required. Any losses associated with this setup can be
restored by replacing the failed coils.
Marginal operational control of a typical generator cooling system is possible due to the
design. One exception is proportioning valves to control RCW flow to the generator air
coolers to maintain a constant hot or cold air temperature. The benefit of the proportioning
valve is in a situation where the generator is operating in load following mode with
significant changes in MVA output. The valve controller would be set to the desired air
temperature.

HAP – Best Practice Catalog – Generator
Rev. 1.0, 12/20/2011 235
The generator rotor should have a significant margin for fatigue failure under design loadings
including design basis transients. Operation at higher MW output may accelerate fatigue
damage of components and should be evaluated by analyses. Also the operation of the
generator at higher MVA and PF conditions may result in high field temperatures that tend to
loosen the shrink of the rim to the rotor arm keys. Operational limits should be imposed for
the generator as a machine with all structures, components and assemblies evaluated.
3.3 Maintenance
A well designed and supported Maintenance Program is essential to the reliability, operation
and maintenance planning for the generator. Maintenance procedures are needed to ensure
that consistent and effective maintenance is performed. These procedures should be based on
manufacturers‘ recommendations and operating experience.
Deterioration of the cooling system effectiveness may be caused by misoperation of heat
exchangers, rotor fans, automatic cooler controls, fouling of stator vents, or ambient
conditions. Any decrease in cooling effectiveness is subject to increased I2R (resistance R by
the current I squared) losses. The generator RCW pipe and generator air cooler tubes foul in
any system. The cleaning of the RCW pipe is probably of minimum value unless the fouling
reduces RCW flow below design value. If design flow rates are not achievable with adequate
pump or head pressure, fouled or obstructed piping may be the cause. Water jet or hydrolaze
cleaning of RCW piping may improve flow rates. The generator air cooler tubes are more
vital and require periodic cleaning to maintain the acceptable performance when indicated by
excessive cold air temperatures. Another potential problem in the older generator air coolers
was the baffles that were designed to create an effective heat transfer path for the RCW.
After years of service, these baffles are totally degraded or lost, resulting in a heat exchanger
with poor performance. Also, the fins may become separated from the tubes which
effectively eliminate the fins surface from heat transfer. Degraded baffles should be repaired
and new gaskets installed on the heads. Degradation of generator air cooler tubes may result
in leaks and water being transported to the stator and field coils. Air cooler cleaning is
typically accomplished by removing the coolers from the generator. The coolers should be
cleaned annually, or even more frequently, if severe fouling occurs. The heads are removed
and the tubes can be cleaned with a tool. In severe cases of unusual biological fouling, it
may be necessary to increase the cleaning frequency. Frequencies may require seasonal
adjustments.
The rotor assembly requires minimum maintenance except to inspect the bolted
connections/keys and correct any loose assemblies, shaft/rotor mating fretting, field leads on
the rotor arm, rim studs, fans blades, and poles. Shrunk on collars should be examined for
fretting of surfaces if access is possible. The tightness of the shrink keys should also be
checked in machines with 30-40 years of service. A re-shrink of the rim may be desirable to
reestablish the compressive load on the rotor arms and ensure acceptable contact between the
rim/pole assembly and the arm key. NDE examinations of structural welds and attachments
should be conducted on a periodic basis. The maintenance procedure should include the
periodic measurement of rotor air gap data. The reduced air gap may be due to frame/core
movement, rotor rim issues or pole mounting issues. The interpole electrical connections
HAP – Best Practice Catalog – Generator
Rev. 1.0, 12/20/2011 236
(including amortisseur windings) should also be checked for indication of overheating or
mechanical failure or damage.
The stator bolted connections in the phase and neutral lead assembly should be checked and
tightened either during outage or checked indirectly by temperature measurement during
operation. Minor I2R losses may be seen here if connections have deteriorated or been made
improperly. Generator inspections and testing should be performed periodically by
individuals‘ knowledgeable in generator design, operations and maintenance. Generator
reliability is highly dependent on the ability to detect and address incipient issues affecting
the integrity of the stator winding.
As seen in Table 1, the collector ring and brush assemblies often account for small losses
(excitation system). To minimize these losses, operators should follow the manufacturers‘
recommendations relative to collector rings and brush rigging. The brush dust generated by
the collector ring and commutator brushes (if present) makes this a high maintenance area.
Lack of attention in this area can result in a flashover due to the low resistance tracking paths
caused by the brush dust.
Perform NDE on stator structural frame welds during major outages or as indicated by
operating experience.
Generator Neutral Grounding Systems traditionally are constructed using distribution
transformers, resistors, and/or inductors. Contamination may cause tracking during fault
conditions resulting in higher fault current for a line to ground fault, which could in turn
result in more damage to the generator iron. Other components associated with the neutral
grounding system include breakers and disconnect, which should be visually inspected. Oil
filled breakers or grounding inductors/transformers should be checked for leakage. Cleaning
and testing is recommended on a scheduled basis as determined by the manufacturers‘s
recommendations and operating experience.
4.0 Metrics, Monitoring and Analysis
4.1 Measures of Performance, Condition, and Reliability
Reductions in stator operating temperature will reduce the value of R and consequently the
I2R losses. However, the R factor in this equation is minor in comparison to the I
2 factor.
Personnel should also take caution that they must follow the manufacturer‘s operating
temperature guidelines to prevent damaging differential expansions between generator
structural and winding components.
Determination of other losses (e.g., windage and friction, core, stray load, and excitation
system) requires various measurements made during different modes of performance testing
as described in IEEE 115 [10]. These losses are originally calculated and provided by the
manufacturer, but the cost of retesting to determine any deterioration or improvement should
be compared to the potential expected benefit.
The largest losses in the generator are the I2R losses in the stator and rotor. An
approximation of these losses can be calculated and compared to design values in an effort to

HAP – Best Practice Catalog – Generator
Rev. 1.0, 12/20/2011 237
determine the gap between the IPL and CPL. Accurate resistance measurements of
components subject to I2R losses at a reference temperature are required. Methods of
temperature determination include thermometer methods, embedded detector methods,
coolant temperature measurements, and indirect measurement with scanning devices.
Voltage and current measurements are also required to determine resistance at operating
temperature. Loss in watts is calculated by multiplying the resistance R by the current I
squared, or I2R.
Resistance at a given operating temperature may be calculated by comparing the measured
resistance of the winding (or rheostat) at a known temperature as follows: [10]
Rs=Rt((ts+k)/(tt+k))
Where:
Rs is the winding resistance, corrected to a specified temperature, ts, in ohms;
ts, is the specified temperature in degrees Celsius;
Rt is the test value of the winding resistance, in ohms;
tt is the temperature of the winding when resistance was measured, in degrees
Celsius;
K is 234.5 for copper, 225 for aluminum, in degrees Celsius.
It should be noted that the values for the ―Limiting observable temperature rises of indirectly
cooled salient-pole synchronous generators and generator/motors for hydraulic turbine
applications ―are given in Table 6 of ANSI C50.12. Note the allowable observable
temperature rise for Class B insulation is 85 degrees C, and for Class F insulation is 105
degrees C based on an ambient temperature of 40 degrees C.
Generator shaft vibration is a measure of performance and reliability. Vibration
measurements may include shaft displacement (x and y) at selected elevations along the axis
of the shaft. A vibration monitoring system should be installed with unit alarm and trip
values set based on operating experience and manufacturers‘ recommendations.
4.2 Data Analysis
Generator IEEE 115 test data is typically evaluated against the IPL test data and
manufacturers calculated data. It is typically very difficult to obtain test data at the rated
MVA, KV and PF conditions. Therefore, the test losses at lower ratings are extrapolated to
the machine rated values.
Trend analysis of bearing temperatures, generator vibrations and oil sample data will be
necessary to reasonably establish the bearing CPL. These analyses should compare results to
previous or test data from commissioning of the unit (IPL). This data can be compared to
OEM data if available for bearing losses, operating temperatures and potential failures.

HAP – Best Practice Catalog – Generator
Rev. 1.0, 12/20/2011 238
4.3 Integrated Improvements
The use of periodic IEEE 115 test may be used to update the unit operating characteristics
and limits. This also provides data to evaluate the stator/rotor condition. Optimally the heat
run data obtained would be integrated into an automatic system (e.g., Automatic Generation
Control), but if not, hard copies of the curves and limits should be made available to all
involved personnel.
5.0 Information Sources
Baseline Knowledge:
Liwschitz-Garik, M., Whipple C., Electric Machinery Vol.1 Fundamentals and D.C.
Machines - Third Printing July 1947
Chapman, Alan J., Heat Transfer - Third Edition, Macmillan Publishing 1974
Buffalo Forge Company, Fan Engineering - Eighth Edition 1983
Walker, John, Large Synchronous Machines Design Manufacture and Operation -
Clarendon Press Oxford 1981
TVA, Design of Projects Technical Report No. 24 Electrical Design of Hydro Plants
Electric Power Research Institute, Handbook to Assess the Insulation Condition of Large
Rotating Machines, EPRI EL-5036, Volume 16, June 1989.
State of the Art:
Sumereder, C., Muhr, M., Korbler, B., Life Time Management of Power Transformers - Graz
University of Technology – Austria TUG Sumereder A1 Session 1, Paper No. 35-1
Fenwick, G.T., Generator Air Cooler Design and Selection for Optimum Performance,
Upgrading and Refurbishing Hydro Plants - Unifin Corporation October 29,1991
Lehoczky, K. N., Generator Life Expectancy Extension and Increased MVA Output through
Three-Dimensional Cooling Design - HydroVision 94 Conference, Phoenix, Arizona.
Standards:
IEEE 115, Guide, Test Procedures for Synchronous Machines
IEC 32, Part 2 International Electro Technical Commission Methods of Determining Losses
and Efficiency Of Rotating Electrical Machinery from Test (Excluding Machines for
Traction Vehicles) Measurement of Losses by the Calorimetric Method
ANSI C50.10 American National Standard: Rotating Electrical Machinery - Synchronous
Machines
ANSI, C50.12 – IEEE Standard for Salient-Pole 50Hz and 60 Hz Synchronous Generators
and Generator/Motors for Hydraulic Turbine Applications Rated 5 MVA and Above

HAP – Best Practice Catalog – Generator
Rev. 1.0, 12/20/2011 239
IEEE, 1 - Recommended Practice — General Principles for Temperature Limits in the Rating
of Electrical Equipment and for the Evaluation of Electrical Insulation
IEEE, STD 492 Guide for Operation and Maintenance of Hydro-Generators
ANSI/IEEE Std 1010-1987 An American National Standard IEEE Guide for Control of
Hydroelectric Power Plants
Recommended Practice for Testing Insulation Resistance of Rotating Machinery, IEEE Std
43, 2000.
American National Standard for Rotating Electrical Machinery - Synchronous Machines,
ANSI C50.10.
ISO 7919 Mechanical Vibrations on Non Reciprocating Machines Measurements on Rotating
Shafts and Evaluation Part 5 Guidelines for Hydraulic Machine Sets
ORNL et al, HAP Condition Assessment Manual, October, 2011
IEEE, STD C62.92.2, Guide for the Application of Neutral Grounding in Electric Utility
Systems : Part II – Grounding of Synchronous Generator Systems
Best Practice Catalog
Main Power Transformer
Revision 1.0, 12/08/2011

HAP – Best Practice Catalog – Main Power Transformer
Rev. 1.0, 12/08/2011 241
1.0 Scope and Purpose ........................................................................................................... 242
1.1 Hydropower Taxonomy Position ................................................................................. 242
1.1.1 Main Power Transformer Components .................................................................... 242
1.2 Summary of Best Practices .......................................................................................... 244
1.2.1 Performance / Efficiency & Capability - Oriented Best Practices ........................... 244
1.2.2 Reliability / Operations & Maintenance - Oriented Best Practices .......................... 244
1.3 Best Practice Cross-references ..................................................................................... 245
2.0 Technology Design Summary .......................................................................................... 245
2.1 Material and Design Technology Evolution ................................................................ 245
2.2 State of the Art Technology ......................................................................................... 247
3.0 Operation & Maintenance Practices ................................................................................ 248
3.1 Condition Assessment .................................................................................................. 248
3.2 Operations .................................................................................................................... 250
3.3 Maintenance ................................................................................................................. 251
4.0 Metrics, Monitoring and Analysis ................................................................................... 254
4.1 Measures of Performance, Condition, and Reliability ................................................. 254
4.2 Integrate Improvements................................................................................................ 255
5.0 Information Sources: ........................................................................................................ 256

HAP – Best Practice Catalog – Main Power Transformer
Rev. 1.0, 12/08/2011 242
1.0 Scope and Purpose
This best practice for the Main Power Transformer (MPT) discusses design components,
condition assessment, operations, and maintenance best practices with the objective to maximize
overall plant performance and reliability.
The primary purpose of the main power transformer is to step up the generator output to a higher
voltage for efficient transmission of energy. The MPT is a critical component of any generation
station. As the MPT connects the generator to the transmission grid, the output of the generator is
directly dependent on the availability and operational status of the transformer. Thermal and
electrical limits of the transformer must be considered in the plant operation. Proper design,
operation, and maintenance are required to provide the utmost efficiency, performance and
reliability of the hydro unit.
1.1 Hydropower Taxonomy Position
Hydropower Facility → Powerhouse → Power Train Equipment → Transformer
1.1.1 Main Power Transformer Components
The components of the MPT related to performance and reliability consist of a core,
windings, dielectric insulation system, bushings, and external cooling system.
Core: The core functions to provide an optimal path for the magnetic flux and
efficiently magnetically couple the windings. The core of a transformer is comprised
of thin magnetic laminations stacked together and tightly clamped into place by a
steel clamping structure. Cores can be designed as either single phase or three phase
configurations depending on capacity and user requirements.
Windings: The windings function as the conducting circuit for the transformer and
consist of turns of insulated wire or cable which are placed around the magnetic core.
A primary and a secondary winding are used in a typical two-winding MPT. The
alternating current that flows through the primary winding establishes a time-varying
magnetic flux, some of which links to the secondary winding and induces a voltage
across it. The magnitude of this voltage is proportional to the ratio of the number of
turns on the primary winding to the number of turns on the secondary winding. This
is known as the ―turns ratio.‖ By operating at higher voltages electric power can be
transmitted more efficiently.
Dielectric Insulation System: The electric insulation system consists of both solid
and liquid dielectric materials. The purpose of this system is to insure that the
windings, conductors, and core remain electrically insulated from one another and
from ground potential. The solid dielectric insulation system consists of various
materials including electrical grade cellulose, Nomex®, pressboard, wood, and
insulating varnishes and films. The liquid insulation consists of an insulating fluid,
normally a highly processed mineral oil, which provides the dielectric properties
required as well as serving as the cooling medium for the transformer.
HAP – Best Practice Catalog – Main Power Transformer
Rev. 1.0, 12/08/2011 243
Bushings: The function of the bushings is to provide a path for current flow from the
windings inside the transformer to external connections while maintaining the
dielectric integrity of the voltage-to-ground clearance required. A central conductor
passes through an insulator which can consist of porcelain, resin, or polymer material.
The inside of the bushing may contain paper and foil layers, film, or ink to create a
low value capacitance to grade the voltage between the conductor and ground. These
bushings are usually filled with insulating oil and are known as capacitor type
bushings. Lower voltage bushings may consist of only a central conductor and an
insulator.
External Cooling System: The purpose of the external cooling system is to remove
the heat generated by power losses within the transformers and maintain operation
within design temperature parameters. The removal of heat protects the windings,
core, and dielectric system from thermal degradation. The external cooling system
can be comprised of radiators, coolers, fans, motor driven pumps, and/or water cooled
heat exchangers based on the design and capacity requirements of the transformer.
Non-performance, but reliability related components of a MPT include the tank, oil
preservation system, and controls/protective devices.
Tank: The purpose of the tank is to provide a sealed container to house the core,
winding assembly and the insulating fluid. The tank is usually made of welded steel
construction and is provided with removable inspection covers. The bushings are
mounted to the tank for electrical connection to the transformer windings. Auxiliary
equipment such as controls, protective devices, and cooling systems are usually
attached to the tank.
Oil Preservation System: The purpose of the oil preservation system is to prevent
moisture, atmospheric air, and other contaminates from entering into the tank and
contaminating the insulating system. This minimizes oxidation and deterioration of
the dielectric insulation system both chemically and electrically. There are various
types of oil preservation systems including gas sealed, pressurized inert gas sealed,
free breathing, and sealed conservator type systems.
Controls/Protective Devices: The purpose of the controls is to provide for operation
and protection of the auxiliary equipment required for the transformer.
Instrumentation is also part of the control system. They provide for manual and
automatic control of the equipment, monitoring of temperatures, trip and alarm
functions, and power supply transfers. The controls are usually housed in a cabinet
mounted to the transformer. The protective devices can vary based on the user’s
specifications and include such items as pressure relief devices, rapid rise fault
pressure relays, temperature indicators, and lock out systems for tap changers.
HAP – Best Practice Catalog – Main Power Transformer
Rev. 1.0, 12/08/2011 244
1.2 Summary of Best Practices
1.2.1 Performance / Efficiency & Capability - Oriented Best Practices
Routine testing to verify performance within the original design criteria and
factory test baseline data.
Real-time monitoring and analysis of transformer performance at Current
Performance Level (CPL) to detect and mitigate deviations from design
parameters for the Installed Performance Level (IPL) due to system degradation,
thermal issues, or malfunction of instrumentation.
Periodic comparison of the CPL to the Potential Performance Level (PPL) to
trigger feasibility studies of major upgrades or replacement opportunities.
Maintain documentation of IPL and update if major modifications are performed
(e.g., winding replacement, cooling system upgrades, oil reclamation).
Periodic comparison of the CPL to the IPL to monitor deterioration and trigger
maintenance or repair. This is especially important regarding routine field
electrical test results.
Trend transformer performance and test data for early detection of deterioration,
contamination, thermal degradation, and incipient faults.
Include industry acknowledged choices and experience for transformer design,
replacement components, and maintenance practices to plant engineering
standards.
1.2.2 Reliability / Operations & Maintenance - Oriented Best Practices
Establish a comprehensive dissolved gas-in-oil analysis (DGA) testing program to
monitor the internal health of the transformer. Accurate analysis and trending of
analytical data can provide early detection of thermal and electrical incipient
faults and allow for intervention and mitigation measures.
Maintain an insulating oil quality testing program to monitor the chemical and
electrical condition of the insulating fluid. Degradation of the insulating fluid
leads to degradation of the solid insulation system which can lead to failure. The
life of the insulation system is the life of the transformer.
Implement a routine electrical testing program and track and trend critical data.
Establish action limits to correct defects found prior to placing the transformer
back in-service.
Insure operation of the MPT within its design voltage limits, typically 105%
maximum to avoid damaging over-excitation issues. Adequate voltage taps should
be provided to adjust to any feasible system condition to prevent this situation.
Operate the transformer within its thermal design limits to prevent accelerated
thermal aging and damage to the insulation system and bushings.

HAP – Best Practice Catalog – Main Power Transformer
Rev. 1.0, 12/08/2011 245
Investigate all oil or nitrogen leaks and determine the need and priority for repair.
Maintain the cooling and oil preservation system with a preventative maintenance
program as these systems protect the transformer from damaging heat, moisture,
and atmospheric air.
Trend bushing condition and replace when significant deterioration is indicated by
comparing all test values to individual bushing nameplate data.
Recondition or reclaim insulating oil when trend analysis indicates need.
Test and calibrate controls and indicating devices and upgrade when required.
Insure availability of on-site or system wide spare transformer(s) and spare parts
to reduce the forced outage time incurred with a failure.
Monitor for trends of deteriorating condition of the transformer (decrease in
Condition Indicator (CI)) and decrease in reliability (an increase in Equivalent
Forced Outage Rate (EFOR), a decrease in Effective Availability Factor (EAF).
Adjust maintenance and capitalization programs to correct deficiencies.
1.3 Best Practice Cross-references
I&C - Automation Best Practice
2.0 Technology Design Summary
2.1 Material and Design Technology Evolution
Transformers have changed very little since their inception with regard to their functionality.
The principal change is the efficiency and performance of modern core designs and improved
windings and insulation materials. Modern transformers are smaller, have higher thermal
limits and fewer losses than the older transformer fleet. Advancements in core materials,
winding design and maintenance innovations have improved efficiency and reliability
significantly.
Performance levels for MPT designs can be stated at three levels as follows:
The Installed Performance Level (IPL) is described by the transformers performance
characteristics at the time of installation. These may be determined from factory
reports and baseline field test comparisons performed prior to initially placing the
transformer in-service.
The Current Performance Level (CPL) is determined by an accurate analysis of the
transformers operating characteristics. These would include thermal performance at
full load as well as component condition or test deviations discovered.
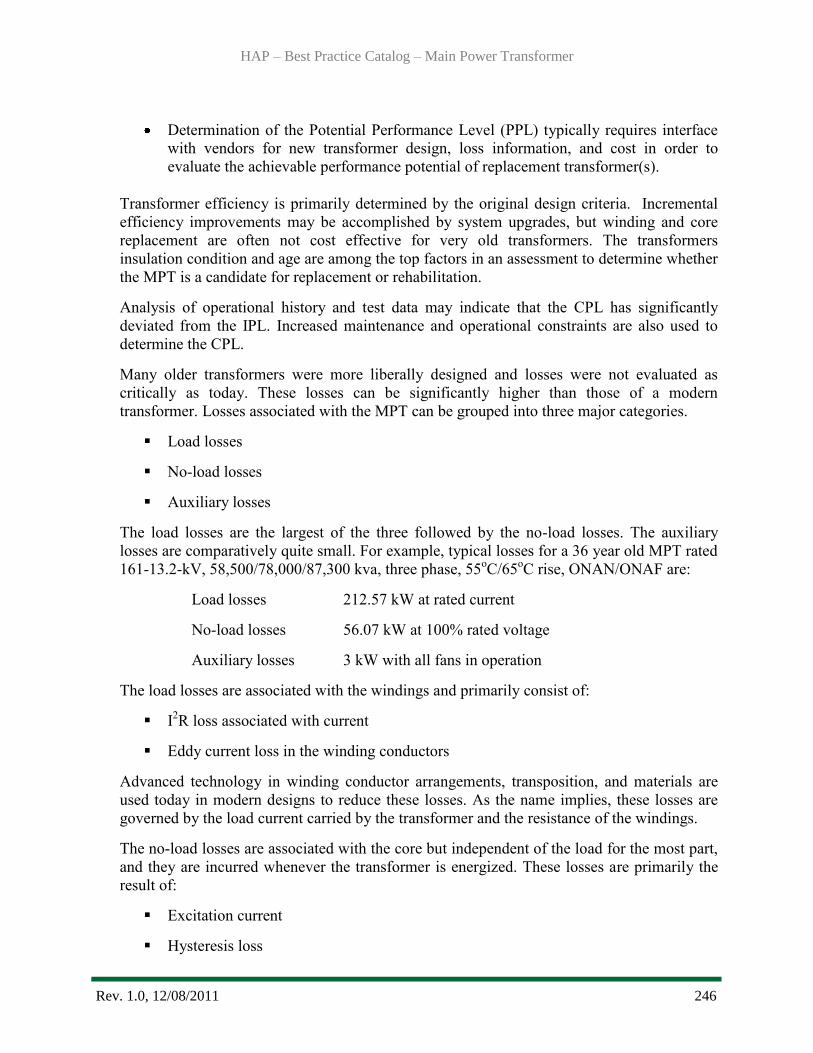
HAP – Best Practice Catalog – Main Power Transformer
Rev. 1.0, 12/08/2011 246
Determination of the Potential Performance Level (PPL) typically requires interface
with vendors for new transformer design, loss information, and cost in order to
evaluate the achievable performance potential of replacement transformer(s).
Transformer efficiency is primarily determined by the original design criteria. Incremental
efficiency improvements may be accomplished by system upgrades, but winding and core
replacement are often not cost effective for very old transformers. The transformers
insulation condition and age are among the top factors in an assessment to determine whether
the MPT is a candidate for replacement or rehabilitation.
Analysis of operational history and test data may indicate that the CPL has significantly
deviated from the IPL. Increased maintenance and operational constraints are also used to
determine the CPL.
Many older transformers were more liberally designed and losses were not evaluated as
critically as today. These losses can be significantly higher than those of a modern
transformer. Losses associated with the MPT can be grouped into three major categories.
Load losses
No-load losses
Auxiliary losses
The load losses are the largest of the three followed by the no-load losses. The auxiliary
losses are comparatively quite small. For example, typical losses for a 36 year old MPT rated
161-13.2-kV, 58,500/78,000/87,300 kva, three phase, 55oC/65
oC rise, ONAN/ONAF are:
Load losses 212.57 kW at rated current
No-load losses 56.07 kW at 100% rated voltage
Auxiliary losses 3 kW with all fans in operation
The load losses are associated with the windings and primarily consist of:
I2R loss associated with current
Eddy current loss in the winding conductors
Advanced technology in winding conductor arrangements, transposition, and materials are
used today in modern designs to reduce these losses. As the name implies, these losses are
governed by the load current carried by the transformer and the resistance of the windings.
The no-load losses are associated with the core but independent of the load for the most part,
and they are incurred whenever the transformer is energized. These losses are primarily the
result of:
Excitation current
Hysteresis loss

HAP – Best Practice Catalog – Main Power Transformer
Rev. 1.0, 12/08/2011 247
Eddy currents
The auxiliary losses are associated primarily with the cooling system and are incurred by the
pump motors and fan motors and are usually negligible in comparison to load and no-load
losses.
2.2 State of the Art Technology
More efficient material and manufacturing techniques have been developed over the years to
reduce the no-load losses. Modern transformer designers can utilize various grades of steel
for the core laminations. Fabrication techniques such as laser etching were not available
years ago. Improved core assembly and configuration processes are also utilized in modern
transformers. Figure 1 shows an example of a modern core in a manufacturing facility.
Figure 2 illustrates a 3-phase winding assembly before installation in the tank.
Advancements in instrumentation and controls can now provide for more efficient and
reliable monitoring of the transformer and associated systems. These include fiber optics for
actual winding conductor temperature, bearing wear monitors for motor driven oil pumps,
partial discharge probes, and on-line bushing monitors.
Replacement of aged MPT’s with modern state of the art designs may result in significant
reduction of losses as compared to those of 40-50 year old transformers. The cost savings
should be considered for the life cycle of a new transformer and decisions should not be
based solely on initial costs. Additionally, establishing partnering agreements with
manufacturers and developing standardized designs can result in substantial cost savings in
the purchase cost of replacement transformers and reduce inventory of spare parts.
Figure 22: Modern Core during Manufacturing

HAP – Best Practice Catalog – Main Power Transformer
Rev. 1.0, 12/08/2011 248
Figure 2: Three Phase Winding Assembly
3.0 Operation & Maintenance Practices
3.1 Condition Assessment
Once the MPT is properly assembled, oil filled, and energized, its life cycle begins. A
reliable life cycle is determined by how well the MPT is operated, maintained, and protected
from faults. Reliability and loss prevention of the IPL and CPL are directly related to proper
operation and maintenance of the MPT.
In order to provide for a representative condition assessment of the MPT, the first step is
information gathering. Initial data includes: DGA, oil quality, factory tests, routine
electrical tests, thermographic tests, operational history, maintenance history, and fault
history. Component failure and replacement as well as any major upgrades or repairs is
important information to review. Interviews with maintenance personnel can provide
excellent information on current and past issues. Depending of the frequency of test cycles, it
may be useful to review the last 15-20 years of test results and history. The quality of the
data directly relates to the quality of the condition assessment. Trending and analysis of all
data sources are performed to determine past experience and current health of the MTP.
DGA data is one of the most valuable diagnostics for determination of the internal health of
the transformer. Overheating of the oil and cellulose, partial discharge, sparking/arcing, and
decomposition of cellulose materials can be monitored, detected, and trended to reflect
internal reactions occurring within the transformer.
The quality of the oil and its maintenance plays an important part in the life of the insulation
system. Insulating oil degrades in time and the degradation by-products can have a
considerable negative effect on the paper insulation. Accelerated aging and loss of insulation
strength can occur if the oil is not properly maintained. Periodic analysis of the oil quality
tests data detects adverse conditions and allows for planned oil maintenance when required.
Various electrical tests can validate the integrity of the MPT. Insulation power factor tests
can assist in determination of the winding insulation as well as that of the bushings. Winding
resistance tests can detect problems in tap changer contacts, poor connections (bolted or
brazed) and broken conductor strands within the windings. Analysis of electrical test data is

HAP – Best Practice Catalog – Main Power Transformer
Rev. 1.0, 12/08/2011 249
an important tool to assist in determination of the transformers electrical integrity. Trending
of the test results is invaluable in determining the degree and rate of degradation.
Thermographic inspections and analysis can provide a wealth of information ranging from
low oil levels and overheating in bushings and connections to component malfunction such
as poor heat transfer in radiators and coolers. A thorough review of thermal data provides yet
another tool for condition assessment. Figure 3 is an example of a thermographic image.
Figure 23: Thermographic Image Showing Low Oil Level in HV Bushing
The age of the transformer must be considered as it relates to the condition of the insulation
system. In the presence of heat, moisture, and oxygen, all cellulose insulation systems will
deteriorate. The insulation strength will weaken until the system cannot adequately perform
its intended electrical function. Even with excellent maintenance these three entities can be
minimized, but not entirely eliminated. Replacement of the entire insulation system for a 35-
40 year old transformer is not economically feasible. Age plays an important factor in the
condition assessment of MPT’s.
After or during the data process, a physical inspection of the MPT is necessary in order to
form a current impression of the equipment and discover any existing anomalies. Nameplate
information can be obtained during the inspection. A systematic inspection process for the
condition assessment should be performed to include the main tank, cooling system,
bushings, oil preservation system, tap changer, controls, and protective/indicating devices.
Upon completion of the data assessment and physical inspection, a systematic and consistent
approach should be used for each MPT. This allows some prioritization to be assigned to
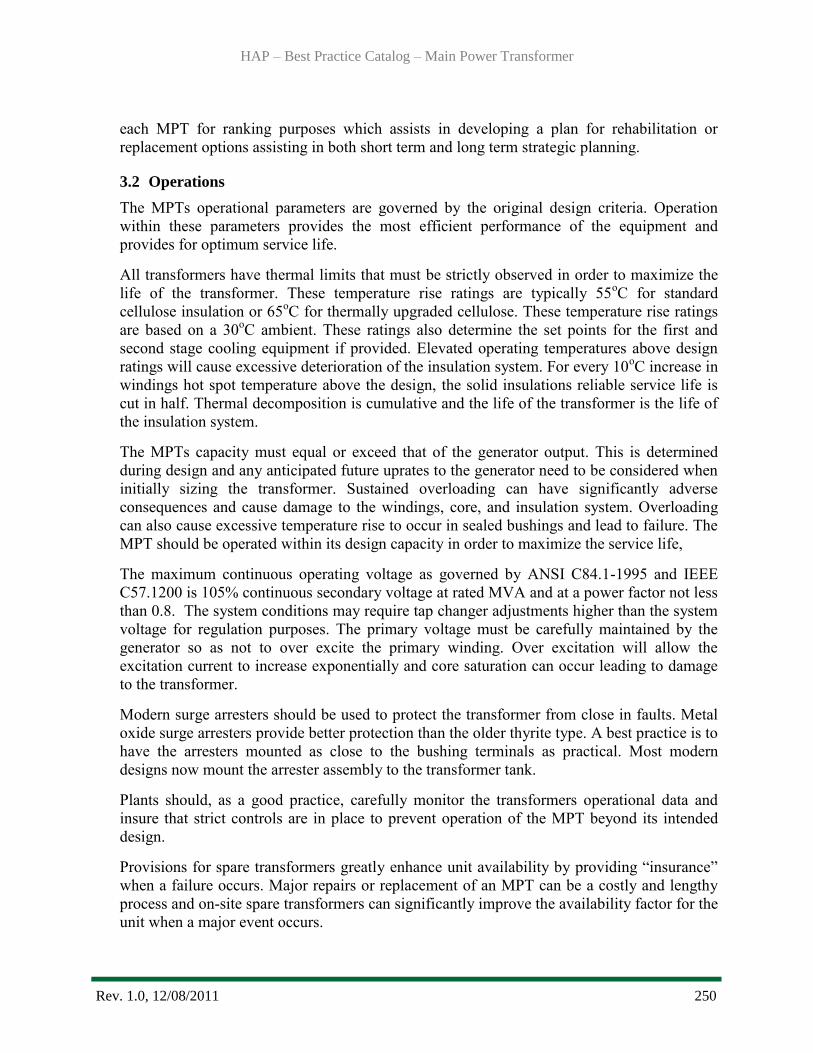
HAP – Best Practice Catalog – Main Power Transformer
Rev. 1.0, 12/08/2011 250
each MPT for ranking purposes which assists in developing a plan for rehabilitation or
replacement options assisting in both short term and long term strategic planning.
3.2 Operations
The MPTs operational parameters are governed by the original design criteria. Operation
within these parameters provides the most efficient performance of the equipment and
provides for optimum service life.
All transformers have thermal limits that must be strictly observed in order to maximize the
life of the transformer. These temperature rise ratings are typically 55oC for standard
cellulose insulation or 65oC for thermally upgraded cellulose. These temperature rise ratings
are based on a 30oC ambient. These ratings also determine the set points for the first and
second stage cooling equipment if provided. Elevated operating temperatures above design
ratings will cause excessive deterioration of the insulation system. For every 10oC increase in
windings hot spot temperature above the design, the solid insulations reliable service life is
cut in half. Thermal decomposition is cumulative and the life of the transformer is the life of
the insulation system.
The MPTs capacity must equal or exceed that of the generator output. This is determined
during design and any anticipated future uprates to the generator need to be considered when
initially sizing the transformer. Sustained overloading can have significantly adverse
consequences and cause damage to the windings, core, and insulation system. Overloading
can also cause excessive temperature rise to occur in sealed bushings and lead to failure. The
MPT should be operated within its design capacity in order to maximize the service life,
The maximum continuous operating voltage as governed by ANSI C84.1-1995 and IEEE
C57.1200 is 105% continuous secondary voltage at rated MVA and at a power factor not less
than 0.8. The system conditions may require tap changer adjustments higher than the system
voltage for regulation purposes. The primary voltage must be carefully maintained by the
generator so as not to over excite the primary winding. Over excitation will allow the
excitation current to increase exponentially and core saturation can occur leading to damage
to the transformer.
Modern surge arresters should be used to protect the transformer from close in faults. Metal
oxide surge arresters provide better protection than the older thyrite type. A best practice is to
have the arresters mounted as close to the bushing terminals as practical. Most modern
designs now mount the arrester assembly to the transformer tank.
Plants should, as a good practice, carefully monitor the transformers operational data and
insure that strict controls are in place to prevent operation of the MPT beyond its intended
design.
Provisions for spare transformers greatly enhance unit availability by providing “insurance”
when a failure occurs. Major repairs or replacement of an MPT can be a costly and lengthy
process and on-site spare transformers can significantly improve the availability factor for the
unit when a major event occurs.
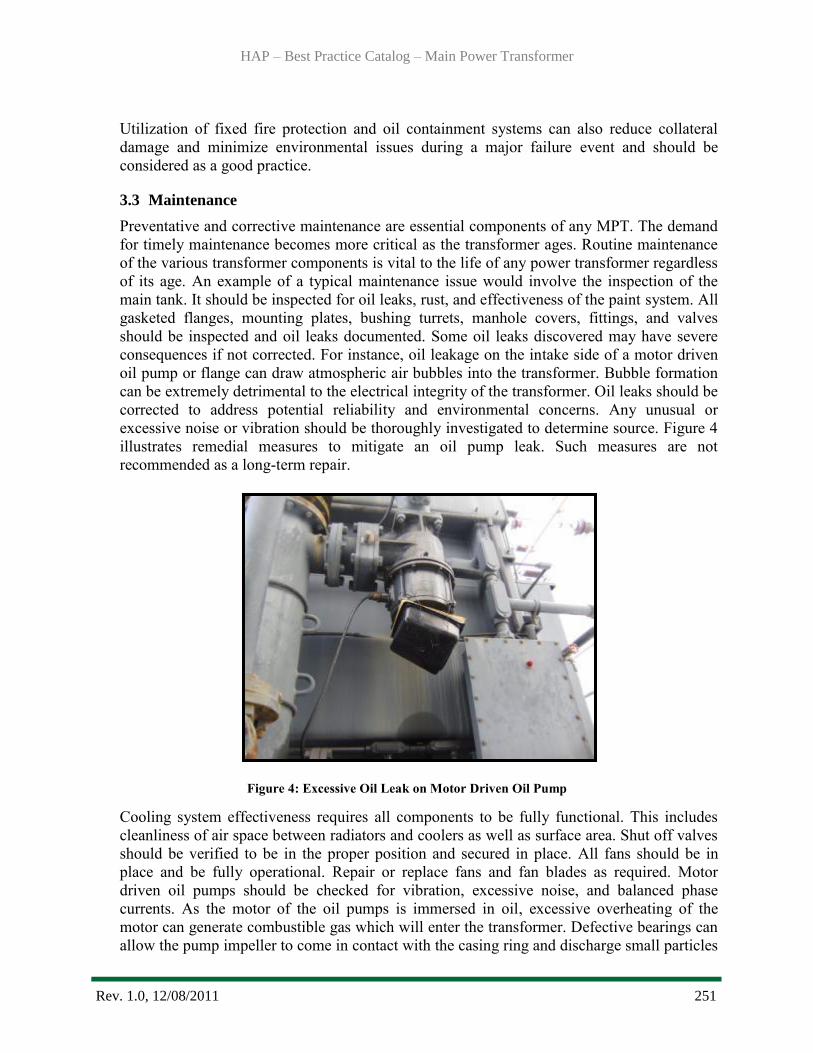
HAP – Best Practice Catalog – Main Power Transformer
Rev. 1.0, 12/08/2011 251
Utilization of fixed fire protection and oil containment systems can also reduce collateral
damage and minimize environmental issues during a major failure event and should be
considered as a good practice.
3.3 Maintenance
Preventative and corrective maintenance are essential components of any MPT. The demand
for timely maintenance becomes more critical as the transformer ages. Routine maintenance
of the various transformer components is vital to the life of any power transformer regardless
of its age. An example of a typical maintenance issue would involve the inspection of the
main tank. It should be inspected for oil leaks, rust, and effectiveness of the paint system. All
gasketed flanges, mounting plates, bushing turrets, manhole covers, fittings, and valves
should be inspected and oil leaks documented. Some oil leaks discovered may have severe
consequences if not corrected. For instance, oil leakage on the intake side of a motor driven
oil pump or flange can draw atmospheric air bubbles into the transformer. Bubble formation
can be extremely detrimental to the electrical integrity of the transformer. Oil leaks should be
corrected to address potential reliability and environmental concerns. Any unusual or
excessive noise or vibration should be thoroughly investigated to determine source. Figure 4
illustrates remedial measures to mitigate an oil pump leak. Such measures are not
recommended as a long-term repair.
Figure 4: Excessive Oil Leak on Motor Driven Oil Pump
Cooling system effectiveness requires all components to be fully functional. This includes
cleanliness of air space between radiators and coolers as well as surface area. Shut off valves
should be verified to be in the proper position and secured in place. All fans should be in
place and be fully operational. Repair or replace fans and fan blades as required. Motor
driven oil pumps should be checked for vibration, excessive noise, and balanced phase
currents. As the motor of the oil pumps is immersed in oil, excessive overheating of the
motor can generate combustible gas which will enter the transformer. Defective bearings can
allow the pump impeller to come in contact with the casing ring and discharge small particles
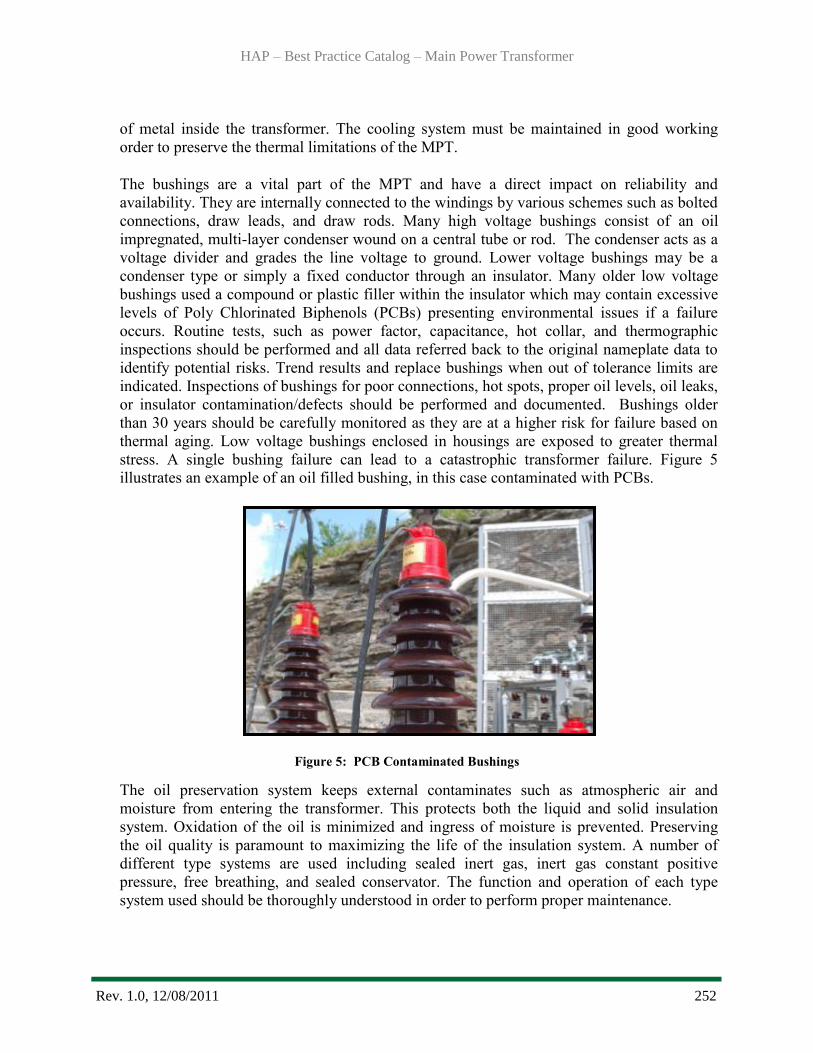
HAP – Best Practice Catalog – Main Power Transformer
Rev. 1.0, 12/08/2011 252
of metal inside the transformer. The cooling system must be maintained in good working
order to preserve the thermal limitations of the MPT.
The bushings are a vital part of the MPT and have a direct impact on reliability and
availability. They are internally connected to the windings by various schemes such as bolted
connections, draw leads, and draw rods. Many high voltage bushings consist of an oil
impregnated, multi-layer condenser wound on a central tube or rod. The condenser acts as a
voltage divider and grades the line voltage to ground. Lower voltage bushings may be a
condenser type or simply a fixed conductor through an insulator. Many older low voltage
bushings used a compound or plastic filler within the insulator which may contain excessive
levels of Poly Chlorinated Biphenols (PCBs) presenting environmental issues if a failure
occurs. Routine tests, such as power factor, capacitance, hot collar, and thermographic
inspections should be performed and all data referred back to the original nameplate data to
identify potential risks. Trend results and replace bushings when out of tolerance limits are
indicated. Inspections of bushings for poor connections, hot spots, proper oil levels, oil leaks,
or insulator contamination/defects should be performed and documented. Bushings older
than 30 years should be carefully monitored as they are at a higher risk for failure based on
thermal aging. Low voltage bushings enclosed in housings are exposed to greater thermal
stress. A single bushing failure can lead to a catastrophic transformer failure. Figure 5
illustrates an example of an oil filled bushing, in this case contaminated with PCBs.
Figure 5: PCB Contaminated Bushings
The oil preservation system keeps external contaminates such as atmospheric air and
moisture from entering the transformer. This protects both the liquid and solid insulation
system. Oxidation of the oil is minimized and ingress of moisture is prevented. Preserving
the oil quality is paramount to maximizing the life of the insulation system. A number of
different type systems are used including sealed inert gas, inert gas constant positive
pressure, free breathing, and sealed conservator. The function and operation of each type
system used should be thoroughly understood in order to perform proper maintenance.
HAP – Best Practice Catalog – Main Power Transformer
Rev. 1.0, 12/08/2011 253
The two most common types of sealed tanks used on modern transformers in the U.S. are
pressurized inert gas sealed and sealed conservator. The inert gas constant positive pressure
sealed system (often referred to as nitrogen blanketed) maintains positive pressure of dry
inert gas, usually nitrogen, above the oil. A nitrogen bottle and regulator system maintains a
positive pressure of 0.5 to 5.0 PSI above the oil. The nitrogen used should meet ASTM D-
1993 Type III with a -59oC dew point as specified in IEEE C-57.12.00. Regular inspection
should be performed of the high pressure gauge, high/low pressure regulators, valves,
pressure vacuum bleeder, and oil sump. Never allow the tank pressure be zero or negative
pressure. The sealed conservator system uses an expansion tank (conservator) which is
mounted above the main tank and maintains the oil at atmospheric pressure. An air cell or
diaphragm is placed inside the conservator which is vented through a silica gel breather. As
the oil in the main tank expands and contracts within the conservator, the transformer
“breathes” to atmosphere via the breather. The air cell or diaphragm serves as a barrier and
prevents any external air or other contaminates from coming into contact with the oil. The
silica gel breather dries the air entering the conservator and the indicating silica gel should be
inspected regularly and the desiccant replaced when approximately one-half of the material
changes color. The inspection port on top of the conservator should be removed every 5-6
years and the inside of the air cell or diaphragm inspected. If any oil is observed, a leak has
developed, and the cell or diaphragm must be replaced. The quality of the insulating oil is
highly dependent on proper maintenance of this system.
The quality of the insulating oil affects the health and life of the MPT. This highly processed
mineral oil must be maintained or reduction in the dielectric strength and accelerated aging
will be experienced by the insulation system. It is imperative that an aggressive oil testing
program be in place for testing the chemical and electric characteristics of the oil. Standard
tests and criteria are recommended and listed in IEEE C57.106. By performing trend analysis
of the data, planned corrective action can by implemented before significant deterioration
occurs. Many additional tests can be performed such as particle count, dissolved metals,
oxidation inhibitor, and corrosive sulfur to further refine the assessment of the oil and
determine the maintenance techniques required. All oil will degrade over time. However,
early detection of degradation allows for treatment of the oil in the field. Reconditioning of
the oil will remove moisture, gases, and most particulates from the oil. Reclamation of the oil
removes moisture, aging by-products, gases and particulates from the oil. Oil reclamation can
return service aged oil to a pristine condition and may be both technically and economically a
best practice for large MPTs. If additives for inhibited oil and passivators for corrosive
sulphur mitigation are used, they are sacrificially consumed over time and must be
replenished.
The controls, indicators, and protective devices are usually mounted on the main tank. The
control cabinet contains power supply transfer components, breakers, relays, switches,
controls and terminal blocks for the auxiliary equipment for the transformer. The cabinet
should be provided with weather tight seals and a strip heater to prevent condensation.
Routine inspections should be performed to check for corrosion, water leakage, and
component function. Thermographic inspections should be performed to check for poor
connections and overheating of wiring and components. Oil flow and oil level indicators
should be checked for proper operation including alarm contacts. Pressure relief devices
HAP – Best Practice Catalog – Main Power Transformer
Rev. 1.0, 12/08/2011 254
(PRD) are mounted on the transformer tank and are a last defense to attempt to mitigate a
tank rupture under major fault conditions and should be routinely inspected. When replacing
these devices, verify the correct pressure setting of the PRD required since various pressure
settings are available. Top oil temperature indicators provide remote monitoring and alarms
functions and should be regularly tested and calibrated. Winding (hot spot) temperature
indicators simulate the calculated hottest spot within the windings. These indicators provide
for monitoring, alarm/trip, and cooling system control functions. Older type indicators are
basically a dial type remote thermometer with set points. Modern electronic control monitors
are available that can provide all functions of the dial types plus additional features for
trending the transformer temperatures. Fiber optics is also available for measuring actual
winding conductor temperatures in lieu of simulated values. Rapid pressure or sudden
pressure relays are normally used on MPTs to provide for rapid tripping of the transformer in
the event of an internal fault. Many utilities have installed redundant relays with two out of
three logic controls to eliminate single point tripping which greatly improves reliability and
availability. All controls, indicators, and protective devices should be regularly inspected,
tested, and calibrated as recommended by manufacturer’s specifications.
An aggressive routine electrical test program should be implemented allowing maintenance
decisions to be data driven. As a minimum, the test program should include the following
tests: winding power factor, bushing power factor and capacitance, bushing hot collar,
winding resistance, excitation, core ground insulation resistance (if external), and insulation
resistance. Thermographic inspections should be included within the test program. All data
analysis should be referred back to base line commission and/or factory and nameplate data.
Additional advanced testing may be performed such as sweep frequency response analysis,
acoustical and partial discharge tests when indicated.
The spare transformer(s) should be maintained in fully operational condition and should
always be immediately available. Components should not be removed and used as spare parts
for other MPTs. When the spare is needed, it is usually installed under tight time constraints.
Routine testing and inspections should be performed in the same manner as an operating
transformer. Adequate critical spare parts such as bushings should be immediately available.
4.0 Metrics, Monitoring and Analysis
4.1 Measures of Performance, Condition, and Reliability
The fundamental efficiency of a main power transformer and associated losses is described
below.
Where: · TL is the total loss for the transformer (Watts)
· NL is the no-load loss at rated voltage (Watts)
· LL is the load loss at rated current (Watts)
· AL is the sum of the auxiliary losses (Watts)
· OP is the output of the transformer (Watts)
· VA is the rated capacity of the transformer (Volt-ampere)
· PF is the power factor of the secondary load
HAP – Best Practice Catalog – Main Power Transformer
Rev. 1.0, 12/08/2011 255
Total transformer losses are: TL = NL + LL + AL
Transformer output is then expressed as: OP = VA * %PF
Transformer efficiency is given by: %Efficiency = (OP / (OP + TL)) * 100
The condition of the MPT can be assessed by the Condition Indicator (CI) as defined
according to HAP Condition Assessment Manual, ORNL, October 2011.
Industry reliability and availability statistics can be monitored and compared to unit
performance by use of the North American Electric Reliability Corporation’s (NERC)
performance indicators, such equivalent availability factor (EAF) and equivalent forced
outage factor (EFOR). These are universally used by the power industry. Many utilities
supply data to the Generating Availability Data System (GADS) maintained by NERC. This
database of operating information is used for improving the performance of electric
generating equipment. It can be used to support equipment reliability and availability
analyses and decision-making by GADS data users.
Data Analysis of test data can be performed with the assistance and guidelines provided by
various standards and guidelines related to specific analysis required. IEEE C57.104 and
C57.106 standards provide information for testing and analysis of insulating oil. Various
ASTM standards provide testing procedures and methodology. Several companies offer
valuable electrical testing, oil analysis and investigation resources and provides assistance on
interpretation and analysis techniques. Many vendor and reference materials are also
available on all aspects of power transformers.
Determine the MPTs existing capabilities (CPL) and compare results to previous or original
test data (IPL). Assess the efficiency, reliability, capacity needs, transformer energy losses,
and revenue loss. Compare results to new MPT design data (from transformer manufacturer),
and determine potential efficiency, capacity, annual energy loss savings, and revenue gain
(PPL). For the latter, calculate the installation/rehabilitation cost and internal rate of return to
determine major upgrade or replacement justification.
The condition assessment of the MPT is quantified through the CI as derived according to
HAP Condition Assessment Manual, ORNL, October 2011. The overall CI is a composite of
the CI derived from each component of the transformer. This methodology can be applied
periodically to monitor existing transformer and can be monitored and analyzed over time to
determine condition trends that can impact performance and reliability.
The reliability of a unit as judged by its availability to generate can be monitored through
reliability indexes or performance indicators as derived according to NERC’s Appendix F,
Performance Indexes and Equations.
4.2 Integrate Improvements
The periodic field test results should be used to update the unit performance characteristics
(CPL). These can be integrated into computer programs to provide on-line analysis results
HAP – Best Practice Catalog – Main Power Transformer
Rev. 1.0, 12/08/2011 256
and anomalies to all involved personnel. Parameters can be established to trigger various
maintenance or immediate action activities as required. Data trends allow predictive
maintenance to be performed in lieu of reactive maintenance.
As the condition of the MPT changes over time, the CI and reliability indexes are trended
and analyzed. Using this data, projects can be ranked and justified in the maintenance and
capital programs to return the transformer to an acceptable condition and performance level
or indicate the need for replacement for long term reliability and unit performance.
5.0 Information Sources:
Baseline Knowledge:
US Corps of Engineers, Hydro Plant Risk Assessment Guide, September 2006
USBR, FIST Volume 3-30, Transformer Maintenance, October 2000
Transformers for the Electric Power Industry, McGraw-Hill Book Company, 1959
Transformer Maintenance Guide, Transformer Maintenance Institute, 2001
EPRI, Increased Efficiency of Hydroelectric Power, EM 2407, June 1992
Hydro Life Extension Modernization Guide, Volume 4-5 Auxiliary Mechanical and Electrical
Systems, EPRI, Palo Alto, CA: 2001. TR-112350V4.
State of the Art
ABB, Service Handbook for Power Transformers, TRES – Transformer Remanufacturing
and Engineering Services, North America, January 2006
CIGRE WG12, 18, Report on Transformer Life Assessment, 2003
ORNL, HAP Condition Assessment Manual, October, 2011
Doble Client Committee on Circuit-Breakers and Bushings, Bushing Field Test Guide,
Document BG661
Standards:
IEEE C57.104 – 2008, Guide for Interpretation of Gases in Oil-Immersed Transformers
IEEE C57.106 – 2006, Guide for Acceptance and Maintenance of Insulating Oil in
Equipment
IEEE C57.12.10, Standard Requirements for Liquid-Immersed Power Transformers
IEEE C57.91, Guide for Loading Mineral-Oil Immersed Transformers

Best Practice Catalog
Excitation System
Revision 1.0, 11/18/2011
HAP – Best Practice Catalog – Excitation System
Rev. 1.0, 12/21/2011 258
1.0 Scope and Purpose ....................................................................................................... 259
1.1Hydropower Taxonomy Position .................................................................................... 259
1.1.1Exciter Components .............................................................................................. 259
1.2 Summary of Best Practices ............................................................................................. 261
1.2.1Performance/Efficiency & Capability - Oriented Best Practices ...................... 261
1.2.2Reliability/Operations & Maintenance - Oriented Best Practices .................... 262
1.3 Best Practice Cross-references ........................................................................................ 263
2.0 Technology Design Summary ...................................................................................... 263
2.1 Material and Design Technology Evolution ................................................................... 263
2.2 State of the Art Technology ............................................................................................ 264
3.0 Operational & Maintenance Best Practices ................................................................. 265
3.1 Condition Assessment..................................................................................................... 265
3.2 Operations ....................................................................................................................... 266
3.3 Maintenance .................................................................................................................... 267
4.0 Metrics, Monitoring and Analysis ............................................................................... 269
4.1 Measures of Performance, Condition, and Reliability .................................................... 269
4.2 Data Analysis .................................................................................................................. 269
4.3 Integrated Improvements ................................................................................................ 270
5.0 Information Sources ..................................................................................................... 270
HAP – Best Practice Catalog – Excitation System
Rev. 1.0, 12/21/2011 259
1.0 Scope and Purpose
This best practice for the excitation system addresses its technology, condition assessment,
operations and maintenance best practices with the objective to maximize performance and
reliability. The primary purpose of the excitation system is to provide a regulated DC current to
the generator rotor to induce and maintain a voltage in the stator at a set value under normal
operating conditions while varying the generation or absorption of reactive power and supporting
generator terminal voltage under fault conditions. The excitation system must respond to voltage
and frequency excursions and this response must be coordinated with generator capabilities and
protective relay functions to ensure continuous unit reliable generation. Due to its critical nature
the reliability of the excitation system has come under the auspices of the North American
Electric Reliability Corporation (NERC).
1.1 Hydropower Taxonomy Position
Hydro Power Facility → Powerhouse → Power Train Equipment → Exciter
1.1.1Exciter Components
Exciters and excitation systems have evolved from DC generators driven by the shaft of
the generator or by an AC motor to the present solid state systems utilizing diodes or
rectifiers. Many of the original systems are still in service today as a testament to their
simplicity and reliability. The solid state systems may be brushless systems where the
rectification takes place on the rotating shaft and field current is supplied to the rotor
without going through brushes and collector rings. A very basic system is seen in figure
1. Performance and reliability related components of the excitation system include the
low voltage controls, the source of the field current (dependent on the type of excitation
system, i.e. rotating or static), the power source (for a static system), current interruption
or isolation devices (AC or DC field breakers), and the brushes and collector rings /
commutator. For purposes of this BP the excitation system is considered to “end” at the
collector rings or at the point of connection to the rotating field circuit.
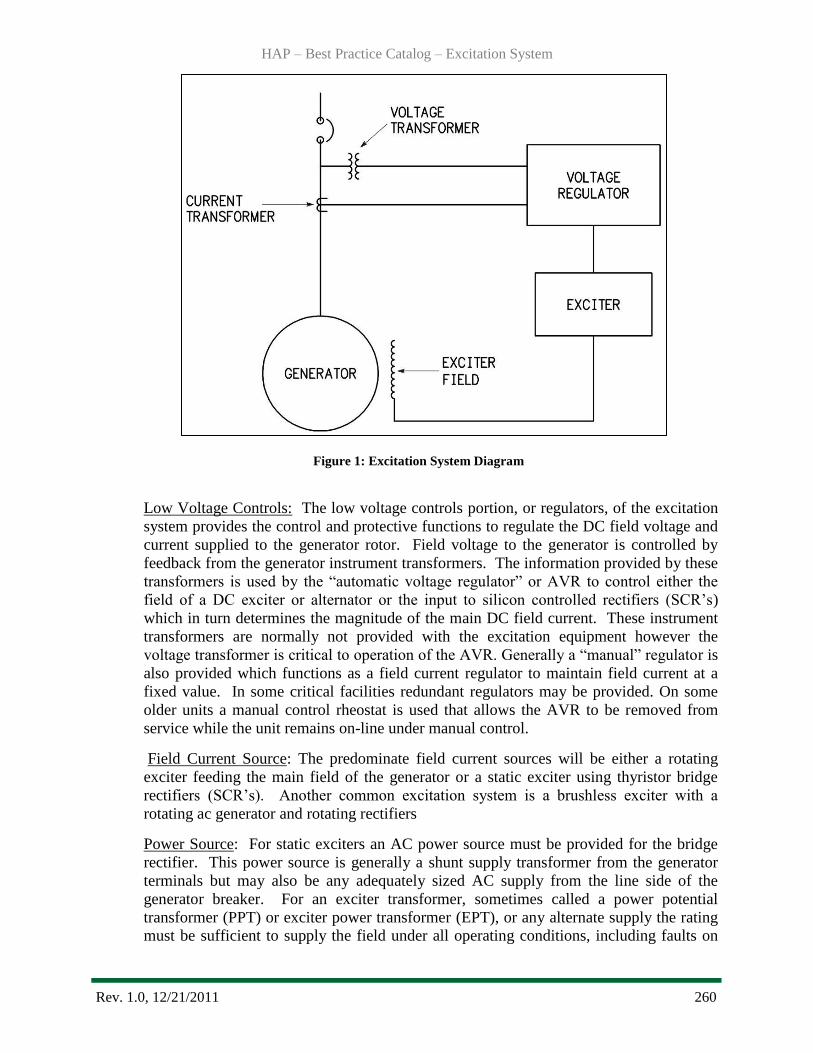
HAP – Best Practice Catalog – Excitation System
Rev. 1.0, 12/21/2011 260
Figure 1: Excitation System Diagram
Low Voltage Controls: The low voltage controls portion, or regulators, of the excitation
system provides the control and protective functions to regulate the DC field voltage and
current supplied to the generator rotor. Field voltage to the generator is controlled by
feedback from the generator instrument transformers. The information provided by these
transformers is used by the ―automatic voltage regulator‖ or AVR to control either the
field of a DC exciter or alternator or the input to silicon controlled rectifiers (SCR‘s)
which in turn determines the magnitude of the main DC field current. These instrument
transformers are normally not provided with the excitation equipment however the
voltage transformer is critical to operation of the AVR. Generally a ―manual‖ regulator is
also provided which functions as a field current regulator to maintain field current at a
fixed value. In some critical facilities redundant regulators may be provided. On some
older units a manual control rheostat is used that allows the AVR to be removed from
service while the unit remains on-line under manual control.
Field Current Source: The predominate field current sources will be either a rotating
exciter feeding the main field of the generator or a static exciter using thyristor bridge
rectifiers (SCR‘s). Another common excitation system is a brushless exciter with a
rotating ac generator and rotating rectifiers
Power Source: For static exciters an AC power source must be provided for the bridge
rectifier. This power source is generally a shunt supply transformer from the generator
terminals but may also be any adequately sized AC supply from the line side of the
generator breaker. For an exciter transformer, sometimes called a power potential
transformer (PPT) or exciter power transformer (EPT), or any alternate supply the rating
must be sufficient to supply the field under all operating conditions, including faults on

HAP – Best Practice Catalog – Excitation System
Rev. 1.0, 12/21/2011 261
the generator terminals or the transmission system when connected, plus any losses in the
conductors, convertor and transformer itself.
For rotating exciters the power source is usually a permanent magnet generator (PMG)
An alternative source of excitation power is a low voltage plant bus. This is not preferred
due to the possibility of harmonic content from the exciter bridge having a deleterious
effect on other equipment powered from the bus. This power source is not considered in
this BP.
Current Interruption Devices : As the field current cannot change instantaneously for a
close-in or internal generator fault fast suppression of the generator field is necessary to
limit damage. As long as the unit is spinning and there is current in the rotor, energy will
be fed to the fault. Depending on the type and vintage of the system a number of methods
are utilized to dissipate and remove this energy. A field discharge resistor in parallel with
the field winding provides a decay path for the field current when the resistor is placed in
the circuit as the result of a unit electrical trip.
For a fully static system, the field voltage may be forced negative to result in rapid de-
excitation.
For almost all systems field energy is dissipated in a field discharge resistor once the field
breaker contacts open or a protective thyristor(s) is gated.
Collector Rings, Commutators, and Brushes : The brushes function to transfer field
current from a stationary component, the brushes and rigging, to a rotating component.
For a rotating exciter, the output of the exciter armature is delivered by the exciter
commutator and brushes to the main generator field collector (or ―slip‖) rings and
brushes
Non-performance but reliability related components of the excitation system include the
instrument transformers used to measure generator voltage and current.
Instrument Transformers, Voltage and Current : As the generator terminal voltage and
currents cannot be directly measured a means for reducing these values to useful levels
for the regulator is required. These transformers are normally not part of the excitation
system regulator ―package‖. Voltage transformers (VT‘s) reduce the generator stator
voltage and current transformers (CT‘s) reduce the generator stator currents to useful
quantities based on their transformation ratios. These transformers are normally housed in
the generator switchgear and the secondary voltages and currents off any VT or CT may
be used by multiple instruments, meters or relays. Inputs from the VT and CT are critical
to both the controlling and protective functions of the regulator.
1.2 Summary of Best Practices
1.2.1Performance/Efficiency & Capability - Oriented Best Practices
Periodic performance testing to establish accurate current unit performance
characteristics and limits.
HAP – Best Practice Catalog – Excitation System
Rev. 1.0, 12/21/2011 262
Dissemination of accurate unit performance characteristics to unit operators,
local and remote control and decision support systems and other personnel and
offices that influence unit operation and performance.
Real-time monitoring and periodic analysis of unit performance at the Current
Performance Level (CPL) to detect and mitigate deviations from expected
performance for the Installed Performance Level (IPL) due to degradation or
component failure.
Periodic comparison of the CPL to the Potential Performance Level (PPL) to
trigger feasibility studies of major upgrades.
Maintain documentation of IPL and update when modification to equipment is
made (e.g., re-insulation of field, exciter replacement).
Trend loss of performance due to degradation of excitation system components.
Such degradation may be indicated by increased excitation current required for a
given load point or increased operating temperatures.
Include industry acknowledged ―up to date‖ choices for excitation system
components and maintenance practices.
1.2.2Reliability/Operations & Maintenance - Oriented Best Practices
For any given load point the power into the exciter should be periodically
measured and trended for degradation. For a static exciter the power into the
exciter is from the PPT (or EPT). In a rotating system exciter field current and
PMG output serve as indicators of power into the system. Shorts (shorted turns)
or open or high resistance circuits in the components providing power to the
exciter will result in increased losses and degraded performance.
The power out of the exciter, i.e. the delivered field current, is determined by the
AVR (or manual regulator). The amount of field current required for any
operating point should be compared to the original manufacturer‘s curves.
The brush rigging and collector commutator assemblies are most critical
reliability components for both static and rotating exciters. The high temperature
environment, brush dust generated and wear of components due to relative
rotating motion dictates increased focus on these areas. Brushes assemblies,
collector rings and commutators should be inspected frequently. Establish a
temperature profile for collector ring/commutator air temperatures. Trend for
degradation and indication of brush/collector/commutator deficiencies. Periodic
infrared inspection of brushes under load can provide an indication of brush
selectivity issues. On higher speed units brush vibration (and attendant wear,
chipping) may be caused by excessive collector ring runout.
Monitor field insulation resistance to ground.
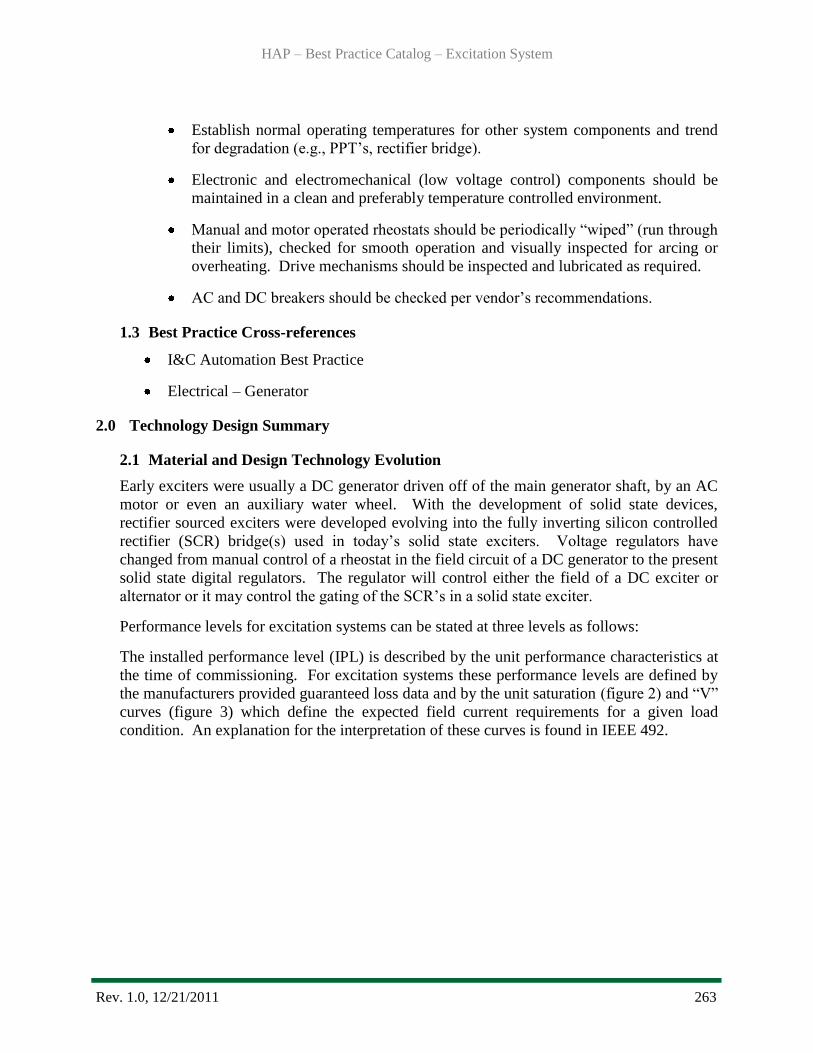
HAP – Best Practice Catalog – Excitation System
Rev. 1.0, 12/21/2011 263
Establish normal operating temperatures for other system components and trend
for degradation (e.g., PPT‘s, rectifier bridge).
Electronic and electromechanical (low voltage control) components should be
maintained in a clean and preferably temperature controlled environment.
Manual and motor operated rheostats should be periodically ―wiped‖ (run through
their limits), checked for smooth operation and visually inspected for arcing or
overheating. Drive mechanisms should be inspected and lubricated as required.
AC and DC breakers should be checked per vendor‘s recommendations.
1.3 Best Practice Cross-references
I&C Automation Best Practice
Electrical – Generator
2.0 Technology Design Summary
2.1 Material and Design Technology Evolution
Early exciters were usually a DC generator driven off of the main generator shaft, by an AC
motor or even an auxiliary water wheel. With the development of solid state devices,
rectifier sourced exciters were developed evolving into the fully inverting silicon controlled
rectifier (SCR) bridge(s) used in today‘s solid state exciters. Voltage regulators have
changed from manual control of a rheostat in the field circuit of a DC generator to the present
solid state digital regulators. The regulator will control either the field of a DC exciter or
alternator or it may control the gating of the SCR‘s in a solid state exciter.
Performance levels for excitation systems can be stated at three levels as follows:
The installed performance level (IPL) is described by the unit performance characteristics at
the time of commissioning. For excitation systems these performance levels are defined by
the manufacturers provided guaranteed loss data and by the unit saturation (figure 2) and ―V‖
curves (figure 3) which define the expected field current requirements for a given load
condition. An explanation for the interpretation of these curves is found in IEEE 492.
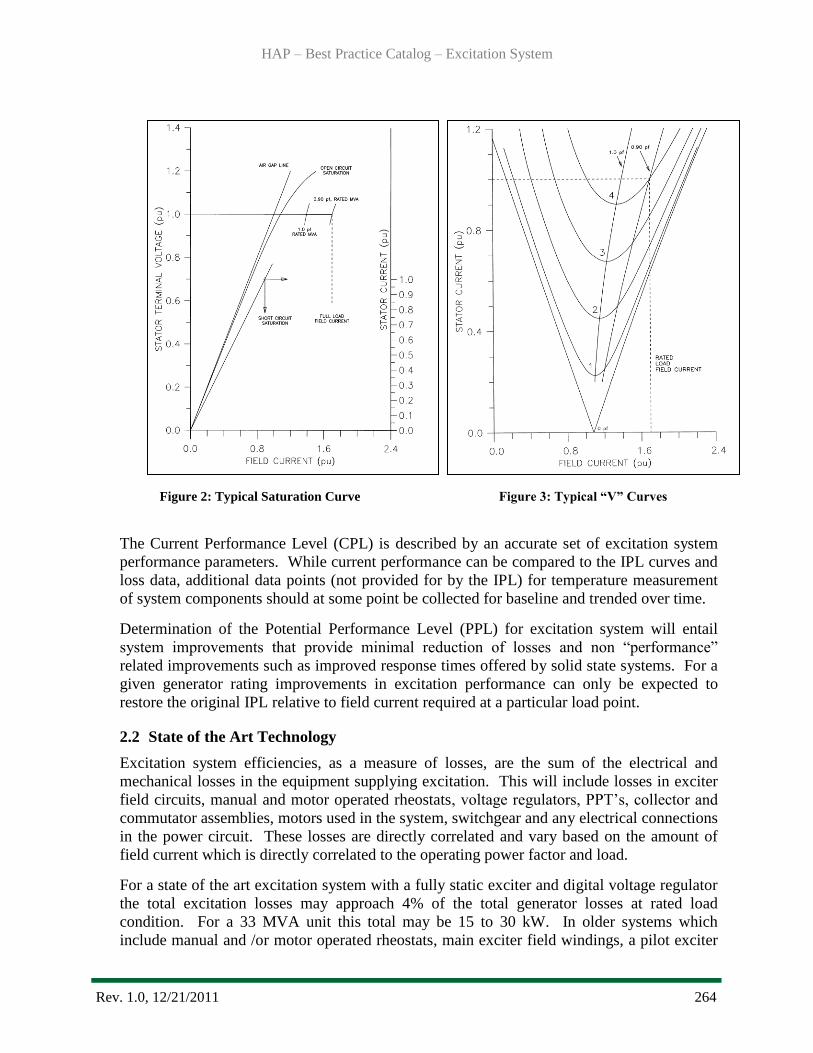
HAP – Best Practice Catalog – Excitation System
Rev. 1.0, 12/21/2011 264
Figure 2: Typical Saturation Curve Figure 3: Typical “V” Curves
The Current Performance Level (CPL) is described by an accurate set of excitation system
performance parameters. While current performance can be compared to the IPL curves and
loss data, additional data points (not provided for by the IPL) for temperature measurement
of system components should at some point be collected for baseline and trended over time.
Determination of the Potential Performance Level (PPL) for excitation system will entail
system improvements that provide minimal reduction of losses and non ―performance‖
related improvements such as improved response times offered by solid state systems. For a
given generator rating improvements in excitation performance can only be expected to
restore the original IPL relative to field current required at a particular load point.
2.2 State of the Art Technology
Excitation system efficiencies, as a measure of losses, are the sum of the electrical and
mechanical losses in the equipment supplying excitation. This will include losses in exciter
field circuits, manual and motor operated rheostats, voltage regulators, PPT‘s, collector and
commutator assemblies, motors used in the system, switchgear and any electrical connections
in the power circuit. These losses are directly correlated and vary based on the amount of
field current which is directly correlated to the operating power factor and load.
For a state of the art excitation system with a fully static exciter and digital voltage regulator
the total excitation losses may approach 4% of the total generator losses at rated load
condition. For a 33 MVA unit this total may be 15 to 30 kW. In older systems which
include manual and /or motor operated rheostats, main exciter field windings, a pilot exciter

HAP – Best Practice Catalog – Excitation System
Rev. 1.0, 12/21/2011 265
and commutators not found in a state of the art system these losses may approach 10%. Here
the value may be 40 to 60 kW. In both cases these IPL values are generally provided as
calculated data by the manufacturer and very difficult to determine empirically as
independent test for the exciter.
The more significant gains as defined by the PPL are in the area of reliability, improved
exciter response time (transmission system stability, minimized fault damage), reduced
maintenance requirements and improved flexibility and integration with modern control and
protection systems. Reduction of losses is not a prime consideration in the decision to replace
an existing system.
3.0 Operation & Maintenance Practices
3.1 Condition Assessment
USACE Hydro Plant Risk Assessment Guide (ref. 1) provides a methodology for assessing
the condition of a system based on its age, operation and maintenance history, availability of
spare parts and service support, and test performed on both the power and control circuitry.
Some of the factors considered in this assessment follow.
The NEMA insulation class ( B, F, H, etc.) will determine the operating temperature limits.
The electrical insulation integrity of this insulation and the system is reduced with increasing
age. All electrical insulation deteriorates over time due to increased exposures to the
cumulative effects of thermal stress and cycling, vibration and mechanical damage, and
deleterious contaminates. Age also determines obsolescence status and availability of vendor
technical support and spare parts. A variety of electrical tests may be performed to aid in
assessing insulation condition.
Obviously, these condition assessment factors are closely related. The evaluation should also
consider the failure and forced outage history. It is likely, however, particularly for older
units, that there may be a lack of history, maintenance records, and design documentation to
supplement the assessment.
Infrared thermography can be used to monitor deterioration of bolted electrical power
connections, collector/commutator performance and rheostat performance.
Winding resistance and system insulation resistance should be measured periodically to
detect deterioration. Field insulation resistance may be continuously monitored on line and
trended.
Brushless systems should be inspected stroboscopically for blown fuses if applicable. In
some cases a blown fuse can cause a cascading overload of remaining fuses.
Collector ring/commutator and brush rigging condition should be evaluated. Ring film
condition, commutator condition and overall cleanliness have a significant effect on
reliability. A typical collector ring, brush rigging assembly, commutator assembly is seen in
figure 4.
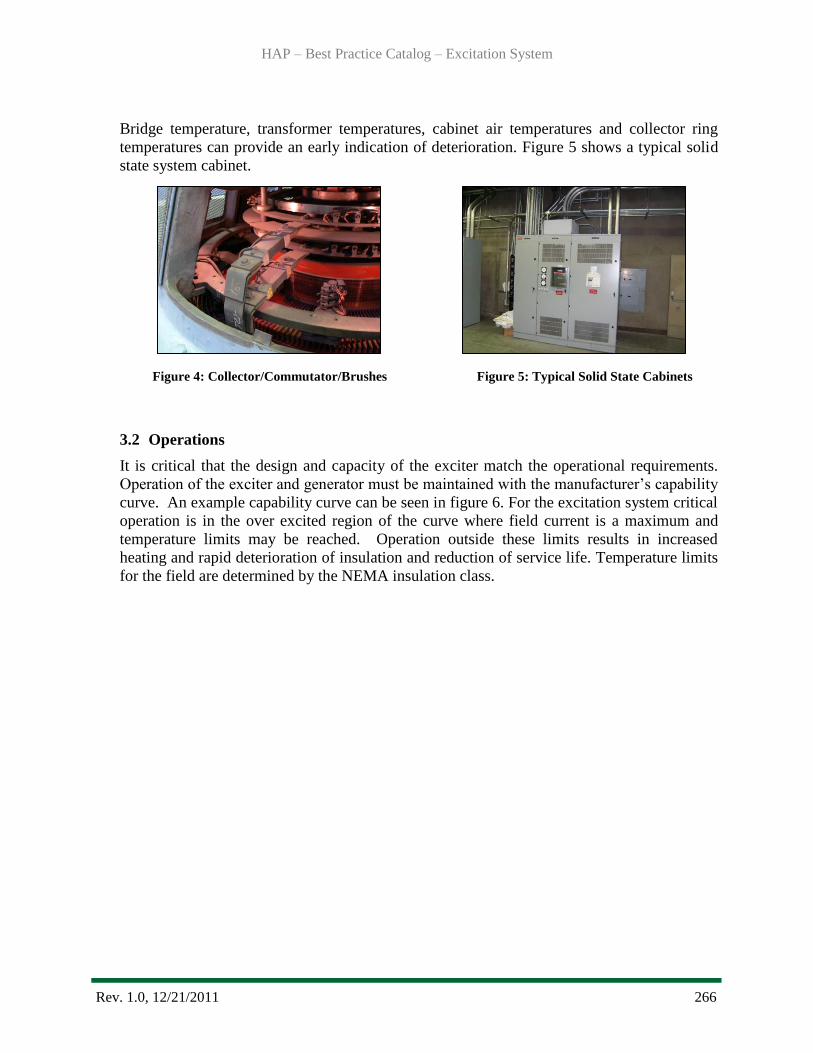
HAP – Best Practice Catalog – Excitation System
Rev. 1.0, 12/21/2011 266
Bridge temperature, transformer temperatures, cabinet air temperatures and collector ring
temperatures can provide an early indication of deterioration. Figure 5 shows a typical solid
state system cabinet.
Figure 4: Collector/Commutator/Brushes Figure 5: Typical Solid State Cabinets
3.2 Operations
It is critical that the design and capacity of the exciter match the operational requirements.
Operation of the exciter and generator must be maintained with the manufacturer‘s capability
curve. An example capability curve can be seen in figure 6. For the excitation system critical
operation is in the over excited region of the curve where field current is a maximum and
temperature limits may be reached. Operation outside these limits results in increased
heating and rapid deterioration of insulation and reduction of service life. Temperature limits
for the field are determined by the NEMA insulation class.
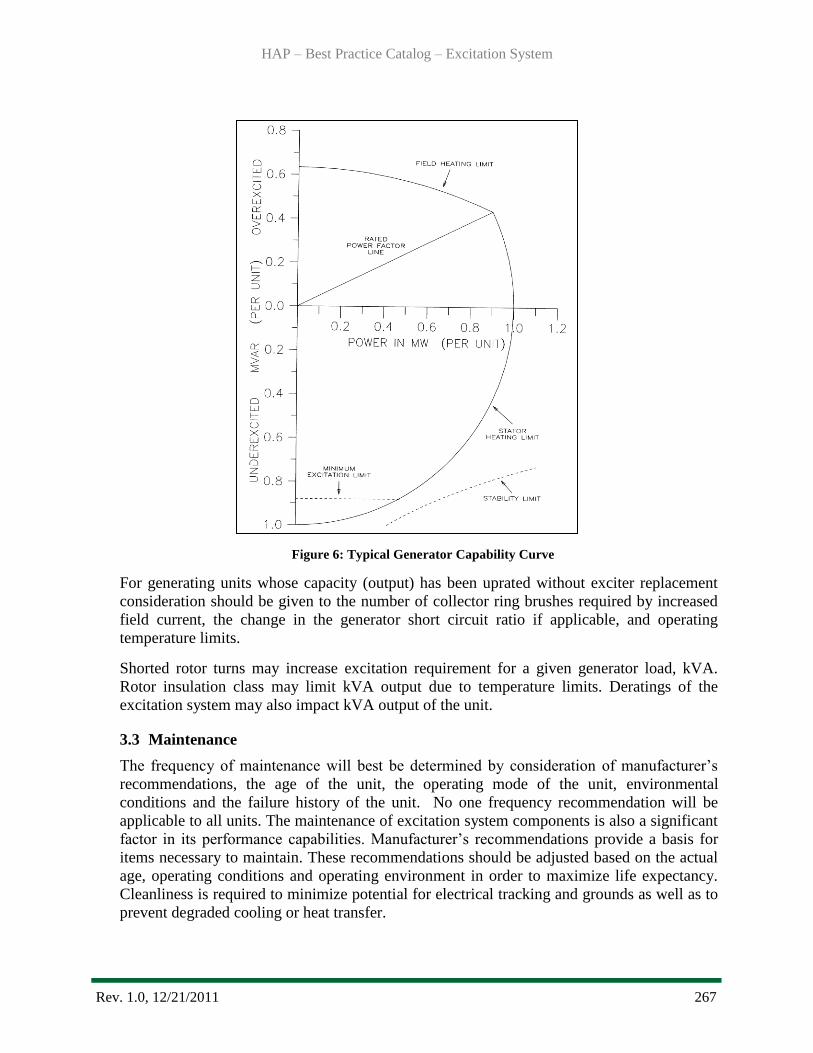
HAP – Best Practice Catalog – Excitation System
Rev. 1.0, 12/21/2011 267
Figure 6: Typical Generator Capability Curve
For generating units whose capacity (output) has been uprated without exciter replacement
consideration should be given to the number of collector ring brushes required by increased
field current, the change in the generator short circuit ratio if applicable, and operating
temperature limits.
Shorted rotor turns may increase excitation requirement for a given generator load, kVA.
Rotor insulation class may limit kVA output due to temperature limits. Deratings of the
excitation system may also impact kVA output of the unit.
3.3 Maintenance
The frequency of maintenance will best be determined by consideration of manufacturer‘s
recommendations, the age of the unit, the operating mode of the unit, environmental
conditions and the failure history of the unit. No one frequency recommendation will be
applicable to all units. The maintenance of excitation system components is also a significant
factor in its performance capabilities. Manufacturer‘s recommendations provide a basis for
items necessary to maintain. These recommendations should be adjusted based on the actual
age, operating conditions and operating environment in order to maximize life expectancy.
Cleanliness is required to minimize potential for electrical tracking and grounds as well as to
prevent degraded cooling or heat transfer.
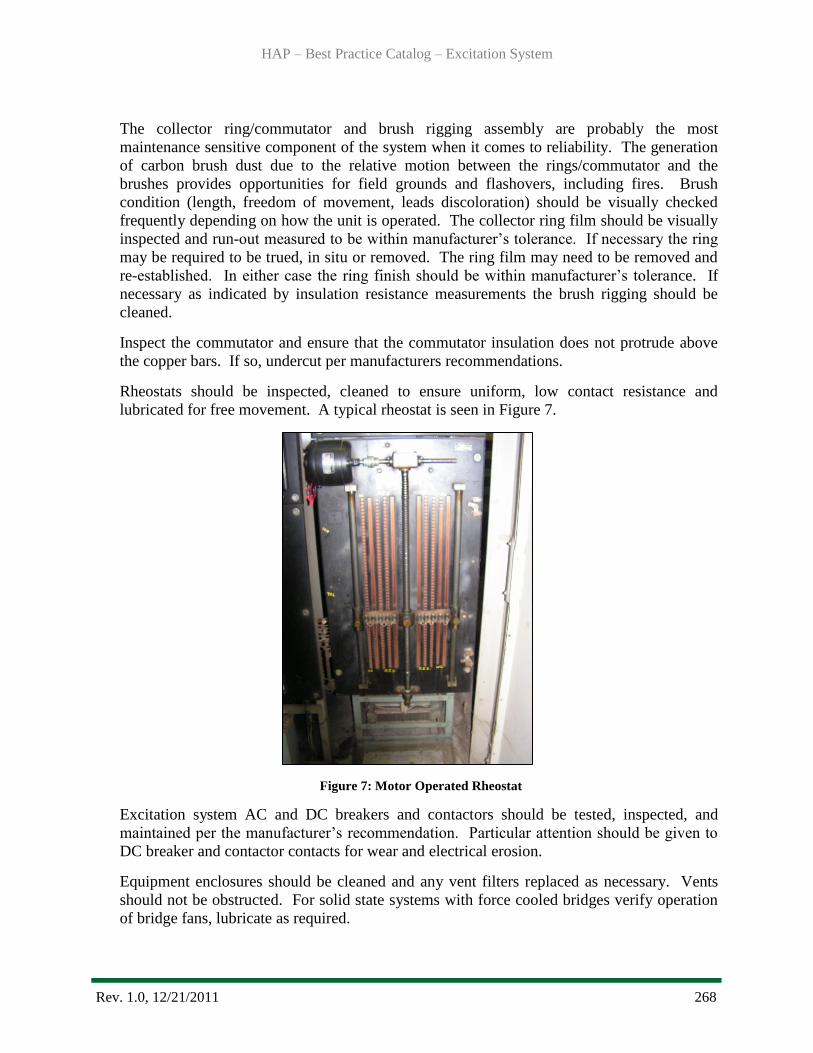
HAP – Best Practice Catalog – Excitation System
Rev. 1.0, 12/21/2011 268
The collector ring/commutator and brush rigging assembly are probably the most
maintenance sensitive component of the system when it comes to reliability. The generation
of carbon brush dust due to the relative motion between the rings/commutator and the
brushes provides opportunities for field grounds and flashovers, including fires. Brush
condition (length, freedom of movement, leads discoloration) should be visually checked
frequently depending on how the unit is operated. The collector ring film should be visually
inspected and run-out measured to be within manufacturer‘s tolerance. If necessary the ring
may be required to be trued, in situ or removed. The ring film may need to be removed and
re-established. In either case the ring finish should be within manufacturer‘s tolerance. If
necessary as indicated by insulation resistance measurements the brush rigging should be
cleaned.
Inspect the commutator and ensure that the commutator insulation does not protrude above
the copper bars. If so, undercut per manufacturers recommendations.
Rheostats should be inspected, cleaned to ensure uniform, low contact resistance and
lubricated for free movement. A typical rheostat is seen in Figure 7.
Figure 7: Motor Operated Rheostat
Excitation system AC and DC breakers and contactors should be tested, inspected, and
maintained per the manufacturer‘s recommendation. Particular attention should be given to
DC breaker and contactor contacts for wear and electrical erosion.
Equipment enclosures should be cleaned and any vent filters replaced as necessary. Vents
should not be obstructed. For solid state systems with force cooled bridges verify operation
of bridge fans, lubricate as required.
HAP – Best Practice Catalog – Excitation System
Rev. 1.0, 12/21/2011 269
Both solid state dry type and oil filled PPT/EPT‘s should periodically meggered and have
turns ratio tested. If fitted with fans they should be cleaned and operation tested. Oil filled
PPT/EPT‘s should be inspected for tank and bushing leaks. Transformer bushings should be
cleaned and oil level checked. If fitted with oil pumps and motors their operation should be
tested. Transformer oil should be checked for dissolved gases and quality.
4.0 Metrics, Monitoring and Analysis
4.1 Measures of Performance, Condition, and Reliability
Excitation system losses (rheostat, brushes, transformers) and excitation system availability
are all measures of condition and reliability. Losses associated with the exciter may include
rheostat losses, brush contact losses, brush friction losses, and windage losses and may
approach 15-30% of the unit full load losses. Generator rotor I2R losses are included with
the generator and not considered in the excitation BP.
Any I2R loss, which is a waste heat loss, may be reduced by reducing R. ―R‖ is the
resistance which is a function of temperature and physical properties of copper in the
excitation system components. R varies but not significantly with the temperature changes in
operation. ―I‖, the current, may vary significantly. The amount of current, the most
significant factor in the loss equation is dictated by the load. Exciter losses are the total of the
losses in the equipment supplying excitation. This equipment is minimized with a static
system, thereby reducing these losses.
Rheostat losses are the I2R losses of the rheostat if used. This is eliminated when using a
static system.
Brush contact losses are the electrical losses in the collector ring brushes. Prudent
maintenance of collector ring, commutator (eliminated with static system) and brush rigging
minimizes these losses.
Brush friction loss is a mechanical loss due to rubbing friction between the brushes and
collector rings and/or commutators. Elimination of the commutator brushes with a static
system reduces these losses.
Friction and windage losses are the power required to drive an unexcited machine at rated
speed with the brushes in contact (excitation system contribution to this loss is typically
minimal and unavoidable).
The key measurements include field current If, field winding resistance R, temperature T, and
brush voltage drop in volts.
4.2 Data Analysis
The CPL, relative to losses, is described by an accurate set of unit performance
characteristics determined by unit efficiency testing, which requires testing per IEEE 115
methods. The CPL relative to field current requirements of the unit is made by comparison
to the saturation and ―V‖ curves. Failure to meet the IPL for field current may be due to
shorted rotor turns.

HAP – Best Practice Catalog – Excitation System
Rev. 1.0, 12/21/2011 270
4.3 Integrated Improvements
Reliability issues, obsolence issues or impending unit uprate may warrant complete
replacement of the existing exciter. The preferred option is a completely solid state unit
which offers the following advantages [4]:
Eliminates high maintenance and obsolete components
Eliminates time constants associated with exciter field components and provides fast
system voltage recovery and transient stability
Provides data recording capability for trending and troubleshooting
Offers an opportunity to increase original field excitation and uprate the unit.
Provides digital communication capability that facilitates remote control and
monitoring.
Provides option of backup regulators
Enhanced control features such as a power systems stabilizer, power factor and VAR
control.
Eliminates losses associated with commutator brushes and rheostats
It may not be necessary to replace the rotating exciter to restore unit reliability. Replacement
of the pilot exciter/voltage regulator with a digital system may be sufficient to improve unit
reliability; however, the response time of the system will not be optimized as with a full
static system. While replacement of the voltage regulator only is a reasonable compromise,
replacement with a full static excitation system is the best solution.
NEMA class F or H insulation (maximum operating temperature 155 or 180 oC,
respectively) should be used for rotor pole windings. For unit uprates brush capacity should
be evaluated for additional field current requirements. Constant pressure brush springs should
be used for collector and commutator brushes.
Location and placement of a new solid state system and PPT (EPT) is often a challenge in
existing plants. Once locations for new equipment have been determined consideration of
the operating environment may indicate the need for additional cooling for reliability of the
low voltage electronics.
5.0 Information Sources
Baseline Knowledge:
USACE – Hydro Plant Risk Assessment Guide, Appendix E4 Excitation System Condition
Assessment
EPRI –EL-5036, Volume 16, Handbook to Assess the Insulation Condition of Large Rotating
Machines

HAP – Best Practice Catalog – Excitation System
Rev. 1.0, 12/21/2011 271
IEEE 115 – Guide for Test Procedures for Synchronous Machines
Hydro Life Extension Modernization Guide, Volume 3: Electromechanical Equipment, EPRI,
Palo Alto, CA: 2001. TR-112350-V3.
State of the Art:
Basler Application Notes – 16 Reasons to Replace Rotating Exciters with Digital Static
Exciters
EPRI 1004556 – Tools to Optimize Maintenance of Generator Excitation Systems, Voltage
Regulators and Field Ground Detection
Standards:
IEEE Std 492 – Guide for Operation and Maintenance of Hydro-Generators
NERC GADS – Top 25 System/Component Cause Codes
Best Practice Catalog
Instruments and Controls for Automation
Revision 1.0, 12/05/2011

HAP – Best Practice Catalog – I&C for Automation
Rev. 1.0, 12/05/2011 273
1.0 Scope and Purpose ........................................................................................................... 274
1.1 Hydropower Taxonomy Position ................................................................................. 274
1.1.1 Plant Automation Components ............................................................................. 274
1.2 Summary of Best Practices .......................................................................................... 278
1.2.1 Performance / Efficiency & Capability - Oriented Best Practices ........................ 278
1.2.2 Reliability / Operations & Maintenance - Oriented Best Practices ...................... 279
1.3 Best Practice Cross-references ..................................................................................... 280
2.0 Technology Design Summary .......................................................................................... 281
2.1 Technological Evolution .............................................................................................. 281
2.2 Design Technology ...................................................................................................... 281
2.3 State of the Art Technology ......................................................................................... 283
3.0 Operation & Maintenance Practices ................................................................................ 285
3.1 Condition Assessment .................................................................................................. 285
3.2 Operations .................................................................................................................... 291
3.3 Maintenance ................................................................................................................. 294
4.0 Metrics, Monitoring and Analysis ................................................................................... 295
5.0 Information Sources: ........................................................................................................ 297
HAP – Best Practice Catalog – I&C for Automation
Rev. 1.0, 12/05/2011 274
1.0 Scope and Purpose
The primary purpose of an automatic control system or automation system is to allow through
computerized control the automatic starting, stopping, safe operation, and protection of any
equipment being controlled. In the context of this document, that equipment is a hydro
generating unit and its associated components and auxiliaries. An additional benefit to an
automation system is the ability to operate the hydro generating unit in a more efficient manner.
Hydro generating units have been monitored and controlled by human operators for many years,
both locally and remotely.. Unfortunately, the generating efficiency is hard to be adequately
optimized by human operators due to the vast number of variable parameters spanning multiple
systems that can affect unit efficiency and also because the variables can change rapidly.
However, a computer system has the capability to analyze numerous parameters to determine
optimum performance settings for a generating unit many times per second, which brings such a
system a distinct advantage when trying to squeeze every last megawatt out of a limited supply
of water resources.
1.1 Hydropower Taxonomy Position
Hydropower Facility → Powerhouse → Instrument and Controls → I&C for Automation
1.1.1Plant Automation Components
Performance and reliability related components of a hydroelectric plant instrument and
control system will vary based on the automation supplier‘s design. This component
listing is based on a PLC (programmable logic controller) or RTU (remote terminal unit),
PC based data server, PC based HMI (human machine interface), conventional panel
boards for manual control and SCADA (Supervisory Control and Data Acquisition)
software. The term ‗controller‘ will be used to represent either a programmable logic
controller or current technology RTU.
PLC (programmable logic controller): The function of a PLC is the heart of digital
control system with programming capability that performs functions similar to a relay
logic system. A PLC consists of a CPU (central processing unit), memory, power
supply and a means of communications to I/O and other devices. The software
includes ladder, block, sequential, structured text and other logic programming to
control devices.
RTU (remote terminal unit): The function of an RTU is to collect data and is similar
to a PLC. Sometimes, it may be termed as PLC depending on the vendor terminology.
RTU is generally associated with older (prior to 1998) control systems with minimal
control capabilities, though it may also be a perfectly acceptable term for a current
vendor offering. Use caution when making a quick assessment of systems based on
these acronyms of RTU and PLC. The RTU is not always a lesser controller.
Controller: This can refer to either a PLC controller or a current technology RTU.
HMI (human machine interface): The function of the HMI is to be the interface for
the operator to the control system. The HMI is normally a PC as the client portion of
a client/server architecture. In some cases, the HMI and the server are the same PC.

HAP – Best Practice Catalog – I&C for Automation
Rev. 1.0, 12/05/2011 275
Data Server: The function of a data server is to link to the controllers and the network
to send data to the HMI and receive operator input from the HMI back to the
controllers. The data server is normally a PC in a client/server application.
Control LAN (2)
Central Hydro Dispatch
Control Center
Secure Isolated
Wide Area Network
Control LAN (2)
Ethernet LAN
Local Operating
Workstation
Redundant Serial
Communication Channels
GPS
Clock
Redundant Plant
Common PLC's Unit PLC's
One Per Unit
Remote
Switchyard I/O
Remote
Switchyard I/O
Remote
Unit I/O
Remote
Unit I/O
Unit
Intelligent
Electronic
Devices
Efficiency
Optimization
Firewall
System Architecture For A Typical Automated Plant
Plant
Intelligent
Electronic
Devices
Figure 1: Typical Control LAN
Network LAN (local area network): There are normally two major networks in a
hydroelectric control system.
The TCP/IP network (Ethernet) links the server(s) to the HMIs, the
controllers, data historians, firewall, and other Ethernet based devices. This is
shown as the Ethernet LAN in Figure 1.
The I/O network may also be Ethernet, though it is commonly a protocol used
by the controls supplier such as Profibus™, Modbus™, DeviceNet™ etc.
This is shown as the Control LAN in Figure 1.
There are also secondary network connections to 3rd
party devices tied directly
to a controller through serial or Ethernet. This is shown as the links to the
plant or unit electronic intelligent devices in Figure 1.
GPS Clock: This is for time synchronization in the control system.
HAP – Best Practice Catalog – I&C for Automation
Rev. 1.0, 12/05/2011 276
SCADA (Supervisory Control and Data Acquisition): SCADA unfortunately tends to
be an ambiguous acronym. Suppliers and end users have widely varying
interpretations of what comprises a SCADA system. (See also RTU definition
above.) As shown in Figure 2, an older SCADA system consists of RTUs (remote
terminal units) that tie back to a central processor that primarily collects data and
commonly uses proprietary communication protocols. Some controls suppliers refer
to their current offerings (Dec. 2011) as a SCADA system, which has the same
capabilities as a PLC based system or even is exactly a PLC based system. This can
lead to some confusion. Generally, older SCADA/RTU systems (designed prior to
1998) have limitations in both logic handling and communications, which make them
the candidates for upgrade. Over the decade, SCADA systems, PLC based systems
and DCS (distributed control systems) have migrated towards being synonymous.
These acronyms and their meanings are usually vary with the culture or industry in
which they were initially installed.
I/O (wired input and output to field devices): The function of I/O is to send
commands to devices or receive information from devices.
Traditional Analog and Discrete I/O: These are wired inputs and outputs that
use voltage or current representing the status of a device, values and/or set
points.
Hybrid I/O: Hybrid I/O varies from traditional I/O in that digital
communications are carried on the same wires as the voltage or current. This
digital information generally contains diagnostic information about the
connected device. Devices that support HART™ on top of a voltage signal
are an example of a hybrid.
Smart I/O: This communication signal is entirely digitalized. The accuracy
exceeds traditional analog and it contains diagnostic information about the
connected device.
Safety I/O: This varies from traditional I/O in that the controller periodically
tests the I/O to verify that the controller hardware is functioning properly.

HAP – Best Practice Catalog – I&C for Automation
Rev. 1.0, 12/05/2011 277
Figure 2: Common Older Style SCADA System [5]
Local Control (definition): Controls located at the equipment itself or within sight
of the equipment. For a generating station, the controls are located on the unit
switchboard-governor control station.
Automatic Control (definition): An arrangement of controls that provide for
switching or controlling, or both, of equipment in a specific sequence and under
predetermined conditions without operator intervention after initiation [1].
Non-performance but reliability related components of a control system.
Firewall: The function of a firewall is to restrict and protect the plant control
network from outside unauthorized access. The firewall restricts communications
in both directions protecting the process and data.
UPS (uninterruptible power supply): The function of the UPS is to provide
temporary power to a system in case of main power failure. The UPS also acts as
a power filter to protect control equipment. At hydro facilities, a large DC battery
bank can also supply backup power through an inverter to the control system.
HAP – Best Practice Catalog – I&C for Automation
Rev. 1.0, 12/05/2011 278
IDS (intrusion detection system): This device resides on the process control
network to detect and log any intrusion attempts – failed or successful. Logs from
firewalls can also be used as a limited form of intrusion detection.
Historical Archive: The function of the historical archive is to store historical
information from the control system.
Reporting: The function of reporting is for GADS (Generating Availability Data
System, as required by NERC - the North American Electric Reliability
Corporation), production, scheduling etc.. This is often accomplished on the
server or client.
Syslogs: This is an important function to meet NERC-CIP requirements as
defined below. Syslogs record software events from the computers, firewalls and
other network devices that support Syslogs.
Engineering Workstation: The function of the engineering workstation is to
configure the software for the control system controllers, servers, HMIs and other
controls equipment.
Efficiency Optimization: This is a program that runs on top of the control system
to maximize efficiency of the plant.
1.2 Summary of Best Practices
1.2.1Performance / Efficiency & Capability - Oriented Best Practices
Use supervisory control that takes into account weather, demand, headwater and
tailwater levels, fish habitat, outages, and other variables.
Use advanced control algorithms, within the controller, to optimize generator
efficiency.
There should not be more than eight actionable alarms per hour per operator
at any plant or for each operator at a central control facility.
Test all software before downloading or installing.
Design local control to be independent of the digital controller system in that the
units can be operated from a bench board without the controllers and/or SCADA
system in operation. Small generating units would be exempt from this practice.
Compare long term trends, seasonal and annual, to measure performance. Figure
3 shows a complex control system LAN (local area network) with its own
historian. This control system LAN ties back to a corporate LAN which has its
own historian. This structure allows operators to create their own trends locally.
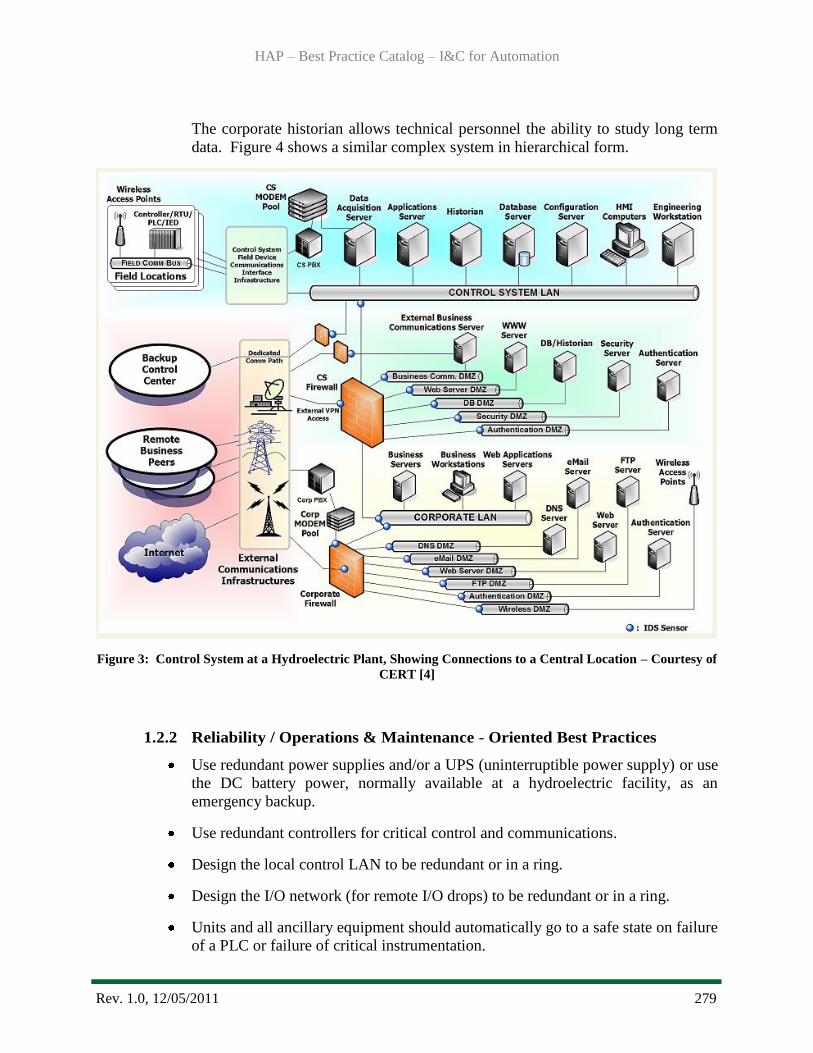
HAP – Best Practice Catalog – I&C for Automation
Rev. 1.0, 12/05/2011 279
The corporate historian allows technical personnel the ability to study long term
data. Figure 4 shows a similar complex system in hierarchical form.
Figure 3: Control System at a Hydroelectric Plant, Showing Connections to a Central Location – Courtesy of
CERT [4]
1.2.2 Reliability / Operations & Maintenance - Oriented Best Practices
Use redundant power supplies and/or a UPS (uninterruptible power supply) or use
the DC battery power, normally available at a hydroelectric facility, as an
emergency backup.
Use redundant controllers for critical control and communications.
Design the local control LAN to be redundant or in a ring.
Design the I/O network (for remote I/O drops) to be redundant or in a ring.
Units and all ancillary equipment should automatically go to a safe state on failure
of a PLC or failure of critical instrumentation.
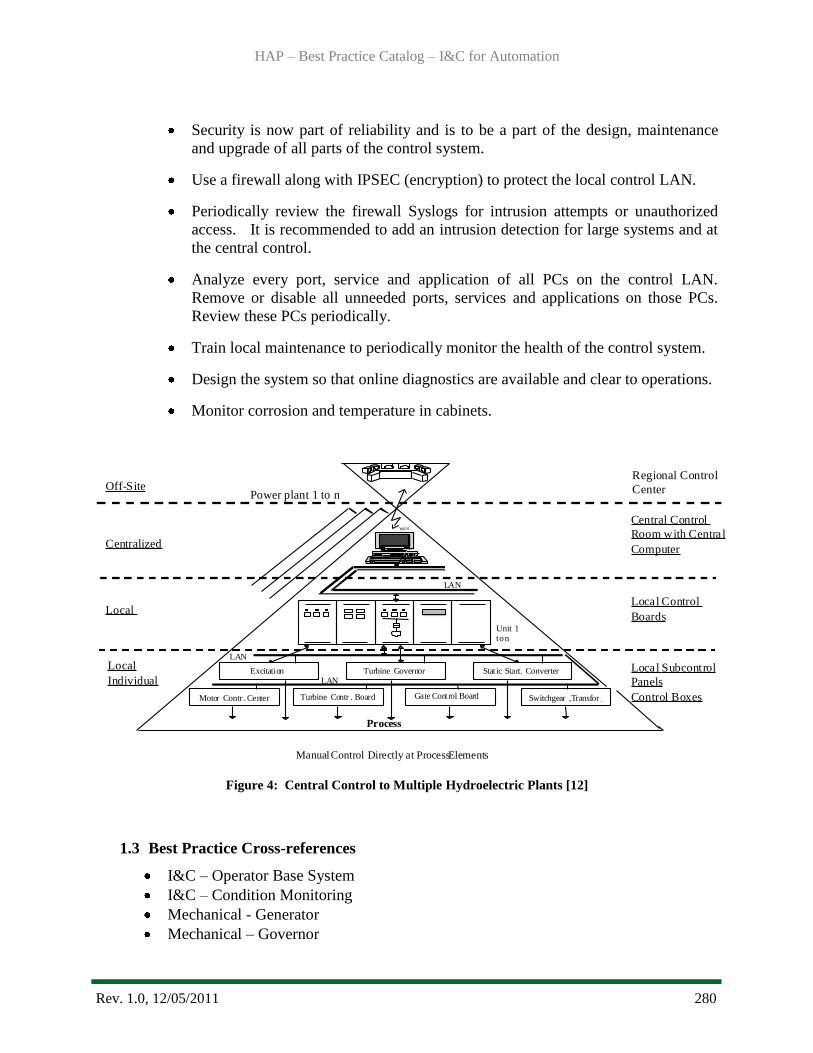
HAP – Best Practice Catalog – I&C for Automation
Rev. 1.0, 12/05/2011 280
Security is now part of reliability and is to be a part of the design, maintenance
and upgrade of all parts of the control system.
Use a firewall along with IPSEC (encryption) to protect the local control LAN.
Periodically review the firewall Syslogs for intrusion attempts or unauthorized
access. It is recommended to add an intrusion detection for large systems and at
the central control.
Analyze every port, service and application of all PCs on the control LAN.
Remove or disable all unneeded ports, services and applications on those PCs.
Review these PCs periodically.
Train local maintenance to periodically monitor the health of the control system.
Design the system so that online diagnostics are available and clear to operations.
Monitor corrosion and temperature in cabinets.
Figure 4: Central Control to Multiple Hydroelectric Plants [12]
1.3 Best Practice Cross-references
I&C – Operator Base System
I&C – Condition Monitoring
Mechanical - Generator
Mechanical – Governor
Off-Site
LAN
Excitation Turbine Governor Stat ic Start. Converter
Turbine Contr . BoardMotor Contr . Center
WAN
Process
Manual Control Directly at Process Elements
Gate Control Board Switchgear ,Transfor .
Central Control
Room with Centra l
Computer
Local Control
Boards
LAN
LAN
Unit 1to n
Power plant 1 to n
Local Subcontrol
Panels
Control Boxes
Centralized
Local
Local
Individual
Regional Control
Center

HAP – Best Practice Catalog – I&C for Automation
Rev. 1.0, 12/05/2011 281
2.0 Technology Design Summary
2.1 Technological Evolution
Automatic control systems for hydroelectric units based on electromechanical relay logic
have been in general use for many years and, in fact, were considered standard practice for
the industry. Within the past few decades, microprocessor-based controllers have been
developed that are suitable for operation in a power plant environment. These computer-
based systems have been applied for data logging, alarm monitoring, and unit and plant
control. Advantages of computer-based control include use of graphical user interfaces, the
incorporation of sequence of events, trending, automatic archiving and reporting into the
control system. The incorporation of artificial intelligence and expert system capabilities
also enhance the system [2].
The initial upgrade for older hydroelectric plants has been from a system that relied primarily
on electromechanical relay logic to a computer based Supervisory Control and Data
Acquisition (SCADA) systems. In an era of deregulation and competition, management
needs more information than ever before, and as quickly as possible, regarding its own costs,
efficiency and the market price for energy. That need for information is leading to the
upgrading and re-engineering of SCADA systems nationwide with new software and
hardware that is more productive, reliable, and which utilizes open standards architecture
[11].The early SCADA systems used proprietary network communications and had
rudimentary logic and information. Today‘s systems include more powerful controllers
(PLCs or RTUs), open architecture (TCP/IP, DN3, Modbus™ etc.) and personal computers
for HMIs (human machine interface).
2.2 Design Technology
Automation system design, operation, and maintenance have a major impact on unit
efficiency, plant overall generation, and reliability. Best practice for the automation system
begins with the ability to safely and securely control the entire facility both locally and
remotely. The security of a control system supplants many previous design parameters, such
as ease of remote network access, open wireless communications and easy physical access.
Once a secure and fail-safe system is in place, the control system is then ready for
optimization and high level control. Figure 5 shows a control system with firewalls and
intrusion detection.

HAP – Best Practice Catalog – I&C for Automation
Rev. 1.0, 12/05/2011 282
Figure 5: Securing a Typical Hydro Facility – Juniper Networks example [7]
Cyber Security (some overlap with hardware and software design)
Government owned hydroelectric facilities cyber security policies will fall under federal
compliance requirements with both NERC [13] (North American Electric Reliability
Corporation) and FISMA [3] (Federal Information Security Management Act). The general
rule is that larger government owned facilities and facilities considered ‗critical‘ fall under
the stricter NERC standards which include substantial penalties, if violations are egregious.
The guidelines (NERC or FISMA) are determined by the management of each utility and
their interpretation of the selection guidelines along with agreement from federal officials.
Brief summaries of the two standards are listed in this document since they are crucial to the
design or the upgrade of a government owned hydroelectric control system. NERC standards
apply to private or public owned utilities that fall under the NERC domain. The standards
are in the NERC-CIP 002-009 and in FISMA‘s NIST 800-53 documentation. In particular,
pay attention to appendix J of NIST 800-53 and NIST 800-82 [14].
At the 2011 ―East Tennessee Cyber Security Summit‖, several vendors remarked that 80% of
security incidents are discovered by 3rd parties. These 3rd parties may be local law
enforcement, FBI, banks or the media. The overwhelming number of corporate entities that
were compromised did not have the ability to detect an intrusion nor a system in place to

HAP – Best Practice Catalog – I&C for Automation
Rev. 1.0, 12/05/2011 283
track the intrusion. Intrusions may go on for weeks or months without being detected or
reported. The importance of cyber security cannot be over stated.
NERC Guidelines
NERC Critical Infrastructure Protection (CIP) standards relies heavily on documentation.
Compliance with NERC-CIP should not be interpreted as being secure. [13]
2.3 State of the Art Technology
A secure reliable automation system that supports high level supervisory optimization is no
longer a difficult technical achievement. The proper design of the automation system will
allow for fail-safe local control, redundancy, secure communications and automated
scheduling with optimization. Optimization routines are readily available from 3rd
party
vendors or may be written in-house with software packages that are becoming easier to
program and employ standard communication protocols.
As the state of the art technology, critical control systems that may cause physical harm,
equipment damage or significant economic loss upon failure should have an appropriate level
of redundancy. But, not all redundancy listed below is required or recommended for all
systems due to the expense involved.
Redundant Power Source
This is the most common form of redundancy and is recommended for all control
systems. A redundant power source may be a UPS with the understanding that the
UPS has a time limit in minutes based on the load and battery size. A UPS may also
be used as a clean power source. Controllers commonly have the ability to be wired
to dual power sources as a fundamental feature.
Redundant Controller
If a redundant controller is not used, verify that a failure of the controller will not
inflict equipment damage or harm personnel. The system must have a safe mode on a
loss of the lone controller. The mean time between failures (MTBF) of a system with
redundant controllers, redundant power supplies and redundant communications is
nearly 10 times that of a standalone control system, see the result data in Table 1
from the study performed at the Large Hadron Collider Project in Europe using the
Siemens 400 series PLCs [10].
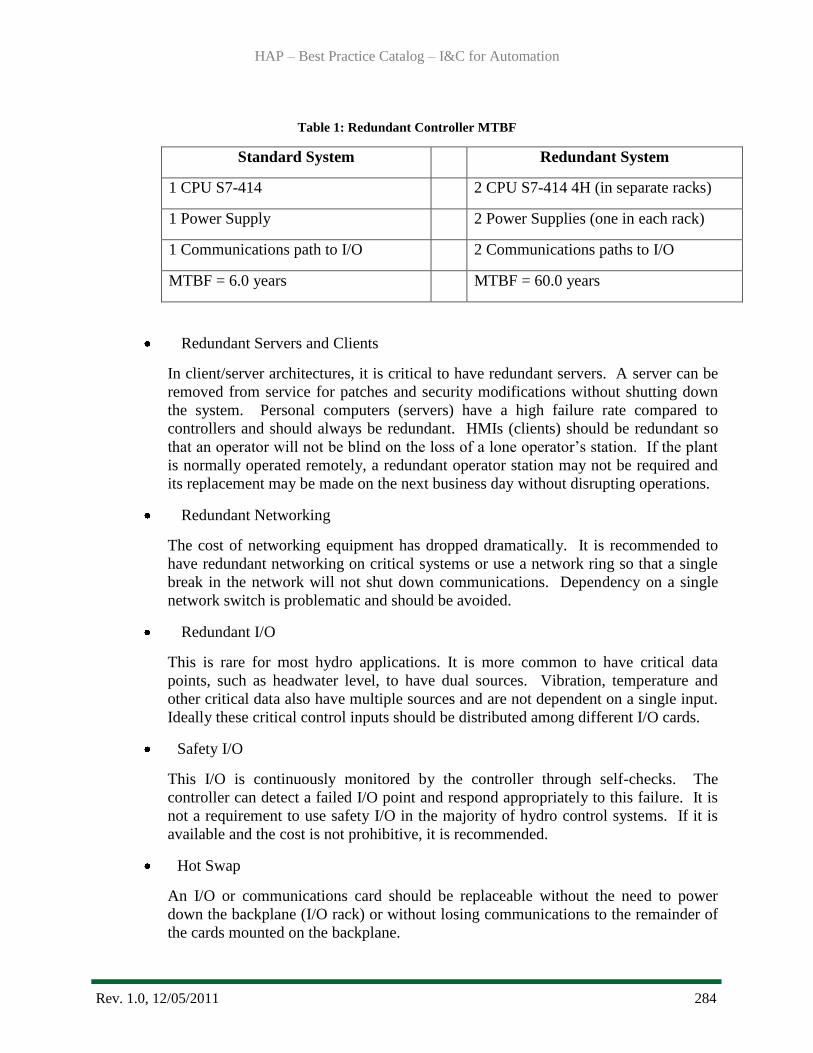
HAP – Best Practice Catalog – I&C for Automation
Rev. 1.0, 12/05/2011 284
Table 1: Redundant Controller MTBF
Standard System Redundant System
1 CPU S7-414 2 CPU S7-414 4H (in separate racks)
1 Power Supply 2 Power Supplies (one in each rack)
1 Communications path to I/O 2 Communications paths to I/O
MTBF = 6.0 years MTBF = 60.0 years
Redundant Servers and Clients
In client/server architectures, it is critical to have redundant servers. A server can be
removed from service for patches and security modifications without shutting down
the system. Personal computers (servers) have a high failure rate compared to
controllers and should always be redundant. HMIs (clients) should be redundant so
that an operator will not be blind on the loss of a lone operator‘s station. If the plant
is normally operated remotely, a redundant operator station may not be required and
its replacement may be made on the next business day without disrupting operations.
Redundant Networking
The cost of networking equipment has dropped dramatically. It is recommended to
have redundant networking on critical systems or use a network ring so that a single
break in the network will not shut down communications. Dependency on a single
network switch is problematic and should be avoided.
Redundant I/O
This is rare for most hydro applications. It is more common to have critical data
points, such as headwater level, to have dual sources. Vibration, temperature and
other critical data also have multiple sources and are not dependent on a single input.
Ideally these critical control inputs should be distributed among different I/O cards.
Safety I/O
This I/O is continuously monitored by the controller through self-checks. The
controller can detect a failed I/O point and respond appropriately to this failure. It is
not a requirement to use safety I/O in the majority of hydro control systems. If it is
available and the cost is not prohibitive, it is recommended.
Hot Swap
An I/O or communications card should be replaceable without the need to power
down the backplane (I/O rack) or without losing communications to the remainder of
the cards mounted on the backplane.

HAP – Best Practice Catalog – I&C for Automation
Rev. 1.0, 12/05/2011 285
It is essential that the following functions can be carried out under backup
conditions or failure of the main control system (PLC or RTU) [12]:
Emergency stop
Operation of spillways
Operation of high voltage circuit breakers and isolating switches
Starting and stopping of generator/turbine units
Operation of the intake gate/turbine isolation (shutoff) valve
Governor and excitation adjustments
3.0 Operation & Maintenance Practices
3.1 Condition Assessment
It is noticed that some key items are missing in control systems in even recent installations
or upgrades of hydropower facilities in the United States (Dec. 2011). The items listed in
this section will enhance IEEE Std 1249:1996 [1], which is now undergoing a revision.
Engineering and operations should carefully consider all these items in the control system
selection. The overall goal of automation system is dependability, as the majority of hydro
facilities are not manned 24/7. This listing is to promote the best selection for a hydro
control system based on the needs for maximum system availability, safety of equipment and
personnel, system optimization, standardized communications protocols, ease of maintenance
and security.
The first step in assessing an automation system would be the determination of the condition
of existing equipment which must be controlled. A major portion of that assessment would
be the condition and capabilities of any required sensors or feedbacks already present. The
following information will be a guide through the various systems necessary and help
determine any upgrades which might be required.
Turbines
While the actual best practices to be considered for hydro turbines is being covered in
another guide, there is still important information which must be gathered in order to allow
the automation system to operate a unit at optimum efficiency. Depending on the design of
the turbine, different levels of testing will have to be performed to determine the overall
operating characteristics of the turbine. For instance a set of efficiency curves will have to be
developed for a Francis unit over a range of flow, headwater elevation, and tailwater
elevation conditions. But for a Kaplan unit much more data must be collected to cover all the
blade tilt positions as well as the range of water flow conditions. Each type of turbine will
have its own specific variations but basically a complete set of turbine efficiencies must be
available for input into the automation software. Additionally the flow instrumentation,
headwater elevation instrumentation and tailwater elevation instrumentation must be accurate
and must have data outputs which are compatible with the requirements for the automation
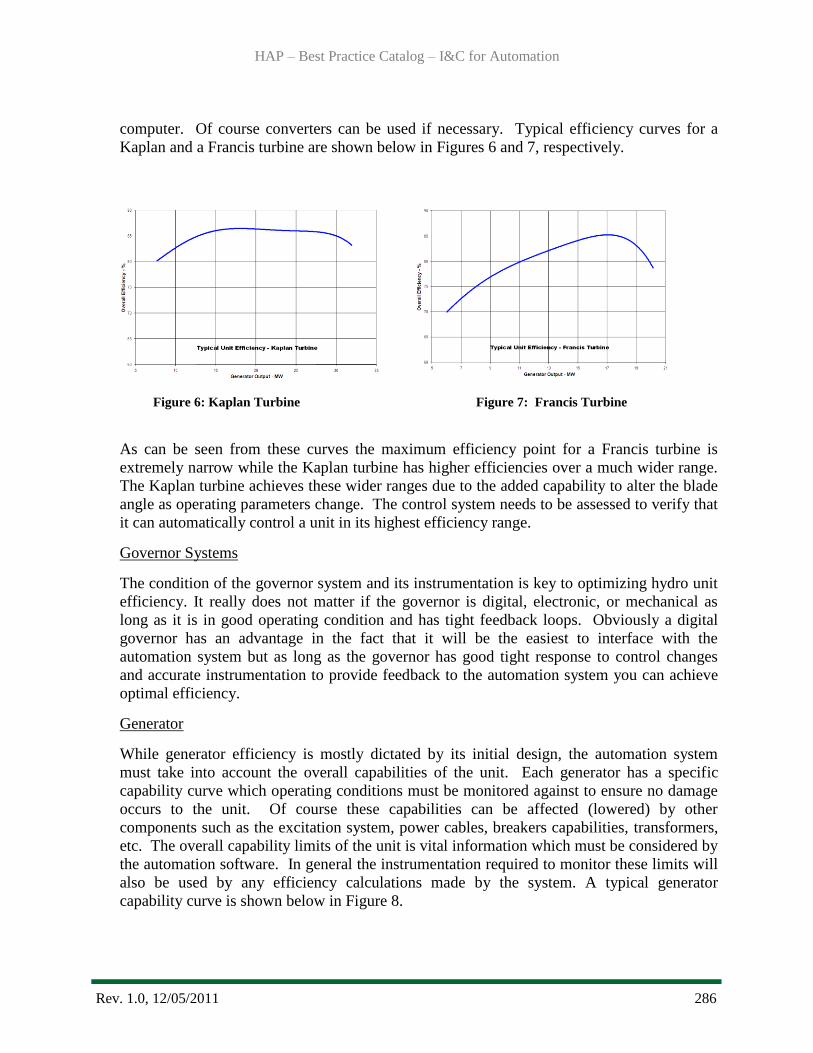
HAP – Best Practice Catalog – I&C for Automation
Rev. 1.0, 12/05/2011 286
computer. Of course converters can be used if necessary. Typical efficiency curves for a
Kaplan and a Francis turbine are shown below in Figures 6 and 7, respectively.
Figure 6: Kaplan Turbine Figure 7: Francis Turbine
As can be seen from these curves the maximum efficiency point for a Francis turbine is
extremely narrow while the Kaplan turbine has higher efficiencies over a much wider range.
The Kaplan turbine achieves these wider ranges due to the added capability to alter the blade
angle as operating parameters change. The control system needs to be assessed to verify that
it can automatically control a unit in its highest efficiency range.
Governor Systems
The condition of the governor system and its instrumentation is key to optimizing hydro unit
efficiency. It really does not matter if the governor is digital, electronic, or mechanical as
long as it is in good operating condition and has tight feedback loops. Obviously a digital
governor has an advantage in the fact that it will be the easiest to interface with the
automation system but as long as the governor has good tight response to control changes
and accurate instrumentation to provide feedback to the automation system you can achieve
optimal efficiency.
Generator
While generator efficiency is mostly dictated by its initial design, the automation system
must take into account the overall capabilities of the unit. Each generator has a specific
capability curve which operating conditions must be monitored against to ensure no damage
occurs to the unit. Of course these capabilities can be affected (lowered) by other
components such as the excitation system, power cables, breakers capabilities, transformers,
etc. The overall capability limits of the unit is vital information which must be considered by
the automation software. In general the instrumentation required to monitor these limits will
also be used by any efficiency calculations made by the system. A typical generator
capability curve is shown below in Figure 8.

HAP – Best Practice Catalog – I&C for Automation
Rev. 1.0, 12/05/2011 287
Figure 8: Typical Generator Capacity Curve
Excitation Systems
Again it really does not matter if the exciter is of digital or mechanical design as long as the
equipment is in good working order and has adequate response times. However, a digital
exciter again has an advantage in the fact that it will be much easier to interface with the
automation system. Optimally the excitation system will have the capacity to operate the
generator anywhere on the capability curve required. However, in some instances the
existing exciter will not have the capacity required and those limits must also be considered
in the automation system software.
Table 2 lists minimum instrumented inputs and outputs on an automated control system, such
as a PLC, to control various devices or systems. The goal of having these levels of control is
to allow fully automated control of a plant from a remote site with scheduling and minimize
the need for operators at the plant full time. The existing system needs to be assessed to
verify it can meet these minimal criteria.
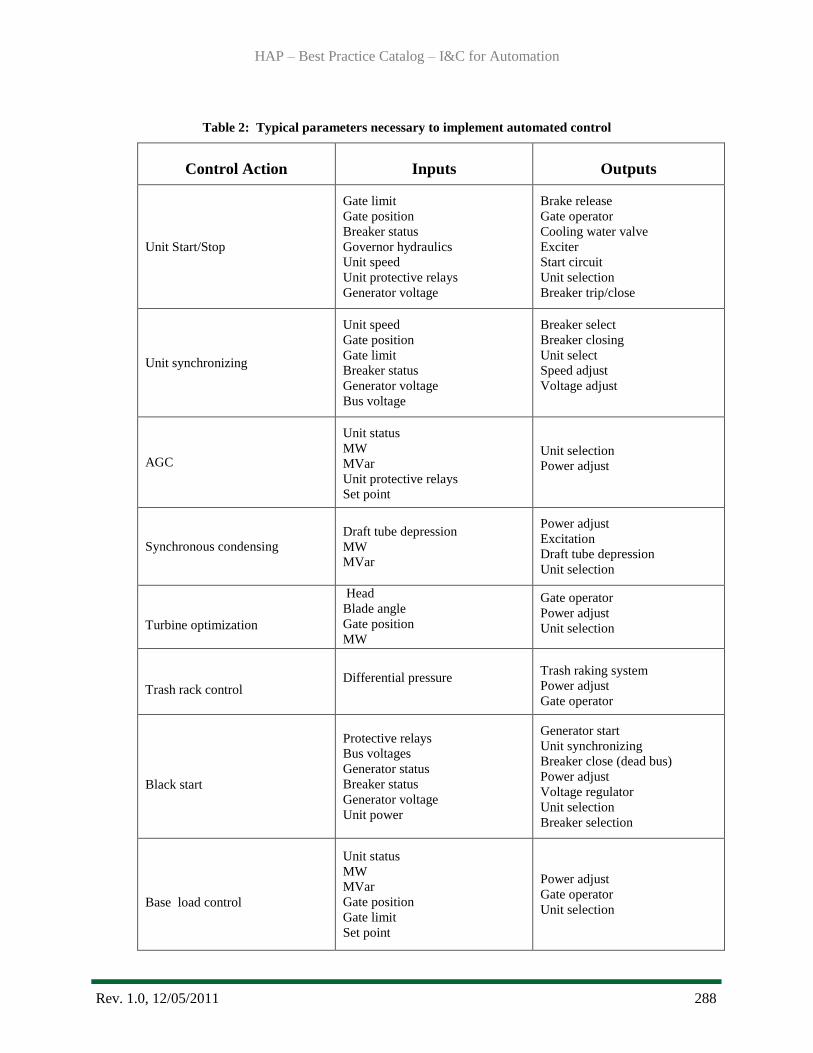
HAP – Best Practice Catalog – I&C for Automation
Rev. 1.0, 12/05/2011 288
Table 2: Typical parameters necessary to implement automated control
Control Action Inputs Outputs
Unit Start/Stop
Gate limit
Gate position
Breaker status
Governor hydraulics
Unit speed
Unit protective relays
Generator voltage
Brake release
Gate operator
Cooling water valve
Exciter
Start circuit
Unit selection
Breaker trip/close
Unit synchronizing
Unit speed
Gate position
Gate limit
Breaker status
Generator voltage
Bus voltage
Breaker select
Breaker closing
Unit select
Speed adjust
Voltage adjust
AGC
Unit status
MW
MVar
Unit protective relays
Set point
Unit selection
Power adjust
Synchronous condensing Draft tube depression
MW
MVar
Power adjust
Excitation
Draft tube depression
Unit selection
Turbine optimization
Head
Blade angle
Gate position
MW
Gate operator
Power adjust
Unit selection
Trash rack control Differential pressure
Trash raking system
Power adjust
Gate operator
Black start
Protective relays
Bus voltages
Generator status
Breaker status
Generator voltage
Unit power
Generator start
Unit synchronizing
Breaker close (dead bus)
Power adjust
Voltage regulator
Unit selection
Breaker selection
Base load control
Unit status
MW
MVar
Gate position
Gate limit
Set point
Power adjust
Gate operator
Unit selection
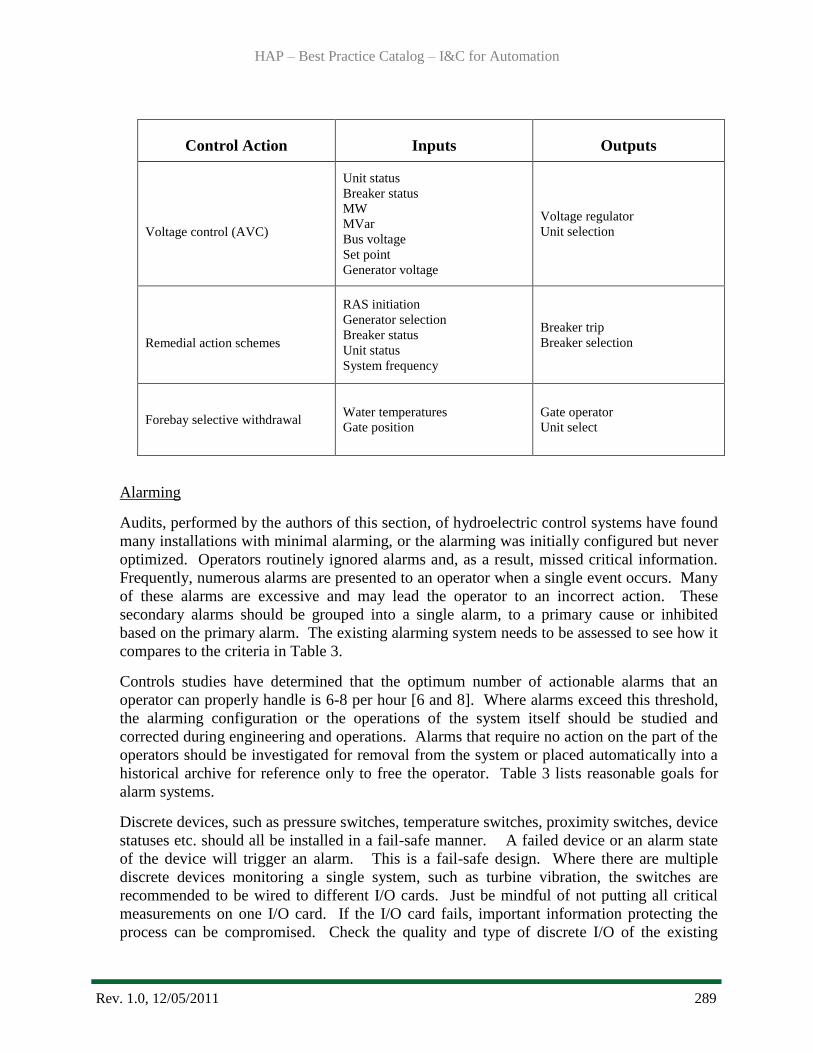
HAP – Best Practice Catalog – I&C for Automation
Rev. 1.0, 12/05/2011 289
Control Action Inputs Outputs
Voltage control (AVC)
Unit status
Breaker status
MW
MVar
Bus voltage
Set point
Generator voltage
Voltage regulator
Unit selection
Remedial action schemes
RAS initiation
Generator selection
Breaker status
Unit status
System frequency
Breaker trip
Breaker selection
Forebay selective withdrawal Water temperatures
Gate position
Gate operator
Unit select
Alarming
Audits, performed by the authors of this section, of hydroelectric control systems have found
many installations with minimal alarming, or the alarming was initially configured but never
optimized. Operators routinely ignored alarms and, as a result, missed critical information.
Frequently, numerous alarms are presented to an operator when a single event occurs. Many
of these alarms are excessive and may lead the operator to an incorrect action. These
secondary alarms should be grouped into a single alarm, to a primary cause or inhibited
based on the primary alarm. The existing alarming system needs to be assessed to see how it
compares to the criteria in Table 3.
Controls studies have determined that the optimum number of actionable alarms that an
operator can properly handle is 6-8 per hour [6 and 8]. Where alarms exceed this threshold,
the alarming configuration or the operations of the system itself should be studied and
corrected during engineering and operations. Alarms that require no action on the part of the
operators should be investigated for removal from the system or placed automatically into a
historical archive for reference only to free the operator. Table 3 lists reasonable goals for
alarm systems.
Discrete devices, such as pressure switches, temperature switches, proximity switches, device
statuses etc. should all be installed in a fail-safe manner. A failed device or an alarm state
of the device will trigger an alarm. This is a fail-safe design. Where there are multiple
discrete devices monitoring a single system, such as turbine vibration, the switches are
recommended to be wired to different I/O cards. Just be mindful of not putting all critical
measurements on one I/O card. If the I/O card fails, important information protecting the
process can be compromised. Check the quality and type of discrete I/O of the existing
HAP – Best Practice Catalog – I&C for Automation
Rev. 1.0, 12/05/2011 290
system. In some older facilities, the quality of the wiring may need to be assessed. Older
wiring may have cracked or even missing insulation.
Historical Data
Historical data is vital to troubleshooting and optimizing a control system. There are
basically two types of historical trending. The first type is the near real-time trending,
continuously displayed trend used by operators going back a few hours or minutes of a
process and up to near real-time. The second type of trending is for long-term archiving.
Audits of control systems have discovered the historical trending that was never archived or
improperly configured, and/or the historical files were too short of duration to be of
usefulness in troubleshooting or for optimizing. Assess the current ability to create long term
trends and be able to export to a database for analysis.
All alarms should be trended and archived. Historical archiving of discrete points is recorded
on an exception basis. Analog points should be archived based on common sense in terms of
the deadband and frequency of data collecting. A slow-moving temperature measurement
may only need to be collected every 5 seconds. A fast analog, such as flow or pressure, may
be collected every second or even faster if the I/O is capable of scanning at high speeds (>
250 ms). The deadband of analog measurements to an archive is often set at 0.25% to 0.5%,
which is the accuracy of most analog measurements. Audits of archives found analogs set at
2% or at even higher deadbands. This can lead to aliasing and mislead an investigator in
analyzing events. Current historical archiving software is capable of data compression
without significant loss of data. The cost of recording media has become minor.
Older analog inputs channels are frequently 12 bit. That is 0.25% accuracy for the full scale
(1 bit out of 4095 total bits). The system may not be capable of obtaining a desired accuracy
from the analog I/O.. The transmitter accuracy compounds the situation. Assess the analog
input and output capability of the system. It should be at an absolute minimum of 13 bit
accuracy with a preferred accuracy of 15 bits (or more). The accuracy of the measurement is
an important factor in historical archiving, interpreting the data and controlling the process.
In modeling and optimizing generator performance, historical archiving for several years is
required. Seasonal variations and overall control of the generator and dam performance can
only be audited and improved using long term data.

HAP – Best Practice Catalog – I&C for Automation
Rev. 1.0, 12/05/2011 291
Table 3: ISA 18-2 Alarm Performance Metrics [6]
3.2 Operations
HMI - Human Machine Interface
The HMI is more than just a rehash of a P&ID (piping and instrumentation design drawing)
with process descriptions. The software helps the operator in routine process management
and optimization. The largest improvement in the HMI for operations has been in helping
the operator respond to alarms. In the last few years emphasis has been placed in developing
HMIs to assist the operator in abnormal situation management, which has been developed in
a consortium with Honeywell [8]. The findings of this group have led to a radical graphical
design change for operators. The normal color conditions for a process is gray and the
HAP – Best Practice Catalog – I&C for Automation
Rev. 1.0, 12/05/2011 292
background is gray. Abnormal conditions change color based on the processes. Information
such as efficiencies or key performance indicators often prompt the operator long before a
serious alarm condition occurs. This group concludes that operators respond 40% faster to
alarms than traditional displays with multiple colors and are less likely to make mistakes in
responding to alarms.
Optimization – Various Methods
Below are the minimum control capabilities in an operating system.
Most Efficient Load (MEL)
This control mode will give the majority of efficiency benefits. The automation
system will look at all the variables affecting unit efficiency, compare them to
optimum, and automatically adjust the unit to achieve the highest possible efficiency
for the operating conditions available. The system will continuously monitor all the
parameters and, if any changes occur, it will automatically make necessary
adjustments to again maintain maximum efficiency.
Maximum Sustainable Load (MSL)
While this mode is not the most efficient, there are times, when the unit must be
operated at maximum MW output due to other power system constraints.
Fixed Turbine Flow
Occasionally there is a requirement to operate a plant at a fixed flow rate for periods
of time. If there is only one unit at that plant, there is little opportunity during these
periods to optimize efficiency. However, if there are multiple units at that plant, the
automation system can match the individual unit efficiencies in such a way as to
maximize the total flow requirement for the plant.
Headwater / Tailwater Elevation Control
Occasionally there is a requirement to operate a plant such that a particular
Headwater or Tailwater elevation is achieved. Just like the fixed turbine flow mode
there is little opportunity to optimize efficiency if there is only one unit. But, as long
as several units are available the automation system can match the individual unit
efficiencies to maximize plant efficiency while maintaining the water elevations.
Load Following / Automatic Generation Control
AGC is a topic which has caused much debate over the years among hydro utilities.
The power system operators want to utilize hydro units for AGC due to the rapid
response of the hydro units. Plant operation personnel tend to discourage that
practice due to the belief that it causes increased maintenance requirements and
reduced efficiency. Assuming that AGC is a requirement for the plant being
automated, the automation system can take the load set point supplied by the power
HAP – Best Practice Catalog – I&C for Automation
Rev. 1.0, 12/05/2011 293
system and calculate the most efficient loading of the individual units and still
achieve the required AGC needs.
Condensing / Reactive Power Control
Although there is no unit efficiency issue since no water is used in condensing mode,
it is still an operating mode that must be considered in the software design as many
units are operated this way for system voltage stability. In condensing mode, the
turbine gates are closed and depending on the design of the unit, water is either
naturally evacuated or a system of air compressors forces the water below the turbine
blades. The unit is then operated as a synchronous condenser to supply reactive
power to the power system for voltage control.
Automatic Load Reduction and Reinstatement for Temperature Considerations
High temperature conditions for plant equipment is one of the fundamental issues that
must be addressed. By supplying temperature sensors from plant equipment into the
automation system, the system can monitor and trend those temperatures to ensure all
components stay within their safe limits. One feature the automation system can
accomplish is to allow the individual components to operate close to limits, but then
if a temperature limit is reached, reduce loading to allow the temperature to stabilize
at safe levels. Then as conditions change, which affect the cooling of that
component, the automation system can automatically increase the load back to the
desired level. Temperature sensors are almost always included in the generators, unit
transformers, and critical bearings. Others critical to unit operation should be
included as available.
Sequence of Events and First Out
First out information should always be historically archived. This is critical information for
operations and troubleshooting. The first out information for trending originates from the
controller, not from comparing times of discrete alarms in the historical archive. Historical
archiving software is usually not fast enough to analyze events that may take place for high-
speed trips. First out alarming in high-speed applications, such as turbine control, is
configured in the control system. These discrete inputs are most commonly scanned at 1 ms
or faster. Standard discrete I/O is not normally scanned at this frequency.
The main controller should have a time sync program with a GPS clock. This accurate time
should be shared in all the controllers and HMIs.
The control system software frequently has prebuilt SOE (sequence of events) blocks or first
out blocks that capture the event that caused a system to trip or fail. This captured event is
then historically trended and displayed to the operator for a quick analysis as to what just
happened. A turbine can trip off line for many reasons. A high vibration trip will be
programmed in a first out block along with temperatures, speeds, power, operator action etc.
If a trip is caused by high vibration, it will be the trapped event in the first out block and
displayed to the operator. The operator will be able to quickly comprehend the cause of the

HAP – Best Practice Catalog – I&C for Automation
Rev. 1.0, 12/05/2011 294
trip and take appropriate action. A restart of the tripped turbine will automatically reset the
first out block and be ready to capture the next trip.
An alternate way of capturing first out events is to wire to an SOE device or high speed I/O
card in parallel to the normal control I/O. The software in the controller (not the historical
archiving software) will capture the individual times of each alarm. The actual time of the
alarm will traditionally be in the message portion of the alarm and not the time the alarm
appears in the archive. The operator will be required to look at all messages of the alarms in
the alarm archive and search for the time of the first event that caused the trip. This is a
common setup in systems that have evolved over the years and in older control systems that
are still in service.
3.3 Maintenance
Backing Up Systems – Disaster Recovery Plans
A disaster recovery plan is essential and must be part of a control system design. A disaster
can occur from a fire, corrupt data, failed systems, poor configuration with a download or
even sabotage. There should be a least two backup copies. On a scheduled basis (monthly or
quarterly, depending on how frequently changes are made to the system) a backup copy
should be made that is stored in a secure location offsite. There are companies that provide
this as a commercial service to IT departments. Primary backups should be made after any
change. Commercial software archiving programs are available to store backups. Images of
PC based systems on a frequent scheduled basis is also recommended. Historical data should
have a backup system as well. A plan for making backups should be made then adhered to.
It is critical to test a recovery system. There are numerous stories of backup systems that
were found to be ineffective. In some cases the backup tapes or disks were found to be blank
or the backup copies were corrupt.
Also, refer to NERC-CIP-009 ―Recovery Plans for Critical Cyber Assets‖
Patches and Software Updates or Changes
The NERC CIP-007-3 standard stresses the need to test modifications before installing the
changes in the field. This is to minimize adverse effects on the production system or its
operation. This includes verifying that no changes impact cyber security. Common
practice to date has been to make changes in a control system without first testing on a bench
or test system. The engineer or programmer has previously assumed no serious error or
complications will occur with a change. This recommended practice of testing, even for a
non-NERC site, will reduce errors in operations and create increased confidence from
operators and management in the quality of process control software changes. In practice,
the authors of this article have found the amount of time to test is quite minimal and has little
impact on perceived productivity of the programmer when the time required to correct errors
in the field with untested changes are taken into account.
HAP – Best Practice Catalog – I&C for Automation
Rev. 1.0, 12/05/2011 295
Vendor patches, such as Microsoft, Siemens, Emerson, Honeywell etc, should be tested in a
lab environment before field installation. Some vendors will test their software/hardware
with recent patches and inform customers of the safe installation of the patches.
Documentation
NERC CIP-003-3 standard outlines rigorous documentation requirements. All changes to a
control system need to be documented in a systematic manner.
Secure Passwords
All default passwords and/or administrative logins without passwords must be eliminated.
All administrative passwords must be kept secure. The passwords should be ‗strong‘. An
ideal password is long (8 characters or more) and includes letters, punctuation, symbols, and
numbers. It is permissible to write down passwords as it is difficult to memorize strong
passwords. These written passwords should be stored in a secure place. These documents
containing the passwords must be kept in a secure location. Refer also to NERC CIP-007-3
section 5.3.
Predictive Maintenance Software – Condition Monitoring
Condition monitoring measures the health of an asset through monitoring and analysis of
data. Common data monitoring points are vibration, temperature, wear, corrosion, pressure,
proximity and flow. Newer instrumentation, such as a HART™ enabled digital control valve
positioner, has digital feedback information to monitor hysteresis, valve stiction and
instrument air pressure. Data is monitored in real time to alert operations to potential
problems. Packages are available to predict required maintenance using these data points.
Maintenance is performed only when required.
From Hydro World Vol. 19 Issue 3: ―Most of the 1,560 MW of hydropower plants in Japan
are unmanned. Operations and maintenance of these plants are handled using a wide-area
maintenance system, in which one office manages multiple facilities. Unmanned plants are
equipped with remote monitoring systems that continuously record data from various
devices, such as tailrace level, turbine discharge, and generator vibration. Condition-based
maintenance is used…
Extending the periodic inspection and overhaul cycles makes it possible to reduce the
number of maintenance staff. Reducing the number of man-hours worked by engineers will
enable their centralization to hydro plants and their allocation to maintenance with DEDE
and other organizations. An estimated 2,025 man-hours can be saved by reducing the cycle of
periodic inspections and overhauls. For example, before the demonstration, 2,130 man-hours
were required for periodic inspection; this was reduced to 1,485 man-hours. For overhaul,
3,600 man-hours were required; this was reduced to 2,400 man-hours.‖
4.0 Metrics, Monitoring and Analysis
Various plant functions are required to be operated quickly and predictably in response to
changes in process variables or operator commands. Failure of the control system to execute a

HAP – Best Practice Catalog – I&C for Automation
Rev. 1.0, 12/05/2011 296
programmed response within a specific time frame will result in operator frustration and
dissatisfaction and may jeopardize the safety of personnel and equipment. To ensure that the
control system responds in a manner commensurate with the expectations of plant operations, the
real-time ability of the control system should be defined in terms of the minimum time that it
takes to process field events and operator-entered and program-generated commands.
Controls system response times are typically specified at the plant level. This excludes the
interface with offsite control centers. The response times for offsite control will vary depending
on the type and speed of the interconnecting communications link. In those situations, where the
response time from offsite control centers is critical, it is necessary that the communications
system be designed for secure, high-speed transmission with the plant control system.
The response time of the control system will depend on the system loading at the time of the
event or control action as defined by its CPU and network load rate.
The CPU load rate is typically computed as a percentage of CPU capacity for "normal" and
"worst case" system loading scenarios. A normal operating scenario is defined to be one where
all field values are being updated at the required periodicity, a minimum number of active
windows are open at the operator interface, communications are in normal configuration,
application programs are in operation, and normal plant start/stop operations are being
undertaken. A "worst case" scenario is typically a case where there are multiple unit trips in a
short period of time. Such a condition has the effect of increasing the number of I/O (either field
devices or operator-generated commands) that are simultaneously changing state.
Typical CPU load rates for normal operating scenarios are in the range of 40-60%. Some
controllers set a percentage of CPU for logic and another percentage for communications. For
worst-case loading scenarios, the CPU load rate will typically vary between 50-75% total. The
network load (TCP/IP) should be less than 30% in the worst case scenario.
The time interval between the moments that a command is issued at the operator interface to the
time the feedback (such as motor status) is displayed at the HMI should not exceed 1-2 seconds.
The time interval between the moments that a command has been issued at the operator interface
to the time that the command is transmitted to the field device should be under 1 second. Ideally,
discrete commands should be transmitted to the device in less than 200ms. The majority of I/O
device drivers place a priority on write commands (write commands or operator inputs will
normally execute before read commands) so that there is a quick response in the field to an
operator screen input.
The time interval between the moments that a status change occurs at an input at the control
system I/O to the time that the status change is displayed at one of the operator interfaces, should
not exceed 1-2 seconds.
Update times to the system-wide database should be less than 1 second and typically range from
100 to 500 ms, depending on the type of I/O (digital input, analog input, or accumulator) and
system loading.

HAP – Best Practice Catalog – I&C for Automation
Rev. 1.0, 12/05/2011 297
Intrusion detection has historically been strictly an IT (information technology) function. This is
falling upon process control engineers now. Intrusion detection logs should be automated and
inspected by the process control engineer and IT. There should be no successful intrusion
attempts.
Syslogs and firewall logs have also been an IT only function. Process control engineers should
review these on a periodic basis.
Actionable alarms should not exceed 10 per hour. Ideally these alarms should not exceed 6 per
hour per operator.
5.0 Information Sources:
Baseline Knowledge:
IEEE Std 1249:1996, IEEE Guide for Computer Based Control for Hydroelectric Power
Plant Automation.
IEEE Std 1249:2010 working copy, IEEE Guide for Computer Based Control for
Hydroelectric Power Plant Automation.
FISMA (NIST 800-53), Recommended Security Controls for Federal Information Systems
and Organizations, NIST Special Publication 800-53.
The FISMA Implementation Project was established in January 2003 to produce several
key security standards and guidelines required by the FISMA legislation. As a key
element of the FISMA Implementation Project, NIST also developed additional guidance
(in the form of Special Publications) and a Risk Management Framework which
effectively integrates all of NIST‘s FISMA-related security standards and guidelines in
order to promote the development of comprehensive, risk-based, and balanced
information security programs by federal agencies. The Risk Management Framework
and the associated publications are available at:
http://csrc.nist.gov/publications/PubsSPs.html.
The National Institute of Standards and Technology (NIST) 800-53 provides recommended
security controls of federal information systems and is used to determine the baseline
security controls for the system. Federal IT systems must adhere to these security guidelines
to comply with FISMA. The section that pertains to hydroelectric control systems is in
appendix I of NIST 800-53.
United States Computer Emergency Readiness Team
The continuously updated site: http://www.uscert.gov/control_systems/
The goal of the DHS National Cyber Security Division's CSSP is to reduce industrial
control system risks within and across all critical infrastructure and key resource sectors
by coordinating efforts among federal, state, local, and tribal governments, as well as
industrial control systems owners, operators and vendors. The CSSP coordinates

HAP – Best Practice Catalog – I&C for Automation
Rev. 1.0, 12/05/2011 298
activities to reduce the likelihood of success and severity of impact of a cyber attack
against critical infrastructure control systems through risk-mitigation activities.
National Communications System, Supervisory Control and Data Acquisition (SCADA)
Systems, NCS Technical Information Bulletin 04-1, Oct. 2004.
http://www.ncs.gov/library/tech_bulletins/2004/tib_04-1.pdf
Hydro Life Extension Modernization Guide, Volume 7 – Protection and Control, EPRI, Palo
Alto, CA: 2000. TR-112350-V7.
State of the Art:
ANSI/ISA ISA 18.00.02-2009 ―Management of Alarm Systems for the Process Industries‖.
Juniper Networks, http://www.juniper.net/us/en/local/pdf/whitepapers/2000276-en.pdf, 2010
ASM Consortium, See http://www.asmconsortium.net. Refer also this white paper:
http://www.asmconsortium.net/Documents/OpInterfaceReqts_GoBeyond_Jan09.pdf
National Institute of Standards and Technology's (NIST) Advanced Technology Program
assisted in funding this technology.
Hydro World Vol. 19 Issue 3
CERN: Large Hadron Collider Project, Power Point Presentation, http://machine-
interlocks.web.cern.ch/machine-
interlocks/Presentations/PIC/Powering%20Interlocks%20Reliability_from_MZS.ppt
Power Engineering, Upgraded SCADA System Gives Hydro Plant Greater Reliability and
Room to Grow, http://www.power-eng.com/articles/print/volume-103/issue-
10/features/upgraded-scada-system-gives-hydro-plant-greater-reliability-and-room-to-
grow.html, 1999
Standards:
IEEE Std 1010:2006, IEEE Guide for Control of Hydroelectric Power Plants
National Electric Reliability Council NERC-CIP 002-009 Summary http://www.nerc.com/
CIP-002-3 ―Critical Cyber Asset Identification‖
Standard CIP-002 requires the identification and documentation of the Critical Cyber
Assets associated with the Critical Assets that support the reliable operation of the Bulk
Electric System. These Critical Assets are to be identified through the application of a
risk-based assessment.
CIP-003-3 ―Security Management Controls‖
Standard CIP-003 requires that Responsible Entities have minimum security management
controls in place to protect Critical Cyber Assets.
CIP-004-3 ―Personnel and Training‖

HAP – Best Practice Catalog – I&C for Automation
Rev. 1.0, 12/05/2011 299
Standard CIP-004 requires that personnel having authorized cyber or authorized
unescorted physical access to Critical Cyber Assets, including contractors and service
vendors, have an appropriate level of personnel risk assessment, training, and security
awareness.
CIP-005-3 ―Electronic Security Perimeters‖
Standard CIP-005 requires the identification and protection of the Electronic Security
Perimeter(s) inside which all Critical Cyber Assets reside, as well as all access points on
the perimeter. All access points to the control system need to be documented. It is
common for vendor or remote maintenance dial up access to be tied to a hydro control
system. These should be eliminated whether a facility is under NERC or not. Access
should be secured through firewalls and the use of VPNs. All access should be logged.
CIP-006-3 ―Physical Security of Critical Cyber Assets‖
Standard CIP-006 is intended to ensure the implementation of a physical security
program for the protection of Critical Cyber Assets.
CIP-007-3 ―Systems Security Management‖
Standard CIP-007 requires Responsible Entities to define methods, processes, and
procedures for securing those systems determined to be Critical Cyber Assets, as well as
other other (non-critical) Cyber Assets within the Electronic Security Perimeter(s).
CIP-008-3 ―Incident Reporting and Response Planning‖
Standard CIP-008-3 ensures the identification, classification, response, and reporting of
Cyber Security Incidents related to Critical Cyber Assets.
CIP-009-3 ―Recovery Plans for Critical Cyber Assets‖
Standard CIP-009 ensures that recovery plan(s) are put in place for Critical Cyber Assets
and that these plans follow established business continuity and disaster recovery
FISMA (NIST 800-82), Industrial Control System Security, NIST Special Publication 800-
82, http://csrc.nist.gov/groups/SMA/fisma/ics/documents/oct23-2009-workshop/nist-
ics3_10-23-2009.pdf

Best Practice Catalog
Machine Condition Monitoring
Revision 1.0, 12/02/2011

HAP – Best Practice Catalog – Machine Condition Monitoring
Rev. 1.0, 12/02/2011 301
1.0 Scope and Purpose ........................................................................................................... 302
1.1 Hydropower Taxonomy Position ................................................................................. 302
1.1.1 Condition Monitoring Components and Measurements ....................................... 302
1.2 Summary of Best Practices .......................................................................................... 307
1.3 Best Practice Cross-references ..................................................................................... 307
2.0 Technology Design Summary .......................................................................................... 308
2.1 Technological Evolution and Design Technology ....................................................... 308
2.2 State of the Art Technology ......................................................................................... 308
3.0 Operation & Maintenance Practices ................................................................................ 310
3.1 Condition Assessment .................................................................................................. 310
3.2 Operations .................................................................................................................... 310
3.3 Maintenance ................................................................................................................. 313
4.0 Metrics, Monitoring and Analysis ................................................................................... 313
4.1 Measures of Performance, Condition, and Reliability ................................................. 313
4.2 Analysis of Data ........................................................................................................... 313
4.3 Integrate Improvements................................................................................................ 313
5.0 Information Sources ......................................................................................................... 314
HAP – Best Practice Catalog – Machine Condition Monitoring
Rev. 1.0, 12/02/2011 302
1.0 Scope and Purpose
Condition monitoring of hydroelectric power generating units is essential to protect against
sudden failure. Fault development can occur very quickly. Many hydro units are located in
remote areas making regular inspection difficult. It is required to have a monitoring system that
continuously checks machine condition, remotely indicates the onset of a fault and provides the
possibility of preventative automatic shutdown.
Hydroelectric turbine-generators are subject to forces and operating conditions unique to their
operation and configuration. They typically operate at low rotational speeds. Their physical
mass and slow rotational speeds give rise to large vibration amplitudes and low vibration
frequencies. This requires a monitoring system with special low frequency response capabilities.
1.1 Hydropower Taxonomy Position
Hydropower Facility → Powerhouse → Instrument and Controls → I&C for Condition
Monitoring
1.1.1 Condition Monitoring Components and Measurements
Performance and reliability related components are primarily centered on the turbine and
generator. The primary components are proximity probes (used for vibration and air
gap), temperature probes and speed indication.
Eddy current transducers (proximity probes) are the choice of vibration transducer and
monitoring. Eddy current transducers are the only transducers that provide shaft relative
(shaft relative to the bearing) vibration measurement.
Several methods are usually available for the installation of eddy current transducers,
including internal, internal/external, and external mounting. Before selecting the
appropriate method of mounting, special consideration needs to be given to several
important aspects of installation that will determine the success of monitoring.
Eddy current transducers work on the proximity theory of operation. An eddy current
system consists of a matched component system: a probe, an extension cable and an
oscillator /demodulator. A high frequency RF (radio frequency) signal is generated by the
oscillator/demodulator, sent through the extension cable and radiated from the probe tip.
Eddy currents are generated in the surface of the shaft. The oscillator/demodulator
demodulates the signal and provides a modulated DC Voltage where the DC portion is
directly proportional to gap (distance) and the AC portion is directly proportional to
vibration. In this way, an eddy current transducer can be used for both radial vibration
and distance measurements such as thrust position and shaft position. [2]

HAP – Best Practice Catalog – Machine Condition Monitoring
Rev. 1.0, 12/02/2011 303
Figure 1: Typical eddy current transducer curve
Guide Bearing Vibration Probe
By measuring vibration at generator and turbine guide bearings, various sources of
unbalance, shear pin failure, bearing problems and wicket gate problems can be
determined. [1]
Gap
Gap indicates the distance between the probe tip and the shaft. It is determined by
filtering out the dynamic signal (AC portion of the waveform) and looking only at the
DC portion of the waveform. This is shown in Figure 1.
Thrust Bearing Oil Film Thickness
Large vertical hydro units can weigh over 1,000 tons, with the unit‘s entire weight
carried by the thrust bearing. An absence or reduction in oil film thickness at the
thrust pads results in rapid breakdown of the bearing babbit which can further lead to
in rotor/bearing damage if the oil film is not corrected. On hydro units, the thrust
bearing shoes are fitted with proximity probes observing the thrust collar, providing a
measurement of oil film thickness.
Guide Bearing Temperatures
Bearing temperature can indicate problems related to fluid-film bearings, including
overload, bearing fatigue, or insufficient lubrication. One RTD (resistance
temperature device) or thermocouple sensor is installed per bearing pad.
Thrust Bearing Temperatures
Bearing temperature can indicate problems related to fluid-film bearings, including
overload, bearing fatigue, or insufficient lubrication. One RTD or thermocouple
sensor is installed per bearing pad.
Keyphasor® Signal (Trademark Bently-Nevada)
A proximity probe observing a once-per-turn notch or protrusion (such as a key or
keyway) on the machine‘s shaft provides a precise reference signal used for

HAP – Best Practice Catalog – Machine Condition Monitoring
Rev. 1.0, 12/02/2011 304
indicating rotational speed, filtering vibration to multiples of running speed (such as
1X, NOT 1X, and NX – see definitions below), providing vibration phase information,
and allowing air gap profile data. The proximity transducer is generally mounted
near the upper guide bearing. The shaft‘s notch or projection should align with an
established reference on the rotor such as the generator‘s #1 pole.
1X Amplitude and Phase
This is a measurement of the vibration that is synchronous with rotor speed (1X). A
tracking filter with a Q (see fig. 2.) of 18 is used to attenuate all other components.
This measurement is valid at speeds between 25 rpm and 1500 rpm, which is
applicable for most hydro-turbines. This measurement is used to determine
acceptance regions and provide data for detecting forced vibrations that may be
introduced by bearing wear, unbalance, wicket gate damage, blade damage, generator
faults, debris passing through the machine, and other conditions. An amplitude
and/or phase change can be indicative of the above conditions. [4]
NOT 1X
This is an overall vibration measurement with the 1X component attenuated. This is
a measurement of all vibration components except those occurring at shaft rotative
speed. This measurement uses a tracking filter with a Q of 18 to attenuate the 1X
component. With the 1X signal attenuated, which is usually the predominant
component in hydro-turbines, the remaining signal will be the sub-synchronous
vibration due to rough zone conditions or super-synchronous vibration. Therefore, the
NOT 1X is the primary measurement used for rough zone vibration. Cavitation occurs
during partial loads and running closer or below minimum operating level of the turbine.
That operating range, where cavitation occurs, is considered to be in the rough zone. In
Francis turbines, for example, cavitation damage is visible in the edges of the runner and
draft tube.
In addition to alarm set-points, an option can be implemented on the NOT 1X
measurement for enabling or disabling a trip. This may be used to prevent other
alarming while the hydro-turbine passes through the rough zone. Alarm delays may
also be set to allow time for the hydro-turbine to pass through this zone. [4]
NX (Amplitude and Phase)
This is a measurement of the vibration that is an integer multiple (nX) of the rotor
speed. A tracking filter with a Q of 18 is used to attenuate all other components. ―N‖
may be configured to an integer value selected by the operator. Typically, this is used
to detect guide vane blockage or shear pin failure, but may be used for detection of
other faults that will cause super-synchronous vibrations. One major cause of super-
synchronous vibration is reduced water flow through a wicket gate. This will cause a
low-pressure region, and each time a blade or bucket passes through it, an impulse is
felt on the rotor causing a super-synchronous vibration equal to the
number of blades. Setting ―N‖ to equal the number of blades will cause the NX
amplitude and phase to be detected. [4]
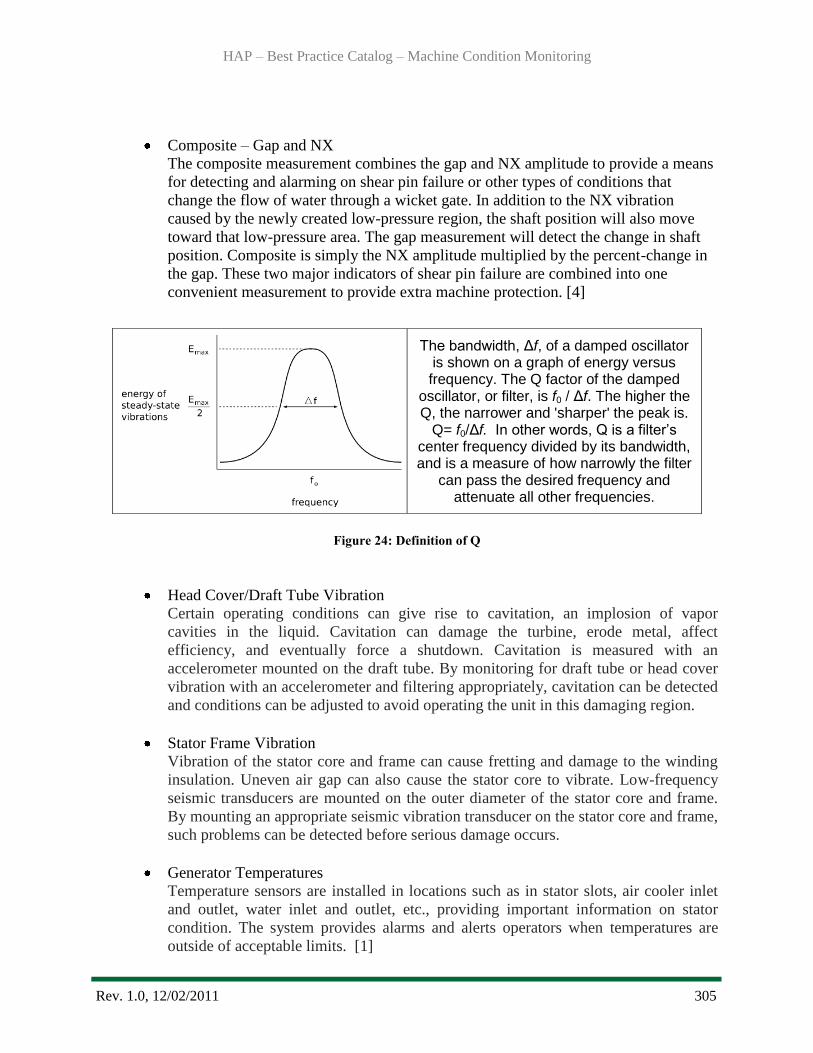
HAP – Best Practice Catalog – Machine Condition Monitoring
Rev. 1.0, 12/02/2011 305
Composite – Gap and NX
The composite measurement combines the gap and NX amplitude to provide a means
for detecting and alarming on shear pin failure or other types of conditions that
change the flow of water through a wicket gate. In addition to the NX vibration
caused by the newly created low-pressure region, the shaft position will also move
toward that low-pressure area. The gap measurement will detect the change in shaft
position. Composite is simply the NX amplitude multiplied by the percent-change in
the gap. These two major indicators of shear pin failure are combined into one
convenient measurement to provide extra machine protection. [4]
Figure 24: Definition of Q
Head Cover/Draft Tube Vibration
Certain operating conditions can give rise to cavitation, an implosion of vapor
cavities in the liquid. Cavitation can damage the turbine, erode metal, affect
efficiency, and eventually force a shutdown. Cavitation is measured with an
accelerometer mounted on the draft tube. By monitoring for draft tube or head cover
vibration with an accelerometer and filtering appropriately, cavitation can be detected
and conditions can be adjusted to avoid operating the unit in this damaging region.
Stator Frame Vibration
Vibration of the stator core and frame can cause fretting and damage to the winding
insulation. Uneven air gap can also cause the stator core to vibrate. Low-frequency
seismic transducers are mounted on the outer diameter of the stator core and frame.
By mounting an appropriate seismic vibration transducer on the stator core and frame,
such problems can be detected before serious damage occurs.
Generator Temperatures
Temperature sensors are installed in locations such as in stator slots, air cooler inlet
and outlet, water inlet and outlet, etc., providing important information on stator
condition. The system provides alarms and alerts operators when temperatures are
outside of acceptable limits. [1]
The bandwidth, Δf, of a damped oscillator is shown on a graph of energy versus frequency. The Q factor of the damped
oscillator, or filter, is f0 / Δf. The higher the Q, the narrower and 'sharper' the peak is.
Q= f0/Δf. In other words, Q is a filter’s center frequency divided by its bandwidth, and is a measure of how narrowly the filter
can pass the desired frequency and attenuate all other frequencies.
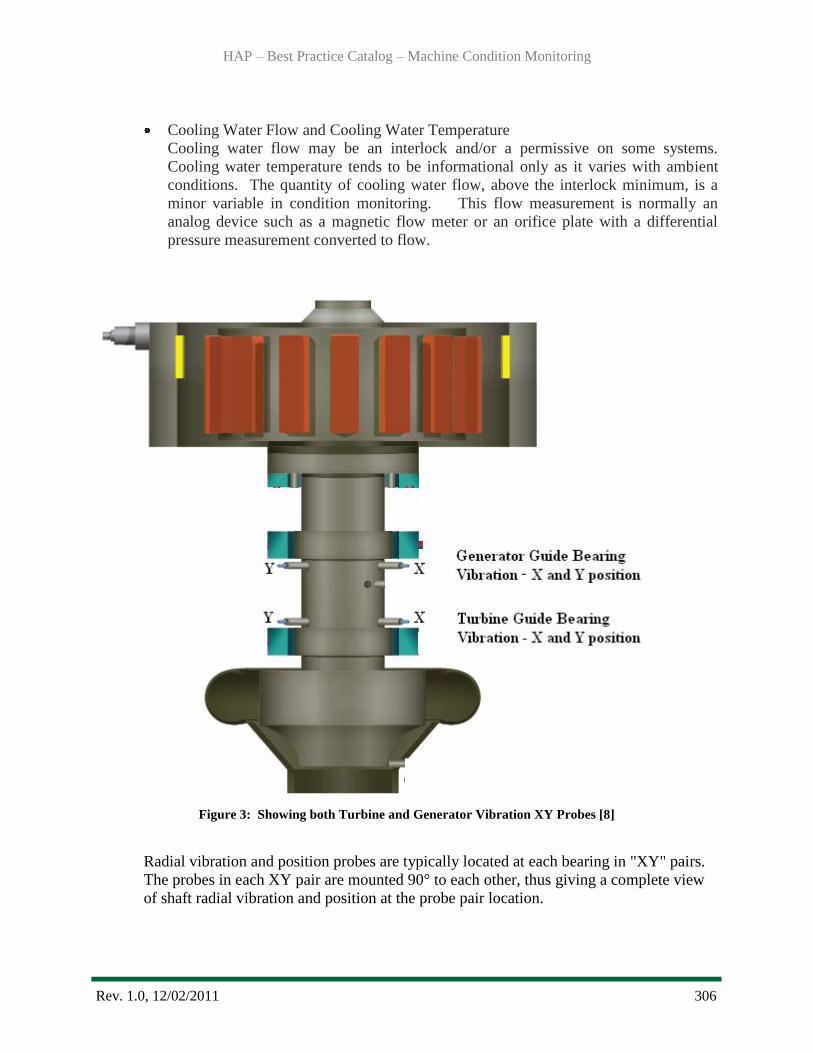
HAP – Best Practice Catalog – Machine Condition Monitoring
Rev. 1.0, 12/02/2011 306
Cooling Water Flow and Cooling Water Temperature
Cooling water flow may be an interlock and/or a permissive on some systems.
Cooling water temperature tends to be informational only as it varies with ambient
conditions. The quantity of cooling water flow, above the interlock minimum, is a
minor variable in condition monitoring. This flow measurement is normally an
analog device such as a magnetic flow meter or an orifice plate with a differential
pressure measurement converted to flow.
Figure 3: Showing both Turbine and Generator Vibration XY Probes [8]
Radial vibration and position probes are typically located at each bearing in "XY" pairs.
The probes in each XY pair are mounted 90° to each other, thus giving a complete view
of shaft radial vibration and position at the probe pair location.
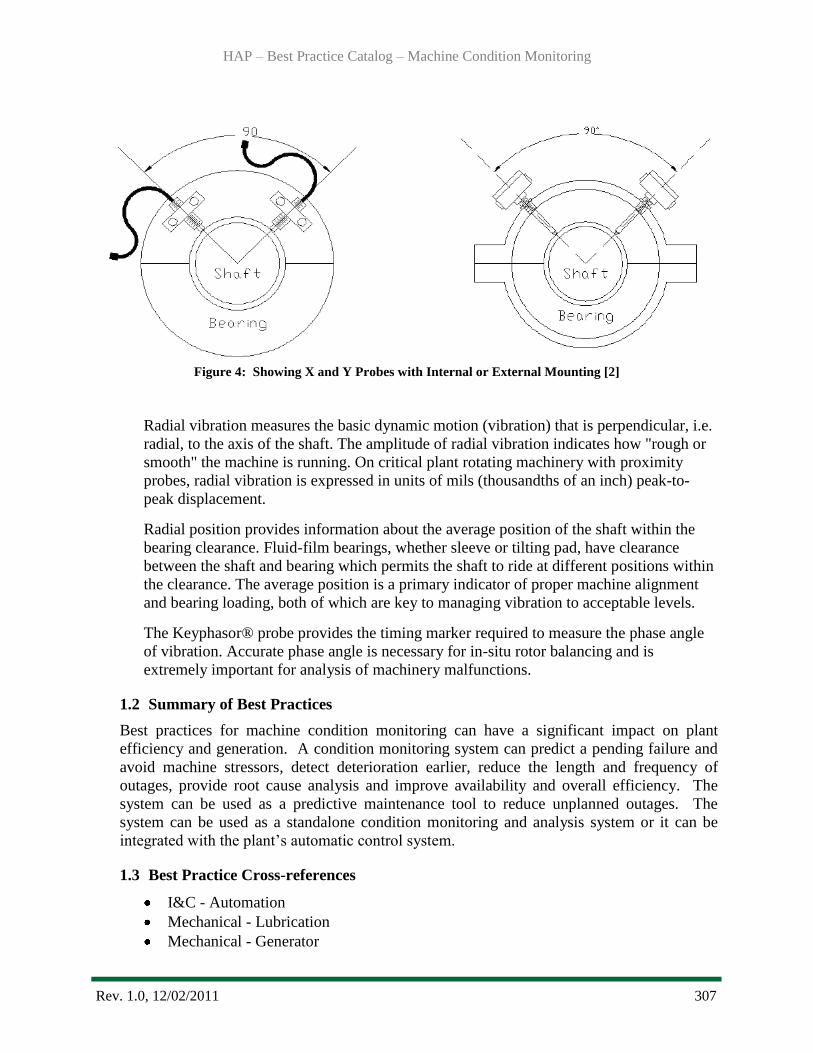
HAP – Best Practice Catalog – Machine Condition Monitoring
Rev. 1.0, 12/02/2011 307
Figure 4: Showing X and Y Probes with Internal or External Mounting [2]
Radial vibration measures the basic dynamic motion (vibration) that is perpendicular, i.e.
radial, to the axis of the shaft. The amplitude of radial vibration indicates how "rough or
smooth" the machine is running. On critical plant rotating machinery with proximity
probes, radial vibration is expressed in units of mils (thousandths of an inch) peak-to-
peak displacement.
Radial position provides information about the average position of the shaft within the
bearing clearance. Fluid-film bearings, whether sleeve or tilting pad, have clearance
between the shaft and bearing which permits the shaft to ride at different positions within
the clearance. The average position is a primary indicator of proper machine alignment
and bearing loading, both of which are key to managing vibration to acceptable levels.
The Keyphasor® probe provides the timing marker required to measure the phase angle
of vibration. Accurate phase angle is necessary for in-situ rotor balancing and is
extremely important for analysis of machinery malfunctions.
1.2 Summary of Best Practices
Best practices for machine condition monitoring can have a significant impact on plant
efficiency and generation. A condition monitoring system can predict a pending failure and
avoid machine stressors, detect deterioration earlier, reduce the length and frequency of
outages, provide root cause analysis and improve availability and overall efficiency. The
system can be used as a predictive maintenance tool to reduce unplanned outages. The
system can be used as a standalone condition monitoring and analysis system or it can be
integrated with the plant‘s automatic control system.
1.3 Best Practice Cross-references
I&C - Automation
Mechanical - Lubrication
Mechanical - Generator

HAP – Best Practice Catalog – Machine Condition Monitoring
Rev. 1.0, 12/02/2011 308
Mechanical – Governor
Mechanical – Raw Water
2.0 Technology Design Summary
2.1 Technological Evolution and Design Technology
Vibration analysis was typically performed by a mechanic or the operator by observing a dial
indicator. This is still the only method in older facilities. Recent developments in vibration
sensor, data acquisition, and analysis technologies, however, are making vibration analysis
cheaper, easier, and more widely available.
Air gap and vibration data is now being incorporated into model-based diagnostics. Models
create virtual sensors where physical sensors are not able to be installed. An example is
where real data from physical sensors mounted on the bearings at the shaft ends, is used to
create a virtual sensor for mid-span vibration.
Detailed analysis is now available in near real time for stator insulation failure, stator
grounding issues and stator vibration. These problems were previously only determined by
expensive shutdowns and testing when the unit is disabled. Even when the unit is down, it
can be very difficult to identify stator problems. The testing is expensive and time
consuming. In the last few years, measuring magnetic flux using a variety of partial
discharge sensors has evolved to be a viable tool for checking for generator problems using
model-based diagnostics.
2.2 State of the Art Technology
State of the art cannot be discussed without mentioning the hardware required. Having all
the sensors mounted, as listed below, and tied to supervisory system that has model-based
software is the state of the art.
State of the Art Turbine Measurements: (See Figure 5.)
2-axis guide bearing vibration
Guide bearing temperature
Guide bearing housing seismic
Draft tube vibration (may include head cover vibration)
Rotational speed
Seal ring position/blade clearance
Cooling water flow
Wicket gate position
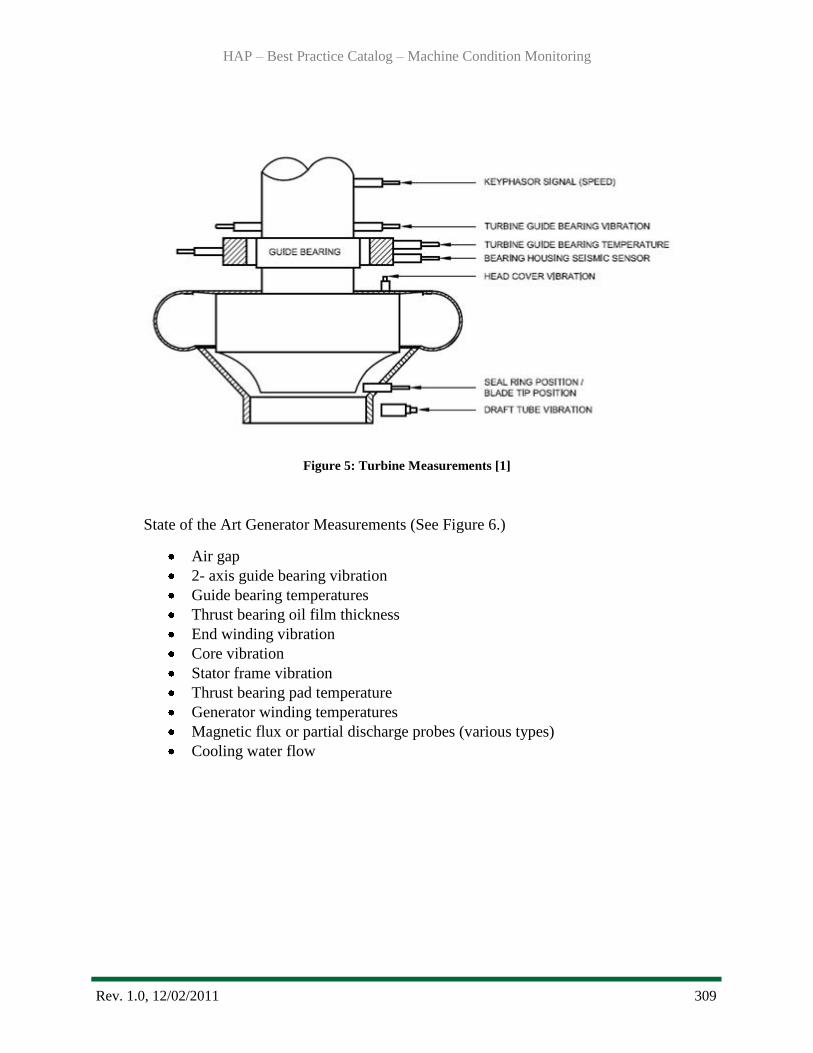
HAP – Best Practice Catalog – Machine Condition Monitoring
Rev. 1.0, 12/02/2011 309
Figure 5: Turbine Measurements [1]
State of the Art Generator Measurements (See Figure 6.)
Air gap
2- axis guide bearing vibration
Guide bearing temperatures
Thrust bearing oil film thickness
End winding vibration
Core vibration
Stator frame vibration
Thrust bearing pad temperature
Generator winding temperatures
Magnetic flux or partial discharge probes (various types)
Cooling water flow
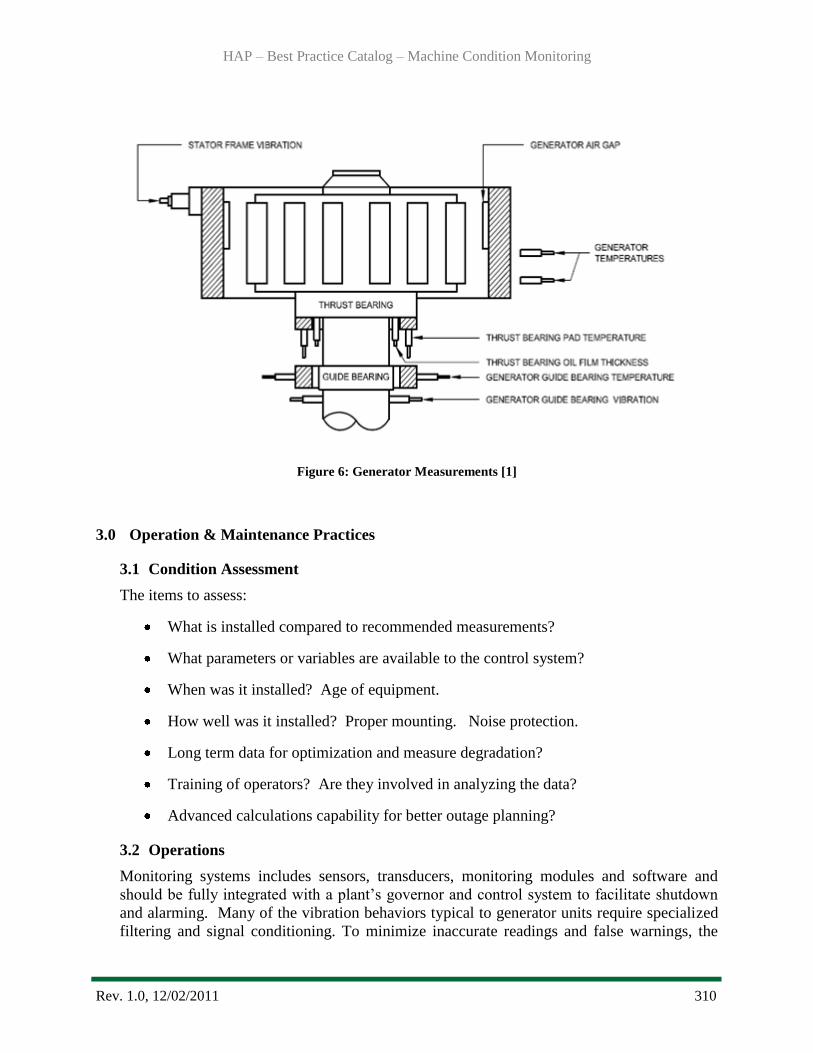
HAP – Best Practice Catalog – Machine Condition Monitoring
Rev. 1.0, 12/02/2011 310
Figure 6: Generator Measurements [1]
3.0 Operation & Maintenance Practices
3.1 Condition Assessment
The items to assess:
What is installed compared to recommended measurements?
What parameters or variables are available to the control system?
When was it installed? Age of equipment.
How well was it installed? Proper mounting. Noise protection.
Long term data for optimization and measure degradation?
Training of operators? Are they involved in analyzing the data?
Advanced calculations capability for better outage planning?
3.2 Operations
Monitoring systems includes sensors, transducers, monitoring modules and software and
should be fully integrated with a plant‘s governor and control system to facilitate shutdown
and alarming. Many of the vibration behaviors typical to generator units require specialized
filtering and signal conditioning. To minimize inaccurate readings and false warnings, the
HAP – Best Practice Catalog – Machine Condition Monitoring
Rev. 1.0, 12/02/2011 311
monitoring system must be designed to operate long-term with the expected mechanical
loads in a humid environment. The condition monitoring system should have features to
prevent false alarms. Typically, the vibration signals must exceed preset limits for a specified
time period before warning is given to reduce false trip signals. The monitoring system
should also take into account rough zones that may be experienced due to low loads during
start-ups.
Turbines in hydroelectric power plants must be able to withstand stresses as a result of rapid
starts, stops and partial loading. These stresses induce fatigue that accumulates and
eventually leads to damage. Wear to the journal bearings, damage to the runner blades from
corrosion, cavitation and/or foreign particles in the water supply are other common problems.
In many cases, the damage could be avoided with a condition monitoring system and
methodology.
Air gap is a measure of the distance between rotor and stator in the hydro generator.
Monitoring of air gap is important as both the stator and the rotor on large hydro machines
can be quite flexible, and their shape and location are affected by operating centrifugal,
thermal, and magnetic forces. Off-center or out-of-round conditions will at least reduce
operating efficiency and in more severe cases can lead to damage from magnetically induced
heating or a rotor-to-stator rub. [6]
When a hydro-generator rotor system is balanced and aligned properly, the shaft should spin
within the confines of the guide bearings without much force being exerted against these
bearings. Clearance of guide bearings can be estimated based on data that is acquired during
unit startup. This is because the shaft moves in a random ―orbit‖ throughout the clearance set
by the guide bearings for the first few revolutions during unit startup. Therefore, when
measuring shaft movement for the first few revolutions, (when the radial forces are not
significant because of low speed – e.g. 8 orbits after start-up) guide bearing clearance can be
estimated quite accurately using orbit analysis. This data can be collected for various
temperature conditions of the guide bearings for both cold and hot conditions. [5]
Overall reliability and effective operation of a monitoring and protection system is related to
a variety of factors including the following: required range of transducers, location of XY
transducers, transducer cable routing and available functionality of the monitoring system.
On many hydro-generators, it is simple to replace a transducer if there is an operational
problem. However, for some hydro-generators, transducers have to operate in an enclosed
space, where quick probe replacement can be problematic. Therefore, for hydro-generators, it
is important to consider installing redundant XY-transducers to increase the reliability of the
monitoring and protection system. The redundant transducers can be fixed:
1) Opposite of the current shaft observing XY-transducers, and/or
2) Without significant angular shift when compared to the existing XY-transducers, and/or
3) Without significant axial shift when compared to the existing XY-transducers.
The term ―shift‖ means that the distance between the two sets of probe tips has to be greater
than the probe separation recommendations in the transducer‘s technical documentation. If

HAP – Best Practice Catalog – Machine Condition Monitoring
Rev. 1.0, 12/02/2011 312
this condition is not met, then an interaction between both transducers can occur, (often
called cross-talk) decreasing signal to noise ratio. [5]
Partial discharge monitoring or analysis (magnetic flux) is a relatively new development. It
requires an advanced software package and a good understanding of the unit being
monitored. It can determine in real time a failure of stator insulation, stator grounding
problems or stator vibration. Stator anomalies, such as stator vibration, are frequently
difficult to isolate when the unit is down for maintenance.
Vibration monitoring remains the most effective technique for detecting the widest range of
machine faults, but a number of other techniques are available for specialized monitoring, as
seen in the Table 1.
Table 1: Condition Monitoring Techniques [9]
Vibration
Air
Gap
Magnetic
Flux
Process
Values Cavitation
Mechanical and Bearing
Unbalance X
Misalignment X
Rotor rub X
Foundation problems X
Loose bearings X
Oil and lubrication
X
Stator or rotor bar problems
X
Generator
Stator bar/core vibration X
Air gap problems
X X
Rotor/stator out of roundness
X
Loose/shorted stator bars or
faulty insulation or stator
vibration
X
Turbine
Turbine runner/blade problems X
Wicket gate problems X
Turbine blade cavitation X
X
HAP – Best Practice Catalog – Machine Condition Monitoring
Rev. 1.0, 12/02/2011 313
3.3 Maintenance
Air gap dimension along with rotor and stator shape cannot be effectively measured with the
generator out of service because of the combined effects of centrifugal, thermal, and
magnetic forces. Early detection of air gap anomalies will facilitate condition-based
maintenance by providing the user with important machine data necessary to plan for repairs
before scheduled outages. Long term trending of gap and shapes can be correlated with
operating conditions and used in operational and rehabilitation planning. Knowing the rotor
and stator shapes and minimum air gap dimensions provides the operator with the
information needed to remove a machine from service before serious damage like that from a
rotor-to-stator rub occurs. [6]
4.0 Metrics, Monitoring and Analysis
4.1 Measures of Performance, Condition, and Reliability
Failure modes that the condition monitoring system helps predict:
Wicket gate shear pin failures
Cavitation
Blade and shaft cracks
Bearing rub, fatigue and overload
Insufficient bearing lubrication
Mechanical unbalance or misalignment
Seal and discharge ring distortion
Insulation breakdown is the ultimate failure in any power generation device. The following
faults will lead to the eventual breakdown of insulation.
Air gap reduction/rub
Cooling fault
Winding vibration
Insulation aging (not directly measureable)
4.2 Analysis of Data
There are numerous software packages available to analyze data from condition monitoring
sensors. The high speed data can only be analyzed with computer software that creates
charts, calculates variables such as vibration frequencies, changes in air gap etc. Operators
should also be trained to interpret the data and understand how the conditioning monitoring
system functions. The operators will then learn to trust the data and use the data for the best
local decisions for the plant.
4.3 Integrate Improvements
The best way to gain the benefits of a monitoring system is to take advantage of the
economic opportunities offered by various modernization, refurbishment, and new projects to
HAP – Best Practice Catalog – Machine Condition Monitoring
Rev. 1.0, 12/02/2011 314
introduce the system and to adapt maintenance practices accordingly. The monitoring system
is a major input to a condition-based maintenance program and is a key contributor to
capitalizing on high market prices.
The cost of the monitoring system is low compared with the cost of a new power plant. A
new plant should automatically be equipped with a monitoring system to minimize
maintenance outage periods and to help the unit owner to stay well-informed of the condition
of the equipment. [7]
5.0 Information Sources:
GE Energy, Condition Monitoring Solutions for Hydro – Bently Nevada Asset Condition
Monitoring, 2005
STI Vibration Monitoring, Eddy Current Transducer Installation,
http://www.stiweb.com/appnotes/PDF%20Files/radial.pdf
Bruel & Kjaer, Permanent Vibration monitoring on a Hydroelectric Generating Set,
http://www.bksv.com/doc/bo0285.pdf
Orbit, Exploring the New 3500 Hydro Monitor, 3rd
Quarter 2000, http://www.ge-
mcs.com/download/monitoring/3q00cohen.pdf
Orbit, XY Measurements for Radial Position and Dynamic Motion in Hydro Turbine Generators,
Vol. 30 No. 1, 2010
GE Fact Sheet, Hydro Generator Air Gap Monitoring, http://www.gepower.com/o&c/hydro
Hydro World, Equipment Monitoring: Equipment Condition Monitoring: Sharing Experience,
http://www.hydroworld.com/index/display/article-display/361643/articles/hydro-review/volume-
27/issue-2/feature-articles/equipment-monitoring-equipment-condition-monitoring-sharing-
experience.html
Orbit, Condition Monitoring for Hydro Machinery, 2nd
Quarter, 2004
Bruel & Kjaer Vibro, Monitoring Solutions, http://www.bkvibro.com/monitoring-
solutions/industries/power-generation/hydroelectric-power-generation/faults-detected.html
Hydro Life Extension Modernization Guide, Volume 7 – Protection and Control, EPRI, Palo
Alto, CA: 2000. TR-112350-V7.
Rev. 1.0, 12/20/2011
315
Best Practice Catalog
Francis Turbine Aeration
Revision 1.0, 12/20/2011
HAP – Best Practice Catalog – Francis Turbine Aeration
Rev. 1.0, 12/20/2011 316
1.0 Scope and Purpose ........................................................................................................... 317
1.1 Hydropower Taxonomy Position ................................................................................. 317
1.1.1 Components of a Francis Turbine Aeration System ............................................. 317
1.2 Summary of Best Practices .......................................................................................... 321
1.2.1 Best Practices Related to Performance/Efficiency and Capability .................. 321
1.2.2 Best Practices Related to Reliability and Operations & Maintenance ............ 321
1.3 Best Practice Cross-references ..................................................................................... 321
2.0 Technology Design Summary .......................................................................................... 322
2.1 Technology Evolution .................................................................................................. 322
2.2 State of the Art Technology ......................................................................................... 323
3.0 Operation & Maintenance Practices ................................................................................ 325
3.1 Condition Assessment .................................................................................................. 325
3.2 Operations ................................................................................................................. 326
3.3 Maintenance .............................................................................................................. 327
4.0 Metrics, Monitoring, and Analysis .................................................................................. 327
4.1 Measures of Performance, Condition, and Reliability ................................................. 327
4.2 Data Analyses ............................................................................................................... 328
4.3 Integrated Improvements.............................................................................................. 329
5.0 Information Sources: ........................................................................................................ 329

HAP – Best Practice Catalog – Francis Turbine Aeration
Rev. 1.0, 12/20/2011 317
1.0 Scope and Purpose
This best practice for Francis turbine aeration addresses the technology, condition assessment,
operations, and maintenance best practices with the objective to maximize the unit performance
and reliability. The primary purpose of a Francis turbine aeration system is to provide air into the
turbine as a way of increasing the downstream dissolved oxygen (DO) level for environmental
enhancement.
Hydropower plants likely to experience problems with low DO include those with a reservoir
depth greater than 50 feet, power capacity greater than 10 MW, and a retention time greater than
10 days [3, 6]. In general, these include plants with watersheds yielding moderate to heavy
amounts of organic sediments and located in a climate where thermal stratification isolates
bottom water from oxygen-rich surface water. At the same time, organisms and substances in the
water and sediments consume and lower the DO in the bottom layer. For plants with bottom
intakes, this low DO water often creates problems downstream from the reservoir, including
possible damage to aquatic habitat. Most of the hydropower plants experiencing problems with
low DO have Francis turbines. Typically, the most cost-effective method for increasing the
downstream DO level is to use some form of Francis turbine aeration [9, 11].
A Francis turbine aeration system‘s design, operation, and maintenance provide the most
significant impact to the efficiency, performance, and reliability for a hydro unit utilizing the
system. Aerating Francis turbines can experience insignificant to moderate (approx. 0.2% - 1%)
efficiency losses even without aeration due, for example, to baffles or thicker blades compared to
conventional, non-aerating technology. Aerating Francis turbines can experience significant (3%
to 10% or more) efficiency losses with aeration, depending on the amount of air introduced into
the turbine and the locations where the air is introduced [1, 2, 3, 4]. Francis turbines aerating
through existing vacuum breaker systems and Francis turbines retrofitted for aeration using hub
baffles typically experience restrictions in both capacity and flexibility that can significantly
reduce generation [1, 2, 3, 4, 5, 6, 9, 11, 12].
1.1 Hydropower Taxonomy Position
Hydropower Facility → Powerhouse → Power Train Equipment → Turbine → Francis
Turbine → Aeration Devices (Francis Turbine Aeration System)
1.1.1 Components of a Francis Turbine Aeration System
A Francis turbine aeration system can be either active or passive in design. An active
design includes some type of motorized blower or compressor to force air into the turbine
for mixing with water in the turbine and/or draft tube. The far more common passive
design emphasized in this best practice typically includes either (1) additions or
modifications to the turbine runner or draft tube to create zones of localized low pressure
and draw atmospheric air into the turbine (see hub baffles in Figure 1) or (2) a turbine
runner specifically designed for aeration (see Figure 2). The components of a Francis
turbine aeration system affecting performance and reliability typically consist of air
intakes, air flow instrumentation, sound mufflers, control valves, and air supply piping, as
shown in Figure 3.
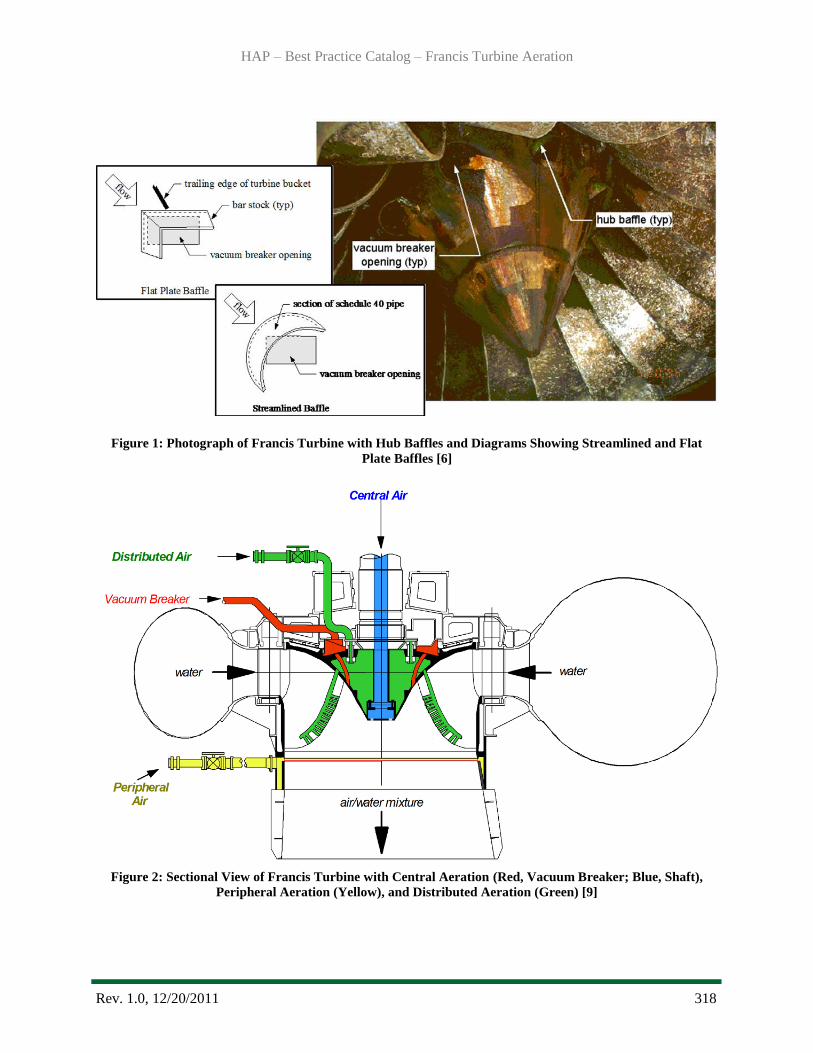
HAP – Best Practice Catalog – Francis Turbine Aeration
Rev. 1.0, 12/20/2011 318
Figure 1: Photograph of Francis Turbine with Hub Baffles and Diagrams Showing Streamlined and Flat
Plate Baffles [6]
Figure 2: Sectional View of Francis Turbine with Central Aeration (Red, Vacuum Breaker; Blue, Shaft),
Peripheral Aeration (Yellow), and Distributed Aeration (Green) [9]

HAP – Best Practice Catalog – Francis Turbine Aeration
Rev. 1.0, 12/20/2011 319
Figure 3: Typical Configuration for a Francis Turbine Aeration System [7]
Air Intakes: Properly designed air intakes, typically bellmouths, reduce the noise levels
associated with the air flow and reduce pressure losses in the aeration system, which
increases air flow through the aeration system. If a standard nozzle design is used for the
intake or if the intake is properly calibrated, the intake can also be used for air flow
measurement (see Figure 4), which is discussed in the following section.
Air Flow Instrumentation: A variety of technologies can be used for air flow
measurements, including bellmouth inlets, Venturi meters, orifice plates, air velocity
traverses (typically using a Pitot-static tube or hot-film anemometer), calibrated elbow
meters (calibrate off-site with appropriate upstream piping or calibrate in place with
velocity traverses), and calibrated single-point velocity measurements (calibrate off-site
with appropriate upstream piping or calibrate in place with velocity traverses). The
following instruments may also be required for air flow measurements, depending on the
type of air flow meters selected for the aeration system:
Manometers, mechanical differential pressure gages, or electronic differential
pressure cells (preferred);
Thermometers, thermistors, RTDs, or thermocouples for air temperature
measurements at primary flow elements;
Barometer, mechanical pressure gage, or electronic pressure cell for air pressure
measurements at primary flow elements; and
Psychrometer or other means to determine relative humidity at primary flow
elements.
Bellmouth (typ.) for loss
and noise reduction
Bellmouth (typ.) for loss
and noise reduction
Control valveControl valve
Muffler for noise reductionMuffler for noise reduction
Section for measuring air flowSection for measuring air flow
Bellmouth (typ.) for loss
and noise reduction
Bellmouth (typ.) for loss
and noise reduction
Control valveControl valve
Muffler for noise reductionMuffler for noise reduction
Section for measuring air flowSection for measuring air flow
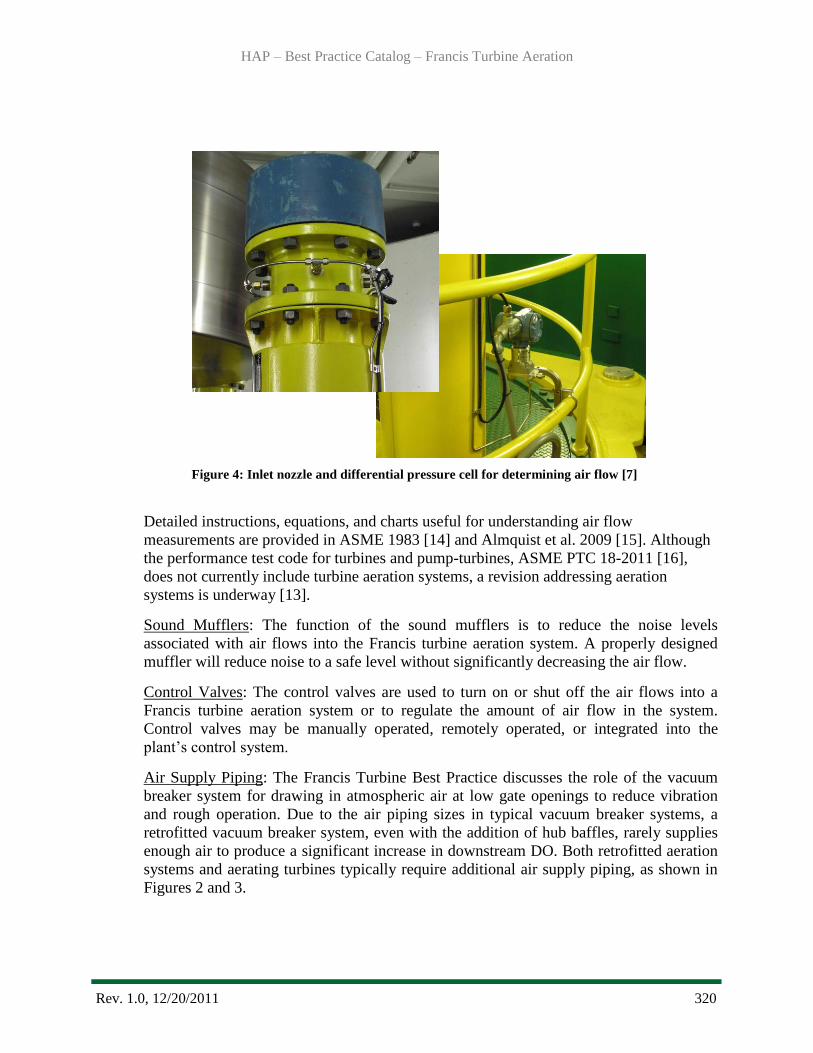
HAP – Best Practice Catalog – Francis Turbine Aeration
Rev. 1.0, 12/20/2011 320
Figure 4: Inlet nozzle and differential pressure cell for determining air flow [7]
Detailed instructions, equations, and charts useful for understanding air flow
measurements are provided in ASME 1983 [14] and Almquist et al. 2009 [15]. Although
the performance test code for turbines and pump-turbines, ASME PTC 18-2011 [16],
does not currently include turbine aeration systems, a revision addressing aeration
systems is underway [13].
Sound Mufflers: The function of the sound mufflers is to reduce the noise levels
associated with air flows into the Francis turbine aeration system. A properly designed
muffler will reduce noise to a safe level without significantly decreasing the air flow.
Control Valves: The control valves are used to turn on or shut off the air flows into a
Francis turbine aeration system or to regulate the amount of air flow in the system.
Control valves may be manually operated, remotely operated, or integrated into the
plant‘s control system.
Air Supply Piping: The Francis Turbine Best Practice discusses the role of the vacuum
breaker system for drawing in atmospheric air at low gate openings to reduce vibration
and rough operation. Due to the air piping sizes in typical vacuum breaker systems, a
retrofitted vacuum breaker system, even with the addition of hub baffles, rarely supplies
enough air to produce a significant increase in downstream DO. Both retrofitted aeration
systems and aerating turbines typically require additional air supply piping, as shown in
Figures 2 and 3.
HAP – Best Practice Catalog – Francis Turbine Aeration
Rev. 1.0, 12/20/2011 321
1.2 Summary of Best Practices
1.2.1Best Practices Related to Performance/Efficiency and Capability
Best practices related to performance/efficiency and capability are similar to the
Francis Turbine Best Practice, with the addition of aerating operation:
Establish accurate current unit performance characteristics and limits under
both aerating and non-aerating conditions through periodic testing [13, 16].
Disseminate accurate unit performance characteristics under both aerating and
non-aerating conditions to unit operators, local and remote control systems,
decision support systems, and other personnel and offices that influence unit
dispatch or generation performance.
Conduct real-time monitoring and periodic analyses of unit performance under
both aerating and non-aerating conditions at Current Performance Level (CPL) to
detect and mitigate deviations from expected efficiency for the Installed
Performance Level (IPL) due to degradation or instrument malfunction.
Periodically compare the CPL under both aerating and non-aerating conditions to
the Potential Performance Level (PPL) under both aerating and non-aerating
conditions to trigger feasibility studies of major upgrades.
Maintain documentation of IPL under both aerating and non-aerating conditions
and update when modification to the equipment (e.g., hydraulic profiling, draft
tube slot fillers, unit upgrade)or the aeration system (e.g., additional air piping,
modifications to hub baffles or draft tube baffles, aerating unit upgrade) is made.
1.2.2Best Practices Related to Reliability and Operations & Maintenance
Use ASTM A487 / A743 CA6NM stainless steel to manufacture Francis turbine
runners to maximize resistance to cavitation, and cavitation-enhanced corrosion.
Clad aeration discharge areas with stainless steel to mitigate cavitation-enhanced
corrosion.
Monitor trends for air flows under similar operating conditions to detect aeration
system problems.
Routinely inspect air intakes, mufflers, air piping, and air outlets and remove any
obstructing debris for optimal performance.
1.3 Best Practice Cross-references
I&C - Automation Best Practice
Mechanical – Francis Turbine Best Practice
HAP – Best Practice Catalog – Francis Turbine Aeration
Rev. 1.0, 12/20/2011 322
2.0 Technology Design Summary
2.1 Technology Evolution
In the 1950s, turbine venting through the vacuum breaker system was introduced in
Wisconsin to reduce the water quality impact of discharges from the pulp and paper industry
and from municipal sewage systems. Research was also conducted in Europe to develop
turbine designs that would boost dissolved oxygen levels in water passing through low head
turbines. By 1961, turbine aeration systems were operating in the U. S. at eighteen
hydroplants on the Flambeau, Lower Fox, and Wisconsin. During the late 1970s and early
1980s, the Tennessee Valley Authority (TVA) developed small, streamlined baffles, called
hub baffles, which reduced energy losses while increasing air flows and operating range for
aeration. The hub baffles installed at TVA‘s Norris Project (see Figure 1) provided DO
uptakes averaging 2 to 3 mg/L with typical efficiency losses of 1 to 2% [1].
During the mid-1980s, Voith Hydro Inc. and TVA invested in a joint research partnership to
develop improved hydro turbine designs for enhancing DO concentrations in releases from
Francis-type turbines. Scale models, numerical models, and full-scale field tests were used in
an extensive effort to validate aeration concepts and quantify key parameters affecting
aeration performance. Specially-shaped geometries for turbine components were developed
and refined to enhance low pressures at appropriate locations, allowing air to be drawn into
an efficiently absorbed bubble cloud as a natural consequence of the design and minimizing
power losses due to the aeration. TVA‘s Norris Project, which was scheduled for unit
upgrades, was selected as the first site to demonstrate these ―auto-venting‖ or ―self-aerating‖
turbine technologies. The two Norris aerating units contain options to aerate the flow through
central, distributed, and peripheral air outlets, as shown in Figure 2.
The successful demonstration of multiple technologies for turbine aeration at TVA‘s Norris
Project in 1995 has helped to develop market acceptance for aerating turbines. Major turbine
manufacturers who currently offer aerating turbines include ALSTOM, American Hydro,
Andritz, and Voith Hydro.
Performance levels for aerating turbine designs can be stated at three levels as follows:
The Installed Performance Level (IPL) is described by the unit performance
characteristics at the time of commissioning, under aerating and non-aerating
conditions. These may be determined from reports and records of efficiency and/or
model testing conducted prior to and during unit commissioning.
The Current Performance Level (CPL) is described by an accurate set of unit
performance characteristics determined by unit efficiency and air flow testing, under
aerating and non-aerating conditions. This requires the simultaneous measurement of
water flow, air flow, head, and power under a range of operating conditions, as
specified in the standards referenced in this document [14, 15, 16].
Determination of the Potential Performance Level (PPL) typically requires reference
to new aerating turbine design information from the turbine manufacturer to establish
HAP – Best Practice Catalog – Francis Turbine Aeration
Rev. 1.0, 12/20/2011 323
the achievable unit performance characteristics of the replacement turbine under
aerating and non-aerating conditions.
2.2 State of the Art Technology
For aerating Francis turbines, turbine efficiencies under aerating and non-aerating conditions
are the most important factor in an assessment to determine rehabilitation and replacement,
as well as proper operation.
When properly designed, hub baffles typically reduce efficiency by 0.5% to 1% without
aeration and 5% or more with aeration, depending on the air flows [1, 2, 3, 4, 5, 9]. In the
cross-section through an aerating Francis turbine shown in Figure 2, central aeration through
the turbine‘s vacuum breaker system is shown in red, and central aeration through the shaft is
shown in blue. Using an existing vacuum breaker system is typically the aeration option with
the lowest initial cost. However, central aeration has the largest effect on unit efficiency, and
the capacity and operational range for the turbine may be severely limited [1, 2, 3, 11, 12].
Figure 2 also shows peripheral aeration in yellow and distributed aeration through the trailing
edges of the turbine blades in green. Distributed aeration often has the smallest effect on unit
efficiency and the highest oxygen transfer into the water (i.e., increased DO), followed by
peripheral aeration [11, 12]. For example, a recent study compared the central, peripheral,
and distributed aeration systems needed to provide a 5 mg/L DO increase for a plant in the
southern USA [12]. In the vicinity of the maximum efficiency, the predicted air flow
requirements (i.e., void fraction in %) for central, peripheral, and distributed aeration systems
were 7.2%, 6.9%, and 6.5%, respectively. The corresponding efficiency decreases (i.e., non-
aerating efficiency minus aerating efficiency, in %) were greater than 10%, 7.4%, and 3.4%,
respectively. These predictions are consistent with field test results reported for other sites [6,
8, 11].
In another example, aerating and non-aerating performance testing was conducted according
to ASME PTC-18 standards [16] at a hydro plant with multiple types of aerating runners,
including two eighty-years-old original runners retrofitted for central aeration, two modern
runners installed in 2002 and designed for central aeration, and four state of the art runners
installed in 2008 with distributed aeration (see Figure 5) through the trailing edges of the
runners [11].
Figure 6 shows the aerating and non-aerating turbine efficiencies versus turbine outputs for
the three unit types at this plant, operating at a net head of 95 ft. The turbine efficiencies have
been normalized to the maximum measured efficiency of the most efficient unit. Note the
relative efficiencies for the three unit types, the relative effects of aeration on efficiency for
central and distributed aeration systems, and the relative amounts of air aspirated by the three
unit types. Under non-aerating operation, the 2008 replacement runners (distributed aeration)
have the highest peak efficiency, with both the original turbines (retrofitted central aeration)
and the 2002 replacement runners (designed central aeration) about 4% lower. Under
aerating

HAP – Best Practice Catalog – Francis Turbine Aeration
Rev. 1.0, 12/20/2011 324
Figure 5: State of the Art Aerating Turbine with Distributed Aeration
Figure 6: Normalized Turbine Efficiencies versus Turbine Output for Three Unit Types [11]
Net Head Efficiency Test Results (Central and Distributed Aeration)Net Head = 95 ft
0.70
0.75
0.80
0.85
0.90
0.95
1.00
1.05
1.10
10 15 20 25 30 35 40
Turbine Output (MW)
No
rma
lize
d N
et
He
ad
Tu
rbin
e E
ffic
ien
cy
2002 Upgraded Unit, Central Aeration Off
2002 Upgraded Unit, Central Aeration On (Qa/Qw = 2.7% to 4.4%)
Original Unit, Central Aeration Off
Original Unit, Central Aeration On (Qa/Qw = 0% to 3.1%)
2008 Upgraded Unit, Distributed Aeration Off
2008 Upgraded Unit, Distributed Aeration On (Qa/Qw = 5.0% to 7.4%)
HAP – Best Practice Catalog – Francis Turbine Aeration
Rev. 1.0, 12/20/2011 325
operation, peak efficiencies for the 2008 replacement runners, the 2002 replacement runners,
and the retrofitted original units drop by about 2.5%, 7%, and 2% (with very low air flows
for the retrofitted original units), respectively. Air flow to water flow ratio ranges under
aerating operation for the 2008 replacement runners, the 2002 replacement runners, and the
retrofitted original runners are 5.0% - 7.4%, 2.7% - 4.4%, and 0% - 3.1%.
The operational challenges for efficient power operation and effective environmental
operation of the plant‘s eight units under non-aerating and aerating conditions, over a range
of heads, and with rapid load swings are apparent, emphasizing the importance of proper
control system design.
3.0 Operation & Maintenance Practices
3.1 Condition Assessment
After the commercial operation begins, how an aerating Francis turbine is operated and
maintained will have a major impact on reducing efficiency losses and maintaining
reliability. Materials for turbine runners are usually cast iron, steel, or stainless steel. As a
best practice, the most common material being used today for new state of the art runners is
ASTM A487 / A743 CA6NM stainless steel (see Francis Turbine Best Practice).
Aeration systems for Francis turbines can take the form of more complex and more energy-
consumptive active systems, such as motorized blowers, to the less complex passive systems,
such as baffles and aerating runner designs. Focusing on the most common aeration system
designs (i.e., passive systems), a simple condition assessment includes inspections of the air
intakes, the air discharge passages in the turbine, the dissolved oxygen monitoring
equipment, and any observable cavitation or corrosion-related damage that might affect
normal operation. A decrease in the expected dissolved oxygen uptake in the waterway
downstream from the plant is a good indicator of degradation in the condition of the aeration
device.
A comprehensive condition assessment for a Francis turbine aeration system requires
information on:
(1) the plant‘s environmental and regulatory environment, including
incoming DO, TDG, and water temperature levels throughout the year
measurement locations and methods for incoming DO, TDG, and temperature
(typically, multiple locations in penstock or spiral case)
regulatory requirements for downstream DO, TDG, and temperature
measurement locations and methods for downstream DO, TDG, and temperature
record of compliance and non-compliance;
(2) the plant‘s operational environment, including

HAP – Best Practice Catalog – Francis Turbine Aeration
Rev. 1.0, 12/20/2011 326
daily and seasonal operational patterns
typical tailwater range during periods of aeration
other restrictions affecting operations (e.g., rough zones, special requirements for
functioning of aeration systems);
(3) details of the specific aeration system, including
type of aeration system (e.g., vacuum breaker, hub baffles, central, peripheral,
distributed, multiple methods)
diameters and lengths of aeration piping
control valve characteristics;
(4) environmental and hydraulic performance of the specific aeration system, including
pressures at aeration outlets over the operational range
head losses for the aeration piping
air flows through the aeration piping as a function of tailwater elevation, water
flow, and control valve position
turbine efficiency without aeration as a function of power and head
turbine efficiency with aeration as a function of power, head, and air flow
DO uptake over the range of operational conditions
Corresponding TDG levels over the range of operational conditions.
3.2 Operations
Because aerating Francis turbines typically have a narrow operating range for peak efficiency
(see Figure 6, for example), it is extremely important to proved plant operators or automated
control systems with accurate operating curves for the units under aerating and non-aerating
conditions. The curves usually originate from the manufacturer‘s model test data and from
post-installation performance testing. Because turbine performance can degrade over time,
periodic performance testing must be carried out to determine unit efficiencies and to update
the performance curves used for operational decisions. The ten-year testing cycle
recommended in the Francis Turbine Best Practice is typically appropriate.
Francis turbine aeration systems may be operated manually or the operation may be
integrated into a plant‘s control system. The detailed aeration instrumentation and controls
are site-specific. Aeration systems are often operated conservatively to ensure that
environmental requirements for DO levels are maintained. However, this can lead to higher
levels of total dissolved gases (TDG), as well as unnecessary efficiency losses due to
excessive air flows into the turbine. Some sites have TDG environmental requirements in
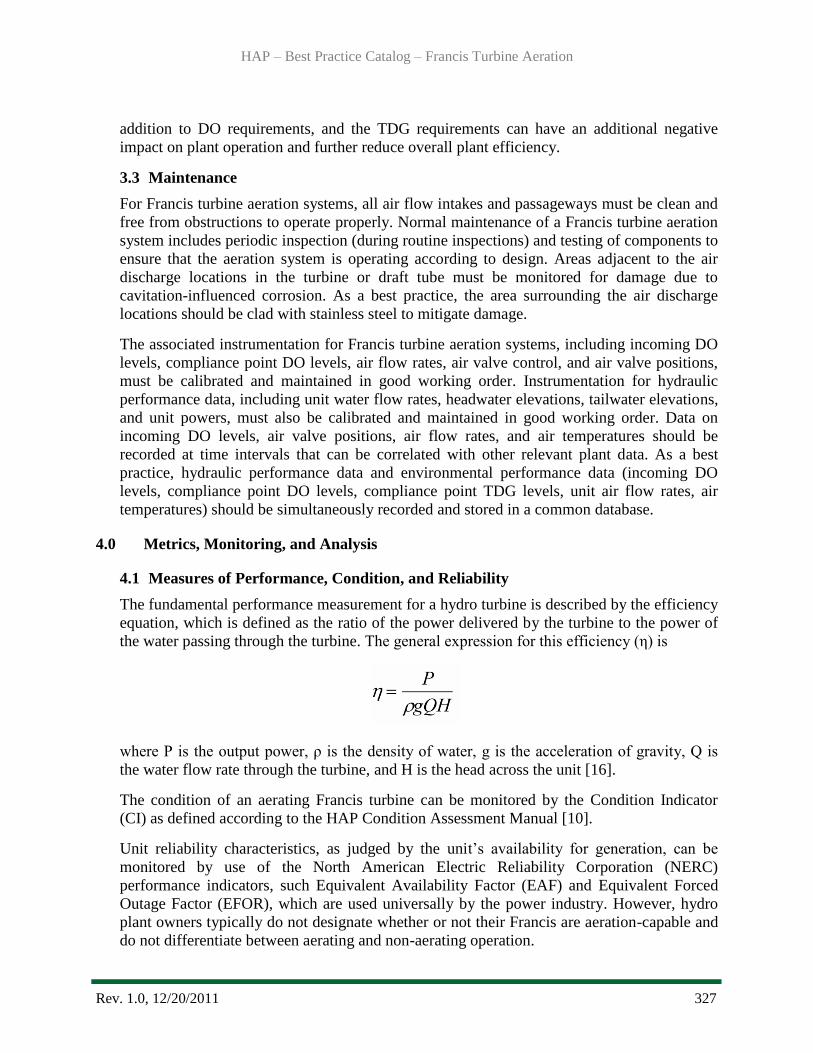
HAP – Best Practice Catalog – Francis Turbine Aeration
Rev. 1.0, 12/20/2011 327
addition to DO requirements, and the TDG requirements can have an additional negative
impact on plant operation and further reduce overall plant efficiency.
3.3 Maintenance
For Francis turbine aeration systems, all air flow intakes and passageways must be clean and
free from obstructions to operate properly. Normal maintenance of a Francis turbine aeration
system includes periodic inspection (during routine inspections) and testing of components to
ensure that the aeration system is operating according to design. Areas adjacent to the air
discharge locations in the turbine or draft tube must be monitored for damage due to
cavitation-influenced corrosion. As a best practice, the area surrounding the air discharge
locations should be clad with stainless steel to mitigate damage.
The associated instrumentation for Francis turbine aeration systems, including incoming DO
levels, compliance point DO levels, air flow rates, air valve control, and air valve positions,
must be calibrated and maintained in good working order. Instrumentation for hydraulic
performance data, including unit water flow rates, headwater elevations, tailwater elevations,
and unit powers, must also be calibrated and maintained in good working order. Data on
incoming DO levels, air valve positions, air flow rates, and air temperatures should be
recorded at time intervals that can be correlated with other relevant plant data. As a best
practice, hydraulic performance data and environmental performance data (incoming DO
levels, compliance point DO levels, compliance point TDG levels, unit air flow rates, air
temperatures) should be simultaneously recorded and stored in a common database.
4.0 Metrics, Monitoring, and Analysis
4.1 Measures of Performance, Condition, and Reliability
The fundamental performance measurement for a hydro turbine is described by the efficiency
equation, which is defined as the ratio of the power delivered by the turbine to the power of
the water passing through the turbine. The general expression for this efficiency (η) is
where P is the output power, ρ is the density of water, g is the acceleration of gravity, Q is
the water flow rate through the turbine, and H is the head across the unit [16].
The condition of an aerating Francis turbine can be monitored by the Condition Indicator
(CI) as defined according to the HAP Condition Assessment Manual [10].
Unit reliability characteristics, as judged by the unit‘s availability for generation, can be
monitored by use of the North American Electric Reliability Corporation (NERC)
performance indicators, such Equivalent Availability Factor (EAF) and Equivalent Forced
Outage Factor (EFOR), which are used universally by the power industry. However, hydro
plant owners typically do not designate whether or not their Francis are aeration-capable and
do not differentiate between aerating and non-aerating operation.

HAP – Best Practice Catalog – Francis Turbine Aeration
Rev. 1.0, 12/20/2011 328
4.2 Data Analyses
The key measurements for hydraulic performance include headwater elevation, HHW (ft);
tailwater elevation, HTW (ft); water flow rate through Unit N without aeration, QN (cfs);
power output for Unit N without aeration, PON; and TH, the measurement timestamp for
hydraulic data. The key measurements for environmental performance include incoming DO
level for Unit N, LDON (mg/L); incoming TDG level for Unit N, LTDGN (%); incoming water
temperature, FWTN (degrees F); downstream DO level for plant at the compliance location,
LDOC (mg/L); downstream TDG level, LTDGC (%) at the compliance location; and
downstream water temperature, FWTC (degrees F), at the compliance location; air flow rate
through Unit N, QAN (cfs); water flow rate through Unit N with aeration, QNA (cfs); power
output for Unit N with aeration, PONA; and TE, the measurement timestamp for
environmental data. Measurements can be near real-time or periodic (hourly, daily),
depending on the site details, license requirements, and operational requirements.
The unit efficiency ηN (nondimensional) for operation without aeration is:
ηN = PON/[KρgQN(HHW - HTW)/(1,000,000)]
where K is a dimensional constant, ρ is the density of water at Unit N, and g is the acceleration
of gravity at Unit N. For most cases, using Kρg = 84.5 provides satisfactory results.
The unit efficiency ηNA (nondimensional) for operation with aeration is:
ηNA = PONA/[KρgQN(HHW - HTW)/(1,000,000)]
References provide detailed guidance on performing the key hydraulic measurements [16]
and the key environmental measurements [15].
The unit efficiency loss due to aeration is equal to ηN minus ηNA for a given power level.
However, detailed data analyses are required to determine what portion of these efficiency
losses are avoidable, due to over-aeration, suboptimization, etc., and to compute the associated
revenue losses. In general, aeration-induced efficiency losses greater than 3% warrant further
investigation. The costs associated with the aeration-induced efficiency losses, capacity
losses, and reductions in operational flexibility should be established for comparison with the
associated revenue losses and used to optimize aeration operations and to evaluate and justify
new aeration systems, including turbine replacements.
The condition assessment of an aerating Francis turbine is quantified through the CI, as
described in the HAP Condition Assessment Manual [10]. The overall CI is a composite of
the CI derived from each component of the turbine. This methodology can be applied
periodically to derive a CI snapshot of the current turbine condition so that it can be
monitored over time and studied to determine condition trends that can impact performance
and reliability.
The reliability of a unit as judged by its availability to generate can be monitored through
reliability indexes or performance indicators as derived according to NERC‘s Appendix F,
Performance Indexes and Equations [17].

HAP – Best Practice Catalog – Francis Turbine Aeration
Rev. 1.0, 12/20/2011 329
4.3 Integrated Improvements
Data on lost efficiency, lost capacity, and operational restrictions due to Francis turbine
aeration systems can be used to quantify lost revenues from generation and ancillary services,
and the economic losses can be used to evaluate and justify funding for aeration system
improvements, including turbine replacement.
The periodic field test results should be used to update the unit operating characteristics and
limits. Optimally, the updated results would be integrated into an automated control system.
If an automated control system is not available, hard copies of the updated curves and limits
should be made available to all relevant personnel, particularly unit operators, and the
importance of the updated results should be emphasized, discussed, and confirmed.
5.0 Information Sources:
Baseline Knowledge:
Bohac, C. E., J. W. Boyd, E. D. Harshbarger, and A. R. Lewis, Techniques for Reaeration of
Hydropower Releases, Technical Report No. E-83-5, Vicksburg, Mississippi: U. S. Army
Corps of Engineers, February 1983.
Wilhelms, S. C., M. L. Schneider, S. E. Howington, Improvement of Hydropower Release
Dissolved Oxygen with Turbine Venting, Technical Report No. E-87-3, Vicksburg,
Mississippi: U. S. Army Corps of Engineers, March 1987.
EPRI, Assessment and Guide for Meeting Dissolved Oxygen Water Quality Standards for
Hydroelectric Plant Discharges, Report No. GS-7001, Palo Alto, California:
ElectricPower Research Institute (EPRI), November 1990.
Carter, J., ―Recent Experience with Hub Baffles at TVA,‖ ASCE Proceedings of Waterpower
95, San Francisco, California, July 25-28, 1995.
EPRI, Maintaining and Monitoring Dissolved Oxygen at Hydroelectric Projects: Status
Report, Report No. 1005194, Palo Alto, California: Electric Power Research Institute
(EPRI), May 2002.
State of the Art:
Hopping, P. N., P. A. March and P. J. Wolff, “Justifying, Specifying, and Verifying
Performance of Aerating Turbines,” Proceedings of HydroVision 98, Reno, Nevada, July
28-31, 1998.
March, P. A., R. K. Fisher, and V. G. Hobbs, ―Water and Energy Infrastructure: Meeting
Environmental Challenges for a Sustainable Water and Energy Future,‖ USACE 2003
Infrastructure Systems Conference, Las Vegas, Nevada, May 6-8, 2003.
Foust, J. M., R. K. Fisher, P. M. Thompson, M. M. Ratliff, and P. A. March, ―Integrating
Turbine Rehabilitation and Environmental Technologies: Aerating Runners for Water
Quality Enhancement at Osage Plant,‖ Proceedings of Waterpower XVI, Spokane,
Washington, July 27-30, 2009.
HAP – Best Practice Catalog – Francis Turbine Aeration
Rev. 1.0, 12/20/2011 330
March, P. A., Hydropower Technology Roundup Report: Technology Update on Aerating
Turbines, Report No. 1017966, Palo Alto, California: Electric Power Research Institute,
2009.
ORNL et al., HAP Condition Assessment Manual, October, 2011.
March, P. A., ―Hydraulic and Environmental Performance of Aerating Turbine
Technologies,‖ EPRI-DOE Conference on Environmentally-Enhanced Hydropower
Turbines: Technical Papers, Palo Alto, California: Electric Power Reaearch Institute
(EPRI) and Washington, D.C.: U. S. Department of Energy (DOE), Report No. 1024609,
December 2011.
Foust, J. M., and S. Coulson, ―Using Dissolved Oxygen Prediction Methodologies in the
Selection of Turbine Aeration Equipment,‖ EPRI-DOE Conference on Environmentally-
Enhanced Hydropower Turbines: Technical Papers, Palo Alto, California: Electric
Power Reaearch Institute (EPRI) and Washington, D.C.: U. S. Department of Energy
(DOE), Report No. 1024609, December 2011.
Kirejczyk, J., ―Developing Environmental Standards and Best Practices for Hydraulic
Turbines,‖ EPRI-DOE Conference on Environmentally-Enhanced Hydropower Turbines:
Technical Papers, Palo Alto, California: Electric Power Reaearch Institute (EPRI) and
Washington, D.C.: U. S. Department of Energy (DOE), Report No. 1024609, December
2011.
Standards:
ASME, Fluid Meters: Their Theory and Application, New York, New York: American
Society of Mechanical Engineers (ASME), 1983.
Almquist, C. W., P. N. Hopping, and P. J. Wolff, ―Draft Test Code for Aerating
Hydroturbines,‖ TVA Report No. WR98-1-600-125, Norris, Tennessee: Tennessee
Valley Authority (TVA), August 1998.
ASME, Performance Test Code 18: Hydraulic Turbines and Pump-Turbines, ASME PTC
18-2011, New York, New York: American Society of Mechanical Engineers (ASME),
2011.
NERC, Appendix F: Performance Indexes and Equations, January 2011.

HAP – Best Practice Catalog
Rev. 1.0, 1/20/2012 331
For overall questions
please contact:
Brennan T. Smith, Ph.D., P.E.
Water Power Program Manager
Oak Ridge National Laboratory
865-241-5160
or
Qin Fen (Katherine) Zhang, Ph. D., P.E.
Hydropower Engineer
Oak Ridge National Laboratory
865-576-2921