best management practices for minimizing horse trail ... nf trail report, final.pdf · u.s. forest...
TRANSCRIPT
U.S. Forest Service Final Research Report
Research for the Development of Best Management Practices to
Minimize Horse Trail Impacts on the Hoosier National Forest
Virginia Tech
College of Natural Resources, Department of Forestry
Research for the Development of Best Management Practices to
Minimize Horse Trail Impacts on the Hoosier National Forest
by:
Michael W. Aust Jeffrey L. Marion
Kevin Kyle
Virginia Tech, Dept. of Forestry (0324) Blacksburg, VA 24061
March 2005
Abstract This research investigates horse trail impacts to gain an improved understanding of the relationship between various levels of horse use, horse trail management alternatives, and subsequent horse trail degradation. A survey of existing horse trails on the Hoosier National Forest was used to collect data on use-related, environmental and management factors to model horse trail impacts. Results are analyzed to identify which factors are most easily manipulated by managers to effectively avoid and minimize horse trail impacts. A specific focus includes evaluating the relative effect of trail use level, surfacing, grade, and water control on indices of erosion and trafficability such as trail cross sectional area, estimated erosion, muddiness, and incision. Overall, the Hoosier National Forest horse trails could be significantly improved by relocating or closing inherited trails that directly ascend slope or are excessively steep, reducing the distance between water control structures, and by applying gravel to harden trail surfaces and reduce soil erosion. A set of Best Management Practices for trails are included as a product of this work, with recommendations based on this research.
ii

TABLE OF CONTENTS
TABLE OF CONTENTS ............................................................................................................. 1
TABLES......................................................................................................................................... 3
FIGURES....................................................................................................................................... 4
FIGURES....................................................................................................................................... 4
INTRODUCTION......................................................................................................................... 5
OBJECTIVES ............................................................................................................................... 6
LITERATURE REVIEW ............................................................................................................ 7 POTENTIAL IMPACTS OF TRAILS................................................................................................... 7 POTENTIAL IMPACTS OF HORSE TRAILS....................................................................................... 9 POTENTIAL IMPACTS OF ROADS................................................................................................. 11 FACTORS AFFECTING TRAIL RESOURCE IMPACTS...................................................................... 12
Use-Related Factors ............................................................................................................. 12 Environmental Factors ......................................................................................................... 12
Vegetation Type................................................................................................................ 13 Topography....................................................................................................................... 13 Soil and Surface Characteristics ....................................................................................... 14
TRAIL MANAGEMENT ................................................................................................................ 15 Trail Construction................................................................................................................. 15
Trail Standards .................................................................................................................. 15 Location ............................................................................................................................ 16 Road Costs ........................................................................................................................ 18 Trail Grade ........................................................................................................................ 18 Trail Slope Length ............................................................................................................ 20 Sidehill Trails.................................................................................................................... 20 Stream Crossings .............................................................................................................. 21 Techniques for Wet Soils.................................................................................................. 22 Tread Hardening ............................................................................................................... 23 Geosynthetics.................................................................................................................... 24 Reinforcing/Augmenting Soil Structure ........................................................................... 25
Trail Maintenance................................................................................................................. 25 Tread Shaping ................................................................................................................... 25 Surface Water Control ...................................................................................................... 26 Vegetation Management ................................................................................................... 27
Visitor Management.............................................................................................................. 28
METHODS .................................................................................................................................. 29 STUDY SITES.............................................................................................................................. 29 TRAIL SELECTION ...................................................................................................................... 29 FIELD PROCEDURES ................................................................................................................... 29 DATA ANALYSIS ........................................................................................................................ 32
- 1 -

RESULTS AND DISCUSSION ................................................................................................. 33 TRAIL INVENTORY INDICATORS................................................................................................. 33 TRAIL IMPACT INDICATORS ....................................................................................................... 35 RELATIONAL ANALYSES ............................................................................................................ 36
Drainage Features ................................................................................................................ 43 Modeling Trail Degradation................................................................................................. 43 Individual Trail Summaries .................................................................................................. 46
SUMMARY AND MANAGEMENT RECOMMENDATIONS ............................................ 48 REVIEW AND SUMMARY OF FINDINGS ....................................................................................... 48 STUDY RECOMMENDATIONS ...................................................................................................... 52
Trail Planning and Decision Making ................................................................................... 52 Managing Visitor Use ........................................................................................................... 53 Evaluate, Relocate, and Reconstruct Trails.......................................................................... 54 Best Management Practices.................................................................................................. 55
LITERATURE CITED .............................................................................................................. 59
APPENDIX 1. TRAIL SURVEY MANUAL........................................................................... 65 INTRODUCTION .......................................................................................................................... 65 MATERIALS................................................................................................................................ 65 POINT SAMPLING PROCEDURES ................................................................................................. 65 PROBLEM ASSESSMENT PROCEDURES........................................................................................ 70 POINT SAMPLING FORM ............................................................................................................. 71 PROBLEM ASSESSMENT FORM ................................................................................................... 72
APPENDIX 2. UNIVERSAL SOIL LOSS EQUATION DATA SHEET ............................. 75
APPENDIX 3. BEST MANAGEMENT PRACTICES GUIDE FOR TRAILS................... 76
APPENDIX 4. WORKSHEET FOR ESTIMATING ROAD/TRAIL COSTS .................... 80
- 2 -

TABLES TABLE 1. DIFFERENT FORMS OF TRAIL RESOURCE IMPACT AND THEIR ECOLOGICAL AND SOCIAL EFFECTS.
.............................................................................................................................................................. 8 TABLE 2. EXAMPLES OF HIGH AND LOW TRAIL STANDARDS. ADDITIONAL EXAMPLES ARE AVAILABLE IN
HESSELBARTH AND VACHOWSKI (2000)............................................................................................ 16 TABLE 3. COSTS FOR LOCATION AND CONSTRUCTION OF A TYPICAL MINIMUM STANDARD FOREST ROAD
IN THE APPALACHIAN MOUNTAINS. COST ARE BASED ON 2001 DOLLARS. ...................................... 19 TABLE 4. SOIL TEXTURE PERCENTAGES FOUND ON HNF HORSE TRAILS.................................................... 33 TABLE 5. TOPOGRAPHIC POSITIONS FOR HNF TRAILS. .............................................................................. 33 TABLE 6. SLOPE ALIGNMENT VALUES HNF HORSE TRAILS. HIGHER ALIGNMENT VALUES ARE MORE
PARALLEL WITH THE NATURAL CONTOUR WHILE VALUES NEAR ZERO ARE PERPENDICULAR TO THE CONTOUR. ........................................................................................................................................... 34
TABLE 7. TRAIL GRADE CATEGORIES FOR HNF HORSE TRAILS. ................................................................ 34 TABLE 8. CROSS SECTIONAL AREA (SOIL EROSION) CATEGORIES FOR HNF HORSE TRAILS. ...................... 35 TABLE 9. MUDDY SOIL AND STANDING WATER PERCENTAGES FOR HNF HORSE TRAILS........................... 35 TABLE 10. TRAIL WIDTH CATEGORIES FOR HNF HORSE TRAILS................................................................ 35 TABLE 11. DISTANCE TO NEAREST UPHILL TREAD DRAINAGE FEATURE FOR HNF HORSE TRAILS............ 36 TABLE 12. USE LEVEL AND SURFACE CONDITION EFFECTS ON MEAN VALUES FOR CROSS SECTIONAL
AREA, ESTIMATED SOIL LOSS, MUDDINESS, TRAIL WIDTH, AND TRAIL INCISION FOR HNF HORSE TRAILS. ............................................................................................................................................... 37
TABLE 13. EFFECT OF TRAIL GRADE CLASS AND GRAVEL DEPTH ON CSA AND USLE. ............................ 39 TABLE 14. COMPARISON OF TRAIL SLOPE CATEGORY AND MEAN DISTANCE TO DRAINAGE FEATURE WITH
RECOMMENDED DRAINAGE FEATURE INTERVALS. ............................................................................. 43 TABLE 15. CORRELATIONS BETWEEN CROSS SECTIONAL AREA LOSS OF SOIL (CSA) AND VARIOUS
PREDICTIVE INDICATORS. ................................................................................................................... 44 TABLE 16. RESULTS FROM REGRESSION ANALYSES (BACKWARDS ELIMINATION) STARTING WITH THE
FACTORS FROM TABLE 15. ................................................................................................................. 44 TABLE 17. MEAN CROSS SECTIONAL AREA SOIL LOSS ON TRAILS WITH AND WITHOUT GRAVEL BY TREAD
DRAINAGE FEATURE DISTANCE AND TRAIL SLOPE ALIGNMENT ANGLE. ............................................ 45 TABLE 18. MEAN VALUES FOR POINT SAMPLING IMPACT INDICATOR DATA BY TRAIL.............................. 46 TABLE 19. TRAIL PROBLEM ASSESSMENT IMPACT INDICATOR DATA BY TRAIL. ........................................ 47 TABLE 20. SUMMARY OF PRINCIPAL RESEARCH FINDINGS AND LOCATION WHERE FINDING IS PRESENTED.
............................................................................................................................................................ 51 TABLE 21. SUMMARY OF RECOMMENDATIONS FOR GRAVEL USE ON HNF HORSE TRAILS........................ 56 TABLE 22. GUIDANCE FOR THE FREQUENCY OF WATER CROSS DRAINS AT VARIOUS TRAIL GRADES........ 57
- 3 -

FIGURES FIGURE 1. TRAILHEAD SIGN ON THE HOOSIER NATIONAL FOREST.............................................................. 5 FIGURE 2. HORSE TRAIL DEVELOPED ALONG A FORMER SKID TRAIL ON THE HOOSIER NF....................... 11 FIGURE 3. TRAIL EROSION POTENTIAL AND PROBABLE PROFILE FOR TRAILS WITH DIFFERENT SLOPE
ALIGNMENT ANGLES (LANDFORM SLOPE IS DOTTED LINE, TRAIL IS SOLID LINE)............................... 13 FIGURE 4. VIEW OF ONE ROAD EVALUATED BY SWIFT (1984) AFTER THE ROAD HAS BEEN STABILIZED
WITH GRAVEL AND VEGETATION........................................................................................................ 17 FIGURE 5. FROM TOP TO BOTTOM: TYPICAL EXAMPLES OF TRAIL CLEARING, ESTABLISHMENT OF ROAD
SURFACE, STABILIZING THE SURFACE, INSTALLATION OF WATER CONTROL/STREAM CROSSING STRUCTURES, AND SURFACING........................................................................................................... 18
FIGURE 6. EFFECT OF TRAIL SLOPE PERCENT ON ESTIMATED EROSION IF RAINFALL AND RUNOFF FACTOR (R = 175), SOIL EROSIVITY (K = 0.3), SLOPE LENGTH (L=100) AND COVER AND SUPPORT PRACTICES (CP = 0.04864) ARE HELD CONSTANT FOR THE USLE (DISSMEYER & FOSTER 1984). NOTE THAT THE EFFECT OF SLOPE BECOMES MORE PRONOUNCES AFTER 10-12 % SLOPE. (DASHED LINES ARE FOR VISUAL EMPHASIS) ...................................................................................................................... 19
FIGURE 7. APPLYING GEOSYNTHETICS TO A HORSE TRAIL IN THE DANIEL BOONE NF. ............................ 24 FIGURE 8. TYPICAL TOPOGRAPHY AND CENTRAL HARDWOODS OF THE HOOSIER NATIONAL FOREST. .... 29 FIGURE 9. ILLUSTRATION OF THE VARIABLE INTERVAL CROSS SECTIONAL AREA METHOD FOR ASSESSING
SOIL EROSION ON TRAILS. TABLE OF VALUES SHOWS HOW DATA AREA RECORDED AND USED IN THE COMPUTATIONAL FORMULA: AREA = (TRANSECT 1 + TRANSECT 2) X INTERVAL X .5 FOR EACH ROW AND SUMMED FOR THE TOTAL AREA OF SOIL LOSS. ........................................................................... 30
FIGURE 10. EFFECT OF AMOUNT OF HORSE USE AND PRESENCE/ABSENCE OF GRAVEL ON USLE............. 37 FIGURE 11. EFFECT OF AMOUNT OF HORSE USE AND PRESENCE/ABSENCE OF GRAVEL ON CSA. .............. 38 FIGURE 12. EFFECT OF AMOUNT OF HORSE USE AND PRESENCE/ABSENCE OF GRAVEL ON MAXIMUM
INCISION. ............................................................................................................................................ 38 FIGURE 13. EFFECT OF AMOUNT OF HORSE USE AND PRESENCE/ABSENCE OF GRAVEL ON TRAIL WIDTH. 38 FIGURE 14. EFFECT OF TRAIL GRADE AND GRAVEL DEPTH ON USLE, CSA, AND MAXIMUM INCISION. ... 40 FIGURE 15. EFFECT OF TRAIL GRADE AND TRAIL ALIGNMENT ANGLE ON CSA......................................... 41 FIGURE 16. EFFECT OF USE LEVEL AND GRAVEL DEPTH ON CSA AND MAXIMUM INCISION. .................... 42 FIGURE 17. ELEMENTS OF A TRAIL PLAN. .................................................................................................. 52 FIGURE 18. COMMON TOOLS FOR OFFICE RECONNAISSANCE OF FOREST TRAILS INCLUDE TOPOGRAPHIC
MAPS, SOIL SURVEYS, AERIAL PHOTOGRAPHS, DIVIDERS, SCALE, AND CALCULATOR. ...................... 55 FIGURE 19. THE THICK DASHED LINE PROVIDES AN EXAMPLE OF A RELOCATED SECTION OF TRAIL THAT
REPLACED THE STEEPER VALLEY BOTTOM TRAIL ALIGNMENT. ......................................................... 55
- 4 -

INTRODUCTION The Hoosier National Forest (HNF) is managed for multiple uses, including forest products, recreation, wildlife, and water resources. Watershed protection is a very important aspect of the forest; indeed HNF provides watershed protection for 20+ municipalities and water companies including Bloomington. Recreation is another predominant use and the HNF has approximately 258 miles of trail, 219 of which are open to some combination of use by hikers, mountain bikers and horse riders (motorized ORVs and ATVs are prohibited) (Figure 1)(Forest Service 2002). Horse riders and mountain bikers are required to purchase annual permits and must stay on designated trails. Visitation estimates from permit data for the last three years indicate that annual trail use was approximately 18,000 for horse riders and 5,000 for bikers. In particular, horseback riding is an increasingly popular activity and the HNF attracts numerous riders from commercial horse camps located on adjacent lands (Wadzinski 2000). Although these trails are widely used and appreciated by horseback riders, they also have the potential to cause a variety of negative impacts. Presently, the HNF has limited information on trail system conditions or programs in place to monitor impacts associated with its varied and growing visitation. Research has documented greater potential for trail degradation from horse use in comparison to other trail uses. For example, horse traffic can eliminate vegetation cover more quickly than foot or bike traffic and their greater ground pressures compact soils to greater densities and depths (Nagy & Scotter 1974, Liddle 1997, Widner & Marion 1993). The resulting hoof prints and rutting retain water and promote muddiness and erosion following rains. Horse trails are also often two to three times the width of hiker trails, resulting in greater soil exposure and erosion potential (Weaver & Dale 1978).
Figure 1. Trailhead sign on the Hoosier National Forest.
Trail impacts include a wide variety of problems. Even low levels of trampling disturbance reduce ground vegetation height, cover, and biomass, and may alter species composition by eliminating fragile species (Cole 1991, Cole 1995a, Sun & Liddle 1993a). Higher levels of trampling cause more complete ground vegetation loss and compositional change (Cole 1995b, Marion & Cole 1996). Concentrated traffic also pulverizes soil leaf litter and humus layers, which are either lost through erosional processes or intermixed with underlying mineral soils. These soils then become exposed and vulnerable to wind or water erosion and compaction (Cole 1982, Cole 1991, Marion & Merriam 1985, Marion & Leung 2001, Monti & Mackintosh 1979). The compaction of soils decreases soil pore space and water infiltration, which in turn increases water runoff and soil erosion.
- 5 -
Trampling and vehicle traffic can also fragment and directly degrade wildlife habitats, and the presence of trail users may disrupt essential wildlife activities such as feeding, sleeping, or reproduction and the raising of young (Knight & Cole 1995). Although certain degrees of trail impacts are unavoidable, excessive trail impacts threaten natural resource values, visitor safety, and the quality of recreational experiences. In addition to the trampling effects previously described, trail impacts include excessive tread widening, muddiness, erosion, proliferation of visitor-created paths, and the results of various depreciative behaviors such as littering and cutting of trail switchbacks (Cole 1983, Leung & Marion 1996, Marion et al. 1993). The HNF’s trail system incorporates many former roads and trails that were improperly located or constructed or that were not maintained. Road and trail impacts are further aggravated by: 1) highly erodible soils, 2) improper construction and maintenance, 3) inappropriate stream crossings, 4) high use by horseback riders, and 5) improper location (e.g., steep grades or floodplain settings). Without proper trail management efforts these problems can alter natural patterns of water runoff, resulting in irreversible soil loss and subsequent turbidity and deposition in streams and other water bodies (Leung & Marion 2000). Again, while some impacts are inevitable, excessive trail impacts should be avoided. The forest plan has six major goals that are all intimately linked to the trail management effort: protection and management of ecosystems, protection of cultural heritage, providing a visually pleasing landscape, providing recreational uses in harmony with natural communities, providing a useable land base, and providing for human and community development.
OBJECTIVES The following sections outline the four major objectives of this research project.
Objective 1: Develop, pilot test, and refine trail assessment procedures designed to inform development of a horse trail degradation model. Elements of two trail survey methodologies were integrated in developing survey procedures (Leung et al. 1997, Marion & Leung 2001). A point measurement method with a systematic sampling scheme at 500 ft intervals provides the most objective and reliable data for assessing trail conditions. This method also provides an objective, accurate, and efficient approach to monitoring changes over time should the HNF choose to reapply these procedures (Farrell & Marion 2002, Leung & Marion 1999a). At each sample point survey staff measured selected indicators such as trail width, maximum incision, and tread composition (e.g., vegetation cover, exposed soil, wet soil, rock). Elements of a problem assessment method were integrated into the survey procedures to provide census information on two specific trail impact problems: excessive erosion and excessive muddiness (Leung & Marion 1999b). This approach provided data on the frequency, lineal extent of occurrence, and location of these specific pre-defined problems. A trail measuring wheel was pushed along each trail to record total distance, distance to each sampling point and beginning/ending distances of each trail problem.
- 6 -

Meetings and close cooperation with forest administrative, resource management, and maintenance staff ensured that forest management needs were met during the development of these procedures (included in Appendix 1). Preliminary procedures were field tested and refined, with appropriate review and approval by forest staff prior to application. Objective 2: Apply trail condition assessment procedures to a sample of HNF horse trails. Survey procedures were applied to a sample of horse trails identified in consultation with HNF managers. A sample of approximately 36 miles was found to be sufficient. Only trails that are predominantly used by horses were sampled and selection criteria included amount of use (low, moderate, and heavy) and application of gravel (yes, no). The sample was not intended to be representative and extrapolation of findings to the entire Forest’s trail system is inappropriate. Objective 3: Evaluate data to understand the process of horse trail degradation and the role of contributing factors. Develop a horse trail degradation model. The purpose of the sampling and subsequent analyses was to identify and understand the role and function of various causal and non-causal yet influential factors contributing to horse trail degradation. Influential factors were investigated through statistical analyses. Causative factors included type and amount of trail use. Non-causative factors included topographic alignment, trail grade, gravel use, and proximity of tread drainage features. Regression analyses were applied to model horse trail degradation and understand the relative influence of alternative factors. These results are presented on pages 43-45. Objective 4: Based on the field research at HNF, literature reviews, and consultations with HNF managers and horse trail managers in other places, develop Best Management Practice guidance for improving the sustainability of horse trails. Literature reviews and analyses of data were conducted to address the development of Best Management Practice guidance. Recommendations are presented in the Summary and Management Recommendations section and Appendix 3.
LITERATURE REVIEW Potential Impacts of Trails Trails are generally regarded as an essential facility in recreation areas, providing access to non-roaded areas, offering recreational opportunities, and protecting resources by concentrating visitor use impacts on resistant tread surfaces. Much ecological change assessed on trails is associated with their construction and is considered unavoidable (Birchard & Proudman 2000). The principal challenge for trail providers is therefore to prevent post-construction degradation from both recreational use and natural processes such as rainfall and water runoff. Unsurfaced trail treads are susceptible to a variety of trail impacts. Common impacts include vegetation loss and compositional changes, soil compaction, erosion, and muddiness, exposure
- 7 -

of plant roots, trail widening, and the proliferation of visitor-created side trails (Table 1) (Hammitt & Cole 1998, Leung & Marion 1996, Tyser & Worley 1992). Soil erosion exposes rocks and plant roots, creating a rutted and uneven tread surface. Erosion can also be self-perpetuating when treads erode below the surrounding soil level, preventing the diversion of water from the tread. Eroded soils may find their way into water bodies, increasing water turbidity and sedimentation impacts to aquatic organisms (Fritz 1993). Similarly, excessive muddiness renders trails less usable and aggravates tread widening and associated vegetation loss as visitors seek to circumvent mud-holes and wet soils (Marion 1994). Trail widening and the creation of parallel treads and side-trails unnecessarily increase the area of land disturbed by trails (Liddle & Greig-Smith 1975). Table 1. Different forms of trail resource impact and their ecological and social effects.
Form of Impact Ecological Effects Social Effects Soil Erosion Soil and nutrient loss, water turbidity and
sedimentation, alteration of water runoff, most permanent impact
Increased travel difficulty, degraded aesthetics, safety
Exposed Roots Root damage, reduced tree health, intolerance to drought
Degraded aesthetics, safety
Secondary Treads Vegetation loss, exposed soil Degraded aesthetics Wet Soil Prone to soil puddling, increased water
runoff Increased travel difficulty, degraded
aesthetics Running Water Accelerated erosion rates Increased travel difficulty Widening Vegetation loss, soil exposure Degraded aesthetics Visitor-Created Trails
Vegetation loss, wildlife habitat fragmentation
Evidence of human, disturbance, degraded aesthetics
Trails, and the presence of visitors, can also impact wildlife, fragment wildlife habitat and cause avoidance behavior in some animals and attraction behavior in others seeking to obtain human food (Hellmund 1998, Knight & Cole 1991). While most impacts are limited to a linear disturbance corridor, some impacts, such as alterations in surface water flow, introduction of invasive plants, and disturbance of wildlife, can extend considerably further into natural landscapes (Kasworm & Monley 1990, Tyser & Worley 1992). Even localized disturbance can harm rare or endangered species or damage sensitive resources, particularly in environments with slow recovery rates. Impacts such as severe soil erosion and exposed roots are visually offensive and can degrade the aesthetics and functional value of recreational settings. Recent studies have found that resource impacts are noticed by visitors and that they can degrade the quality of recreation experiences (Roggenbuck et al. 1993, Vaske et al. 1993). Impacts such as deep ruts and excessive muddiness increase the difficulty of travel and threaten visitor safety. From a managerial perspective, excessive trail-related impacts to vegetation, soil, wildlife or water quality can represent an unacceptable departure from natural conditions and processes. Impacts also result in substantial costs for the maintenance and rehabilitation of trails and operation of visitor management programs.
- 8 -

Potential Impacts of Horse Trails Impacts from horse use can be ecological: impacts to the resource, or social: impacts to the experiences of other visitors. Both types of impact serve to bring horse use concerns to the attention of managers. For example, many studies have revealed conflicts between hikers and horseback riders. Watson et al. (1993) found that 36% of wilderness hikers did not like encounters with horses on trails but only 4% of horse riders disapproved of meeting hikers. In another wilderness study, 75% of managers reported they received complaints about horses, including excessive trail impacts, manure on trails, and damage to meadows and riparian areas (Shew et al. 1986). There is not space for a complete review of the social impacts of horse use here; additional pertinent references include Hammitt and Cole (1998), Jacob and Schreyer (1980), McClaran (1989), and Newsome et al. (2002). The severity of resource impacts depends on the characteristics and behavior of the user, environmental attributes, and how visitors and trails are managed. In order to understand horse impacts and to arrive at viable solutions regarding their management, it is important to examine and understand the impacts and factors that influence them. The major ecological impacts to trails from horse use are vegetation loss, trail widening, erosion, muddiness, and informal trail development. Erosion is considered to be the most severe form of impact because its effects are long lasting, if not permanent (Hammitt & Cole 1998). Trampling and erosional impacts caused by horses have been found to be significantly higher than hikers, llamas, mountain bikes and even off-road motorcycles (Cole & Spildie 1998, DeLuca et al. 1998, Wilson & Seney 1994). Many studies demonstrate that trampling by a horse is more destructive to vegetation than trampling by foot (Nagy & Scotter 1974, Weaver & Dale 1978, Whittaker & Bratton 1978). Whittaker and Bratton (1978) found vegetation on horse trails to be churned up and often cut off at the roots, instead of flattened, as on hiking trails. An experimental trampling study by Nagy and Scotter (1974) found vegetation loss to be four to eight times greater from horse trampling than hiker trampling. The greater vegetation loss from horse use tends to widen horse trails, which are often two to three times the width of hiker trails (Weaver & Dale 1978). The greater width of exposed soil and inherent characteristics of horses also contribute to the greater erosion potential of horse trails. Erosion occurs after vegetation is lost; vegetation loss exposes soil that can then be eroded by disturbances such as hooves, wind and water. Horse use can be a significant precursor for increased erosion potential (Hammitt & Cole 1998). Soil erosion resulting from horse use is a product of the trampling and eventual loss of vegetative cover, subsurface soil compaction leading to lowered water infiltration rates, and the increased roughness and detachment of surface soil particles. A horse carries a heavy weight on a small, usually shod, hoof. This weight exerts approximately 18 lbs/in2 ground pressure for unshod horses to 62 lbs/in2 for shod horses, compared to 2.9 lbs/in2 for a hiker in boots (Liddle 1997). Thus, horse traffic causes significant compaction to the underlying soil layers, reducing water infiltration and increasing surface runoff. In addition, the action of a horse hoof tends to puncture and dig up the soil surface (McQuaid-Cook 1978). Loose, unconsolidated soil is more prone to erosion than compacted soil and as a result, the potential for erosion increases on horse trails as compared to hiker trails. An evaluation by Deluca et al. (1998) of the mechanisms by which trail traffic leads to accelerated erosion suggested that soil loosening and detachment of soil particles by horses
- 9 -

contributed to the higher erosional rates. Soil compaction and decreased infiltration were not considered as important, a finding supported by the work of Wilson and Seney (1994). Heavy horse traffic in areas with wet soils can result in the formation of muddy quagmires and excessive trail widening. Whittaker and Bratton (1978) found loosening of the soil to be a precursor to muddy trail sections. Loose soil is more apt to form mud than compacted soil and the highly compacted subsurface soils prohibit water infiltration. The resulting impermeable basins retain water and mud long after rainfall. Marion (1994) noted that deep hoof prints collect and retain water, providing greater surface contact between water and soil and accelerating the formation of mud. Trail muddiness can be a temporary or seasonal problem, making travel difficult and often resulting in significant trail widening when trail users seek to circumvent muddy sections. Other trail problems attributed to horse use include the proliferation of informal trails, manure on trails, tree damage, and the introduction and spread of exotic vegetation. Trail braiding is especially troublesome in meadows, where stock users tend to spread out rather than ride in single file (Hammitt & Cole 1998). The creation of side trails to access water, features of interest, or short cuts to other trails are also considered a significant form of trail impact. User-created trails are often poorly routed and not maintained, resulting in an increased potential for degradation. Manure on trails is both an ecological and social problem. Manure can contain the seeds of exotic plants, although seeds may also be introduced from horse feed, equipment, and mud stuck to horse hooves. Large numbers of weed seeds can pass through the gut of horses and germinate in their manure (St John-Sweeting & Morris 1991). However, Whinam et al. (1994) found that weed seeds were limited to the manure, and Whinam and Comfort (1996) revealed no indication of introduced weeds from monitoring. Large amounts of manure may also pose a threat to water quality (Hammitt & Cole 1998). Finally, horses tied to trees can result in damage to bark and roots. Ropes or chewing can damage tree bark and may completely girdle and kill trees (Cole 1983). Bark damage weakens trees and opens their inner wood to invasion by insects and diseases. Pawing and digging by confined horses erodes soils and exposes tree roots. In the Bob Marshall Wilderness of Montana, campsites used by horse groups had eleven times as many damaged trees and twenty-five times more trees with exposed roots than backpacker sites (Cole 1983). It is important to note that while horse use is often a more impacting type of use, other factors may be more influential determinants of resource degradation. For example, McQuaid-Cook (1978) found trail impact to be more a function of slope and trail location than a result of user type. Nagy and Scotter (1974) concluded that although horse use generally causes more damage than hikers, the degree of difference depends on the soil, vegetation, topographic and climate characteristics. Summer (1980) identified the most influential landscape factors governing trail deterioration as parent material, grade of trail and side-slope, soil texture and organic content, rockiness, vegetation, and drainage. Measurements of physical changes along trails receiving a constant amount of horse use resulted in a wide spectrum of erosional impacts as influenced by one or more of the landscape factors listed above. Summer (1980, 1986) concluded that horse traffic was not the most important agent contributing to trail degradation. Deluca et al. (1998) experimentally compared the effects of hikers, llamas, and horses on established recreational trails in western Montana. They concluded that horses consistently
- 10 -
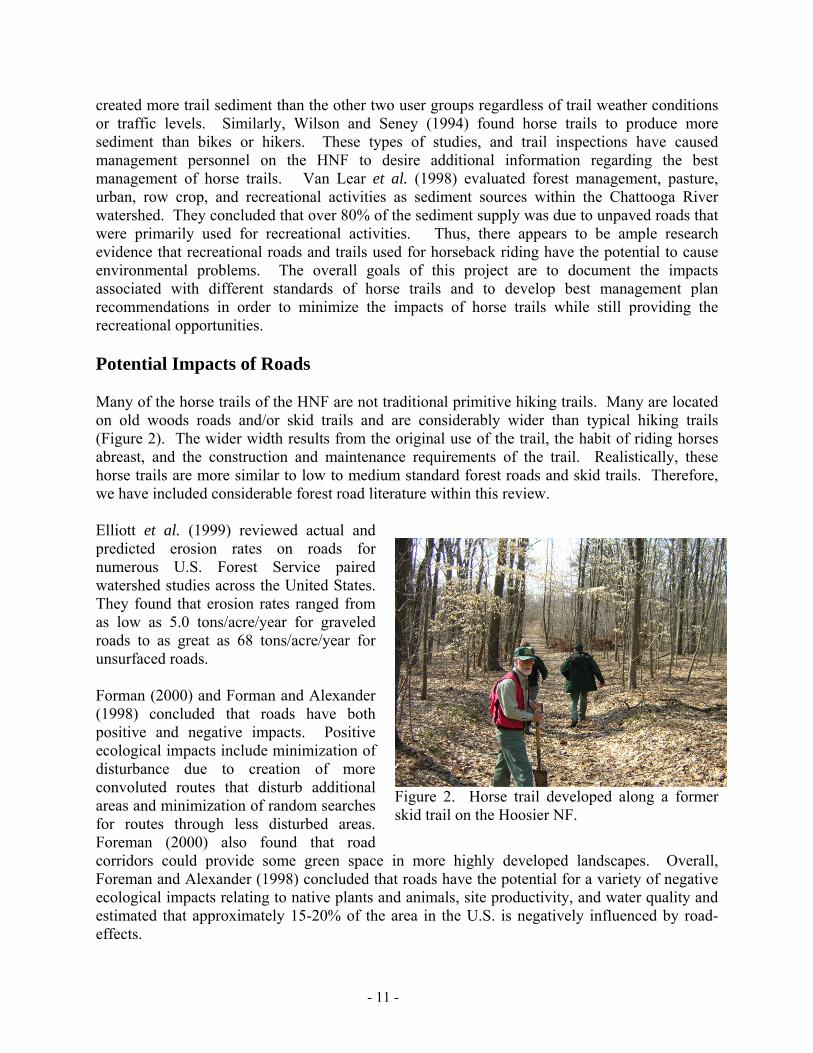
created more trail sediment than the other two user groups regardless of trail weather conditions or traffic levels. Similarly, Wilson and Seney (1994) found horse trails to produce more sediment than bikes or hikers. These types of studies, and trail inspections have caused management personnel on the HNF to desire additional information regarding the best management of horse trails. Van Lear et al. (1998) evaluated forest management, pasture, urban, row crop, and recreational activities as sediment sources within the Chattooga River watershed. They concluded that over 80% of the sediment supply was due to unpaved roads that were primarily used for recreational activities. Thus, there appears to be ample research evidence that recreational roads and trails used for horseback riding have the potential to cause environmental problems. The overall goals of this project are to document the impacts associated with different standards of horse trails and to develop best management plan recommendations in order to minimize the impacts of horse trails while still providing the recreational opportunities. Potential Impacts of Roads Many of the horse trails of the HNF are not traditional primitive hiking trails. Many are located on old woods roads and/or skid trails and are considerably wider than typical hiking trails (Figure 2). The wider width results from the original use of the trail, the habit of riding horses abreast, and the construction and maintenance requirements of the trail. Realistically, these horse trails are more similar to low to medium standard forest roads and skid trails. Therefore, we have included considerable forest road literature within this review. Elliott et al. (1999) reviewed actual and predicted erosion rates on roads for numerous U.S. Forest Service paired watershed studies across the United States. They found that erosion rates ranged from as low as 5.0 tons/acre/year for graveled roads to as great as 68 tons/acre/year for unsurfaced roads. Forman (2000) and Forman and Alexander (1998) concluded that roads have both positive and negative impacts. Positive ecological impacts include minimization of disturbance due to creation of more convoluted routes that disturb additional areas and minimization of random searches for routes through less disturbed areas. Foreman (2000) also found that road corridors could provide some green space in more highly developed landscapes. Overall, Foreman and Alexander (1998) concluded that roads have the potential for a variety of negative ecological impacts relating to native plants and animals, site productivity, and water quality and estimated that approximately 15-20% of the area in the U.S. is negatively influenced by road-effects.
Figure 2. Horse trail developed along a former skid trail on the Hoosier NF.
- 11 -

Gucinski et al. (2001) published an extensive review of the potential effects of forest roads that categorized the potential negative effects of forest roads into the broad categories of direct physical and ecological effects and indirect landscape level effects. Direct physical and ecological effects of forest roads include geomorphic alteration of sediment supply and landslides, hydrologic alterations, decreased site productivity, habitat fragmentation, and introduction of exotic species. Indirect landscape level effects included alteration of aquatic habitat, alteration of terrestrial habitat, road kills, introduction of pathogens, changes in predation, altered biodiversity, and decreased water and air quality. Factors Affecting Trail Resource Impacts The type and extent of trail impacts are influenced by use-related and environmental factors, both of which may be modified through management actions. Use-related factors include type of use, amount of use, and user behavior; environmental factors include attributes such as vegetation and soil type, topography and climate. Recent comprehensive reviews of the role of these factors are provided by Leung and Marion (1996), Hammitt and Cole (1998), and Marion (1998).
Use-Related Factors
For well-designed and constructed trails, post-construction trail impacts would be minimal in the absence of use. Rainfall might erode some soil following construction but in most environments organic litter and vegetative colonization would increasingly minimize such impacts on unused trails. Numerous studies have documented a curvilinear relationship between amount of use and most forms of trail impact (Cole 1983, Sun & Liddle 1993a,b, Weaver et al. 1979). Initial or low levels of use generate the majority of use-related impact, with per-capita impacts diminishing as use increases. For example, vegetation and organic litter are either removed during trail construction or are quickly lost from trails receiving even light traffic. Further traffic causes relatively little additional impact, particularly on trails with adequate maintenance to control water runoff and tread widening. An important implication is that substantial use reductions must occur on highly visited trails to achieve any significant reduction in impact. Some specific impacts, such as trail widening and creation of parallel treads (trail braiding) or side trails, are strongly influenced by user behavior (Hammitt & Cole 1998). Visitors seeking to avoid severe rutting or rockiness caused by soil erosion or muddiness often cause trail widening. Visitors traveling side-by-side rather than single file also contribute to this problem. Type of use has also been shown to be a significant determinant of the type and extent of trail impacts. For example, Wilson and Seney (1994) evaluated tread erosion from horses, hikers, mountain bikes, and motorcycles and found that horses made significantly more sediment available for erosion than the others uses, which did not significantly vary from the control. Thurstan and Reader (2001) found no significant differences between the vegetation and soil impacts from hiking and mountain biking, though they speculated that behavioral differences between the two groups could contribute to the belief that mountain biking has led to trail degradation problems.
Environmental Factors
Many trail impact problems are the result of poor location rather than higher impacting types or amounts of use (Cole, 1987; Leung and Marion, 1996, 2000). Many trails have sections ranging
- 12 -

from good to poor condition, yet each trail likely receives the same types and amounts of use. Thus, problems like muddy soils or eroded treads are primarily a function of trail routings through wet soils or up steep slopes. Applying tread reconstruction and maintenance solutions to such problems can be expensive, effective for only a short time, and give the trail a more “developed” appearance that can alter the nature of recreational experiences. Short trail reroutes or larger relocations are a more effective long-term solution for sustaining traffic while minimizing resource impacts and maintenance. The following topics highlight some important trail location and design considerations to promote sustainable trail development. These include vegetation type, topography, and soil and surface characteristics. Vegetation Type In general, dense understory vegetation that is resistant to trampling will inhibit trail widening, though these attributes are less important in reducing soil loss. Dense trailside vegetation confines the lateral spread of trail users while segments crossing open meadows often widen or split to form multiple treads. At low use levels, vegetation types with high trampling resistance and/or resilience (ability to recover) can sustain use with little degradation. The influence of these attributes diminishes with increasing use and is relatively unimportant at high use levels (Cole 1988). Topography Characteristics of topography have been the most intensively investigated influences on trail degradation. Numerous studies have documented strong positive relationship between trail slopes and soil loss (Weaver and Dale 1978; Bratton et al. 1979, Teschner et al. 1979). The greater velocity and erosivity of surface runoff on steep slopes is the predominant cause but other influences, such as the slippage of feet and hooves, are also likely contributors. The orientation of the trail to the prevailing slope, termed the trail angle by Bratton et al. (1979), and slope alignment angle by Marion and Leung (2001), is an important factor often overlooked by trail designers and researchers. Trails that more directly ascend the fall line of a slope, irrespective of its steepness, have a low slope alignment angle. Side-slopes, the terrain adjacent to either side of the trail, are relatively flat with low slope alignment angles, relative to the plane of the trail tread (Figure 3). Trails with a low slope alignment angle are susceptible to degradation because their flatter side-slopes offer little resistance to trail widening, and hinder or block the drainage of water from incised trail treads. The slope alignment angle is important regardless of topographic position (valley bottom, mid-slope, ridge- or mountaintop),
Very Low - easy to drain water but trail can’t change elevation very fast
68-90o
Low – easy to drain water while still changing elevation
46-67o
High – draining water will be difficult in most places
23-45o
Very High – erosion from water draining along tread and muddiness from water trapped on treads
0-22o
Slope Alignment Degradation Potential Trail ProfileAngle
Figure 3. Trail erosion potential and probable profile for trails with different slope alignment angles (landform slope is dotted line, trail is solid line).
- 13 -

though the greater rainfall at higher elevations can increase erosion rates. The importance of slope alignment angle increases in significance as trail slope increases. Water trapped within low slope alignment trails with lower grades creates muddiness and are highly susceptible to widening. This can occur in both valley bottom and ridge-top settings. Trails that more closely follow the contour have a high slope alignment angle: they are more perpendicular to the slope (Figure 3). Known as “side-hill” trails, their steeper side-slopes confine use to the constructed tread and facilitate tread drainage. Though side-hill trails often develop a berm of soil along their lower edge, these can be cut through during water bar or drainage dip construction to allow water to drain off trail treads (Birchard & Proudman 2000, Hesselbarth & Vachowski 2000). The easy removal of water from side-hill trails and the ease of angling them to avoid steep trail grades make high slope alignment angle trails far more sustainable and less expensive to maintain over time. Proximity to groundwater discharge areas or streams can also increase the susceptibility of trails due to excessive wetness and periodic flooding of trail treads (Root & Knapik 1972). Such problems are most prevalent in valley bottom settings adjacent to streams and rivers. Unless adequate drainage and hardening features are provided in these areas, trails with eroded and muddy tread surfaces are unavoidable. In summary, degradation can be minimized by mid-slope topographic positions with low trail grades, and higher slope alignment angles with moderate side-slopes. Soil and Surface Characteristics Soil properties, including soil wetness, texture, structure and depth, influence the ability of soil to withstand a given type and amount of traffic (Demrow & Salisbury 1998, Scottish Natural Heritage 2000). Trails that traverse poorly drained soils are susceptible to excessive trail widening as users seek to avoid muddy areas. Wet muddy soils are also more susceptible to erosion, especially when trail grades are steeper. Highly organic soils retain water long after rains and with traffic become mucky (Bryan 1977). Wet soils often present seasonal limitations, as during times of the year when rainfall or snowmelt are particularly high. However, these problems are exacerbated if trails are located near streams and groundwater discharge areas. If soils that are seasonally wet and poorly drained cannot be avoided, be prepared to employ trail construction techniques such as boardwalks, turnpikes, causeways, puncheon or geosynthetics to sustain traffic and avoid muddiness (Hesselbarth & Vachowski 2000). Trails on soils with fine and homogeneous textures are more erodible and often have greater tread incision (Bryan 1977, Welch & Churchill 1986). Loam and sandy-loam soils, because of their even mixture of silt, clay and sand, provide the fewest limitations for trails (Demrow & Salisbury 1998, Hammitt & Cole 1998). Removal of organic litter and soils during trail construction to expose underlying mineral soil creates a more durable tread less prone to muddiness. Rock and gravel in the mineral soil further strengthens them to support heavy traffic while resisting erosion and muddiness. Where possible, avoid soils high in silt and clay, which become muddy when wet, or cracked and dusty when dry. Soil depth to bedrock of greater than one meter is preferred – shallower soils may become saturated and subject to muddiness. Extremely thin soils in alpine terrain are easily eroded so contain traffic on clearly marked treads (Demrow & Salisbury 1998). Repeated traffic will alter
- 14 -

soil structure, compressing the arrangement of soil aggregates and decreasing air and water infiltration (Pritchett 1979). However, compacted treads provide a more stable and resistant surface that sheds water to resist muddiness and minimizes the potential for soil erosion. Surface characteristics generally refer to the roughness of trail treads, such as stoniness and the presence of exposed tree roots. Trails on soils with a high rock or gravel content are less susceptible to soil erosion (Bryan 1977, Weaver & Dale 1978). Rocks and gravels are less easily eroded by water or wind, and these materials can act as filters, retaining and binding finer soil particles. In general, small rocks and stones should not be removed from trail treads as their presence tends to slow the velocity of water runoff and protect underlying soils (Summer 1980, 1986). Trail Management Few studies have directly examined the influence of managerial actions, though they have considerable potential for modifying the roles of use-related and environmental factors (Leung & Marion 1996). Knowledge of relationships between environmental factors and trail impacts can be applied to route trails in the most resistant and sustainable locations. Muddiness can be limited by avoiding wet organic soils and flatter terrain, erosion can be limited by avoiding steep trail grades and low trail alignment angles, and parallel treads and tread widening can be limited by locating trails in sloping terrain where steeper side-slopes direct visitors to stay on the provided tread (Birchard & Proudman 2000). Through educational and regulatory actions, managers can influence or control all use-related factors. For example, the impacts of horses or vehicles may be limited by restricting their use to resistant trails, prohibiting their use on non-graveled trails during wet seasons, or limiting their numbers. Trail construction and maintenance actions, including installation and upkeep of tread drainage features, rock steps, and bridging, are also vital to limiting soil erosion and tread muddiness, which in turn, influence user behavior and the extent of impacts such as tread widening and secondary tread development (Birchard & Proudman 2000). Unfortunately, trail management functions, because of their expense, are often neglected and may be traded for use-related restrictions and regulations. Grace (2002a) reviewed the forest road best management practices for the 13 southeastern states and concluded that almost all of the states address the same basic issues of location-planning, construction, stabilization, drainage, maintenance, and stream crossings. Swift (1985) summarized almost 50 years of forest road related research from the USFS Forest Hydrology Laboratory at Coweeta, NC and the Timber and Watershed Laboratory at Parsons, WV. Swift (1985) concluded that application of existing technology would provide low cost, low maintenance road designs that would provide lower levels of sediment to streams. The main features needed were road planning and location, proper road template selection, adequate water control, road stabilization, and surfacing. These basic features will be covered in additional detail below.
Trail Construction
Trail Standards Trail standards refer to the trail characteristics that act in concert to provide different qualities of traffic, ease and timing of access, maintenance requirements, and costs (Walbridge 1997, Walbridge et al. 1984). In general a higher standard trail will provide enhanced travel, lower
- 15 -

maintenance, but will have a greater construction cost (Table 2). Issues that should be considered prior to selection of the final trail standards are: trail grade, maximum trail grade for short distances, trail surface width, trail template, drainage structures, surfacing, stream crossings to be used, seasonality, intended traffic volume and type, and intended maintenance regime. If vehicular traffic is intended, then turning radii should be considered for design of curves and switchback radii. Table 2. Examples of high and low trail standards. Additional examples are available in Hesselbarth and Vachowski (2000). Trail Parameters High Standard Trail Low Standard Trails Users Bike, horse, hiker Hikers only Season of major use All year Summer, Fall Grade (%) <8% 10-12% Maximum grade for 200 ft 10% 15% Desired tread width 8 feet 3 feet Trail template Insloped Outsloped Drainage structures Culverts, turnouts Water bars, turnouts Surfacing 6 inches gravel Native material Stream Crossings Culverts Fords Maintenance inspections 1-2/year Every 2 years Maintenance schedule Every 2 years Every 4 years Construction Cost ($/mile $15,000/mile $4000/mile for comparison only) Location Walbridge (1997) stated that "the three most important considerations for forest roads are location, Location, and LOCATION!" Hank Sloan, an experienced road designer with the U.S. Forest Service has said that "a low standard road in a good location is usually better than a higher standard trail in a poor location." Unfortunately, many roads and trails are in poor locations for a variety of reasons including inheritance of existing roads having poor locations or designs that are currently unacceptable by today's standards, inaccessible areas having limited access options, equipment operator location of roads without benefit of a surveyed gradeline, and simply poor trail location skills. Egan (1999) suggested that the components of the Universal Soil Loss Equation (rainfall and runoff, soil erodibility, slope length and steepness, cover, and management practices) be carefully considered as roads are being located and constructed. Swift and Burns (1999) suggested that the cost of moving these poorly located or designed roads is often prohibited by costs of new construction. They recommended that redesign and reconstruction to upgrade the existing trails and that relocation be used only for the worst segments. This strategy seems viable on public lands having older road systems and limited road budgets. Elliot and Tysdal (1999) evaluated erosion problems from insloped roads and concluded that distance between the road and the stream, ditch water control, road segment lengths, road
- 16 -
gradient, and cutslope height and cover were the five most important considerations for control of sediment from forest roads. Four of the five issues are directly addressed by the process of road location. McCashion and Rice (1983) evaluated almost 350 miles of logging roads in northwestern California. As they encountered erosion problems they characterized the cause of the problem and estimated how the problem might have been avoided. They concluded that approximately 76% of the problems were due to problems with site characteristics and slope alignment, clearly indicating the importance of road location. It is tempting to use a poorly located trail as opposed to developing a new trail. New trails are costly and time consuming and the older trails are sometimes difficult to close. However, location costs are minimal compared to the construction costs. Aust and Shaffer (2001) found that location costs represented less than 3% of the total road costs for almost a mile of forest road. New trail construction has the potential to cause significant erosion because the construction phase exposes previously covered soil and breaks downs large soil aggregates into less stable structures. New trail construction should always be conducted on flagged or otherwise marked gradelines (Walbridge 1997). Simply showing the equipment operator or trail crew starting and ending points is probably not sufficient for ensuring proper location and design. Unfortunately, even experienced equipment operators will construct a better trail if a gradeline is well marked.
New trail construction typically follows the following stages (Figure 4). The clearing and grubbing phase removes vegetation, litter, and roots. For some trails, subsequent traffic may actually serve as the agent for root and litter removal. After clearing and grubbing, the cross section of the trail is constructed. Fill slopes and cut slopes may require some stabilization at this phase. Water control structures are installed and surfacing is applied and spread. The construction phase of trails is a highly erodible time and generally requires the use of multiple erosion control measures to protect water quality (Grace 2002a, Jubenville & O'Sullivan 1987). This is a rapidly
improving technology, but seeding, mulching, hydroseeding, sediment fencing, stacked hay bales, sediment traps and armoring all have applications.
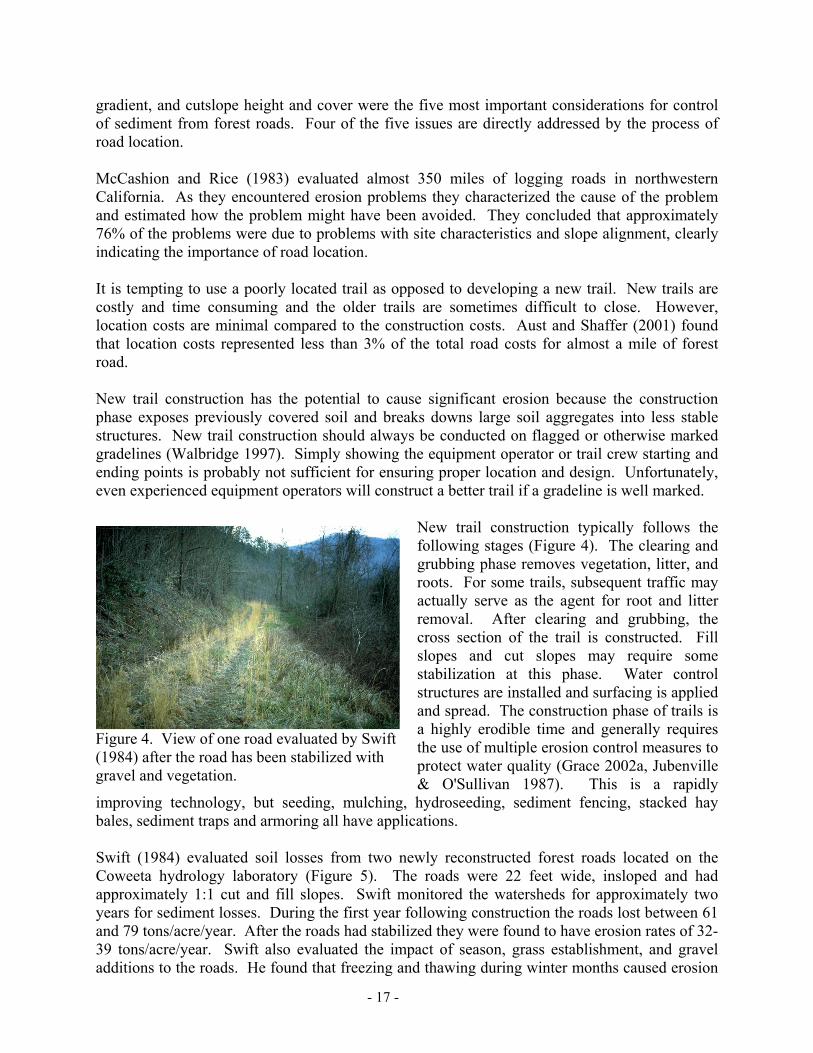
Figure 4. View of one road evaluated by Swift (1984) after the road has been stabilized with gravel and vegetation.
Swift (1984) evaluated soil losses from two newly reconstructed forest roads located on the Coweeta hydrology laboratory (Figure 5). The roads were 22 feet wide, insloped and had approximately 1:1 cut and fill slopes. Swift monitored the watersheds for approximately two years for sediment losses. During the first year following construction the roads lost between 61 and 79 tons/acre/year. After the roads had stabilized they were found to have erosion rates of 32-39 tons/acre/year. Swift also evaluated the impact of season, grass establishment, and gravel additions to the roads. He found that freezing and thawing during winter months caused erosion
- 17 -

rates to become as large as 162 tons/acre/year due to cut slope slumpages. The addition of gravel and establishment of grass combined to reduce erosion rates
Figure 5. From top to bottom: typical examples of trail clearing, establishment of road surface, stabilizing the surface, installation of water control/stream crossing structures, and surfacing.
to less than 2 tons/acre/year. Overall, Swift recommended slope stabilization, control of grade, gravel, and seeding as being critical for erosion control on forest roads. Road Costs Road costs vary tremendously due to differences in terrain, contactor fees, competition, etc. and cost estimates are difficult to obtain. There are basically 4 general ways in which road costs can be estimated: 1. local experience, 2. obtaining contractor bids (either with or without earthwork estimates) 3. machine rate estimates based on equipment handbooks, and 4. estimating cost components (Walbridge 1997). Aust and Shaffer (2001) maintained records of component costs for 4500 feet of road construction in the Appalachian mountains. The road had a 9-10% grade and was insloped, 16 feet wide, graveled to 3 inches depth, and used a combination of culverts and broad based dips for drainage. Cost estimates are provided in Table 3. Trail Grade Trail grade is one of the most important considerations for ensuring the life of a trail as well as minimizing environmental impacts. An important goal of trail layout and design is to minimize the number of tread structures (e.g., drainage features, steps, tread armoring) and tread maintenance (Birchard & Proudman 2000). The most important design specification for limiting soil erosion is keeping trail grades below 10% (Hooper, 1988) or 12% (Hesselbarth & Vachowski 2000, Agate 1996) (Figure 6). A design grade of less than 9% is recommended for equestrian trails (Vogel 1982). There are at least three compelling reasons to keep grades below 12%: 1. Trail grades in excess of 10-12% are simply more difficult to traverse. 2. Trails steeper than 10% erode at increasingly greater rates because erosion rates start to
become exponentially greater with increasing trail grades. Erosion from steep trails is more difficult to prevent.
3. Trail maintenance expenses are greater for steeper sections of trail. It is not uncommon for gravel applications to be 4-5 times greater for trails steeper than 10%.
- 18 -

Table 3. Costs for location and construction of a typical minimum standard forest road in the Appalachian Mountains. Cost are based on 2001 dollars. Activity Actual Cost per 4500 feet Estimated Cost per Mile ($) (%) ($) Location1 480 2.7 563 Clearing and Grubbing2 4250 23.9 4987 Finishing cut slopes3 1500 8.4 1760 Constructing ditches4 1300 7.3 1525 Installing culverts5 3200 18.0 3755 Graveling6 5313 29.9 6234 Seeding banks7 256 1.4 300 Closure8 500 2.8 1173 Maintenance9 1000 5.6 1173 Total Road Costs 17,799 100.0 20,797
1 Two person location team paid $12/hr and working for 20 hr each. 2 50 hrs for Caterpillar D6 with machine and operator cost of $85/hr. 3 20 hrs for a Caterpillar 963 with a machine and operator cost of $75/hr. 4 20 hrs with a John Deere 672A motorized grader with machine and operator cost of $65/hr. 5 Cost of culvert and installation with caterpillar backhoe totaling $400/culvert. 6 Based on delivered gravel cost of $6.25/ton 7 Based on contract seeding price of $300/mile. 8 Purchase of materials and manufacture of steel gate. 9 Five year average annual costs for gravel, drainage cleaning, grading.
0
3
6
9
12
0 2 4 6 8 10 12 14 16 18 20Trail slope (%)
Estim
ated
ero
sion
(ton
s/ac
re/y
ear)
Figure 6. Effect of trail slope percent on estimated erosion if rainfall and runoff factor (R = 175), soil erosivity (K = 0.3), slope length (L=100) and cover and support practices (CP = 0.04864) are held constant for the USLE (Dissmeyer & Foster 1984). Note that the effect of slope becomes more pronounces after 10-12 % slope. (Dashed lines are for visual emphasis)
- 19 -
Trail segments with steeper grades should be rerouted wherever possible, particularly those receiving moderate to heavy use. When topographic features prohibit relocation more extensive tread work involving steps, drainage, and armoring with rock (stone pitching) will be essential to prevent excessive erosion. Trimble and Sartz (1957) concluded that downslope gradient was the key to understanding how far sediment would move below a forest road. They developed the following equation, widely used by state forestry organizations for developing Streamside Management Zone (SMZ) guidelines: SMZ width needed to protect against road sediment = 25 ft + 2 ft (sideslope percent). Haupt (1959) followed up on the work by Trimble and Sartz (1957) to determine which road characteristics were critical for predicting the distance that road sediment will travel. Haupt concluded that slope obstructions (such as litter), cross ditch intervals, road gradient, and cut slope lengths were significant factors for predicting a road's erosion potential. Luce and Black (1999) installed 74 sediment traps for section of forest road in western Oregon. All roads were at least 16 feet wide, insloped, graveled, and had light traffic. They found that sediment production was best predicted by the product of segment length x road gradient2, indicating the profound effect of road grade. Trail Slope Length The length of trail on a particular slope can also have negative effects on erosion rates. Long slopes on a steep grade allow water to accelerate to velocities that have greater erosive forces. Long slopes also have the tendency to accumulate greater quantities of water simply because of their increased area. The combination of greater quantity (mass) and velocity provide for potential erosion problems. The solution to this problem is to either ensure that long slopes have minimal grades and adequate cover or to break the sections of trail into shorter sections. These shorter sections provide opportunities to install water control structures such as broad based dips or turnouts. Sidehill Trails Trails with a high slope alignment angle (side-hill trails) are always the most preferred design (Birchard & Proudman, 2000). A properly constructed sidehill trail design allows the greatest control over trail grades and effectively minimizes the most common and significant trail degradation problems: tread erosion, muddiness, widening, and secondary treads (Agate 1996, Birchard & Proudman 2000, Demrow & Salisbury 1998, Hesselbarth and Vachowski 2000). However, sidehill construction is more difficult, particularly on steep slopes. The amount of excavation on slopes greater than 50% is considerable and treads will slump or erode unless shored up with retaining walls (Birchard & Proudman 2000). Regardless, the benefits of avoiding or minimizing future resource degradation and the cumulative costs of repetitive short-term maintenance clearly make sidehill trails the preferred design for resource protection and sustainable use. Sidehill trail construction requires excavating the trailbed into the slope to create a gently outsloped bench. A trail crossing slopes up to 10% may require only the removal of organic litter and soils to expose mineral soil, which will remain drier and is more resistant to traffic than
- 20 -
organic materials. Sideslopes of 10-30% can employ a half-bench design where half the tread rests on original mineral soil exposed by excavation and half is on compacted mineral soil dug from upslope (Hesselbarth & Vachowski 2000). A three-quarter or full bench construction will be more sustainable and is preferred, particularly on slopes above 30%. Outsloping treads 5% (1 in drop for every 18 in of width) during construction allows water to drain across and off the tread, rather than accumulate and run down the trail to erode soil (Birchard & Proudman 2000, Hooper 1988). However, natural processes and trail use eventually compromise tread outsloping so additional measures are needed to remove water from treads. The most effective and sustainable method for removing water from trails is the Coweeta or grade dip, also known as terrain dips or rolling grade dips (Birchard & Proudman 2000, Hesselbarth & Vachowski 2000). These are constructed by reversing the trail’s grade periodically to force all water off the tread. These must be planned during initial construction so that a descending trail’s grade levels off and ascends for 10 to 15 ft before resuming its descent. A sufficient frequency of grade dips, particularly on steeper trail grades and in mid-slope positions, is necessary to prevent the accumulation of sufficient water to erode tread surfaces. Additional methods for removing water on previously constructed trails are described under Trail Maintenance. Stream Crossings A good trail design will minimize the number of stream crossings and carefully plan the locations where crossings are necessary. Inadequate or poorly designed stream crossings have two major potential problems: they can be major environmental problems and they can have poor trafficability. Fortunately, several viable options exist, including bridges, low water crossings, culverts, and fords. Trails approaching stream crossings often directly descend steep slopes and are prone to erosion, the sediments from which can drain into streams. The employment of a side-hill design across slopes permits control of trail grades and drainage. Adequate tread drainage in the vicinity of streams prevents the buildup of larger, more erosive volumes of water. Tread outsloping is a recommended tread drainage method near streams because runoff is slowed and evenly distributed, allowing adjacent organic litter and vegetation to filter out soil particles before reaching streams. Bridges are also critical resource protection facilities on horse and motorized trails, uses that are more apt to loosen tread soils, making them more susceptible to erosion. Aust et al. (2003) compared the costs of a variety of stream crossings appropriate for forest roads on first order Appalachian stream. Overall, they found that one stream crossing can cost as much as construction of 1 mile of forest road ($25,000) to as little as $1000 for geotextile fords. The decision about the most appropriate crossing is based on the integration of funds, environmental sensitivity, season of crossings, desired longevity, and site engineering and permitting issues. Taylor et al. (1999) compared the environmental effects of fords, bridges, and culverts on stream water quality. They concluded that sediment production was highest for fords and lowest for bridges and sediment production was highest for all structures during the installation phase. After stabilization, the greatest source of sediment for all structures was due to the stream approach which provided over 90% of the total sediment. Bridges can be constructed from a variety of materials, but wood is an obvious choice on trails. These structures can be
- 21 -
manufactured on site or can be purchased as prefabricated structures for installation. A professional engineer should be involved if bridges are selected. Bridges have several advantages over other options. They do not restrict the flow of water at the crossing and therefore do not restrict the travel of aquatic organisms. Also bridges tend to keep traffic and soil out of the stream to a greater degree than other alternatives. However, bridges can be relatively expensive and require professional engineering skills (Aust et al. 2003). Culverts are often used for small stream crossings. Culverts are relatively easy to install and are usually less expensive than bridges. Culverts have several disadvantages. A common problem with culverts is that they can be plugged by sediment or woody debris. Use of adequate sized culverts minimizes the problem but regular maintenance is required. Culvert installation is another potential source of sediment to the stream because soil is actually placed around the culvert in the channel. Furthermore, the culvert tends to increase water velocities at the outlet and improper placement can restrict movement of aquatic organisms. Protection of the inlet, outlet, and fill materials with seed and armor are required (Blinn et al 1999). Fords have historically been successful when located at places where the stream is wide, shallow, and has a hard bottom. Fords work well in such locations, but still have the potential to cause water quality problems by allowing direct contact between water and the traffic. For example, fords allow direct inputs of horse manure from horse trails. Another common problem is that fords are sometimes used in situations where the bottoms are soft. These require some sort of surfacing with stone or concrete. The stone and concrete should be similar physically and chemically to native stream material. Geotextiles such as geoweb provide an excellent mechanism for stabilizing stone in stream fords (Aust et al. 2003). Low water crossings, commonly constructed from culverts and concrete, represent attributes of bridges, fords, and culverts. These are acceptable crossings in situations where traffic will be restricted during periods of high water and the crossing will receive routine maintenance. Techniques for Wet Soils Areas with wet soils require more expensive initial construction and continuing maintenance and should be avoided whenever possible. When wet soils do need to be traversed, constructing parallel drainage ditches can be effective by draining water away from tread soils. More expensive options include turnpike and puncheon construction, which elevate the trail above wet ground. A turnpike is constructed by placing mineral soil excavated from two parallel trailside ditches between rows of rot-resistant logs or rocks (Steinholtz & Vachowski 2001). Geosynthetics (described in a following section) can be used under the fill material or to encapsulate gravel or rock to improve drainage and trafficability (Monlux & Vachowski 2000). Puncheons are elevated wooden walkways ranging from primitive bog bridging (Demrow & Salisbury 1998) to more elaborate structures with wooden stringers and decking (Steinholtz & Vachowski 2001). Puncheon has much higher initial and recurring costs so it is generally used only in locations where suitable mineral soil or gravel is unavailable for turnpike construction (Birchard & Proudman 2000). Puncheon must also be well-anchored in areas prone to flooding and may burn during dry season forest fires. More elaborate elevated boardwalks and bridges are required when deeper water or ravines must be traversed (Steinholtz & Vachowski, 2001).
- 22 -

Tread Hardening A number of tread hardening techniques may also be employed during original trail construction or during subsequent reconstruction and maintenance. Wet soils can be capped with crushed stone or excavated and replaced with crushed stone or other suitable fill material (Meyer 2002). Large stones are often used to form a stable base in wet soils, often capped with crushed stone and “crusher fines” or “whin dust” (screened material less than ¼ in) to provide a smoother tread surface that can be periodically hand or machine graded (Scottish Natural Heritage 2000). In Scotland, aggregate placed on top of geosynthetics has been used to effectively “float” trails over deep peat substrates (Bayfield & Aitken 1992, The Footpath Trust 1999). Even soils that are not seasonally wet may require capping with crushed stone to create a tread surface capable of sustaining heavy horse or motorized traffic. Trail surfacing provides two basic functions: it can enhance the trafficability and/or it can reduce erosion. Surfacing such as gravel is commonly used to enhance the trafficability of wet areas. Unfortunately, applications of gravel to trafficked wet areas can be lost as the gravel in churned to lower horizons. Use of larger stone or geotextile underneath the stone can deter this problem and greatly enhance the longevity of the trail. As previously mentioned, gravel can be used to protect bare soil from the erosive forces of water. In general, larger sizes of stone (#1, 2, 3) withstand traffic better, but smaller stones provide a smoother walking or traveling surface. Thus, many road managers choose to use an aggregate such as #3-5-7. Gravel use is common on steeper sections of trail for erosion control, but these areas tend to loose gravel rapidly, particularly as traffic moves the loose stones. Crushed stone (aggregate) will migrate downslope at unacceptable rates when applied to trail grades over 8% (Footpath Trust 1999). Trail segments with steeper grades should be rerouted wherever possible, particularly those receiving moderate to heavy use. When topographic features prohibit relocation more extensive tread work involving steps, drainage, and armoring with rock (stone pitching) will be essential to prevent excessive erosion. Three options can be useful in such situations: 1. Large "steps" of wooden boxes can be used to provide more stable surfaces for foot traffic. Broken rock makes the most suitable fill material above steps as angular edges interlock yet allow drainage, providing a stable base for soil or crushed stone tread substrates. These boxes are expensive to construct and restrict most wheeled traffic. 2. Using large stone in combination with a "sheepfoot" roller packer can pack the stone so that it is less likely to erode. This option can create stone surfaces that are relatively slick to hoofed traffic. 3. Geotextile can be used to create honeycombs that will retain stone. This method will retain the stone better but has the potential to be broken by hoofed traffic over time. Other options for steep slopes include aggregate with rock anchors positioned flush with the path surface to prevent the downward migration of gravel (The Footpath Trust 1999). Rounded (natural) gravel has little cohesion, requiring closely spaced anchors and limiting its application on steeper grades. Angular crushed stone with crusher fines included contains a mix of particle sizes that pack tightly to form a hard durable surface when dry. With a sufficient number of stone anchors and adequate drainage, crushed stone can be applied to slopes up to 16% (Bayfield and Aitken 1992, The Footpath Trust 1999). Stone pitched paths, consisting of well-anchored rockwork across the entire tread surface, are another alternative for steep slopes (The Footpath Trust 1999). Additional options for exceptionally steep pitches include crib ladders, pinned rock or wooden steps, log ladders, and even wooden staircases constructed from dimensional lumber
- 23 -
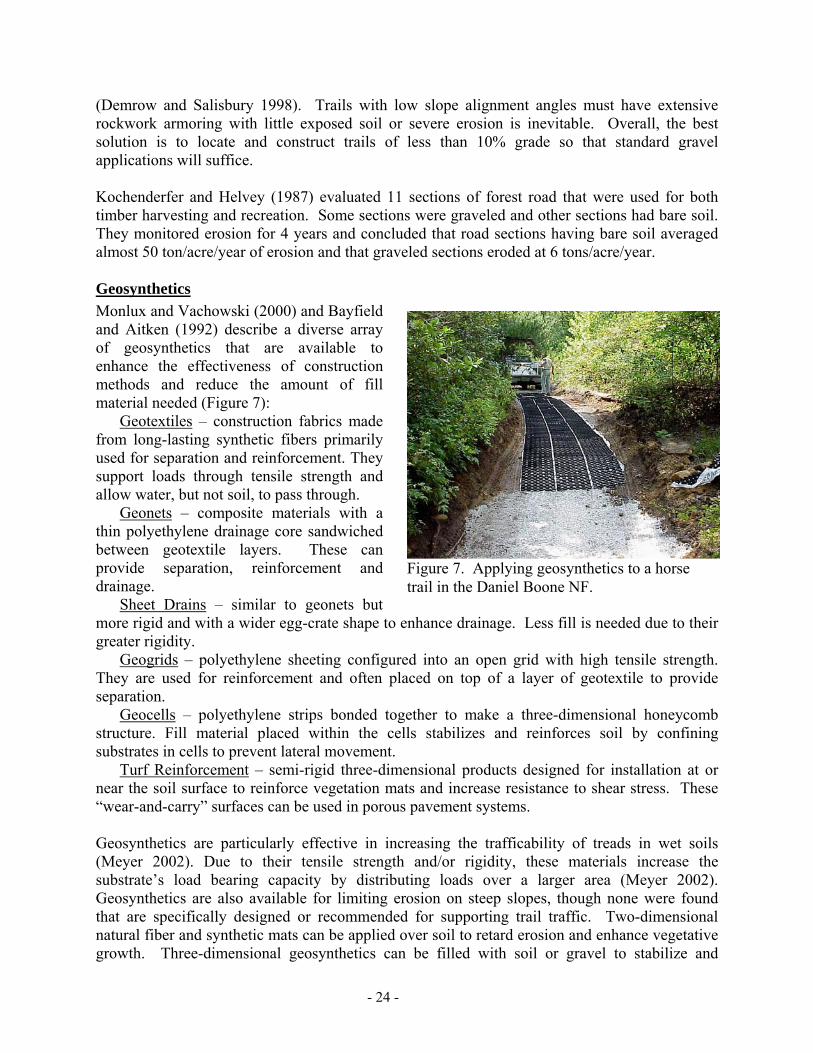
(Demrow and Salisbury 1998). Trails with low slope alignment angles must have extensive rockwork armoring with little exposed soil or severe erosion is inevitable. Overall, the best solution is to locate and construct trails of less than 10% grade so that standard gravel applications will suffice. Kochenderfer and Helvey (1987) evaluated 11 sections of forest road that were used for both timber harvesting and recreation. Some sections were graveled and other sections had bare soil. They monitored erosion for 4 years and concluded that road sections having bare soil averaged almost 50 ton/acre/year of erosion and that graveled sections eroded at 6 tons/acre/year. Geosynthetics Monlux and Vachowski (2000) and Bayfield and Aitken (1992) describe a diverse array of geosynthetics that are available to enhance the effectiveness of construction methods and reduce the amount of fill material needed (Figure 7):
Geotextiles – construction fabrics made from long-lasting synthetic fibers primarily used for separation and reinforcement. They support loads through tensile strength and allow water, but not soil, to pass through.
Geonets – composite materials with a thin polyethylene drainage core sandwiched between geotextile layers. These can provide separation, reinforcement and drainage.
Sheet Drains – similar to geonets but more rigid and with a wider egg-crate shape to enhance drainage. Less fill is needed due to their greater rigidity.
Figure 7. Applying geosynthetics to a horse trail in the Daniel Boone NF.
Geogrids – polyethylene sheeting configured into an open grid with high tensile strength. They are used for reinforcement and often placed on top of a layer of geotextile to provide separation.
Geocells – polyethylene strips bonded together to make a three-dimensional honeycomb structure. Fill material placed within the cells stabilizes and reinforces soil by confining substrates in cells to prevent lateral movement.
Turf Reinforcement – semi-rigid three-dimensional products designed for installation at or near the soil surface to reinforce vegetation mats and increase resistance to shear stress. These “wear-and-carry” surfaces can be used in porous pavement systems. Geosynthetics are particularly effective in increasing the trafficability of treads in wet soils (Meyer 2002). Due to their tensile strength and/or rigidity, these materials increase the substrate’s load bearing capacity by distributing loads over a larger area (Meyer 2002). Geosynthetics are also available for limiting erosion on steep slopes, though none were found that are specifically designed or recommended for supporting trail traffic. Two-dimensional natural fiber and synthetic mats can be applied over soil to retard erosion and enhance vegetative growth. Three-dimensional geosynthetics can be filled with soil or gravel to stabilize and
- 24 -
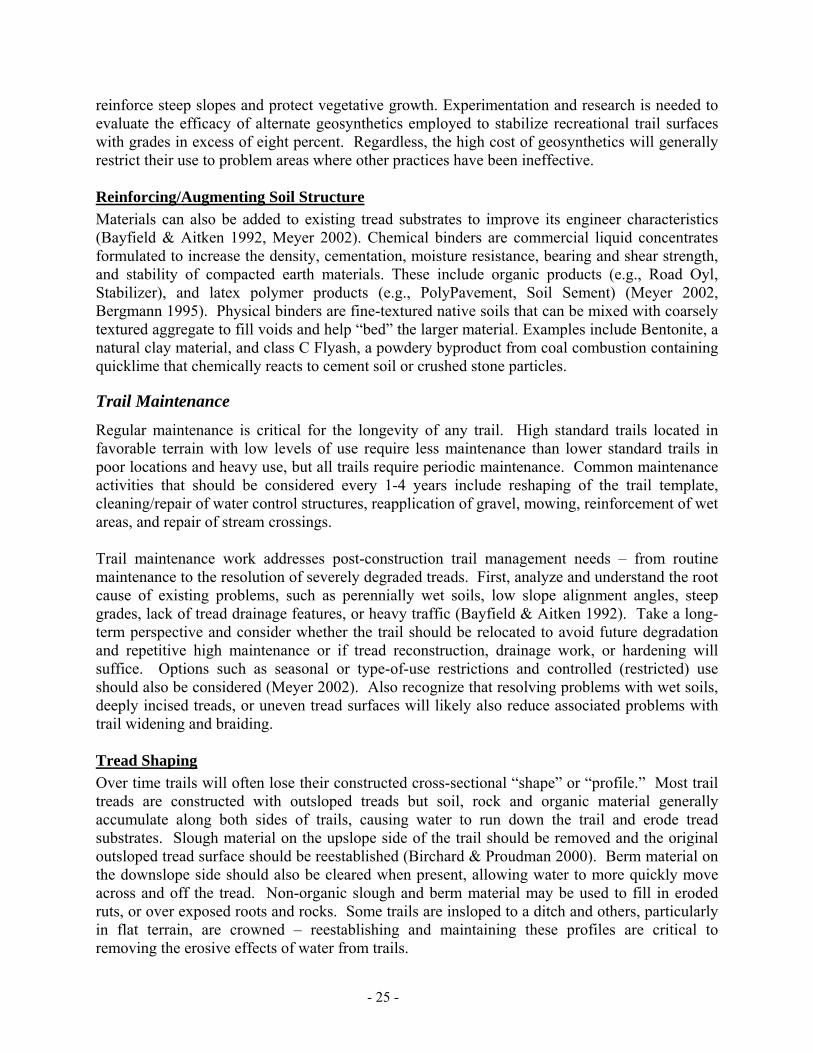
reinforce steep slopes and protect vegetative growth. Experimentation and research is needed to evaluate the efficacy of alternate geosynthetics employed to stabilize recreational trail surfaces with grades in excess of eight percent. Regardless, the high cost of geosynthetics will generally restrict their use to problem areas where other practices have been ineffective. Reinforcing/Augmenting Soil Structure Materials can also be added to existing tread substrates to improve its engineer characteristics (Bayfield & Aitken 1992, Meyer 2002). Chemical binders are commercial liquid concentrates formulated to increase the density, cementation, moisture resistance, bearing and shear strength, and stability of compacted earth materials. These include organic products (e.g., Road Oyl, Stabilizer), and latex polymer products (e.g., PolyPavement, Soil Sement) (Meyer 2002, Bergmann 1995). Physical binders are fine-textured native soils that can be mixed with coarsely textured aggregate to fill voids and help “bed” the larger material. Examples include Bentonite, a natural clay material, and class C Flyash, a powdery byproduct from coal combustion containing quicklime that chemically reacts to cement soil or crushed stone particles.
Trail Maintenance
Regular maintenance is critical for the longevity of any trail. High standard trails located in favorable terrain with low levels of use require less maintenance than lower standard trails in poor locations and heavy use, but all trails require periodic maintenance. Common maintenance activities that should be considered every 1-4 years include reshaping of the trail template, cleaning/repair of water control structures, reapplication of gravel, mowing, reinforcement of wet areas, and repair of stream crossings. Trail maintenance work addresses post-construction trail management needs – from routine maintenance to the resolution of severely degraded treads. First, analyze and understand the root cause of existing problems, such as perennially wet soils, low slope alignment angles, steep grades, lack of tread drainage features, or heavy traffic (Bayfield & Aitken 1992). Take a long-term perspective and consider whether the trail should be relocated to avoid future degradation and repetitive high maintenance or if tread reconstruction, drainage work, or hardening will suffice. Options such as seasonal or type-of-use restrictions and controlled (restricted) use should also be considered (Meyer 2002). Also recognize that resolving problems with wet soils, deeply incised treads, or uneven tread surfaces will likely also reduce associated problems with trail widening and braiding. Tread Shaping Over time trails will often lose their constructed cross-sectional “shape” or “profile.” Most trail treads are constructed with outsloped treads but soil, rock and organic material generally accumulate along both sides of trails, causing water to run down the trail and erode tread substrates. Slough material on the upslope side of the trail should be removed and the original outsloped tread surface should be reestablished (Birchard & Proudman 2000). Berm material on the downslope side should also be cleared when present, allowing water to more quickly move across and off the tread. Non-organic slough and berm material may be used to fill in eroded ruts, or over exposed roots and rocks. Some trails are insloped to a ditch and others, particularly in flat terrain, are crowned – reestablishing and maintaining these profiles are critical to removing the erosive effects of water from trails.
- 25 -

Treads may also creep downhill from their original alignments. Trail creep is caused by a natural tendency for trail users to travel the downslope edges of side-hill trails (Hesselbarth & Vachowski 2000). Trails should be returned to their original alignments through side-hill tread reconstruction work and by the strategic placement of embedded anchor rocks on the downhill edges of trails. Trail users will seek to avoid the rocks, centering their use along the tread. Crib walls to support treads may be necessary for sections that traverse particularly steep slopes. Tread shaping can also address problems with trail widening and development of multiple treads. Both problems generally occur in flatter terrain in places where woody trailside vegetation provides insufficient deterrence. Reshape treads to improve their trafficability while piling rocks and woody debris along braided treads to discourage further use and prevent erosion. Strategic, yet naturally appearing, guide rocks can also be embedded along trail edges, particularly adjacent to drainage features, to confine traffic to the designed tread width. Lining the tread with rock scree in alpine areas may appear artificial but will be more effective in containing traffic to a single narrow tread than a trail marked with cairns (Demrow & Salisbury 1998). If such measures are ineffective, consider relocating the segment out of flat terrain where possible. Surface Water Control In the central and eastern U.S. water is the greatest erosive force. Water can be erosive as falling raindrops, as surface flow across bare soil, and even as an erosive force in the subsoil under certain situations. For trail longevity, it is absolutely essential that rain drop energy and surface water be controlled. There are multiple mechanisms for providing this control. Raindrop energy can be dissipated by interception by litter layer, by low growing plants, and the lower canopy of trees. Taller trees actually provide less protection from raindrops because water intercepted by taller trees forms larger drops that can actually impact the soil with as much force as non-intercepted raindrops. Therefore it is important to minimize disturbance to the litter and vegetation proximate to trails. For the actual trails, some type of surfacing can provide the best protection against raindrop energy. Often, this is either natural coarse fragments within the soil or applied gravel. Once raindrops begin to accumulate on the surface they begin overland flow and can cause sheet, rill, gully, or mass wasting erosion on non-protected trails. The goal of the trail manager is to control and disperse water in small quantities that have less erosive forces. Two of the very worst trail problems, soil erosion and muddiness, are caused by water accumulating on trail treads. Water removal should be a top trail maintenance priority, one that cannot be deferred without the potential for suffering significant long-term and possibly irreversible trail degradation. Grade dips and tread outsloping are the best and most sustainable methods for water removal – both should be original design features and may be difficult to add during routine trail maintenance work (Hesselbarth & Vachowski 2000). Subsequent trail maintenance seeks to enhance the ability of natural features, or to construct and maintain artificial features that divert water from tread surfaces. Natural features may be roots, rocks, or low points where water can be drained from the trail. Minor ditching at these sites can increase their ability to remove water. Some authors refer to these as “bleeders” (Birchard & Proudman 2000). Artificial tread drainage features include water bars and drainage dips, which are designed to intercept and drain water to the lower sides of trails.
- 26 -

Numerous authors provide guidance on the installation and maintenance of water bars and drainage dips (Agate 1996, Hesselbarth & Vachowski 2000, Birchard & Proudman 2000, Demrow & Salisbury 1998). The U.S. Forest Service (1984, 1991) provides specifications for these installations and other trail construction techniques. Key considerations include their frequency, trail angle, size and stability. Water bars may be constructed of rock or wood, including a wheel-friendly design with a protruding flexible rubber strip bolted between buried treated lumber (Birkby 1996). Drainage dips are shallow angled channels dug into the tread to drain water with an adjacent downslope berm of soil to increase their effectiveness and longevity. U.S. Forest Service guidance specifies tread drainage frequencies based on trail grade and soil type; for example, every 30 m for loam soil at 6% grade, every 15 m for loam soil at 10% grade, and every 45 m for clay soil at 10% grade (Forest Service 1991). The angle at which water bars and drainage dips are installed relative to the trail alignment is also critical. An angle of 45-60o insures that water will run off the trail with sufficient speed to carry its’ sediment load (Hesselbarth & Vachowski 2000). Larger angles will cause water to pool first, dropping sediment loads and filling in drainage channels. Cleaning and reconstruction of tread drainage features must be done one to three times/year to maintain their effectiveness. Effective water bars must be of sufficient length to extend across the trail and be anchored beyond tread boundaries. This will discourage trail users and surface water from seeking to circumvent the drainage feature. For log water bars, a diameter of >6 inches allows 2-3 inches to be embedded with sufficient above-ground material left to divert water from larger storm events. Stability is also critical, rock and wood water bars must be sufficiently anchored to sustain heavy traffic from hikers or horses. Though used less frequently, drainage ditches, check dams, and culverts can be important elements of a water drainage and erosion control system. Their use is described best by Birkby (1996) Hesselbarth and Vachowski (2000), and Birchard and Proudman (2000). We are aware of no trail studies that have evaluated the efficacy of alternative tread maintenance actions. A few road-related studies have been conducted. Rice (1999) monitored 100 segment of forest road in northwestern California and compared these data to data collected prior to implementation of new culvert and road water control guidelines. This survey indicated a 10-fold decrease with the new guidelines and attributed the erosion decrease to better culvert sizing and use of additional road drainage structures. Grace (2002b) evaluated four methods for controlling water borne sediment from forest road ditches: rip-rap, sediment fence, vegetation, and sediment basins. Overall, the sediment basins were most effective during moderate rainfall, but overflowed during heavy storms. The vegetation and sediment fencing were both more effect than rip-rap in trapping sediment before it left the ditch. Vegetation Management Sustained vegetation management efforts are essential to the utility, safety, and natural condition of trail corridors. Annual vegetation clearing maintains an open and passable trail corridor. Hazard trees and tree falls can be hazardous to the safety of trail users and when not cleared, also promote trail widening and braiding. Proper vegetation clearing to design dimensions can center and constrain traffic to a specified tread width. Management of exotic plant populations along trail corridors is also an increasing activity and concern in the U.S.
- 27 -

Bare soil is the most easily erodible soil state. Trails almost always have some bare soil due to construction (cut slope, fill slope, and tread width) and traffic, but natural or artificial vegetation or mulch cover can reduce erosion of bare soil. Grace et al. (1998) compared the effect of erosion mats, native grass, and exotic grass cover on erosion rates as compared to a bare soil control. For cut slopes, they found that the control had 42, 24, and 5 times more erosion than the erosion mat, exotic grass, and native grass, respectively. Luce and Black (1999) found that forest roads having cleared vegetation on cutslopes and ditches produced 7X more sediment than road segments where vegetation was retained.
Visitor Management
While natural processes can degrade trails that receive no use, visitor traffic breaks down protective vegetative and organic cover, exacerbates muddiness, and increases tread susceptibility to soil erosion. Trail management therefore necessarily includes managing the type, amount, behavior and timing of visitor use to insure resource protection. We provide a limited summary of this topic here and direct readers to more comprehensive treatments in the literature: Cole (1987), Anderson et al. (1998), Leung and Marion (2000), and Hendee and Dawson (2002). Trampling research has shown that the majority of resource impact on trails, excepting construction, occurs with relatively low use levels (Cole 1987, Leung & Marion 2000). Above moderate use levels the per capita impact associated with increasing visitation diminishes substantially so dispersing or restricting use to control trail impacts may be an ineffective management strategy. Some exceptions include higher impact types of use (e.g., horses or motorized uses) and trail use during wet seasons. For example, the substantially greater susceptibility of trails to muddiness and erosion during wet seasons has led some managers to issue wet-weather restrictions on all or certain types of trail uses. Special management of visitor uses that have a greater potential to degrade trails is generally necessary to minimize resource impacts. For example, horse users may be restricted to a subset of trails specially selected, constructed and maintained to sustain that type of use (Newsome et al. 2004). Higher impacting visitor behaviors may also be modified to minimize impacts through visitor education or regulation. Examples include Leave No Trace skills and ethics (http://www.LNT.org) educational messages that promote staying on and traveling down the center of designated trails or regulations prohibiting livestock grazing or requiring use of weed-free feed (Hendee & Dawson 2002). Comprehensive Leave No Trace practices for horse riders are contained within the Backcountry Horse Use Skills and Ethics booklet. Educational or regulatory actions may also be implemented to avoid or lessen recreational conflicts or crowding (Anderson et al. 1998). Conflicting uses may be separated by travel zone or trail, incompatible uses may be restricted or prohibited (Cole et al. 1987). Similarly, amount of use on trails or within zones may be influenced or regulated to achieve different use levels, providing solitude in some areas and higher density use in others (Manning 1999).
- 28 -

METHODS Study Sites Study sites are located on the Hoosier National Forest in south-central Indiana, a non-glaciated and hilly section of the state (Figure 8). The area is underlain by limestone and much of the forest has a loess mantle which results in the dominance of silt loam textures. The terrain has relatively short, but steep slopes. The area was converted from forest to agricultural production in the mid 1800's resulting in the formation of erosion gullies which are still visible today. During the 1930s the Hoosier National Forest was formed and today the area is dominated by central hardwoods with occasional stands of planted conifers. Since that time the area has been used for watershed protection, fish and wildlife habitat, recreation, timber production, and wilderness. Trail Selection Based on preliminary meetings with HNF personnel, we decided to systematically sample sections of existing horse trails in order to gather data for a 2x3 factorial experimental design comprised of two levels of gravel (none vs. graveled) and three levels of use (low, moderate, and heavy). Within each of these six categories, we collected data from approximately six miles of trail. This subsample of 36 miles represents approximately 18% of all horse trails within HNF. For each category, the gravel and use-levels were assigned based on interviews with resource managers. Use data for the trail network was unavailable so use levels were assigned relative to the range of trail use for the entire Forest. See Table 18 (page 46) for a listing of the study trails, including their lengths and use levels. Data were collected in 2004.
Figure 8. Typical topography and central hardwoods of the Hoosier National Forest.
Field Procedures A detailed description of all trail condition assessment procedures is presented in Appendix 1 and summarized here. Elements of two trail condition assessment methodologies were integrated in developing the procedures applied to assess selected impact indicators for the sampled trail segments. A point measurement method with a systematic sampling interval at 500 ft intervals, following a randomized start, was the primary method (Leung & Marion 1999a, Marion & Leung, 2001). A trail measuring wheel was used to identify sample point locations. At each sample point, a transect was established perpendicular to the trail tread with endpoints defined by visually pronounced changes in non-woody vegetation height (trampled vs. untrampled), cover, composition, or, when vegetation cover is minimal or absent, by disturbance to organic litter. Representative photos promoted consistent judgment (Appendix 1, Figure 1)
- 29 -

The objective was to select visually obvious boundaries caused by trampling disturbance that contained the majority (>95%) of traffic. Temporary stakes were placed at these boundaries and the distance between was measured as tread width; maximum depth from a taut string tied to the base of these stakes to the trail surface was measured as maximum incision (MIC), an indicator of soil erosion (Farrell and Marion, 2002). Refer to Appendix 1, Figure 2 for diagrams showing how MIC measures were taken on trails in flat and sloping terrain (where side-hill construction complicates such measures). The cross sectional area (CSA) of soil loss, from the taut string to the tread surface, was also measured using a variable interval method. CSA provides a more accurate measure of trail soil erosion that can be extrapolated to provide an estimate of total soil loss from each trail segment. The variable method is an adaptation of the traditional fixed interval method described by Cole (1983), designed to reduce measurement time to allow application at every sample point. Instead of taking vertical measurements along the horizontal transect at fixed intervals, vertical measurements are taken only at points directly above tread surface locations where changes in tread micro-topography occur (Appendix 1, Figure 2). This variable interval method was applied by positioning beads along the transect string over tread locations that, when connected with straight lines, would most accurately represent the cross sectional shape or profile of the tread surface. The number of beads employed varied with tread surface complexity. The distance from each bead to the left boundary stake was recorded, along with the vertical measure of incision under each bead (Figure 9). A computer program was developed and used to calculate CSA from data collected at each sample point. These procedures were applied to derive CSA estimates only at sample points where maximum trail incision along the transect exceeded one inch, a decision rule included to further conserve assessment time at locations where soil loss was minimal.
Transect (in)
Cumulative Interval &
Interval (in)
Area (in2)
T1: 4.25 2.5 I1: 2.5 5.31 T2: 7.5 8.75 I2: 6.25 36.72 T3: 9.75 18.5 I3: 9.75 84.09 T4: 6.0 27.0 I4: 8.5 66.94 T5: 2.75 28.25 I5: 1.25 5.47 T6: 0 31.0 I6: 2.75 3.78
Total CSA: 202.31
Stake
Stake
T2 T3T5
I2 I3 I4I1 I6
T4
I5
T1 T6
Stake
Stake
T2 T3T5
I2 I3 I4I1 I6
T4
I5
T1 T6
Figure 9. Illustration of the variable interval cross sectional area method for assessing soil erosion on trails. Table of values shows how data area recorded and used in the computational formula: Area = (Transect 1 + Transect 2) x Interval x .5 for each row and summed for the total area of soil loss. We note that using a visitor use disturbance-related definition for establishing trail boundaries, from which soil loss (MIC and CSA) is also assessed, underestimates measures of soil erosion. For example, a trail that is entrenched several feet deep generally has steep sides that are not
- 30 -

traveled upon. Sometimes the erosion is associated with recent recreational use but more often it reflects historic erosion from earlier non-recreational uses, or soil excavation during trail construction and maintenance work. Such “historic” erosion was not assessed in this study (see Figure 2 at the end of Appendix 1 for clarification). While this decision clearly underestimates soil erosion measures, we believe this to be necessary for two reasons: 1) it is better to err by underestimating recreation-related erosion than to potentially include soil loss caused by older non-recreational trail uses and trail construction activities, and 2) focusing soil loss measures on more recent erosion is more managerially relevant for monitoring and current management decision making purposes. Trail tread condition characteristics, including vegetation cover, organic litter, exposed soil, muddy soil, water, rock, gravel, and roots, were defined as mutually exclusive categories and assessed across each transect. These indicators were evaluated as a proportion of tread width in 10% categories (5% where necessary). A count of additional secondary trails that paralleled the survey trail at each sample point provided a measure of the extent of trail braiding. Several inventory indicators were also assessed at sample points. These included: Tread grade – percent slope of the trail at the sample point Trail slope alignment angle – orientation of the trail (0-90o) to the prevailing grade of the
landform. A low slope alignment angle trail is oriented up- and down-slope, a high slope alignment angle trail is oriented along the contour.
Tread drainage feature – distance in 25-foot increments up to 75 feet, to any reasonably effective human-constructed tread drainage feature (water bar or drainage dip) located in an up-slope trail direction from the sample point.
Water drainage – an estimate of the amount of water (25% categories) that would flow off the tread within 10 feet upslope of the sample point during a rainstorm.
Trail position – categorized as valley bottom, ridge top, or mid-slope. Soil texture – assessed using a field assay method described by Foth (1990) to determine soil
texture in the vicinity of the sample point. The Universal Soil Loss Equation (USLE), as modified by Dissmeyer and Foster (1984), was used to estimate soil erosion for trail segments (Appendix 2). The USLE is an empirical formula that has been widely used throughout the United States for estimating potential erosion during average conditions and its reliability has been verified with a variety of erosion plot studies. Although the USLE was not originally intended for use on trails, it has been used to compare relative erosion rates for forest roads (Hood et al. 2002). In order to use the USLE, it is necessary to evaluate a rainfall and runoff factor (R); a soil erodibility factor (K) based on soil texture, organic matter, and soil physical properties; slope length (L) and steepness (S) factors; and soil cover (C) and management practices (P) factors. The CP factor potentially evaluates over 15 subfactors that influence soil erosion. A problem assessment method integrated into the monitoring procedures provided census information on two specific trail impact problems: excessive erosion and excessive muddiness (Leung & Marion 1999a). Excessive erosion was defined as sections of tread (≥ 10 ft in length) with tread incision exceeding 5 in. Excessive muddiness was defined as sections of tread (≥ 10 ft in length) with seasonal or permanently wet, muddy soils that show imbedded foot or hoof prints ≥ 0.5 in deep. As they hiked, field staff looked for and recorded the beginning and ending distances from the starting point for all occurrences of these problems. A trail measuring wheel
- 31 -

was used to measure distances. In contrast to the point sampling, this method provides census data on the extent and location of specific pre-defined problems, facilitating management efforts to rectify such impacts. Data Analysis Data were input into an Excel spreadsheet and imported to the SPSS Statistical package for analyses. Basic frequencies and descriptive statistics were run for all indicators. Relational analyses, including Analysis of Variance and Multiple Regression Analysis, were conducted to evaluate the influence of various use-related, environmental, and managerial factors. More detail on Regression procedures are provided in that section of the Results.
- 32 -

RESULTS AND DISCUSSION Data were collected from 20 trails open to horses and other use types, including 35.51 miles and 619 sample points stratified evenly across the six gravel and use-level categories. Data were computer input and verified for accuracy. Results are reported separately for inventory and impact indicators, followed by analyses focused on evaluating relationships between trail conditions and influential causal and non-causal factors. Trail Inventory Indicators Table 4. Soil texture percentages found on HNF horse trails.
Soil texture was determined for each of the 619 survey points to determine if soil texture influences trail conditions (Table 4). On many forests this would be a more important factor, but the HNF is very uniform in soil texture due to the uniformity of the loess mantle and parent material. Over 90% of the sites were silt loams and silty clay loams (81% and 10% respectively). This uniformity of textures minimized the effects of soil texture on trail properties. An interesting aspect of the soils on these sites is the depth of the soil and the lack of coarse fragments in the profiles. In other locals having shallower soils, trails may erode until bedrock is encountered, but these deep soils have the potential to erode to greater depths.
Soil texture Sample points Percent
Clay loam 2 0 Clay 2 0 Loam 37 6 Sand loam 1 0 Silt 3 0 Silt clay 9 1 Silt clay loam 62 10 Silt loam 503 81
Totals: 619 100
Table 5. Topographic positions for HNF trails.
Assessments of topographic position at sample points indicate that the trails are primarily located in higher, drier locations (Table 5). Approximately 84% of all trail locations were on ridges, shoulders, or mid slope positions. Only 11% of the trails were in valley positions where soil moisture might be more of a problem.
Topographic position
Sample points Percent
Valley 71 11
Foot slope 31 5 Mid-slope 90 15 Shoulder 236 38
Ridge 191 31
Totals: 619 100
- 33 -

Table 6. Slope alignment values HNF horse trails. Higher alignment values are more parallel with the natural contour while values near zero are perpendicular to the contour.
Slope alignment values indicate that a majority of the trails have higher alignment values and are following the natural contour of the slope (Table 6). Trails that roughly follow the contour typically have lower erosion rates than those that are perpendicular to the contour. Approximately 18% of the trails have slope alignment values less than 23o indicating a strong potential for erosion problems. Water flowing along treads of these “fall-line” aligned trails is exceptionally difficult to remove so it builds in volume and erosive force.
Slope alignment angle
Sample points Percent
0 – 22o 111 18 23 – 45o 46 7 46 – 68o 99 16 69 – 90o 363 59
Totals: 619 100
Mean: 60.9o
Table 7. Trail grade categories for HNF horse trails.
Trail slope, or grade, is one of the more important indicators of potential problems with water control, erosion, and ease of trafficability. Approximately 45% of the surveyed horse trails on the HNF had slopes greater than 10%, which is the maximum recommended grade (Table 7). If we use 15% as a critical threshold, then 28% of all trails are steeper than desirable. Combined with a mean grade of 13.2% these data indicate that the trail system is highly susceptible to soil erosion –
particularly from higher impacting activities such as horse traffic. Some portions of these steeper trails, particularly those that are heavily used and actively eroding, should be strongly considered for relocations. Also, a high proportion of all trails (21%) are in the 0-2% slope category. Poor drainage and wet muddy treads are often problematic in low slope areas. Trail grades greater than 2% are generally recommended to provide adequate drainage.
Grade Sample points Percent Grade GIS data
(all trails)
0 - 2% 132 21 0-2% 6% 3 - 6% 96 16 2.1-4.5% 10% 7 - 10% 105 17 4.5-10% 25% 11 - 15% 106 17 10.1-21% 42% 16 – 20% 70 11 21.1-46% 17% 21 – 30% 65 11 >46 1%
>31% 45 7
Totals: 619 100 100% Mean: 13.2%
Also reported in Table 7 are data on trail grade from the HNF Geographic Information System (GIS) for all trails in the forest. These data show a much smaller percentage of trails in flat terrain and a substantially greater percentage of trails in steeper terrain. For example, the GIS data indicate that 60% of the trails are over 10% grade, compared to 45% from our survey. The discrepancy between the GIS inventory and the trail survey is not unusual, GIS inventories that account for elevational changes are commonly less accurate than those that account for horizontal distances. Also, although the GIS data and trail inventory data overlap, they are not considering exactly the same points.
- 34 -
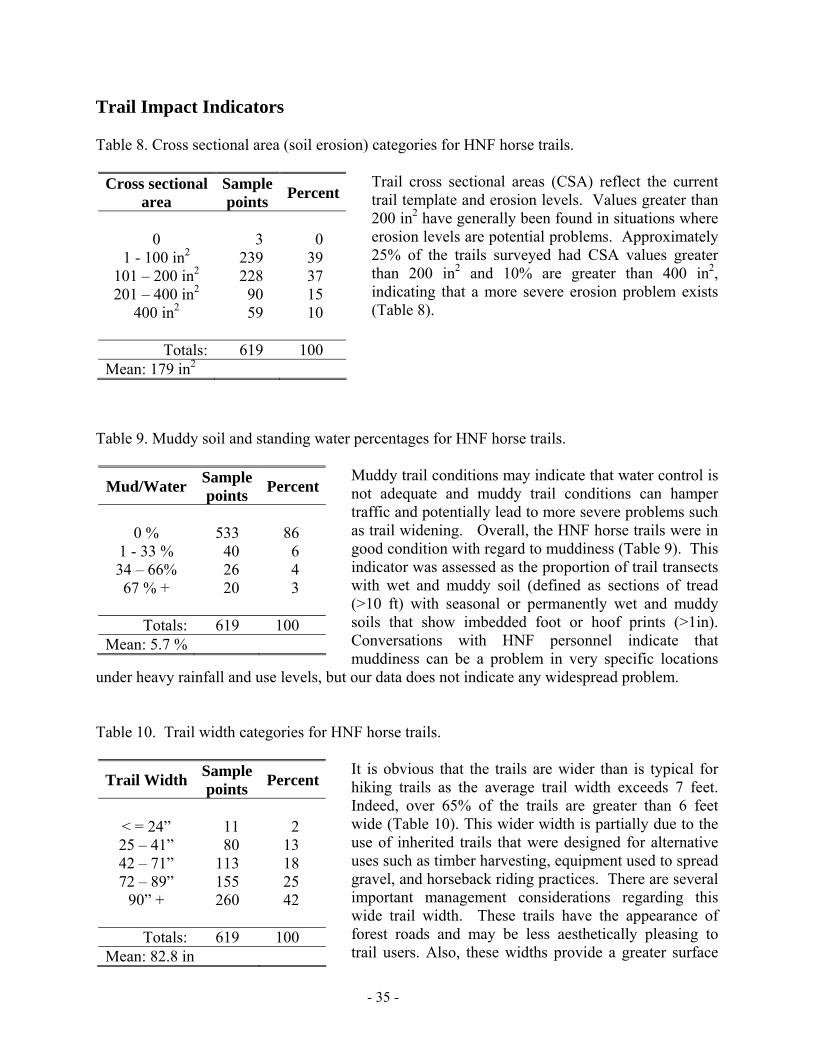
Trail Impact Indicators Table 8. Cross sectional area (soil erosion) categories for HNF horse trails.
Trail cross sectional areas (CSA) reflect the current trail template and erosion levels. Values greater than 200 in2 have generally been found in situations where erosion levels are potential problems. Approximately 25% of the trails surveyed had CSA values greater than 200 in2 and 10% are greater than 400 in2, indicating that a more severe erosion problem exists (Table 8).
Cross sectional area
Sample points Percent
0 3 0
1 - 100 in2 239 39 101 – 200 in2 228 37 201 – 400 in2 90 15
400 in2 59 10
Totals: 619 100 Mean: 179 in2
Table 9. Muddy soil and standing water percentages for HNF horse trails.
Muddy trail conditions may indicate that water control is not adequate and muddy trail conditions can hamper traffic and potentially lead to more severe problems such as trail widening. Overall, the HNF horse trails were in good condition with regard to muddiness (Table 9). This indicator was assessed as the proportion of trail transects with wet and muddy soil (defined as sections of tread (>10 ft) with seasonal or permanently wet and muddy soils that show imbedded foot or hoof prints (>1in). Conversations with HNF personnel indicate that muddiness can be a problem in very specific locations
under heavy rainfall and use levels, but our data does not indicate any widespread problem.
Mud/Water Sample points Percent
0 % 533 86
1 - 33 % 40 6 34 – 66% 26 4 67 % + 20 3
Totals: 619 100
Mean: 5.7 %
Table 10. Trail width categories for HNF horse trails.
It is obvious that the trails are wider than is typical for hiking trails as the average trail width exceeds 7 feet. Indeed, over 65% of the trails are greater than 6 feet wide (Table 10). This wider width is partially due to the use of inherited trails that were designed for alternative uses such as timber harvesting, equipment used to spread gravel, and horseback riding practices. There are several important management considerations regarding this wide trail width. These trails have the appearance of forest roads and may be less aesthetically pleasing to trail users. Also, these widths provide a greater surface
Trail Width Sample points Percent
< = 24” 11 2 25 – 41” 80 13 42 – 71” 113 18 72 – 89” 155 25
90” + 260 42
Totals: 619 100 Mean: 82.8 in
- 35 -

area for potential soil erosion and water quality issues. Finally, these wider widths increase the quantities and costs of gravel substantially. For example, a 24 inch wide trail would require approximately 132 tons of gravel per mile to provide a gravel depth of 3 inches. The average width of 7 feet would require 462 tons/mile to provide the same depth of gravel. Table 11. Distance to nearest uphill tread drainage feature for HNF horse trails.
The distance in an uphill direction to the nearest tread drainage feature was assessed. These data (Table 11) indicate that most trails have relatively few drainage features installed. For example, only 25% of the sample points had drainage features within 100 feet of them in an uphill direction. Note that the mean distance is an estimate that treats all instances of distances greater than 100 feet as 100 feet in the computation – the actual mean is much greater than 84 feet.
Drainage feature distance
Sample points Percent
1 ft 12 1.9 10 ft 1 0.2 25 ft 79 12.8 50 ft 41 6.6 75 ft 24 3.9
>100 ft 462 74.6
Totals: 619 100 Mean: 84 ft
Relational Analyses These analyses focus on understanding the role of various causal and non-causal yet influential factors on horse trail conditions. An improved understanding of the influence of these factors will help suggest effective management interventions for sustaining increasing amounts of horse traffic while protecting the conditions of trails and natural resources. Our focus is on the influence of four primary factors under management control: trail slope, trail use level, trail drainage structures, and trail surfacing, on five trail condition response variables: cross-sectional area (CSA), estimated soil erosion (USLE), trail width, trail muddiness, and trail incision. Table 12 provides the average values for CSA, USLE, muddiness, width, and incision for the 3 x 2 matrix created by 3 use levels and 2 surface conditions. Overall, all matrix cells had adequate representation, though locating low use trails with gravel proved difficult. The effects of gravel use are obvious for most of the indices. The CSA values are lower for the graveled treads in both the high and moderate use categories. For the low use segments the bare soil condition actually had a lower CSA. The erosion estimate provide by the USLE indicated that the use of gravel was reducing the estimated erosion by an order of magnitude for all use levels. A similar trend was also found for the muddiness, with the graveled trails being much less muddy on average. The use of gravel does appear to be correlated with greater trail widths, possibly caused by the application techniques. Finally, incision is greater on trails with bare soil.
- 36 -

Table 12. Use level and surface condition effects on mean values for cross sectional area, estimated soil loss, muddiness, trail width, and trail incision for HNF horse trails.
Use level
Surface condition
Sample points
CSA (in2)
USLE (t/ac/yr)
Muddiness(%)
Trail width (in)
Maximumincision
(in)
High Bare soil Gravel
138 101
238 163
29 3
10 2
90 101
4.4 2.9
Medium Bare soil Gravel
101 123
239 155
34 8
12 2
76 88
4.5 2.7
Low Bare soil Gravel
115 41
104 153
17 1
4 0
60 96
2.8 2.6
Statistical Testing: ANOVA*
Use Level effect .002 .030 .024 .000 .000 Surface Condition effect .033 .000 .000 .000 .000 Use/Surface Interaction .006 .520 .341 .000 .003
* p-values < .05 are statistically significant All differences for levels of use and surface condition are statistically significant (Table 12). However, interpretation for three indicators (CSA, trail width, max. incision) have significant interaction effects, which means that reference to graphed results is necessary to understand effects that vary by use and surface condition level. These are highlighted in the following Figures and sections.
0
5
10
15
20
25
30
35
40
Yes NoGraveled
estim
ated
soi
l los
s (tn
/ac/
yr)
HighMediumLow
Figures 10 and 11 illustrate the effects of gravel and use level on USLE and CSA levels, respectively. The beneficial effects of gravel are obvious, but interestingly, estimated soil losses are greater from the moderate use trails as opposed to the high use trails. This might indicate that moderate use trails receive less reconstructive or maintenance attention than do the high use trails.
Figure 10. Effect of amount of horse use and presence/absence of gravel on USLE.
- 37 -

75
125
175
225
275
Yes NoGraveled
Erod
ed tr
ail c
ross
sec
tion
(in2 )
HighMediumLow
Graveled trails are less eroded than non-graveled trails at the moderate and high use levels (Figure 11). At the low use level graveled trails had more erosion, hence the significant interaction effect in Table 12. This difference at the low use level cannot be explained and may be attributable in part to the smaller sample size of graveled low use trails (N=41 points).
Figure 11. Effect of amount of horse use and presence/absence of gravel on CSA.
0123456789
10
Yes NoGraveled
Max
imum
trai
l inc
isio
n (in
ches
)
HighMediumLow
Mean maximum incision values are lower for graveled horse trails only at the high and medium use levels (Figure 12). At the low use level differences are minor and not statistically significant.
Figure 12. Effect of amount of horse use and presence/absence of gravel on maximum incision.
20
30
40
50
60
70
80
90
100
110
Yes NoGraveled
Trai
l wid
th (i
n)
HighMediumLow
Graveled horse trails are wider than trails with bare soil surfaces (Figure 13). This likely reflects the method of application or that graveled trails were wider to begin with due to former uses. Note that the surface condition effect varies with level of use. Differences are greater with decreasing level of use.
Figure 13. Effect of amount of horse use and presence/absence of gravel on trail width.
- 38 -
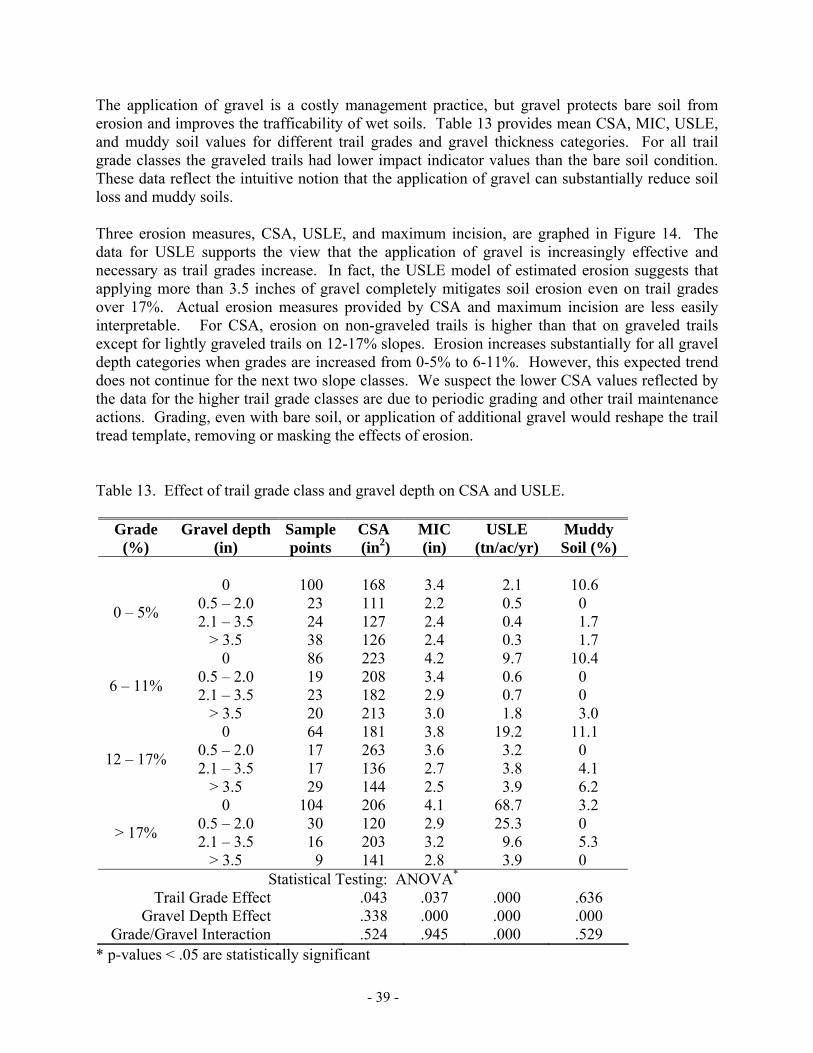
The application of gravel is a costly management practice, but gravel protects bare soil from erosion and improves the trafficability of wet soils. Table 13 provides mean CSA, MIC, USLE, and muddy soil values for different trail grades and gravel thickness categories. For all trail grade classes the graveled trails had lower impact indicator values than the bare soil condition. These data reflect the intuitive notion that the application of gravel can substantially reduce soil loss and muddy soils. Three erosion measures, CSA, USLE, and maximum incision, are graphed in Figure 14. The data for USLE supports the view that the application of gravel is increasingly effective and necessary as trail grades increase. In fact, the USLE model of estimated erosion suggests that applying more than 3.5 inches of gravel completely mitigates soil erosion even on trail grades over 17%. Actual erosion measures provided by CSA and maximum incision are less easily interpretable. For CSA, erosion on non-graveled trails is higher than that on graveled trails except for lightly graveled trails on 12-17% slopes. Erosion increases substantially for all gravel depth categories when grades are increased from 0-5% to 6-11%. However, this expected trend does not continue for the next two slope classes. We suspect the lower CSA values reflected by the data for the higher trail grade classes are due to periodic grading and other trail maintenance actions. Grading, even with bare soil, or application of additional gravel would reshape the trail tread template, removing or masking the effects of erosion. Table 13. Effect of trail grade class and gravel depth on CSA and USLE.
Grade (%)
Gravel depth (in)
Samplepoints
CSA (in2)
MIC (in)
USLE (tn/ac/yr)
Muddy Soil (%)
0 – 5%
0 0.5 – 2.0 2.1 – 3.5
> 3.5
100 23 24 38
168 111 127 126
3.4 2.2 2.4 2.4
2.1 0.5 0.4 0.3
10.6 0 1.7 1.7
6 – 11%
0 0.5 – 2.0 2.1 – 3.5
> 3.5
86 19 23 20
223 208 182 213
4.2 3.4 2.9 3.0
9.7 0.6 0.7 1.8
10.4 0 0 3.0
12 – 17%
0 0.5 – 2.0 2.1 – 3.5
> 3.5
64 17 17 29
181 263 136 144
3.8 3.6 2.7 2.5
19.2 3.2 3.8 3.9
11.1 0 4.1 6.2
> 17%
0 0.5 – 2.0 2.1 – 3.5
> 3.5
104 30 16 9
206 120 203 141
4.1 2.9 3.2 2.8
68.7 25.3 9.6 3.9
3.2 0 5.3 0
Statistical Testing: ANOVA*
Trail Grade Effect .043 .037 .000 .636 Gravel Depth Effect .338 .000 .000 .000
Grade/Gravel Interaction .524 .945 .000 .529 * p-values < .05 are statistically significant
- 39 -

Results for maximum incision are similar and somewhat more clear (Figure 14). Incision is highest on non-graveled trails for all trail grade categories. However, the absence of greater erosion levels for the higher trail grade categories (12-17% and >17%) again suggests the effect of management actions such as grading. Increasing thickness of gravel application more strongly equates with diminishing levels of trail incision. Based on USLE, CSA and maximum incision data it is clear that gravel does have a very beneficial stabilizing effect on the steepest grades. This indicates that gravel can be effectively used to minimize erosion problems on steep trail segments if relocation is not feasible. It is also interesting to note that gravel depth did not have major beneficial effects on grades below 12% (though it does resolve problems with muddiness). This implies that less gravel might be applied on trails having low to moderate grades in order to reduce management costs and improve visitor aesthetics. These findings also support the application of additional gravel depth on steeper sections of trail. One issue of concern, however, is the rate at which gravel will migrate to the bottom of such slopes. On steeper slopes we presume that frequent maintenance will be necessary to reapply new gravel or grade existing gravel back to the top of slopes. These data appear to reflect that maintenance crews have already been performing such work and that these efforts have been effective in preventing excessive erosion on steep slopes.
0-5 6-11 12-17 >17Trail Grade (%)
0
10
20
30
40
50
60
70Es
timat
ed S
oil E
rosi
on (t
n/ac
/yr)
Gravel Depth0 in0.5-2.0 in2.1-3.5 in>3.5 in
0-5 6-11 12-17 >17Trail Grade (%)
2.0
2.5
3.0
3.5
4.0
Max
imum
Inci
sion
(in)
Gravel Depth0 in0.5-2.0 in2.1-3.5 in>3.5 in
Figure 14. Effect of trail grade and gravel depth on USLE, CSA, and maximum incision.
0-5 6-11 12-17 >17Trail Grade (%)
100
150
200
250
Cro
ss S
ectio
nal A
rea
(ft2)
Gravel Depth0 in0.1-2.0 in2.1-3.5 in>3.5 in
- 40 -
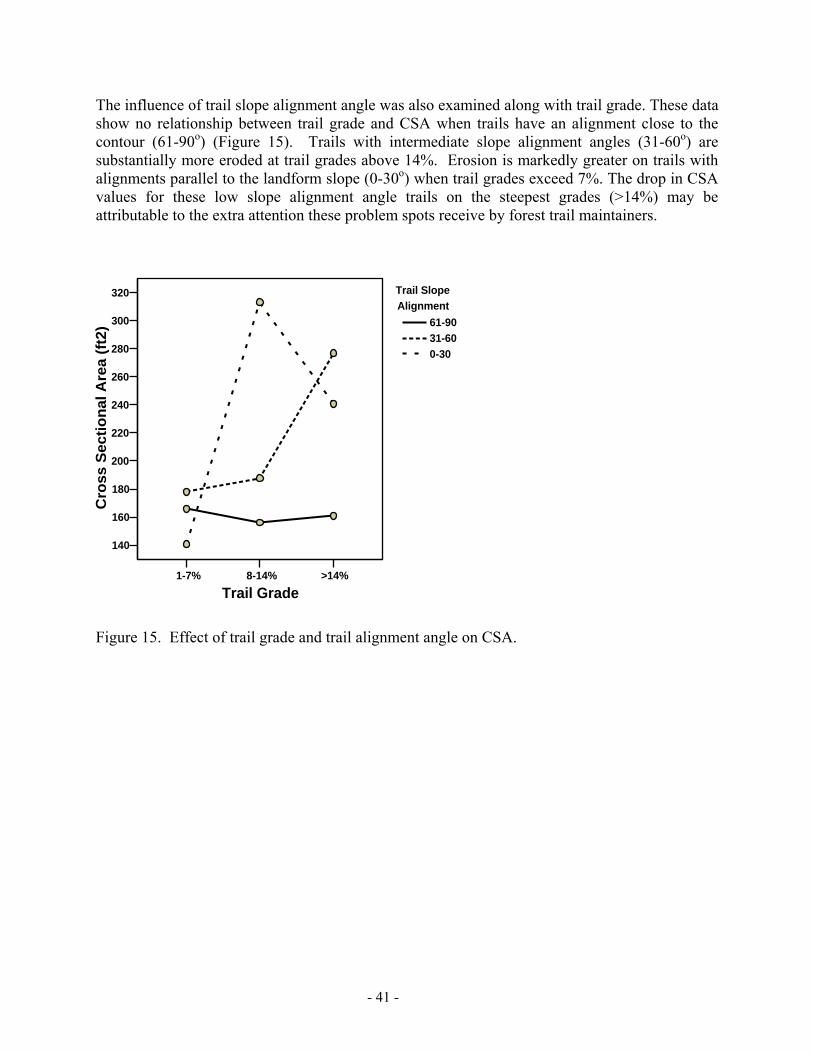
The influence of trail slope alignment angle was also examined along with trail grade. These data show no relationship between trail grade and CSA when trails have an alignment close to the contour (61-90o) (Figure 15). Trails with intermediate slope alignment angles (31-60o) are substantially more eroded at trail grades above 14%. Erosion is markedly greater on trails with alignments parallel to the landform slope (0-30o) when trail grades exceed 7%. The drop in CSA values for these low slope alignment angle trails on the steepest grades (>14%) may be attributable to the extra attention these problem spots receive by forest trail maintainers.
Figure 15. Effect of trail grade and trail alignment angle on CSA.
1-7% 8-14% >14%Trail Grade
140
160
180
200
220
240
260
280
300
320
Cro
ss S
ectio
nal A
rea
(ft2)
Trail Slope Alignment
61-9031-600-30
- 41 -
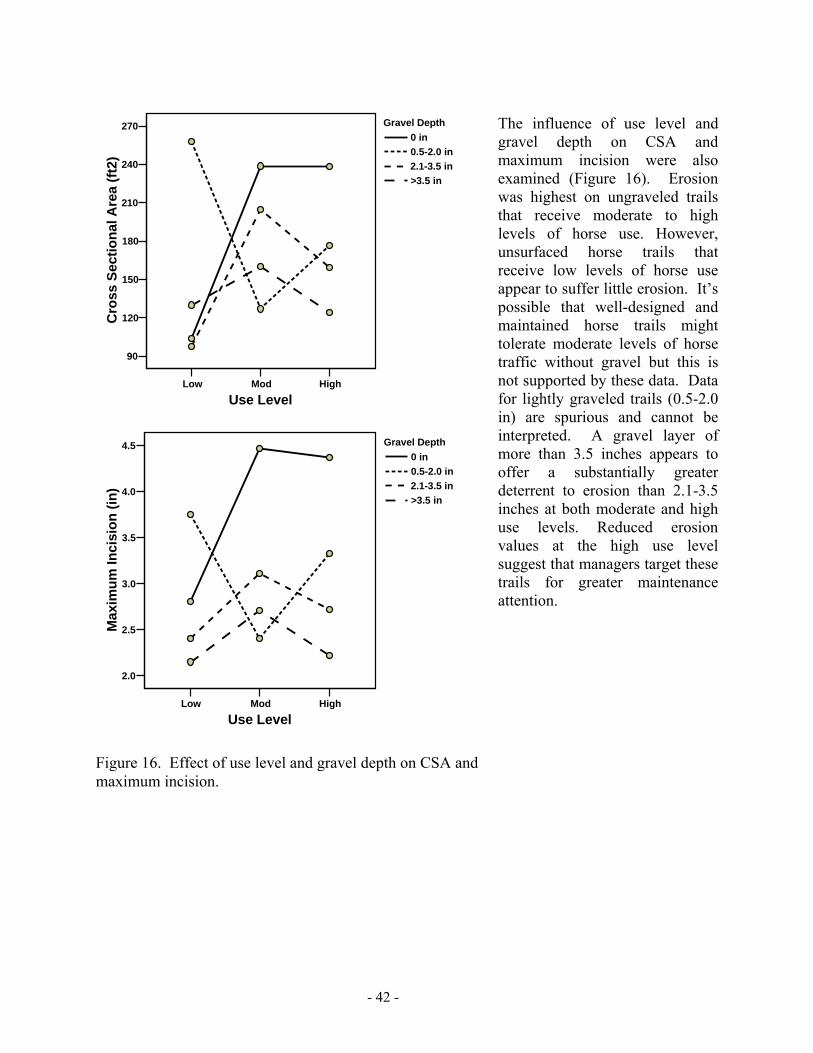
The influence of use level and gravel depth on CSA and maximum incision were also examined (Figure 16). Erosion was highest on ungraveled trails that receive moderate to high levels of horse use. However, unsurfaced horse trails that receive low levels of horse use appear to suffer little erosion. It’s possible that well-designed and maintained horse trails might tolerate moderate levels of horse traffic without gravel but this is not supported by these data. Data for lightly graveled trails (0.5-2.0 in) are spurious and cannot be interpreted. A gravel layer of more than 3.5 inches appears to offer a substantially greater deterrent to erosion than 2.1-3.5 inches at both moderate and high use levels. Reduced erosion values at the high use level suggest that managers target these trails for greater maintenance attention.
Low Mod HighUse Level
90
120
150
180
210
240
270C
ross
Sec
tiona
l Are
a (ft
2)Gravel Depth
0 in0.5-2.0 in2.1-3.5 in>3.5 in
Low Mod HighUse Level
2.0
2.5
3.0
3.5
4.0
4.5
Max
imum
Inci
sion
(in)
Gravel Depth0 in0.5-2.0 in2.1-3.5 in>3.5 in
Figure 16. Effect of use level and gravel depth on CSA and maximum incision.
- 42 -

Drainage Features
Drainage is critical for the longevity of a trail. We evaluated the distance to the nearest drainage structure in an uphill direction and compared that to the recommended distance for different slope classes and for soil versus graveled surfaces (Table 14). We note that our distance assessments were cut off at 100 feet and all greater distances were recorded as 100. This truncated mean distance estimates, improperly indicating that drainage features are closely spaced on trails with low grades. In spite of this deficiency, the data still reveal that steeper grades are not adequately drained for non-graveled trails (Table 14). Indeed, for slopes greater than 11%, more than three times as many drainage structures are recommended as were currently found on non-graveled trails. Graveled trails appear from this data to be adequately drained, though 63 sample points on these trails have grades exceeding 16.5 percent for which standards have not been established. Of even greater concern with respect to erosion potential are 117 sample points on non-graveled trails that exceed a grade of 16.5%. Table 14. Comparison of trail slope category and mean distance to drainage feature with recommended drainage feature intervals.
Non-graveled Graveled
Grade Sample points
Mean distance todrainage
feature (ft)
Recom- mended drainage
interval (ft)
Sample points
Mean distance to drainage
feature (ft)
Recom- mended drainage
interval (ft)
0 - 3% 75 86 350 57 93 - 3.1 - 5% 25 89 150 28 93 - 5.1 - 7% 26 92 100 17 72 800 7.1 - 9% 28 91* 75 21 76 600 9.1 - 11% 32 90* 50 24 84 400
11.1 - 13.5% 21 88** 252 26 76 300 13.6 - 16.5% 30 80** 102 29 85 250
>16.5 117 78** - 63 77** -
1 - from Forest Service Handbook (1991); 2 – extrapolated value not provided in original guidance. * denotes minor non-compliance with recommendations. ** denotes areas that need approximately 3x or greater drainage features.
Modeling Trail Degradation
The influence of various environmental, management and use-related factors on soil loss (CSA) was also evaluated through multiple regression analyses. These analyses are used to develop a model of horse trail degradation, providing greater insights into the relative influence of various factors. The previous analyses have selectively examined the influence of only one or two factors at a time. The influence of other factors is not accounted for and may confound the interpretation of results. Multivariate methods, such as multiple regression, employ partial correlation coefficients that enable simultaneous analyses of the relative influence of numerous factors. These methods provide essentially “model” horse trail degradation, revealing the
- 43 -

interrelationships between influential factors that most closely approximate the complexity of actual reality. The cross sectional area measure of soil erosion was selected as the dependent variable for these multiple regression analyses. Correlation values between CSA and various independent explanatory variables are presented in Table 15. All factors except trail grade were found to be significantly correlated with the CSA measure of soil loss. As previously discussed, we suspect the poor correlation with trail grade is due to successful management efforts, such as regrading, that target steeper trail grades. The sign of the correlation values reveals whether the relationship is positive or negative. For example, soil loss increases with increasing use level and distance to the nearest tread drainage feature and decreases with increasing percent cover and depth of gravel and trail slope alignment angle (low angles more directly ascend slopes). A visual examination of the plot for CSA and tread drainage features revealed no relationship beyond 50 feet so cases beyond this value were omitted (pairwise). Table 15. Correlations between cross sectional area loss of soil (CSA) and various predictive indicators. Gravel Gravel Trail Trail Use Drainage Cover Depth Grade Alignment Level Feature (%) (in) (%) (degrees) (L, M, H) (Feet: 5, 25, 50) Correlation w/CSA: -.131 -.079 .044 -.108 .166 .249 One-tailed Sig. .001 .025 .135 .004 .000 .002 N 618 619 619 619 619 132 Regression analyses with the predictive indicators from Table 15 revealed the presence and distance to tread drainage features to be the most influential factor, followed by trail alignment angle and percent gravel cover (Table 16). This reveals that the variation in CSA is most fully explained by these three factors together, and that the factors excluded from the model, gravel depth, trail grade and use level, are less important predicators of erosion. Table 16. Results from regression analyses (backwards elimination) starting with the factors from Table 15. Gravel Trail Drainage Constant Cover Alignment Feature (%) (degrees) (feet: 5, 25, 50) Unstandardized Coefficient -1.1 -1.1 4.1 147 t-test p-value .049 .039 .001 .002
- 44 -

The interrelationships between CSA, gravel, drainage features, and trail slope alignment are explored further in Table 17. The application of gravel does further limit erosion on trails that have tread drainage features installed, regardless of the presence or proximity of tread drainage features. As expected, the range of mean CSA values is greatest for non-graveled surfaces. Trails that approximately follow the contour (68-90o alignments) have the lowest CSA values and non-graveled trails generally have more erosion. However, beyond these general conclusions the data are less clear. Alignment angle appears to have little influence on trails that have been graveled. The lower mean CSA value of 167 for graveled trails with slope alignment angles of under 22o cannot be easily explained. Additional examinations of gravel depth and cover, trail slope, distance to tread drainage feature and use level revealed differences that were relatively small or not interpretable. These findings support the contention that managers are simply maintaining these locations frequently. Table 17. Mean cross sectional area soil loss on trails with and without gravel by tread drainage feature distance and trail slope alignment angle. Tread Attributes N Mean Graveled Treads Drainage Feature <5 ft Drainage Feature 25 ft Drainage Feature 50 ft Drainage Feature >50 ft
1 40 19
205
66 164 228 151
Non-Graveled Treads Drainage Feature <5 ft Drainage Feature 25 ft Drainage Feature 50 ft Drainage Feature >50 ft
11 39 33
281
84
205 381 183
Graveled Treads Trail Alignment 0-22o
Trail Alignment 23-45o
Trail Alignment 46-67o
Trail Alignment 68-90o
48 19 41
157
167 253 184 137
Non-Graveled Treads Trail Alignment 0-22o
Trail Alignment 23-45o
Trail Alignment 46-67o
Trail Alignment 68-90o
63 27 58
206
229 216 243 168
- 45 -
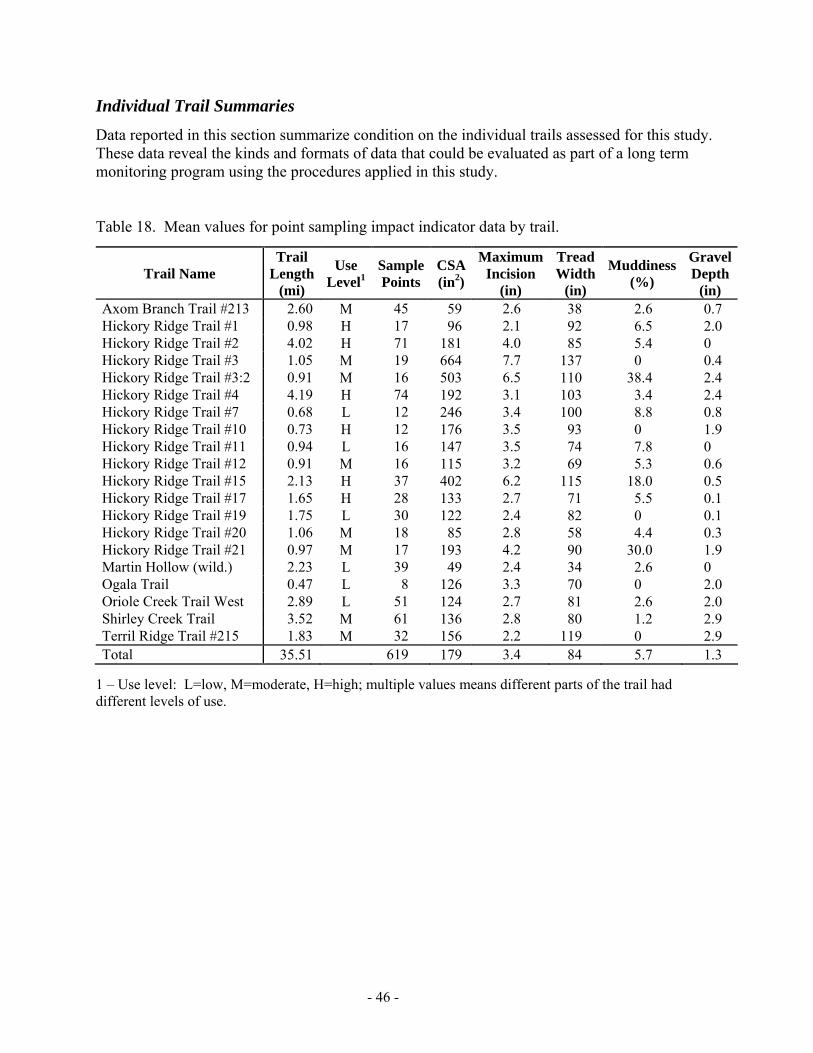
Individual Trail Summaries
Data reported in this section summarize condition on the individual trails assessed for this study. These data reveal the kinds and formats of data that could be evaluated as part of a long term monitoring program using the procedures applied in this study. Table 18. Mean values for point sampling impact indicator data by trail.
Trail Name Trail
Length (mi)
Use Level1
SamplePoints
CSA(in2)
MaximumIncision
(in)
Tread Width
(in)
Muddiness(%)
GravelDepth
(in) Axom Branch Trail #213 2.60 M 45 59 2.6 38 2.6 0.7 Hickory Ridge Trail #1 0.98 H 17 96 2.1 92 6.5 2.0 Hickory Ridge Trail #2 4.02 H 71 181 4.0 85 5.4 0 Hickory Ridge Trail #3 1.05 M 19 664 7.7 137 0 0.4 Hickory Ridge Trail #3:2 0.91 M 16 503 6.5 110 38.4 2.4 Hickory Ridge Trail #4 4.19 H 74 192 3.1 103 3.4 2.4 Hickory Ridge Trail #7 0.68 L 12 246 3.4 100 8.8 0.8 Hickory Ridge Trail #10 0.73 H 12 176 3.5 93 0 1.9 Hickory Ridge Trail #11 0.94 L 16 147 3.5 74 7.8 0 Hickory Ridge Trail #12 0.91 M 16 115 3.2 69 5.3 0.6 Hickory Ridge Trail #15 2.13 H 37 402 6.2 115 18.0 0.5 Hickory Ridge Trail #17 1.65 H 28 133 2.7 71 5.5 0.1 Hickory Ridge Trail #19 1.75 L 30 122 2.4 82 0 0.1 Hickory Ridge Trail #20 1.06 M 18 85 2.8 58 4.4 0.3 Hickory Ridge Trail #21 0.97 M 17 193 4.2 90 30.0 1.9 Martin Hollow (wild.) 2.23 L 39 49 2.4 34 2.6 0 Ogala Trail 0.47 L 8 126 3.3 70 0 2.0 Oriole Creek Trail West 2.89 L 51 124 2.7 81 2.6 2.0 Shirley Creek Trail 3.52 M 61 136 2.8 80 1.2 2.9 Terril Ridge Trail #215 1.83 M 32 156 2.2 119 0 2.9 Total 35.51 619 179 3.4 84 5.7 1.3
1 – Use level: L=low, M=moderate, H=high; multiple values means different parts of the trail had different levels of use.
- 46 -

Table 19. Trail problem assessment impact indicator data by trail.
Occurrences Lineal Distance Trail & Indicator Length (mi) (#) (#/mi) (ft) (ft/mi) (%)
Secondary Trails
Axom Branch 2.60 0 Severe Erosion 5 1.9 421 162 3.1 Muddy Soil 1 0.4 51 20 0.4Hickory Ridge #1 0.98 0 Severe Erosion 1 1.0 105 107 2.0 Muddy Soil 0 Hickory Ridge #2 4.02 0 Severe Erosion 7 1.7 2671 664 12.6 Muddy Soil 15 3.7 1156 287 5.4Hickory Ridge #3 1.05 0 Severe Erosion 7 6.7 534 508 9.6 Muddy Soil 2 1.9 88 84 1.6Hickory Ridge #3: 2 0.91 0 Severe Erosion 1 1.1 1518 1677 31.8 Muddy Soil 3 3.3 1027 1134 21.5Hickory Ridge #4 4.19 0 Severe Erosion 8 5.7 1572 375 7.1 Muddy Soil 24 1.9 1115 266 5.0Hickory Ridge #7 0.68 0 Severe Erosion 0 Muddy Soil 3 4.4 221 327 6.2Hickory Ridge #10 0.73 1 Severe Erosion 4 5.5 614 843 16.0 Muddy Soil 0 Hickory Ridge #11 0.94 0 Severe Erosion 1 1.1 62 66 1.2 Muddy Soil 3 3.2 356 378 7.2Hickory Ridge #12 0.91 0 Severe Erosion 3 3.3 627 693 13.1 Muddy Soil 2 2.2 93 103 1.9Hickory Ridge #15 2.13 0 Severe Erosion 12 5.6 2355 1105 20.9 Muddy Soil 22 10.3 1936 909 17.2Hickory Ridge #17 1.65 0 Severe Erosion 0 Muddy Soil 6 3.6 185 112 2.1Hickory Ridge #19 1.75 0 Severe Erosion 3 1.7 504 288 5.5 Muddy Soil 0 Hickory Ridge #20 1.06 0 Severe Erosion 7 6.6 677 638 12.1 Muddy Soil 0 Hickory Ridge #21 0.97 1 Severe Erosion 1 1.0 300 310 5.9 Muddy Soil 2 2.1 1877 1941 36.8Martin Hollow 2.23 0 Severe Erosion 3 1.3 271 121 2.3 Muddy Soil 1 0.4 20 9 0.2Oriole West 2.89 0 Severe Erosion 9 3.1 2276 788 14.9 Muddy Soil 2 0.7 131 45 0.9Shirley Creek 3.52 0 Severe Erosion 9 2.6 1190 338 6.4 Muddy Soil 3 0.9 534 152 2.9Terril Ridge 1.83 0 Severe Erosion 1 0.5 241 132 2.5 Muddy Soil 0
- 47 -
Summary and Management Recommendations This section of the report will review and summarize the principal research findings and discuss implications for managers. Comprehensive recommendations for improving management of a trail system that can accommodate and sustain a variety of trail uses while protecting the forest’s natural resources are also offered. Review and Summary of Findings The Hoosier National Forest includes 200,000 acres of public land, 13,000 of which are designated as Indiana’s only wilderness (Wadzinski 2000). By 1990 the Forest had accumulated some 600 miles of trails, including trails designed and constructed by HNF personnel, pre-existing woods roads and trails, logging roads and skid trails, and a substantial number of visitor-created trails. Many were in degraded condition due to unregulated use, poor design and maintenance, and heavy use (Wadzinski 2000). Initial management actions to remedy this situation have included:
• Forest-wide planning efforts that incorporated a Limits of Acceptable Change (LAC) process and extensive public involvement,
• Prohibition of off-road vehicle use, • Designation of official trails, mostly for multiple uses, and closure of non-official trails to
horseback and mountain bike riding, • Specification of trail standards that facilitate maintenance outside the wilderness by
mechanized equipment, • Initiation of a recreation fee program on higher impact trail uses (horse and bike riders) to
fund trail maintenance work, and • Implementation of trail reconstruction and maintenance work, marking, and access
improvements. These efforts have been largely successful in achieving the Forest’s two primary trail-related management objectives: 1) provide quality trail opportunities year around to as many users as possible, and 2) adequately protect forest resources while providing these opportunities (Forest Service 2002). Following careful reviews the trail system has been reduced to 258 miles, which is more sustainable and manageable given declining agency budgets. While many issues have been addressed or resolved, some issues continue to provide a challenge to Forest managers. The decision to make most trails multiple use, based on extensive public involvement during the 1992-94 planning process, is problematic for some trail users. In particular, the application of gravel for enhancing the sustainability of trails to accommodate all types of year-round use is a significant aesthetic concern (Wadzinski 2000). The cost-efficient application of gravel generally requires large trucks and dozers, which necessitates greater clearing of woody vegetation and wider treads.
This research sought to address these concerns by investigating factors that contribute to the degradation of horse trails. Greater insights into the role and influence of various use-related, environmental and managerial factors were expected to contribute to the development of improved Best Management Practices (BMPs). In particular, the use of gravel to harden trails
- 48 -
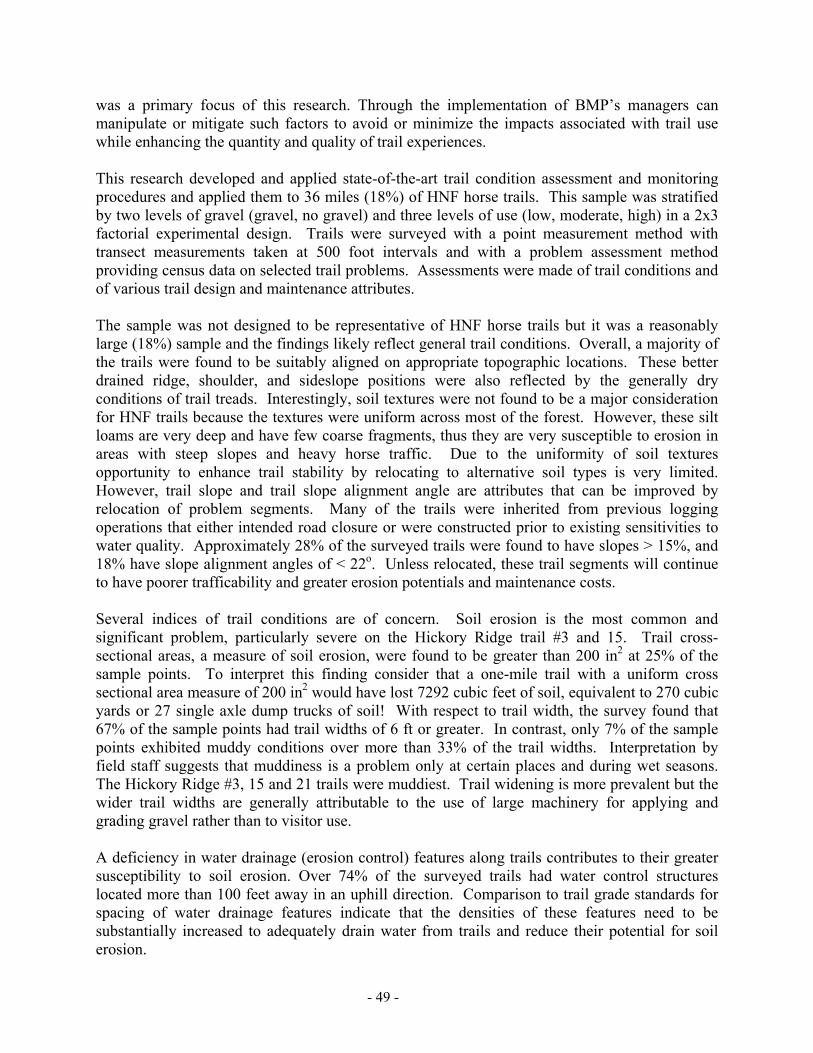
was a primary focus of this research. Through the implementation of BMP’s managers can manipulate or mitigate such factors to avoid or minimize the impacts associated with trail use while enhancing the quantity and quality of trail experiences. This research developed and applied state-of-the-art trail condition assessment and monitoring procedures and applied them to 36 miles (18%) of HNF horse trails. This sample was stratified by two levels of gravel (gravel, no gravel) and three levels of use (low, moderate, high) in a 2x3 factorial experimental design. Trails were surveyed with a point measurement method with transect measurements taken at 500 foot intervals and with a problem assessment method providing census data on selected trail problems. Assessments were made of trail conditions and of various trail design and maintenance attributes. The sample was not designed to be representative of HNF horse trails but it was a reasonably large (18%) sample and the findings likely reflect general trail conditions. Overall, a majority of the trails were found to be suitably aligned on appropriate topographic locations. These better drained ridge, shoulder, and sideslope positions were also reflected by the generally dry conditions of trail treads. Interestingly, soil textures were not found to be a major consideration for HNF trails because the textures were uniform across most of the forest. However, these silt loams are very deep and have few coarse fragments, thus they are very susceptible to erosion in areas with steep slopes and heavy horse traffic. Due to the uniformity of soil textures opportunity to enhance trail stability by relocating to alternative soil types is very limited. However, trail slope and trail slope alignment angle are attributes that can be improved by relocation of problem segments. Many of the trails were inherited from previous logging operations that either intended road closure or were constructed prior to existing sensitivities to water quality. Approximately 28% of the surveyed trails were found to have slopes > 15%, and 18% have slope alignment angles of < 22o. Unless relocated, these trail segments will continue to have poorer trafficability and greater erosion potentials and maintenance costs. Several indices of trail conditions are of concern. Soil erosion is the most common and significant problem, particularly severe on the Hickory Ridge trail #3 and 15. Trail cross-sectional areas, a measure of soil erosion, were found to be greater than 200 in2 at 25% of the sample points. To interpret this finding consider that a one-mile trail with a uniform cross sectional area measure of 200 in2 would have lost 7292 cubic feet of soil, equivalent to 270 cubic yards or 27 single axle dump trucks of soil! With respect to trail width, the survey found that 67% of the sample points had trail widths of 6 ft or greater. In contrast, only 7% of the sample points exhibited muddy conditions over more than 33% of the trail widths. Interpretation by field staff suggests that muddiness is a problem only at certain places and during wet seasons. The Hickory Ridge #3, 15 and 21 trails were muddiest. Trail widening is more prevalent but the wider trail widths are generally attributable to the use of large machinery for applying and grading gravel rather than to visitor use. A deficiency in water drainage (erosion control) features along trails contributes to their greater susceptibility to soil erosion. Over 74% of the surveyed trails had water control structures located more than 100 feet away in an uphill direction. Comparison to trail grade standards for spacing of water drainage features indicate that the densities of these features need to be substantially increased to adequately drain water from trails and reduce their potential for soil erosion.
- 49 -

Use level was found to significantly affect trail cross sectional areas, estimated soil erosion values, muddiness, and maximum incision. The moderate and high use trails had somewhat similar values, but lower use trails were generally in better condition. These data indicate that substantial reductions in use would be required to significantly improve resource conditions. Consequently, reducing horse use is unlikely to be a realistic or effective management option. Site management actions, such as tread drainage, grading, and application of gravel, have the strongest potential for improving trail conditions. Surface substrates (gravel vs. bare soil) significantly affected trail cross sectional area, estimated soil erosion, trail muddiness, trail width, and maximum incision. Gravel enhanced all characteristics and the HNF has probably avoided significant problems with their horse trails due to the use of gravel. However, it may prove difficult and costly to control erosion on the more poorly located trail segments, and heavy horse traffic tends to exacerbate the problem. Furthermore, another potentially negative aspect of gravel use is that graveled trails tend to be wide, though this may reflect the types of trails that were selected for gravel application or perhaps the method of gravel application. From a management perspective, one of the most immediately applicable findings is related to gravel depth and its effectiveness in addressing soil erosion and muddiness. Small applications of gravel improved trail conditions at grades <17% and large applications of gravel were effective at minimizing problems on steeper slopes. Table 20 presents a summary of all research findings. In particular, we emphasize the results from the trail degradation model produced through regression analyses. The multivariate regression procedure allows a simultaneous evaluation of many different factors, adjusting for the relative influence of each factor. This technique enables the best “real world” model of trail degradation and provides insights into what factors managers can influence to most effectively reduce soil erosion on trails. Based on these analyses, the most important factor managers can influence is the density of tread water drainage features such as water bars and drainage dips. Other significant factors were the trail slope alignment angle (rerouting segments with fall-line trail alignments) and graveling trails. Interestingly, the gravel measure included in the model was percent cover across a trail’s width, rather than gravel depth. Regardless, both are statistically significant predictors of soil erosion and they point to the efficacy of graveling as a management action for preventing soil erosion. Of specific interest is our failure to find a significant relationship between trail grade and erosion. We cannot explain this other than to suggest that managers have been successful in targeting steeper grades with additional gravel application and periodic grading. There is a large body of literature attributing to the importance of trail grade so we will add this factor to those included in the trail degradation mode. Another interesting finding is that while amount of use is highly significant when examined in a univariate test, when examined in a multivariate analyses other factors are revealed to be more important predictors of soil erosion. Amount of use was not included in the trail model, suggesting that use reductions would be a less effective management action for reducing soil erosion than the other factors included in the model.
- 50 -
Table 20. Summary of principal research findings and location where finding is presented.
Page Research Finding
33 Soil types are very uniform, primarily silt loam (81%) and silty clay loam (10%), which contain little coarse material (rock) and are very susceptible to erosion.
34 & 41
18% of the sample points were located on trails with a “fall-line” trail slope alignment angle (i.e., directly up and down slope). Draining water off fall-line trails is exceedingly difficult and they are highly susceptible to erosion. Erosion is substantially higher on fall-line trails, particularly those with grades >8%.
34
45% of the sample points were located on grades >10%, 28% on grades >15%. Horse trails with such steep grades are highly susceptible to soil erosion. 21% of the sample points were located on grades of 0-2% - these trails are highly susceptible to poor drainage and muddy treads if located in flat terrain (i.e. are not side-hill trails).
35 Surveyed trails have a mean soil loss of 179 in2 and 10% of the sample points had soil loss exceeding 400 in2.
35 13% of the sample points exhibited some degree of muddiness, survey data reveal this problem to be minimal and localized.
35 Surveyed trails have a mean width of 83 in. These wide treads reflect their prior history as woods roads and use of large equipment for applying gravel.
36 & 43
75% of sample points did not have a drainage feature within 100 ft in an uphill direction. Unless trails are designed with rolling grade dips or maintained to have outsloped treads such features are an important deterrent to soil erosion. The current density of drainage features is deficient according to Forest Service Handbook specifications.
38 Moderate and high-use non-graveled trails are significantly more eroded than graveled trails.
40 A gravel thickness of more than 3.5 inches, combined with periodic grading, can effectively minimize soil erosion on horse trails.
42
Erosion is greatest on non-graveled moderate to high use trails, only low use horse trails can sustain traffic without substantial soil loss. A gravel layer of >3.5 in. offers substantially greater deterrent to erosion than 2.1-3.5 in. at moderate and high use levels. Data also suggest that manager’s efforts to reduce erosion on steeper and higher use trails have been effective.
44
A trail degradation model suggests the following factors are the most important influences on trail erosion: drainage features, graveling, and trail slope alignment angle. These findings suggest that erosion is best controlled by increasing the construction and maintenance of tread drainage features, adding gravel to trails, and rerouting fall-line trails to side-hill alignments.
- 51 -

Study Recommendations Recommendations are derived from the findings of this study, reviewed literature, and the authors’ personal judgments. We begin with recommendations for trail planning and decision making, followed by guidance for assessing the need for trail relocations and procedures for designing improved routes, and end with an examination of recommended Best Management Practices for trail maintenance.
Trail Planning and Decision Making
The Forest Plan for the Hoosier National Forest is a strategic document that outlines broad goals and priorities for how the national forest is managed. This document is currently undergoing a revision but it is not intended to provide comprehensive and specific guidance for trail management. A Trail Program document (Forest Service 2002) provides limited additional direction but at 10 pages it is too brief to adequately address many important trail management issues. The development of a more comprehensive Trail Plan for the Forest is recommended. A trail plan provides direction and guidance to all trail management decision-making and should address four general topics: 1) management guidance, including goals, objectives and desired resource and social condition statements, 2) identification of a decision making framework, including indicators, standards, monitoring methods and alternative management actions, 3) evaluation of existing trail resources in light of administrative and recreational needs intended for the trail system, and 4) description of the actions and resources necessary to develop and manage the trail system (see Figure 17) (Marion and Leung 2004). More specific trail planning guidance is provided by Birchard and Proudman (2000) and Demrow and Salisbury (1998) for backcountry trails, and by Vogel (1982) for equestrian trails. Figure 17. Elements of a trail plan. • Goals, prescriptive objectives, and specific desired resource and social condition statements for the
trail system and zones related to recreational opportunities and resource conditions. • Evaluation and specification of appropriate recreational opportunities. • Incorporation/description of a decision-making framework to guide and justify management actions. • Identification of indicators, standards and monitoring protocols needed to sustain high quality
resource conditions and recreational experiences. Description of alternative management actions that may be applied to achieve desired conditions.
• Inventory of existing trails and roads for their suitability to sustain intended types and amounts of uses. Consider management zoning; environmental sensitivity; recreational and administrative needs; distribution, design and condition of existing trails; and facility/maintenance features.
• Evaluation of proposed uses in relation to the existing network to identify deficiencies. Description of the actions and resources necessary to address deficiencies (e.g., new trail construction, reconstruction, relocations) and to manage the proposed trail system (e.g., support trail maintenance and visitor management).
• Trail standards specifying the general level of trail development, including tread widths, substrates, grades, difficulty, maintenance features, and corridor width and height.
- 52 -

An important step omitted in many trail plans is the specification of prescriptive management objectives and desired resource and social conditions for the trail system, generally by management zone (NPS 1998). Application of zoning allows different classifications of guidance for social, physical and managerial settings and, when needed, spatial segregation of conflicting uses (Forest Service 1982). For example, zone “x” could provide for low intensity human-powered activities on primitive trails with few facilities and pristine resource conditions, while zone “y” could provide for high use, including equestrians, on designated routes with crushed stone (aggregate) surfacing, bridges for stream crossings, and allowance for greater levels of resource degradation. Comprehensive and specific desired condition statements provide improved management guidance, particularly for identifying the type and extent of trail development and associated trail management actions. Desired resource and social conditions can be sustained by employing planning and decision frameworks such as the Limits of Acceptable Change (LAC) (Farrell and Marion 2002, Stankey et al. 1985). These permit inclusion of indicators and standards of quality, and monitoring to gauge management success in achieving prescriptive objectives. Conditions that exceed management standards prompt an evaluation of the impact problem and selection and implementation of corrective actions (Anderson et al., 1998). Omitting this step and these frameworks greatly increases the subjectivity of management decisions and can permit an incremental spiraling decline in social and resource conditions beyond acceptable levels.
Managing Visitor Use
While a variety of recreational uses are appropriate on the HNF trail system, managers must ensure that they avoid significant impairment of natural and cultural resources. Managers are charged with applying their professional judgment in evaluating the type and extent of recreation-related impacts when judging what constitutes impairment. This report provides useful information for rendering such determinations and provides a basis for decisions to enhance management of visitors and resources to avoid or minimize recreation impacts. Visitor use regulations and educational programs can assist in reducing resource impacts associated with trail use. The literature review in this report reveals that trail impacts related to horse use are substantially greater than other forms of human-powered trail activities. HNF regulations already restrict horse and bike use to select subsets of trails that are sufficiently well-designed, constructed and maintained to sustain those uses with minimal impact. Another potentially important regulation or low impact use recommendation are temporary trail closures for horse use on non-graveled trails during wet seasons. Trail use when soils are wet is considerably more damaging than when soils are dry. Well-graveled trails could be exempted. Educational programs, such as the national Leave No Trace program, provide excellent low impact trail use practices that can help trail users to avoid or reduce both resource and social impacts. The forest currently has four staff who have taken the five-day Master of Leave No Trace course. Additional Trainers or a Masters course might be considered to train an adequate cadre of forest staff, commercial outfitters, and stakeholders from area recreation organizations. Courses specific to horse use and backpacking/camping are available. A comprehensive array of educational materials has already been developed by this organization (www.LNT.org) and can be adapted to address local needs.
- 53 -

Evaluate, Relocate, and Reconstruct Trails
In spite of an earlier selection process applied by HNF managers, many designated trails were not carefully planned and constructed as recreational trails to sustain high horse traffic while limiting resource degradation. Survey results identified several trail design factors that significantly influence trail degradation. These factors can help managers evaluate the relative resistance of individual trails, particularly for higher impacting uses. As previously noted, trail grade is perhaps the most disturbing issue related to the location of HNF trails. Over 46% of the total trail alignments examined had grades greater than 10% and almost 18% were greater than a 20% grade. In addition, approximately 18% of the sampled trails were found on 0-22 degree slope alignments, indicating that the trails roughly parallel the landform slope. The proportion of trails along stream valleys, 11%, also indicates higher susceptibility to problems with tread muddiness and sedimentation of adjacent water resources. Where feasible, trail grades for horse trails should not exceed 12%, 15% maximum. This recommendation is derived primarily from our review of the literature and professional judgment. Trail sections with direct ascent slope alignments (0-22o) are also strong candidates for rerouting, particularly when the trail grade is also steep. As shown by this survey, many existing trail segments could benefit from relocations to bring them into standard so that they can support their intended uses while protecting the forest’s natural resources. Trails with active erosion that can be rerouted to avoid steep trail grades and direct ascent alignments should be given the highest priority. Alternately, tread reconstruction and maintenance treatments to harden and drain water from tread surfaces are a potentially effective though less preferable management practice. Current efforts to address these problems through heavy applications of gravel and increased maintenance on existing alignments appear to be an effective alternative for minimizing soil erosion but likely entail greater long-term cost and aesthetic impact to visitor’s experiences. In order to further enhance the protection of Forest natural resources, it is recommended that the forest conduct additional formal assessments of existing trails to evaluate the adequacy of their design. Recommended procedures for accomplishing this are included in the “Trail Inspection and Problem Location Form” in Appendix 3. These procedures can help to structure and guide assessments and decisions about the need for trail relocations and tread maintenance. Though more expensive to construct, side-hill trail designs are preferred in all settings. Side-hill trails can always be easily drained while “direct-ascent” trails cannot (regardless of their grade); and flat-terrain trails are also problematic as they are susceptible to muddiness, tread widening, and trail braiding. Trail managers should employ side-hill alignments when possible and give strong consideration to rerouting fall-line trails, particularly those with steeper grades. For trails or segments that must be relocated, it is relatively easy to mark a trail gradeline on paper and in the field. One of the simplest and most efficient methods for locating trail gradeline involves the use of standard USGS topographic maps and dividers (Figures 18-19). For example, to relocate a section of trail that is too steep we begin by identifying a starting point (A) and ending point (B). Both points are identified on the topographic map (Scale 1:24,000 and contour intervals of 20 feet). We can now set our dividers to maintain the desired slope between the two control points by manipulating the standard slope calculations in the following manner:
- 54 -

Slope % = (∆elevation/∆distance) x 100%
Figure 18. Common tools for office reconnaissance of forest trails include topographic maps, soil surveys, aerial photographs, dividers, scale, and calculator.
Desired Slope % = contour interval/distance x 100% Distance = Desired Slope/slope (decimal) Distance = 20 ft/0.10 = 200 ft Therefore we can travel 200 feet on a 10% grade between two 20-foot contour intervals. Now we can calculate the divider setting and create the gradeline directly on the topographic map. The scale of the map is 1:24000 or 1in./2000ft. so 200ft x 1in/2000 ft = 0.1 inches. Our divider setting will be 0.1 inches. Now we can simply swing the dividers from line to line to establish the gradeline on the topographic map. After the general gradeline possibilities are located on the map, we should continue to reconnoiter the site. Soil surveys, aerial photographs and GIS databases are excellent sources of information on soil stability, location of sensitive areas, boundaries, etc. Next, conduct a reconnaissance of the site to locate control points (obstacles or go to points) that were not obvious with the remote data. After reconnaissance, gradeline marking can begin. Marking the field location of a gradeline is also relatively simple and can be done with one person. Begin by tying a flag at eye level at the starting point. Move forward for 50 feet or less and shoot back to the first flag with your clinometer or hand level. Move up or down slope until the desired grade is achieved and tie another flag at eye level. The process proceeds until the end of the desired trail is achieved. This flagged gradeline will provide an excellent location for the subsequent construction phase.
Best Management Practices
Figure 19. The thick dashed line provides an example of a relocated section of trail that replaced the steeper valley bottom trail alignment.
Recommendations for maintaining HNF horse trails are offered in this section and summarized in Appendix 3. In general, the data show that most horse trails that receive low use are in good condition even when gravel is not applied. Good design and maintenance can likely address most problems without the application of gravel, or, gravel could be applied only to poorly designed problem areas when reroutes are not possible (Table 21). In contrast to horseback riding areas in the Appalachian and Rocky Mountains, good design and maintenance are likely insufficient to prevent erosion on horse trails
- 55 -

that receive moderate use. This is largely due to the higher erodibility of HNF’s loamy soils, which contain little or no rock. Application of gravel (generally about 2-3 inches) in all but the most resistant sections, followed by periodic maintenance, should be sufficient. Poorly designed segments will require a greater thickness of gravel and more frequent maintenance. Maintenance includes installation and periodic cleaning of an adequate density of tread drainage features. Table 21. Summary of recommendations for gravel use on HNF horse trails.
Use Level Well-Designed Trails
<13% slope >22o slope alignment, dry soils
Poorly Designed Trails >13% slope < 22o slope alignment, wetter soils
Low Use Gravel generally not necessary1 2-3 in. where needed
Moderate Use 2-3 in. recommended 4-5 in. recommended
Grading and reapplication as needed
High Use 4-5 in. recommended 6-7 in. recommended
Grading and reapplication as needed 1 – Common recommendation for all cells in table: installation of an adequate density (see Table 22) and annual maintenance of water drainage features. High use horse trails will likely require 4-5 inches of gravel along their entire length, 6-7 inches in areas most prone to erosion and muddiness (Table 21). Sections with design deficiencies will also require more frequent maintenance, grading, and reapplication of gravel. Of particular concern is the rate at which gravel on steeper grades and poor slope alignments will migrate downhill under heavy horse traffic. Three-dimensional geotextiles (geocell honeycomb configurations) can be tried on steep slopes but we found no literature that suggested their use or evaluated their efficacy following horse traffic in such settings. Thicker applications of gravel may be necessary in wetter soils, though this can be minimized if geotextiles are used to separate and/or contain the gravel. The greater resource impacts and/or expense of maintaining these sections can be avoided through relocations. A worksheet for estimating road and trail costs is provided in Appendix 4. The cost-efficient application of gravel to HNF horse trails requires the use of large trucks, whose access to the trail system requires wider clearing of woody vegetation. However, the gravel can be applied in a narrower width that lessens the “road-like” appearance of some HNF trails. Other protected areas have found that equestrian visitors have been accepting of graveled trails when limited in size to 73’s (1 inch “crush-and-run” gravel). After several years the gravel will sink into the soil and become covered and stained by organic litter, creating a resistant but more aesthetically pleasing appearance. Trailside vegetation will also grow in and down over time, creating a more narrow trail corridor. However, poorly designed sections that require frequent grading and reapplication of gravel, as opposed to more permanent fixes involving relocations, will require heavy equipment to periodically travel the trail corridors to access the problem segments. This will prevent the narrowing of trail corridors from vegetative growth and, in problem areas, recreate a “gravel road” appearance.
- 56 -

Some options to address these problems include the use of geotextiles to further stabilize problem areas and extend the life of treads. The effective application of geotextiles can reduce the frequency of maintenance by heavy equipment. The use of narrower gage heavy equipment might also be considered to maintain narrower trail widths. However, such equipment is rare and costly, making this a cost-prohibitive alternative when trail work must be contracted to the private sector. The aesthetic issue related to the appearance of gravel can be addressed by mixing gravel with soil prior to its application. This technique has met with good success at Shenandoah National Park. Survey results also revealed an inadequate density of tread drainage features on forest trails. For example, only 157 of 619 sample points had a tread drainage feature within 75 feet in an uphill direction along the trail (Table 11) and based on trail grade the density of these features was clearly deficient (Table 14). Drainage features were the most important influence on trail erosion according to regression analyses (Table 15). Thus, another important maintenance recommendation from this study is for HNF managers to inspect the density and effectiveness of existing tread drainage features to ensure adequate drainage of the trail. A variety of drainage control structures can be used depending on trail design attributes, site conditions, maintenance standards, and use level. Guidance for the frequency of drainage features on HNF treads of loamy soil and gravel is provided in Table 22. Inspections of the effectiveness of tread drainage features can be conducted using the inspection form in Appendix 3. Such features become ineffective over time as traffic compacts or rearranges tread substrates. Drainage features generally must be cleaned, restored, or replaced on an annual basis, preferably immediately preceding wetter seasons. Table 22. Guidance for the frequency of water cross drains at various trail grades.
Frequency of Cross Drains (ft) Trail Grade Substrate
2% 4% 6% 8% 10% 12% 15% Loam 350’ 150’ 100’ 75’ 50’ 25’1 10’1
Gravel - - 800’ 600’ 400’ 300’ 250’ Source: Forest Service 1991. 1 – extrapolated value not provided by original reference. Stream crossings within the HNF are a final management challenge. Regardless of the type, bridges or fords, trail erosion into streams is a significant concern. All stream crossings by horse trails should be periodically evaluated to identify the most effective method to avoid or minimize soil erosion into streams. These may include bridges, trail reroutes, tread hardening with rock, gravel, and/or geotextiles, enhanced drainage by tread outsloping or water bars, or other measures. In the vicinity of stream crossings water should be drained from trails in a thin sheet flow that, prior to reaching water resources, travels through >15 feet of organic litter and
- 57 -

vegetation to settle out or filter soil particles. This is an important issue that requires considerable management attention.
- 58 -

Literature Cited Agate, E. 1996. Footpaths: A Practical Handbook. British Trust for Conservation Volunteers.
The Eastern Press Ltd., London, UK. Anderson, D.H., Lime, D.W. and Wang, T.L. 1998. Maintaining the Quality of Park Resources
and Visitor Experiences: A Handbook for Managers. Publication TC-777. University of Minnesota, Department of Forest Resources, Cooperative Park Studies Unit, St. Paul, MN.
Aust, W.M. and R.M.Shaffer. 2001. Costs of planning, locating, and constructing a minimum standard forest road to meet BMP guidelines in the Appalachian Mountains of Virginia. p. 1-4. Annual Meeting Council on Forest Engineering, Portland Oregon, Fall 2000.
Aust, W.M., Visser, R.M., Gallagher, T., and Roberts. T. 2003. Cost of six different stream crossing options in the Appalachian region. Southern Journal Applied Forestry 27(1): 66-70.
Bayfield, N.G. and Aitken, R. 1992. Managing the Impacts of Recreation on Vegetation and Soils: A Review of Techniques. ITE Project T0 2050V1, Institute of Terrestrial Ecology, Brathens, Banchory, UK.
Bergmann, R. 1995. Soil Stabilizer for Use on Universally Accessible Trails. Publication 9523-1804-MTDC-P. USDA Forest Service, Technology and Development Program, Missoula, MT.
Birchard, W. and Proudman, R.D. 2000. Appalachian Trail Design, Construction, and Maintenance. (2nd Ed.). Harpers Ferry, WV: Appalachian Trail Conference.
Birkby, R.C. 1996. Lightly on the Land: The SCA Trail-Building and Maintenance Manual. Student Conservation Association, Inc. The Mountaineers, Seattle, WA.
Blinn, C.R., Dahlman, R., Hislop, L. and Thompson, M.A. 1999. Options for temporary wetland and stream crossings. Journal of Forestry 97(8): 1-6.
Bratton, S.P., Hickler, M.G., and Graves, J.H. 1979. Trail erosion patterns in Great Smoky Mountains National Park. Environmental Management 3: 431-445.
Bryan, R.B. 1977. The influence of soil properties on degradation of mountain hiking trails at Grovelsjon. Geografiska Annaler 59A(1-2): 49-65.
Cole, D.N. 1982. Wilderness campsite impacts: Effect of amount of use. Research Paper INT-284. Ogden, UT: USDA Forest Service, Intermountain Forest and Range Experiment Station.
Cole, D.N. 1983. Assessing and Monitoring Backcountry Trail Conditions. Research Paper INT-303. Ogden, UT: USDA Forest Service, Intermountain Forest and Range Experiment Station. 10p.
Cole, D.N. 1987. Research on soil and vegetation in wilderness: a state-of-knowledge review. In: Lucas, R.C. comp. Proceedings – National Wilderness Research Conference: Issues, State-of-Knowledge, Future Directions; Fort Collins, CO. General Technical Report INT-220. USDA Forest Service, Intermountain Research Station, Ogden, UT, pp. 135-177.
Cole, D.N. 1988. Disturbance and recovery of trampled montane grassland and forests in Montana. Research Paper INT-389. Ogden, UT: USDA Forest Service, Intermountain Forest and Range Experiment Station.
Cole, D.N. 1991. Changes on trails in the Selway-Bitterroot Wilderness, Montana, 1978-1989 Research Paper INT-212. Ogden, UT: USDA Forest Service, Intermountain Research Station.
Cole, D.N. 1995a. Disturbance of natural vegetation by camping: Experimental applications of low-level stress. Environmental Management 19(3): 405-416.
- 59 -

Cole, D.N. 1995b. Experimental trampling of vegetation. I. Relationship between trampling intensity and vegetation response. Journal of Applied Ecology 32: 203-214.
Cole, D.N. and Spildie, D.R. 1998. Hiker, horse, and llama trampling effects on native vegetation in Montana, USA. Journal of Environmental Management 53: 61-71.
Deluca, T.H., Patterson, W.A., Freimund, W.A., and Cole, D.N. 1998. Influence of llamas, horses, and hikers on soil erosion from established recreational trails in western Montana, USA. Environmental Management 22(2): 255-62.
Demrow, C. and Salisbury, D. 1998. The Complete Guide to Trail Building and Maintenance. 3rd ed. Appalachian Mountain Club Books, Boston, MA.
Dissmeyer, G.E. and Foster, G.R. 1984. A Guide for Predicting Sheet and Rill Erosion on Forest Land. USDA Forest Service Technical Publication R8 TP 6. 40 p.
Egan, A.F. 1999. Forest roads: where soil and water don't mix. Journal of Forestry 97(8): 18-21. Elliot, W.J., Hall, D.E., and Graves, S.R. 1999. Predicting sedimentation from forest roads.
Journal of Forestry 97(8): 23-29. Elliot, W.J. and Tysdal, L.M. 1999. Understanding and reducing erosion form insloping roads.
Journal of Forestry 97(8): 30-34. Farrell, T.A. and Marion, J.L. 2002. Trail impacts and trail impact management related to
visitation at Torres del Paine National Park, Chile. Leisure/Loisir 26(1): 31-59. Footpath Trust. 1999. Upland Pathwork: Construction Standards for Scotland. The Footpath
Trust for the Path Industry Skills Group. Scottish Natural Heritage, Battleby, Redgorton, Perth.
Forest Service. 1982. ROS Users Guide. USDA Forest Service, Washington, DC. Forest Service. 1984. Standard Specifications for Construction of Trails. USDA Forest Service,
Engineering Staff, Washington, DC. Forest Service. 1991. Trails Management Handbook. USDA Forest Service, Washington, DC. Forest Service. 2002. Trail Program, Hoosier National Forest. USDA Forest Service, Bedford,
IN. 32pp. Forman, R.T. 2000. Estimate of the area affected ecologically by the road system in the United
States. Conservation Biology 14(1): 31-35 Forman, R.T. and Alexander, L.E. 1998. Roads and their major ecological effects. Annual
Review of Ecology and Systematics 29: 207-231. Foth, H.D. 1990. Fundamentals of Soil Science. 8th edition, John Wiley & Sons, New York. Fritz, J.D. 1993. Effects of trail-induced sediment loads on Great Smoky Mountains National
Park high gradient trout streams. M.S. Thesis. Cookville, TN: Tennessee Technological University.
Grace, J.M. 2002a. Overview of best management practices related to forest roads: the southern states. American Society of Agricultural Engineers Paper Number 025013.
Grace, J.M. 2002b. Control of sediment export from the forest road prism. Trans. American Society of Agricultural Engineers 45(4): 1127-1132
Grace, J.M., Rummer, B., Stokes, B.J. and Wilhoit, J. 1998. Evaluation of erosion control techniques on forest roads. Trans. American Society of Agricultural Engineers 42(1): 383-391.
Gucinski, H., Brookes, M.H., Furniss, M.J., Ziemer, R.R. 2001. Forest Roads: A Synthesis of Scientific Information. USDA Forest Service Pacific Northwest Research Station General Technical Report PNW-GTR-509. 103 p.
Hammitt, W.E. and Cole, D.N. 1998. Wildland Recreation: Ecology and Management (2nd Ed.). New York: John Wiley and Sons.
- 60 -
Haupt, H.F. 1959. Road and slope characteristics affecting sediment movement from logging roads. Journal of Forestry 57(5): 329-332.
Hellmund, P.C. 1998. Planning trails with wildlife in mind: A handbook for trail planners. Denver, CO: Colorado State Parks.
Hendee, J. and Dawson, C.D. 2002. Wilderness Management: Stewardship and Protection of Resources and Values. 3rd ed. Fulcrum Publishing, Golden, CO.
Hesselbarth, W. and Vachowski, B. 2000. Trail Construction and Maintenance Notebook 2000 Edition. 0023 2839P. Missoula, MT: USDA Forest Service, Missoula Technology and Development Center.
Hood, S.M., Zedaker, S.M., Aust, W.M., Smith, D.W. 2002. Soil erosion in Appalachian hardwoods: using the Universal Soil Loss Equation (USLE) to compare the impacts of different harvest methods. Northern Journal of Applied Forestry 19(2): 53-58.
Hooper, L. 1988. National Park Service Trails Management Handbook. USDI National Park Service, Denver Service Center, Denver, CO.
Indiana Woodland Stewardship Institute. 1999. Indiana Logging and Forestry Best Management Practices (BMP Field Guide). Published by Indiana Division of Forestry, Indiana Dept of Natural Resources. 85 p.
Jacob, G.R. and Schreyer, R. 1980. Conflict in outdoor recreation: A theoretical perspective. Journal of Leisure Research 12: 368-380.
Jubenville, A. and O'Sullivan, K. 1987. Relationship of vegetation and slope gradient to trail erosion in interior Alaska. Journal of Soil and Water Conservation 42: 450-452.
Kasworm, W.F. and Monley, T.L. 1990. Road and trail influences on grizzly bears and black bears in northwest Montana. In L. M. Darling, & W. R. Archibald (Eds.), Bears: Their Biology and Management: Proceedings of the 8th International Conference (pp. 79-84). Victoria, BC: International Association for Bear Research and Management.
Knight, R.L. and Cole, D.N. 1991. Effects of recreational activity on wildlife in wildlands. Transactions of the North American Wildlife and Natural Resource Conference 56: 238-247.
Knight, R.L. and Cole, D.N. 1995. Wildlife responses to recreationists. In: Knight, R.L. and Gutzwiller, K.J., eds. Wildlife and Recreationists: Coexistence Through Management and Research. Washington, DC: Island Press: 51-70.
Kochenderfer, J.N. and Helvey, J.D. 1987. Using gravel to reduce soil losses from minimum standard forest roads. Journal of Soil and Water Conservation 42(1): 46-50.
Leung, Y.F. and Marion, J.L. 1996. Trail degradation as influenced by environmental factors: A state-of-the-knowledge review. Journal of Soil and Water Conservation 51(2): 130-136.
Leung, Y.F., Marion, J.L. and Ferguson, J.Y. 1997. Methods for assessing and monitoring backcountry trail conditions: An empirical comparison. In: Proceedings of the 9th George Wright Society Conference on Research and Resource Management in Parks and on Public Lands, Albuquerque, NM., March 17-21, 1997, The George Wright Society, Hancock, MI. pp. 406-414.
Leung, Y.F. and Marion, J.L. 1999a. The influence of sampling interval on the accuracy of trail impact assessment. Landscape and Urban Planning 43(4): 167-179.
Leung, Y.F. and Marion, J.L. 1999b. Assessing trail conditions in protected areas: Application of a problem assessment method in Great Smoky Mountains National Park, U.S.A. Environmental Conservation 26(4): 270-279.
Leung, Y.F. and Marion, J.L. 2000. Recreation impacts and management in wilderness: A state-of-knowledge review. In: Cole, D.N. and others (eds.), Proceedings: Wilderness Science in a Time of Change; Vol 5: Wilderness ecosystems, threats, and management, pp. 23-48; May
- 61 -

23-27, 1999, Missoula, MT. Proceedings RMRS-P-15-Vol-5. Ogden, UT: USDA Forest Service, Rocky Mountain Research Station.
Liddle, M.J. and Greig-Smith, P. 1975. A survey of tracks and paths in a sand dune ecosystem, I. Soils. Journal of Applied Ecology 12: 893-908.
Liddle, M.J. 1997. Recreation ecology: The ecological impact of outdoor recreation and ecotourism. Chapman & Hall, London. 639 pp.
Luce, C.H. and Black, T.A. 1999. Sediment production from forest roads in western Oregon. Water Resources Research 35(8): 2561-2570.
Manning, R.E. 1999. Studies in Outdoor Recreation: Search and Research for Satisfaction. Oregon State Univ. Press, Corvallis, OR. 374 pp.
Marion, J.L. 1994. An assessment of trail conditions in Great Smoky Mountains National Park Research/Resources Management Report. Atlanta, GA: USDI National Park Service, Southeast Region.
Marion, J.L. 1998. Recreation ecology research findings: Implications for wilderness and park managers. In H. Kirchner (Ed.), Proceedings of the National Outdoor Ethics Conference (pp. 188-196). Gaithersburg, MD: Izaak Walton League of America.
Marion, J.L. and Leung, Y.F. 2001. Trail resource impacts and an examination of alternative assessment techniques. Journal of Park and Recreation Administration 19(1): 17-37.
Marion, J.L. and Leung, Y.F. 2004. Environmentally sustainable trail management. Book Chapter, In: Environmental Impact of Tourism, CABI Publishing, Inc.
Marion, J.L. and Merriam, L.C. 1985. Predictability of recreational impact on soils. Soil Science Society of America Journal 49(3): 7851-753.
Marion, J.L. and Cole, D.N. 1996. Spatial and temporal variation in soil and vegetation impacts on campsites. Ecological Applications 6(2): 520-530.
Marion, J.L., Roggenbuck, J.W., and Manning, R.E. 1993. Problems and Practices in Backcountry Recreation Management: A Survey of National Park Service Managers. Natural Resources Report NPS/NRVT/NRR-93/12. Denver, CO: USDI National Park Service, Natural Resources Publication Office. 64p.
McCashion, J.D. and Rice, R.M. 1983. Erosion on logging roads in northwestern California: how much is avoidable? Journal of Forestry 81(1): 23-26.
McClaran, M.P. 1989. Recreation pack stock management in Sequoia and Kings Canyon National Parks. Rangelands 11(1): 3-8.
McQuaid-Cook, J. 1878. Effects of hikers and horses on mountain lakes. Journal of Environmental Management 6: 209-212.
Meyer, K.G. 2002. Managing degraded off-highway vehicle trails in wet, unstable, and sensitive environments. Publication 0223-2821-MTDC. USDA Forest Service, Technology and Development Program, Missoula, MT.
Monlux, S. and Vachowski, B. 2000. Geosynthetics for Trails in Wet Areas: 2000 Edition. Publication 0023-2838-MTDC. USDA Forest Service, Technology and Development Program, Missoula, MT.
Monti, P. and Mackintosh, E.E. 1979. Effect of camping on surface soil properties in the boreal forest region of northwestern Ontario, Canada. Soil Science Society of America Journal 43: 1024-1029.
Nagy, J.A. and Scotter, G.W. 1974. A qualitative assessment of the effects of human and horse trampling on natural areas, Waterton Lakes National Park. Canadian Wildlife Service, Edmonton, AB. 145pp.
National Park Service. 1998. Director's Order 2 for Park Planning Sourcebook. USDI, National Park Service, Washington, D.C., http://planning.nps.gov/document/do2.pdf.
- 62 -

Newsome, D.E., Cole, D.N. and Marion, J.L. 2004. Environmental impacts associated with recreational horse riding. In: Buckley, Ralf (ed.), Environmental Impact of Tourism, Cambridge, MA: CABI Publishing. pp. 61-82.
Newsome, D., Phillips, N., Milewskii, A. and Annear, R. 2002. Effects of horse riding on National Parks and other natural ecosystems in Australia: Implications for management. Journal of Ecotourism 1(1): 52-74.
Pritchett, W.L. 1979. Properties and Management of Forest Soils. John Wiley & Sons, New York, NY.
Rice, R.M. 1999. Erosion on logging roads in Redwood Creek, Northwestern, California. Journal of the American Water Resources Association 35(5): 1171-1182.
Roggenbuck, J.W., Williams, D.R. and Watson, A.E. 1993. Defining acceptable conditions in wilderness. Environmental Management 17: 187-197.
Root, J.D. and Knapik, L.J. 1972. Trail Conditions along a portion of the Great Divide Trail Route, Alberta and British Columbia Rocky Mountains. Research Council of Alberta, Report No. 72-5, Edmonton, Canada.
Scottish Natural Heritage. 2000. A Technical Guide to the Design and Construction of Lowland Recreation Routes. Scottish Natural Heritage, Battleby, Redgorton, Perth.
Shew, R.L., Saunders, P.R. and Ford, J.D. 1986. Wilderness managers’ perceptions of recreational horse use in the Northwestern United States. In Proceedings of the National Wilderness Conference, Current Research. General Technical Report, INT-212, pp. 320-325. Fort Collins, CO: USDA Forest Service, Intermountain Research Station.
Stankey, G.H., Cole, D.N., Lucas, R.C., Petersen, M.E. and Frissell, S.S. 1985. The Limits of Acceptable Change (LAC) System for Wilderness Planning. General Technical Report INT-176. USDA Forest Service, Intermountain Forest and Range Experiment Stn., Ogden, UT.
Steinholtz, R.T. and Vachowski, B. 2001. Wetland Trail Design and Construction. Publication 0123-2833-MTDC. USDA Forest Service, Technology and Development Program, Missoula, MT.
St. John-Sweeting, R.S. and Morris K.A. 1991. Seed transmission through the digestive tract of the horse. In: Plant Invasions The Incidence of Environmental Weeds in Australia. pp. 170-172. Kowari 2, Australian National Parks and Wildlife Service, Canberra.
Summer, R.M. 1980. Impact of horse traffic on trails in Rocky Mountain National Park. Journal of Soil and Water Conservation 35: 85-87.
Summer, R.M. 1986. Geomorphic impacts of horse traffic on montane landforms. Journal of Soil and Water Conservation 42: 126-128.
Sun, D. and Liddle, M.J. 1993a. A survey of trampling effects of vegetation and soil in eight tropical and subtropical sites. Environmental Management 17: 497-510.
Sun, D. and Liddle, M.J. 1993b. Plant morphological characteristics and resistance to simulated trampling. Environmental Management 17(4): 511-521.
Swift, L.W., Jr. 1984. Soil losses from roadbeds and cut and fill slopes in the southern Appalachian Mountains. Southern Journal of Applied Forestry 8(4): 209-216.
Swift, L.W., Jr. 1985. Forest road design to minimize erosion in the southern Appalachians. p. 141-151. In B.G. Blackmon (ed) Proc. Forestry and Water Quality: a mid-south symposium. Monticello, AR.
Swift, L.W. and Burns, R.G. 1999. The threes R’s of roads: redesign, reconstruction, and restoration. Journal of Forestry 97(8): 40-44.
Taylor, S.E., Rummer, R.B., Yoo, K.H., Welsch, R.A. and Thompson, J.D. 1999. What we know and don't know about water quality at stream crossings. Journal of Forestry 97(8): 12-17.
- 63 -
Teschner, D.P., DeWitt, G.M. and Lindsay, J.J. 1979. Hiking Impact on Boreal Forest Vegetation and Soils in Vermont's Northern Green Mountains. University of Vermont, Recreation Management Program, Research Note SNR-RM 6, Burlington, VT.
Thurston, E. and Reader, R.L. 2001. Impacts of experimentally applied mountain biking and hiking on vegetation and soil of a deciduous forest. Environmental Management 27(3): 397-409.
Trimble, G.R. and Sartz, R.S. 1957. How far from a stream should a logging road be located. Journal of Forestry 55: 339-341.
Tyser, R.W. and Worley, C.A. 1992. Alien flora in grasslands adjacent to road and trail corridors in Glacier National Park, Montana (U.S.A.). Conservation Biology 6: 253-262.
Van Lear, D.H., Taylor, G.B. and Hansen, W.F. 1998. Sediment sources to the Chattooga River. p. 357-362. In T.A. Waldrop (ed) Proc. Ninth Biennial Southern Silvicultural Research Conf. Feb. 25-27, 1997. Clemson, SC. USDA Gen. Tech. Rep. SRS-20. 628 p.
Vaske, J.J., Donnelly, M.P. and Shelby, B. 1993. Establishing management standards: Selected examples of the normative approach. Environmental Management 17: 629-643.
Vogel, C. 1982. Trails Manual, 2nd ed. Equestrian Trails, Sylmar, CA. Wadzinski, L. 2000. Mud, manure, and money: fixing the trails in Indiana. 15th National Trails
Symposium. American Trails. Sept. 21-24, 2000. Redding, CA Walbridge, T.A. 1997. The Location of Forest Roads. T.A. Walbridge & Associates.
Blacksburg, VA. 91 p. Walbridge, T.A., Franklin, B.D., Griffiths, R.C., and Jarck, W. 1984. Forest Road Engineering.
Section 18. p. 1041-1087. In. K.F. Wenger Forestry Handbook. 2nd edition. Wiley and Sons, New York. 1335 p.
Watson, A.E., Niccolucci, M.J. and Williams, D.R. 1993. Hikers and recreational stock users: predicting and managing recreation conflicts in three wilderness. Res. Pap. INT-468. Ogden, UT: USDA For. Serv., Intermountain Research Station 35p.
Weaver, T. and Dale, D. 1978. Trampling effects of hikers, motorcycles and horses in meadows and forests. Journal of Applied Ecology 15(2): 451-457.
Weaver, T., Dale, D. and Hartley, E. 1979. The relationship of trail condition to use, vegetation, user, slope, season and time. In R. Ittner, D. R. Potter, J. K. Agee, & S., Anschell (Eds.), Recreational Impact on Wildlands: Conference Proceedings (pp. 94-100). Seattle, WA: USDA Forest Service, Pacific Northwest Forest and Range Experiment Station and USDI National Park Service.
Welch, D.M. and Churchill, J. 1986. Hiking trail conditions in Pangnirtung Pass, 1984, Baffin Island, Canada. Parks Canada Report, Ottawa, Canada.
Whinam, J. and Comfort, M. 1996. The impact of commercial horse riding on sub-alpine environments at Cradle Mountain, Tasmania, Australia. Journal of Environmental Management 47: 61-70
Whittaker, P.L. and Bratton, S.P. 1978. Comparison of surface impact by hiking and horseback riding in the Great Smoky Mountains National Park (Research/Resource Management Report No. 24). Gatlinburg, TN: Great Smoky Mountains National Park, Uplands Field Research Laboratory.
Widner, C. and Marion, J.L. 1993. Horse impacts: Research findings and their implications. Master Network, part 1 – 1993:No. 5 (pp.5, 14); part 2 – 1994:No. 6 (pp.5-6).
Wilson, J.P. and Seney, J.P. 1994. Erosional impacts of hikers, horses, motorcycles, and off-road bicycles on mountain trails in Montana. Mountain Research and Development 14:77-88.
- 64 -

Appendix 1. Trail Survey Manual
Introduction This manual describes standardized procedures for conducting an assessment of resource conditions on Hoosier National Forest recreation trails. These procedures can be periodically reapplied to document and monitor changes in trail conditions over time. Their design relies on a sampling approach to characterize trail conditions from measurements taken at transects located every 300 ft (91 m) along selected trail segments. Distances are measured with a measuring wheel. Measurements are conducted at sample points to document the trail’s width, depth, substrate, slope, alignment and other characteristics. These procedures take between 3 to 6 minutes to apply at each sample point. Data is summarized through statistical analyses to characterize resource conditions for each trail segment. During future assessments it is not necessary to relocate the same sample points for repeat measures. Survey work should be conducted during the middle or end of the primary use season during the growing season. Subsequent surveys should be conducted at approximately the same time of year. Materials This manual on waterproof paper, Field forms (both types) - some on waterproof paper, Pencils, Clipboard w/compartment for forms, Measuring wheel, Topographic and driving maps, Clinometer, 12 ft Tape measure (& 25ft for wide trails), Metal stakes (3), Compass, 25 ft 1/16 in. braided nylon string with 18 beads attached, Trowel Point Sampling Procedures Trail Segments: During the description of amount and type of use (indicators 5 & 6 below) be sure that the use characteristics are relatively uniform over the entire trail segment. Some of the study trails have multiple uses. For example, a sign in the middle of a study segment restricting horse use beyond it can substantially affect visitation and impact. Even when use types are not regulated the study trail may intersect with another route that diverts one of the user groups. In such instances where substantial changes in the type and/or amount of use occur, the trail should be split in two segments and assigned separate names and forms, upon which the differences in use can be described. This practice will facilitate subsequent statistical summaries and analyses. Also collect and record any other information that is known about the trail’s history, such as original construction, past uses, type and amount of maintenance, history of use, etc. 1) Trail Segment Code: Record a unique trail segment code (can be added later). 2) Trail Name: Record the trail segment name(s) and describe the segment begin and end points. 3) Surveyors: Record initials for the names of the trail survey crew.
Developed by Dr. Jeff Marion, USDI, U.S. Geological Survey, Patuxent Wildlife Research Center, Virginia Tech/Dept. of Forestry, Blacksburg, VA 24061-0324 (540/231-6603) email: [email protected]
- 65 -

4) Date: Record the date (mm/dd/yr) the trail was surveyed. 5) Use Level (UL): Record an estimate of the amount of use the trail receives, relative to all trails in the
forest, from the most knowledgeable forest staff member: High, Medium, Low. Work with them to quantify these use levels on an annual basis (e.g., low use, < 100 users/wk for the 12 wk use season, < 30 users/wk for the 20 wk shoulder season, < 10 users/wk for the 20 wk off-season = < 2000 users/yr).
6) Use Type (UT): Record estimates for the types of use the trail receives (including any illegal uses)
using percentages that sum to 100%. These should be provided by the most knowledgeable forest staff member. Categories include: Hiking, Horseback, Vehicle, ATV, Bike, Other (specify).
Starting/Ending Point: Record a brief description of the starting and ending points of the survey. Try to choose identifiable locations like intersections with other trails, roads, or permanent trailhead signs. Measuring Wheel Procedures: At the trail segment starting point, select a random number from 0 to 300. Record this number on the first row of the form. This will be the first sample point, from which all subsequent sample points will be located in 300 ft intervals. This procedure ensures that all points along the trail segment have an equal opportunity of being selected. Once you get to the first sample point, reset the wheel counter and use it to stop at 300 ft intervals thereafter. Push the measuring wheel along the middle of the tread so that it does not bounce or skip in rough terrain. Lift the wheel over logs and larger rocks, adding distance manually where necessary to account for horizontal distances. Your objective is to accurately measure the distance of the primary (most heavily used) trail tread. Monitor the wheel counter and stop every 300 ft to conduct the sampling point measures. If you go over this distance, you can back the wheel up to the correct distance. If the wheel doesn’t allow you to take distance off the counter then stop immediately and conduct your sampling at that point, recording the actual distance from the wheel, not the “missed” distance. If an indicator cannot be assessed, e.g., is “Not Applicable” code the data as -9, code missing data as -1. Rejection of a sample point: Given the survey’s objective there will be rare occasions when you may need to reject a sampling point due to the presence of boulders, tree falls, trail intersections, road-crossings, stream-crossings, bridges or other odd “uncharacteristic” situations. The data collected at sample points should be “representative” of the 150 ft sections of trail on either side of the sample point. Do not relocate a point to avoid longer or common sections of bog bridging, turnpiking, or other trail tread improvements. Use your judgment but be conservative when deciding to relocate a sample point. The point should be relocated by moving forward along the trail an additional 30 ft, this removes the bias of subjectively selecting a point. If the new point is still problematic then add another 30 ft, and so on. 7) Distance: In the first column record the measuring wheel distance in feet from the beginning of the
trail segment to the sample point. 8) Secondary Treads (ST): Count the number of trails that parallel the main tread at the sample point.
Count all treads regardless of their length. Do not count the main tread. 9) Tread Width (TW): From the sample point, extend a line transect in both directions perpendicular
to the trail tread. Identify the endpoints of this trail tread transect as the most pronounced outer boundary of visually obvious human disturbance created by trail use (not trail maintenance like vegetation clearing). These boundaries are defined as pronounced changes in ground vegetation height (trampled vs. untrampled), cover, composition, or, when vegetation cover is reduced or absent, as pronounced changes in organic litter (intact vs. pulverized) (see photo illustrations in Figure 1).
- 66 -

The objective is to define the trail tread that receives the majority (>95%) of traffic, selecting the most visually obvious outer boundary that can be most consistently identified by you and future trail surveyors. Include any secondary treads (see #9) within the transect unless there are undisturbed areas between treads (as defined by the tread boundary definition). In this latter case, establish the transect and conduct measurements for the primary tread. Temporarily place stakes at the boundary points. Note: incision and cross-sectional area measures will be taken from this line so it should be unobstructed. If raised up by soil or litter then push down the obstructing materials. If pushed up substantially by rocks or roots then move the line forward along the trail in one-foot increments until you reach a location where the line is unobstructed. Measure and record the length of the transect (the tread width) to the nearest inch (don’t record feet and inches).
10) Maximum Incision, Current Tread (MIC): Stretch the nylon string tightly between the two stakes
that define the tread boundaries - any bowing in the middle will bias your measurements. Position the string so that it can be used as a datum to measure tread incision caused by soil erosion and/or compaction. Note that this string will likely not be “level” (i.e., if a bubble level were placed along it). Measure the maximum incision (nearest 1/4 in: record .25, .5, .75) from the string to the deepest portion of the trail tread. Measure to the surface of the tread's substrate, not the tops of rocks or the surface of mud puddles. Your objective is to record a measure that reflects the maximum amount of soil loss along the transect within the tread boundaries. See Figure 2, noting differences in MIC measures for side-hill vs. non-side-hill trails.
11) Cross-Sectional Area (CSA): On the Cross
Sectional Area form, record the distance from the measuring wheel. Record a 0 in the Area column and skip this procedure if the maximum incision is #1 in. Otherwise complete the following:
• Starting at the left tread boundary, position
beads (or twist ties) along the nylon string so that they are above tread surface locations that, if connected with straight lines, would accurately characterize the tread cross-section (see figure).
Stake
Stake
T2 T3T5
I2 I3 I4I1 I6
T4
I5
T1 T6
Stake
Stake
T2 T3T5
I2 I3 I4I1 I6
T4
I5
T1 T6
• Measure and record the distance to each bead from the
left stake. It’s most efficient (and accurate) to record the cumulative measures from the left stake. Note: if measuring is done as you position the beads you may be able to place them at whole-inch intervals, otherwise record to the nearest 1/4 in.
• Measure (nearest 1/4 in: record .25, .5, .75) each
vertical transect oriented perpendicular (90o) from the line down to the tread surface beginning with the first bead and ending with the other stake (Tn = 0).
• Compute and sum cross-sectional area with the
following formula: Area = (Transect 1 + Transect 2) x Interval x .5 for each row and summed for the total area of soil loss. Note: the author has a computer spreadsheet program that calculates CSA with transect and cumulative interval measures as input. Contact author to obtain a copy. As shown in the adjacent table, the intervals between each bead are calculated after date entry, along with the area of each polygon which are summed for cumulative area.
Transect (in)
Cumulative Interval (in)
Area (in2)
Dist: T1: 4.25 2.5 I1: 2.5 5.31 T2: 7.5 8.75 I2: 6.25 36.72 T3: 9.75 18.5 I3: 9.75 84.09 T4: 6.0 27.0 I4: 8.5 66.94 T5: 2.75 28.25 I4: 1.25 5.47 T6: 0 31.0 I5: 2.75 3.78
202.31
- 67 -

12-22) Tread Condition Characteristics: Along the trail tread width transect, estimate to the nearest 10% (5% where necessary) the aggregate lineal length occupied by any of the mutually exclusive tread surface categories listed below. Be sure that your estimates sum to 100%. Record these on the form by labeling sections of the appropriate row with the relevant code separated by marked vertical lines indicating the appropriate percentage cover for each code.
S-Soil All soil types including sand and organic soils, excluding organic litter unless highly pulverized and in a thin layer or smaller patches over bare soil.
L-Litter Surface organic matter including intact or partially pulverized leaves, needles, or twigs that mostly or entirely cover the tread substrate.
V-Vegetation Live vegetative cover including herbs, grasses, mosses rooted within the tread boundaries. Ignore vegetation hanging in from the sides.
R-Rock Naturally-occurring rock (bedrock, boulders, rocks, cobble, or natural gravel). If rock or native gravel is embedded in the tread soil estimate the percentage of each and record separately.
M-Mud Seasonal or permanently wet and muddy soils that show imbedded foot or hoof prints from previous or current use (omit temporary mud created by a very recent rain). The objective is to include only transect segments that are frequently muddy enough to divert trail users around problem.
G-Gravel Human-placed (imported) gravel.
MG-Muddy Gravel
Muddy human-placed (imported) gravel.
RT-Roots
Exposed tree or shrub roots.
W-Water
Portions of mud-holes with water or water from intercepted seeps or springs.
WO-Wood
Human-placed wood (water bars, bog bridging, cribbing).
O-Other Specify.
23) Gravel Depth (GD): Use a trowel or other implement to dig into the tread so that human-placed
gravel depth can be measured (nearest 1/4 in). 24) Gravel Size Class (GS): Record the size class of human-placed gravel present: 1= <1in, 2= 1-2in,
3= >2in, 4=class 3 and either class 1 and/or class 2. 25) Trail Grade (TG): The two field staff should position themselves at the sample point and 10 ft
upslope along the trail. A clinometer is used to determine the grade (% slope) by sighting and aligning the horizontal line inside the clinometer with a spot on the opposite person at the same height as the first person's eyes. Note the percent grade (right-side scale in clinometer viewfinder) and record.
26) Trail Alignment (TA): Assess the trail’s alignment angle to the prevailing land-form in the vicinity
of the sample point. Sight a compass along the trail from a point about 5ft before the transect to about 5ft past the transect, record the compass azimuth (0-360, not corrected for declination) on the left side of the column (it doesn’t matter which direction along the trail you sight). Next face directly downslope, take and record another compass azimuth - this is the aspect of the local landform. The trail’s alignment angle (<900) can be computed by these two azimuths.
- 68 -

27) Landform Slope (LS): Position two people about 20 ft apart directly up- and down-slope from the sample point. Use a clinometer to obtain the percent slope of the original (pre-trail) landform. On side-hill trails move as far apart as needed to be above the cut-slope and below any fill material.
28) Tread Drainage Feature (TD): Pace, up to 150 ft, to the closest feature in an up-hill direction that is reasonably effective in removing water from the trail tread (e.g., at least 70% of water during a rain event would be diverted off-trail). This may be a human-constructed water bar or drainage dip, a natural feature (e.g., tree root, rock, or dip) or tread outsloping. If the latter, pace to a point where you believe water entering the trail from upslope would travel down and across the trail and miss going past the sample point. Record the paced distance to the nearest foot. Record a 150 if no features are present within 150 ft.
28) Trail Position (TP): Use the descriptions below to determine the trail position of the sampling point.
Record the corresponding letter code in the TP column. R - Ridge: Ridge-top or high plateau position. S - Shoulder: Shoulder just below ridge tops. M - Midslope/Sideslope: Mid-slope positions. F - Foot slope/Toe slope: Foot slope just above valley bottom positions. V - Valley Bottom: Flatter valley bottom terrain. 29) Soil Texture (TX): Follow the field method described by Foth (1990) to determine the soil texture of
the soils in the vicinity of the sample point. Soil texture should not vary substantially along most trails. This assessment should be done at the start of the trail (have some water to use and rinse your hands with). Check the texture without wetting at the sample points and repeat the full method if it appears to have changed.
a) Moisten a sample of soil the size of a golf ball and work it until it’s uniformly moist; squeeze it
out between the thumb and forefinger to try to form a ribbon.
b) First Decision: If the moist soil is: Clay
SiltSandy
Clay
Clay Loams
Loams
Clay
SiltSandy
Clay
Clay Loams
Loams
* Extremely sticky and stiff, it is a clay. * Sticky and stiff to squeeze, it is a clay loam.
* Soft, easy to squeeze, and only slightly sticky, it is a loam.
c) Second decision: Add an adjective to refine the description. If the soil feels: * Very smooth, it is silt or silty (# 3, 6, or 9). * Somewhat gritty, use no adjective (#2, 5, or 8). * Very, very gritty, it is sandy (# 1, 4, or 7).
d) Combine your (b) and (c) determinations to identify and record the proper classification on the form: Clay
SiltSandy
1
2
34
9
10
5 67 8
Clay
SiltSandy
1
2
34
9
10
5 67 8
1 - sandy clay 6 - silty clay loam 2 - clay 7 - sandy loam 3 - silty clay 8 - loam 4 - sandy clay loam 9 - silt loam 5 - clay loam 10 - organic soil
- 69 -

- 70 -
30) Canopy Height (CH): As per guidance in USLE report, record canopy height value. 31) Canopy Cover (CC): As per guidance in USLE report, record canopy percent cover value. 32) Steps (S): As per guidance in USLE report, record value for steps. 33) Onsite Storage (OS): As per guidance in USLE report, record value for onsite storage. Collect all equipment and move onto the next sample point. Be sure to record information on indicators 34 & 35 as you proceed to the next sample point. These indicators are assessed continuously as pre-defined trail tread problems and when found, surveyors record begin and end distances (from the start of the survey) on the Problem Assessment Form. Note: after data entry and before analysis the data for these indicators need to be corrected to add in the 1st randomly selected interval distance so that location data is accurate. In particular, examine any indicators that may begin before and end after the first sample point. Problem Assessment Procedures 34) Soil Erosion (SE): Sections of tread (>10 ft) with soil erosion exceeding 5 in. depth within current tread boundaries. Record beginning and ending distances on the Problem Assessment form. 35) Muddy Soil (MS): Sections of tread (>10 ft) with seasonal or permanently wet and muddy soils that show imbedded foot or hoof prints (>1in). Omit temporary muddiness created from a recent rain. This should generally include any longer mud-holes or treads with running water. The objective is to include only tread segments that are frequently wet or muddy enough to divert trail users around the problem, often leading to an expansion of trail width.

Point Sampling Form
Trail Segment Code Trail Name Surveyors Date Use Level Use Type(s): Horse %, Hiker %, Vehicle %, Bike % Starting/Ending Point:
Dist ST TW MIC Tread Substrate Characteristics GD GS TG TA LS TD TP TX CH CC S OS | . | . | . | . | . | . | . | . | . | . | /
| . | . | . | . | . | . | . | . | . | . | / | . | . | . | . | . | . | . | . | . | . | / | . | . | . | . | . | . | . | . | . | . | / | . | . | . | . | . | . | . | . | . | . | / | . | . | . | . | . | . | . | . | . | . | / | . | . | . | . | . | . | . | . | . | . | / | . | . | . | . | . | . | . | . | . | . | / | . | . | . | . | . | . | . | . | . | . | / | . | . | . | . | . | . | . | . | . | . | / | . | . | . | . | . | . | . | . | . | . | / | . | . | . | . | . | . | . | . | . | . | / | . | . | . | . | . | . | . | . | . | . | / | . | . | . | . | . | . | . | . | . | . | / | . | . | . | . | . | . | . | . | . | . | / | . | . | . | . | . | . | . | . | . | . | / | . | . | . | . | . | . | . | . | . | . | / | . | . | . | . | . | . | . | . | . | . | / | . | . | . | . | . | . | . | . | . | . | / 0 10 20 30 40 50 60 70 80 90 100
Dist = Wheel Distance S=Soil MG=Muddy Gravel GD=Gravel Depth, GS=Gravel Size Class (1-4) ST=Secondary Treads L=Litter RT=Roots TG=Trail Grade TW=Tread Width V=Vegetation W=Water TA=Alignment (Trailo / Landformo) MIC=Max. Incision, Current Tread R=Rock WO=Wood, human placed LS=Landform Slope, TD=Tread Drainage feature M=Mud O=Other (Specify) TP=Trail Posit. (R, S, M, F, V), TX=Texture (1-10) G=Gravel CH=Canopy Height, CC=Canopy Cover, S=Steps, OS=Onsite Storage

Problem Assessment Form Cross Sectional Area Form Trail Segment Code Trail Name
Soil Erosion Muddy Soil
Begin Dist
End Dist
Begin Dist
End Dist
Cross Sectional Area Cross Sectional Area Cross Sectional Area
Transect (in)
Inter- val (in)
Area Transect (in)
Inter- val (in)
Area Transect (in)
Inter- val (in)
Area
Dist.= T1= CI1=

Figure 1. Photographs illustrating different types of boundary determinations. Trail tread boundaries are defined as the most pronounced outer boundary of visually obvious human disturbance created by trail use (not trail maintenance like vegetation clearing). These boundaries are defined as pronounced changes in ground vegetation height (trampled vs. untrampled), cover, composition, or, when vegetation cover is reduced or absent, as pronounced changes in organic litter (intact vs. pulverized). The objective is to define the trail tread that receives the majority (>80%) of traffic, selecting the most visually obvious boundary that can be most consistently identified by you and future trail surveyors. - 73 -
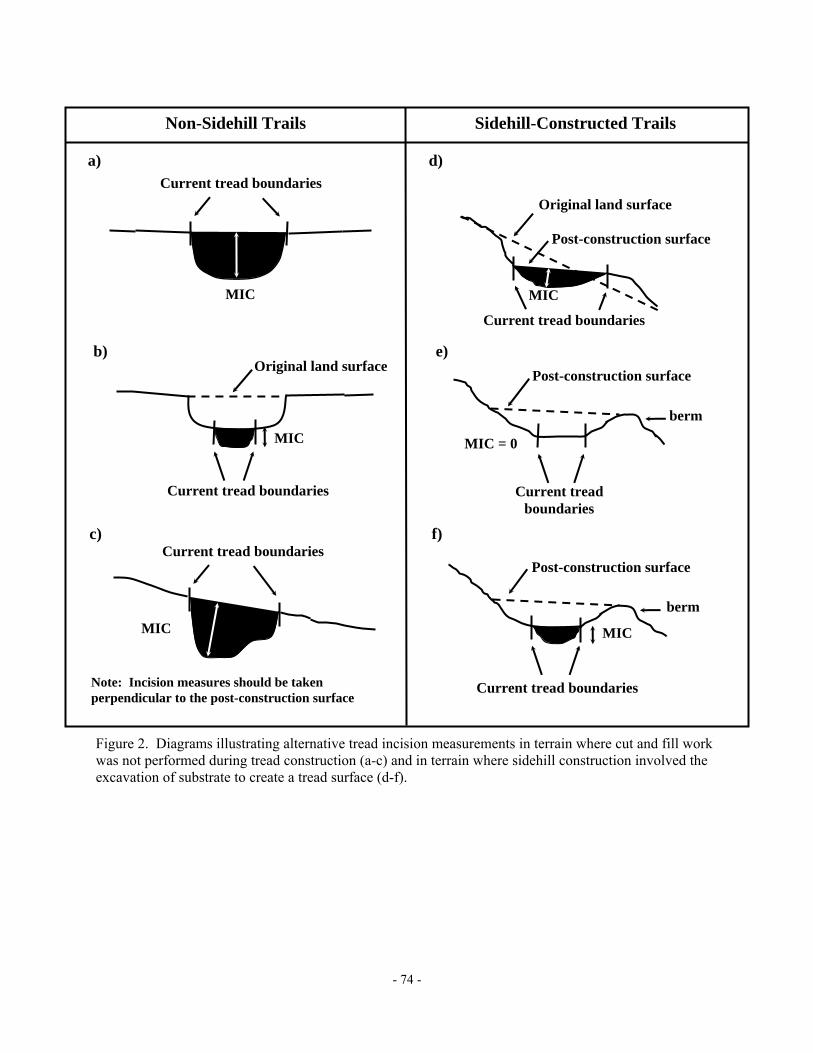
a) Current tread boundaries
MIC
MIC
c) Current tread boundaries
Post-construction surface
berm
MIC = 0
e)
Current tread boundaries
Original land surface
d)
MIC
Sidehill-Constructed Trails Non-Sidehill Trails
Note: Incision measures should be taken perpendicular to the post-construction surface
b)
Current tread boundaries
berm
f)
Post-construction surface
MIC
Original land surface
MIC
Current tread boundaries
Current tread boundaries
Post-construction surface
Figure 2. Diagrams illustrating alternative tread incision measurements in terrain where cut and fill work was not performed during tread construction (a-c) and in terrain where sidehill construction involved the excavation of substrate to create a tread surface (d-f).
- 74 -

Appendix 2. Universal Soil Loss Equation Data Sheet For additional details see Dissmeyer, G.E. and G.R. Foster (1984). A Guide for Predicting Sheet
and Rill Erosion on Forest Land. USDA Forest Service Technical Publication R8 TP 6. 40 p. 1. R (Rainfall and Runoff Index) = __________ See Figure 1, page 3 in the USLE manual 2. K (soil erodibility) = ____________
See page 36 in USLE or Table 15 in Soil Survey 3&4. LS (Slope Length and Steepness) = __________ See Table 1, page 5 or Figure 3, page 6 5&6. CP (Cover - Management Practice Factor for Untilled and Tilled Forest land) To obtain this value you must evaluate the appropriate subset of the 9 subfactors and
multiply them together to get the CP value. If it is inappropriate to evaluate a particular subfactor, assign it a value of 1.0.
CP Subfactors For Untilled CP Subfactors For Roads, Trails or Tilled areas a. Bare soil, & Fine roots = ______ a. Bare Soil, residual binding, soil reconsolidation =_____
Table 3, page 20 Tables 4a-4d, pages 21-22 b. Canopy = _________ b. Canopy = __________
Relates only to canopy Relates only to canopy above above bare soil bare soil See Table 5 on page 23 See Table 5 on page 23
c. Steps = ____________ c. Steps = ____________ See Table 7 on page 24 See Table 7 on page 24 d. Onsite storage = ____________ d. Onsite storage = ____________ See Figure 19 on page 15 See Figure 19 on page 15 e. High OM Content = _________ e. Invading vegetation
Read page 11 See table 6, page 23 f. Contour Tillage See Table 8, page 24
Total CP for Untilled = _________ Total CP for Tilled = __________
Estimated soil erosion = A (tons/acre/year) = RKLSCP A = ___________________________________________________________ tons/acre/year
- 75 -

Appendix 3. Best Management Practices Guide for Trails This Best Management Practices (BMP) Field Guide is based on findings from a study on Hoosier National Forest trails by Virginia Tech. As you complete trail projects please keep the following information in mind. Factors specific to the Hoosier National Forest:
A trail degradation model suggests the following factors are the most important influences on trail erosion: drainage features, graveling, and trail alignment angle. Erosion is best controlled by increasing the construction and maintenance of tread drainage features, adding gravel to trails, and rerouting direct ascent “fall-line” trails.
Unless trails are designed with rolling grade dips or maintained to have outsloped treads, trail drainage features such as water bars or drainage dips are an important deterrent to soil erosion. The density of drainage features should meet or exceed specifications in the Forest Service Handbook (included below).
Moderate and high-use non-graveled trails are significantly more eroded than graveled trails. Application of gravel, combined with periodic grading, can effectively minimize soil erosion on horse trails. See table below for guidance on gravel thickness.
Draining water off trails with a “fall-line” trail slope alignment is exceedingly difficult and they are highly susceptible to erosion. Such trails should be rated high priority for rerouting, particularly on trail grades in excess of 8%.
Recommendations (in priority):
Drainage Structures: Install trail water drainage structures to meet frequency per FSH 2309.18 standards, then maintain regularly to maximize effectiveness. See the following table:
Grade (percent) Material Type 2% 4% 6% 8% 10% 12% 15%
Loam 350’ 150’ 100’ 75’ 50’ 35’ * 25’ *
Angular rock - - 800’ 600’ 400’ 300’ 250’ * Spacing based on local experience. - Generally no diversion required.
- 76 -
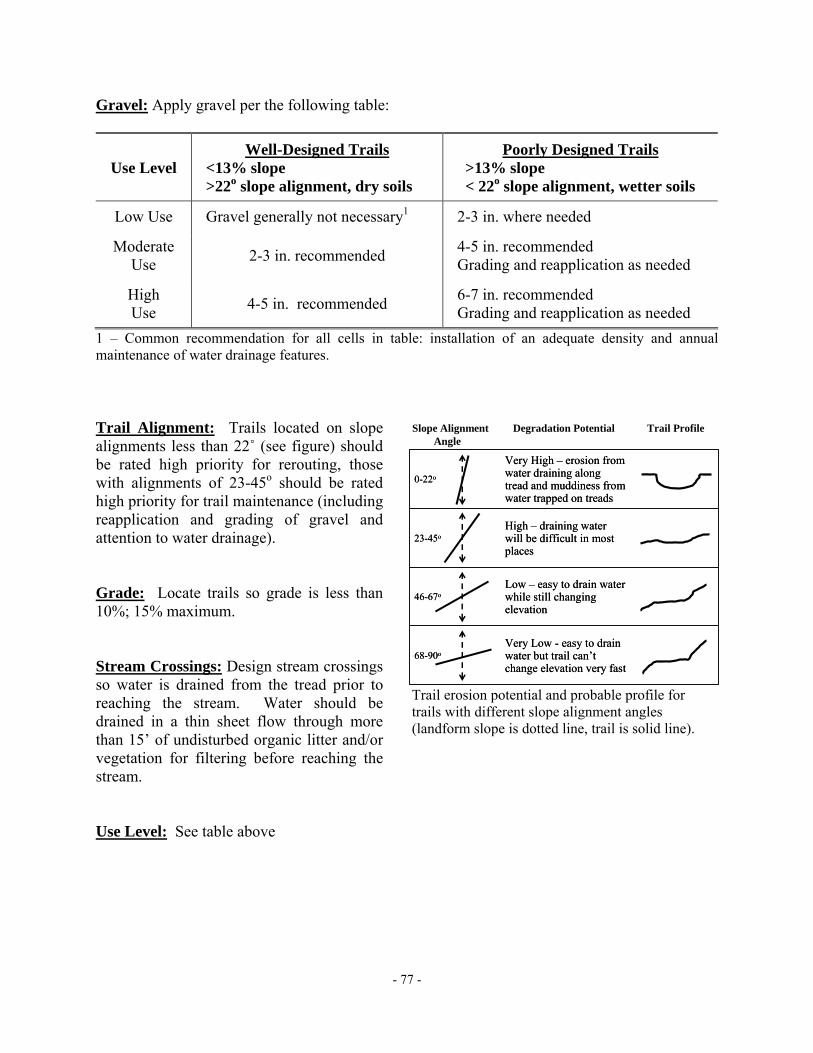
Gravel: Apply gravel per the following table:
Use Level Well-Designed Trails
<13% slope >22o slope alignment, dry soils
Poorly Designed Trails >13% slope < 22o slope alignment, wetter soils
Low Use Gravel generally not necessary1 2-3 in. where needed
Moderate Use 2-3 in. recommended 4-5 in. recommended
Grading and reapplication as needed
High Use 4-5 in. recommended 6-7 in. recommended
Grading and reapplication as needed 1 – Common recommendation for all cells in table: installation of an adequate density and annual maintenance of water drainage features. Trail Alignment: Trails located on slope alignments less than 22˚ (see figure) should be rated high priority for rerouting, those with alignments of 23-45o should be rated high priority for trail maintenance (including reapplication and grading of gravel and attention to water drainage).
Very Low - easy to drain water but trail can’t change elevation very fast
68-90o
Low – easy to drain water while still changing elevation
46-67o
High – draining water will be difficult in most places
23-45o
Very High – erosion from water draining along tread and muddiness from water trapped on treads
0-22o
Slope Alignment Degradation Potential Trail ProfileAngle
Trail erosion potential and probable profile for trails with different slope alignment angles (landform slope is dotted line, trail is solid line).
Grade: Locate trails so grade is less than 10%; 15% maximum.
Stream Crossings: Design stream crossings so water is drained from the tread prior to reaching the stream. Water should be drained in a thin sheet flow through more than 15’ of undisturbed organic litter and/or vegetation for filtering before reaching the stream.
Use Level: See table above
- 77 -

Trail Inspection and Problem Location Form This simplified inspection process is designed for trail inspections by Hoosier National Forest staff. The process does not replace professional judgment, but it does provide a framework that organizes and standardizes typical considerations regarding trail maintenance, location, and remediation. Trail Name and Number _________________________________________ Inspectors Name ________________________________________________ Date _____________ General weather conditions for previous month________________________ 1. General Nature of Problem
a. Point Feature is problem b. Linear section is problem Estimated length of problem _____________ c. GPS coordinate acquired? _______________________________________
2. Recommendation for Traffic a. Allow existing traffic levels to continue _________ b. Restrict traffic levels until maintenance or relocation completed _________ c. Close trail until improvements can be made _______
3. Do problems exist? If yes, what are the principal issues? a. Grade > 15% (measure with clinometer) b. Trail slope alignment angle <23o c. Water control features will require annual maintenance for minimal effectiveness (e.g., culverts
are blocked or rusted, turnouts are filled, broad based dips require reshaping, etc.)
d. Water quality is significantly impaired (e.g., stream bed has obvious sediment loading, stream banks are eroding, etc)
e. Trafficability is limited for intended users (obvious areas where horses have sunk in or slipped) f. Safety considerations are not adequate (areas where riders might encounter slopes sufficient to
cause slipping or where horse and vehicular traffic coincide) g. Erosion is major problem (obvious rill or gully erosion, slumps. or areas having estimated
erosion rates > 10 t/a/y h. Is relocation feasible and cost effective (Sufficient area, ownership, etc)?
If answer is yes to any one principal issue (a-g) and h, then consider relocation. If answer is yes to any two principal issues and h, relocation should be conducted whenever possible. If answer is yes to three or more and h, then relocation should be conducted in near future.
4. Relocation recommended? Yes or No __________________ If relocation is not recommended, then continue to 5, 6, or 7 as appropriate. If relocation is desirable, but not possible or feasible, then continue to 8.
5. General Maintenance Needs a. Clean drainage structures _____ b. Install additional drainage or steps _____ c. Reconstruct drainage _____ d. Reshape trail template _____ e. Fill Ruts _____ f. Add gravel _____ g. Remark trail _____ h. Mow/herbicide trail _____
- 78 -

6. Water control a. Water control is adequate (see attached table) _____ b. Water control is not adequate _____ clean water bars _____ install additional water controls or steps _____ apply gravel or geotextile and gravel _____ apply build and fill boxes _____ install ditches and culverts _____
7. Stream Crossings a. Stream crossings are adequate for traffic and water quality _____ b. Stream crossings are inadequate _____ clean/maintain drainage structures _____ install culvert _____
nstall larger culvert _____ install ford _____ install geotextile ford _____ apply gravel _____ outslope above crossing _____ divert water above crossing _____ move stream crossing _____ install bridge (stringer, prefabricated)
8. Problems that cannot be relocated a. Erosion/slope problem _____ enhance/improve water control _____ armor trail _____ b. Wet soil problem _____ add geotextile and gravel _____ armor _____ enhance drainage _____
9. Equipment needed for maintenance or construction a. Location tools (clinometer, flagging) _____ a. Hand tools (shovel, pulaski, pick, fire-rake, axe, etc.) _____ b. Power hand tools (chainsaw, auger, etc.) _____ c. Small dozer: reconstruct trail template, fill ruts, construct water bars, etc) _____ d. Backhoe: (install culvert, clean water control structures) _____ e. Front end loader (haul gravel, spread gravel, shape trail cuts) _____ f. Excavator (bench cuts, install drainage structures, install crossings, clean structures) _____ g. 4-wd tractor with front end loader, backhoe, and bellymower (general maintenance) _____ h. Gravel transport needed (Dump truck, tracked dump, other ______________)
10. Other Comments Recommended maximum spacing for drainage structures (Forest Service Handbook 1991).
Frequency of Cross Drains (ft) Trail Grade Substrate
2% 4% 6% 8% 10% 12% 15% Loam 350’ 150’ 100’ 75’ 50’ 25’1 10’1
Gravel - - 800’ 600’ 400’ 300’ 250’ 1 – extrapolated value not provided by original reference.
- 79 -

Appendix 4. Worksheet for Estimating Road/Trail Costs Expected costs ranges may not reflect regional costs and should be replaced with actual cost data as it becomes available.
ROAD/TRAIL PLANNING/COST ESTIMATION FORM
General location________________________________ Trail Name ______________________ County/State________________________________________Date_______________ Inspector Name_____________________________________________ 1. What is the current road/trail situation?
An adequate road/trail exists. Stop No road/trail exists. Go to part 2. Road/trail exists, but needs upgrade/repair. Go to 5.
2. Plan for new road/trail (or section of road/trail). Locate the desired road/trail on topomap & attach map. Estimated length of road/trail Traffic (comment on type, quantity, and season) Width of road/trail Maximum desired grade of road/trail Rock type & hardness expected (soil survey) 3. Are perennial stream crossings needed?________ What is the stream width________ Traffic considerations? _________
How many of the following are needed?
Type Quantity Expected cost range/crossing Estimated cost Ford $200-1000 Reinforced ford $500-2000 Culvert (steel or plastic) $200-1500 Portable bridges $2000-8000 Stringer bridges $8000-50000 Other options 4. New Construction costs Length /quantity Expected cost range Estimated costs Easement costs Location and gradeline installation $500-1000/mile Clearing and grubbing $2000-7000/mile Cut & Fill slopes $1500-2500/mile Ditch construction $1200-2000/mile Shape final surface grade $5000-2500/mile Water control broad based dips $15-50/dip water turnouts $10-50/turnout culvert installation & cost $280 installation + pipe Gravel ((LxWxD in ft)x 100)/ 2000 _________tons tons x $/ton Seeding banks $200-500/mile 5. Upgrade-Repair-Maintenance needs for use of existing road Length /quantity Expected cost range Estimated costs Ditch improvement/repair $300-2000/mile Grade road /trail $300-2500/mile Improve water control broad based dips $25-50/dip water turnouts $10-50/turnout culvert installation & cost $280 installation + pipe Add gravel (( LxWxD in ft)x 100)/ 2000 = _________tons tons x $/ton Seeding $300-500/mile 6. Closure costs Length/quantity Expected cost range Estimated costs water bars $15-30/bar disc & seed $400-800/mile gates $500-2000 other 7. Other?
- 80 -TOTAL ESTIMATED COSTS