best environmental management practice in the tourism...
TRANSCRIPT

Best practice 7.6 – Renewable energy sources
Best Environmental Management Practice in THE TOURISM SECTOR
Renewable energy sources
This best practice is an extract from the report Best Environmental
Management Practice in the Tourism Sector.
Find out about other best practices at www.takeagreenstep.eu/BEMP or download the full report at http://susproc.jrc.ec.europa.eu/activities/emas/documents/TourismBEMP.pdf
7.6

Best practice 7.6 – Renewable energy sources
Best Environmental Management Practise in the Tourism Sector 2
7 7.6 Renewable energy sources
Description
After implementation of measures to reduce energy demand, further reductions in primary
energy consumption and associated environmental benefits can be achieved through measures to
increase the supply of renewable energy (RE). Most currently exploited energy sources
ultimately originate from solar energy. In the first instance, passive use of solar energy for
heating through good building design (passive gain through south facing windows in cold
climates) is the first important best practice measure (section 7.2). Active utilisation of RE
sources exploits energy carriers that do not necessitate the depletion of finite reserves, and that
do not release carbon sequestered in fossil resources to the atmosphere where it contributes to
climate change.
The Renewables Directive (2009/28/EC) establishes mandatory national targets for RE shares
consistent with at least a 20 % of energy from renewable sources across the EU in 2020.
Member States must demonstrate implementation of national RE action plans. This target
requires rapid expansion in RE generation from the 1 481 882 GWh produced in the EU-27 in
2006, representing 7 % of final consumption. Latest available data from Eurostat indicate that
RE production rose to 1 643 726 GWh in 2010. Figure 7.35 displays the breakdown of EU-27
RE production in 2006. Biomass and wastes, specifically wood, dominate RE production,
reflecting the compatibility of bioenergy with traditional energy conversion processes (i.e.
supply and combustion of solid fuels).
Source: Eurostat (2009).
Figure 7.35: Contribution of specified sources to total primary RE production in the EU-27
Table 7.30 summarises the main best practice RE options for accommodation. Heat pumps and
geothermal systems utilise renewable aerothermal, hydrothermal and geothermal energy but
require significant amounts of conventional energy (typically electricity) to operate, and are
described separately in section 7.4 as options to reduce energy demand. Less widely applicable
and emerging options not referred to in Table 7.30 include heat and electricity generation from
biogas, and hydro-power. On-site production of biogas is an emerging option for
accommodation enterprises that generate large quantities of organic waste, but only represents
best practice where the organic waste cannot be sent to centralised biogas plants (see section
8.2). Considering the limited availability of biogas as a sustainable transport fuel, use for
decentralised building heating or electricity generation is not considered best practice.
Generation of electricity from small hydro-plants situated on adjacent streams or rivers is a best
practice option for a small number of appropriately sited accommodation enterprises. An
overview of the main RE technologies is provided below.

Best practice 7.6 – Renewable energy sources
Best Environmental Management Practise in the Tourism Sector 3
Table 7.30: Descriptions and applicability of major best practice RE options for accommodation
RE technology Best practice description Applicability
Off-site RE
Where it is not efficient to exploit RE directly on site, the preferred best practice
measure is for accommodation enterprises to invest in RE schemes to install a RE
generating capacity equivalent to that which would be required to supply on-site
demand. An alternative, less rigorous, best practice measure is for accommodations to
purchase 'green' electricity that can be traced to a specific renewable source that is not
accounted for in national average (emission) factors for grid-supplied electricity as per
GHG accounting guidelines provided by BSI (2011).
All accommodation providers.
Biomass heating
The main source of biomass heating is wood or pellet boilers that may be used to heat
water feeding DHW and HVAC systems. The use of gasifying boilers fed by logs also
represents best practice, and is described in section 9.2 for campsites. Best practice
operation of wood boilers involves continuous operation at partial load wherever
possible, in order to minimise emissions to air.
Any accommodation, but best suited to non-urban
areas with a local wood supply and where
combustion emissions pose a lower health risk.
Solar thermal
Flat plate or evacuated tube solar collectors can be placed on accommodation building
roofs or in adjacent areas to heat DHW. Solar thermal water heating is particularly well
suited to accommodation premises where occupancy and peak DHW demand occurs in
summer, coinciding with peak solar irradiance.
Any building with suitable exposure to the sun,
including at mid- to high-latitudes and in cloudy
climates. Potential contribution to DHW heating is
limited for large urban buildings.
Solar photovoltaic
Solar photovoltaic cells can be installed on or integrated with the building envelope – in
particular roofs, exterior walls and shading devices – to generate electricity. Generated
electricity may be used for on-site processes or fed into the grid in order to avail of feed-
in tariffs for solar electricity.
Any building with suitable exposure to the sun (i.e.
not shaded). More effective at lower latitudes and in
sunny climates, but most cost-effective where high
solar feed-in tariffs are available (e.g. Germany).
Wind turbines
Building-mounted wind turbines with a capacity of 1 – 6 kW are an emerging
technology with low electricity outputs and typically poor return on investment
compared with alternative RE options. Therefore, best practice is to install on-site free-
standing turbines of tens to hundreds of kW capacity where space and wind conditions
allow, or to invest in offsite large wind turbines of MWs capacity.
Best practice installation of larger turbines is
restricted to accommodations in open (e.g. rural or
coastal) areas. However, wind turbines are a good
option for green electricity investment by all
accommodation enterprises (see above).

Best practice 7.6 – Renewable energy sources
Best Environmental Management Practise in the Tourism Sector 4
Biomass heat
The most relevant source of biomass heat for accommodations is wood, and the most efficient
conversion pathway is through direct combustion of wood chips or wood pellets in boilers, or
combustion of larger wood pieces in gasifying wood boilers (application of a gasifying wood boiler is
described in section 9.3).
Pellet boilers are highly automated and are well suited to meeting variable load demands. They are
typically rated from 8 – 500 kW (Carbon Trust, 2008) and achieve efficiencies of 85 – 90 %. Pollutant
emissions are lower than for other types of wood boiler owing to precise control of feed rates and
combustion air possible with automated systems and homogenous pellet composition, so that pellet
boilers represent state-of-the-art for solid biomass combustion alongside gasifying boilers. The buffer
capacity of DHW storage tanks facilitate continuous operation at maximum combustion efficiency
with minimum emissions.
Wood chip boilers work on the same principle as pellet boilers, with automated control of chip feed
supply. Whilst boiler operation is similar to pellet boilers, the average heating value and homogeneity
of wood chips is lower than for pellets, resulting in more variable performance and slightly lower
efficiency. Wood chip boilers usually incorporate a fuel stoking system whilst pellet boilers use a
simpler pellet metering system, and are better suited to larger applications of 30 – 10 000 kW capacity
(Carbon Trust, 2008). Wood chips are often available at lower cost than pellets, per MJ energy
content, owing to lower processing requirements.
Solar thermal
Solar thermal collectors absorb energy from solar radiation and transfer it to heat water via heat
exchangers. Solar collectors are well suited for installation on accommodation roofs with orientation
from 90 º to 270 º from north (180 º – due south – is optimum), and peak output in summer months
may coincide with peak occupancy and therefore DHW demand in many accommodation enterprises.
There are two main types of solar collector:
flat plate collectors that can be built into the roof, transferring 50 % received incident radiation
into heat
evacuated tube collectors that must be mounted on top of the roof, transferring 60 % of
received incident radiation into heat.
Thus evacuated tube collectors produce approximately 20 % more heating energy than flat plate
collectors per m2 of aperture (light entry) area, but actual output is highly site specific. Accor (2007)
suggest that solar collectors can easily cover 40 % of hotel hot water demand.
Solar photovoltaic
Solar photovoltaic (PV) cells are made from layers of semi-conducting materials that generate a direct
current when exposed to light. Solar PV installation has been growing exponentially since the late
1990s, and reached 15.6 GWp installed capacity by 2008, 60 % of which was in Europe (EPIA,
2009). Currently, 90 % of PV cells are made by slicing or growing crystalline silicon, whilst the
remaining 10 % are made using film technology that involves depositing thin layers of photosensitive
materials onto backing materials such as glass, stainless steel or plastic. Solar PV cell performance is
measured according to the percentage of solar energy striking its surface converted into electricity. A
typical commercial solar cell has an efficiency of approximately 15 %, and the main barrier to
increased PV uptake has been capital cost per kW output capacity. Emerging technologies include
concentrated PV cells that use concentrating collectors to increase the output of the expensive
semiconducting PV material, and flexible cells derived from film technology (EPIA, 2011).

Best practice 7.6 – Renewable energy sources
Best Environmental Management Practise in the Tourism Sector 5
Wind
Wind turbines convert the linear motion of air in wind currents to rotary motion in order to drive
electricity generators, usually via large rotors (impellors). Wind turbines range in capacity from small
units with peak rated output of less than 1 kW to stand-alone units with a peak rated output of 7.5
MW and 130 m diameter rotors. The main limiting factors for larger wind turbines are the availability
of sufficient space and sufficient wind speed. Turbines operate from wind speeds of around 4 m/s, but
work best in locations with mean wind speeds of 7m/s or higher (Carbon Trust, 2008).
Achieved environmental benefit
Technology specific GHG avoidance
Figure 7.36 displays primary energy and GHG emission avoidance per kWh useful heat and electricity
output for different RE options. Compared with conventional heating and electricity options, RE
technologies reduce GHG emissions by between 76 % (solar PV) and 97 % (wind turbines). Thus, the
type of energy displaced has a greater influence on primary energy and GHG emission avoidance than
the type of RE option applied.
For example, displacing inefficient direct electric resistance heating with a wood-chip boiler results in
a GHG saving of 0.52 kg CO2 eq. compared with a saving of 0.21 kg CO2 eq. When natural gas
heating is the reference. Primary energy savings range from 1.03 kWh per kWh heat delivered for
wood pellet heating replacing gas heating, to 2.67 kWh per kWh electricity delivered for wind
turbines replacing grid electricity.

Best practice 7.6 – Renewable energy sources
Best Environmental Management Practise in the Tourism Sector 6
NB: Avoided primary energy and GHG emissions are calculated relative to gas heating, oil
heating, electric resistance heating and average grid electricity supply. Assume 90 % boiler
efficiency and 5 % additional emissions from boiler manufacture and maintenance.
Figure 7.36: Lifecycle avoided primary energy consumption (above) and GHG emissions (below) per
kWh useful heat or electricity generated by different RE technologies, relative to
conventional reference heating and electricity options
Accommodation GHG avoidance
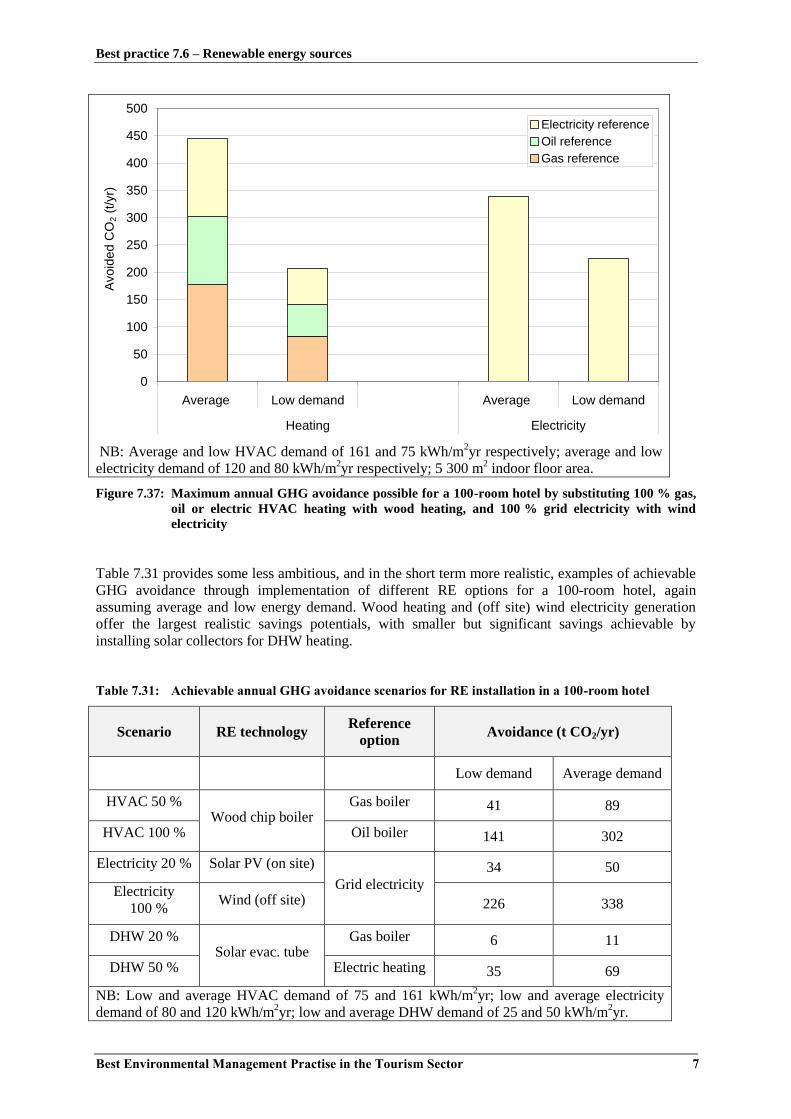
Figure 7.37 provides an example of maximum GHG avoidance achievable through use of RE to
provide 100 % of HVAC (wood chip boiler) and 100 % of electricity (wind turbine) demands for a
100-room hotel with average energy demand and best performance energy demand. Maximum GHG
avoidance for a 100-room average hotel ranges from 516 to 784 t CO2 per year, whilst maximum
GHG avoidance for a low energy demand hotel implementing best practice ranges from 308 to 433 t
CO2 per year.
0.0
0.5
1.0
1.5
2.0
2.5
3.0
Wood chip Wood pellet Solar plate Solar tube Solar PV Wind
Heat Electricity
kW
h p
rim
ary
en
erg
y a
vo
ide
d p
er
kW
h o
utp
ut Gas/oil reference Electricity reference
0.0
0.1
0.2
0.3
0.4
0.5
0.6
Wood chip Wood pellet Solar plate Solar tube Solar PV Wind
Heat Electricity
kg C
O2 a
void
ed p
er
kW
h o
utp
ut
Gas reference Oil reference Electricity reference
Best practice 7.6 – Renewable energy sources
Best Environmental Management Practise in the Tourism Sector 7
NB: Average and low HVAC demand of 161 and 75 kWh/m
2yr respectively; average and low
electricity demand of 120 and 80 kWh/m2yr respectively; 5 300 m
2 indoor floor area.
Figure 7.37: Maximum annual GHG avoidance possible for a 100-room hotel by substituting 100 % gas,
oil or electric HVAC heating with wood heating, and 100 % grid electricity with wind
electricity
Table 7.31 provides some less ambitious, and in the short term more realistic, examples of achievable
GHG avoidance through implementation of different RE options for a 100-room hotel, again
assuming average and low energy demand. Wood heating and (off site) wind electricity generation
offer the largest realistic savings potentials, with smaller but significant savings achievable by
installing solar collectors for DHW heating.
Table 7.31: Achievable annual GHG avoidance scenarios for RE installation in a 100-room hotel
Scenario RE technology Reference
option Avoidance (t CO2/yr)
Low demand Average demand
HVAC 50 % Wood chip boiler
Gas boiler 41 89
HVAC 100 % Oil boiler 141 302
Electricity 20 % Solar PV (on site)
Grid electricity
34 50
Electricity
100 % Wind (off site) 226 338
DHW 20 % Solar evac. tube
Gas boiler 6 11
DHW 50 % Electric heating 35 69
NB: Low and average HVAC demand of 75 and 161 kWh/m2yr; low and average electricity
demand of 80 and 120 kWh/m2yr; low and average DHW demand of 25 and 50 kWh/m
2yr.
0
50
100
150
200
250
300
350
400
450
500
Average Low demand Average Low demand
Heating Electricity
Avo
ide
d C
O2 (
t/yr)
Electricity reference
Oil reference
Gas reference

Best practice 7.6 – Renewable energy sources
Best Environmental Management Practise in the Tourism Sector 8
Appropriate environmental indicator
Off-site RE
The most direct and verifiable way to invest in off-site RE is to do so directly by contributing to RE
schemes. The annual generating capacity of off-site renewable installations directly supported by the
accommodation's investment may be considered equivalent to on-site renewable generation.
Attributing additionality to purchased 'renewable' electricity is a complex task for which a European
methodology is being developed (EPED, 2012). According to the UK Publicly Available
Specification (PAS) 2050 for the calculation of GHG emissions of goods and services (BSI, 2011),
off-site RE generation can only be considered valid if the following conditions can be demonstrated:
off-site energy generation is of the same form (e.g. heat or electricity) as that used on-site
the generated RE has not been accounted for as RE consumption by another process or
organisation and is excluded from the national average emission factor for electricity
generation.
The PAS 2050 specification is primarily concerned with avoiding double accounting of RE
consumption. However, the requirement for traceability and exclusive accounting of RE consumption
provides a useful indication of additionality. Another potential indicator is that purchased RE should
originate from new capacity, installed within the past e.g. two years.
Therefore, where accommodation enterprises can trace purchased RE to specific generation in
accordance with the above conditions, such energy may be regarded as genuine purchased RE (see the
second benchmark, below).
RE performance
The energy performance of RE technologies can be expressed as primary energy ratios (PERs), and
compared with PERs for conventional energy sources (Table 7.4 in section 7.1) and for heat pump
heating (Table 7.18 in section 7.4).
Lifecycle GHG emissions, expressed per kWh heat or electricity produced, is another environmental
indicator of RE performance that is useful for sustainability reporting. Table 7.32 presents default
PER and lifecycle CO2 burdens for different RE technologies, taken from the GEMIS LCA database.
Table 7.32: Primary energy ratios and lifecycle GHG burdens per kWhth or kWhe delivered energy for
different RE technologies from the GEMIS lifecycle assessment database
Technology / energy carrier PER CO2eq./kWh
Wood chip boiler 0.08 0.028
Wood pellet boiler 0.18 0.056
Flat plate solar collector 0.14 0.046
Vacuum tube solar collector 0.10 0.026
Solar PV 0.48 0.154
Wind turbine 0.03 0.018
Source: GEMIS (2005).
Energy content of wood fuel
In order to calculate on-site energy consumption, and to compare the price per unit energy of
delivered fuel, information on the moisture content of wood fuel delivered for heating should be
known as this is the primary factor affecting the net calorific value energy content of wood (dry value
of 18 MJ/kg). This information can be provided by suppliers, and should be certified for relatively

Best practice 7.6 – Renewable energy sources
Best Environmental Management Practise in the Tourism Sector 9
homogenous and standardised pellets. Table 7.33 provides indicative values for different wood fuel
types.
Table 7.33: Typical moisture and energy contents of supplied wood fuel
Dried logs Dried wood chip Wood pellet
Moisture content (% wet weight) 20 – 25 20 – 30 5 – 12
Energy content (kWh/kg) 3 – 4 2.5 – 3.5 4.8 – 5
Source: Carbon Trust (2008).
Accounting for RE use by heat pumps
According to the Renewable Energy Directive (2009/28/EC), aerothermal, geothermal or
hydrothermal energy captured by heat pumps can be considered renewable and calculated according
to the following formula:
RE = Qfinal x (1 – 1/SPF)
Where Qfinal is the final useful energy delivered by the heat pumps and SPF is the estimated
average seasonal performance factor (HSPF for heating and SEER for cooling in section 7.4).
NB: Only heat pumps for which SPF >1.15 x 1/η shall be taken into account, where η is the
ratio between gross electricity generation and the primary energy consumption for electricity
generation according to the EU average taken from Eurostat.
Renewable energy captured by heat pumps may be included in the share of RE used by
accommodation, where total final energy consumption is recalculated to include the final energy
delivered by the heat pump (Qfinal above). Qfinal may be estimated by multiplying energy consumed by
the heat pump by the SPF calculated by the suppliers or installers. It is important to note that final
energy consumption calculated in this way for accommodation premises using heat pumps will be
considerably higher than final energy consumption calculated as the sum of on-site fuel and electricity
consumption.
Benchmark of excellence
There are no extensive data on shares of RE across accommodation enterprises, but there are some
examples of high shares, especially where geothermal systems are used. Renewable energy shares
may be high where onsite energy consumption is minimised. Considering these factors, the following
benchmark of excellence is proposed:
BM: the equivalent of 50 % of the accommodation's annual energy consumption is
generated by on-site renewable sources, or by verifiably additional off-site RE
sources.
An alternative benchmark of excellence where electricity flows can be accounted for at the necessary
level of disaggregation is:
BM: 100 % of electricity is from traceable renewable electricity sources not already
accounted for by another organisation or in the national electricity average
generating mix, or that is less than two years old.

Best practice 7.6 – Renewable energy sources
Best Environmental Management Practise in the Tourism Sector 10
Cross-media effects
The main cross-media effects and options to mitigate them are summarised for each main RE
technology in Table 7.34 below.
Table 7.34: Cross-media effects for different RE options
Technology Cross-media effects Mitigation options
Wood
boilers
Wood burning emits CO, NOx, hydrocarbons, particles and
soot to air and produces bottom ash for disposal. These
substances indicate incomplete combustion performance, and
occur especially during start-up, shutdown and load
variation. Wood chip boilers typically emit slightly more
polluting gases than pellet boilers owing to lower fuel
homogeneity, but emissions are low compared with other
solid fuel boilers.
CO, hydrocarbons,
soot and black
carbon particles can
be reduced by using
continuously
operating wood chip
or wood pellet
boilers.
Solar
thermal
Production of solar thermal collectors requires energy and
materials, and emits gases such as CO2. The energy
embodied in solar thermal cells is typically paid back within
two to three years of operation depending on site-specific
application, so that energy produced over the remaining ~20
years operating lifetime creates a large positive balance.
Maximise output
through optimised
siting and
installation (e.g.
south orientation),
and ensuring long
operational lifetime.
Solar PV
As with solar collectors, production of solar PV cells requires
energy and materials and emits gases. Owing to lower
conversion efficiencies and more complex production
methods, energy payback times are estimated at three to four
years by against 30-year operating lifetimes (US NREL,
2004). It is expected that energy payback times will be
reduce to approximately one year with anticipated thin-film
technology.
As above.
Wind
turbines
Embodied energy in wind turbines typically represents less
than one year's electricity output over typical operating
lifetimes of 20 years.
Maximise output
through appropriate
siting (e.g. in areas
of high and
consistent wind
speeds).
Operational data
Biomass heating
Wood fuel supplies can vary significantly from one location to another in terms of reliability and cost.
Before installing a wood boiler, it is essential to ascertain the local availability, reliability and price of
wood fuel. Owing to the lower energy density of wood fuel compared with oil, wood boilers require
relatively large fuel storage areas for the chips or pellets, usually at ground or below ground level.
Operational measures to reduce operating emissions from wood boilers are described below.
Combustion efficiency in wood boilers is optimised through air staging (splitting the combustion air
into a primary air flow directly to the flame and a secondary air flow in direction of the combustion
gases) to avoid excess oxygen in the combustion zone and ensure sufficient oxygen above the

Best practice 7.6 – Renewable energy sources
Best Environmental Management Practise in the Tourism Sector 11
combustion zone. Secondary air injection increases the low-temperature outer-flame volume to ensure
full oxidisation of hydrocarbons, black carbon and carbon monoxide following combustion.
Boilers connected to small hot water storage tanks operate under variable load conditions throughout
the day, thereby producing relatively large quantities of partially oxidised compounds. Air and fuel
feeding systems can ensure optimised combustion performance at loads of between 50 – 100 %. The
installation of large hot water storage tanks can enable wood boilers to operate for longer periods at
peak or close to peak load, and reduce the number of start-ups and shut downs during the day, thereby
reducing emissions. Some important information related to wood boilers contained in the technical
report for the buildings and construction sector (EC, 2012) is summarised below.
The EN-standard for automatic biomass boilers with nominal heat output of 50 to 150 kW (EN 303-5)
establishes the emission limits shown in Table 7.35 for pellet boiler class types 1 (worst) to 3 (best).
Table 7.35: EN 303-5 test stand emission limit values for pellet boilers
Class 1 Class 3
Energy efficiency (NCV) 67 + 6 log (QN) 47 + 6 log (QN)
CO emissions (mg/Nm³) 12,500 2,500
PM emissions (mg/Nm³) 200 150
Organic compounds emissions (mg/Nm³) 1,250 80
Source: EC (2009).
Meanwhile, a preparatory study for solid fuel combustion under the Eco-design Directive (EC, 2009)
proposes best performance emission parameters for wood pellet and wood chip boilers that may be
used to guide selection of the most environmentally friendly boilers during procurement (Table 7.36).
Table 7.36: EcoDesign performance indicators for pellet boilers and combined pellet/wood-chip boilers
Pellet Wood Chip
Energy efficiency (NCV) 94 % 92 %
CO emissions (mg/Nm³) 30 30
PM emissions (mg/Nm³) 10 20
NOx emissions (mg/Nm³) 90 90
Organic compounds emissions (mg/Nm³) 1.5 1.5
NB: reference O2 content: 13 % vol..
Source: EC (2009).
Studies have shown that optimising the combustion process can almost completely prevent large
particle emission, but can leader to higher emissions of fine particles (diameter <0.1 µm). Secondary
abatement techniques like electrostatic precipitators and fabric filters are therefore necessary to
minimise emissions of fine particles, and can reduce total PM emission by 50 – 70 %. After-burning
catalysts are available to reduce carbon monoxide and volatile hydrocarbon emissions.
Solar thermal
The heating output from solar collectors is highly dependent on the situation, especially:
annual quantity incident solar radiation (function of latitude, cloud cover, shading)
orientation
tilt angle
temperature difference between heated water and outside air.
Best practice 7.6 – Renewable energy sources
Best Environmental Management Practise in the Tourism Sector 12
Situation specific annual incident solar radiation and heat output can be calculated based on latitude
and local climatic data, planned collector type and installation orientation and tilt. In Switzerland,
south facing collectors can provide over 850 kWh/m2yr of water heating (SPF, 2011). However,
Ecocamping (2010) report that, on average, flat plate collectors installed in Germany can be expected
to generate approximately 350 kWh/m2yr water heating, and evacuated tube collectors approximately
450 kWh/m2yr of water heating (Ecocamping, 2010). South-facing flat plate panels in Seehof
campsite, northern Germany, provided an average of 600 kWh/m2yr of water heating between 2010
and 2011 (see section 9.2).
The ideal situation for solar panels is on a south-facing roof with a tilt angle of 30º to 45º. However,
in typical mid- to high- latitude (40º to 60º N) European situations, output is reduced by just 5 %
when oriented SE or SW, and solar panels function adequately on E- and W- oriented roofs. When
selecting solar collectors, the European Solar Keymark (ESTIF, 2012) provides assurance of
compliance with European standards.
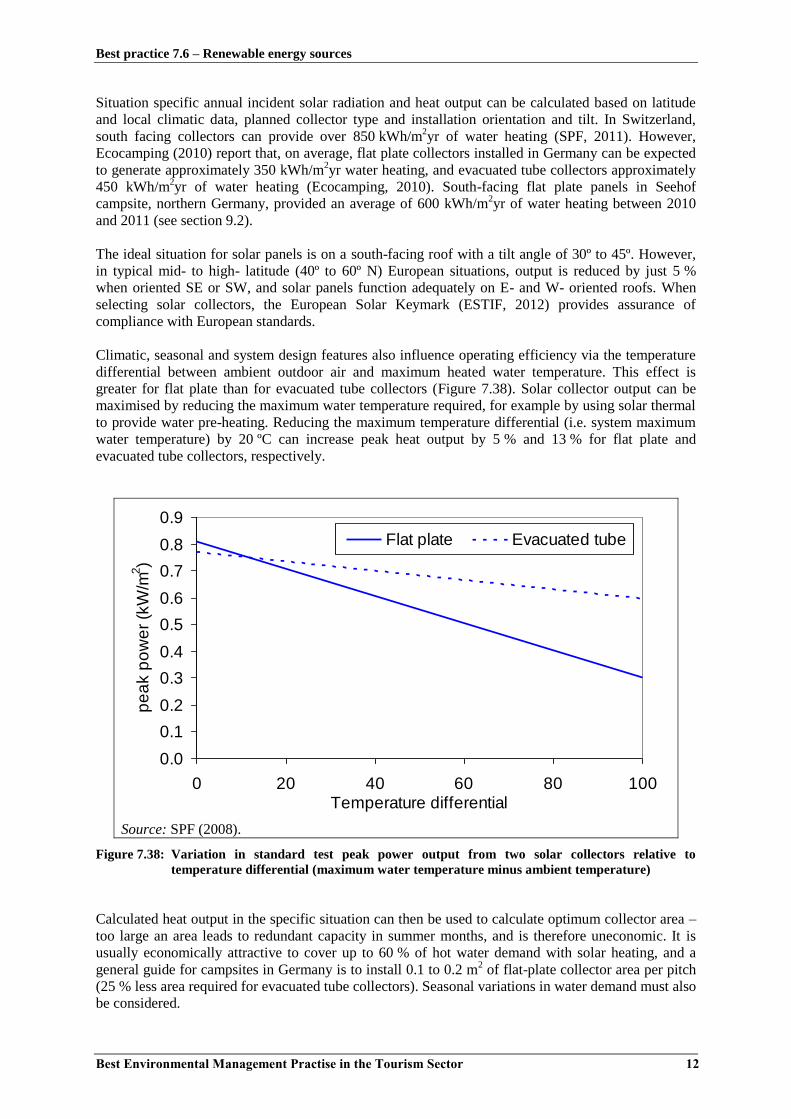
Climatic, seasonal and system design features also influence operating efficiency via the temperature
differential between ambient outdoor air and maximum heated water temperature. This effect is
greater for flat plate than for evacuated tube collectors (Figure 7.38). Solar collector output can be
maximised by reducing the maximum water temperature required, for example by using solar thermal
to provide water pre-heating. Reducing the maximum temperature differential (i.e. system maximum
water temperature) by 20 ºC can increase peak heat output by 5 % and 13 % for flat plate and
evacuated tube collectors, respectively.
Source: SPF (2008).
Figure 7.38: Variation in standard test peak power output from two solar collectors relative to
temperature differential (maximum water temperature minus ambient temperature)
Calculated heat output in the specific situation can then be used to calculate optimum collector area –
too large an area leads to redundant capacity in summer months, and is therefore uneconomic. It is
usually economically attractive to cover up to 60 % of hot water demand with solar heating, and a
general guide for campsites in Germany is to install 0.1 to 0.2 m2 of flat-plate collector area per pitch
(25 % less area required for evacuated tube collectors). Seasonal variations in water demand must also
be considered.
0.0
0.1
0.2
0.3
0.4
0.5
0.6
0.7
0.8
0.9
0 20 40 60 80 100Temperature differential
pe
ak p
ow
er
(kW
/m2)
Flat plate Evacuated tube

Best practice 7.6 – Renewable energy sources
Best Environmental Management Practise in the Tourism Sector 13
Installed hot water storage capacity should be calculated according to the area of solar collectors, and
be at a minimum:
100L per m2 flat-plate collector
133 L per m2 evacuated tube collector (Ecocamping, 2011).
Storage tanks and all pipework should be well insulated. A minimum of 50 mm insulation is
recommended for storage tanks, preferably factory fitted, while pipe insulation should be of a
thickness at least equivalent to the outer diameter of the pipes (SEIA, 2010).
It is important to install an expansion vessel and pressure release valve to protect the solar heating
loop from overheating and excessive pressure during periods of high solar gain. A control system is
required with sensors on the solar collectors and in the water tanks to switch on circulating pumps
when sufficient solar radiation is reaching the collectors and when water requires heating.
Solar PV
Factors affecting output from PV panels are similar to those described above for solar thermal panels.
Aspect and tilt angle are important. In addition, more recent developments in PV cell technology
make it feasible to apply solar PV cells onto vertical façades and shading devices. Cells must be
cleaned at least once per year, more often where there are sources of deposition such as air pollution,
sea spray, or a high concentration of birds, etc.
Wind
The main limiting factors for larger wind turbines are the availability of sufficient space and sufficient
wind speed. Turbines operate from wind speeds of around 4 m/s, but work best in locations with mean
wind speeds of 7 m/s or higher (Carbon Trust, 2008). Figure 7.39 shows the relationship between
wind speed, power output and conversion efficiency (coefficient of performance, Cp) for a large
900 kW turbine (Enercon, 2011).
NB: Wind speed measured at hub height (45 m)
Source: Data from Enercon (2011).
Figure 7.39: Evolution of power output and conversion efficiency (Cp) with wind speed for a 900 kW
turbine
0
100
200
300
400
500
600
700
800
900
1000
1 2 3 4 5 6 7 8 9 10111213141516171819202122232425
Wind speed (m/s)
Po
we
r o
utp
ut (k
W)
0
0.1
0.2
0.3
0.4
0.5
0.6P
ow
er
co
effic
ien
t (C
p)
Power output (kW) Power coefficient (Cp)
Best practice 7.6 – Renewable energy sources
Best Environmental Management Practise in the Tourism Sector 14
In the first instance, indicative information on wind speeds can be obtained from meteorological data
from the nearest weather station, or from national databases such as the BERR/NOABL Wind Speed
Database in the UK (Renewable UK, 2012). However, local topography and buildings can
significantly influence local wind speeds and generate turbulent flow patterns so that site surveys
should be carried out before installation of wind turbines.
The economic viability of installing a wind turbine can be calculated by comparing total investment
costs with annual electricity output and output value (electricity prices and any feed-in tariffs
available), as described under 'Economics'. The annual electricity output from a wind turbine of a
given capacity can be calculated based on the average annual wind speed according to product
performance specifications such as those presented in Figure 7.39 according to the following
equation:
Ea = Ckw x T x Cp
Where Ea is annual electricity output in kWh; Ckw is turbine capacity, in kW, T is time 'online'
expressed as hours per year; Cp is the average coefficient of performance (based on average
wind speed).
Assuming the 900 kW turbine for which output data are displayed in Figure 7.39 is online all year
(8 760 hours) at a site with an average wind speed of 12 m/s (Cp = 0.44), the annual electricity output
would equate to: 900 x 8760 x 0.44 = 36 468 960 kWh, or 36 960 MWh.
Installation of larger wind turbines may require an Environmental Impact Assessment to be carried
out, and potential interference with aviation and telecommunications must be assessed. There are few
maintenance requirements but a service check should be performed at least every two years (Carbon
Trust, 2008).
Applicability
The potential to exploit particular RE resources on site depends on location- and site-specific factors
such as climate, shading, available space, etc., as summarised in Table 7.30. These issues are not
barriers to investment in off-site RE installations, although the opportunities for investment in off-site
RE may depend somewhat on the national prevalence of RE schemes.
Economics
Subsidies
Subsidies may be available for the installation many RE technologies, reducing net installation costs
and payback periods. Such schemes vary across countries. In the UK, the capital cost of many RE
technologies can be offset against tax under the Enhanced Capital Allowance scheme. In some
countries, RE electricity fed into the national grid is eligible for feed-in tariffs significantly above
market electricity prices. These subsidies are referred to for specific RE technologies, below.
Biomass
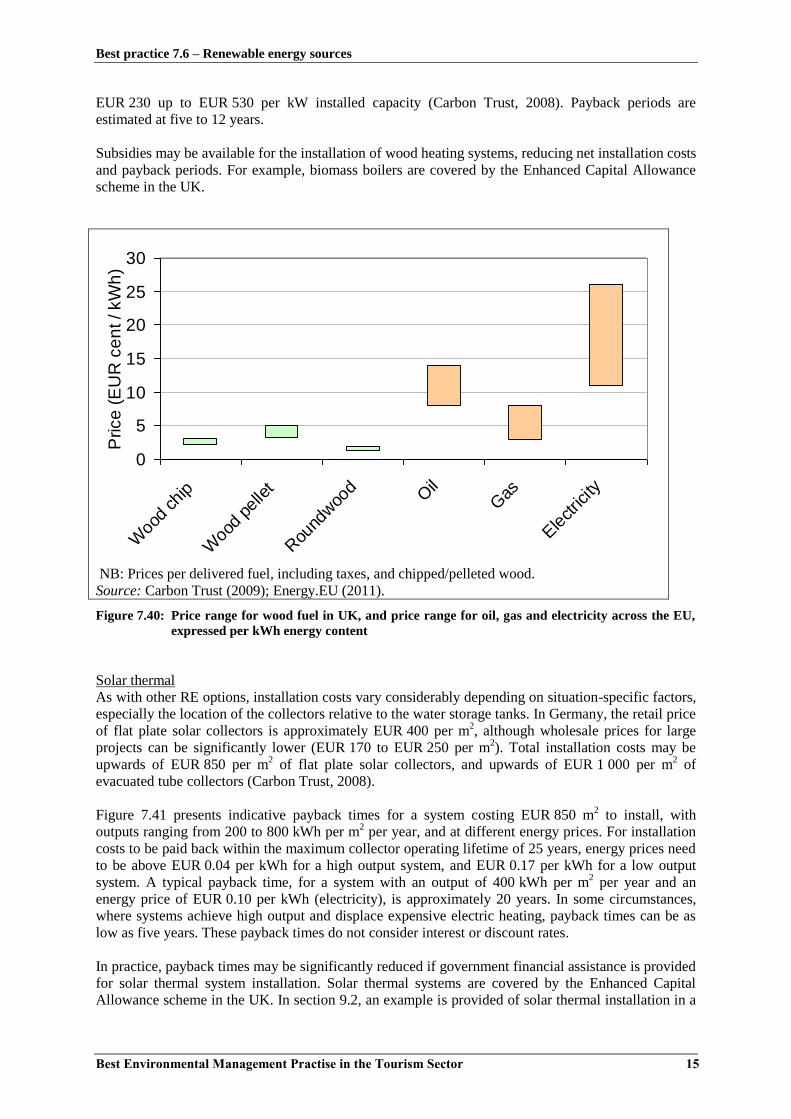
Wood is a relatively cheap fuel although prices vary considerably depending on sources, transport
distance, quantity purchased and preparation, from less than EUR 1.50 per MWh for delivered
roundwood (logs) to over EUR 5 per MWh for delivered pellets (Figure 7.40).
Wood pellet boilers of 125 kW and 250 kW capacities are available for prices of EUR 30 000 to
EUR 45 000 (excl. VAT), respectively. Installation of the complete heating system, including water
storage tanks, approximately doubles the price, leading to total installation costs from approximately
Best practice 7.6 – Renewable energy sources
Best Environmental Management Practise in the Tourism Sector 15
EUR 230 up to EUR 530 per kW installed capacity (Carbon Trust, 2008). Payback periods are
estimated at five to 12 years.
Subsidies may be available for the installation of wood heating systems, reducing net installation costs
and payback periods. For example, biomass boilers are covered by the Enhanced Capital Allowance
scheme in the UK.
NB: Prices per delivered fuel, including taxes, and chipped/pelleted wood.
Source: Carbon Trust (2009); Energy.EU (2011).
Figure 7.40: Price range for wood fuel in UK, and price range for oil, gas and electricity across the EU,
expressed per kWh energy content
Solar thermal
As with other RE options, installation costs vary considerably depending on situation-specific factors,
especially the location of the collectors relative to the water storage tanks. In Germany, the retail price
of flat plate solar collectors is approximately EUR 400 per m2, although wholesale prices for large
projects can be significantly lower (EUR 170 to EUR 250 per m2). Total installation costs may be
upwards of EUR 850 per m2 of flat plate solar collectors, and upwards of EUR 1 000 per m
2 of
evacuated tube collectors (Carbon Trust, 2008).
Figure 7.41 presents indicative payback times for a system costing EUR 850 m2 to install, with
outputs ranging from 200 to 800 kWh per m2 per year, and at different energy prices. For installation
costs to be paid back within the maximum collector operating lifetime of 25 years, energy prices need
to be above EUR 0.04 per kWh for a high output system, and EUR 0.17 per kWh for a low output
system. A typical payback time, for a system with an output of 400 kWh per m2 per year and an
energy price of EUR 0.10 per kWh (electricity), is approximately 20 years. In some circumstances,
where systems achieve high output and displace expensive electric heating, payback times can be as
low as five years. These payback times do not consider interest or discount rates.
In practice, payback times may be significantly reduced if government financial assistance is provided
for solar thermal system installation. Solar thermal systems are covered by the Enhanced Capital
Allowance scheme in the UK. In section 9.2, an example is provided of solar thermal installation in a
0
5
10
15
20
25
30
Woo
d ch
ip
Woo
d pe
llet
Rou
ndwoo
d Oil
Gas
Ele
ctric
ity
Price
(E
UR
ce
nt / kW
h)

Best practice 7.6 – Renewable energy sources
Best Environmental Management Practise in the Tourism Sector 16
German campsite with an estimated payback time of 10 years compared with gas heating owing to the
availability of a government subsidy for installation.
Figure 7.41: Simple payback time for solar thermal systems at different energy prices and annual
thermal output, assuming an installation cost of EUR 850 per m2
Solar PV
The price of solar PV cells has declined rapidly over recent years. The Carbon Trust (2008) quoted
installation costs of approximately EUR 6 000 to EUR 9 500 per kW capacity, whilst a typical UK
installer quotes installation costs ranging from EUR 2 100 to 3000 per kW installed capacity
depending on system size (South-facing, 2012).
Many countries now implement a feed-in tariff for electricity generated by solar PV electricity. The
value of this tariff in the UK varies depending on installed capacity, from EUR 0.10 to EUR 0.255 per
kWh (Table 7.37), is guaranteed for 25 years at an inflation-indexed rate, and can be claimed whether
the electricity generated is used on site or is exported. Feed-in tariffs provide an additional return on
investment over and above savings made through avoided purchasing of grid electricity.
Based on the above information, assuming electricity output of 850 kWh per kW installed capacity in
the UK, and an electricity price of EUR 0.1 to EUR 0.2 per kWh, payback times of eight to 11 years
are achievable. Solar PV payback times will vary significantly depending on country-specific feed-in
tariffs and electricity prices.
Table 7.37: Feed-in tariff rates for electricity generated by solar PV systems of different capacity in the
UK
System size (kW) 0 – 4 4 – 10 10 – 50 50 – 250 250 – 5 000
FI tariff (EUR/kWh) 0.255 0.198 0.179 0.152 0.10
0
5
10
15
20
25
30
35
40
45
50
0 2 4 6 8 10 12 14 16 18 20
Energy price (EUR cent / kWh)
Sim
ple
payback t
ime (
years
) .
200 kWh/m2/yr
400 kWh/m2/y
600 kWh/m2/yr
800 kWh/m2/yr
Best practice 7.6 – Renewable energy sources
Best Environmental Management Practise in the Tourism Sector 17
Wind
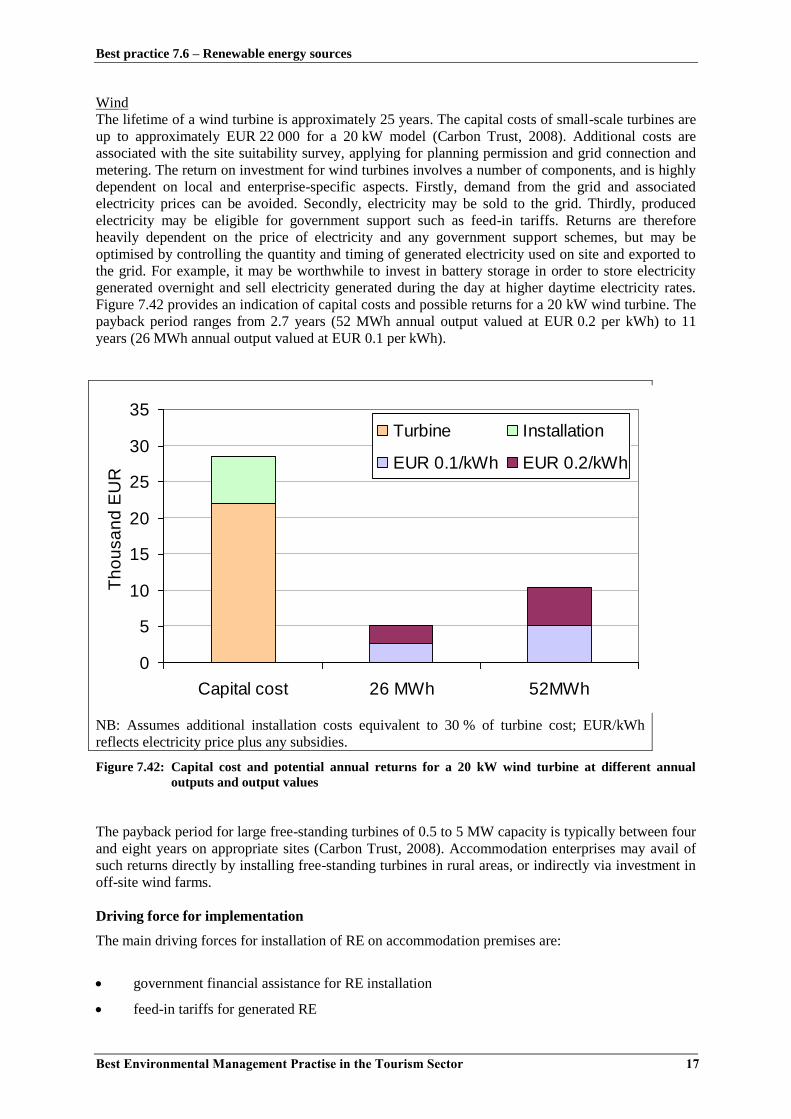
The lifetime of a wind turbine is approximately 25 years. The capital costs of small-scale turbines are
up to approximately EUR 22 000 for a 20 kW model (Carbon Trust, 2008). Additional costs are
associated with the site suitability survey, applying for planning permission and grid connection and
metering. The return on investment for wind turbines involves a number of components, and is highly
dependent on local and enterprise-specific aspects. Firstly, demand from the grid and associated
electricity prices can be avoided. Secondly, electricity may be sold to the grid. Thirdly, produced
electricity may be eligible for government support such as feed-in tariffs. Returns are therefore
heavily dependent on the price of electricity and any government support schemes, but may be
optimised by controlling the quantity and timing of generated electricity used on site and exported to
the grid. For example, it may be worthwhile to invest in battery storage in order to store electricity
generated overnight and sell electricity generated during the day at higher daytime electricity rates.
Figure 7.42 provides an indication of capital costs and possible returns for a 20 kW wind turbine. The
payback period ranges from 2.7 years (52 MWh annual output valued at EUR 0.2 per kWh) to 11
years (26 MWh annual output valued at EUR 0.1 per kWh).
NB: Assumes additional installation costs equivalent to 30 % of turbine cost; EUR/kWh
reflects electricity price plus any subsidies.
Figure 7.42: Capital cost and potential annual returns for a 20 kW wind turbine at different annual
outputs and output values
The payback period for large free-standing turbines of 0.5 to 5 MW capacity is typically between four
and eight years on appropriate sites (Carbon Trust, 2008). Accommodation enterprises may avail of
such returns directly by installing free-standing turbines in rural areas, or indirectly via investment in
off-site wind farms.
Driving force for implementation
The main driving forces for installation of RE on accommodation premises are:
government financial assistance for RE installation
feed-in tariffs for generated RE
0
5
10
15
20
25
30
35
Capital cost 26 MWh 52MWh
Th
ou
sa
nd
EU
R
Turbine Installation
EUR 0.1/kWh EUR 0.2/kWh

Best practice 7.6 – Renewable energy sources
Best Environmental Management Practise in the Tourism Sector 18
GHG emission reduction
corporate social responsibility
to improve business image.
Reference companies
The HES publication 'best Practices Guide – successful RE technologies integration in SME hotels'
(HES, 2011) provides a range of examples of RE applications in accommodation enterprises. Two
additional examples are summarised below, for a large and small accommodation enterprise
respectively.
Crowne Plaza Copenhagen Towers
In addition to the use of geothermal energy for heating and cooling (see section 7.4), the 360-room
Crowne Plaza Copenhagen Towers hotel incorporates ultra-thin solar PV panels on all sunny exterior
surfaces. These generate 200 000 kWh electricity per year, approximately 8 % of on-site electricity
demand.
Huerta Cinco Lunas
Huerta Cinco Lunas is a traditional Andalucian farmhouse ('finca') providing bed and breakfast
accommodation in three rooms. It was renovated using local materials in the traditional style, which
includes small windows and thick walls made of stone and limestone plaster painted white. The high
thermal mass of this design reduces summer daytime temperatures and avoids the need for air
conditioning. All space and water heating is provided by renewable sources, avoiding the use of
propane gas. During summer, energy for heating hot water is provided by 2 m2 on-site solar panels.
During winter (approximately 100 days per year), space and water heating is provided by a wood
pellet boiler that consumes approximately 3 tonnes pellets per year (bought locally in 15 kg sacks at a
total cost of EUR 730 per year). Installation costs were EUR 6 591 for the wood pellet boiler, and
EUR 2 367 for the solar panels. Residual energy requirements for operation of pumps and appliances
average 7 kWh per day, and are supplied by grid electricity (Huerta Cinco Lunas, 2011).
References
Accor, Accor hotels environment charter: practical guide, Accor, 2007, France.
Ardente, F., beccali, G., Cellura, M., Lo Brano, V., Life cycle assessment of a solar thermal
collector: sensitivity analysis, energy and environmental balances, Renewable Energy, Vol. 30
(2005), pp. 109 – 130.
BSI, Specification for the assessment of the life cycle greenhouse gas emissions of goods and
services, BSI, 2011, London. ISBN 978-0-580-71382-8.
Carbon Trust, Making sense of renewable energy technologies: Opportunities for businesses in
Northern Ireland CTG011, Carbon Trust, 2008, London.
Carbon Trust, Biomass heating: A practical guide for potential users, Publication CTG012,
Carbon Trust, 2009, London.
EC, Preparatory Studies for Eco-design Requirements of EuPs(II) – Lot 15 Solid fuel small
combustion installations, EC, 2009, Brussels. Available at: http://www.ecosolidfuel.org/
EC, Directive 2009/28/EC of the European Parliament and of the council of 23 April 2009 on
the promotion of the use of energy from renewable sources and amending and subsequently
repealing Directives 2001/77/EC and 2003/30/EC, OJEU, L 140/16.

Best practice 7.6 – Renewable energy sources
Best Environmental Management Practise in the Tourism Sector 19
EC, Renewables make the difference, EC, 2011, Luxembourg. ISBN 978-92-79-16988-5.
EC, technical report on best environmental management practice in the building and
construction sector, EC IPTS, 2012, Seville. Available at:
http://susproc.jrc.ec.europa.eu/activities/emas/construction.html
Ecocamping, Klimaschutz im Campingunternehmen, Ecocamping, 2010, Konstanz.
Ecocamping, Ecology and Economy in Harmony: How to establish
sustainability on campsites, Ecocamping, 2011, presentation made in Zadar.
Enercon, Enercon Produktübersicht: unsere modelle für Ihnen erfolg, Enercon, 2011, Aurich
Enercon, homepage accessed January 2012: http://www.enercon.de/en-
en/Produktuebersicht.htm
Energy.eu, Europe's Energy Portal fuel price website, accessed October 2011: www.energy.eu/
EPED, European Platform for Electricity Disclosure calculation methodology, webpage
accessed February 2012: http://www.eped.eu/portal/page/portal/EPED_HOME/Methodology
EPIA, European Photovoltaic Industry Association homepage, accessed December 2011:
http://www.epia.org
EPIA, Photovoltaic energy: electricity from the sun, European Photovoltaic Industry
Association, 2009. Available at: http://www.epia.org
ESTIF, CEN Keymark Scheme for Solar Thermal Products, European Solar Therma Industry
Federation webpage accessed May 2012: http://www.estif.org/solarkeymarknew/index.php
Eurostat, Panorama of energy: energy statistics to support EU policies and solutions, EC, 2009,
Luxembourg. ISBN 978-92-79-11151-8.
GEMIS, Global Emission Model for Integrated Systems, Version 4.5 (2005).
HES, Best practices guide – successful renewable energy technologies integration in SME
hotels: Hotel Energy Solutions project publications, HES, 2011. Available at:
http://hes.unwto.org/sites/all/files/docpdf/bestpracticesguide-
successfulrenewableenergytechnologiesintegrationinsmehotels2282011.pdf
Huerta Cinco Lunas, personal communication August 2011.
Renewable UK, UK wind speed database, webpage accessed May 2012:
http://www.renewableuk.com/en/renewable-energy/wind-energy/small-and-medium-scale-
wind/planning-an-installation.cfm
SEAI, Domestic solar systems for hot water: A Consumer Guide, SEAI, 2010, Ireland.
Available at:
http://www.seai.ie/Renewables/Solar_Energy/Domestic_solar_systems_for_hot_water_Consum
er_Guide_2010.pdf
SEAI, Solar benefit calculator, accessed October 2011:
http://www.seai.ie/Renewables/Solar_Energy/Solar_Heating_at_Home/
South-facing, Estimated costs, savings, payments and returns, webpage accessed February
2012: http://www.south-facing.co.uk/feed-in-tariff/the-returns/
SPF, Solar collector factsheet AMK-Collectra OPC 10, SPF, 2008, Rapperswil.
SPF, Solar collector factsheet Ebner P20000, SPF, 2008, Rapperswil.
SPF, Institut für solartechnik homepage, accessed January 2012:
http://www.solarenergy.ch/Home.44.0.html?&L=6

Best practice 7.6 – Renewable energy sources
Best Environmental Management Practise in the Tourism Sector 20
IMPRINT This document is an extract from a Scientific and Policy report by the Joint Research Centre (JRC), the
European Commission’s science and knowledge service. The scientific output expressed does not imply a policy
position of the European Commission. Neither the European Commission nor any person acting on behalf of the
Commission is responsible for the use that might be made of this publication.
Contact information
European Commission - Joint Research Centre - Industrial Leadership and Circular Economy Unit
Address: Calle Inca Garcilaso 3, 41092, Seville, Spain
E-mail: [email protected]
Website: http://susproc.jrc.ec.europa.eu/activities/emas/
JRC Science Hub
https://ec.europa.eu/jrc
The reuse of the document is authorised, provided the source is acknowledged and the original meaning or
message of the texts are not distorted. The European Commission shall not be held liable for any consequences
stemming from the reuse.
How to cite this document
This best practice is an extract from the report Best Environmental Management Practice in the Tourism
Sector to be cited as: Styles D., Schönberger H., Galvez Martos J. L., Best Environmental Management
Practice in the Tourism Sector, EUR 26022 EN, doi:10.2788/33972.
All images © European Union 2017, except: cover image, stock.adobe.com