best available copy - defense technical information … · ad/a-003 012-strength-size relationships...
TRANSCRIPT
AD/A-003 012
-STRENGTH-SIZE RELATIONSHIPS IN CERAMICMATERIALS: INVESTIGATION OF PYROCERAM9606
G. K. Bansal, et al
Battelle Columbus Laboratories
Prepared for:
Office of Naval Research
November 1974
DISTRIBUTED BY:
lftuonl Technical Inwihwi Sm-iceUI. S. DEPARTMENT Di' COMiMERCE
Best Available Copy

Security Classific~ationA - .Q6L
DOCUMENT CONTROL DATA - R & D(Security clessifkreition of title, body of abstroct and Indexing annoto tion must be~ entered when the overall report Is classified)
I.ORIGINATING ACTIVITY (Corporate author) 2a REPORT SECURITY CLASSIFICATION
I Battelle, Columbus Laboratories2bGRP505 King Avenue, Columbus, Ohio, 432C,;
3. REPORT TITLE
Strength-Size Relationships in Cerami~c Materials:Investigatiun of Pyroceram 9606
4. DESCRIPTIVE NOTES (Type of report and inclusive date&)
Technical Report No. 3a. AU THORtS) (Pint* name, middle Initial, lsart name)
Bansal, G. K., Duckworth, W. H., ani Niesz, D. E.
S. REPORT DATE 7a. TOTAL NO OF PAGES 7b. NoO r REFS
November, 1974 ____3+__ 3Wa. coNT7R-Acr OR GRANT NO. 9a. ORIGINATO.RS RE.PORT NUMBER(S)
NOO0l4-73-C-C.O4O8, NR 032-541h. PROJECT No. 3
9h,. OTHIER REPO~RT NO(S) (Any Other numnbers that may be assignedthis report) 2
d.
10. DISTRIBUTION STATEMENT
* Reproduction in whole or in part is permitted for any purpose of
the United States Government.1I. SUPPLEMENTARY NOTES fI2SPONSORIIW.; MILITARY ACTIVITY
Office of Naval ResearchDepartment of Navy
II3. ABSTRACTI
This research was directed to characterizing and explaining strength-size
relationships exhibited by ceramic materials. Precise measurements of the
strength of the commercial glass-ceramic, Corning's Pyroceram 9606, are reported.
Fracture stresses in specimens differing in each linear dimension by a factor
of five were measured at room temperature under carefully controlled conditions NN
which minimized subcritical crack growth. Data obtained were analyzed with the
aid of fractographic examinations to determine applicability of various size-
effect theories. Findings indicated validity of the spurious-effect theory, and
that the strength of Pyroceram 9606 can be described adequately in terms of
stress alone. Maximum tensile stress criteria for failure were determined,
Roproducod by
NATIONAL TECHNICALINFORMATION SERVICE
U S Dapaitmont of CommetceSpfingflold, VA. 22151
DD 1OV651473Security Classification

Security Classification LIKAUK8 1 LN1.KEY WORDS ROWTW ROLE WTOL i
Ceramic Strength Behavior
Size-Strength Relations
Brittle Fracture
Critical Flaw Size
Fracture Energy
Strength Theories A
fa
"Aa
Ucd- -

ABSTRACT
This research was directed to characterizing and explaining
strength-size relationships exhibited by ceramic materials. Precise
measurements of the strength of the commerzial glass-ceramic, Corning's
Pyroceram 9606, are reported. Fracture stresses in specimens differing
in each linear dimension by a factor of five were measured at room
temperature under carefully controlled conditions which minimized sub-
critical crack growth. Data obtained were analyzed with the aid of
fractographic examinations to determine applicability of various size-
effect theories. Findings indicated validity of the spurious-effect
theory, and H the strength of Pyroceram 9606 can be described adequately
in terms of stress alone. Maximum tensile stress criteria for failure
were determined.
I vhiI
! I,
• . • . . . = . .. . ... . . .
STRENGTH-SIZE RELATIONSHIPS IN CERAMIC MATERIALS:K, IINVESTIGATION OF PYROCERAM 9606
by
G. K. Bansal, Winston Duckworth, and D. E. Niesz
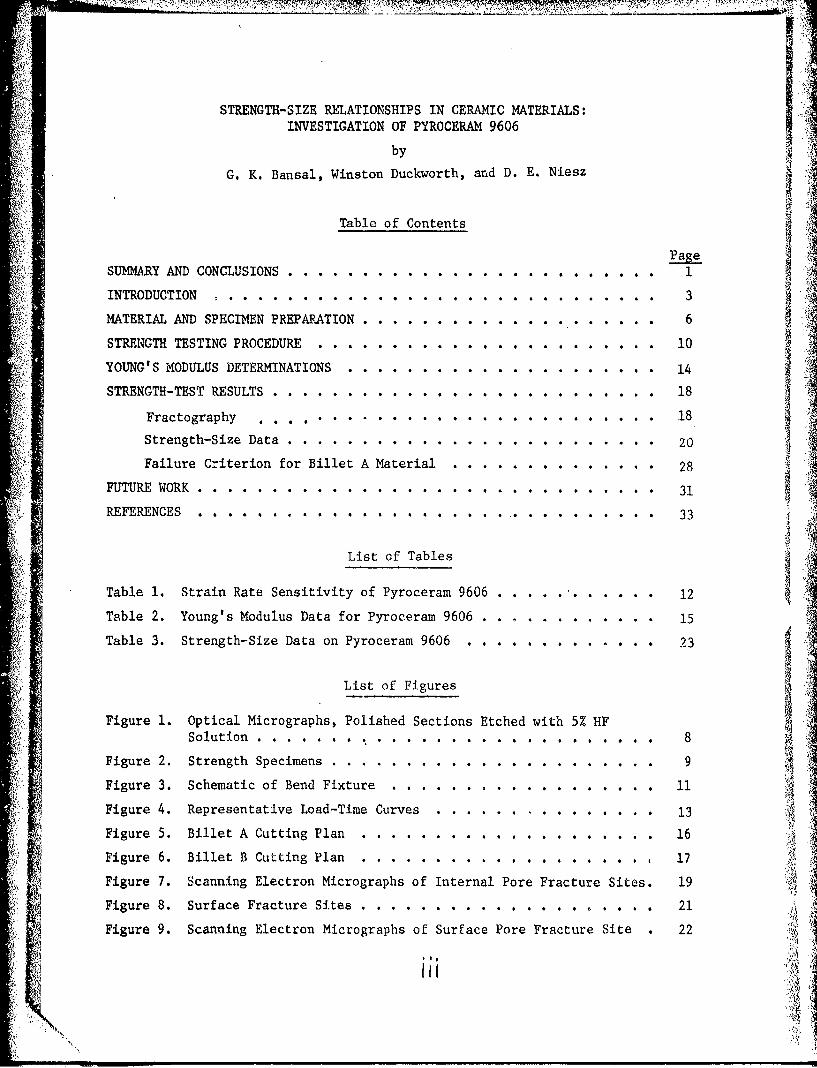
Table of Contents
SUMMARY AND CONCLUSIONS....... ... . . .. . .. .. .. .. .. .. ........ ag
INTRODUCTION . .. .. .. .. .. .. .. .. .. .. .. .. .. . . 3
MATERIAL AND SPECIMEN PREPARATION . .. .. .. .. .. .. .. .. .. .. 6
hSTRENGTH TESTING PROCEDURE....... .. . . .... .. .. .. . . .. .. .. . 10
YOUNG'S MODULUS DETERMINATIONS. .. ...... ............ ........ .......... 14
STRENGTH-TEST RESULTS. .. .. ......... . . . . . .. .. .. .. .. .. 18
Fractography . . .. . .. .. .. .. .. .. ... . . . . . 18
Strength-Size Data. .. ........ . . .. .. .. .. .. .. .. .. 20
Failure Criterion for Billet A Material. .. ........ ................ 28
FUTURE WORK. .. .. ....... . ........ ............ ........ .............. 31
REFERENCES .. .. .. .. .. .. .. .. .. . ..... .. .. .. . .33
List of Tables
Table 1. Strain Rate Sensitivity of Pyroceram 9606 .. ........ .. .. ..... 12
Table 2. Young's Modulus Data for Pyrocerain 9606. .. .......... ......... 15
Table 3. Strength-Size Data on Pyroceram 9606 .. .. .. .. .. ... 23
List of Figures
Figure 1. Optical Micrographs, Polished Sections Etched with 5% HFSolution . . .. . .#. .. .. .. .. .. .... 8al
Figure 2. Strength Specimens .. .. .. ....... . .. .. .. .. .. .... 9
Figure 3. Schematic of Bend Fixture........ ... .. .. .. .. ..... 11
Figure 4. Representative Load-Time Curves .. ......... ........ . . . 13
FigureS5. Billet A Cutting Plan .. ....... . ...... .. .. .. .. .... 16
Figure 6. Billet B Cutting Plan .. ....... . ......... . . . . . . . . 17
Figure 7. Scanning Electron Micrographs of Internal Pore Fracture Sites. 19
Figure 8. Surface Fracture Sites. .. .......... ........... . . . . . . 21
Figure 9. Scanning Electron Micrographs of Surface Pore Fracture Site 22

SUMMARY AND CONCLUSIONS
The uniaxial strength of the glass-ceramic, Corning's Pyroceram
9606, with respect to specimen size has been determined from precise measure-
men ts at room temperature under controlled conditions which minimized i
subcritical crack growth. The measurements coupled with fractographic
examinations revealeu the following:
(1) Fracture originated from tension at either of two sites.,
(a) At the surface in which case fractography was unremarkable.
(b) At an internal pore approximately 80 pm. in diameter.
(2) The critical stress at the fracture site differed depending
on whether fracture was from a surface or pore origin.
(3) For both surface and pore origins, the fracture stress
was independent of specimen size. Specimens differing in
each linear dimension by a factor of five were evaluated.
(4) Material from two billets of Pyroceram 9606 exhibited
4)
different average fracture-stress values, as follows:
Billet A Billet BON
Surface Origin 45.0 ksi 57.1 ksiPore Ori,' 3 35. 8 ksi1 39.5 ksi
We conclude from chese results that a simple maximum tensile stress J
criterion should be ufed to describe the strength of Pyroceram 9606 for
structural design purposes. If the pores were not present, no failure should
be observed when tensile stresses are maintained below the values given above
for surface origins. Elimination of the pores might be accomplished by
processing refinementsh
' A-
2
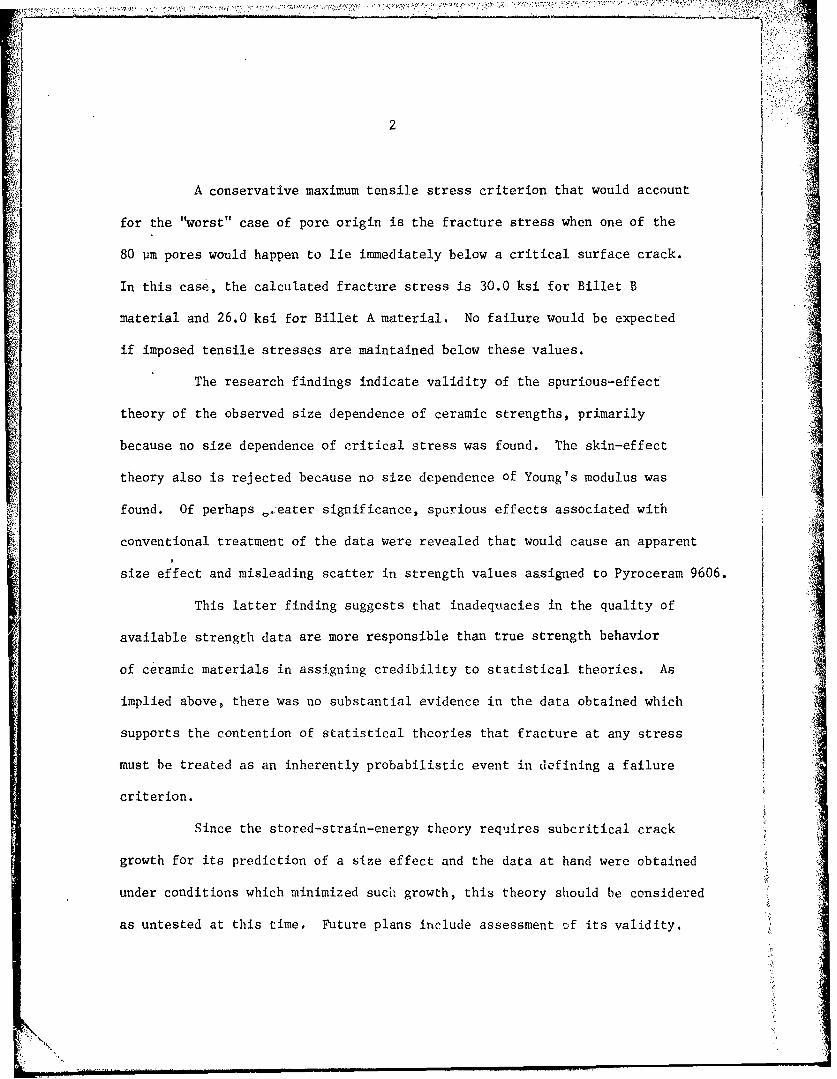
A conservative maximum tensile stress criterion that would account
for the "worst" case of pore origin is the fracture stress when one of the
80 urm pores would happen to lie immediately below a critical surface crack.
In this case, the calculated fracture stress is 30.0 ksi for Billet B
material and 26.0 ksi for Billet A material. No failure would be expected
if imposed tensile stresses are maintained below these values.
The research findings indicate validity of the spurious-effect
theory of the observed size dependence of ceramic strengths, primarily
because no size dependence of critical stress was found. The skin-effect
theory also is rejected because no size dependence of Young's modulus was
found. Of perhaps ,.eater significance, spurious effects associated with
conventional treatment of the data were revealed that would cause an apparent
size effect and misleading scatter in strength values assigned to Pyroceram 9606.
This latter finding suggests that inadequacies in the quality of
available strength data are more responsible than true strength behavior
of ceramic materials in assigning credibility to statistical theories. As
implied above, there was no substantial evidence in the data obtained which
supports the contention of statistical theories that fracture at any stress
must be treated as an inherently probabilistic event in defining a failure
criterion.
Since the stored-strain-energy theory requires subcritical crack
growth for its prediction of a size effect and the data at hand were obtained
under conditions which minimized such growth, this theory should be considered
as untested at this time, Future plans include assessment of its validity.
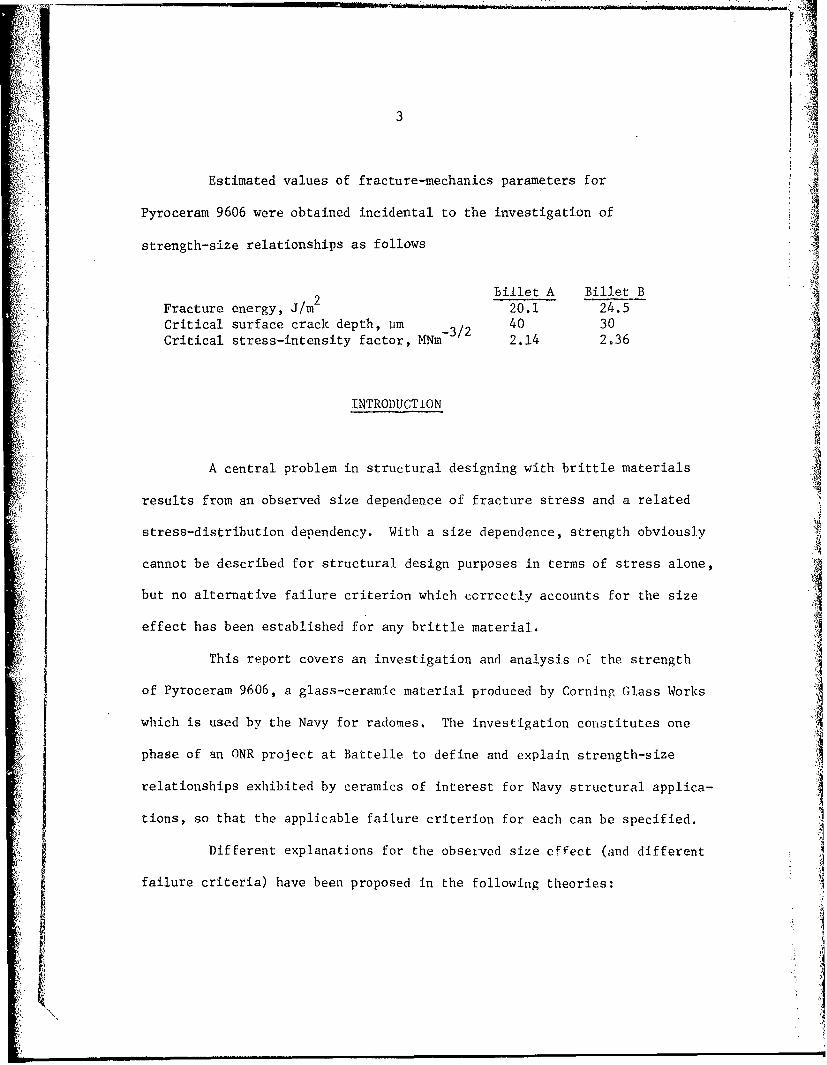
3
Estimated values of fracture-mechanics parameters for
Pyroceram 9606 were obtained incidental to the investigation of
strength-size relationships as follows
2 Billet A Billet BFracture energy, J/m 20.1 24.5Critical surface crack depth, Pm 40 30Critical stress-intensity factor, MNm 2.14 2.36
INTRODUCTION
A central problem in structural designing with brittle materials
results from an observed size dependence of fracture stress and a related
stress-distribution dependency. With a size dependence, strength obviously
cannot be described for structural design purposes in terms of stress alone,
but no alternative failure criterion which correctly accounts for the size
effect has been established for any brittle material.
This report covers an investigation and analysis of the strength
of Pyroceram 9606, a glass-ceramic material produced by Corning Glass Works
which is used by the Navy for radomes. The investigation constitutes one
phase of an ONR project at Battelle to define and explain strength-size
relationships exhibited by ceramics of interest for Navy structural applica-
tions, so that the applicable failure criterion for each can be specified.
Different explanations for the observed size effect (and different
failure criteria) have been proposed in the following theories:
~44
e Spurious-effect theory
a Statistical theories
* Skin-effect theory
* Stored-strain-energy-effect theory.
The project objectives include finding which, if any, of these theories applies
to each selected ceramic.
The spurious-effect theory is often used implicitly in accounting
for variations among reported strengths of a brittle material. According
to this theory, there is no real size effect and observed differences in
strengths from one specimen size to another result from variability in
stress-measurement errors and/or in the specimen material, including its
surface character. The theory suggests that a brittle material would exhibit
a unique value of fracture stress independent of specimen size if these sources
of variability are eliminated.
The widely accepted statistical theories, of which Weibull s(I)
is most prominent, contend that fracture at any stress should be considered
as probabilistic rather than fixed. From this viewpoint, special significance
is attached to the dispersion of values in a single set of strength data--
an 4ntrinsic dispersion is assumed which constitutes, in effect, a strength
characteristic of the material. The theories provide expressions for the
probability of fracture as a function of stress derived on the basis the
material contains a random flaw population and breaks at the most-severe
flaw like a chain at its weakest link. Because there is apt to be a more
severe flaw among the greater number of flaws in a large than a small specimen,
* References are listed on page 33.

5
a size effect is predicted with small specimens appearing stronger. The
strength of a material is characterized from the statistical probability
expressions by empirically determined material pa-ameters, such as
SOus a0 and m in the following Weibull expression:
Pf I -exp -f 0
where: Pf = probability of fracture
V = stressed volume
a = applied stress.
Although less obvious than in the case of the spurious-effect theory, the
statistical theories place extraordinary demands on the quality of strength data.
Values in a set of data must reflect only the assumei intrinsic dispersion
free of effects from lack of control in strength testing or specimen preparation.
In the skin-effect theory, the material is characterized as
a layered composite having a skin of invariant thickness whose Young's modulus
differs from that of the underlying material. The strength of such a composite
will approach the skin strength for very small specimens and the substrate
strength for very large specimens; the relation between strength and specimen
size being derived readily from elementary principles of mechanics. If this
theory is valid, Young's modulus as well as strength is size dependent.
A relatively new theory advanced by Glucklich requires subcritical
crack growth prior to catastrophic fracture, and proposes that the eniergy
consumed in such growth can affect strength to an extent dependent on the
total available stored strain energy. Since strain energy stored in a stressed
S .4

6
specimen is proportional to the specimen volume, higher stress levels
will be required to fracture small than large specimens (i.e., to obtain
the ne'essary condition of sufficient stored strain energy for propagation
of the critical crack). Strain energy is stored in the load train and
the testing machine as well as in the specimen, so specimen size is not
the only factor which might affect measured strengths as a consequence
of subcritical crack growth. Because of the large amount of &tored strain
energy available with dead-weight loading, for example, Giucklich's theory
would predict little size dependence when specimens are loaded in this
manner.
The research efforts described in the pages which tollow were
addressed primarily to the question of whether the strength of Pyroceram
9606 exhibits a real size depencence. Emphasis was placed on precision
in strength measurements and on experimental control in specimen preparation
and tosting. Fractography was utilized for interpreting results.
MATERIAL AND SPF(TMEN PRFPARATIONf
The glass-ceramic material investigated, Corning Glass Works'
Pyroceram 9606, is reported to be made from a magnesium aluminosilicate
glass containing titania as a nucl.eating agent, and cordierite
(2MgO.2AI 203 .530 2) is reported to be the najor crystalline phase in the
material. (4) Two blanks or billets, 5 x 10 x 1-1/4 in., of the material
were prepared specially by Corning for the investigation. Both were cast
from the sa:. glass melt, and in the crystallization process each billet
E fwas subjected to the same heat treatment.

7
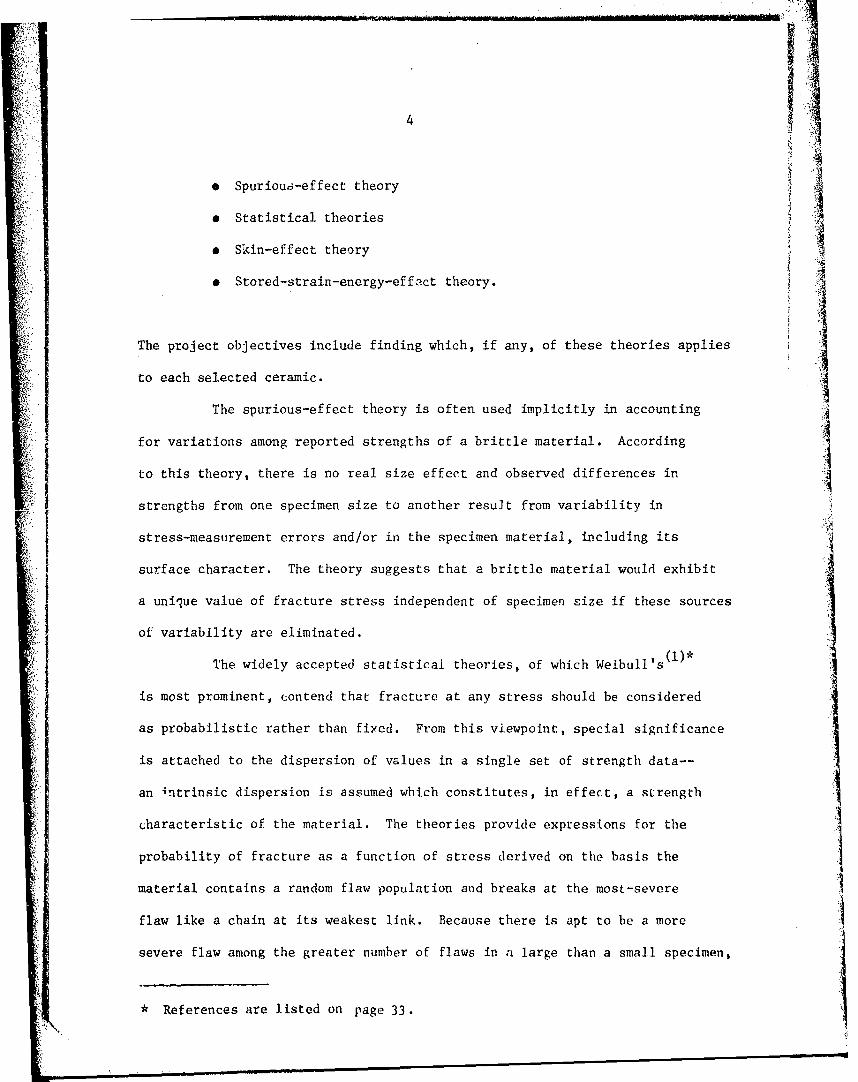
Optical microscopy, however, revealed the two billets had
different microstructures, necessitating separate strength analvyes of
each and limiting the number of replicate specimens for strergt;. deter-
minations. Figure 1 presents micrographs of chemically etched "eactions
from each billet showing a nonuniform microstructure in BiY> . i, and
a relatively uniform microstructure in Billet B. Billet A contained
occasional large crystals which were absent in Billet B,.
The microstructural differences were not reflected in Young's
modulus data, indicating there was little variation in phases present.
Young's modulus values were obtained from a number of bend- and compres-
sion-test specimens from each billet. The maximum variation in these
values was less than two percent. Included were data trom specimens
taken from two orientations within a billet. Measured values of Young's
modulus are reported in a later section; the average value was 16.6 x 10⁶ psi.
The two sizes of specimens sbown in Figure 2 were used for strength
meas'irements. The larger specimen had each linear dimension five times V
that of the smaller one; the volume and area ratios are 125 and 25,
respectively. The billets were diamond cut and ground to obtain these
specimens. Standard diamond sawing techniques using specified infeeds,
table speeds, and coolant were used for cutting. Each specimen was cut
oversize so that approximately 0.05 in. remained for removal from all
surfaces by surface grinding. Coarse grinding was done with a 120-grit,
metal-bonded diamond wheel of T,,pe M'PA-S under the following conditions:
* (0.2 x 0.1 x 1.5 in. and 1.0 x 0.5 x 7.5 in.)
If
8
pm5
U
Billet A Billet B
FIGURE 1. OPTICAL MICROGRAPHS, POLISHED SECTIONSETCHED WITH 5% HF SOLUTION
.•N.

FT(;URE 2 STRENG~L'u SPECIMENS

F.. 10
Wheel dimensions 7-in. diameter, 1/2 in. wide
Bond depth 1/4 in.
Diamond concentration 100
Wheel speed 5500 rpm
Table speed 1 ft/min
Depth of cut 0.001 in./pass
Cross feed 0.06 in. per table reversal
Coolant Water with rust inhibitor
The final 0.01 in. was removed with a 320-grit diamond wheel using an infeed of
0.0005 in./pass and other conditions as listed above. Edges were rounded
slightly by polishing with 1 Vm diamond paste to eliminate edge-initiated
fractures.
Specimens were degreased in trichloroethyline, washed with detergent,
water, and acetone, and then were dried at 125 C [257 Fl. After drying,
specimens were stored in vacuum until tested.
STRENGTH TESTING PROCEDURE
Strengths were measured in four-point bending. In measuring strengths,
we employed a special bend-test fixture, specimen dimensional ratios, span
lengths, and procedures developed earlier in the project to eliminate spurious
(5)stresses from wedging, unequal moments, twisting, and frictional forces.
By these means, errors in stress measurements were found to be reduced to
the order of 1 percent. Figure 3 is a schematic of the bend-test fixture,

.. ..
'U . . ,
M.&
FIGURE 3. SCILEMATIC OF DEliD FIXTURE
Note: The specimen at A is loaded via the hardened steel rollers, B.
Indlenendently retable hardened steel ways (the lower pair indicated
at C) support the rollers and are free to pivo-t about bearings
one of which is indicated at D. The bearings rest in V-
of the uppec" span relative to the lower span can be adjusted by
me~ans of the screws at F and the variouis elements of the fixture
are located at the onset of the test by rubber bands which are •
!'• ~held in several slots, one being indicated at (.I•
A

12
Stress, a, in the bend specimens was calculated using the
simple beam expression, a Mc/I, where M is the applied moment, c is
the distance to the neutral axis, and I is the cross-sectional moment of
inertia. Error is introduced in stress values obtained from this
expression if the material exhibits nonlinear stress-strain behavior
or different values of Young's modulus in tension and compression.
Pyroceram 9606 was found to exhibit neither in experiments described inSA~
the. next section of the report.
Preliminary bend-strength tests were conducted on small specimens
from an uncharacterized billet of Pyroceram 9606 to establish test conditions
which minimized static fatigue, a phenomenon caused by subcritical crack A
growth. The specimens were tested in dry nitrogen (< 3 ppm water) at each I
of four strain rates. Strength data obtained are summarized in Table 1, I
and representative load-time curves are plotted in Figure 4.
TABLE 1. STRAIN-RATE SENSITIVITY OF PYROCERAM 9606 '4
AeaeCoefficient of i
Cross-head Stress Rate, Fracture Stress, (a)Speed, in./min. ksi/sec ksi(MNm2 ) percent
0.002 0.2 39.4 (272) 1.360.01 1.0 42.8 (295) 1.320.1 10.0 43.0 (296) 2.340.2 20.0 43.1 (297) 2.00
(a) Average of four values in each case.

13
-A
E- 0
* C0
CZ CIYL
I'PI
QcLO
LI to o 0 00 0 0 0 0 0
0 OD N

14
As shown in Table 1, strengths increased with increasing strain
rate. However, with cross-head speeds between 0.1 and 0.2 in./minute
corresponding to 10,000 and 20,000 psi/second, no appreciable increase
in strength was observed. Therefore, a cross-head speed equivalent to
-2""t15,000 psi/second [100 M~m /second] was selected for strength measure-
ments.
YOUNG'S MODULUS DETERMINATIONS
Values of Young's modulus were obtained from direct-compression
tests on specimens of two s~zes, 0.2 x 0.2 x 0.8 and 1.0 x 1.0 x 4.0 in.,
in normal laboratory air at room temperature. Each specimen was loaded
parallel to the length direction, and axial strain in each of its four faces
at midlength was measured with resistance strain gages. The average strain
value from the four gages as a function of applied stress was used to
calculate Young's modulus.
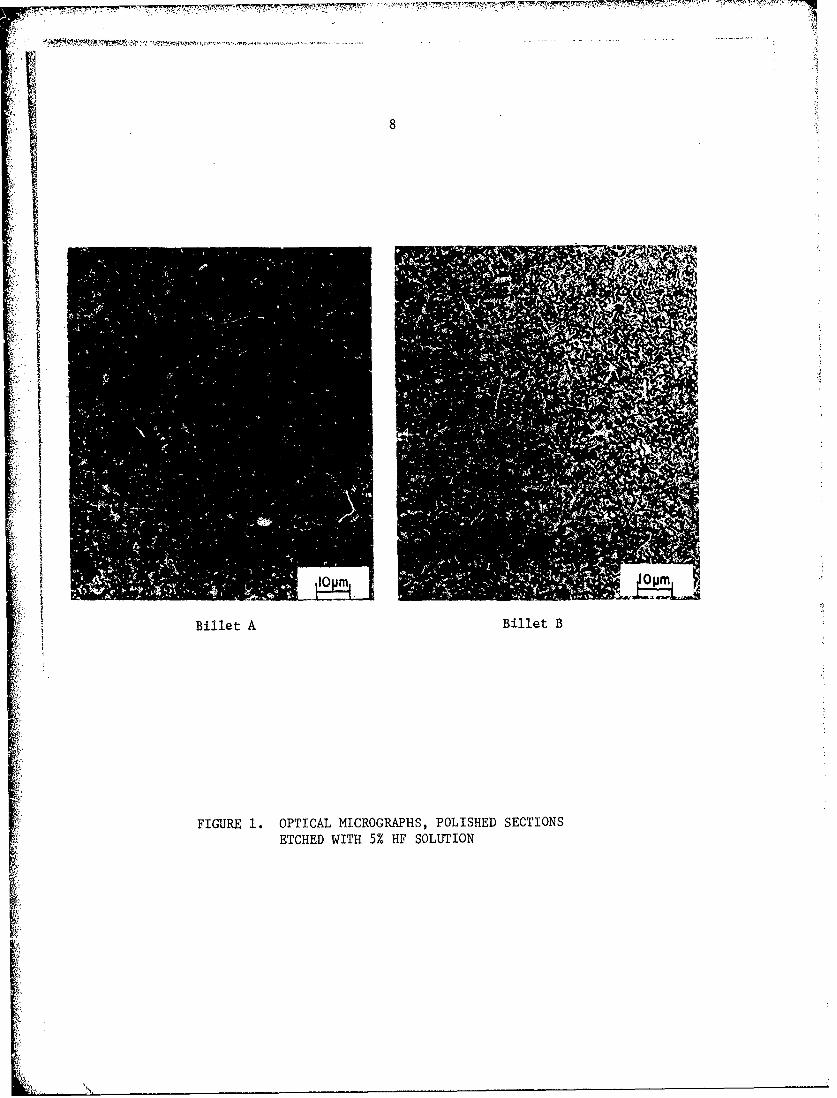
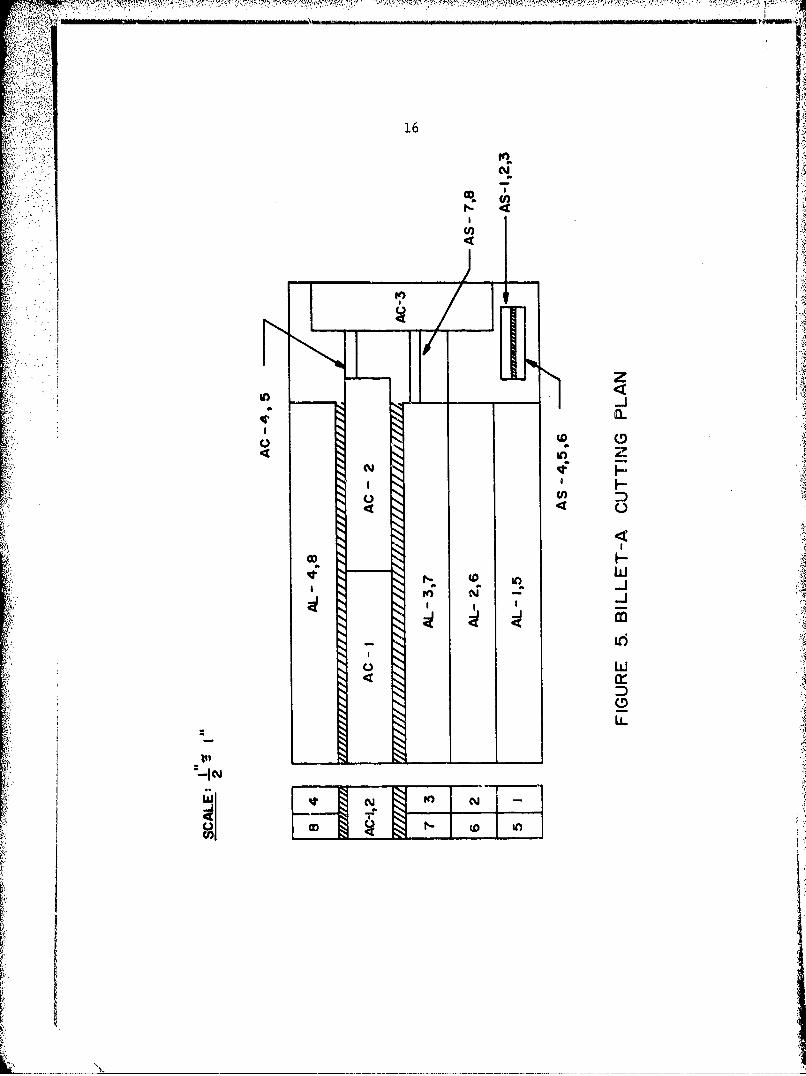
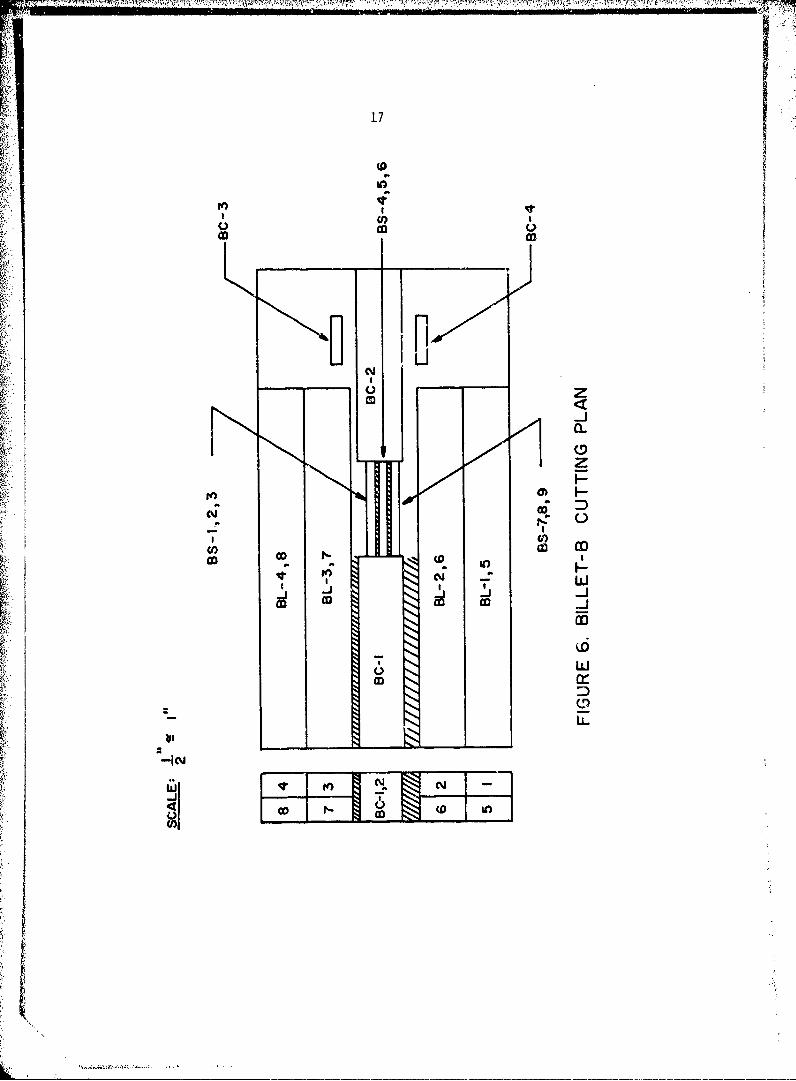
Table 2 gives the values obtained. The billet cutting plans shown
in Figures 5 and 6 give the locations in each billet from which the specimens
in Table 2 were taken.
As mentioned previously, the Young's modulus data indicate no
difference in elastic behavior between the materials in Billets A and B and
in the material within each billet. The data also indicate that Young's
modulus is independent of specimen size. Accordingly, the skin-effect
theory does not appear applicable to Pyroceram 9606.

7~-77
15
7. TABLE 2. YOUNG'S MODULUS DATA FOR PYROCERAM 9606
Specimen Size~, Specimen Young's Modulusinches Identification 106 psi [GNm 2)
BILLET A
* ... Large -1.0 x 1.0 x 4.0 AC-I 16.55
AC-2 16.45
Average 16.50 [113.76]
AC-3 16.59 [115.07]
Small -0.2 x 0.2 x 0.8 AC-4 16.69
AC-5 16.51
Average 16.60 [114.45]
BILLET B
Large -1.0 x 1.0 x 4.0 BC-l 16.54
BC-2 16.62
Average 16.58 [114.32]
Small -0.2 x 0.2 x 0.8 BC-3 16.74
BC-4 16.48
Average 16.61 [114.52]
4~A -16
ODD
i I-
LLI
too'
03DA r- IID t
ve
17
0 C L
to,
OD rJ
to ad
CIOI
U)0 40 LL
ato
OD co
18
Young's modulus also was assessed from data obtained in bend tests
on several specimens. Axial strains in both the tension and compression
surfaces were measured with resistance strain gages as a function of the
applied moment. The curves were linear to failure. Moduli values from
compression-surface strains were within the range of those in Table 2 from
the direct-compression tests. Moduli values from tensile strains were about
1 percent less than those from compressive strains when measured on the
same specimen. As pointed out earlier, these findings indicate that little
or no error is introduced from using the simple beam expression to determine
stresses in bend specimens.
STRENGTH-TEST RESULTS 7A
Fractography
Before presenting the strength-size data, the nature of fracture.
initiation sites found in Pyroceramic 9606 will 1:e described. After strength
testing, each specimen was subjected to fractography using both optical and
scanning electron microscopy.
No differences were found in the nature of fracture-initiation
sites attributable to billet-to-billet variation; the fractographic findings
were similar in specimens from the two billets.
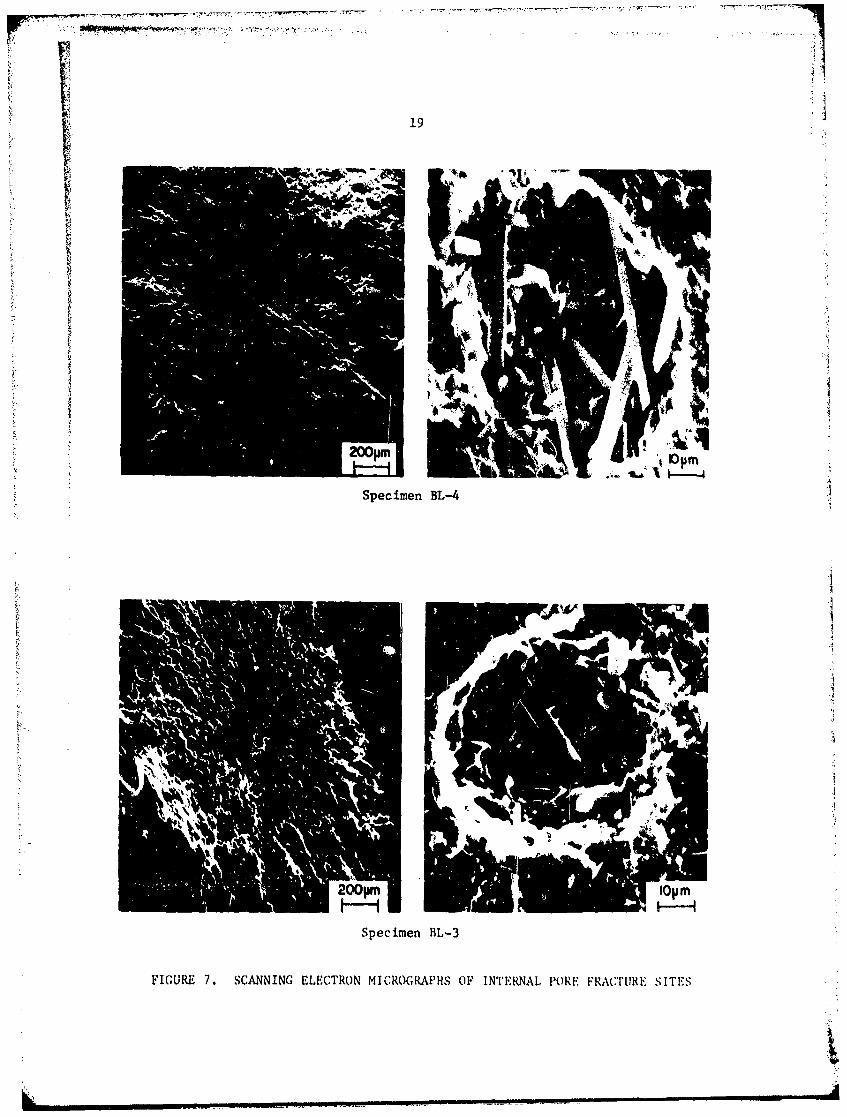
Figure 7 shows fractures originating from subsurface pores
approximately 80 pm in diameter. The maximum stress in specimens which
failed at these pores varied depending on the distance of the pore from the
tensile surface. However, the stress at the pore site at fracture was
,',
12 19
iA
Spec imen BL-4
Specimen BL.-3
FIGURE 7. SCANNING ELECTRON MICROGRAPHS OF INTERNAL. PORE FRACTURE, SITES

20
invariably "'35.8 ksi [247 MNm 2 ] in specimens from Billet A and 'ý'39.5 ksi .
-'2(272 MNm 2 in specimens from Billet B. A fibrous structure was always
associated with these pores. .
Figure 8 shows fracture initiation at the surface where no
obvious flaw was detected. Specimens failing at the surface always had higher i :strengths than those failing at internal pores.
In a few large specimens, edge-initiated failure (Figure 8,
Specimen BL-7) occurred due to insufficient rounding of the specimen edges. 'q
Specimens failing from edges had the lowest fracture stresses observed. The
values were considered spurious and were not used in strength analyses.
Figure 9 shows the fracture surface of Specimen BL-2 which had a
pore 30 Pm in diameter so close to the tensile surface that the ligament
between the pore and the surface fractured prior to catastrophic failure
to produce a surfane flaw slightly larger than the pore diameter.
Strength-Size Data
Table 3 gives the measured strengths of specimens of both sizes !from each billet. The billet cutting plans in Figures 5 and 6 identify the
location from which each specimen was taken. As pointed out earlier, micro-
structures of material in each billet differed, and this is reflected in the
strength levels. Because the waterials were not alike, strength data from
the two billets have been analyzed separately.
The data in Table 3 show that fracture stress was dependent on
whether fracture initiated at the surface or at an internal pore. Most of
the small specimens failed at the surface, while the failure origins in

21
Specimen BS-2
77
Specimen BS-4 Spec imen Bl,-7
Ft(IGURE 8. SURFACE: FRACTUIRE S fTES (SCANNING ELECTRON 'MICROGRAPHISOF SPEIC IMEINS B8-2 arid BS-4 AND) OPT ICAL MICROGRAPHI
OF SPECIMEN bI,-7)

My,
22
lopri
7:
Specimen BL .2 .
FIGURE 9. SCANNING ELECTRON MTCROGRAPHS OFSURFACE PORE FRACTURE SITE

23
TABLE 3. STRENGTH-SIZE DATA ON PYROCERAM 9606
Specimen Stress at Fracture, psi [Mm 2]Identification Fracture Site At Surface At Fracture Site
BILLET A
Small Specimens
AS-i Surface 46,125 [3181 ---AS-2 Surface 45,750 [3151 ---AS-3 Surface 43,690 (301] ---AS:-4 Surface 43,875 [303] ---AS-5 Surface 44,625 [308]AS-6 Surface 42,750 [295] ---AS7 Surface 45,375 [313] ---AS-8 Pore 35,250 [243] 35,000 [241]
Average: Surface 44,600 [308]Coefficient of Variation(Surface) 2.5%
Large Specimens
AL-i Corner 38,650 [266] ---AL-2 Surface 44,450 [306] ---
AL-3 Corner 34,000 [234] ---AL-4 Pore 38,500 [265] 37,500 [259]AL-5 Surface 45,300 [312] ---AL-6 Surface 48,300 [333] ---AL-7 Corner 36,175 [249] ---AL-8 Pore 35,500 [245] 35,000 [241]
Average: Surface 46,000 [317T ---Pore 37,000 [255] 36,250 [250]
BILLET B
Small Specimens
BS-1 Surface 59,050 [407] ---
BS-2 Surface 52,500 [362] ---
BS-3 Surface 58,875 [4061 ---
BS-4 Surface 60,375 [416]BS-5 Pore 47,250 [326] 40,500 [279]BS-6 Surface 58,125 [401] ---
BS-7 Surface 55,125 [380] ---BS-8 Surface 58,500 [403] ABS-9 Surface 56,250 [388] --.
Average: Surface 57,350 [395]Coefficient of Variation (Surface) 4.2%
Large Specimens
BL-1 Surface 54,750 [378] ---BL-2 Surface Pore(a) 55,500 (383] ---BL-3 Pore 42,375 [292] 38,700 [267]BL-4 Pore 45,750 [315] 39,500 (272]ML-5 Surface 57,375 [396] ---BL-6 Corner 38,625 [266] ---BL-7 Corner 34,125 [235] --BL-3 Pore 40,875 (282) 39,300 [271]
Average: Surface 56,060 [387] ---Pore 43,000 [296] 39,170 [270]
(a) Excluded In calculating average.
ý,,A
24
large specimens were about equally distributed between surface and internal
pore sites.
Fracture initiated at the surface in 20 of the 28 specimens whose
strengths were determined. When this occurred, strength appeared to be
independent of specimen size suggesting validity of the spurious-effect
-theory. Average fracture stresses of the large and small specimens
exhibiting surface failures were as follows:
Average Fracture Stress, ksiSpecimen Size Billet A Billet B
Small 44.6 57.4
Large 46.0 56.1
The dispersion of values included in each of the above averages was quite
small. Coefficients of variation were, respectively, 2.5 and 4.2 percent for
7 and 8 small specimens from Billets A and B; for large specimens the maximum
variation of an individual value from the average fracture-stress value was
less than 5 percentb
On the basis of these data, in the absence of pore-initiated failure
a simple maximum tensile stress criterion would adequately define the strength
of Pyroceram 9606 for structural design purposes. Under the particular
conditions of surface finish, strain rate, and environment used, no fracture
should occur when surface tensile stresses are maintained below the following
indicated values:
Billet A-- 45.0 + 1.1 ksi
Billet B -- 57.1 + 1.7 ksii )~(6) :
(95% confidence limits are shown)(

25
The fact that most of the small specimens exhibited surface failures
but about equal numbers of large specimens failed at the surface and internal-
pore sites is attributed to (1) a sparse pore population making it less likely
one will be present in a small specimen and (2) the need for a pore to
reside nearer the surface in a small specimen for it to experience sufficient
stress to compete with potential surface origins under higher stress, the
stress gradient being steeper in the small specimens.
From Table 3, critical tensile stresses at the fracture sites
in the seven specimens exhibiting internal pore origins were as follows:
Fracture Stress, ksiSpecimen Size Billet A Billet B
Small 35.0 40.5Large 37.5, 35.0 38.7, 39.5, 39.3
Within the limits of these data, again there is no evidence of a size effect
nor of much dispersion among individual values, suggesting validity of the
spurious-effect theory. It would appear that regardless of specimen size
fracture occurs when the tensile stress at an internal pore reaches the
following indicated value:
Billet A - 35.8 + 3.6 ksi
Billet B - 39.5 + 1.2 ksi
(95% confidence limits are shown)(6)
Accordingly, a simple maximum tensile stress criterion for strength also
appears applicable to Pyroceram 9606 if the presence of internal pores
must be taken into account.
'. t••, • • '•~': : • ; ?" ':.•••" •h • " •' -";6• ••• ,,' •U •.,'',,•.*.. :. , ,

26
An unobserved situation must be considered, however, In evaluating
this criterion. Specifically, a "most-severe" flaw would be present if one
of the 80-pm pores happened to lie immediately beneath a critical surface
crack. Calculation of the fracture stress for this "worst" condition
requires knowledgeý of the depth of critical surface cracks, and this depth
can be estimated for Billet B material from data provided by Specimen BL-2.
In this singular case, fracture initiated at a pore 30 pm in diameter
located very near the surface (see Figure 9). Specimen BL-2 fractured at
55.5 ksi, while specimens from Billet B failing from a critical surface
crack had an average strength of 57.1 ksi. Assuming that the pore in
Specimen BL-2 acted like a surface crack 32 pm deep in intensifying stress,
the inverse proportionality between strength and square root of crack depth
-1/2(i.e., a c ) would apply and the depth of the critical surface crack
would be
2c -" (55.5/57.1) x 32 30 pm.
Thus, the "worst" condition would be a surface crack 30 + 80 = 110 Pm deep,
and the inverse proportionality relationship gives a stress of about 30 ksi
for fracture from this surface crack. It follows that the conservative
maximum tensile stress criterion is 30 ksl under the conditions or' surface
finish, strain rate, and environment used n these experiments. No failure
would be expected if tensile stress is maintained below this value in a
component of pore-containing Billet B material.
L~...... __

7I
27
A similar approach was used to calculate the critical surface
crack depth and then a "worst" condition fracture stress for Billet A
material. The calculation was more complex than for the Billet B material,
requiring that fracture energies be evaluated, and is described in the following
section of this report. The calculation indicated that the critical surface
crack is 40 um deep making the "worst" condition a surface crack about
40 + 80 120 Pm deep. For a crack this deep in Billet A material,
fracture is calculated to occur at a stress of 26.0 ksi, which provides the
conservative maximum tensile stress criterion for failure.
Our treatment of the data in Table 3 reveals that the strength of
Pyroceram 9606 can be defined adequately in terms of stress alone; i.e.,
specimen size does not affect actual fracture stress. This finding would
have been obscured by spurious effects if conventional strength-testing
practice had been followed. In such practice, the larger Values from surface
origins and the smaller values from internal-pore origins would be averaged
together in assigning a strength value. This strength value would exhibit
a size effect because of the greater frequency of pore-site fractures among
large specimens for reasons given previously, and consequently a lower
strength value would be assigned to the large specimen. Ain off-setting error
also would be present in the strength value because the maximum tensile stress
rather than Zhe actual stress at the fracture site is assessed in conventional
bend testing. The error in each value is proportional to the distance of
the fracture-origin site from the tensile surface, a distance that is a
matter of chance in the case of pore-site failures. The off-setting error,
of course, would occur more frequently in large than small specimens. In
iI
S.,.N -- .
7-77-7 ,.-7'. ..- 6
28
S
addition to an apparent size dependence, these two spurious effects would
cause data from conventional testing to exhibit a misleading dispersion
among individual values. For purposes of academic interest, tabulated below
are strength values reflecting these spurious effects obtained from the data
in Table 3 by following conventional practice:
Strength, ksiSpecimen Size Billet A Billet B
Large 42.4 + 6.5 49.5 + 7.6
Small 43.4 + 2.9 56.2 + 3.2
Notes: (1) Data from specimens exhibiting edge-initiatedfractures are not included in these averagevalues. Had they been, values for largespecimens would be smaller.
(6)(2) 95 percent confidence limits are shown.
It should be noted that the above tabulation shows an unreal size
effect and misleading dispersions in strength values from known spurious
effects even though precise stress measurements were made. In conventional
testing, unknown errors from neglect of superposed stresses (e.g., friction,
wedging, twisting, and unequal moments in bend tests and bending moments in
direct tension tests) are usually present in the data. These errors would
create further distortions in the assigned strength values.
Failure Criterion for Billet A Material
The following generalized Griffith-Orowan expression was used to
calculate the fracture stress in Billet A material for the condition of a
80-um internal pore immediately below a critical surface crack:
... .. . ....... ..

af "": - A(yfE/c) (1)
In using this relationship, A, the geometric factor, is assumed to have a
different value for internal-pore and surface failure origins (A and As),
but to be independent of the material. The fracture energy, Yf, however, is
assumed different for Billet A and B materials, yfA and TfB Young's
6modulus, E, was measured and found to have the same value, 16.6 x 10 psi,
for both materials. The term, c, in the above expression is either the surface
crack depth, cs, or the "effective" radius of an 80-pm internal pore, C,
depending on which was found at the fracture origin. The value of cs, of
course, is different in A and B materials (c and cs), but c is assumed
the same for the observed pore failure origins in both materials since the
pores in the two were indistinguishable.
Data provided by Specimen BL-2 permit a calculation of fractureIt' energy, yfB, for Billet B material, using the following exact form of the
-i•:.-(7)above equation:
2 1/2afB (TrEyf/2cB(l 2)] (2)
where: afB = fracture stress = 55.5 ksi
E Young's modulus 16.6 x 10⁶ psi
C = crack depth 32 pm1 = Poisson's ratio = 0.245
* Value from Corning's Data Sheet on Pyroceram 9606.
N•::o•' : :• : 5•i•-•:::)?;•,•.:.•,,,.:.,:,•., .. ,.. .... ,...••.,'.v • .. • • ,. '•'•• ..... . i

30
The value of fracture energy so obtained is 24.5 J/m2 which is in close
agreement with the value of 22.5 J/m2 measured by McKinney and Smith( 8 )
on precracked specimens of Pyroceram 9606.
Using the value 24.5 J/m 2 for YfB' and the measured values
afA and afB = 35.8 and 39.5 ksi for the internal-pore fracture stresses,
the following relationships are obtained from Equation (1):
Billet B 39.5 A (24.5 x E/cp~l/2VP p
Billet A 35.8 A (y x E/cp fA p
2From these relationships, f 24.5 (35.8/39.5) 20.1 J/m2."!ffThe critical surface crack depth for Billet A material can now be
evaluated from the following relationships also obtained from the
generalized expression, Equation (1), and the measured values, af = 57.1 ksi
and 0fA 45.0 ksi:
Billet B 57.1 A (24.5 x E/30)s
Billet A 45.0 A (20.1 E/CA)l/2s sA
From these relationships, the depth of the critical surface crack in Billet A
material, csA 30 x 20.1/24.5 (57.1/45.0)2 40 0.m.
* In inconsistent units.
L:.

31
The "worst"t condition in A material, therefore, is a surface
crack approximately 40 + 80 120 pm deep. From Equation (2), a surface
crack this deep would result in fracture at a stress of 26.0 ksi.' This value
is considered to be the conservative maximum tensile stress criterion for
failure of Billet A material.
FUTURE WORK
Project plans for the immediate future will feature effort directed
to obtaining similar precise strength data for Pyroceram 9606 under controlled
environmental and strain-rate conditions favoring subcritical crack growth
and with minimum stored strain energy in the loading apparatus, for three
reasons:
(1) The material will be subjected to conditions favoring
sub~critical crack growth in :-.ractical applications.
(2) The surface fracture stress should be lowered, but the
internal pore fracture stress should be unaffected.
Therefore, the presence of pores should become a less
significant factor in strength, and may not require
consideration in developing a fracture criterion for 7
design use.
reasons
i!:: A

32
(3) By maximizing the energy dissipated by the fracture
event relative to the total stored strain energy in
the material, predictions of the stored-strain-energy
theory may hold and a size dependence of strength for
this reason may be observed.
Future plans also include strength measurements in direct tension
and on specimens of smaller size to determine whether the same failure
criterion applies to these extended experimental conditions.
Also, microstructures of Billet A and Billet B materials will
be more thoroughly characterized in an effort to explain the observed
differences in their strength levels.
A similar investigation and analysis of strength-size relations
exhibited by a high-Al 2 03 ceramic has been started and will be completed in
future project work.
V
Kk-4 i

33
REFERENCES
(1). Weibull, W., "A Statistical Theory of the Strength of Materials",Ing. Ventenskaps Akard Handl., No. 151, Stockholm (1939).
(2) Berenbaum, R., and Brodie, I., "Measurements of the Tensile Strengthof Brittle Materials", Brit. J. Appl. Phys., 10, 281-287 (1959).
(3) Glucklich, J., "Strain Energy Size Effect", Jet Propulsion LaboratoryTech. Rep. 32-1438 (August, 1970).
(4) McMillan, P. W., Glass-Ceramics, Academi- Press, London & New York(1964).
(5) Hoagland, R. G., Marschall, C. W., and Duckworth, W. H., Battelle'sColumbus Laboratories, "Reduction of Errors in Ceramic Bend Tests",Tech. Rep. 1, Office of Naval Research, Contract No. N00014-73-C-0408,NR 032-541, (July, 1974).
(6) ASTM Manual on Quality Control of Materials, Special Technical PublicationNo. 15-C (January, 1951).
(7) Davidge, R. W., and Evans, A. G., "The Strength of Ceramics", Mater.Sci. Eng., 6, 281-298 (1970).
(8) McKinney, K. R., and Smith, H. L., "Method of Studying SubcriticalCracking of Opaque Materials", J. Am. Ceram. Soc., 56 (1), 30-32 (1973).
SIi