beryllium window experiment at hiradmat 1 chris densham, 1 tristan davenne, 1 andrew atherton, 1...
TRANSCRIPT
Beryllium window experiment at HiRadMat
1Chris Densham, 1Tristan Davenne, 1Andrew Atherton, 1Otto Caretta, 1Peter Loveridge, 2Patrick Hurh, 2Brian
Hartsell, 2Kavin Ammigan, 3Steve Roberts, 3Viacheslav Kuksenko, 1Michael Fitton, 1Joseph O’Dell, 2Robert Zwaska
1 STFC Rutherford Appleton Laboratory, UK2 Fermilab, US3 Oxford University (Materials for Fission and Fusion Power), UK
Objectives of experimentIdentify design limits for beam windows for the next generation of proton accelerator driven facilities by:
• Exploring the onset of failure modes (flow behaviour, crack initiation, or fracture, and other degradation) of various beryllium grades/forms under controlled conditions at simultaneous high localized strain rates and temperature rises.
• Identifying and quantifying any potential thermal stress wave limits for beryllium windows under intense pulsed beam conditions and how they may differ between grades/forms
• Comparing measurements to non-linear failure simulations for
validation/modification of material models through the use of state-of-the art material analysis techniques
• Investigating the potential effects of resonance, with constructive superposition of stress waves, in windows of particular thicknesses/geometries.
Model Inputs
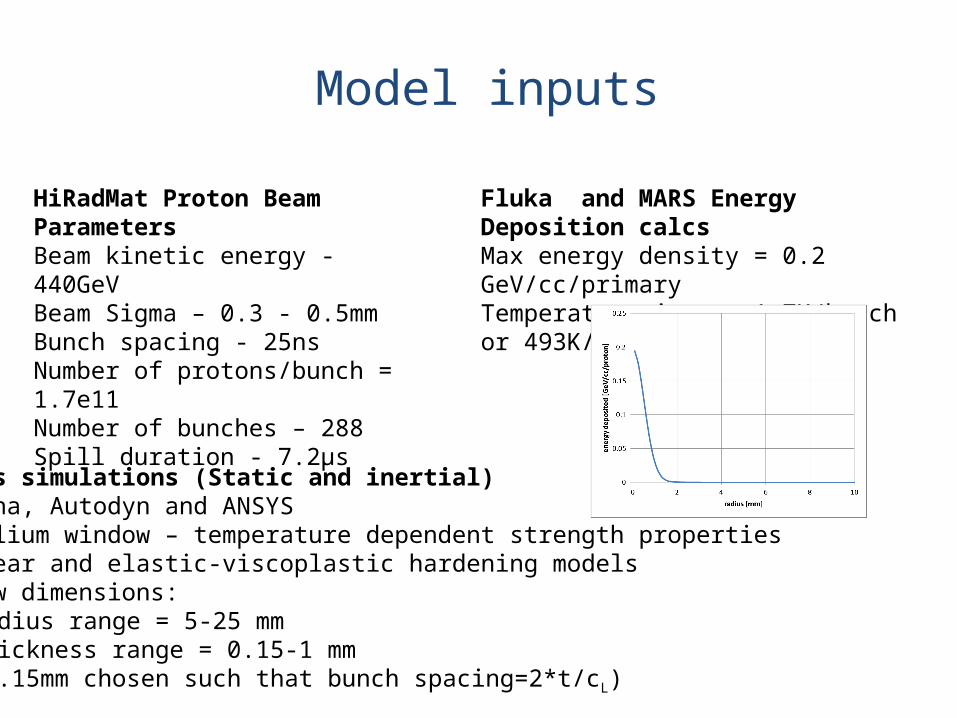
Fluka and MARS Energy Deposition calcsMax energy density = 0.2 GeV/cc/primary Temperature jump = 1.7K/bunch or 493K/spill
HiRadMat Proton Beam ParametersBeam kinetic energy - 440GeVBeam Sigma – 0.3 - 0.5mmBunch spacing - 25nsNumber of protons/bunch = 1.7e11Number of bunches – 288Spill duration - 7.2μs
Stress simulations (Static and inertial)LS-Dyna, Autodyn and ANSYS Beryllium window – temperature dependent strength propertiesBilinear and elastic-viscoplastic hardening models Window dimensions:
Radius range = 5-25 mmThickness range = 0.15-1 mm(0.15mm chosen such that bunch spacing=2*t/cL)
Model inputs
Beryllium Material Data
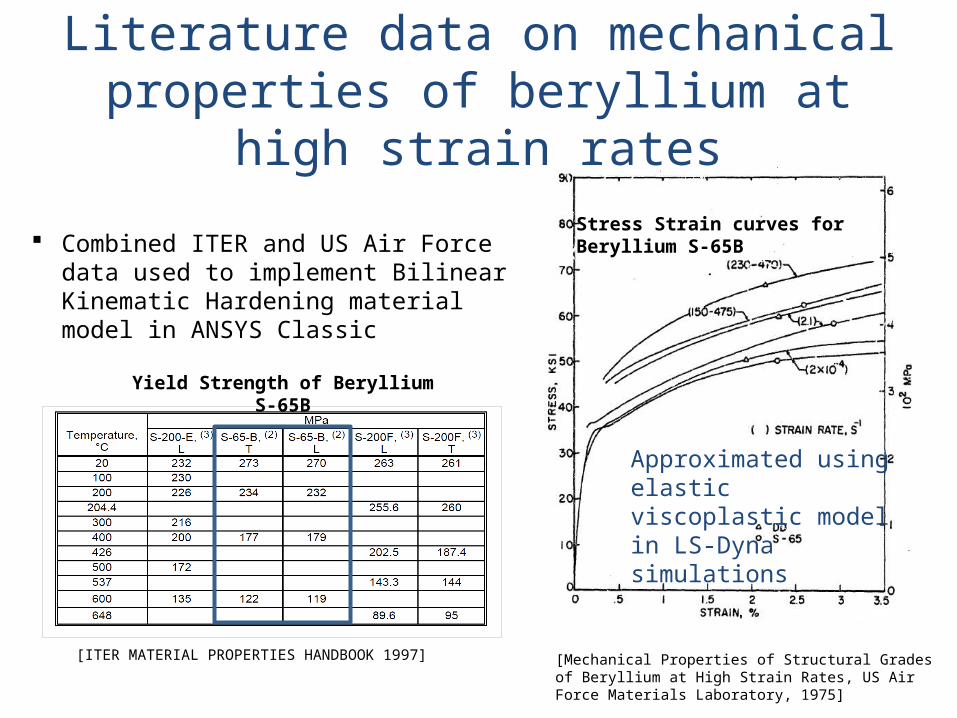
[ITER MATERIAL PROPERTIES HANDBOOK 1997] [Mechanical Properties of Structural Grades of Beryllium at High Strain Rates, US Air Force Materials Laboratory, 1975]
Stress Strain curves for Beryllium S-65B
Yield Strength of Beryllium S-65B
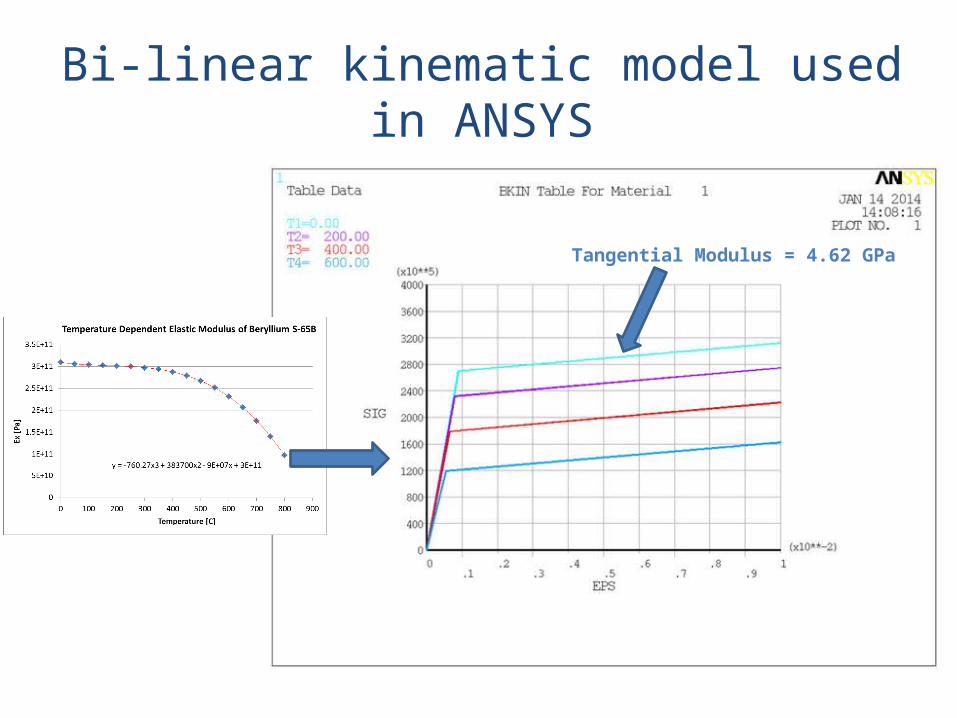
Combined ITER and US Air Force data used to implement Bilinear Kinematic Hardening material model in ANSYS Classic
Literature data on mechanical properties of beryllium at high strain rates
Approximated using elastic viscoplastic model in LS-Dyna simulations
Beryllium Material Data
Tangential Modulus = 4.62 GPa
Bi-linear kinematic model used in ANSYS
Beam Induced Stress
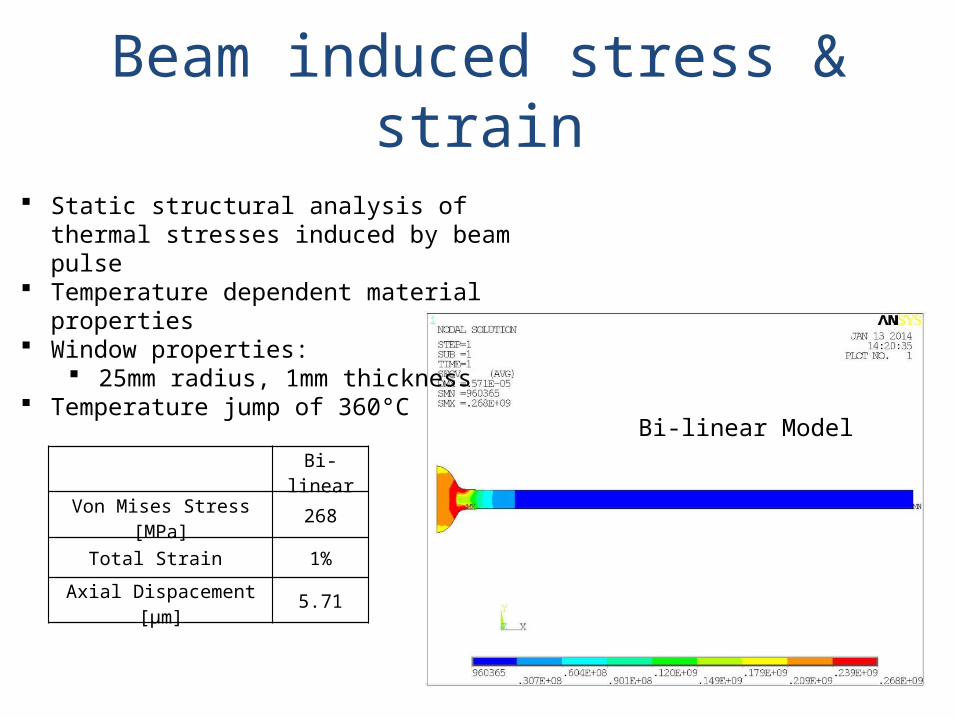
Bi-linear Model
Static structural analysis of thermal stresses induced by beam pulse
Temperature dependent material properties Window properties:
25mm radius, 1mm thickness Temperature jump of 360°C
Bi-linear
Von Mises Stress [MPa] 268
Total Strain 1%
Axial Dispacement [μm] 5.71
Beam induced stress & strain
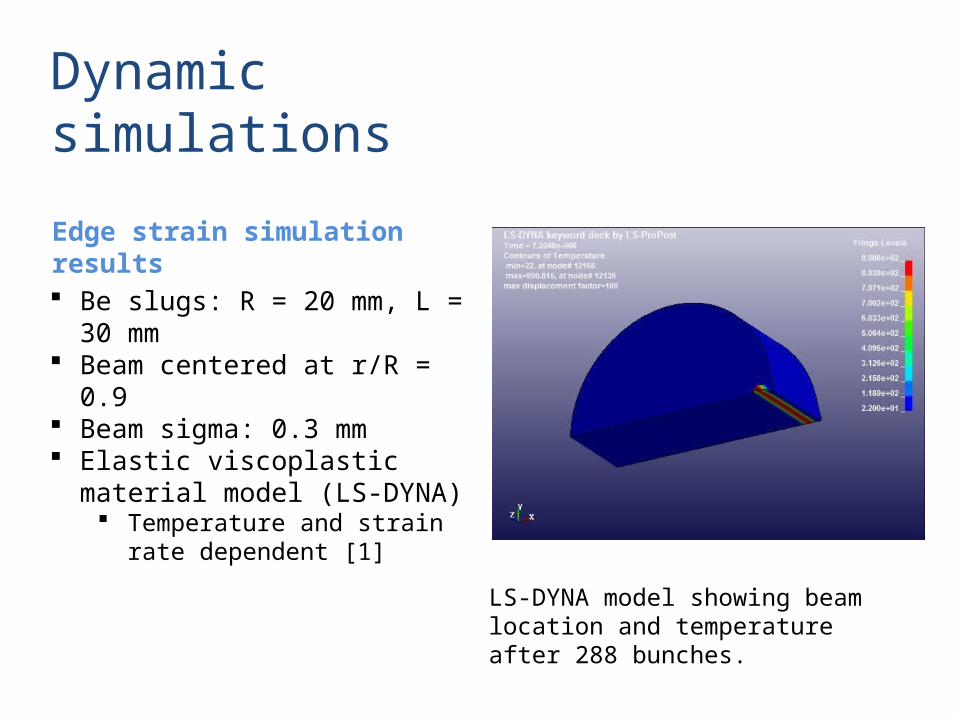
Edge strain simulation results
Be slugs: R = 20 mm, L = 30 mm Beam centered at r/R = 0.9 Beam sigma: 0.3 mm Elastic viscoplastic material model
(LS-DYNA) Temperature and strain rate
dependent [1]
LS-DYNA model showing beam location and temperature after 288 bunches.
Dynamic simulations
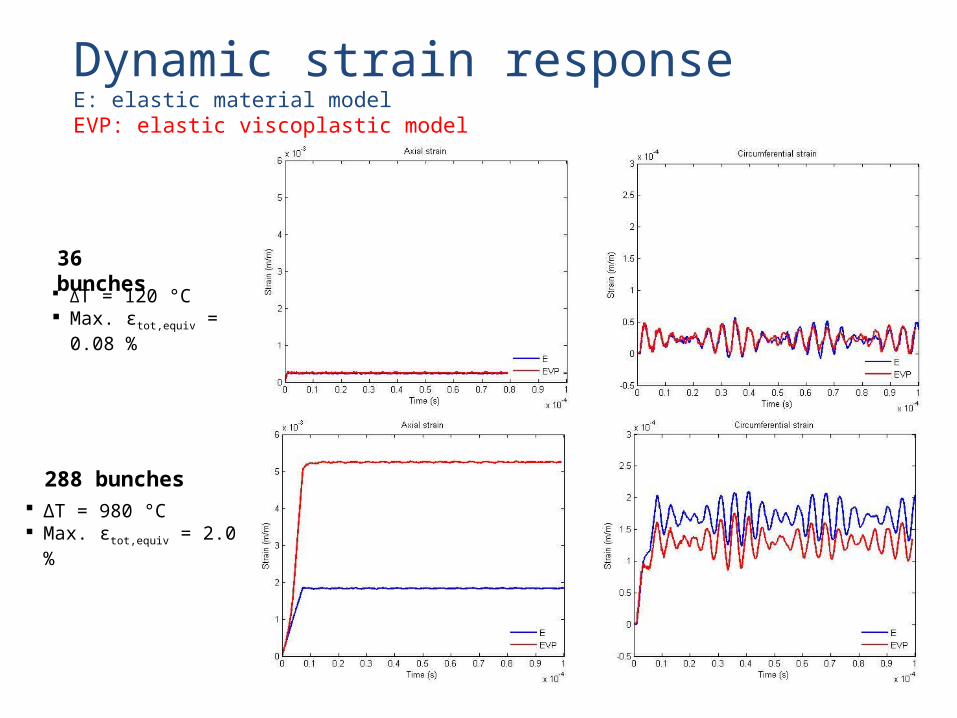
Dynamic strain responseE: elastic material modelEVP: elastic viscoplastic model
288 bunches
36 bunches
ΔT = 120 °C Max. εtot,equiv = 0.08 %
ΔT = 980 °C Max. εtot,equiv = 2.0 %
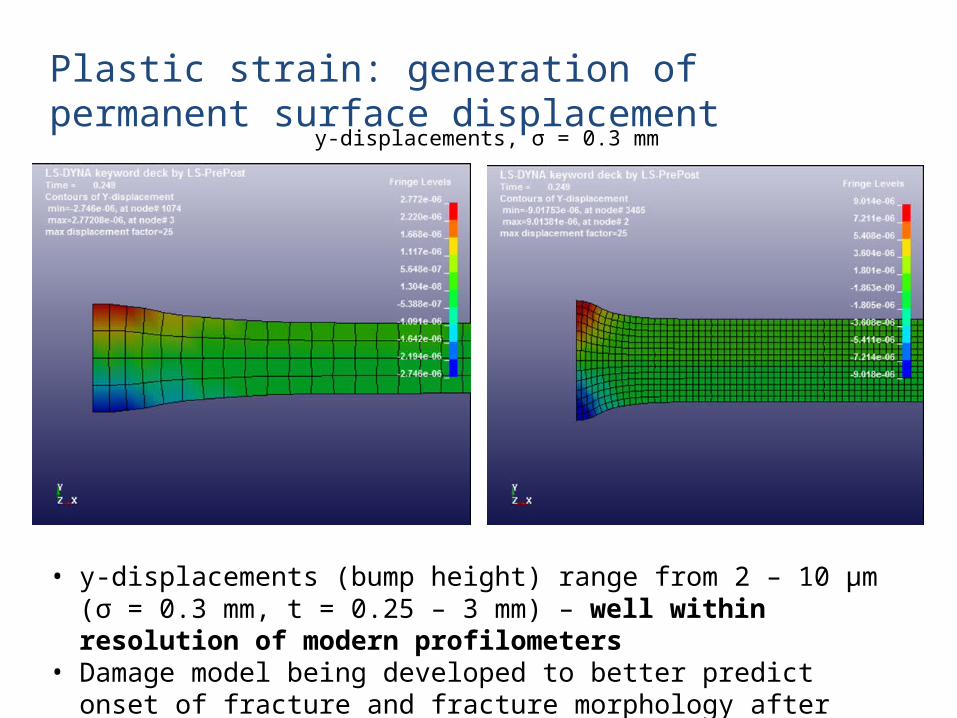
Plastic strain: generation of permanent surface displacement
y-displacements, σ = 0.3 mm
• y-displacements (bump height) range from 2 – 10 µm (σ = 0.3 mm, t = 0.25 – 3 mm) – well within resolution of modern profilometers
• Damage model being developed to better predict onset of fracture and fracture morphology after cool-down (fracture of centre spot expected)
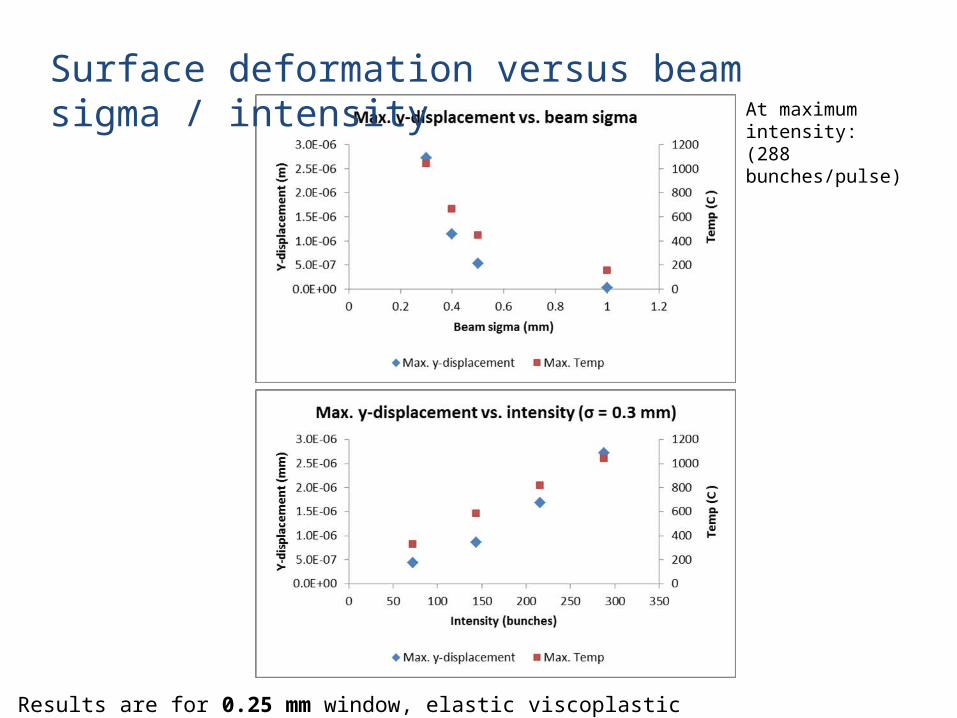
Results are for 0.25 mm window, elastic viscoplastic material model
At maximum intensity:(288 bunches/pulse)
Surface deformation versus beam sigma / intensity
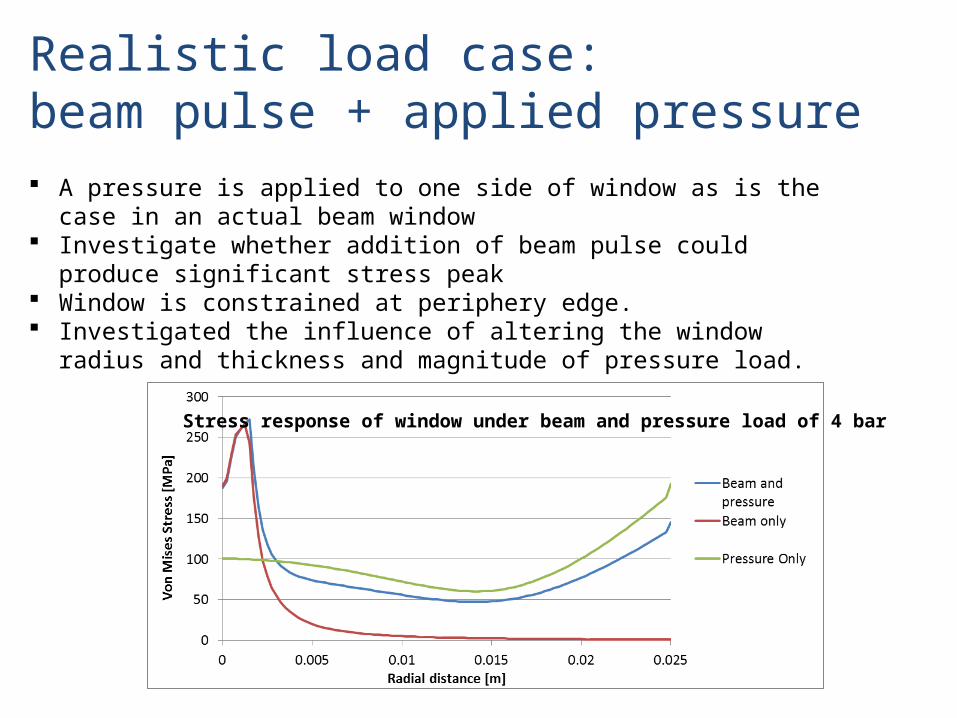
Beam and Applied Pressure
A pressure is applied to one side of window as is the case in an actual beam window
Investigate whether addition of beam pulse could produce significant stress peak
Window is constrained at periphery edge. Investigated the influence of altering the window radius and thickness and
magnitude of pressure load.
Stress response of window under beam and pressure load of 4 bar
Realistic load case: beam pulse + applied pressure
Interim conclusion
Applying a pressure to the window in conjunction with beam loading does not appear to induce a higher stress peak in the window (good result for actual beam windows!)
Nevertheless, it may still be a valid method of detecting window failure e.g. by using an on-line leak detector
Realistic load case: beam pulse + applied pressure
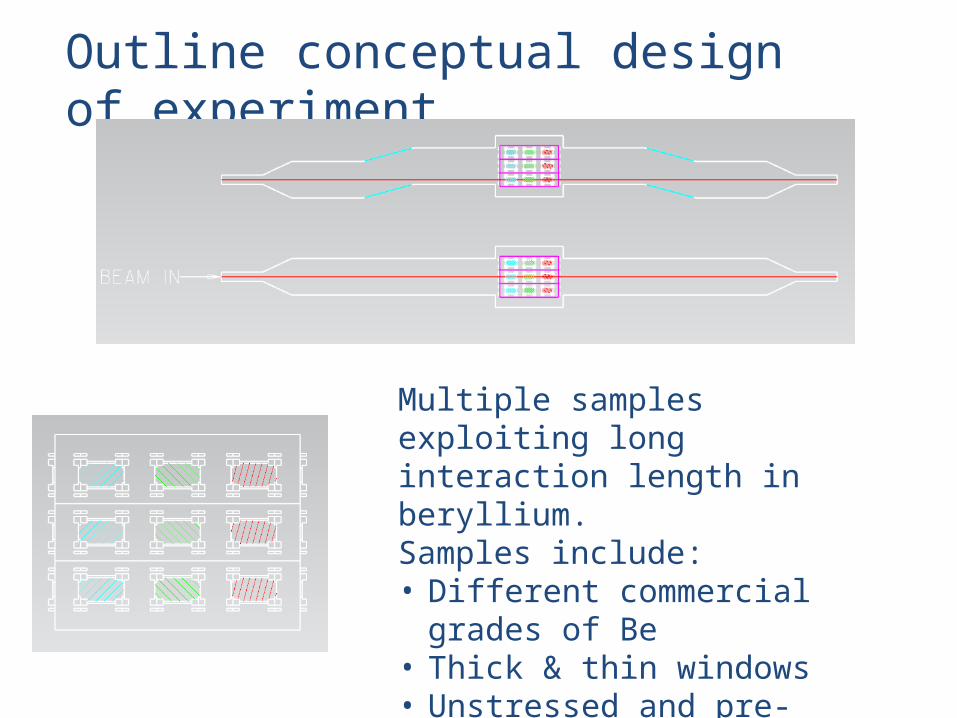
Outline conceptual design of experiment
Multiple samples exploiting long interaction length in beryllium.Samples include:• Different commercial grades of
Be• Thick & thin windows• Unstressed and pre-stressed
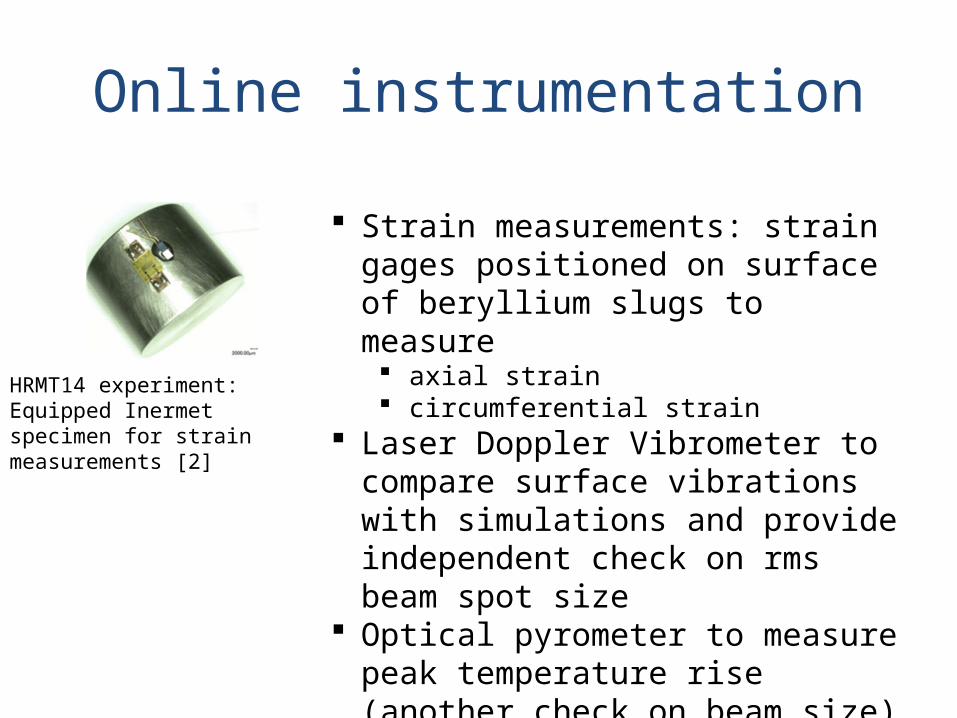
Online instrumentation
Strain measurements: strain gages positioned on surface of beryllium slugs to measure axial strain circumferential strain
Laser Doppler Vibrometer to compare surface vibrations with simulations and provide independent check on rms beam spot size
Optical pyrometer to measure peak temperature rise (another check on beam size)
HRMT14 experiment: Equipped Inermet specimen for strain measurements [2]
Off-line materials analysis
• Profilometer/AFM to analyse window surface profile and measure out-of-plane plastic deformations.
• Advanced microscopy systems for micro-structural and crystallography evaluation (SEM, EBSD, EDS) and potential crack/failure analysis.
Proposed experimental methodology
1. Polish samples before irradiation and characterise using AFM, SEM, EBSD, EDS, nanoindentation and, possibly, micromechanical methods
2. Carry out experiments:– Scan beam across samples with increasing number of
bunches per spill– Carry out multiple shots on single locations to investigate
whether beam effects saturate or accumulate
3. Repeat measurements in step 1 to identify effects of pulse beam interation
Material analysis techniques
• Used before and after in-beam experiment to quantify effects of pulsed beam interaction with material
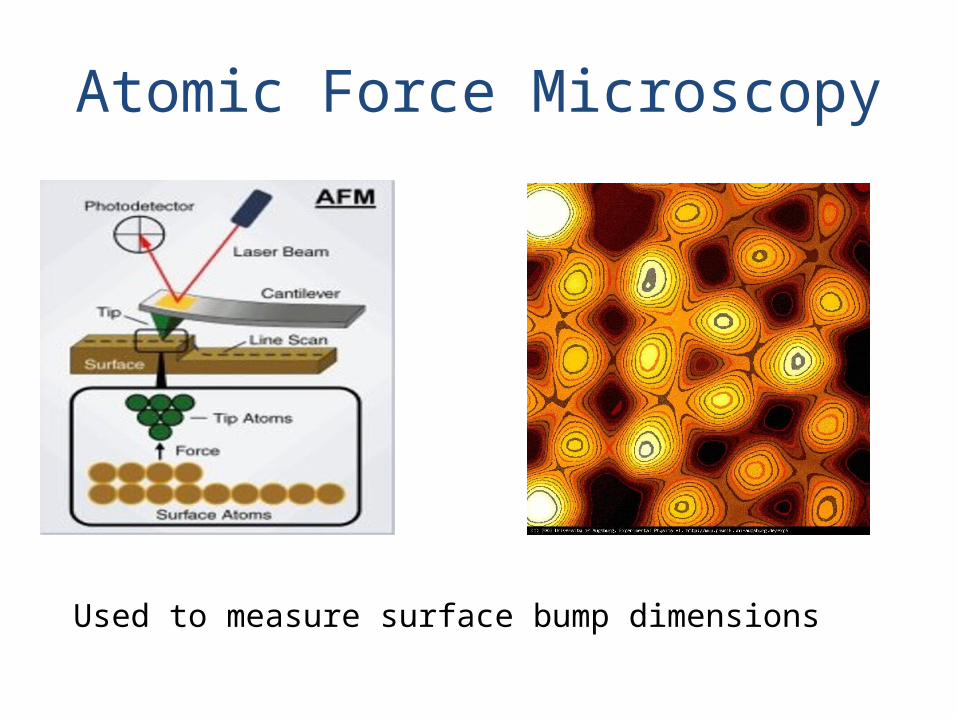
Atomic Force Microscopy
Used to measure surface bump dimensions
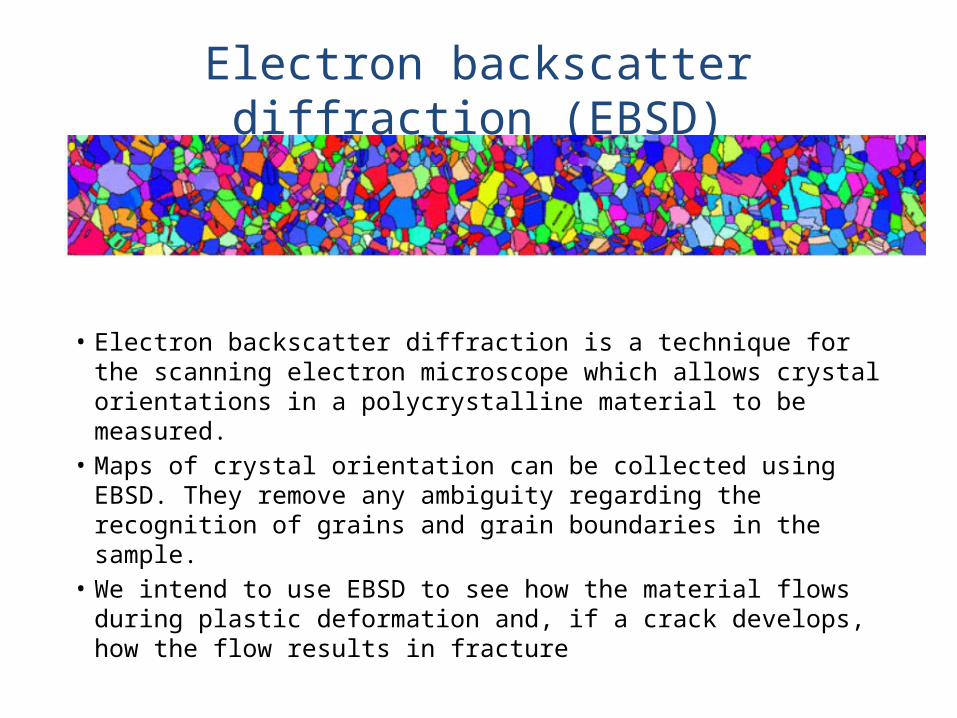
Electron backscatter diffraction (EBSD)
• Electron backscatter diffraction is a technique for the scanning electron microscope which allows crystal orientations in a polycrystalline material to be measured.
• Maps of crystal orientation can be collected using EBSD. They remove any ambiguity regarding the recognition of grains and grain boundaries in the sample.
• We intend to use EBSD to see how the material flows during plastic deformation and, if a crack develops, how the flow results in fracture
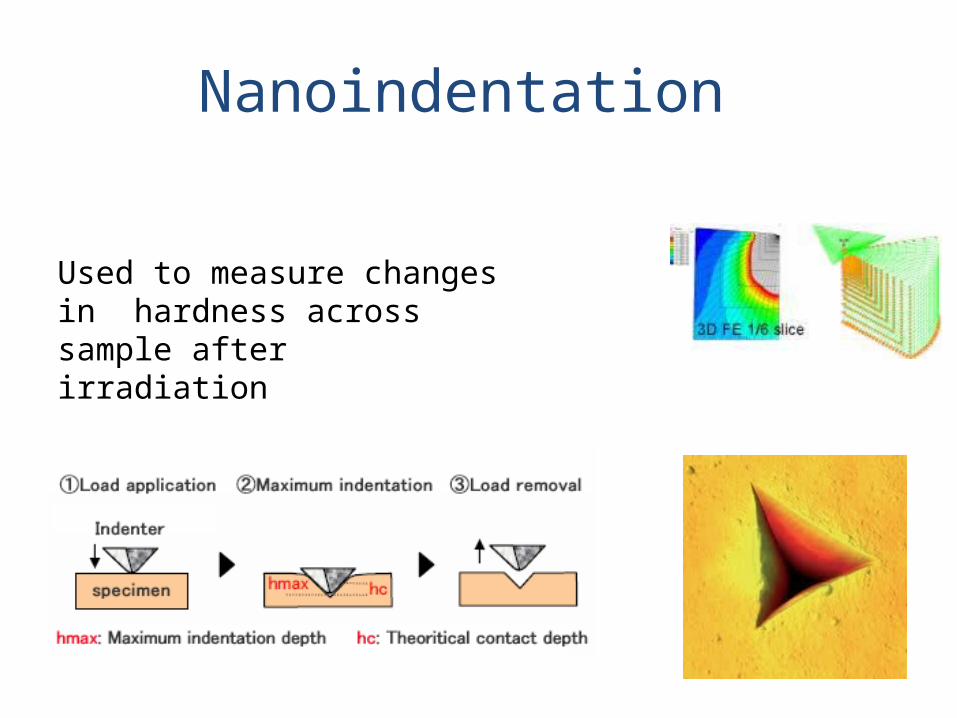
Nanoindentation
Used to measure changes in hardness across sample after irradiation
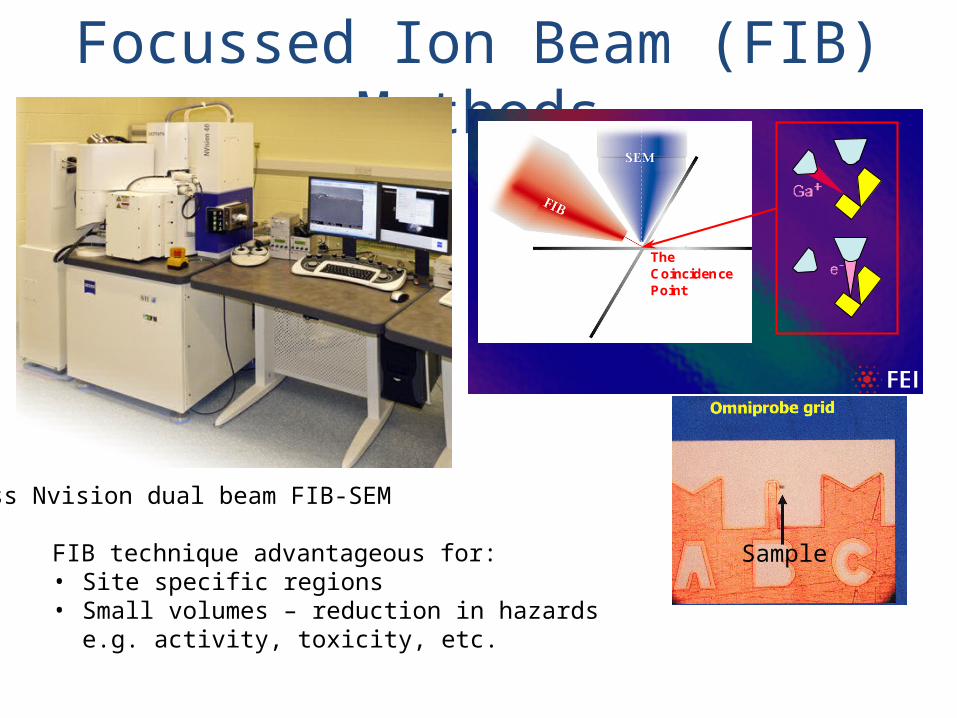
Focussed Ion Beam (FIB) Methods
Zeiss Nvision dual beam FIB-SEM
Sample
10
The DualBeam Advantage:The DualBeam Advantage:
TheCoincidencePoint
FIB technique advantageous for:• Site specific regions• Small volumes – reduction in hazards e.g. activity,
toxicity, etc.
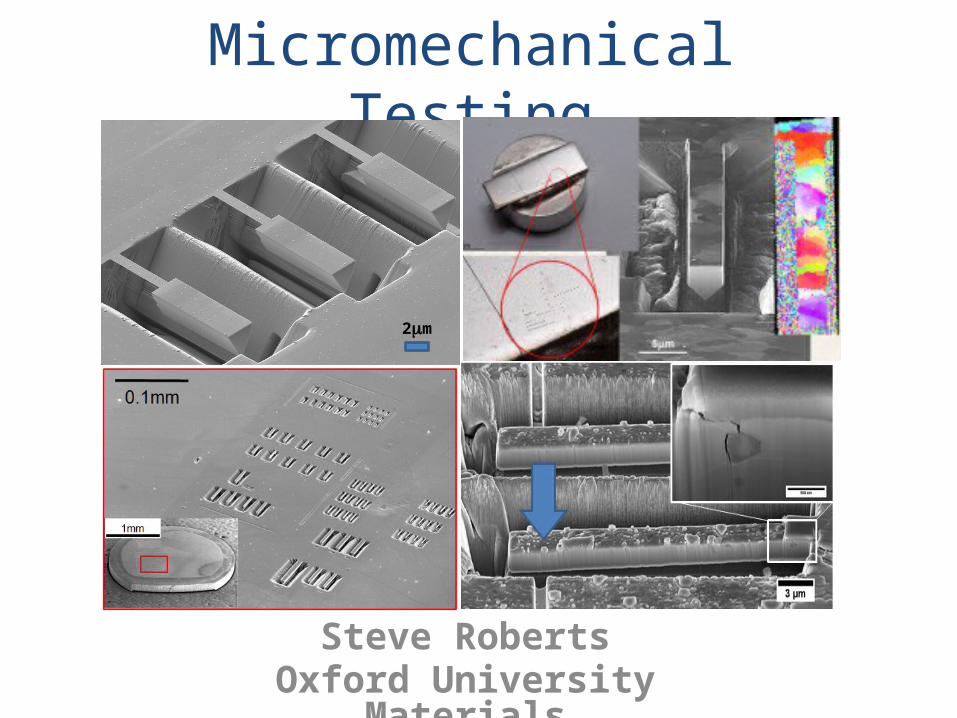
Micromechanical Testing
Steve RobertsOxford University Materials
2mm

23
Why microcantilevers?
• Need for a sample design that can be machined in surface of bulk samples.
• Bend testing allows fracture as well as elastic and plastic properties to be investigated.
• Suitable for measuring individual microstructural features.
• Testing of samples only available in small volumes.
• Geometry that can be manufactured quickly and reproducibly.
1um
3um 2um
3um
4um
0.00E+00
1.00E+09
2.00E+09
3.00E+09
4.00E+09
5.00E+09
6.00E+09
7.00E+09
0.000 1.000 2.000 3.000 4.000 5.000 6.000 7.000 8.000
Yiel
d St
ress
(Pa)
Beam Depth (μm)
Simple Yield Stress
Neutron Irradiated
Ion Irradiated
Un-Irradiated
Power (Neutron Irradiated)
Power (Ion Irradiated)
Power (Un-Irradiated)
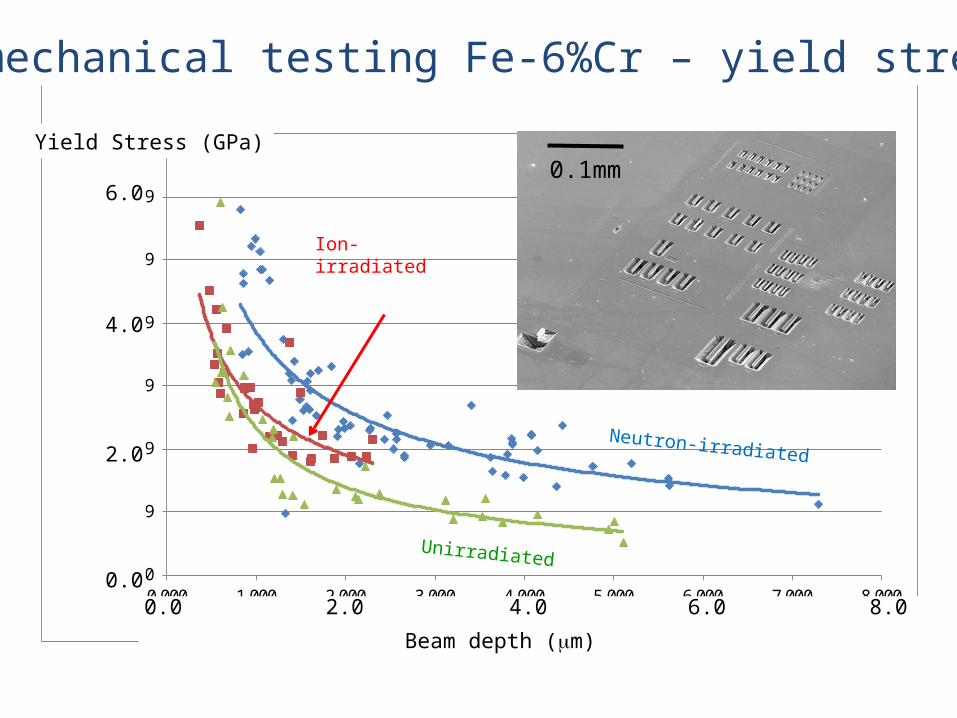
Neutron-irradiated
Unirradiated
Ion-irradiated
Micromechanical testing Fe-6%Cr – yield stress
6.0
4.0
2.0
0.00.0 2.0 4.0 6.0 8.0
Yield Stress (GPa)
Beam depth (mm)
0.1mm
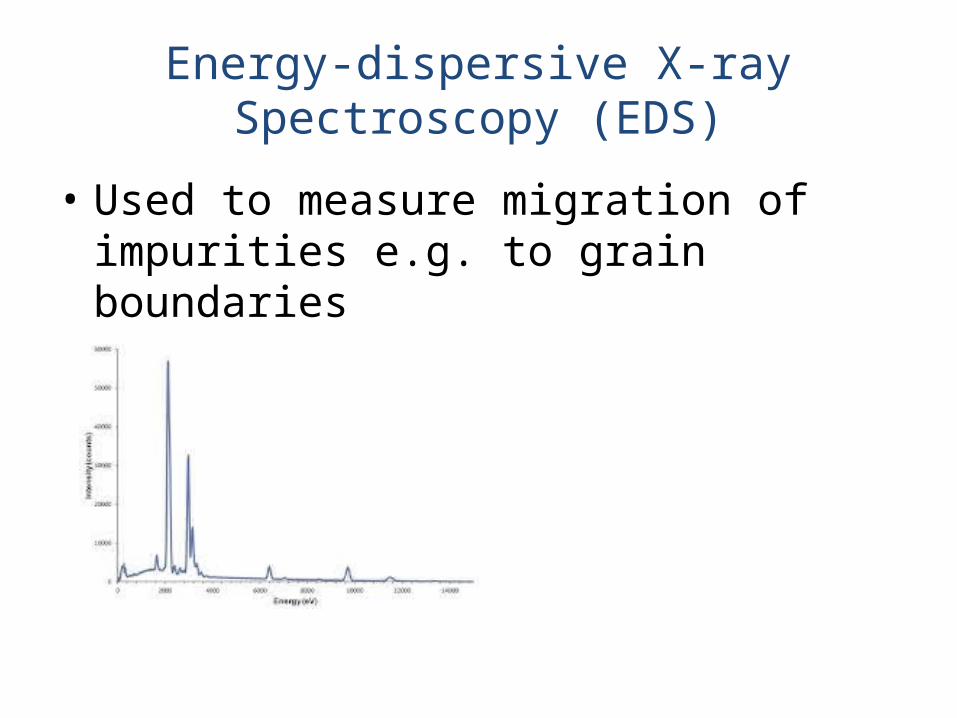
Energy-dispersive X-ray Spectroscopy (EDS)
• Used to measure migration of impurities e.g. to grain boundaries
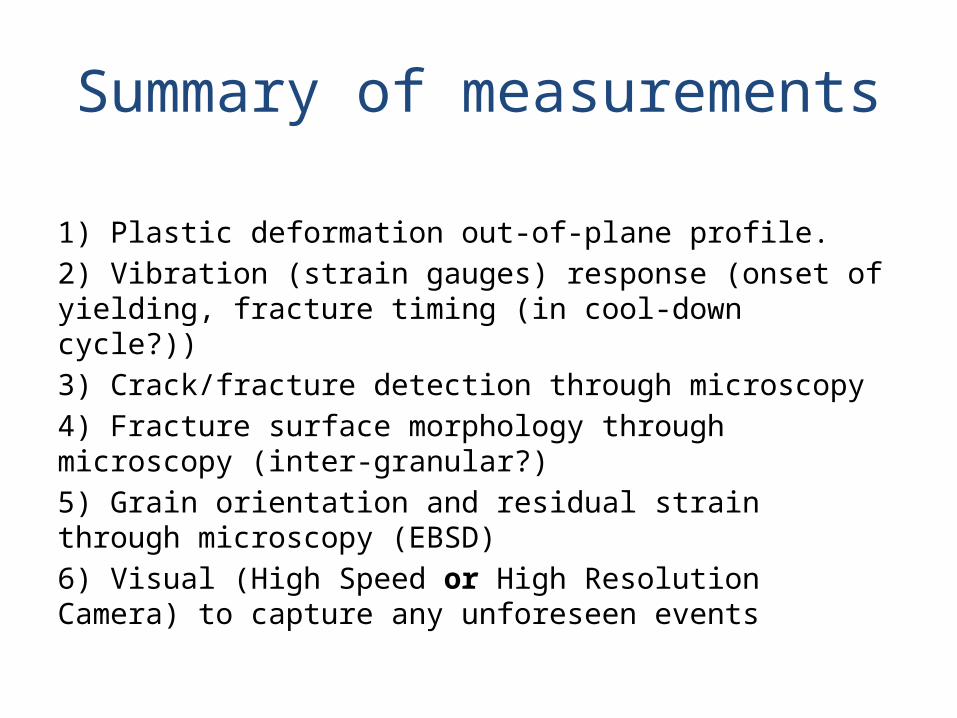
Summary of measurements
1) Plastic deformation out-of-plane profile.2) Vibration (strain gauges) response (onset of yielding, fracture timing (in cool-down cycle?))3) Crack/fracture detection through microscopy4) Fracture surface morphology through microscopy (inter-granular?)5) Grain orientation and residual strain through microscopy (EBSD)6) Visual (High Speed or High Resolution Camera) to capture any unforeseen events
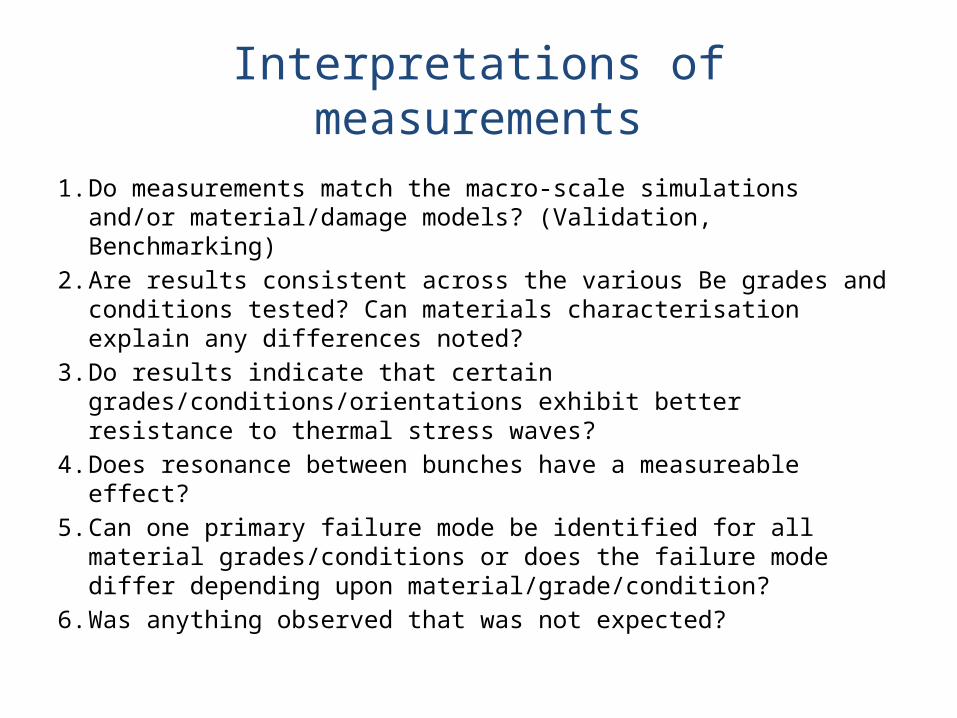
Interpretations of measurements
1. Do measurements match the macro-scale simulations and/or material/damage models? (Validation, Benchmarking)
2. Are results consistent across the various Be grades and conditions tested? Can materials characterisation explain any differences noted?
3. Do results indicate that certain grades/conditions/orientations exhibit better resistance to thermal stress waves?
4. Does resonance between bunches have a measureable effect?5. Can one primary failure mode be identified for all material
grades/conditions or does the failure mode differ depending upon material/grade/condition?
6. Was anything observed that was not expected?
Extra Material
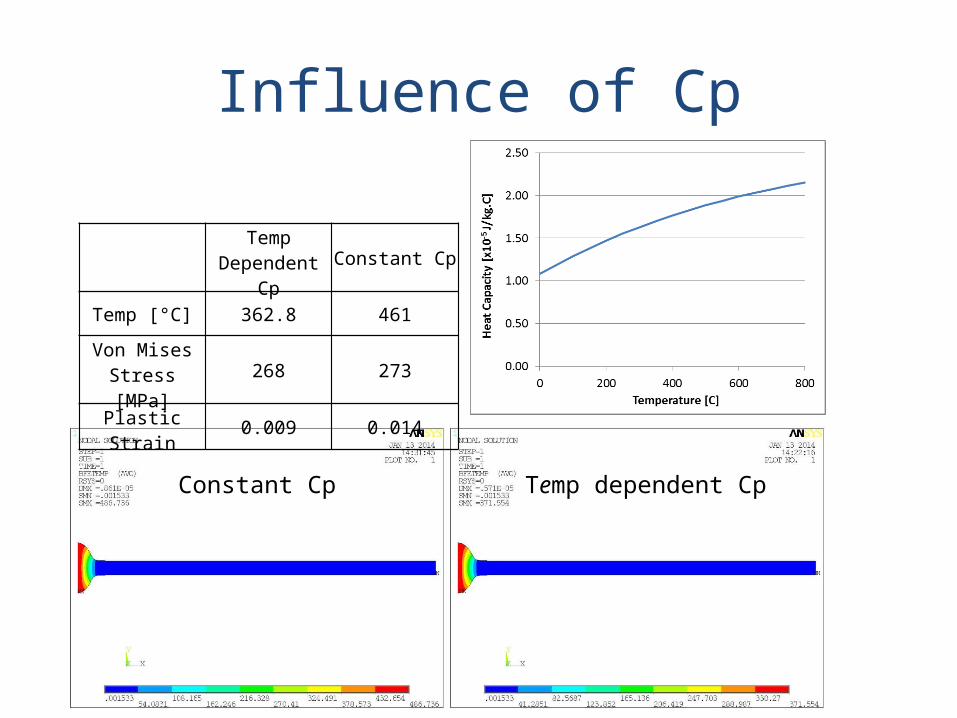
Influence of Cp
Temp dependent CpConstant Cp
Temp
Dependent Cp Constant Cp
Temp [°C] 362.8 461
Von Mises Stress [MPa] 268 273
Plastic Strain 0.009 0.014
Influence of Cp
30
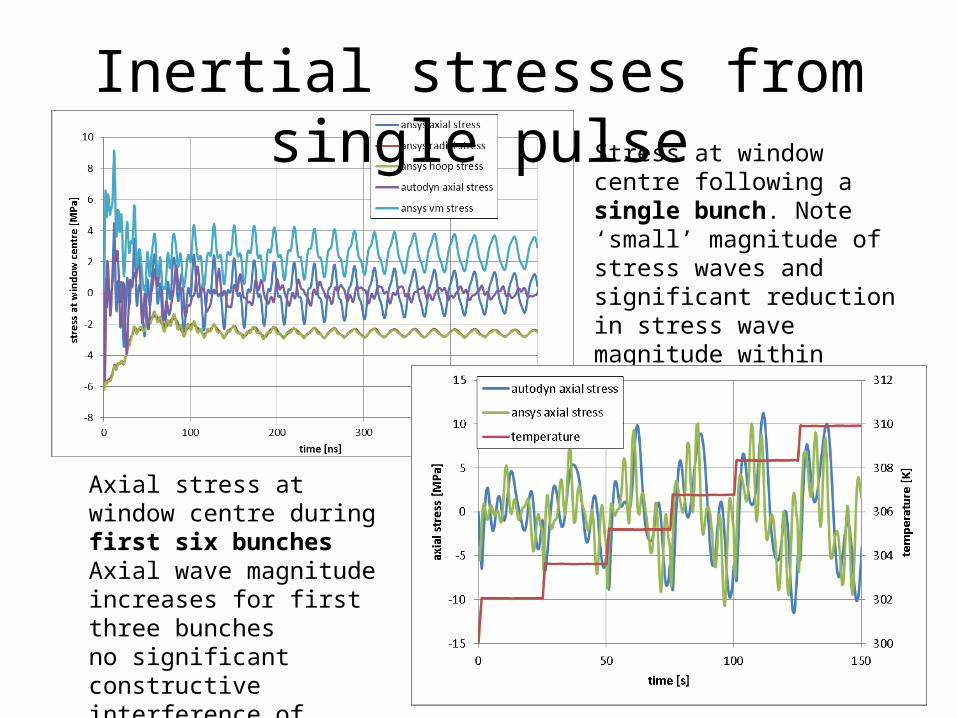
Stress at window centre following a single bunch. Note ‘small’ magnitude of stress waves and significant reduction in stress wave magnitude within several bunches
Axial stress at window centre during first six bunchesAxial wave magnitude increases for first three bunchesno significant constructive interference of axial waves observed
Inertial stresses from single pulse
31
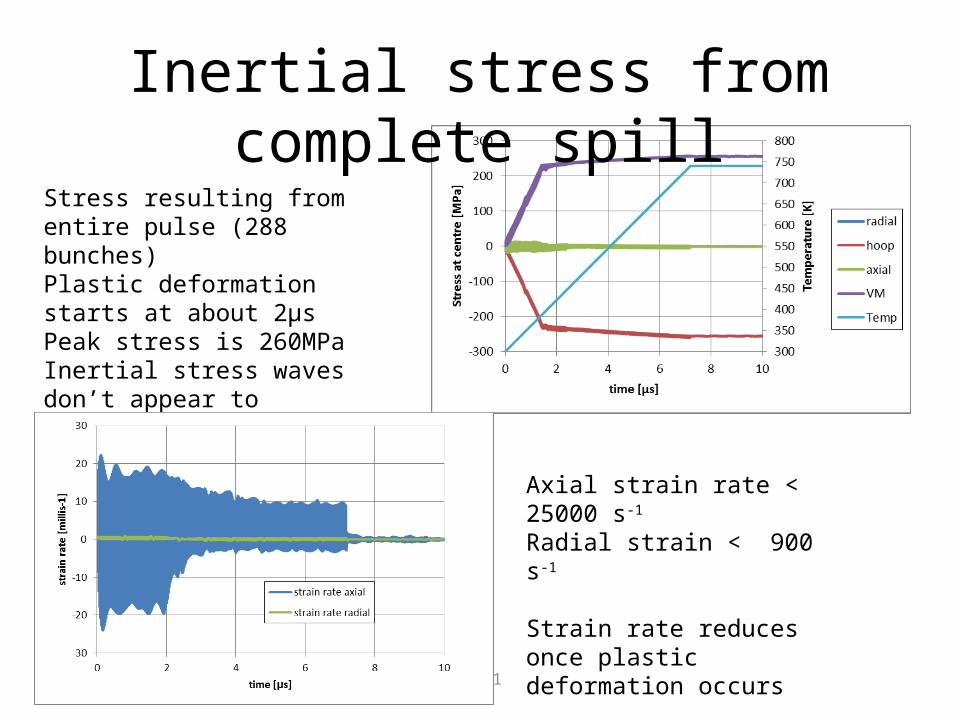
Inertial Stress – complete pulse
Stress resulting from entire pulse (288 bunches)Plastic deformation starts at about 2μsPeak stress is 260MPaInertial stress waves don’t appear to significantly add to stress
Axial strain rate < 25000 s-1
Radial strain < 900 s-1
Strain rate reduces once plastic deformation occurs
Inertial stress from complete spill
32
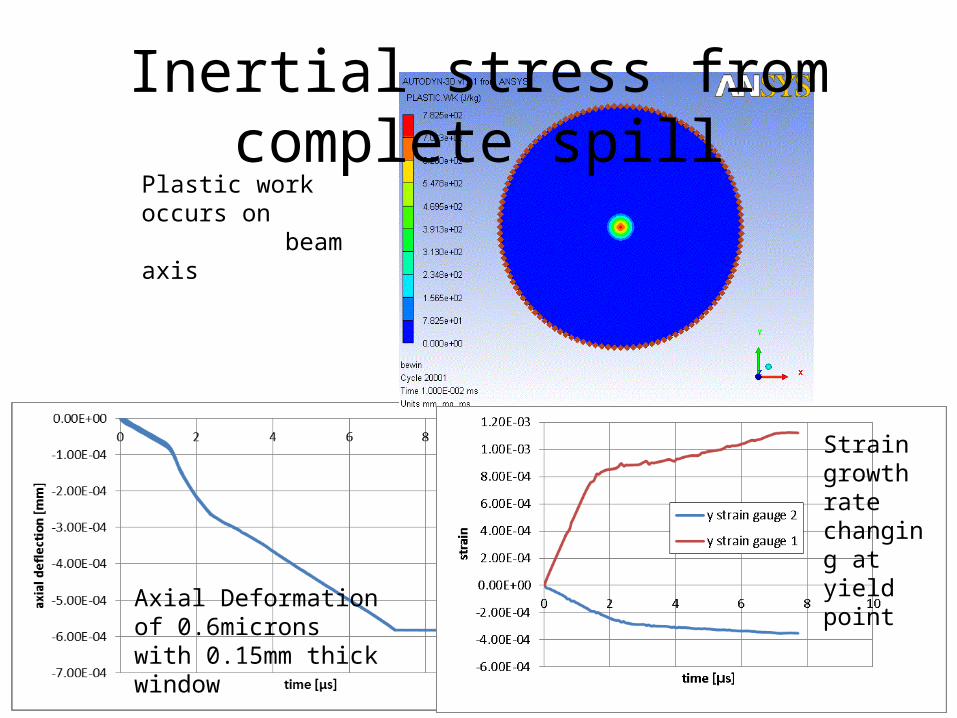
Inertial Stress – complete pulse
Plastic work occurs on beam axis
Axial Deformation of 0.6microns with 0.15mm thick window
Strain growth rate changing at yield point
Inertial stress from complete spill