bernards township public schools post secondary …
TRANSCRIPT

BERNARDS TOWNSHIP PUBLIC SCHOOLSPOST SECONDARY REPORT 2016
December 19, 2016
DR. BRIAN HEINEMANDirector of Curriculum
MRS. JILLIAN SHADIS District Supervisor of School Counseling

Standardized Testing – Part ISAT Reasoning, ACT, and SAT Subject Tests
Redesigned SAT
• Debuted March 2016
• This year, all reported scores have been converted to the “old” test by College Board
• We will have new data points beginning with the Class of 2017
Data from SAT Highlights Report for Ridge High School 2016

SAT vs. ACT
SAT ACT
Type of Assessment “College Admissions Test” Achievement Test
Test Content •Critical Reading
•Math
•Writing
•English
•Math
•Reading
•Science
•Writing (Optional)
Timing •3 hrs. 45 min. •Without Writing: 2 hrs. 55 min.
•With Writing: 3 hrs. 25 min.
Guessing Penalty? Yes No
Scoring 200 to 800 in each section;
combined score of 600 to
2400.
1 to 36 in English, Math, Reading,
and Science. Average for a composite
score. 2 to 12 on Writing, equal to
1/3 of the English score.

Testing Trends
Class of 2016 2015 2014 2013 2012
SATsRidge 310 344 341 331 374N.J. 84,954 85,021 83,481 83,489 84,857
ACTsRidge 316 292 280 286 287N.J. 33,646 30,263 26,182 24,202 22,179
Total Number of Students Tested
Data from SAT Highlights Report for Ridge High School 2016, and ACT Profile Report for Ridge High School, 2016

SAT Critical Reading ScoresClass of 2016 2015 2014 2013 2012
RidgeMean Scores 606 589 577 568 571Ridge Point Change +17 +12 +9 -3 -6N.J. Mean Score 495 500 501 499 495N.J. Point Change -5 -1 +2 +4 0National Mean Score 494 495 497 496 496National Point Change -1 -2 +1 0 -1
Max score = 800Data from SAT Highlights Report for Ridge High School 2016

SAT Critical Reading Scores
Data from SAT Highlights Report for Ridge High School 2016

SAT Math ScoresClass of 2016 2015 2014 2013 2012
RidgeMean Scores 622 611 611 597 603Ridge Point Change +11 0 +14 -6 +8N.J. Mean Score 514 521 523 522 517N.J. Point Change -7 -2 +1 +5 +1National Mean Score 508 511 513 514 514National Point Change -3 -2 -1 0 0
Data from SAT Highlights Report for Ridge High School 2016 Max score = 800

SAT Math Scores
Data from SAT Highlights Report for Ridge High School 2016

SAT Writing ScoresClass of 2016 2015 2014 2013 2012
RidgeMean Scores 598 581 585 573 576Ridge Point Change +17 -4 +12 -3 -2N.J. Mean Score 492 499 502 500 499N.J. Point Change -7 -3 +2 +1 +2National Mean Score 482 484 487 488 488National Point Change -2 -3 -1 0 -1
Max score = 800Data from SAT Highlights Report for Ridge High School 2016

SAT Writing Scores
Max score = 800Data from SAT Highlights Report for Ridge High School 2016

Data from School Profiles 2016-17
Comparison DistrictsAverage SAT Scores for the Class of 2016
CR M W
Chatham 584 587 585
Demarest 586 627 618
Glen Rock 546 568 550
Haddonfield 583 590 595
Millburn 612 635 614
Montgomery 610 647 625
Mountain Lakes 567 583 566
Old Tappan 568 609 593
Ridge 606 622 598
Ridgewood 569 606 584
WW-P North & South 616 649 622

Data from School Profiles 2016-17
Comparison DistrictsAverage SAT Critical Reading

Data from School Profiles 2016-17
Comparison DistrictsAverage SAT Math

Data from School Profiles 2016-17
Comparison DistrictsAverage SAT Writing

ACT Mean ScoresClass of 2016 2015 2014 2013 2012
AverageComposite Score (Does not include writing)
Ridge 26.8 26.3 26.2 25.8 25.6
N.J. 23.1 22.9 23.1 23.0 23.4
AverageEnglish Score
Ridge 26.8 26.5 26.2 25.3 25.2
N.J. 22.7 23.7 22.8 22.5 23.1
AverageMath Score
Ridge 26.7 26.5 26.5 26.6 26.0
N.J. 23.3 23.3 23.7 23.6 23.9
AverageReading Score
Ridge 27.1 26.5 26.1 26.0 25.5
N.J. 23.5 23.3 23.1 23.1 23.4
Average Science ScoreRidge 26.2 25.8 25.5 25.1 24.9
N.J. 22.5 22.6 22.4 22.2 22.6
Average Writing Score (Optional for Students)
Ridge 22.1* 26.3 25.7 25.6 N/A
N.J. 19.3* 23.2 22.9 23.0 N/A*The ACT Writing Test was redesigned during the summer of 2015. The scores are no longer comparable to years past.
Data from ACT College Readiness Letter and Profile Report for Ridge High School, 2016 Max score = 36

ACT Benchmarks
“A benchmark score is the minimum score needed on an ACT
subject-area test to indicate a 50% chance of obtaining a B or
higher, or about a 75% chance of obtaining a C or higher, in
the corresponding, credit-bearing college courses.”
Data from ACT Profile Report for Ridge High School, 2016
College Course/ Course Area
ACT Test Section Benchmark Score
English Composition English 18
Algebra Math 22
Social Sciences Reading 22
Biology Science 23

ACT Benchmarks
Class of 2016 2015 2014 2013 2012
All Four Testing Areas
Ridge 70% 67% 58% 63% 61%
N.J. 42% 42% 40% 40% 39%
National 26% 28% 26% 26% N/A
English
Ridge 93% 93% 96% 93% 92%
N.J. 75% 78% 77% 77% 81%
National 61% 64% 64% 64% N/A
Math
Ridge 87% 84% 86% 86% 86%
N.J. 61% 63% 64% 64% 67%
National 41% 42% 43% 44% N/A
ReadingRidge 84% 80% 75% 75% N/A
N.J. 59% 59% 57% 58% N/A
ScienceRidge 78% 77% 70% 63% N/A
N.J. 50% 52% 50% 40% N/A
Percentage of Students Meeting College-Readiness Benchmarks
Data from ACT Profile Report for Ridge High School, 2016

Data from School Profiles 2016-17
Comparison DistrictsAverage Composite ACT Scores for the Class of 2016
ACT
Chatham 28.6
Demarest 26.3
Glen Rock Not reported
Haddonfield Not reported
Millburn 28.0
Montgomery 26.7
Mountain Lakes 26.3
Old Tappan Not reported
Ridge 26.8
Ridgewood 25.0
WW-P North & South 28.2

Data from School Profiles 2016-17
Comparison DistrictsAverage Composite ACT Scores for the Class of 2016

Ridge SAT/ACT 2016 Score Comparison
ACTMean
Approximate SAT
Equivalent
SATMean
Reading 27.1 612 > 606
Math 26.7 605.5 < 622
Writing 22.1 534 < 598
Comparison scores from ACT website: http://www.act.org/aap/concordance/pdf/reference.pdf

SAT Subject Tests
• Generally taken by students in AP Courses, but Honors students at Ridge also take them.
• Some colleges recommend or require SAT Subject Tests
• Students themselves generally select which Subject Test(s) to take, though some colleges or programs have more specific requirements.
• Subject Test Guidance Document available on the Counseling Department site to equate Ridge courses with SAT Subject Tests.
(formerly known as “SAT II Tests”)
Information from College Board: https://collegereadiness.collegeboard.org/sat-subject-tests/about/institutions-using

SAT Subject Test Mean Scores 2016# of Test Takers
Ridge N.J. National
LA Literature 28 679 614 599
Math
Math I(through Algebra II)
27 658 625 599
Math II(through Precalculus)
110 732 703 690
Science
Biology (Molecular) 21 730 670 647
Biology (Ecological) 96 713 643 616
Chemistry 79 666 677 668
Physics 73 714 669 667
SSU.S. History 35 649 650 624
World History 10 519 616 615
WLFrench 5 670 614 634
Spanish 9 619 626 653Data from SAT Highlights Report for Ridge High School 2016
Reported for subject areas with more than 4 test takers.

SAT Subject Test ELA & SS Mean Scores for Ridge High School 2012-2016
Reported for subject areas with more than 4 test takers.
Data from SAT Highlights Report for Ridge High School 2016 Max score = 800

SAT Subject Test WL Mean Scores for Ridge High School 2012-2016
Reported for subject areas with more than 4 test takers.
Data from SAT Highlights Report for Ridge High School 2016 Max score = 800

SAT Subject Test Math Mean Scores for Ridge High School 2012-2016
Reported for subject areas with more than 4 test takers.
Data from SAT Highlights Report for Ridge High School 2016 Max score = 800

SAT Subject Test Science Mean Scores for Ridge High School 2012-2016
Reported for subject areas with more than 4 test takers.
Data from SAT Highlights Report for Ridge High School 2016 Max score = 800

Test PreparationMethod Test Prep 2.0

Method Test Prep 2.0
• Highlights: – SAT and ACT
– Breaks practice into 15 minute tasks
– Audio/video explanations of how to solve every question
– Listen to a professional tutor explain the concepts and questions that they are struggling with
– Immediate feedback on every question
– Tracks performance and indicates strengths and weaknesses
– Complete practice quizzes and/or full-length practice tests
– Receive hundreds of practice questions and valuable test-taking tips
Information from Method Test Prep (http://www.methodtestprep.com/)

MTP Usage
Information from Method Test Prep 2.0 Administrative Site

Standardized Testing – Part IIAdvanced Placement (AP) Exams

AP Class Enrollment 2015-16Percentage of Students Enrolled in an AP Course that
Took the AP Exam

AP Class Enrollment (Part I) 2016 2015 2014 2013 2012Subject A B A B A B A B A B
Arts
Studio Art Drawing 21 17 22 21 31 29 23 21 27 26Studio Art 2-D 1 1 2 2 0 0 0 0 0 0Studio Art 3-D 1 0 1 1 0 0 0 0 0 0
English
English Lang & Comp 71 74 110 103 101 99 80 78 107 105
English Lit & Comp 94 63 71 51 72 50 83 56 101 94
Math
Calculus AB 99 94 99 97 85 78 97 94 101 96Calculus BC 61 59 46 43 51 48 39 38 41 38
Statistics 51 48 49 44 73 65 74 64 75 73
Computer Science A 90 72 0 0 0 0 0 0 0 0
Science
Biology 73 71 88 78 84 76 66 64 48 46Chemistry 36 35 47 43 38 27 32 29 52 47Physics 1 111 108 114 107
81 74 82 80 102 102Physics 2 0 0 114 106Physics C - E&M 62 50 30 14 37 34 42 31 30 29Physics C - Mechanics 62 51 30 27 37 34 42 31 30 28Environmental Science 136 97 137 115 101 84 111 95 123 114
A = Number of Students Enrolled B = Number of Exams Issued

AP Class Enrollment (Part II) 2016 2015 2014 2013 2012
Subject A B A B A B A B A B
SS
Human Geography 121 96 137 103 153 103 99 83 0 0Psychology 205 188 193 177 206 179 223 193 188 183European History 22 17 25 18 28 21 29 26 14 11U.S. Gov't & Politics 128 122 102 97 109 106 159 157 170 168Macroeconomics 128 125 102 96 109 103 159 156 170 168U.S. History 45 41 24 23 37 29 46 39 92 83Microeconomics 91 88 66 59 0 0 0 0 0 0
WL
French Lang & Culture 15 13 10 10 22 19 5 5 28 4Italian Lang & Culture 15 15 17 14 24 18 20 18 17 15Japanese Lang & Culture 13 7 18 13 7 6 7 5 5 4Latin 68 60 0 0 42 35 0 0 19 18
Spanish Language 33 32 27 23 23 19 10 10 11 12
TOTAL (from both slides)
1964 1644 168114851561134515281373 15511464
A = Number of Students Enrolled B = Number of Exams Issued
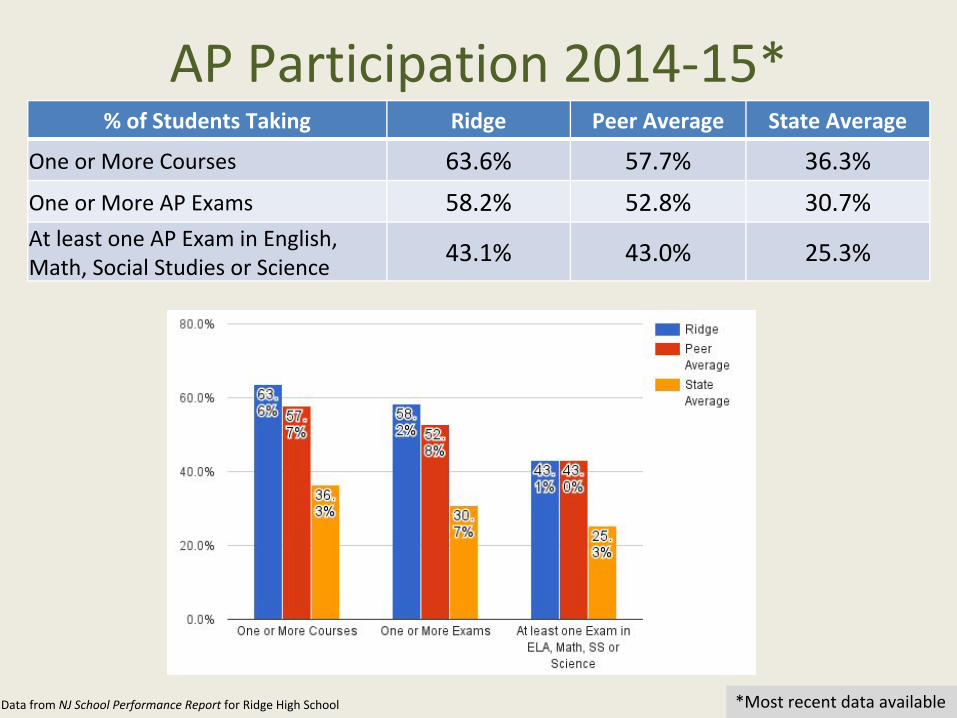
AP Participation 2014-15* % of Students Taking Ridge Peer Average State Average
One or More Courses 63.6% 57.7% 36.3%
One or More AP Exams 58.2% 52.8% 30.7%
At least one AP Exam in English, Math, Social Studies or Science
43.1% 43.0% 25.3%
Data from NJ School Performance Report for Ridge High School *Most recent data available

AP Results 2014-15*% of AP Exams Ridge Peer Average State Average
A) Scored 3 or Greater 94.7% 84.2% 72.4%
B) Scored 3 or Greater in English, Math, Social Studies or Science
89.3% 83.5% 69.7%
Data from NJ School Performance Report for Ridge High School*Most recent data available

Total Number of AP Exams Passed
Passing* AP Score Breakdown 2016
*Passing Score = 3, 4 or 5Data from College Board AP Score Report 2016

AP Equity & Excellence 2016
Data from College Board AP Score Report 2016
AP Equity & Excellence Score
12th GradePercentage of AP students per grade level who scored 3 or higher on at least one AP Exam this year divided by the total number of students in each grade.
57.8%
11th Grade 41.4%
10th Grade 7.9%
Graduating Class Summary
Number of seniors who scored 3 or higher on at least one AP Exam at any point during high school divided by the total number of the school’s seniors.
63.3%

AP Equity & Excellence Five Year Trends
YearTotal number of
students taking at least one AP Exam
AP Equity and Excellence Score
12th Grade 11th Grade 10th Grade
2016 571 57.8% 41.4% 7.9%
2015 531 51.6% 46.0% 6.4%
2014 480 50.6% 44.0% 3.9%
2013 471 47.6% 43.3% 6.6%
2012 487 53.6% 46.4% 1.6%
Data from College Board AP Score Report 2016

Language Arts AP TrendsTotal Number of Test Takers
Data from College Board AP Score Report 2016

Language Arts AP Trends
Data from College Board AP Score Report 2016
Percentage of Test Takers Passing*
*Passing Score = 3, 4 or 5

Language Arts AP Trends
Data from College Board AP Score Report 2016
Breakdown of 2016 Passing Scores

Mathematics AP TrendsTotal Number of Test Takers
Data from College Board AP Score Report 2016

Mathematics AP Trends
Data from College Board AP Score Report 2016 *Passing Score = 3, 4 or 5
Percentage of Test Takers Passing*

Mathematics AP Trends
Data from College Board AP Score Report 2016
Breakdown of 2016 Passing Scores

Science AP Trends
Data from College Board AP Score Report 2016
Total Number of Test Takers

Science AP Trends
Data from College Board AP Score Report 2016 *Passing Score = 3, 4 or 5
Percentage of Test Takers Passing*

Science AP Trends
Data from College Board AP Score Report 2016
Breakdown of 2016 Passing Scores

Social Studies AP Trends
Data from College Board AP Score Report 2016
Total Number of Test Takers

Social Studies AP Trends
Data from College Board AP Score Report 2016 *Passing Score = 3, 4 or 5
Percentage of Test Takers Passing*

Social Studies AP Trends
Data from College Board AP Score Report 2016
Breakdown of 2016 Passing Scores

World Language AP Trends
Data from College Board AP Score Report 2016
Total Number of Test Takers
*AP Latin is offered every other year.

World Language AP Trends
Data from College Board AP Score Report 2016 *Passing Score = 3, 4 or 5
Percentage of Test Takers Passing*

World Language AP Trends
Data from College Board AP Score Report 2016
Breakdown of 2016 Passing Scores

Fine Arts AP Trends
Data from College Board AP Score Report 2016
Total Number of Test Takers

Fine Arts AP Trends
Data from College Board AP Score Report 2016
Percentage of Test Takers Passing*

Fine Arts AP Trends
Data from College Board AP Score Report 2016 *Passing Score = 3, 4 or 5
Information withheld to protect the
identity of the student.
Breakdown of 2016 Passing Scores

Advanced Placement Summary 2016
Subject
Percentage Point
Change in Passing Rate
Improvements
Japanese +9%Physics 1 +7%Env. Science +5%Biology +5% (to 100%)Gov’t & Politics +3%Human Geog. +3%Chemistry +2%Microeconomics +2%Psychology +1%
Decline
Physics C: E & M -8%Latin* -2%English Lang & Comp -1%U.S. History -1%
Data from College Board AP Score Report 2016
Subject
Percentage Point
Change in Passing Rate
Status Quo
Studio Art: 2D 0% (at 100%)Studio Art: Draw 0% (at 100%)English Lit & Comp 0%European History 0% (at 100%)Macroeconomics 0%Calculus AB 0%Calculus BC 0% (at 100%)Statistics 0%Physics C: M 0% (at 100%)French 0% (at 100%)Italian 0% (at 100%)Spanish 0% (at 100%)
*As compared to 2014 data, the last test given in Latin.

College AdmissionsApplications, Acceptances, Instant
Decision Days, Matriculations, and News

Ridge Class of 2016 Snapshot
Mean SAT Reasoning Test Scores● Critical Reading = 606● Math = 622● Writing = 598
Mean ACT Exam Scores● Composite = 26.8
466 Students Graduated
98.1% are continuing their education

Class Profiles2016 2015 2014 2013 2012
Graduating Class Size 466 459 444 413 443
Average GPA 3.567 3.508 3.451 3.395 3.416
Average PSAT 165 162 162 160 161
Average SAT(1600 Scale) 1255 1224 1210 1192 1196
Average SAT(2400 Scale) 1869 1824 1809 1780 1784
Average ACT 27 27 27 26 26
Number of Apps Submitted 3,158 3,222 2,832 2,582 2,920
Average Number of Apps per Student 6.8 7 6.3 6.1 6.6
Percentage Accepted 64% 63% 64% 66% 64%
Data from Naviance

2016 “Hot” (and Not) SchoolsIncreased Interest
SchoolApps 2016
Apps 2015
Change
University of Michigan 46 69 -23
Rutgers New Brunswick 149 171 -22
College of Charleston 10 29 -19
University of Delaware 58 74 -16
University of Pittsburgh 30 45 -15
Bloomsburg U of PA 6 19 -13
Miami University, Oxford 17 30 -13
Quinnipiac University 31 44 -13
Drexel University 23 35 -12
Ithaca College 17 29 -12
Decreased Interest
SchoolApps 2016
Apps 2015
Change
Georgia Tech 27 10 17
NYU 55 41 14
UCLA 32 18 14
RVCC 25 12 13
Providence College 28 16 12
Boston University 48 37 11
U of Texas, Austin 24 13 11
U of Maryland 84 73 11
Loyola U Maryland 29 19
10NJIT 24 14
Rutgers Newark 15 5
Class Sizes2016 466
2015 459Data from Naviance

Teacher Letters of Recommendation*Total # of Teachers Total # of Letters Range Average # of Letters
67 721 1 - 58 10.8
Data from Naviance *Only letters sent via Naviance eDocs
Number of Letters
Written by Department

College Representative Visits 2015-16
School # Students
1 Pennsylvania State University 72
2 Rutgers University-New Brunswick 67
3 University of Maryland, College Park 58
4 New York University 46
5 Virginia Tech 44
6 Boston University 42
7 Boston College 39
8 Vanderbilt University 32
9 Loyola University Maryland 30
10University of California, Los AngelesQuinnipiac
29
Most Attended Visits
2015-16
Number of Rep Visits
112
Average number of students per visit
11.1
Data from Naviance

Instant Decision/Interview Days
Data courtesy of Jackie Treanor, RHS School Counselor
*Students have been double-counted if they participated in more than one IDD in a given year.
+In 2015-16, two colleges canceled their participation due to issues on their end.
Number of Schools Participating+ Number of Students Participating*

Instant Decision/Interview Days
Instant Decision Interview Only
Data courtesy of Jackie Treanor, RHS School Counselor
# of Students Participating
# Admitted
Centenary 4 4
Drew 3 2
Fairleigh Dickinson
6 6
Montclair 16 14
NJIT 8 7
Rider 11 9
Seton Hall 10 8
# of Students Participating
# Later Admitted
Catholic 4 4
Coll. of Charleston
17 12
High Point 5 1
Providence 6 4
Sacred Heart 5 2
Univ. of Scranton
16 15

College Comparisons
2016 2015 2014 2013
Ivy League 11% 17% 18% 11%
Most Competitive 29% 31% 38% 34%
Highly Competitive 67% 62% 68% 69%
Very Competitive 81% 74% 75% 75%
Competitive 83% 80% 86% 83%
Less Competitive 82% 100% 100% 89%
Specialty Schools (Art, Music)
60% 84% 69% 62%
Percentage of Ridge Applicants Accepted
Data from Naviance

Ivy League Colleges 2016
CollegeInitial Apps
WithdrawnNet
AppsAccepted Denied WL
No Decision
Attending
Brown 12 0 12 2 9 1 0 2
Columbia 18 1 17 0 15 2 0 0
Cornell 44 2 42 5 29 8 0 2
Dartmouth 5 0 5 1 2 2 0 0
Harvard 12 1 11 0 11 0 0 0
Penn 26 1 25 5 19 1 0 4
Princeton 18 0 18 2 12 3 1 2
Yale 10 0 10 0 10 0 0 0
TOTALS 145 5 140 15 107 17 1 10
Data from Naviance
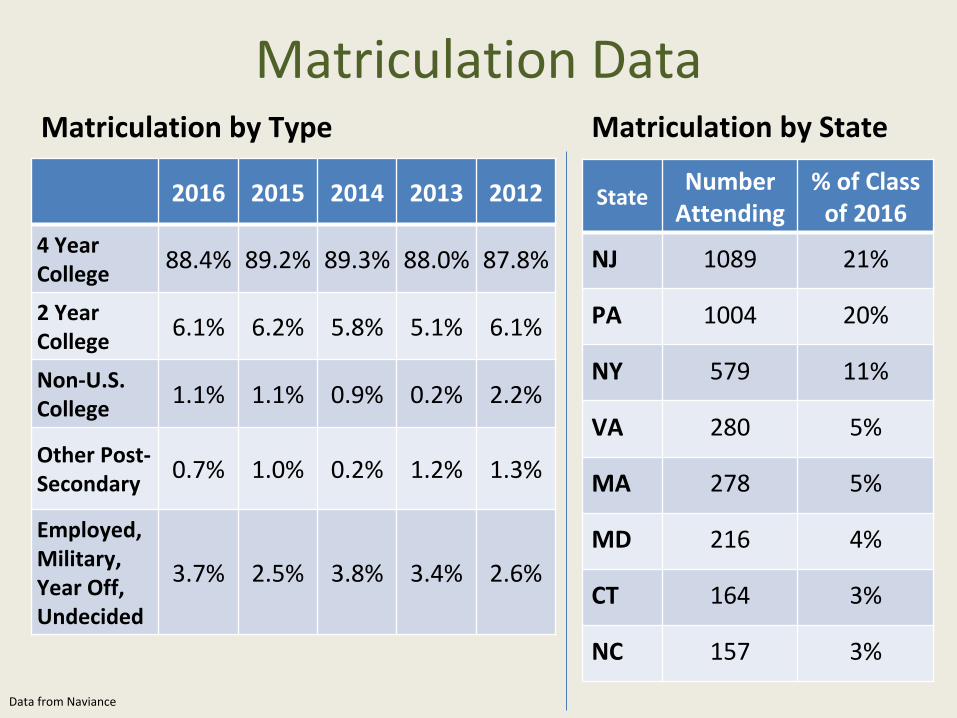
Matriculation DataMatriculation by Type
StateNumber
Attending% of Class
of 2016
NJ 1089 21%
PA 1004 20%
NY 579 11%
VA 280 5%
MA 278 5%
MD 216 4%
CT 164 3%
NC 157 3%
Matriculation by State
2016 2015 2014 2013 2012
4 Year College
88.4% 89.2% 89.3% 88.0% 87.8%
2 Year College
6.1% 6.2% 5.8% 5.1% 6.1%
Non-U.S. College
1.1% 1.1% 0.9% 0.2% 2.2%
Other Post-Secondary
0.7% 1.0% 0.2% 1.2% 1.3%
Employed, Military, Year Off, Undecided
3.7% 2.5% 3.8% 3.4% 2.6%
Data from Naviance

College Admissions Updates
• The Coalition Application
• Applications up again!
– Colleges increased outreach
– Many more new programs
Information from College Bound Magazines 2015-16; NACAC State of College Admissions Report; US News and World Report

College Admissions News
• Early Admission ups and downs
• Waitlisting is up
• More schools using SRAR
• Engineering is hot!
• Spring Admission
Information from College Bound Magazines 2015-16; NACAC State of College Admissions Report; US News and World Report