bermuda insurance market report 2014 - invest...
TRANSCRIPT
Bermuda Insurance Market Report 2014with Analysis by Standard & Poor’s

Bermuda Insurance Market Report 2014 ©2014 Deloitte Limited 1
Barbarians at the gates: Are Bermudian (Re)insurers victims of their own success?
The 2013 Bermuda Top 10
BY SHAREHOLDERS’ EQUITY $ MILLIONS BY NET PREMIUMS EARNED $ MILLIONS
1 ACE Limited 28,825 1 ACE Limited 16,613
2 XL Group plc 11,350 2 XL Group plc 6,014
3 Everest Re Group, Ltd. 6,969 3 PartnerRe Ltd. 5,198
4 PartnerRe Ltd. 6,767 4 Everest Re Group, Ltd. 4,754
5 AXIS Capital Holdings Limited 5,869 5 Catlin Group Limited 3,948
6 Arch Capital Group Ltd. 5,648 6 AXIS Capital Holdings Limited 3,707
7 Validus Holdings, Ltd. 4,289 7 Arch Capital Group Ltd. 3,146
8 OIL Insurance Limited 4,185 8 Aspen Insurance Holdings Limited 2,172
9 RenaissanceRe Holdings Ltd. 3,905 9 Validus Holdings, Ltd. 2,102
10 Catlin Group Limited 3,783 10 Endurance Specialty Holdings Ltd. 2,017
BY TOTAL ASSETS BY NET INCOME
1 ACE Limited 94,510 1 ACE Limited 3,758
2 XL Group plc 45,653 2 Everest Re Group, Ltd. 1,259
3 PartnerRe Ltd. 23,039 3 XL Group plc 1,137
4 Everest Re Group, Ltd. 19,808 4 AXIS Capital Holdings Limited 728
5 AXIS Capital Holdings Limited 19,635 5 Arch Capital Group Ltd. 710
6 Arch Capital Group Ltd. 19,567 6 RenaissanceRe Holdings Ltd. 666
7 Catlin Group Limited 14,594 7 PartnerRe Ltd. 664
8 Allied World Assurance Company Holdings, AG
11,946 8 OIL Insurance Limited 632
9 Aspen Insurance Holdings Limited 10,231 9 Validus Holdings, Ltd. 533
10 Validus Holdings, Ltd. 9,847 10 Allied World Assurance Company Holdings, AG 418
Primary Credit Analyst:Taoufik Gharib, Director [email protected]
Secondary Credit Analyst:Jason Porter, Director [email protected]
Bermudian (re)insurers reaped strong earnings in 2013 despite increasing competition, persistently low investment yields, and a tepid economic recovery in the U.S. and Europe. The 20 participants in Deloitte’s Bermuda Insurance Market Report, with analysis by Standard & Poor’s, generated strong underwriting and operating performance in 2013, thanks in part to mild catastrophe losses and favorable prior year reserve development. In aggregate, the 20 (re)insurers had a combined ratio of 85.6%, an improvement from 91.5% in 2012, and a return on average equity (ROAE) of 12.9%, up from 11.4% in 2012. These strong results have supported the Bermudian (re)insurers’ overall risk-adjusted capitalization, which we view as a rating strength.
The eight Bermudian companies with the largest market share by net premiums earned (NPE) are unchanged from last year and their positions within the list haven’t shifted: ACE Limited remains in the pole position, while XL Group plc, PartnerRe Ltd., Everest Re Group Ltd., and Catlin Group Ltd. (in that order) round out the top five.
Bermuda continues to be an underwriting hub for property and property catastrophe reinsurance. The Bermudians underwrite about one-third of the global property catastrophe business. Over the past two decades, Bermuda (AA-/Negative/A-1+) has gradually become the domicile of choice for (re)insurers setting up new businesses. Among other things, Bermuda offers relatively quick regulatory approval to launch operations (a few weeks), favorable tax laws (zero corporate income tax), and proximity to the U.S., the largest reinsurance market in the world (650 miles off the coast of North Carolina). Bermuda’s share of the global reinsurance market doubled to about 8% in 2013 from 4% a decade ago. This demonstrates the attractiveness and the competitive advantage of Bermuda as a reinsurance center.

2
One of the hottest topics on market participants’ minds was the recent rise in third-party capital (also referred to as convergence capacity, alternative capital, and collateralized reinsurance) and its effect on property catastrophe rates. Although this mechanism has been part of the reinsurance landscape for decades, the influx of third-party capital has increased significantly over the past couple of years. As much as $100 billion of alternative capital could flow into the reinsurance market during the next five years, according to reinsurance intermediary Aon Benfield.
Competition from the glut of third-party capital is only adding fuel to the fire. Traditional (re)insurers are already competing in an attempt to deploy their excess capital. In addition, large cedants (insurance companies) are rationalizing their reinsurance spending as their reinsurance purchasing decisions are increasingly made at the group level rather than at individual operating units. This portfolio optimization approach is streamlining reinsurance programs and reducing the number of reinsurers used for protection. As a result, we believe that competition among the Bermudian (re)insurers would be fierce even without the surge in third-party capital. The effects of alternative capital are most acute in the U.S. property catastrophe markets and, to a lesser extent, in the international property catastrophe markets. Market intermediaries credit third-party capital with taking over roughly 15% of the global property catastrophe reinsurance limit, or roughly $45 billion–$50 billion in total. However, competition is also intense in most other lines of business, as rates decrease on excess-of-loss covers or ceding commissions rise on pro rata treaties.
Growing competition and its potential to dent (re)insurers’ profitability caused us to revise our view on the global reinsurance sector trends to “negative” from “stable” earlier this year. The tipping point came in early January, when we observed increasingly competitive underwriting behavior among (re)insurers that we believe will weaken their profitability in 2014 and 2015. We think that companies without a defendable competitive position, or those that are more aggressive in maintaining market share by competing on price or relaxing their underwriting discipline, are most at risk. We could revise our assessment of those (re)insurers’ business risk profiles to reflect the relatively higher risk. In addition, we believe Bermudian (re)insurers with diminished capital buffers, or those whose earnings capacity is persistently constrained, could face rating pressure.
• Bermudian (re)insurers generated strong earnings in 2013, in part because of low catastrophe losses and favorable prior year reserve development, and they maintained strong capitalization.
• The influx of third-party capital into the Bermudian reinsurance market is disrupting existing business models, as competition among traditional (re)insurers also heats up.
• This increasingly competitive landscape will likely hurt Bermudian (re)insurers’ profitability in 2014 and 2015 and could threaten some players’ market positions.
• We could lower our ratings on those (re)insurers that aggressively seek to maintain market share by competing on price or relaxing their underwriting discipline, while their profits slip.

Bermuda Insurance Market Report 2014 ©2014 Deloitte Limited 3
Not surprisingly, companies in our report ranked renewal rates, investment returns, cost control, regulation, and increasing market share vs. profitability as their top five key business issues, in that order.
For those few reinsurance lines that are not experiencing lower rates, loss history plays a major component. For example, poor underwriting results in the U.K. motor insurance market have helped somewhat sustain reinsurance rates. We do not foresee an end to the downward trend on prices over the next two years. Last year turned out to be profitable for the industry, in part due to the relatively low catastrophe losses. The strong profits only add to the amount of excess capital in the industry, and returning capital to shareholders as quickly as earnings are adding to capital has been challenging. The lack of major catastrophe losses will also draw further inflows of third-party capital to the sector.
Reports on April renewals, which are mostly on Asian cedants, speak to double-digit rate decreases. The sharp increases on various Japanese programs following the 2011 Tohoku earthquake provide some rationale for the more recent declines. However, the magnitude of rate decreases surprised some market observers, who expected the more relationship-oriented Asian markets to be more stable. For the bulk of U.S. wind coverage that is placed midyear, the jury is still out. We expect meaningful rate declines, though it is still too early to say by how much. Given the current dynamic, we think only drastic changes in capital markets, adverse reserve development, or a very large catastrophe loss would be sufficient to reverse the current negative pricing trend.
Geographic Diversification Hasn’t Changed MuchIn 2013, Bermudian gross premiums written rose 8%, to $76.04 billion, from the previous year. Property and property catastrophe reinsurance together represented about one third of the premiums, which is essentially unchanged compared with the previous year. The contributions of other lines to Bermudian (re)insurers’ total business include casualty (13%), professional liability (8%), accident and health (6%), marine and aviation (5%), excess liability (4%), life (3%), general liability (3%), workers compensation (1%), terrorism (less than 1%), and other lines of business (23%). Excess liability, general liability, and professional liability have been gradually contributing more to Bermudian (re)insurers’ top line growth and strengthening their value proposition.
Pricing Is Going SouthPricing for the reinsurance market as whole has been on a downward trend for at least a year. The January renewals rate declines, of 15% or more in the U.S. property catastrophe market and 5%-15% in other territories, are the most salient evidence of pricing pressure, although the rate reductions extend throughout the reinsurance market. Excess-of-loss covers are more transactional in nature and are receiving rate decreases in most lines of business. Proportional coverage contracts, on the other hand, are benefiting from rate increases in the primary markets and the inuring benefits of cheaper excess-of-loss covers. However, increases in commissions that cedants receive from (re)insurers are offsetting most of these rate increases. Moreover, the pace of rate increases in primary markets has recently slowed, or even stopped in certain lines, such as commercial property.
TOP BUSINESS ISSUES IN BERMUDA
Renewal Rates 15
Investment Returns 14
Cost Control 13
Regulation 11
Growing Market Share vs. Profit-ability
10
Bermuda Market Presence 5
IT 4
Alternative Capital Impact on Industry (Positive)
4
Alternative Capital Impact on Industry (Negative)
4
Other 3
Resources 2
85
18%
16%
15%
13%
12%
6%
5%
5%
5%
4%
2%
100%

4
The Bermudian (re)insurers continue to generate the bulk of their premiums from the North American market. We don’t expect this to change in the next few years, as Bermudians are finding it difficult to place meaningful capacity in emerging markets, particularly in Asia. In 2013, about half of their gross premiums written were from North America, while 19% came from Continental Europe, 7% from Bermuda, 6% from the U.K., 8% from Asia-Pacific, and about 11% from the rest of world. The 2013 geographic distribution did not change significantly from 2012.
Bermudian (re)insurers are looking to expand into non-catastrophe-exposed short-tail classes of business, such as accident and health, crop, credit, and motor coverage. As a result, we could see some margin compression in those lines of business due to increasing competition.
The Net Effect Of Third-Party Capital Is NegativeBermudian (re)insurers have a few choices to address competition from third-party capital providers: beat them, join them, pull back, or use them. In the first instance, (re)insurers are emphasizing some of the advantages that they hold over third-party capacity. As unrated vehicles, reinsurance products must offer fully collateralized limits, making reinstatement limits difficult to offer. Additionally, third-party capital shops typically can’t develop relationships over multiple lines of business, are more likely to have their prices fluctuate with capital market movements, and they’re less equipped to offer the analytical services that more sophisticated (re)insurers provide. Alternatively, some (re)insurers have joined forces with third-party capital providers by creating sidecars and catastrophe funds (sometimes referred to as insurance-linked securities (ILS) funds). In this way, Bermudian (re)insurers can offer both traditional and third-party capacity according to their respective risk and return requirements, thereby broadening their product offerings while earning fee income. Other (re)insurers have been cutting back their participation in catastrophe markets and are looking to deploy that capital elsewhere, and almost all (re)insurers are now buying retrocession from third-party capital providers at favorable prices. As retrocession buyers, (re)insurers can significantly reduce tail risk and lower their cost of capital.
Despite their efforts to either combat or harness the flow of capital, we believe the net effect for Bermudian (re)insurers is negative. They will have difficulty adjusting when what has generally been their most profitable line of business (in years with light-to-average catastrophes losses) rapidly loses pricing power and becomes increasingly commoditized. In the extreme, Bermudian (re)insurers risk becoming mere conduits to the capital markets and not the primary risk bearers. While we think this is unlikely, the push in that direction can’t be denied. Similarly, increased use of retrocession may lure (re)insurers into arbitraging the rate gaps between incoming catastrophe premiums and outgoing retrocession. This could create situations where (re)insurers rely too much on potentially flighty retrocession capital.
Despite increasing competition from third-party capital and its impact on the traditional (re)insurers, the Bermuda market as a reinsurance center may further gain prominence in catastrophe reinsurance. Given that many third-party capital vehicles are domiciled in Bermuda for both tax efficiency and proximity to Bermuda’s notable reinsurance hub, the amount of reinsurance placed in the Bermuda market could grow, especially if third-party capital deepens its reinsurance presence for exposures outside of North America.
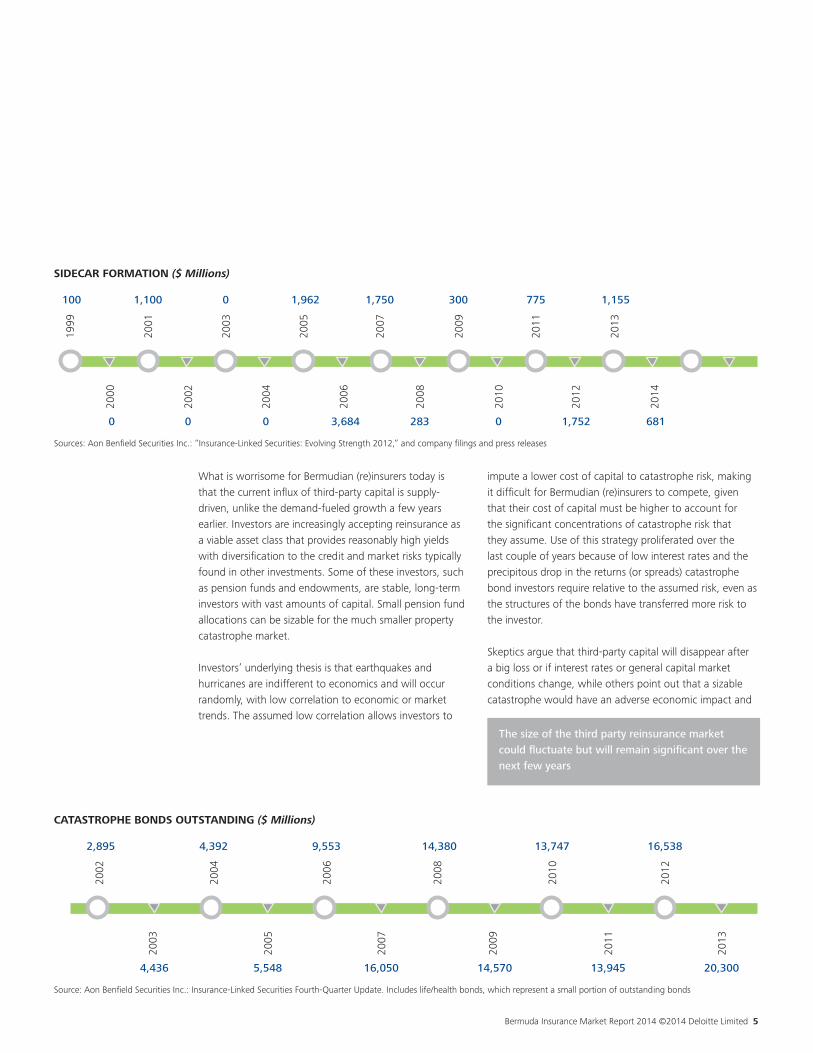
Notably, this is not the first time in history that third-party capital has rapidly expanded. For example, sidecar formation and catastrophe bond issuance ramped up quite rapidly following the hurricanes in 2004 and 2005. In the aftermath, large losses put many companies into a defensive position and others out of business. Catastrophe reinsurance markets were starved for capacity, and capital markets responded by investing in catastrophe bonds, sidecars, and a small group of start-up (re)insurers, known as the “Class of 2005”.
Some (re)insurers have joined forces with third-party capital providers [to] offer both traditional and third-party capacity according to their respective risk and return requirements
Bermuda Insurance Market Report 2014 ©2014 Deloitte Limited 5
What is worrisome for Bermudian (re)insurers today is that the current influx of third-party capital is supply-driven, unlike the demand-fueled growth a few years earlier. Investors are increasingly accepting reinsurance as a viable asset class that provides reasonably high yields with diversification to the credit and market risks typically found in other investments. Some of these investors, such as pension funds and endowments, are stable, long-term investors with vast amounts of capital. Small pension fund allocations can be sizable for the much smaller property catastrophe market.
Investors’ underlying thesis is that earthquakes and hurricanes are indifferent to economics and will occur randomly, with low correlation to economic or market trends. The assumed low correlation allows investors to
impute a lower cost of capital to catastrophe risk, making it difficult for Bermudian (re)insurers to compete, given that their cost of capital must be higher to account for the significant concentrations of catastrophe risk that they assume. Use of this strategy proliferated over the last couple of years because of low interest rates and the precipitous drop in the returns (or spreads) catastrophe bond investors require relative to the assumed risk, even as the structures of the bonds have transferred more risk to the investor.
Skeptics argue that third-party capital will disappear after a big loss or if interest rates or general capital market conditions change, while others point out that a sizable catastrophe would have an adverse economic impact and
The size of the third party reinsurance market could fluctuate but will remain significant over the next few years
2002
2,895
4,436
2003
4,392
2004
5,548
2005
9,553
2006
16,050
2007
14,380
2008
14,570
2009
13,747
2010
13,945
2011
16,538
2012
20,300
2013
Source: Aon Benfield Securities Inc.: Insurance-Linked Securities Fourth-Quarter Update. Includes life/health bonds, which represent a small portion of outstanding bonds
1999
100
0
1,100
0
0
0
1,962
3,684
1,750
283
300
0
775
1,752
1,155
681
2000
2001
2002
2003
2004
2005
2006
2007
2008
2009
2010
2011
2012
2013
2014
Sources: Aon Benfield Securities Inc.: “Insurance-Linked Securities: Evolving Strength 2012,” and company filings and press releases
SIDECAR FORMATION ($ Millions)
CATASTROPHE BONDS OUTSTANDING ($ Millions)

6
potential ramifications for the capital markets. Much of the risk that third-party reinsurance capital has historically assumed has hidden potential volatility, which the market has not yet experienced. A large U.S. hurricane, particularly in Florida, may awaken some investors to the tail risk embedded in these products and force them to rethink their beliefs about the risk they’re taking. However, we believe that long-term investors, such as pension funds, generally appreciate these risks and are not making outsized allocations to catastrophe risk. Consequently, they are less likely to retreat. Nevertheless, a large portion of the market consists of opportunistic investors, such as hedge funds, that may focus more on short-term gains. These investors could quickly move to other parts of the market after a loss or if another asset class is simply more attractive. In short, we believe that the size of the third-party reinsurance market could fluctuate but will remain significant over the next few years. Furthermore, the availability of third-party capital limits (re)insurers’ capacity to raise premium rates following large catastrophes and reduces the likelihood that a new “class” of start-ups (such as the Class of 2005) would emerge following large catastrophe losses.
Capitalization Is Still A Credit StrengthThe Bermuda-based (re)insurers have strong capitalization overall. This, along with generally declining renewal rates, has prompted many to return capital to their shareholders through special dividends, increased regular dividends, and share buybacks. However, some companies are significantly better capitalized than others. We view excess capital as a rating strength because it provides a cushion to the inherent severity risk (e.g., property catastrophe, terrorism, excess casualty) that most Bermudian (re)insurers underwrite and for possible modeling errors when evaluating their catastrophe exposures.
The participants in our Bermuda market report reported underwriting capital (defined as shareholders’ equity plus total debt) of $117.74 billion and net premiums written of $61.55 billion for 2013 compared with $96.94 billion and $47.97 billion, respectively, in 2009. Underwriting capital for the market participants was up 4.5% from the 2012 level of $112.63 billion, as a result of strong reported net income of $12.93 billion in 2013 relative to $10.69 billion in 2012, representing a 20.9% jump year over year.
Share repurchasing in 2013 totaled $4.69 billion or more than 30% higher than the amount repurchased in 2012 ($3.60 billion) by the market participants. Repurchasing shares has been an attractive way for publicly listed companies to boost their valuations, as most of the market participants that are publicly listed have broadly traded either around or slightly higher than their book value during the past 18 months as the capital markets recovered.
Balance Sheets Continue To Look StrongThe Bermudian (re)insurers benefit from strong balance sheets with limited exposure to intangible assets and asbestos and environmental (A&E) liabilities. As of year-end 2013, the surveyed companies’ total assets included quoted investments (63%), other investments (5%), cash and cash equivalents (5%), reinsurance balances receivable (7%), other assets (17%), and goodwill and other intangibles (3%).
Debt leverage slightly increased to 13.4% as of year-end 2013 from 12.4% as of year-end 2012, but remained in line with the past five year (2009–2013) average of 13.0%. Furthermore, earnings before interest and taxes (EBIT) adjusted to interest coverage significantly improved to 16.7x in 2013 from 12.6x in 2012 because of better operating results overall.
Earnings Are Solid For NowDuring the past five years, investment income has contributed between 8.8 (in 2009) and 5.3 (in 2013) percentage points to Bermudian (re)insurers’ EBIT return on underwriting capital, a common industry metric. These large percentages have been possible because the size of the market participants’ invested assets was twice that of their underwriting capital. However, the investment income contribution to EBIT has been gradually declining because of low interest rates.
The five-year (2009–2013) average EBIT return on underwriting capital for the market participants was 11.7% and reached its highest level for that period of 18.5% in 2009. Similarly, over the past five years, the market

Bermuda Insurance Market Report 2014 ©2014 Deloitte Limited 7
participants generated an average ROAE of 11.4% and were able to exceed the widely quoted reinsurance industry target of 15% over the underwriting cycle only in 2009 (ROAE of 18.6%); in the other four years, record catastrophe losses and decreasing investment income hurt returns on equity.
Investment Yields Are WaningInvestment yields have continued to decline for Bermudian (re)insurers amid low interest rates during the past few years. The market participants achieved a 2.6% net yield on invested assets including cash and cash equivalents in 2013, the lowest level in recent history, and down materially from 4.0% in 2009. The net investment income declined 4.6% to $6.15 billion in 2013 from $6.45 billion in 2012 and dropped 16.9% from $7.40 billion in 2009.
As of year-end 2013, total invested assets including cash and cash equivalents reached $235.55 billion, an increase of 1.3% relative to year-end 2012, because of Bermudian (re)insurers’ strong operating results, offset by share buybacks. At the end of 2013, their asset allocation included corporate debt securities (33%), foreign government debt securities (16%), U.S. government and government agency debt securities (10%), mortgage and asset-backed securities (22%), equities (5%), and other investments (14%).
As a result of the significant drop in investment yields, the property and casualty (re)insurance market is going to need to raise pricing to achieve the level of returns shareholders require
Cash & CashEquivalents
5%
Quoted Investments
63%
OtherInvestments
5%
Reinsurance Balances
Receivable 7%
Other Assets 17%
Goodwill & OtherIntangible Assets
3%
TOTAL ASSETS COMPOSITION FOR COMPANIES IN THE REPORT
TOTAL ASSETS COMPOSITION FOR COMPANIES IN THE REPORT
U.S. Government & Government Agency Debt
securities 10%
Foreign Government
Debt Securities 16%
Corporate Debt Securities
33%
Mortgage & Asset Backed
Securities 22%
Equities 5%
Other 14%
TOTAL QUOTED INVESTMENT COMPOSITION FOR COMPANIES IN THE REPORT
TOTAL QUOTED INVESTMENT COMPOSITION FOR COMPANIES IN THE REPORT
CONTRIBUTION ANALYSIS: EBIT RETURN ON AVERAGE UNDERWRITING CAPITAL (ROAC)
8.6%
4.1%
-3.7%
3.1% 6.2%
8.8%
7.0%
6.6%
6.0%
5.3%
1.1%
2.3%
-0.6%
2.3%
1.4%
-5%
0%
5%
10%
15%
20%
2009 2010 2011 2012 2013
Underwriting contribution to ROAC Investment income contribution to ROAC Realized capital G/(L) contribution to ROAC
CONTRIBUTION ANALYSIS: EBIT RETURN ON AVERAGE UNDERWRITING CAPITAL (ROAC)

8
Most of the market participants have willingly traded-off investment risk for underwriting risk and have maintained relatively conservative investment portfolios over the past few years. Typically, the duration of fixed-income investments for most of the Bermudian (re)insurers is between two and four years, with an average credit rating between ‘A’ and ‘AA’ (at year-end 2013, 82% of the Bermudians’ fixed income investments were rated ‘A-’ or higher). As a result of the significant drop in investment yields, the property and casualty (re)insurance market is going to need to raise pricing to achieve the level of returns shareholders require.
As of year-end 2013, the Bermudian (re)insurers collectively had virtually no exposure to the sovereign debt from European periphery countries (i.e, Greece, Ireland, Italy, Portugal, and Spain). The market participants’ non-U.S. government debt holdings represented approximately 16% of their total invested assets (excluding cash and cash equivalents) at year-end 2013, up slightly from 14% in 2009. Over the past couple of years, as the capital markets recovered, realized capital gains have contributed to these companies’ bottom line, at $2.06 billion in 2013 compared with $1.49 billion in 2012.
Reserve redundancy and increased likelihood of adverse reserve development could make disciplined, profitable underwriting a ratings differentiator in the next few years
Favorable Reserve Releases Could Dry UpOver the past five years (2009–2013), Bermudian (re)insurers’ calendar-year results have benefited from favorable prior-year loss reserve development. During the same timeframe, the Bermudian (re)insurers released a total of $17.56 billion in reserves, which represented 6.6 percentage points on the combined ratio. The favorable prior-year developments have come largely from the latest set of hard market years (i.e., 2002 to 2005) for casualty reinsurance. The market participants’ calendar-year loss ratio benefited from 7.5 percentage points of favorable prior-year development in 2009 and 6.3 percentage points in 2013.
We believe that the remaining redundancies associated with these hard market years are limited and, as a result, we expect the ongoing benefits to decrease relative to the past few years. Although we believe that loss reserves are generally adequate among the Bermudian (re)insurers we rate, some could experience adverse development on the more recent accident years. We also believe that the reserve redundancy and increased likelihood of adverse development could make disciplined, profitable underwriting a rating differentiator in the next few years.
Bermuda’s Top 10 List By Net Premiums Earned Is Mostly UnchangedThe eight Bermudian companies with the largest market share by net premiums earned (NPE) are unchanged from last year and their positions within the list haven’t shifted: ACE Ltd. remains in the lead position, while XL Group plc, PartnerRe Ltd., Everest Re Group Ltd., and Catlin Group Ltd. (in that order) round out the top five.
53.5% 60.0%
75.1%
61.8% 55.8%
61.0% 66.8%
81.6%
67.8% 62.1%
0%
10%
20%
30%
40%
50%
60%
70%
80%
90%
100%
2009 2010 2011 2012 2013
CALENDAR YEAR VS. ACCIDENT YEAR LOSS & LAE1 RATIO
Calendar year loss & LAE ratio Accident year loss & LAE ratio
1 LAE: Loss adjustment expense
CALENDAR YEAR VS. ACCIDENT YEAR LOSS & LAE1 RATIO
Bermuda Insurance Market Report 2014 ©2014 Deloitte Limited 9
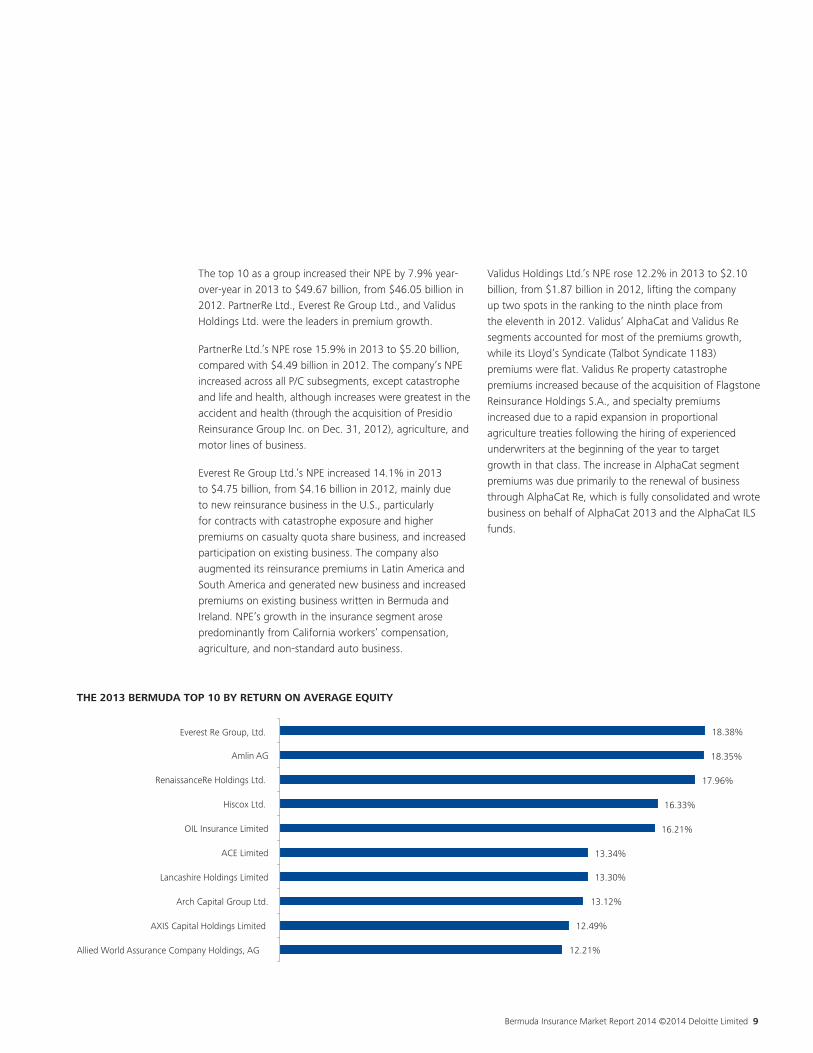
The top 10 as a group increased their NPE by 7.9% year-over-year in 2013 to $49.67 billion, from $46.05 billion in 2012. PartnerRe Ltd., Everest Re Group Ltd., and Validus Holdings Ltd. were the leaders in premium growth.
PartnerRe Ltd.’s NPE rose 15.9% in 2013 to $5.20 billion, compared with $4.49 billion in 2012. The company’s NPE increased across all P/C subsegments, except catastrophe and life and health, although increases were greatest in the accident and health (through the acquisition of Presidio Reinsurance Group Inc. on Dec. 31, 2012), agriculture, and motor lines of business.
Everest Re Group Ltd.’s NPE increased 14.1% in 2013 to $4.75 billion, from $4.16 billion in 2012, mainly due to new reinsurance business in the U.S., particularly for contracts with catastrophe exposure and higher premiums on casualty quota share business, and increased participation on existing business. The company also augmented its reinsurance premiums in Latin America and South America and generated new business and increased premiums on existing business written in Bermuda and Ireland. NPE’s growth in the insurance segment arose predominantly from California workers’ compensation, agriculture, and non-standard auto business.
Validus Holdings Ltd.’s NPE rose 12.2% in 2013 to $2.10 billion, from $1.87 billion in 2012, lifting the company up two spots in the ranking to the ninth place from the eleventh in 2012. Validus’ AlphaCat and Validus Re segments accounted for most of the premiums growth, while its Lloyd’s Syndicate (Talbot Syndicate 1183) premiums were flat. Validus Re property catastrophe premiums increased because of the acquisition of Flagstone Reinsurance Holdings S.A., and specialty premiums increased due to a rapid expansion in proportional agriculture treaties following the hiring of experienced underwriters at the beginning of the year to target growth in that class. The increase in AlphaCat segment premiums was due primarily to the renewal of business through AlphaCat Re, which is fully consolidated and wrote business on behalf of AlphaCat 2013 and the AlphaCat ILS funds.
12.21%
12.49%
13.12%
13.30%
13.34%
16.21%
16.33%
17.96%
18.35%
18.38%
Allied World Assurance Company Holdings, AG
AXIS Capital Holdings Limited
Arch Capital Group Ltd.
Lancashire Holdings Limited
ACE Limited
OIL Insurance Limited
Hiscox Ltd.
RenaissanceRe Holdings Ltd.
Amlin AG
Everest Re Group, Ltd.
THE 2013 BERMUDA TOP 10 BY RETURN ON AVERAGE EQUITY

10
Endurance Specialty Holdings Ltd.’s NPE remained virtually flat at $2.02 billion year-over-year in 2013. The company dropped to No. 10 in 2013 from No. 9 in 2012. Under the leadership of its new CEO, John Charman, who joined in May 2013, the company is experiencing a rapid transformation by expanding its global underwriting talent, rebalancing its insurance and reinsurance portfolios to lower volatility and improve profitability, and refocusing its corporate and enterprise risk functions. We expect Endurance’s NPE to expand, as the new underwriting team gains traction in the next few years.
In 2013, the 20 market participants reported a ROAE of 12.9%, up from 11.4% in 2012. Everest Re Group Ltd. has the highest ROAE at 18.4%, mostly as a result of its increase in NPE, improved underwriting results, and net realized capital gains on equity securities.
Rating Actions In 2013On Oct. 30, 2013, Standard & Poor’s raised its long-term counterparty credit and financial strength ratings on XL Group plc’s intermediary holding company, XLIT Ltd., and its core operating subsidiaries (collectively XL) to ‘A+’ from ‘A’. At the same time, we raised our long-term counterparty credit on XLIT Ltd. to ‘A-’ from ‘BBB+’. The outlook is stable. The upgrade reflects our view that XL has demonstrated improved operating performance and will be able to sustain such improvement through strategic growth initiatives, a strong market presence, and a strong enterprise risk management (ERM) framework that will contribute to earnings stability. In recent years, the company has divested its financial-guarantee business, deleveraged its balance sheet, and managed down the risk in its investment portfolio. As a result, XL’s financial flexibility is strong and has improved markedly during the past few years. We believe XL will continue to improve its fixed-charge coverage and maintain it at least at 5x with its financial leverage at less than 25%. In addition, management has renewed XL’s focus on P/C insurance and reinsurance operations and placed the life reinsurance operations in run-off. We expect the company to continue to increase premiums strategically while maintaining strong underwriting performance.
On July 31, 2013, Standard & Poor’s changed its outlook to negative from stable on Argo Group International Holdings Ltd.’s U.S.-based intermediary holding company and its core operating subsidiaries. The negative outlook reflects our view that management faces potential execution risks related to successfully achieving its plans to improve the group’s operating performance and maintain risk management capabilities in line with its risk appetite and the growing complexity of its operations.
In addition, on May 22, 2013, we revised our outlook on ACE Ltd. and its operating subsidiaries to positive from stable. The outlook revision reflects our favorable view of the group’s superior operating performance relative to that of its global multiline insurance peers, its excellent underwriting practices and strong focus on underwriting discipline and bottom-line profits, and sustainable competitive advantages in several of its key lines of business, which support its extremely strong competitive position.
ERM Practices May Be Tested Very SoonSince Standard & Poor’s introduced its ERM criteria in 2005, it has found that, in general, the Bermudian (re)insurers have sophisticated ERM frameworks. This has been key to their stability in recent years and a rating strength. Overall, we consider their ERM capabilities to be strong, and they are among the leading practitioners in the industry. In fact, their ERM practices have been tested through a number of natural and man-made catastrophes and financial crises over the past decade.
Despite the significant and unusual natural catastrophe events over the past few years (e.g., Tohoku and Christchurch earthquakes), and the accompanying financial market volatility in Europe and the U.S., Standard & Poor’s ERM scores for the Bermudian (re)insurers overall have remained relatively stable over the past few years.
With the continuation of rate decreases in property catastrophe and other lines of business, relative risk-adjusted returns for various risk exposures will shift. This could force (re)insurers to implement some strategic changes based on the guidance of their ERM functions.
Bermuda Insurance Market Report 2014 ©2014 Deloitte Limited 11
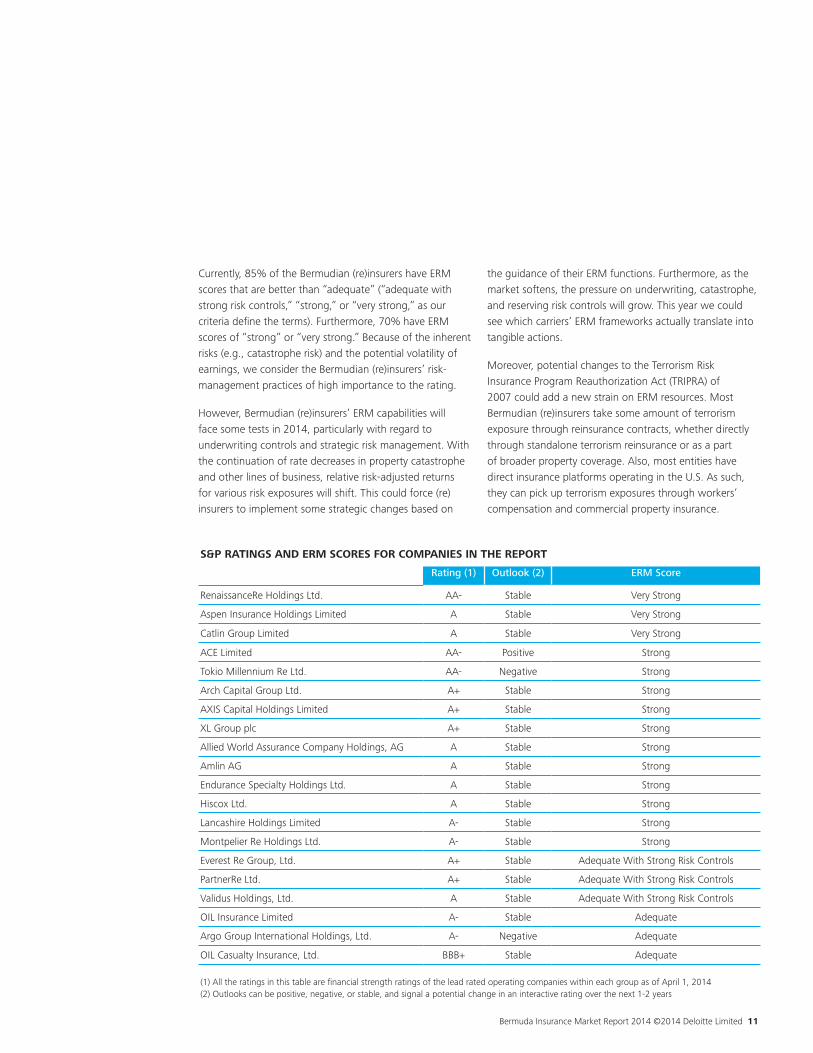
Currently, 85% of the Bermudian (re)insurers have ERM scores that are better than “adequate” (“adequate with strong risk controls,” “strong,” or “very strong,” as our criteria define the terms). Furthermore, 70% have ERM scores of “strong” or “very strong.” Because of the inherent risks (e.g., catastrophe risk) and the potential volatility of earnings, we consider the Bermudian (re)insurers’ risk-management practices of high importance to the rating.
However, Bermudian (re)insurers’ ERM capabilities will face some tests in 2014, particularly with regard to underwriting controls and strategic risk management. With the continuation of rate decreases in property catastrophe and other lines of business, relative risk-adjusted returns for various risk exposures will shift. This could force (re)insurers to implement some strategic changes based on
the guidance of their ERM functions. Furthermore, as the market softens, the pressure on underwriting, catastrophe, and reserving risk controls will grow. This year we could see which carriers’ ERM frameworks actually translate into tangible actions.
Moreover, potential changes to the Terrorism Risk Insurance Program Reauthorization Act (TRIPRA) of 2007 could add a new strain on ERM resources. Most Bermudian (re)insurers take some amount of terrorism exposure through reinsurance contracts, whether directly through standalone terrorism reinsurance or as a part of broader property coverage. Also, most entities have direct insurance platforms operating in the U.S. As such, they can pick up terrorism exposures through workers’ compensation and commercial property insurance.
S&P RATINGS AND ERM SCORES FOR COMPANIES IN THE REPORT
Rating (1) Outlook (2) ERM Score
RenaissanceRe Holdings Ltd. AA- Stable Very Strong
Aspen Insurance Holdings Limited A Stable Very Strong
Catlin Group Limited A Stable Very Strong
ACE Limited AA- Positive Strong
Tokio Millennium Re Ltd. AA- Negative Strong
Arch Capital Group Ltd. A+ Stable Strong
AXIS Capital Holdings Limited A+ Stable Strong
XL Group plc A+ Stable Strong
Allied World Assurance Company Holdings, AG A Stable Strong
Amlin AG A Stable Strong
Endurance Specialty Holdings Ltd. A Stable Strong
Hiscox Ltd. A Stable Strong
Lancashire Holdings Limited A- Stable Strong
Montpelier Re Holdings Ltd. A- Stable Strong
Everest Re Group, Ltd. A+ Stable Adequate With Strong Risk Controls
PartnerRe Ltd. A+ Stable Adequate With Strong Risk Controls
Validus Holdings, Ltd. A Stable Adequate With Strong Risk Controls
OIL Insurance Limited A- Stable Adequate
Argo Group International Holdings, Ltd. A- Negative Adequate
OIL Casualty Insurance, Ltd. BBB+ Stable Adequate (1) All the ratings in this table are financial strength ratings of the lead rated operating companies within each group as of April 1, 2014(2) Outlooks can be positive, negative, or stable, and signal a potential change in an interactive rating over the next 1-2 years

12
A significant change in TRIPRA could expose (re)insurers to significantly more terrorism risk through their direct business. More importantly, the demand for traditional terrorism (excluding nuclear, chemical, biological, and radiological) reinsurance could surge. Those that are able to control, optimize, and manage this risk may be able to capitalize on the market opportunity. Those with weaker risk management may end up overexposed.
On the regulatory front, Solvency II requirements will be in force in 2016. While the Bermuda Monetary Authority (BMA) continues its efforts to meet an EU equivalency standard, the Bermudian (re)insurers will continue to enhance their ERM programs to meet Solvency II standards. Bermudians in general have been ahead of the curve in preparing for the implementation of Solvency II.
Consolidation May Move Up In The AgendaIn our view, consolidation will rise in importance on the strategic agendas of the Bermudian (re)insurers over the next 12 months. For smaller players that are trying to compete globally, consolidation may be one of the few viable survival options, while midlevel players will be looking to acquire greater size and scope. Meanwhile, book values have climbed in recent years, as most market participants have broadly traded around or slightly higher than their book value over the past 18 months, so they’ve become more accommodating of M&A activity. Buyers and sellers of reinsurance businesses appear to be placing more emphasis on size as a competitive advantage. As (re)insurers look to expand their size and scope to meet their clients’ needs, M&A will likely be the most attractive option in an unfriendly market.
Underwriting Discipline, Rate Adequacy, And Profitability Are Key Metrics To WatchGiven the current lower pricing, relatively low investment yields, and our projection for diminishing prior-year reserve redundancies, we expect the Bermudian (re)insurers to generate an EBIT return on underwriting capital in the high single digits, assuming normalized catastrophe losses. Although this is below the five-year (2009–2013) average EBIT return on underwriting capital, we think the contribution will be more evenly split between underwriting and investment.
We think that companies without a defendable competitive position, or those that are more aggressive in maintaining market share by competing on price or relaxing their underwriting discipline, are most at risk. Smaller, catastrophe-risk heavy Bermudian (re)insurers providing commodity type products are most under pressure. Competitive pressures will hit their margins hardest and threaten their business models most directly. In addition, the risk positions could weaken for (re)insurers whose exposure levels rise without a commensurate increase in premiums, through taking more business at lower rates or expanding coverage while maintaining flat premium rates.
We’ll focus heavily on Bermudian (re)insurers’ underwriting discipline, rate adequacy, and profitability prospects for the next 12 to 24 months. Many of these companies will prove successful in navigating this soft market by adhering to established underwriting and risk controls. It will be those companies at the margins and those that relax their rigor that likely succumb to consolidation or suffer negative rating actions.
About the Bermuda Insurance Market ReportTo create the Bermuda Insurance Market Report, Deloitte obtained and compiled the financial data from Bermuda-based (re)insurance companies for fiscal years 2009-2013. Standard & Poor’s analyzed the compiled financial data and prepared the industry commentary. The report includes a few metrics that are commonly used in the industry. However, the method for calculating certain metrics in the report (e.g., EBIT return on underwriting capital) may be different than in Standard & Poor’s rating criteria.
Buyers and sellers of reinsurance businesses appear to be placing more emphasis on size as a competitive advantage. As (re)insurers look to expand their size and scope to meet their clients’ needs, M&A will likely be the most attractive option in an unfriendly market.

13
Market Report Participants Data and Information
14
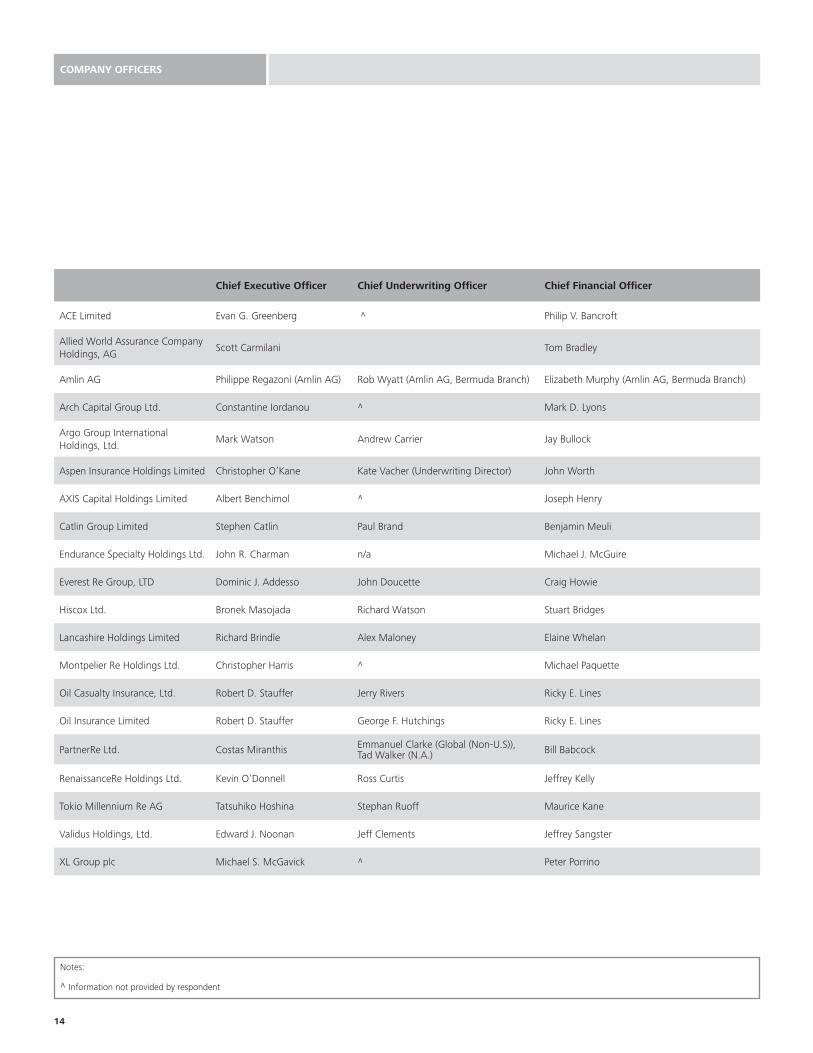
Chief Executive Officer Chief Underwriting Officer Chief Financial Officer
ACE Limited Evan G. Greenberg ^ Philip V. Bancroft
Allied World Assurance Company Holdings, AG
Scott Carmilani Tom Bradley
Amlin AG Philippe Regazoni (Amlin AG) Rob Wyatt (Amlin AG, Bermuda Branch) Elizabeth Murphy (Amlin AG, Bermuda Branch)
Arch Capital Group Ltd. Constantine Iordanou ^ Mark D. Lyons
Argo Group International Holdings, Ltd.
Mark Watson Andrew Carrier Jay Bullock
Aspen Insurance Holdings Limited Christopher O’Kane Kate Vacher (Underwriting Director) John Worth
AXIS Capital Holdings Limited Albert Benchimol ^ Joseph Henry
Catlin Group Limited Stephen Catlin Paul Brand Benjamin Meuli
Endurance Specialty Holdings Ltd. John R. Charman n/a Michael J. McGuire
Everest Re Group, LTD Dominic J. Addesso John Doucette Craig Howie
Hiscox Ltd. Bronek Masojada Richard Watson Stuart Bridges
Lancashire Holdings Limited Richard Brindle Alex Maloney Elaine Whelan
Montpelier Re Holdings Ltd. Christopher Harris ^ Michael Paquette
Oil Casualty Insurance, Ltd. Robert D. Stauffer Jerry Rivers Ricky E. Lines
Oil Insurance Limited Robert D. Stauffer George F. Hutchings Ricky E. Lines
PartnerRe Ltd. Costas Miranthis Emmanuel Clarke (Global (Non-U.S)), Tad Walker (N.A.) Bill Babcock
RenaissanceRe Holdings Ltd. Kevin O’Donnell Ross Curtis Jeffrey Kelly
Tokio Millennium Re AG Tatsuhiko Hoshina Stephan Ruoff Maurice Kane
Validus Holdings, Ltd. Edward J. Noonan Jeff Clements Jeffrey Sangster
XL Group plc Michael S. McGavick ^ Peter Porrino
Notes: ^ Information not provided by respondent
COMPANY OFFICERS
Bermuda Insurance Market Report 2014 ©2014 Deloitte Limited 15
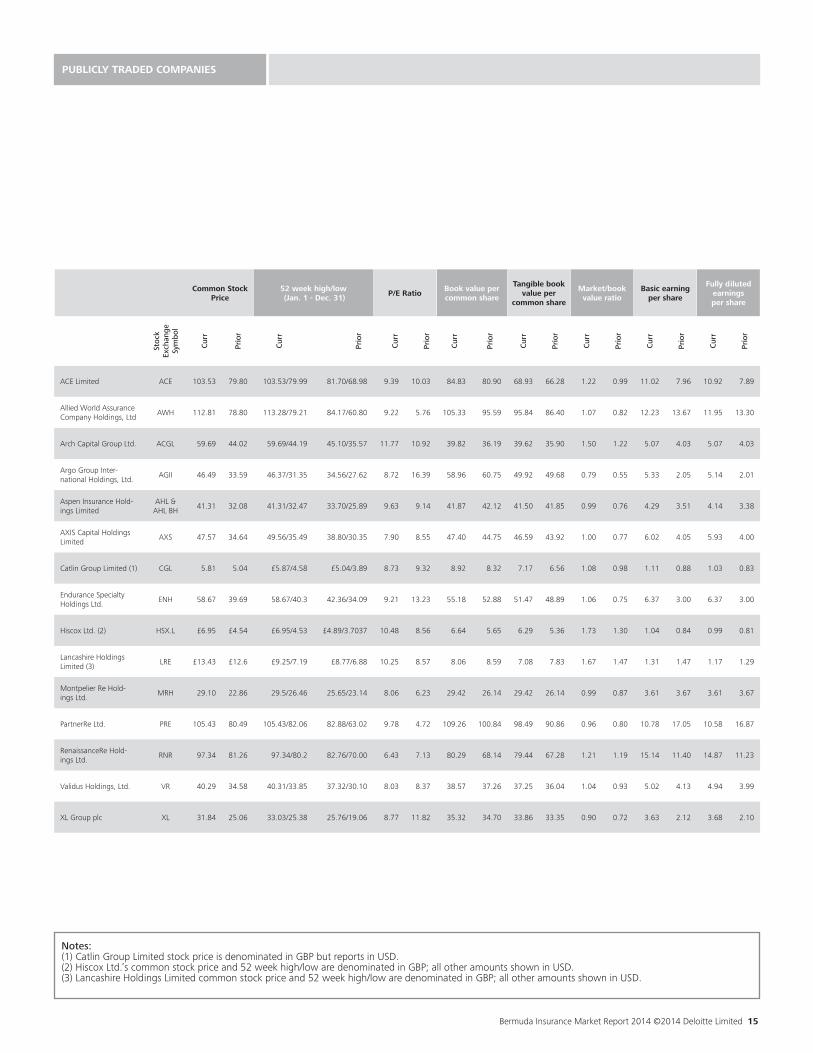
Common Stock Price
52 week high/low (Jan. 1 - Dec. 31)
P/E RatioBook value per common share
Tangible book value per
common share
Market/book value ratio
Basic earning per share
Fully diluted earnings per share
Stoc
k Ex
chan
ge
Sym
bol
Cur
r
Prio
r
Cur
r
Prio
r
Cur
r
Prio
r
Cur
r
Prio
r
Cur
r
Prio
r
Cur
r
Prio
r
Cur
r
Prio
r
Cur
r
Prio
r
ACE Limited ACE 103.53 79.80 103.53/79.99 81.70/68.98 9.39 10.03 84.83 80.90 68.93 66.28 1.22 0.99 11.02 7.96 10.92 7.89
Allied World Assurance Company Holdings, Ltd
AWH 112.81 78.80 113.28/79.21 84.17/60.80 9.22 5.76 105.33 95.59 95.84 86.40 1.07 0.82 12.23 13.67 11.95 13.30
Arch Capital Group Ltd. ACGL 59.69 44.02 59.69/44.19 45.10/35.57 11.77 10.92 39.82 36.19 39.62 35.90 1.50 1.22 5.07 4.03 5.07 4.03
Argo Group Inter-national Holdings, Ltd.
AGII 46.49 33.59 46.37/31.35 34.56/27.62 8.72 16.39 58.96 60.75 49.92 49.68 0.79 0.55 5.33 2.05 5.14 2.01
Aspen Insurance Hold-ings Limited
AHL & AHL BH
41.31 32.08 41.31/32.47 33.70/25.89 9.63 9.14 41.87 42.12 41.50 41.85 0.99 0.76 4.29 3.51 4.14 3.38
AXIS Capital Holdings Limited
AXS 47.57 34.64 49.56/35.49 38.80/30.35 7.90 8.55 47.40 44.75 46.59 43.92 1.00 0.77 6.02 4.05 5.93 4.00
Catlin Group Limited (1) CGL 5.81 5.04 £5.87/4.58 £5.04/3.89 8.73 9.32 8.92 8.32 7.17 6.56 1.08 0.98 1.11 0.88 1.03 0.83
Endurance Specialty Holdings Ltd.
ENH 58.67 39.69 58.67/40.3 42.36/34.09 9.21 13.23 55.18 52.88 51.47 48.89 1.06 0.75 6.37 3.00 6.37 3.00
Hiscox Ltd. (2) HSX.L £6.95 £4.54 £6.95/4.53 £4.89/3.7037 10.48 8.56 6.64 5.65 6.29 5.36 1.73 1.30 1.04 0.84 0.99 0.81
Lancashire Holdings Limited (3)
LRE £13.43 £12.6 £9.25/7.19 £8.77/6.88 10.25 8.57 8.06 8.59 7.08 7.83 1.67 1.47 1.31 1.47 1.17 1.29
Montpelier Re Hold-ings Ltd.
MRH 29.10 22.86 29.5/26.46 25.65/23.14 8.06 6.23 29.42 26.14 29.42 26.14 0.99 0.87 3.61 3.67 3.61 3.67
PartnerRe Ltd. PRE 105.43 80.49 105.43/82.06 82.88/63.02 9.78 4.72 109.26 100.84 98.49 90.86 0.96 0.80 10.78 17.05 10.58 16.87
RenaissanceRe Hold-ings Ltd.
RNR 97.34 81.26 97.34/80.2 82.76/70.00 6.43 7.13 80.29 68.14 79.44 67.28 1.21 1.19 15.14 11.40 14.87 11.23
Validus Holdings, Ltd. VR 40.29 34.58 40.31/33.85 37.32/30.10 8.03 8.37 38.57 37.26 37.25 36.04 1.04 0.93 5.02 4.13 4.94 3.99
XL Group plc XL 31.84 25.06 33.03/25.38 25.76/19.06 8.77 11.82 35.32 34.70 33.86 33.35 0.90 0.72 3.63 2.12 3.68 2.10
Notes:(1) Catlin Group Limited stock price is denominated in GBP but reports in USD.(2) Hiscox Ltd.’s common stock price and 52 week high/low are denominated in GBP; all other amounts shown in USD.(3) Lancashire Holdings Limited common stock price and 52 week high/low are denominated in GBP; all other amounts shown in USD.
PUBLICLY TRADED COMPANIES

16
Capital & SurplusType of
Insurance as % of premiums
Co
mp
any
S&P
’s
Rat
ing
(1
)
Outl
oo
ks (
3)
S&P
’s E
RM
Sc
ore
Bas
is o
f ac
counti
ng
Curr
ent
Pri
or
Pre
miu
ms
earn
ed
Curr
ent
Net
Inco
me
Curr
ent
Insu
rance
R
egula
tio
n
Cla
ss
Dat
e o
f In
corp
ora
tio
n
Dir
ect
Rei
nsu
rance
ACE Limited AA- Positive Strong US GAAP 28,825,000 27,531,000 16,613,000 3,758,000 Class 4 8/30/85 84% 16%
Allied World Assurance Company Holdings, AG
A Stable Strong US GAAP 3,519,826 3,326,335 2,005,833 417,880 Class 4 11/13/01 66% 34%
Amlin AG A Stable Strong Other 1,653,158 1,625,433 1,078,738 300,747 Class 4 10/28/05 0% 100%
Arch Capital Group Ltd. A+ Stable Strong US GAAP 5,647,496 5,168,878 3,145,952 709,731 Class 4 3/1/95 66% 34%
Argo Group International Holdings, Ltd.
A- Negative Adequate US GAAP 1,563,000 1,514,100 1,303,800 143,200 Class 4 10/5/99 83% 17%
Aspen Insurance Holdings Limited
A Stable Very Strong US GAAP 3,300,000 3,489,000 2,172,000 329,400 Class 4 5/23/02 57% 43%
AXIS Capital Holdings Limited
A+ Stable Strong US GAAP 5,867,962 5,779,761 3,707,065 727,465 Class 4 11/8/01 55% 45%
Catlin Group Limited A Stable Very Strong US GAAP 3,782,581 3,511,867 3,948,238 392,028 Class 4 6/25/99 63% 37%
Endurance Specialty Holdings Ltd.
A Stable Strong US GAAP 2,886,549 2,710,597 2,016,484 311,915 Class 4 11/30/01 55% 45%
Everest Re Group, Ltd. (2) A+ StableAdequate
With Strong Risk Controls
US GAAP 6,968,276 6,733,467 4,753,543 1,259,382 N/a 2/24/00 24% 76%
Hiscox Ltd. A Stable Strong Other 2,325,611 2,225,546 2,005,815 371,616 Class 4 12/12/06 77% 23%
Lancashire Holdings Limited
A- Stable Strong Other 1,460,400 1,387,400 568,100 189,400 Class 4 10/12/05 68% 32%
Montpelier Re Holdings Ltd.
A- Stable Strong US GAAP 1,887,000 1,629,400 599,600 210,600 Class 4 11/14/01 20% 80%
Oil Casualty Insurance, Ltd. BBB+ Stable Adequate US GAAP 529,094 489,471 107,271 39,648 Class 3B 5/14/86 43% 57%
Oil Insurance Limited A- Stable Adequate US GAAP 4,184,868 3,611,771 550,361 631,898 Class 2 12/14/71 100% 0%
PartnerRe Ltd. A+ StableAdequate
With Strong Risk Controls
US GAAP 6,766,159 6,933,496 5,198,210 664,008 Class 4 8/24/93 0% 100%
RenaissanceRe Holdings Ltd.
AA- Stable Very Strong US GAAP 3,904,384 3,507,056 1,114,626 665,676 N/a 6/7/93 3% 97%
Tokio Millennium Re AG AA- Negative Strong Other 1,273,059 1,173,340 664,449 140,026 Class 3B 3/15/00 0% 100%
Validus Holdings, Ltd. A StableAdequate
With Strong Risk Controls
US GAAP 4,288,263 4,455,107 2,102,045 532,666 Class 4 10/19/05 23% 77%
XL Group plc A+ Stable Strong US GAAP 11,349,298 11,856,397 6,014,099 1,136,647 Class 4 3/16/98 74% 26%
Total 101,981,984 98,659,422 59,669,229 12,931,933
Notes:(1) All the ratings in this table are financial strength ratings of the lead rated operating companies within each group as of April 1, 2014(2) All Everest Re Group, Ltd.’s financial information provided in this report is unaudited.(3) Outlooks can be positive, negative, or stable, and signal a potential change in an interactive rating over the next 1-2 years.^ Information not provided by respondent.
COMPANY INFORMATION (US$ 000s)

Bermuda Insurance Market Report 2014 ©2014 Deloitte Limited 17
Type of Insur-ance as % of
premiumsBreakdown of premium as class of business risk
Breakdown of Gross premium by Geographic Region
Pro
po
rtio
nal
No
n-
Pro
po
rtio
nal
Mar
ine
&
Avi
atio
n
Finan
cial
G
uar
ante
e
Acc
iden
t &
H
ealt
h
Pro
per
ty
Pro
per
ty
Cat
astr
op
he
Pro
fess
ional
Li
abili
ty
Exce
ss
Liab
ility
Gen
eral
Li
abili
ty
Cas
ual
ty
Finit
e
Wo
rker
s C
om
pen
sati
on
Life
Terr
ori
sm
Oth
er
UK
No
rth A
mer
ica
Euro
pe
Asi
a, A
ust
ralia
&
New
Zea
land
Ber
mud
a
Res
t o
f W
orl
d
0% 0% 0% 0% 21% 37% 2% 0% 0% 0% 35% 0% 0% 5% 0% 0% 0% 58% 17% 16% 0% 9%
46% 54% 1% 0% 0% 11% 0% 17%24%
10% 3% 0% 0% 0% 0% 34% 0% 60% 10% 6% 24% 0%
53% 47% 2% 0% 0% 20% 26% 0% 0% 14% 1% 0% 0% 0% 1% 35% 36% 27% 30% 7% 0% 1%
56% 44% 2% 0% 3% 26% 6% 11% 21% 0% 0% 0% 5% 0% 1% 25% 0% 72% 17% 6% 3% 3%
^ ^ ^ ^ ^ ^ ^ ^ ^ ^ ^ ^ ^ ^ ^ ^ ^ ^ ^ ^ ^ ^
96% 4% 0% 0% 0% 20% 10% 0%0%
0% 22% 0% 0% 0% 0% 47% 6% 45% 4% 4% 0% 41%
58% 42% 6% 0% 6% 22% 8% 27% 0% 13% 0% 0% 0% 0% 1% 17% 0% 49% 36% 0% 15% 0%
^ ^ 22% 0% 0% 12% 0% 0% 0% 0% 22% 0% 0% 0% 0% 44% 47% 25% 10% 7% 11% 0%
51% 49% 2% 3% 0% 13% 13% 12% 11% 0% 9% 0% 0% 0% 0% 36% 2% 68% 8% 2% 20% 0%
67% 33% 3% 1% 1% 49% 0% 8% 10% 17% 4% 0% 8% 0% 0% 0% 8% 65% 4% 6% 2% 16%
^ ^ 5% 0% 1% 28% 3% 29% 0% 0% 0% 0% 0% 0% 3% 31% 21% 38% 13% 2% 0% 26%
1% 99% 18% 0% 0% 46% 27% 0% 0% 0% 0% 0% 0% 0% 10% 0% 0% 37% 6% 8% 0% 49%
^ ^ 0% 0% 0% 8% 46% 0%0%
0% 0% 0% 0% 0% 0% 46% 33% 0% 0% 0% 67% 0%
^ ^ 0% 0% 0% 23% 0% 0% 41% 0% 32% 0% 0% 0% 0% 4% ^ ^ ^ ^ ^ ^
^ ^ 0% 0% 0% 100% 0% 0% 0% 0% 0% 0% 0% 0% 0% 0% ^ ^ ^ ^ ^ ^
72% 28% 11% 0% 2% 12% 9% 0% 0% 0% 12% 0% 0% 15% 0% 39% 0% 39% 40% 11% 0% 10%
82% 18% 0% 0% 0% 0% 72% 0% 0% 0% 0% 0% 0% 0% 0% 28% 0% 59% 3% 5% 0% 33%
50% 50% 0% 0% 0% 0% 54% 8% 0% 6% 8% 0% 2% 0% 1% 20% 1% 77% 10% 6% 0% 6%
20% 80% 29% 0% 1% 17% 31% 0% 0% 0% 0% 0% 0% 0% 1% 20% 0% 26% 5% 4% 0% 66%
^ ^ 1% 0% 0% 19% 7% 22% 0% 0% 0% 0% 0% 4% 0% 47% 0% 43% 45% 0% 13% 0%
COMPANY INFORMATION (US$ 000s)

18
Notes:(1) All Everest Re Group, Ltd. financial information provided in this report is unaudited.(2) Hiscox Ltd. balance sheet amounts were translated from GBP to USD using 1.65 closing and 1.563 average rates to translate the income statement.
Assets Liabilities and Capital & Surplus
Company Cash & Cash Equivalents
Quoted Investments
Other Investments
Reinsurance Balances
ReceivableOther Assets
Goodwill and Other Intangible
Assets
Total Assets Loss ReservesUnearned Premium Reserve
ACE Limited 579,000 57,952,000 2,976,000 5,026,000 22,573,000 5,404,000 94,510,000 42,058,000 7,539,000
Allied World Assurance Company Holdings, AG
681,329 6,100,798 1,611,238 1,575,496 1,659,762 317,207 11,945,830 5,766,529 1,396,256
Amlin AG 106,562 2,465,425 192,056 530,515 98,654 - 3,393,212 1,114,008 481,362
Arch Capital Group Ltd. 434,057 12,340,144 1,271,590 1,804,330 3,688,654 27,319 19,566,094 8,824,696 1,896,365
Argo Group International Holdings, Ltd.
157,400 3,700,300 378,900 1,263,500 851,100 239,800 6,591,000 3,230,300 779,100
Aspen Insurance Holdings Limited 1,294,000 6,912,000 48,000 999,000 960,000 18,000 10,231,000 4,679,000 1,281,000
AXIS Capital Holdings Limited 923,326 12,734,526 1,045,810 3,618,945 1,222,649 89,528 19,634,784 9,582,140 2,683,849
Catlin Group Limited 2,291,427 6,925,779 - 1,480,002 3,177,082 719,640 14,593,930 6,709,097 2,728,176
Endurance Specialty Holdings Ltd. 845,851 5,111,458 617,478 757,975 1,479,982 165,378 8,978,122 4,002,259 1,018,851
Everest Re Group, Ltd. (1) 1,825,581 14,262,455 508,447 540,883 2,670,670 - 19,808,036 9,673,240 1,579,945
Hiscox Ltd. (2) 931,219 4,265,339 12,794 757,056 1,232,416 119,988 7,318,812 3,057,552 1,247,497
Lancashire Holdings Limited 403,000 2,011,300 4,700 193,800 477,800 177,200 3,267,800 853,400 442,100
Montpelier Re Holdings Ltd. 549,200 2,548,100 78,800 288,400 294,000 - 3,758,500 881,600 276,700
Oil Casualty Insurance, Ltd. 122,052 812,176 15,347 157,062 140,922 - 1,247,559 374,525 85,597
Oil Insurance Limited 722,649 6,196,619 - - 175,370 - 7,094,638 2,405,684 -
PartnerRe Ltd. 1,496,485 14,827,902 1,106,749 2,465,713 2,497,976 643,470 23,038,295 12,620,451 1,723,767
RenaissanceRe Holdings Ltd. 408,032 5,098,053 1,723,659 474,087 467,189 8,111 8,179,131 1,563,730 477,888
Tokio Millennium Re AG 127,225 1,281,503 354,235 355,434 290,144 5,267 2,413,808 583,691 483,295
Validus Holdings, Ltd. 1,056,346 6,294,036 618,316 450,234 1,300,700 126,800 9,846,432 3,030,399 824,496
XL Group plc 1,800,832 31,855,356 2,535,573 118,885 8,930,630 411,611 45,652,887 20,481,065 3,846,526
16,755,573 203,695,269 15,099,692 22,857,317 54,188,700 8,473,319 321,069,870 141,491,366 30,791,770
BALANCE SHEET DATA (US$ 000s)
Bermuda Insurance Market Report 2014 ©2014 Deloitte Limited 19
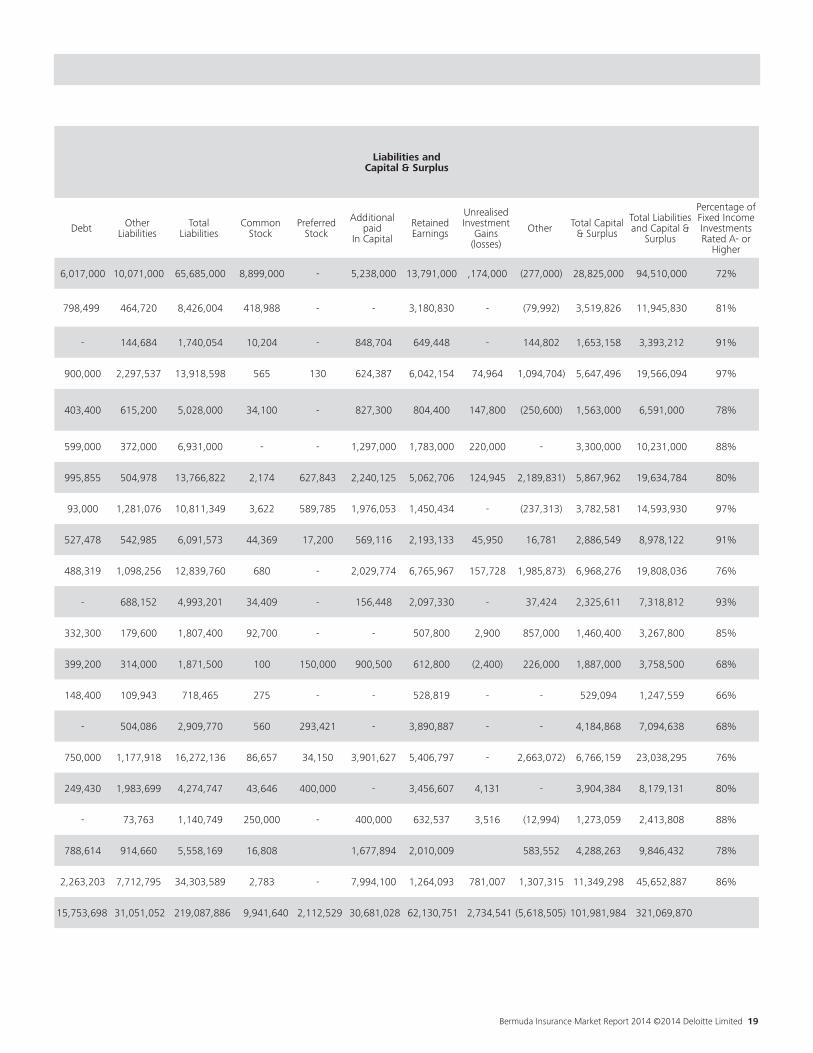
Liabilities and Capital & Surplus
Debt Other Liabilities
Total Liabilities
Common Stock
Preferred Stock
Additional paid
In Capital
Retained Earnings
Unrealised Investment
Gains (losses)
Other Total Capital & Surplus
Total Liabilities and Capital &
Surplus
Percentage of Fixed Income Investments Rated A- or
Higher
6,017,000 10,071,000 65,685,000 8,899,000 - 5,238,000 13,791,000 ,174,000 (277,000) 28,825,000 94,510,000 72%
798,499 464,720 8,426,004 418,988 - - 3,180,830 - (79,992) 3,519,826 11,945,830 81%
- 144,684 1,740,054 10,204 - 848,704 649,448 - 144,802 1,653,158 3,393,212 91%
900,000 2,297,537 13,918,598 565 130 624,387 6,042,154 74,964 1,094,704) 5,647,496 19,566,094 97%
403,400 615,200 5,028,000 34,100 - 827,300 804,400 147,800 (250,600) 1,563,000 6,591,000 78%
599,000 372,000 6,931,000 - - 1,297,000 1,783,000 220,000 - 3,300,000 10,231,000 88%
995,855 504,978 13,766,822 2,174 627,843 2,240,125 5,062,706 124,945 2,189,831) 5,867,962 19,634,784 80%
93,000 1,281,076 10,811,349 3,622 589,785 1,976,053 1,450,434 - (237,313) 3,782,581 14,593,930 97%
527,478 542,985 6,091,573 44,369 17,200 569,116 2,193,133 45,950 16,781 2,886,549 8,978,122 91%
488,319 1,098,256 12,839,760 680 - 2,029,774 6,765,967 157,728 1,985,873) 6,968,276 19,808,036 76%
- 688,152 4,993,201 34,409 - 156,448 2,097,330 - 37,424 2,325,611 7,318,812 93%
332,300 179,600 1,807,400 92,700 - - 507,800 2,900 857,000 1,460,400 3,267,800 85%
399,200 314,000 1,871,500 100 150,000 900,500 612,800 (2,400) 226,000 1,887,000 3,758,500 68%
148,400 109,943 718,465 275 - - 528,819 - - 529,094 1,247,559 66%
- 504,086 2,909,770 560 293,421 - 3,890,887 - - 4,184,868 7,094,638 68%
750,000 1,177,918 16,272,136 86,657 34,150 3,901,627 5,406,797 - 2,663,072) 6,766,159 23,038,295 76%
249,430 1,983,699 4,274,747 43,646 400,000 - 3,456,607 4,131 - 3,904,384 8,179,131 80%
- 73,763 1,140,749 250,000 - 400,000 632,537 3,516 (12,994) 1,273,059 2,413,808 88%
788,614 914,660 5,558,169 16,808 1,677,894 2,010,009 583,552 4,288,263 9,846,432 78%
2,263,203 7,712,795 34,303,589 2,783 - 7,994,100 1,264,093 781,007 1,307,315 11,349,298 45,652,887 86%
15,753,698 31,051,052 219,087,886 9,941,640 2,112,529 30,681,028 62,130,751 2,734,541 (5,618,505) 101,981,984 321,069,870

Loss Ratio (1) Expense Ratio (1) Combined Ratio (1)
Capital & Surplus Ratios
% Change from Prior Period CURRENT PERIOD
Com
pany
Cur
rent
Prio
r
Cur
rent
Prio
r
Cur
rent
Prio
r
Net
Pre
miu
ms
to
Cap
ital &
Sur
plus
Loss
Res
erve
to
C
apita
l & S
urpl
us
Cap
ital &
Sur
plus
Net
Pre
miu
m W
ritte
n
Lo
ss R
atio
(4)
(wei
ghte
d av
. 5yr
.)
Gro
ss P
rem
ium
Writ
ten
Ced
ed P
rem
ium
s
Net
Pre
miu
ms
Writ
ten
Cha
nge
in U
PR
Prem
ium
s Ea
rned
Loss
es &
LA
E
Com
mis
ions
&
Brok
erag
e
Oth
er U
nder
writ
ing
Ex
pens
es
Und
erw
ritin
g ga
in/
(loss
)
Inve
stm
ent
Inco
me
Ea
rned
(exc
ludi
ng
real
ized
gai
ns/lo
sses
)
Real
ized
Cap
ital G
ain/
(Los
s)
Cha
nge
in U
nrea
lized
G
ains
/(Los
ses)
Inte
rest
Exp
ense
on
debt
Oth
er In
com
e (E
xpen
ses)
Tax
Bene
fit (E
xpen
se)
Inco
me
adju
stm
ents
Net
Inco
me
Retu
rn o
n Eq
uity
(2)
Retu
rn o
n Re
venu
e (3
)
ACE Limited 59.60% 65.70% 28.40% 28.20% 88.00% 93.90% 59.06% 145.91% 4.70% 5.91% 61.92% 22,828,000 (5,803,000) 17,025,000 (412,000) 16,613,000 9,863,000 2,659,000 2,211,000 1,880,000 2,144,000 504,000 - (275,000) (15,000) (480,000) 3,758,000 13.34% 19.92%
Allied World Assurance Company Holdings, AG
56.00% 65.14% 30.16% 29.34% 86.16% 94.48% 60.24% 163.83% 5.82% 15.38% 56.98% 2,738,664 (618,183) 2,120,481 (114,648) 2,005,833 1,123,242 252,673 352,285 277,633 157,564 107,297 (47,772) (56,510) (10,552) (9,780) 417,880 12.21% 17.10%
Amlin AG 53.84% 58.57% 22.90% 19.55% 76.74% 78.11% 65.70% 67.39% 1.71% 7.89% 61.39% 1,214,789 (128,633) 1,086,156 (7,418) 1,078,738 580,787 181,737 65,285 250,929 21,486 46,494 (729) - (18,565) 1,132 300,747 18.35% 23.47%
Arch Capital Group Ltd. 53.38% 63.41% 32.26% 31.71% 85.64% 95.13% 59.34% 156.26% 9.26% 9.80% 85.64% 4,196,623 (845,256) 3,351,367 (205,415) 3,145,952 1,679,424 556,464 458,327 451,737 267,219 70,232 - (27,060) (19,623) (32,774) 709,731 13.12% 19.81%
Argo Group International Holdings, Ltd. (10)
57.76% 64.49% 39.76% 40.07% 97.52% 104.56% 86.46% 206.67% 3.23% 8.58% 65.30% 1,888,400 (537,100) 1,351,300 (66,700) 1,284,600 742,000 510,800 19,200 12,600 100,000 71,300 (20,200) (4,900) (36,500) 122,300 9.31% 6.34%
Aspen Insurance Holdings Limited (12)
56.31% 59.45% 34.02% 32.29% 90.33% 91.75% 69.70% 141.79% (5.42)% 2.36% 63.19% 2,647,000 (347,000) 2,300,000 (128,000) 2,172,000 1,223,100 422,000 317,000 209,900 186,000 36,500 (12,000) (33,000) (44,700) (13,400) 329,300 9.70% 13.76%
AXIS Capital Holdings Limited (11)
57.57% 61.37% 30.88% 30.93% 88.46% 92.30% 66.94% 163.30% 1.53% 17.70% 61.51% 4,697,041 (768,841) 3,928,200 (221,135) 3,707,065 2,134,195 664,191 480,710 427,969 409,312 77,195 (1,631) (61,979) (116,399) (7,002) 727,465 12.49% 16.47%
Catlin Group Limited (8) (9) 52.30% 56.00% 33.30% 34.00% 85.60% 90.00% 107.13% 177.37% 7.71% 5.72% 58.70% 5,309,373 (1,256,951) 4,052,422 (104,184) 3,948,238 2,063,233 881,879 660,660 342,466 115,857 7,669 - - (34,510) 4,046 (43,500) 392,028 10.75% 9.44%
Endurance Specialty Holdings Ltd.
60.49% 75.52% 29.82% 26.87% 90.31% 102.39% 70.98% 138.65% 6.49% 0.96% 66.65% 2,665,244 (616,311) 2,048,933 (32,449) 2,016,484 1,219,684 304,430 296,952 195,418 166,216 14,579 (1,031) (36,188) (21,226) (5,853) 311,915 11.15% 14.07%
Everest Re Group, LTD (5) 58.91% 65.92% 25.55% 27.86% 84.46% 93.78% 71.82% 138.82% 3.49% 22.63% 70.30% 5,218,634 (213,813) 5,004,821 (251,278) 4,753,543 2,800,251 977,558 237,126 738,608 548,509 300,227 - (46,118) 7,862 (289,706) 1,259,382 18.38% 23.52%
Hiscox Ltd. (6) (7) (13) 39.80% 44.40% 43.20% 41.40% 83.00% 85.80% 92.15% 131.47% 4.50% 6.64% 47.04% 2,656,284 (513,233) 2,143,051 (137,236) 2,005,815 811,633 477,929 365,123 351,130 66,538 3,737 23,206 (11,216) (51,182) (10,597) 371,616 16.33% 17.58%
Lancashire Holdings Limited 33.11% 29.88% 22.14% 20.49% 55.25% 50.38% 38.18% 58.44% 5.26% (3.21)% 27.66% 679,700 (122,100) 557,600 10,500 568,100 188,100 125,800 - 254,200 26,800 12,600 (32,500) (8,900) (66,600) 3,800 189,400 13.30% 38.90%
Montpelier Re Holdings Ltd. 21.10% 46.46% 34.97% 34.52% 56.07% 80.97% 31.96% 46.72% 15.81% (2.05)% 47.68% 706,000 (102,900) 603,100 (3,500) 599,600 126,500 90,500 119,200 263,400 64,000 (1,600) (47,600) (18,800) (48,900) 100 210,600 11.98% 42.25%
Oil Casualty Insurance, Ltd. 62.91% 133.45% 13.53% 10.32% 76.44% 143.77% 21.66% 70.79% 8.10% 4.83% 97.09% 152,720 (38,125) 114,595 (7,324) 107,271 67,483 14,510 - 25,278 17,360 28,305 (5,646) (12,479) (13,170) - 39,648 7.79% 15.24%
Oil Insurance Limited 89.95% 91.09% 0.37% 0.05% 90.33% 91.13% 13.15% 57.49% 15.87% (18.16)% 80.69% 550,361 - 550,361 - 550,361 495,058 2,287 (230) 53,246 84,821 337,046 178,218 (730) (20,703) - 631,898 16.21% 18.98%
PartnerRe Ltd. 60.75% 62.52% 20.73% 20.89% 81.48% 83.41% 79.76% 186.52% (2.41)% 18.01% 67.72% 5,569,706 (173,180) 5,396,526 (198,316) 5,198,210 3,157,808 1,077,628 - 962,774 484,367 271,218 (431,953) (48,929) (525,053) (48,416) 664,008 9.69% 16.93%
RenaissanceRe Holdings Ltd. 15.37% 30.41% 28.40% 27.39% 43.77% 57.80% 30.84% 40.05% 11.33% 9.19% 28.65% 1,605,412 (401,465) 1,203,947 (89,321) 1,114,626 171,287 125,501 191,105 626,733 208,028 76,890 (41,814) (17,929) (184,540) (1,692) 665,676 17.96% 55.56%
Tokio Millennium Re AG 46.42% 41.59% 25.51% 34.00% 71.93% 75.59% 61.19% 45.85% 8.50% 7.07% 48.71% 897,169 (118,164) 779,005 (114,556) 664,449 308,422 146,244 23,279 186,504 31,859 2,413 - - (78,136) (2,614) 140,026 11.45% 22.68%
Validus Holdings, Ltd. 37.77% 53.35% 33.45% 33.37% 71.22% 86.72% 47.30% 70.67% (3.75)% 9.12% 50.48% 2,401,106 (372,585) 2,028,521 73,524 2,102,045 793,932 360,310 342,895 604,908 96,072 3,258 (58,481) (53,078) (59,630) (383) 532,666 12.18% 27.51%
XL Group plc 62.05% 65.31% 30.45% 30.95% 92.50% 96.25% 52.02% 180.46% (4.28)% (0.89)% 65.85% 7,416,792 (1,512,810) 5,903,982 110,117 6,014,099 3,731,464 882,658 948,915 451,062 957,716 95,575 - (155,462) (134,739) (77,505) 1,136,647 9.80% 16.36%
76,039,018 (14,489,650) 61,549,368 (1,899,339) 59,650,029 33,280,603 10,714,099 7,088,832 8,566,494 6,153,724 2,064,935 (479,733) (883,578) (1,460,266) (1,007,144) (43,500) 12,910,932
OPERATING DATA
Notes: (1) Loss, expense & combined ratio only for non-life business. Loss Ratio: losses & loss adjustment expenses/earned premiums Expense Ratio: commissions, brokerage & other underwriting expenses/earned premiums Combined Ratio: Loss Ratio + Expense Ratio (2) Return on Equity = Net Income / Average of CY Capital & Surplus and PY Capital & Surplus.(3) Return on Revenue is calculated: (Net Income-Tax Benefit-Realized Capital G/L-Change in URGL) / (Premium Earned+Investment Income Earned+Other Income/Expense)(4) Loss ratio (5 year average) = sum of loss and LAE (five years) / sum of premiums earned (5 years). For those respondents that provided less than five years of data, the average has been calculated over the number of periods provided. (5) All Everest Re Group, Ltd. financial information provided in this report is unaudited. (6) Hiscox Ltd. income statement translated from GBP to USD using average rate of 1.5847 for the relevant year. (7) Hiscox Ltd. expense ratio and combined ratio excluding FX impact is 42.3% and 82.1%, respectively. (8) Catlin’s net income is net of preference share dividend of $43.5m (9) Catlin’s reported return on equity is 13.44% as opening equity is used in their calculation. (10) Argo’s Net Premiums Earned figure includes Other Reinsurance-Related Expenses.(11) AXIS Capital Holdings Ltd.’s expense and combined ratios per the 10-K are 33.4% and 91.0% for 2013 and 34.8% and 96.2% for 2012, which include corporate expenses of $90.3m and $129.7m for 2013 and 2012 respectively. (12) Aspen’s Return on Equity is 10.6% per their 10-K; calculated using the weighted average method. (13) Hiscox Ltd. Return on Equity is 19.3M per their coporate highlights and is based on weighted average capital with the opening capital adjusted for dividends and return of capital.
20 Bermuda Insurance Market Report 2014 ©2014 Deloitte Limited 21

About Deloitte Bermuda
Deloitte drives progress. Our firms around the world help clients become leaders wherever they choose to compete. Deloitte invests in outstanding people of diverse talents and backgrounds and empowers them to achieve more than they could elsewhere. Our work combines advice with action and integrity. We believe that when our clients and society are stronger, so are we.
The Deloitte Bermuda Insurance team is dedicated to providing assurance and advisory services to clients and our senior leadership is listed on the next page. We serve many of the (re)insurance companies in the 2014 Bermuda Insurance Market report, as well as over 200 captives, covering all classes of insurers writing diverse lines of business.
Our objective is to help our clients succeed by anticipating tomorrow’s agenda with focused, insightful and fresh thinking borne out of our multidisciplinary strengths. We draw upon our specialist skills in audit, tax, actuarial, consulting and corporate finance both within Bermuda and across the Deloitte worldwide network.
What’s different about Deloitte is our people, who focus on building long-term relationships and are determined to deliver measurable value for our clients’ business. Deloitte’s professionals in Bermuda provide audit, tax, actuarial, consulting, and corporate finance services to public and private clients spanning multiple industries. With a globally connected network of member firms in more than 150 countries, Deloitte brings world class capabilities and deep local expertise to help clients succeed wherever they operate.
Our Bermuda offering includes IPOs, M&A transactions, taxation, adoption of new accounting standards, financial statement and statutory audits covering all classes of insurers writing all lines of business, Agreed Upon Procedures engagements, internal audit services, actuarial services and reserve specialist opinions for inclusion in annual BMA filings.
Deloitte is one of the largest professional services firm in the world, with an unrivaled depth and breadth of services and capabilities across every industry sector and international market. Globally, our insurance practice includes nearly 5,000 professionals and more than 800 dedicated partners and directors. We serve 90% of the top 20 global insurance companies (according to market capitalization). Our global financial services industry practice includes 19,300 professionals with 1,850 dedicated partners in more than 40 countries.

Contacts
John Johnston Principal +1 441 299 1301 [email protected]
Anna Burns Principal +1 441 299 1396 [email protected]
Mark Baumgartner Principal +1 441 299 1322 [email protected]
Muhammad Khan Principal +1 441 299 1357 [email protected]
Stephen Kuzyk Principal +1 441 299 1370 [email protected]
Mark Smith Principal +1 441 299 1314 [email protected]
James Dockeray Director Tax +1 441 299 1399 [email protected]
Nicole Valadao Director Enterprise Risk Services +1 441 299 1393 [email protected]
Brett Henshilwood Director Enterprise Risk Services +1 441 299 1395 [email protected]
Liz Cunningham Senior Manager Actuarial, Risk & Analytics +1 441 299 1323 [email protected]
Paul Bohus Senior Manager Audit Insurance +1 441 299 1880 [email protected]
Heldar Carreiro Senior Manager Audit Insurance +1 441 299 1308 [email protected]
Heather Doolin Senior Manager Audit Insurance +1 441 299 1356 [email protected]
Adam Laing Senior Manager Audit Insurances +1 441 299 1391 [email protected]
Newton Odhiambo Senior Manager Enterprise Risk Services +1 441 299 1378 [email protected]
Kyle Metayer Manager Audit Insurance +1 441 299 1882 [email protected]


Deloitte refers to one or more of Deloitte Touche Tohmatsu Limited, a UK private company limited by guarantee, and its network of member firms, each of which is a legally separate and independent entity. Please see www.deloitte.com/ about for a detailed description of the legal structure of Deloitte Touche Tohmatsu Limited and its member firms. Deloitte Bermuda is an affiliate of Deloitte Caribbean and Bermuda Limited, a member firm of Deloitte Touche Tohmatsu Limited. Deloitte provides audit, tax, consulting, and financial advisory services to public and private clients spanning multiple industries. With a globally connected network of member firms in more than 150 countries, Deloitte brings world-class capabilities and high-quality service to clients, delivering the insights they need to address their most complex business challenges. Deloitte’s approximately 200,000 professionals are committed to becoming the standard of excellence. This publication contains general information only, and none of Deloitte Touche Tohmatsu Limited, Deloitte Global Services Limited, Deloitte Global Services Holdings Limited, the Deloitte Touche Tohmatsu Verein, any of their member firms, or any of the foregoing’s affiliates (collectively the “Deloitte Network”) are, by means of this publication, rendering accounting, business, financial, investment, legal, tax, or other professional advice or services. This publication is not a substitute for such professional advice or services, nor should it be used as abasis for any decision or action that may affect your finances or your business. Before making any decision or taking any action that may affect your finances or your business, you should consult a qualified professional adviser. No entity in the Deloitte Network shall be responsible for any loss whatsoever sustained by any person who relies on this publication. © 2014 Deloitte Caribbean and Bermuda Limited and its affiliates