bentley capital limited bel asx 2013 annual... · 30 june 2013 bentley capital limited a.b.n. 87...
TRANSCRIPT

BentleyCapital Limited
2013 Annual Report
2013
CONTENTS CORPORATE DIRECTORY Company Profile 1 BOARD Farooq Khan Executive Chairman Overview of Performance 2 Christopher B. Ryan Non- Executive Director William M. Johnson Non- Executive Director The Board’s Report 4 COMPANY SECRETARY Directors’ Statutory Report 5 Victor P.H. Ho Remuneration Report 18 PERTH CORPORATE OFFICE Auditor’s Independence Declaration 24 Suite 1, 346 Barker Road Subiaco Western Australia 6008 Consolidated Statement of Profit or Loss 25 Telephone: (08) 9214 9757
and Comprehensive Income Facsimile: (08) 9214 9701 Email: [email protected]
Consolidated Statement of 26 Website: www.bel.com.au Financial Position
Consolidated Statement of 27 SYDNEY (REGISTERED) OFFICE Changes in Equity Suite 202, Angela House
30-36 Bay Street Consolidated Statement of Cash Flows 28 Double Bay New South Wales 2028 Telephone: (02) 9363 5088 Notes to the Consolidated 29 Facsimile: (02) 9363 5488 Financial Statements
Directors’ Declaration 56 AUDITORS BDO Audit (WA) Pty Ltd Independent Auditor’s Report 57 38 Station Street Subiaco, Western Australia 6008 Corporate Governance 59 Telephone: (08) 6382 4600 Facsimile: (08) 6382 4601 Investment Mandate 69 Website: www.bdo.com.au List of Share Investments 70 STOCK EXCHANGE Additional ASX Information 71 Australian Securities Exchange Sydney, New South Wales ASX CODE BEL SHARE REGISTRY Advanced Share Registry Limited Visit www.bel.com.au for: Suite 2, 150 Stirling Highway Latest News Nedlands Western Australia 6009 Market Announcements Telephone: (08) 9389 8033 Financial Reports Facsimile: (08) 9389 7871 Email: [email protected] Register your email with us to Investor Web: www.advancedshare.com.au receive latest Company announcements and releases Level 6, 225 Clarence Street Sydney, New South Wales 2000 EMAIL US AT: [email protected] Telephone: (02) 8096 3502
30 JUNE 2013 BENTLEY CAPITAL LIMITED A.B.N. 87 008 108 218
COMPANY PROFILE
ANNUAL REPORT | 1
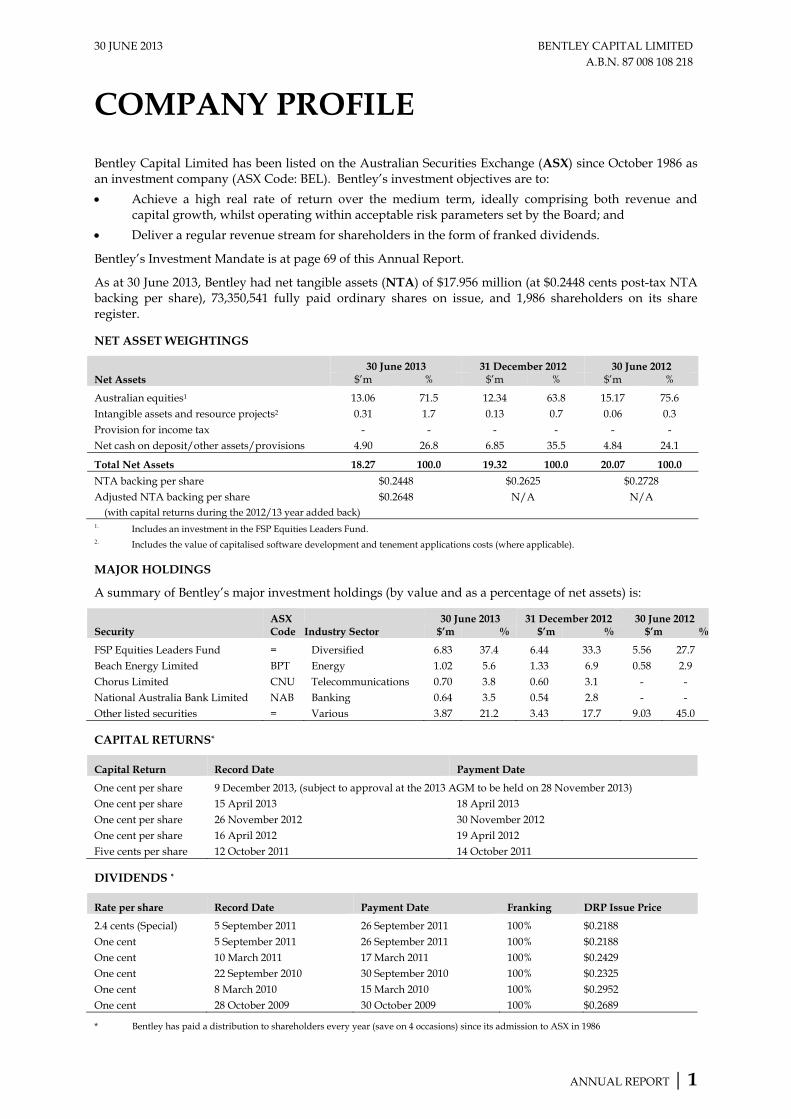
Bentley Capital Limited has been listed on the Australian Securities Exchange (ASX) since October 1986 as an investment company (ASX Code: BEL). Bentley’s investment objectives are to:
Achieve a high real rate of return over the medium term, ideally comprising both revenue and capital growth, whilst operating within acceptable risk parameters set by the Board; and
Deliver a regular revenue stream for shareholders in the form of franked dividends.
Bentley’s Investment Mandate is at page 69 of this Annual Report.
As at 30 June 2013, Bentley had net tangible assets (NTA) of $17.956 million (at $0.2448 cents post-tax NTA backing per share), 73,350,541 fully paid ordinary shares on issue, and 1,986 shareholders on its share register.
NET ASSET WEIGHTINGS
Net Assets 30 June 2013 31 December 2012 30 June 2012
$’m % $’m % $’m %
Australian equities1 13.06 71.5 12.34 63.8 15.17 75.6 Intangible assets and resource projects2 0.31 1.7 0.13 0.7 0.06 0.3 Provision for income tax - - - - - - Net cash on deposit/other assets/provisions 4.90 26.8 6.85 35.5 4.84 24.1
Total Net Assets 18.27 100.0 19.32 100.0 20.07 100.0
NTA backing per share $0.2448 $0.2625 $0.2728 Adjusted NTA backing per share $0.2648 N/A N/A (with capital returns during the 2012/13 year added back) 1. Includes an investment in the FSP Equities Leaders Fund. 2. Includes the value of capitalised software development and tenement applications costs (where applicable).
MAJOR HOLDINGS
A summary of Bentley’s major investment holdings (by value and as a percentage of net assets) is:
Security ASX Code Industry Sector
30 June 2013 31 December 2012 30 June 2012 $’m % $’m % $’m %
FSP Equities Leaders Fund = Diversified 6.83 37.4 6.44 33.3 5.56 27.7 Beach Energy Limited BPT Energy 1.02 5.6 1.33 6.9 0.58 2.9 Chorus Limited CNU Telecommunications 0.70 3.8 0.60 3.1 - - National Australia Bank Limited NAB Banking 0.64 3.5 0.54 2.8 - - Other listed securities = Various 3.87 21.2 3.43 17.7 9.03 45.0
CAPITAL RETURNS*
Capital Return Record Date Payment Date
One cent per share 9 December 2013, (subject to approval at the 2013 AGM to be held on 28 November 2013) One cent per share 15 April 2013 18 April 2013 One cent per share 26 November 2012 30 November 2012 One cent per share 16 April 2012 19 April 2012 Five cents per share 12 October 2011 14 October 2011
DIVIDENDS *
Rate per share Record Date Payment Date Franking DRP Issue Price
2.4 cents (Special) 5 September 2011 26 September 2011 100% $0.2188 One cent 5 September 2011 26 September 2011 100% $0.2188 One cent 10 March 2011 17 March 2011 100% $0.2429 One cent 22 September 2010 30 September 2010 100% $0.2325 One cent 8 March 2010 15 March 2010 100% $0.2952 One cent 28 October 2009 30 October 2009 100% $0.2689
* Bentley has paid a distribution to shareholders every year (save on 4 occasions) since its admission to ASX in 1986
30 JUNE 2013 BENTLEY CAPITAL LIMITED A.B.N. 87 008 108 218
OVERVIEW OF PERFORMANCE
ANNUAL REPORT | 2
CONSOLIDATED June 2013
$'000 June 2012
$'000
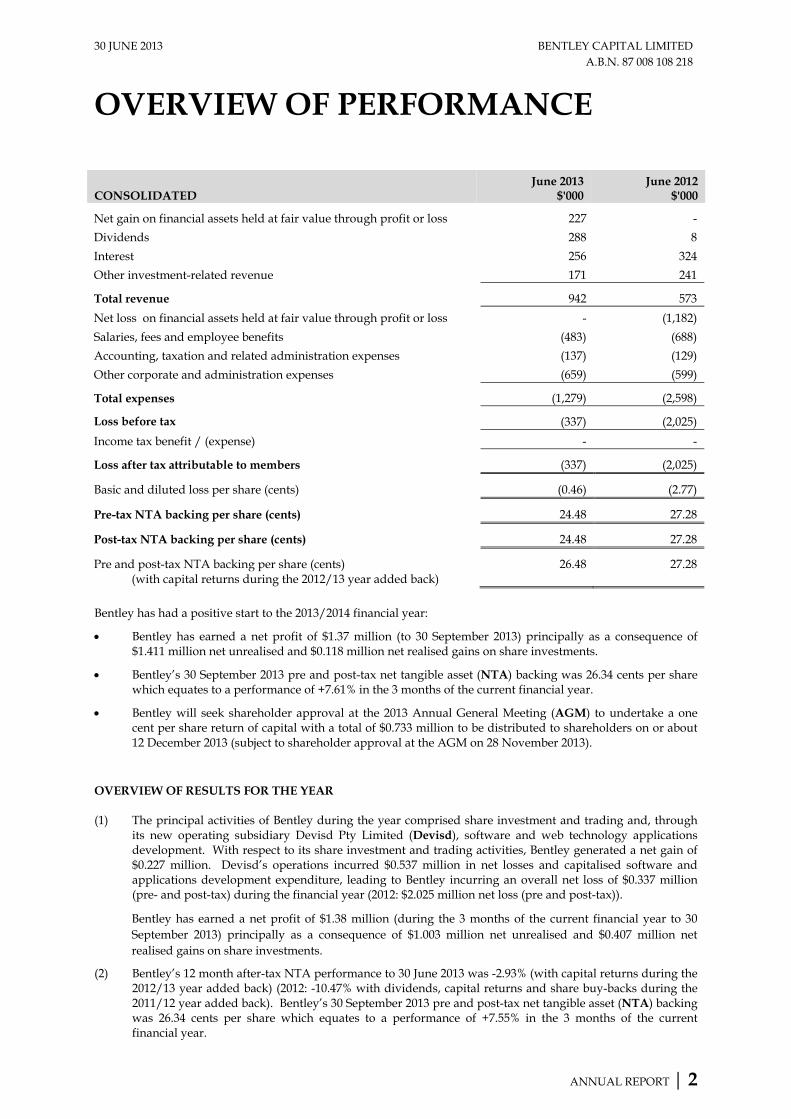
Net gain on financial assets held at fair value through profit or loss 227 -
Dividends 288 8
Interest 256 324
Other investment-related revenue 171 241
Total revenue 942 573
Net loss on financial assets held at fair value through profit or loss - (1,182)
Salaries, fees and employee benefits (483) (688)
Accounting, taxation and related administration expenses (137) (129)
Other corporate and administration expenses (659) (599)
Total expenses (1,279) (2,598)
Loss before tax (337) (2,025)
Income tax benefit / (expense) - -
Loss after tax attributable to members (337) (2,025)
Basic and diluted loss per share (cents) (0.46) (2.77)
Pre-tax NTA backing per share (cents) 24.48 27.28
Post-tax NTA backing per share (cents) 24.48 27.28
Pre and post-tax NTA backing per share (cents) (with capital returns during the 2012/13 year added back)
26.48 27.28
Bentley has had a positive start to the 2013/2014 financial year:
Bentley has earned a net profit of $1.37 million (to 30 September 2013) principally as a consequence of $1.411 million net unrealised and $0.118 million net realised gains on share investments.
Bentley’s 30 September 2013 pre and post-tax net tangible asset (NTA) backing was 26.34 cents per share which equates to a performance of +7.61% in the 3 months of the current financial year.
Bentley will seek shareholder approval at the 2013 Annual General Meeting (AGM) to undertake a one cent per share return of capital with a total of $0.733 million to be distributed to shareholders on or about 12 December 2013 (subject to shareholder approval at the AGM on 28 November 2013).
OVERVIEW OF RESULTS FOR THE YEAR (1) The principal activities of Bentley during the year comprised share investment and trading and, through
its new operating subsidiary Devisd Pty Limited (Devisd), software and web technology applications development. With respect to its share investment and trading activities, Bentley generated a net gain of $0.227 million. Devisd’s operations incurred $0.537 million in net losses and capitalised software and applications development expenditure, leading to Bentley incurring an overall net loss of $0.337 million (pre- and post-tax) during the financial year (2012: $2.025 million net loss (pre and post-tax)).
Bentley has earned a net profit of $1.38 million (during the 3 months of the current financial year to 30 September 2013) principally as a consequence of $1.003 million net unrealised and $0.407 million net realised gains on share investments.
(2) Bentley’s 12 month after-tax NTA performance to 30 June 2013 was -2.93% (with capital returns during the 2012/13 year added back) (2012: -10.47% with dividends, capital returns and share buy-backs during the 2011/12 year added back). Bentley’s 30 September 2013 pre and post-tax net tangible asset (NTA) backing was 26.34 cents per share which equates to a performance of +7.55% in the 3 months of the current financial year.
30 JUNE 2013 BENTLEY CAPITAL LIMITED A.B.N. 87 008 108 218
OVERVIEW OF PERFORMANCE
ANNUAL REPORT | 3
(3) Gross interest, dividend and other investment revenue were $0.715 million (2012: $0.573 million).
(4) The $0.227 million net gain result in relation to Bentley’s investments comprised $0.535 million net unrealised gain and $0.308 million net realised loss (2012: $0.355 million net unrealised gain and $1.537 million net realised loss), with material contributions being as follows:
(a) FSP Fund - $1.269 million unrealised gain (2012: $1.093 million realised loss (net of reversal of previous years’ unrealised gains on disposal) and $2.189 million unrealised loss);
(b) MEO Australia Limited (ASX: MEO) - $1.447 million realised loss (net of reversal of previous years’ unrealised gains on disposal) (2012: $1.797 million unrealised gain and $0.336 million realised gain (net of reversal of previous years’ unrealised gains on disposal));
(c) Beach Energy Limited (ASX: BPT) - $0.454 million realised gain (net of reversal of previous years’ unrealised losses on disposal) and $0.188 million unrealised loss (2012: $0.399 million unrealised loss);
(d) Cash Converters International Limited (ASX: CCV) - $0.305 million realised gain (2012: Nil); and
(e) Other listed and unlisted securities - $0.380 million realised gain and $0.546 million unrealised loss (2012: $1.146 million unrealised gain and $0.780 million realised loss).
(5) A significant portion of Bentley’s funds are held under management by Sydney-based fund manager, FSP Equities Management, in the wholesale FSP Equities Leaders Fund (FSP Fund):
(a) As at 30 June 2013, Bentley had 37.39% ($6.831 million) of its net assets invested in the FSP Fund (2012: 27.71% and $5.562 million).
(b) The 12-month performance of the FSP Fund to 30 June 2013 was +25.7% (2012: -12.0%) compared with its benchmark performance (S&P/ASX 200 Accumulation Index) of +22.8% (2012: -6.7%).
(6) Bentley’s new technology software/applications development division (via Devisd established in July 2012) contributed a net loss of $0.225 million (2012: Nil).
(7) Bentley returned one cent per share to shareholders twice, in November 2012 and April 2013, at a total cost of $1.467 million as approved by shareholders on 16 November 20121 and 5 April 20132 respectively (2012: five cents and one cent per share to shareholders in October 2011 and April 2012 respectively (totalling $3.673 million and $0.733 million respectively) as approved by shareholders on 4 October 20113 and 4 April 20124 respectively).
(8) Bentley did not declare any dividends for the financial year (2012: one cent fully franked final dividend and a 2.4 cent fully franked special dividend5 in September 2011 totalling $0.726 million and $1.742 million respectively).
(9) Bentley reduced its share capital and accumulated losses by $0.781 million in accordance with approval given at the 2012 AGM. This did not result in the return of capital to shareholders or the cancellation of shares, but allows the Company to remove historical accumulated accounting losses from its books that affect its ability to retain current and future earnings, on which dividends may potentially be paid in future.
Please refer to the Directors’ Report and financial statements and notes for further information on a review of Bentley’s operations and the financial position and performance of Bentley for the financial year ended 30 June 2013.
1 Refer Bentley’s Notice of Annual General Meeting dated 12 October 2012 and released on ASX on 18 October 2012 for a general meeting
held on 16 November 2012. 2 Refer Bentley’s Notice of General Meeting dated 28 February 2013 and released on ASX on 7 March 2013 for a general meeting held on 5
April 2013. 3 Refer Bentley’s Notice of General Meeting dated 26 August 2011 and released on ASX on 1 September 2011 for a general meeting held on
4 October 2011. 4 Refer Bentley’s Notice of General Meeting dated 29 February 2012 and released on ASX on 2 March 2012 for a general meeting held on 4
April 2012. 5 Refer 25 August 2011 ASX market announcement “Dividends and Proposed Capital Return”.

30 JUNE 2013 BENTLEY CAPITAL LIMITED A.B.N. 87 008 108 218
THE BOARD’S REPORT
ANNUAL REPORT | 4
Investment Update Subsequent to Year End
Bentley has earned a net profit of $1.37m (to 30 September 2013) principally as a consequence of $1.411m net unrealised and $0.118m net realised gains on share investments. Bentley’s NTA backing as at 30 September 2013 was $0.263 per share (pre and post-tax) (up 2.8 cents from $0.245 as at 30 June 2013). As at 30 September 2013, Bentley’s $19.64m net assets comprised:
(1) $7.62m invested in the FSP Fund;
(2) $7.42m invested in ASX listed securities;
(3) $4.17m cash;
(4) $0.15m invested in unlisted securities;
(5) $0.32m Devised intangible software and applications development expenditure; and
(6) $0.04m net other liabilities. Bentley’s major securities holdings as at 30 September 2013 were:
Security ASX Code
Value ($)
Chorus Limited CNU 837,554 Orica Limited ORI 539,410 Redflex Holdings Limited RDF 462,874 Echo Entertainment Group EGP 414,000 QBE Insurance Group Limited QBE 403,100 Beach Energy Limited BPT 397,500 National Australia Bank Limited NAB 394,565 Other listed securities Various 3,973,807 Total Listed Investments 7,422,810 Please refer to the List of Share Investments section of this Annual Report (at page 70) for further details of Bentley’s investment holdings as at 30 September and 30 June 2013. Subsequent to 30 June 2013 year end and to 24 October 2013, Bentley:
Realised $6.270 from the sale of listed securities; and
Invested a further $8.131m in listed securities.
On-Market Takeover Bid for Marathon Resources Limited (ASX: MTN)
On 25 October 2013, Bentley announced an unconditional on-market takeover bid for Marathon Resources Limited (ASX: MTN) at a price of 2.5 cents per share, valuing Marathon at ~$2.3m. The bid price is the same price paid by Bentley to acquire 18,432,337 (19.98%) Marathon shares on market on 21 October 2013.
Marathon is a minerals exploration company that had a previous focus on the Mt Gee uranium project at Arkaroola in the northern Flinders Ranges of South Australia. Marathon received $5m compensation from the SA Government in February 2012 following a ban on exploration and mining in the Northern Flinders Ranges. Marathon had a reported cash balance of ~$4.9m as at 30 June 2013, reported estimated cashflows of $0.5m for the September 2013 quarter and a number of early stage minerals and mineral sands exploration projects in South Australia and Victoria. The takeover offer opened on 25 October 6 and closes on 11 December 2013 (unless extended or withdrawn by Bentley). Return of Capital
The Company has distributed a total of 2 cents as a return of capital (at a total cost of $1.467 million) during the 2012/13 financial year (on 16 November 2012 and on 5 April 2013) after shareholders’ approvals. The Company was not in a position to pay a dividend for the financial year and given Bentley holds uninvested capital in the form of cash, the Board has determined that it is appropriate for the Company to undertake a capital return. The Board has determined to seek shareholder approval at the 2013 AGM for the Company to undertake a further one cent per share return of capital (Return of Capital). Shareholders as at 6 December 2013 (the proposed record date) will be entitled (subject to shareholder approval at the AGM) to participate under the $0.733m Return of Capital, which is expected to be distributed to eligible shareholders on or about 12 December 2013. Performance Bonus Scheme
There were no entitlements arising under the Company’s Performance Bonus Scheme (PBS) during the financial year (2012: Nil). The conditions for payment to members of the Investment Committee are related to Bentley’s financial performance (based on the change in Bentley’s net asset value relative to the Benchmark ASX All Ordinaries Index) during each half-year period. Please refer to the Remuneration Report (at pages 18 to 21) within the Directors’ Report for further details in relation to the PBS.
25 October 2013
6 Refer Bentley’s Bidder’s Statement dated 25 October 2013
30 JUNE 2013 BENTLEY CAPITAL LIMITED A.B.N. 87 008 108 218
DIRECTORS’ REPORT
ANNUAL REPORT | 5
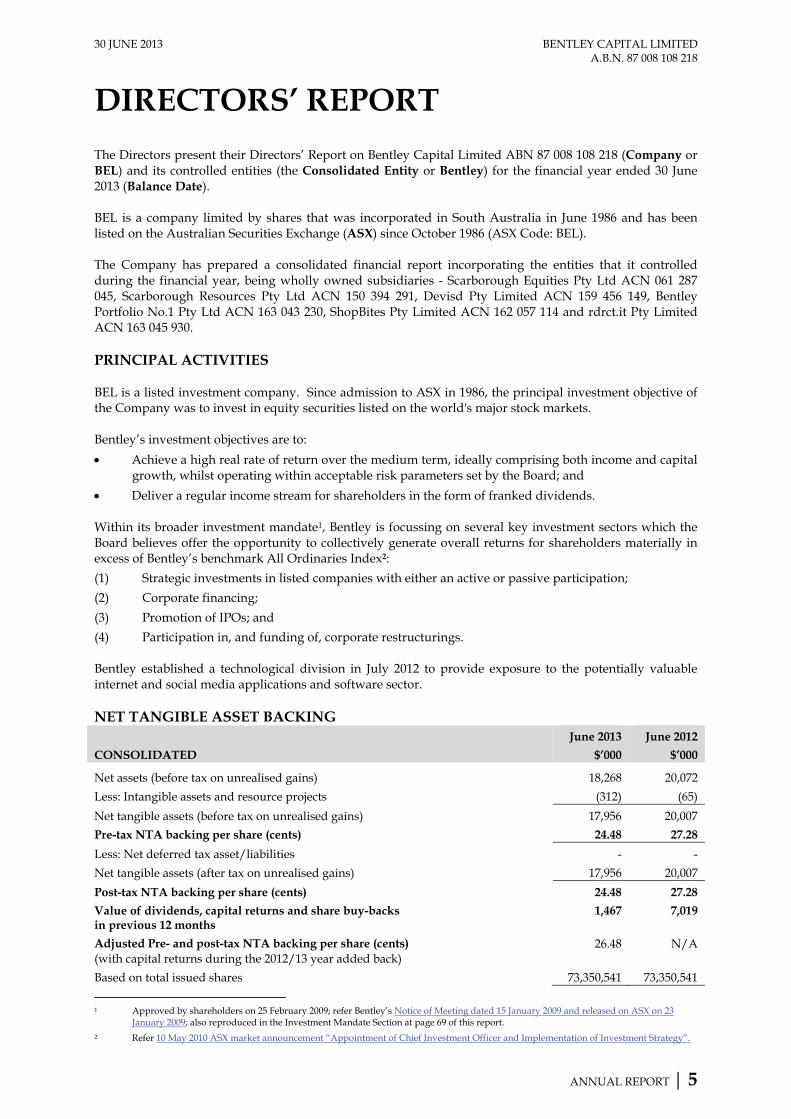
The Directors present their Directors’ Report on Bentley Capital Limited ABN 87 008 108 218 (Company or BEL) and its controlled entities (the Consolidated Entity or Bentley) for the financial year ended 30 June 2013 (Balance Date). BEL is a company limited by shares that was incorporated in South Australia in June 1986 and has been listed on the Australian Securities Exchange (ASX) since October 1986 (ASX Code: BEL). The Company has prepared a consolidated financial report incorporating the entities that it controlled during the financial year, being wholly owned subsidiaries - Scarborough Equities Pty Ltd ACN 061 287 045, Scarborough Resources Pty Ltd ACN 150 394 291, Devisd Pty Limited ACN 159 456 149, Bentley Portfolio No.1 Pty Ltd ACN 163 043 230, ShopBites Pty Limited ACN 162 057 114 and rdrct.it Pty Limited ACN 163 045 930. PRINCIPAL ACTIVITIES BEL is a listed investment company. Since admission to ASX in 1986, the principal investment objective of the Company was to invest in equity securities listed on the world's major stock markets. Bentley’s investment objectives are to:
Achieve a high real rate of return over the medium term, ideally comprising both income and capital growth, whilst operating within acceptable risk parameters set by the Board; and
Deliver a regular income stream for shareholders in the form of franked dividends. Within its broader investment mandate1, Bentley is focussing on several key investment sectors which the Board believes offer the opportunity to collectively generate overall returns for shareholders materially in excess of Bentley’s benchmark All Ordinaries Index2:
(1) Strategic investments in listed companies with either an active or passive participation;
(2) Corporate financing;
(3) Promotion of IPOs; and
(4) Participation in, and funding of, corporate restructurings. Bentley established a technological division in July 2012 to provide exposure to the potentially valuable internet and social media applications and software sector. NET TANGIBLE ASSET BACKING
CONSOLIDATED
June 2013
$’000
June 2012
$’000
Net assets (before tax on unrealised gains) 18,268 20,072
Less: Intangible assets and resource projects (312) (65)
Net tangible assets (before tax on unrealised gains) 17,956 20,007
Pre-tax NTA backing per share (cents) 24.48 27.28
Less: Net deferred tax asset/liabilities - -
Net tangible assets (after tax on unrealised gains) 17,956 20,007
Post-tax NTA backing per share (cents) 24.48 27.28
Value of dividends, capital returns and share buy-backs in previous 12 months
1,467 7,019
Adjusted Pre- and post-tax NTA backing per share (cents) 26.48 N/A (with capital returns during the 2012/13 year added back)
Based on total issued shares 73,350,541 73,350,541
1 Approved by shareholders on 25 February 2009; refer Bentley’s Notice of Meeting dated 15 January 2009 and released on ASX on 23
January 2009; also reproduced in the Investment Mandate Section at page 69 of this report. 2 Refer 10 May 2010 ASX market announcement “Appointment of Chief Investment Officer and Implementation of Investment Strategy”.

30 JUNE 2013 BENTLEY CAPITAL LIMITED A.B.N. 87 008 108 218
DIRECTORS’ REPORT
ANNUAL REPORT | 6
Bentley notes that its 31 July 2013 pre and post tax net tangible asset (NTA) backing was 25.76 cents per share (unaudited) which equates to a performance of +5.23% since Balance Date. Bentley’s 12-month, after-tax NTA performance to 30 June 2013 was -2.93% (with capital returns during the 2012/13 year added back) (2012: -10.47% with dividends, capital returns and share buy-backs during the 2011/12 year added back). Bentley returned one cent per share to shareholders twice in November 2012 and April 2013 at a total cost of $1.467 million, as approved by shareholders on 16 November 20123 and 5 April 20134 respectively (2012: five cents and one cent per share to shareholders in October 2011 and April 2012 respectively (totalling $3.672 million and $0.733 million respectively) as approved by shareholders on 4 October 20115 and 4 April 20126 respectively). OPERATING RESULTS
CONSOLIDATED June 2013
$'000 June 2012
$'000
Net gain on financial assets held at fair value through profit or loss 227 -
Dividends 288 8
Interest 256 324
Other investment-related revenue 171 241
Total revenue 942 573
Net loss on financial assets held at fair value through profit or loss - (1,182)
Salaries, fees and employee benefits (483) (688)
Accounting, taxation and related administration expenses (137) (129)
Other corporate and administration expenses (659) (599)
Total expenses (1,279) (2,598)
Loss before tax (337) (2,025)
Income tax benefit / (expense) - -
Loss after tax attributable to members (337) (2,025) Subsequent to the Balance Date, Bentley has earned a net profit of $0.942 million (to 31 July 2013) (unaudited), principally as a consequence of a $1.031 million unrealised gain and a $0.022 million realised loss on share investments. Bentley’s principal activities during the year comprise share investment and trading and through its new operating subsidiary, Devisd Pty Limited (Devisd), software and web technology applications development.
With respect to its share investment and trading activities, Bentley generated a net gain of $0.227 million. Devisd’s operations incurred $0.537 million in net losses and capitalised software and applications development expenditure, leading to Bentley incurring an overall net loss of $0.337 million (pre and post-tax) during the financial year (2012: $2.025 million net loss (pre and post-tax)).
3 Refer Bentley’s Notice of Annual General Meeting dated 12 October 2012 and released on ASX on 18 October 2012 for a general meeting
held on 16 November 2012. 4 Refer Bentley’s Notice of General Meeting dated 28 February 2013 and released on ASX on 7 March 2013 for a general meeting held on 5
April 2013. 5 Refer Bentley’s Notice of General Meeting dated 26 August 2011 and released on ASX on 1 September 2011 for a general meeting held on
4 October 2011. 6 Refer Bentley’s Notice of General Meeting dated 29 February 2012 and released on ASX on 2 March 2012 for a general meeting held on 4
April 2012.
30 JUNE 2013 BENTLEY CAPITAL LIMITED A.B.N. 87 008 108 218
DIRECTORS’ REPORT
ANNUAL REPORT | 7
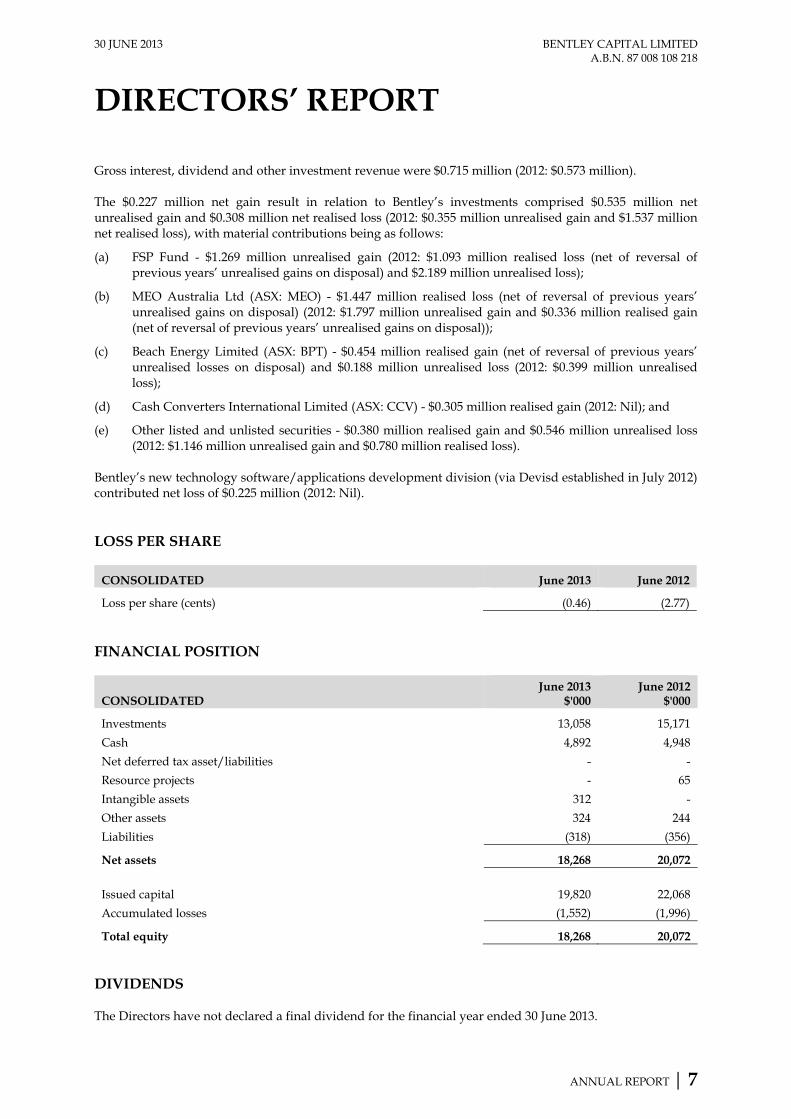
Gross interest, dividend and other investment revenue were $0.715 million (2012: $0.573 million). The $0.227 million net gain result in relation to Bentley’s investments comprised $0.535 million net unrealised gain and $0.308 million net realised loss (2012: $0.355 million unrealised gain and $1.537 million net realised loss), with material contributions being as follows:
(a) FSP Fund - $1.269 million unrealised gain (2012: $1.093 million realised loss (net of reversal of previous years’ unrealised gains on disposal) and $2.189 million unrealised loss);
(b) MEO Australia Ltd (ASX: MEO) - $1.447 million realised loss (net of reversal of previous years’ unrealised gains on disposal) (2012: $1.797 million unrealised gain and $0.336 million realised gain (net of reversal of previous years’ unrealised gains on disposal));
(c) Beach Energy Limited (ASX: BPT) - $0.454 million realised gain (net of reversal of previous years’ unrealised losses on disposal) and $0.188 million unrealised loss (2012: $0.399 million unrealised loss);
(d) Cash Converters International Limited (ASX: CCV) - $0.305 million realised gain (2012: Nil); and
(e) Other listed and unlisted securities - $0.380 million realised gain and $0.546 million unrealised loss (2012: $1.146 million unrealised gain and $0.780 million realised loss).
Bentley’s new technology software/applications development division (via Devisd established in July 2012) contributed net loss of $0.225 million (2012: Nil). LOSS PER SHARE
CONSOLIDATED June 2013 June 2012
Loss per share (cents) (0.46) (2.77) FINANCIAL POSITION
CONSOLIDATED June 2013
$'000 June 2012
$'000
Investments 13,058 15,171
Cash 4,892 4,948
Net deferred tax asset/liabilities - -
Resource projects - 65
Intangible assets 312 -
Other assets 324 244
Liabilities (318) (356)
Net assets 18,268 20,072
Issued capital 19,820 22,068
Accumulated losses (1,552) (1,996)
Total equity 18,268 20,072 DIVIDENDS The Directors have not declared a final dividend for the financial year ended 30 June 2013.
30 JUNE 2013 BENTLEY CAPITAL LIMITED A.B.N. 87 008 108 218
DIRECTORS’ REPORT
ANNUAL REPORT | 8
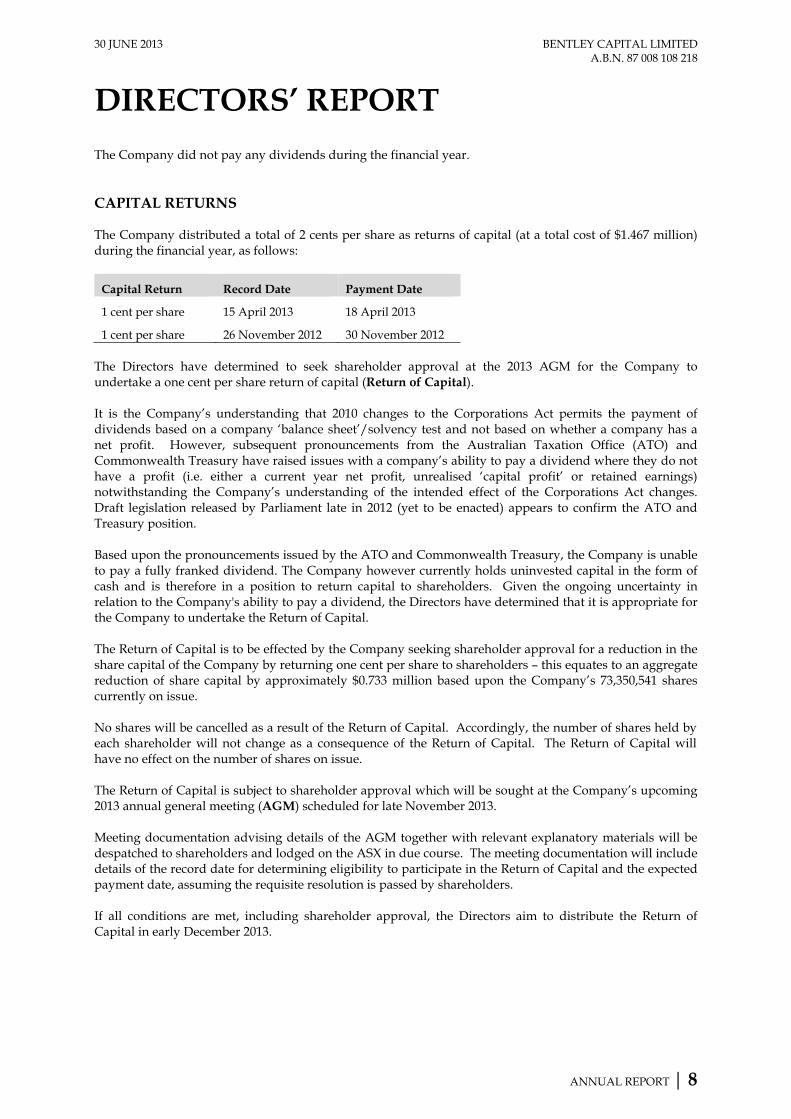
The Company did not pay any dividends during the financial year. CAPITAL RETURNS The Company distributed a total of 2 cents per share as returns of capital (at a total cost of $1.467 million) during the financial year, as follows:
Capital Return Record Date Payment Date
1 cent per share 15 April 2013 18 April 2013
1 cent per share 26 November 2012 30 November 2012 The Directors have determined to seek shareholder approval at the 2013 AGM for the Company to undertake a one cent per share return of capital (Return of Capital). It is the Company’s understanding that 2010 changes to the Corporations Act permits the payment of dividends based on a company ‘balance sheet’/solvency test and not based on whether a company has a net profit. However, subsequent pronouncements from the Australian Taxation Office (ATO) and Commonwealth Treasury have raised issues with a company’s ability to pay a dividend where they do not have a profit (i.e. either a current year net profit, unrealised ‘capital profit’ or retained earnings) notwithstanding the Company’s understanding of the intended effect of the Corporations Act changes. Draft legislation released by Parliament late in 2012 (yet to be enacted) appears to confirm the ATO and Treasury position. Based upon the pronouncements issued by the ATO and Commonwealth Treasury, the Company is unable to pay a fully franked dividend. The Company however currently holds uninvested capital in the form of cash and is therefore in a position to return capital to shareholders. Given the ongoing uncertainty in relation to the Company's ability to pay a dividend, the Directors have determined that it is appropriate for the Company to undertake the Return of Capital. The Return of Capital is to be effected by the Company seeking shareholder approval for a reduction in the share capital of the Company by returning one cent per share to shareholders – this equates to an aggregate reduction of share capital by approximately $0.733 million based upon the Company’s 73,350,541 shares currently on issue. No shares will be cancelled as a result of the Return of Capital. Accordingly, the number of shares held by each shareholder will not change as a consequence of the Return of Capital. The Return of Capital will have no effect on the number of shares on issue. The Return of Capital is subject to shareholder approval which will be sought at the Company’s upcoming 2013 annual general meeting (AGM) scheduled for late November 2013. Meeting documentation advising details of the AGM together with relevant explanatory materials will be despatched to shareholders and lodged on the ASX in due course. The meeting documentation will include details of the record date for determining eligibility to participate in the Return of Capital and the expected payment date, assuming the requisite resolution is passed by shareholders. If all conditions are met, including shareholder approval, the Directors aim to distribute the Return of Capital in early December 2013.

30 JUNE 2013 BENTLEY CAPITAL LIMITED A.B.N. 87 008 108 218
DIRECTORS’ REPORT
ANNUAL REPORT | 9
CAPITAL MANAGEMENT Securities on Issue
The Company has 73,350,541 (30 June 2012: 73,350,541) fully paid, ordinary shares on issue. All such shares are listed on ASX. The Company has no other securities on issue.
On-Market Share Buy-Back
The Company’s on-market share buy-back initiative (Buy-Back)7 expired on 31 August 2012 after 12 months8. No shares were bought-back under the Buy-Back during the financial year (2012: 665,961 shares bought back at a cost of $0.144 million).
Capital Returns
As described above, the Company returned one cent per share to shareholders on 16 November 20129 and 5 April 201310 (at a total cost of $1.467 million) during the financial year pursuant to shareholders’ approvals.
Reduction in Share Capital and Accumulated Losses
The Company reduced its share capital and accumulated losses by $0.781 million per share in accordance with approval given at the 2012 AGM. This did not result in the return of capital to shareholders or the cancellation of shares, but allows the Company to remove historical accumulated accounting losses from its books that affect its ability to retain current and future earnings, on which dividends may potentially be paid in future.
REVIEW OF OPERATIONS Net Asset Weightings A summary of Bentley’s net asset weighting (by value and as a percentage of net assets) is:
Net Assets 30 June 2013 31 December 2012 30 June 2012 $’m % $’m % $’m %
Australian equities 1 13.06 71.5 12.34 63.8 15.17 75.6
Intangible assets and resource projects 2 0.31 1.7 0.13 0.7 0.06 0.3
Provision for income tax - - - - - -
Net cash on deposit/other assets/provisions 4.90 26.8 6.85 35.5 4.84 24.1
Total Net Assets 18.27 100.0 19.32 100.0 20.07 100.0
NTA backing per share $0.2448 $0.2625 $0.2728
Adjusted NTA backing per share $0.2648 N/A N/A (with capital returns during the 2012/13 year added back)
1. Includes an investment in the FSP Equities Leaders Fund
2. Includes the value of capitalised software development and tenement applications costs (where applicable)
7 Refer 17 August 2011 ASX market announcement “Intention to Conduct On-Market Share Buy-Back” and Appendix 3C – Announcement
of Buy-Back dated 17 August 2011. 8 Refer Appendix 3F Final Share Buy-Back Notice released on ASX on 10 September 2012. 9 Refer Bentley’s Notice of Annual General Meeting dated 12 October 2012 and released on ASX on 18 October 2012 for a general meeting
held on 16 November 2012. 10 Refer Bentley’s Notice of General Meeting dated 28 February 2013 and released on ASX on 7 March 2013 for a general meeting held on 5
April 2013.

30 JUNE 2013 BENTLEY CAPITAL LIMITED A.B.N. 87 008 108 218
DIRECTORS’ REPORT
ANNUAL REPORT | 10
Major Holdings A summary of Bentley’s major investment holdings (by value and as a percentage of net assets) is:
Security ASX Code Industry Sector
30 June 2013 31 December 2012 30 June 2012 $’m % $’m % $’m %
FSP Equities Leaders Fund - Diversified 6.83 37.4 6.44 33.3 5.56 27.7
Beach Energy Limited BPT Energy 1.02 5.6 1.33 6.9 0.58 2.9
Chorus Limited CNU Telecommunications 0.70 3.8 0.60 3.1 - -
National Australia Bank Limited NAB Banking 0.64 3.5 0.54 2.8 - -
Other listed securities - Various 3.87 21.2 3.43 17.7 9.03 45.0 Subsequent to 30 June 2013 year end and to 23 August 2013, Bentley:
(1) Realised $3.132 million from the sale of listed securities; and
(2) Invested a further $3.321 million in listed securities. FSP Equities Leaders Fund 11 As at 30 June 2013, Bentley had 37.39% ($6.831 million) of its net assets invested in the FSP Equities Leaders Fund (FSP Fund) (2012: 27.71% and $5.562 million). The 12 month performance of the FSP Fund to 30 June 2013 was +25.7% (2012: -12.0%) compared with its benchmark performance (S&P/ASX 200 Accumulation Index) of +22.8% (2012: -6.7%). In July 2013, Bentley received $0.160 million (2012: $0.209 million) income distributions from the FSP Fund in respect of the financial year ended 30 June 2013. The 30 June 2013 carrying value above is “ex” entitlement to this income distribution. Bentley’s investment in the FSP Fund has generated an unrealised gain of $1.269 million for the financial year (2012: $1.093 million realised loss (net of reversal of previous years’ unrealised gains on disposal) and $2.189 million unrealised loss). The investment’s unrealised gain (from historical cost) is $0.358 million (2012: $1.363 million unrealised loss). The FSP Fund is a wholesale fund not open to retail investors. The objective of the fund is to outperform the S&P/ASX 200 Accumulation Index over the medium term. The Investment Manager is “style neutral” and invests in growth stocks, value stocks, stocks with maintainable dividend yields and special situations. Bentley is able to redeem its investment in the FSP Fund at short notice without any exit fees. FSP Fund details provided to the Company as at 30 June 2013 are as follows:
The equity weighting was 96.17% (30 June 2012: 97.50%);
92.16% of the equity portfolio is invested in companies contained within the S&P/ASX 200 Index (30 June 2012: 81.81%) with the balance of 7.84% invested in companies outside of the S&P/ASX 200 Index (30 June 2012: 18.19%); and
The equity portfolio contained 42 holdings (30 June 2012: 57 holdings).
11 Based on information provided by investment manager, FSP Equities Management Limited.

30 JUNE 2013 BENTLEY CAPITAL LIMITED A.B.N. 87 008 108 218
DIRECTORS’ REPORT
ANNUAL REPORT | 11
In July 2012, Bentley received $208,515 income distributions from the FSP Fund in respect of the financial year ended 30 June 2012. The 30 June 2012 carrying value above is “ex” entitlement to this income distribution. Bentley’s investment in the FSP Fund has generated an unrealised loss of $1.04 million for the financial year (2011: $1.39 Million unrealised gain). The investment’s unrealised loss (from historical cost) is $1.36 million (2011: $0.32 million unrealised loss). The FSP Fund is a wholesale fund not open to retail investors. The objective of the fund is to outperform the S&P/ASX 200 Accumulation Index over the medium term. The Investment Manager is “style neutral” and invests in growth stocks, value stocks, stocks with maintainable dividend yields and special situations. Bentley is able to redeem its investment in the FSP Fund at short notice without any exit fees. FSP Fund details provided to the Company as at 30 June 2012 are as follows:
The equity weighting was 97.5% (30 June 2011: 97.93%);
81.81% of the equity portfolio is invested in companies contained within the S&P/ASX 200 Index (30 June 2011: 81.1%) with the balance of 18.19% invested in companies outside of the S&P/ASX 200 Index (30 June 2011: 18.9%); and
The equity portfolio contained 57 holdings (30 June 2011: 54 holdings).
30 JUNE 2013 BENTLEY CAPITAL LIMITED A.B.N. 87 008 108 218
DIRECTORS’ REPORT
ANNUAL REPORT | 12
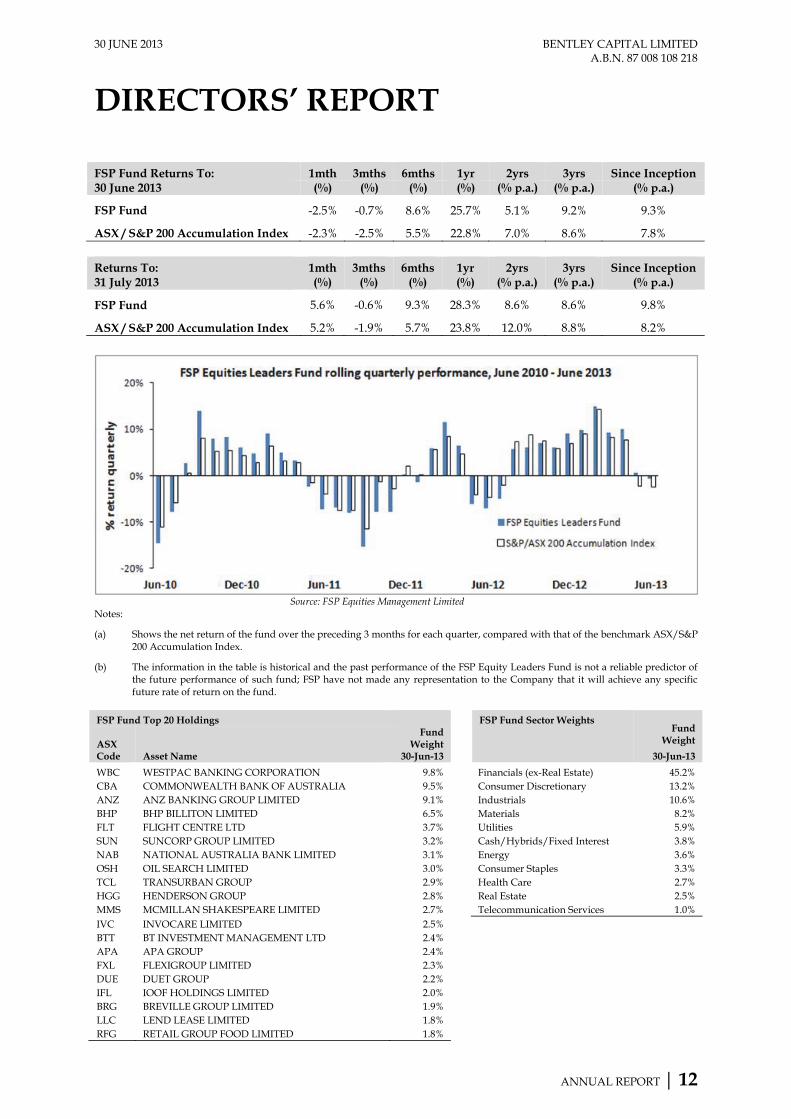
FSP Fund Returns To: 1mth 3mths 6mths 1yr 2yrs 3yrs Since Inception 30 June 2013 (%) (%) (%) (%) (% p.a.) (% p.a.) (% p.a.)
FSP Fund -2.5% -0.7% 8.6% 25.7% 5.1% 9.2% 9.3%
ASX / S&P 200 Accumulation Index -2.3% -2.5% 5.5% 22.8% 7.0% 8.6% 7.8% Returns To: 1mth 3mths 6mths 1yr 2yrs 3yrs Since Inception 31 July 2013 (%) (%) (%) (%) (% p.a.) (% p.a.) (% p.a.)
FSP Fund 5.6% -0.6% 9.3% 28.3% 8.6% 8.6% 9.8%
ASX / S&P 200 Accumulation Index 5.2% -1.9% 5.7% 23.8% 12.0% 8.8% 8.2%
Source: FSP Equities Management Limited
Notes:
(a) Shows the net return of the fund over the preceding 3 months for each quarter, compared with that of the benchmark ASX/S&P 200 Accumulation Index.
(b) The information in the table is historical and the past performance of the FSP Equity Leaders Fund is not a reliable predictor of the future performance of such fund; FSP have not made any representation to the Company that it will achieve any specific future rate of return on the fund.
FSP Fund Top 20 Holdings FSP Fund Sector Weights Fund
Weight
30-Jun-13 ASX Code Asset Name
Fund Weight
30-Jun-13
WBC WESTPAC BANKING CORPORATION 9.8% Financials (ex-Real Estate) 45.2% CBA COMMONWEALTH BANK OF AUSTRALIA 9.5% Consumer Discretionary 13.2% ANZ ANZ BANKING GROUP LIMITED 9.1% Industrials 10.6% BHP BHP BILLITON LIMITED 6.5% Materials 8.2% FLT FLIGHT CENTRE LTD 3.7% Utilities 5.9% SUN SUNCORP GROUP LIMITED 3.2% Cash/Hybrids/Fixed Interest 3.8% NAB NATIONAL AUSTRALIA BANK LIMITED 3.1% Energy 3.6% OSH OIL SEARCH LIMITED 3.0% Consumer Staples 3.3% TCL TRANSURBAN GROUP 2.9% Health Care 2.7% HGG HENDERSON GROUP 2.8% Real Estate 2.5% MMS MCMILLAN SHAKESPEARE LIMITED 2.7% Telecommunication Services 1.0% IVC INVOCARE LIMITED 2.5% BTT BT INVESTMENT MANAGEMENT LTD 2.4% APA APA GROUP 2.4% FXL FLEXIGROUP LIMITED 2.3% DUE DUET GROUP 2.2% IFL IOOF HOLDINGS LIMITED 2.0% BRG BREVILLE GROUP LIMITED 1.9% LLC LEND LEASE LIMITED 1.8% RFG RETAIL GROUP FOOD LIMITED 1.8%

30 JUNE 2013 BENTLEY CAPITAL LIMITED A.B.N. 87 008 108 218
DIRECTORS’ REPORT
ANNUAL REPORT | 13
Devisd Applications / Software Development Bentley established a technology division in July 2012 via the incorporation of Devisd Pty Limited (formerly Bentley Technologies Pty Limited) (Devisd). The division was formed to allow Bentley exposure to the growing importance of the Internet and social media applications as a potentially valuable investment and/or income generating opportunity for Bentley. The Devisd team is based in Perth and currently comprises a CEO and Chief Technology Officer with third-party programming, design and development contractors engaged on a project by project basis. Devisd has a number of applications and software projects under development, as detailed below:
(1) ShopBites is a smartphone application and system designed to drive foot traffic into participating stores throughout Australia. Registered shoppers are targeted (using geo-location technology) and encouraged to visit partner stores and undertake certain actions using their smartphone (such as scanning in-store QR codes or product barcodes) and in doing so, will earn points called ‘bites’. Bites can then be redeemed for a range of rewards, including digital gift vouchers, credits for third-party applications and physical goods, all within the smartphone application.
(2) “Rdrct.it” is a web service that allows smart-phone application (app) developers to send out download links for their apps and app content that direct link recipients to the correct end-point, irrespective of the user’s platform, or whether they have the relevant app installed. This project is currently in beta testing and has commenced earning revenue in such test phase.
(3) Squizzed is a smartphone application that allows users to create an Augmented Reality (AR) map to share with friends or the general public. Maps may include local attractions, tourist spots or something as specific as temporary locations at an event.
(4) “Yurn.it” is an e-commerce website interlaced with social and competitive elements. Via a series of rolling competitions, users will be encouraged to identify and upload consumer items to the yurn.it website.
(5) Tree Trauma is a mobile game in which the player acts as a topiarist who, using a variety of tools, trims trees into shapes as set by topiary judges.
Performance Bonus Scheme (PBS) There were no entitlements arising under the Company’s Performance Bonus Scheme (PBS) (which was implemented on 1 May 201012) during the financial year. The conditions for payment to members of the Investment Committee are related to Bentley’s financial performance (based on the change in Bentley’s net asset value relative to the Benchmark ASX All Ordinaries Index) during each half-year period. Please refer to the Remuneration Report below for further details in relation to the PBS. SIGNIFICANT CHANGES IN THE STATE OF AFFAIRS There were no significant changes in the state of affairs of Bentley that occurred during the financial year not otherwise disclosed in this Directors’ Report or the financial statements.
12 Refer 10 May 2010 ASX market announcement “Appointment of Chief Investment Officer and Implementation of Investment Strategy”
and also the Remuneration Report at pages 18 to 21 of this report.
30 JUNE 2013 BENTLEY CAPITAL LIMITED A.B.N. 87 008 108 218
DIRECTORS’ REPORT
ANNUAL REPORT | 14
FUTURE DEVELOPMENTS Bentley intends to continue its investment activities in future years. The results of these investment activities depend upon the performance of the underlying companies and securities in which Bentley invests. The investments’ performances depend on many economic factors and also industry and company- specific issues. In the opinion of the Directors, it is not possible or appropriate to make a prediction on the future course of markets, the performance of Bentley’s investments or forecast the likely results of Bentley’s activities. ENVIRONMENTAL REGULATION Bentley notes the reporting requirements of both the Energy Efficiency Opportunities Act 2006 (Cth) (EEOA) and the National Greenhouse and Energy Reporting Act 2007 (Cth) (NGERA). The EEOA requires affected companies to assess their energy usage, including the identification, investigation and evaluation of energy saving opportunities, and to report publicly on the assessments undertaken, including what action the company intends to take as a result. The NGERA requires affected companies to report their annual greenhouse gas emissions and energy use. Bentley has determined that it does not operate a recognised facility requiring registration and reporting under the NGERA and in any event, it would fall under the threshold of greenhouse gas emissions required for registration and reporting. Similarly, Bentley’s energy consumption would fall under the threshold required for registration and reporting under the EEOA. Bentley notes that it is not directly subject to the Clean Energy Act 2011 (Cth). Bentley is not otherwise subject to any particular or significant environmental regulation under either Commonwealth or State legislation. To the extent that any environmental regulations may have an incidental impact on Bentley's operations, the Directors are not aware of any breach by Bentley of those regulations.

30 JUNE 2013 BENTLEY CAPITAL LIMITED A.B.N. 87 008 108 218
DIRECTORS’ REPORT
ANNUAL REPORT | 15
DIRECTORS Directors in office during or since the financial year are as follows:
FAROOQ KHAN — Chairman
Appointed — Director since 2 December 2003; Chairman since 10 February 2004
Qualifications — BJuris, LLB. (UWA)
Experience — Mr Khan is a qualified lawyer having previously practised principally in the field of corporate law. Mr Khan has extensive experience in the securities industry, capital markets and the executive management of ASX-listed companies. In particular, Mr Khan has guided the establishment and growth of a number of public listed companies in the investment, mining and financial services sector. He has considerable experience in the fields of capital raisings, mergers and acquisitions and investments.
Relevant interest in shares — None
Special Responsibilities — Chairman of the Board and Investment Committee
Other current directorships in listed entities
— (1) Executive Chairman and Managing Director of Queste Communications Ltd (QUE) (since 10 March 1998)
(2) Executive Chairman of Orion Equities Limited (OEQ) (since 23 October 2006)
Former directorships in other listed entities in past 3 years
— (1) Alara Resources Limited (AUQ) (18 May 2007 to 31 August 2012) (2) Yellow Brick Road Holdings Limited (YBR) (27 April 2006 to 18 March
2011) (3) Strike Resources Limited (SRK) (3 September 1999 to 3 February 2011)
WILLIAM M. JOHNSON — Non-Executive Director
Appointed — Director since 13 March 2009; Non-Executive Director since 26 March 2013
Qualifications — MA (Oxon), MBA
Experience — Mr Johnson commenced his career in resource exploration and has held senior management and executive roles in a number of public companies in Australia, New Zealand and Asia. Throughout his career, Mr Johnson has been actively involved in the strategic analysis of a diverse range of business and investment opportunities and the execution of many corporate transactions. Mr Johnson brings a considerable depth of experience in business strategy and investment analysis and execution.
Relevant interest in shares — None
Special Responsibilities — Mr Johnson is a Member of the Audit and Remuneration Committees. He was a member of the Investment Committee until 26 March 2013.
Other current directorships in listed entities
— Managing Director of Strike Resources Limited (SRK) (since 25 March 2013; Director since 14 July 2006; Executive Director since 21 January 2013)
Non-Executive Director of Alara Resources Limited (AUQ) (since 1 July 2011; Director since 26 October 2009)
Former directorships in other listed entities in past 3 years
— Orion Equities Limited (OEQ) (28 February 2003 to 3 May 2013)
30 JUNE 2013 BENTLEY CAPITAL LIMITED A.B.N. 87 008 108 218
DIRECTORS’ REPORT
ANNUAL REPORT | 16
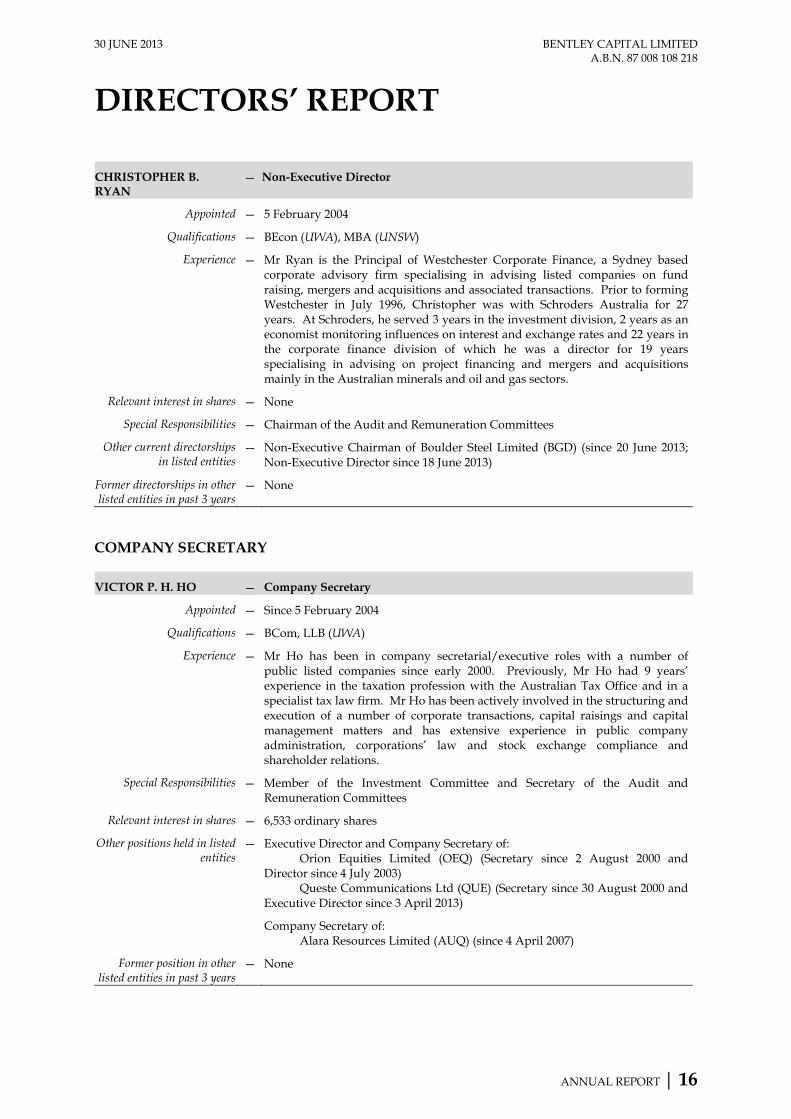
CHRISTOPHER B. RYAN
— Non-Executive Director
Appointed — 5 February 2004
Qualifications — BEcon (UWA), MBA (UNSW)
Experience — Mr Ryan is the Principal of Westchester Corporate Finance, a Sydney based corporate advisory firm specialising in advising listed companies on fund raising, mergers and acquisitions and associated transactions. Prior to forming Westchester in July 1996, Christopher was with Schroders Australia for 27 years. At Schroders, he served 3 years in the investment division, 2 years as an economist monitoring influences on interest and exchange rates and 22 years in the corporate finance division of which he was a director for 19 years specialising in advising on project financing and mergers and acquisitions mainly in the Australian minerals and oil and gas sectors.
Relevant interest in shares — None
Special Responsibilities — Chairman of the Audit and Remuneration Committees
Other current directorships in listed entities
— Non-Executive Chairman of Boulder Steel Limited (BGD) (since 20 June 2013; Non-Executive Director since 18 June 2013)
Former directorships in other listed entities in past 3 years
— None
COMPANY SECRETARY
VICTOR P. H. HO — Company Secretary
Appointed — Since 5 February 2004
Qualifications — BCom, LLB (UWA)
Experience — Mr Ho has been in company secretarial/executive roles with a number of public listed companies since early 2000. Previously, Mr Ho had 9 years’ experience in the taxation profession with the Australian Tax Office and in a specialist tax law firm. Mr Ho has been actively involved in the structuring and execution of a number of corporate transactions, capital raisings and capital management matters and has extensive experience in public company administration, corporations’ law and stock exchange compliance and shareholder relations.
Special Responsibilities — Member of the Investment Committee and Secretary of the Audit and Remuneration Committees
Relevant interest in shares — 6,533 ordinary shares
Other positions held in listed entities
— Executive Director and Company Secretary of: Orion Equities Limited (OEQ) (Secretary since 2 August 2000 and
Director since 4 July 2003) Queste Communications Ltd (QUE) (Secretary since 30 August 2000 and
Executive Director since 3 April 2013)
Company Secretary of: Alara Resources Limited (AUQ) (since 4 April 2007)
Former position in other listed entities in past 3 years
— None
30 JUNE 2013 BENTLEY CAPITAL LIMITED A.B.N. 87 008 108 218
DIRECTORS’ REPORT
ANNUAL REPORT | 17
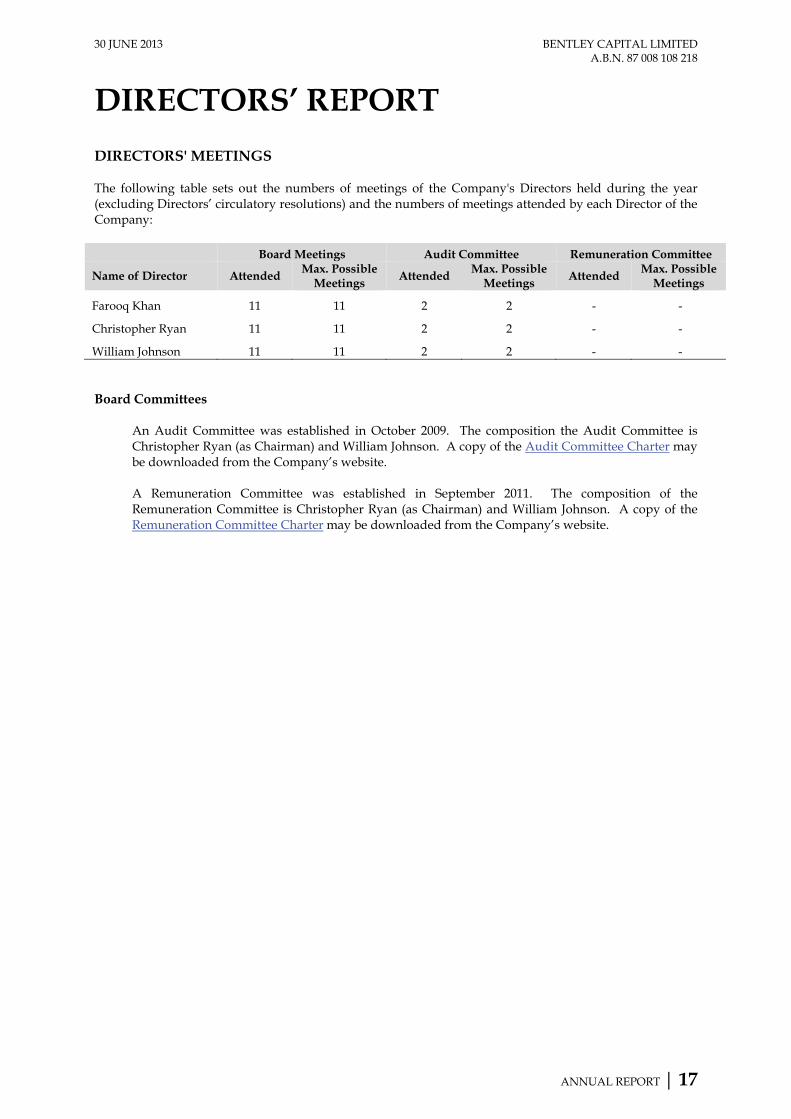
DIRECTORS' MEETINGS The following table sets out the numbers of meetings of the Company's Directors held during the year (excluding Directors’ circulatory resolutions) and the numbers of meetings attended by each Director of the Company:
Board Meetings Audit Committee Remuneration Committee
Name of Director Attended Max. Possible Meetings
Attended Max. Possible Meetings
Attended Max. Possible Meetings
Farooq Khan 11 11 2 2 - -
Christopher Ryan 11 11 2 2 - -
William Johnson 11 11 2 2 - - Board Committees
An Audit Committee was established in October 2009. The composition the Audit Committee is Christopher Ryan (as Chairman) and William Johnson. A copy of the Audit Committee Charter may be downloaded from the Company’s website. A Remuneration Committee was established in September 2011. The composition of the Remuneration Committee is Christopher Ryan (as Chairman) and William Johnson. A copy of the Remuneration Committee Charter may be downloaded from the Company’s website.
30 JUNE 2013 BENTLEY CAPITAL LIMITED A.B.N. 87 008 108 218
REMUNERATION REPORT
ANNUAL REPORT | 18
This Remuneration Report details the nature and amount of remuneration for each Director of the Company. The information provided under headings (1) to (5) below has been audited as required under section 308(3)(c) of the Corporations Act 2001. (1) Remuneration Policy
The Board determines the remuneration structure of all Directors and Company Executives (being a company secretary or senior manager) (Key Management Personnel) having regard to the Company’s nature, scale and scope of operations and other relevant factors, including the frequency of Board meetings, length of service, particular experience and qualifications. Fixed Cash Short-term Employment Benefits: The Key Management Personnel of the Company are paid a fixed amount per annum plus applicable employer superannuation contributions. The Non-Executive Directors of the Company are paid a maximum aggregate base remuneration of $110,000 per annum inclusive of employer superannuation contributions where applicable, to be divided as the Board determines appropriate. The Board has determined the following fixed cash remuneration for current Key Management Personnel during the year as follows: Executive Directors
(1) Mr Farooq Khan (Executive Chairman) – a base salary of $175,000 per annum plus employer superannuation contributions; and
(2) Mr William Johnson – a base salary of $85,000 per annum plus employer superannuation contributions, until 24 March 2013. Mr Johnson transitioned to Non-Executive Director on 25 March 2013.
Non-Executive Director
(3) Mr Christopher Ryan – a base fee of $26,400 per annum (including 10% GST) payable to Westchester Financial Services Pty Limited (trading as Westchester Corporate Finance), a corporate advisory company in which Mr Ryan is principal; and
(4) Mr William Johnson – a base salary of $24,000 per annum plus employer superannuation contributions (where applicable), from 25 March 2013.
Company Executives/Senior Managers
(5) Mr Victor Ho (Company Secretary) – a base salary of $85,000 per annum plus employer superannuation contributions.
Special Exertions and Reimbursements: Pursuant to the Company’s Constitution, each Director is also entitled to receive:
(a) Payment for reimbursement of all travelling, hotel and other expenses reasonably incurred by a Director for the purpose of attending meetings of the Board or otherwise in and about the business of the Company; and
(b) In respect of Non-Executive Directors, payment for the performance of extra services or the making of special exertions for the benefit of the Company (at the request of and with the concurrence of the Board).
Long-Term Benefits: Key Management Personnel have no right to termination payments save for payment of accrued annual leave and long service leave (other than Non-Executive Directors).
30 JUNE 2013 BENTLEY CAPITAL LIMITED A.B.N. 87 008 108 218
REMUNERATION REPORT
ANNUAL REPORT | 19
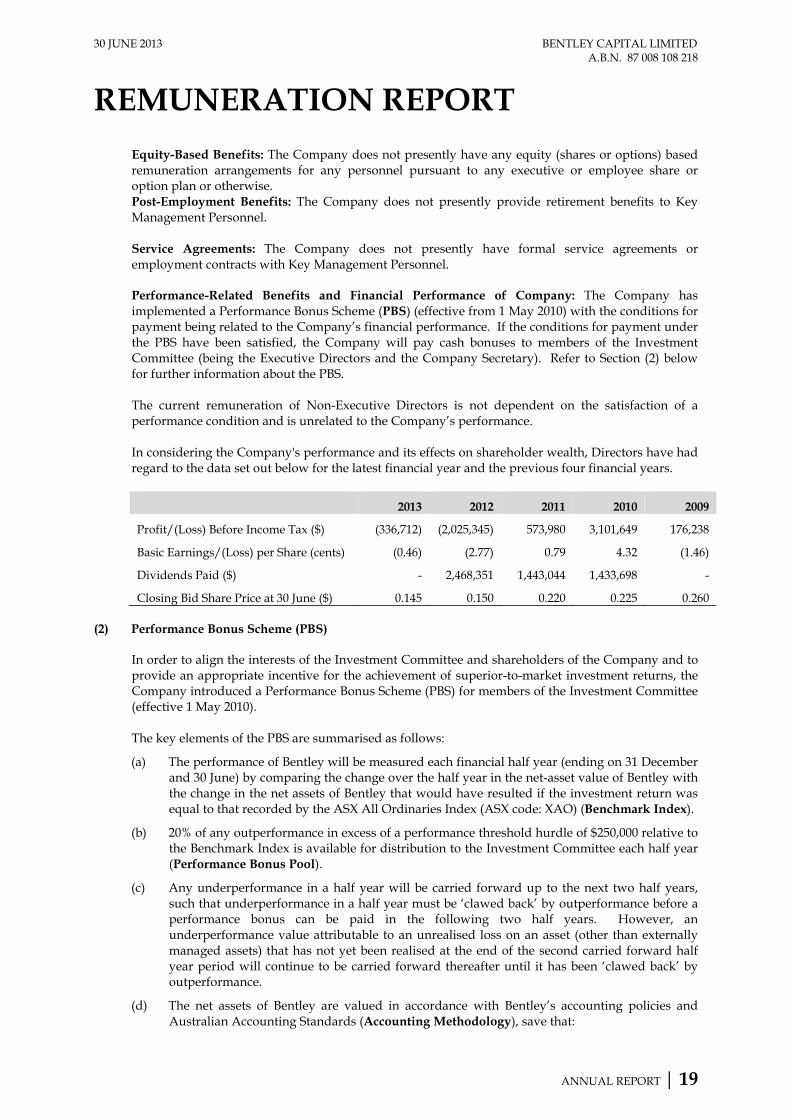
Equity-Based Benefits: The Company does not presently have any equity (shares or options) based remuneration arrangements for any personnel pursuant to any executive or employee share or option plan or otherwise. Post-Employment Benefits: The Company does not presently provide retirement benefits to Key Management Personnel. Service Agreements: The Company does not presently have formal service agreements or employment contracts with Key Management Personnel. Performance-Related Benefits and Financial Performance of Company: The Company has implemented a Performance Bonus Scheme (PBS) (effective from 1 May 2010) with the conditions for payment being related to the Company’s financial performance. If the conditions for payment under the PBS have been satisfied, the Company will pay cash bonuses to members of the Investment Committee (being the Executive Directors and the Company Secretary). Refer to Section (2) below for further information about the PBS. The current remuneration of Non-Executive Directors is not dependent on the satisfaction of a performance condition and is unrelated to the Company’s performance. In considering the Company's performance and its effects on shareholder wealth, Directors have had regard to the data set out below for the latest financial year and the previous four financial years.
2013 2012 2011 2010 2009
Profit/(Loss) Before Income Tax ($) (336,712) (2,025,345) 573,980 3,101,649 176,238
Basic Earnings/(Loss) per Share (cents) (0.46) (2.77) 0.79 4.32 (1.46)
Dividends Paid ($) - 2,468,351 1,443,044 1,433,698 -
Closing Bid Share Price at 30 June ($) 0.145 0.150 0.220 0.225 0.260
(2) Performance Bonus Scheme (PBS) In order to align the interests of the Investment Committee and shareholders of the Company and to provide an appropriate incentive for the achievement of superior-to-market investment returns, the Company introduced a Performance Bonus Scheme (PBS) for members of the Investment Committee (effective 1 May 2010). The key elements of the PBS are summarised as follows:
(a) The performance of Bentley will be measured each financial half year (ending on 31 December and 30 June) by comparing the change over the half year in the net-asset value of Bentley with the change in the net assets of Bentley that would have resulted if the investment return was equal to that recorded by the ASX All Ordinaries Index (ASX code: XAO) (Benchmark Index).
(b) 20% of any outperformance in excess of a performance threshold hurdle of $250,000 relative to the Benchmark Index is available for distribution to the Investment Committee each half year (Performance Bonus Pool).
(c) Any underperformance in a half year will be carried forward up to the next two half years, such that underperformance in a half year must be ‘clawed back’ by outperformance before a performance bonus can be paid in the following two half years. However, an underperformance value attributable to an unrealised loss on an asset (other than externally managed assets) that has not yet been realised at the end of the second carried forward half year period will continue to be carried forward thereafter until it has been ‘clawed back’ by outperformance.
(d) The net assets of Bentley are valued in accordance with Bentley’s accounting policies and Australian Accounting Standards (Accounting Methodology), save that:

30 JUNE 2013 BENTLEY CAPITAL LIMITED A.B.N. 87 008 108 218
REMUNERATION REPORT
ANNUAL REPORT | 20
(i) assets (other than externally managed assets) are carried at the lower of cost or value (whereas they would have been ‘marked to market’ under the Accounting Methodology); and
(ii) deferred tax assets and deferred tax liabilities (other than in respect of externally managed assets) are excluded from net assets but a provision for income tax expense is included.
(e) The terms of the PBS are to be reviewed annually by the Board.
(f) The Performance Bonus Pool is distributed to members of the Investment Committee pursuant to a resolution of the Board.
(g) If Bentley has incurred a net loss for the financial half year, the Board may in exceptional circumstances at its absolute discretion withhold up to 50% of the Performance Bonus Pool applicable to that financial half year.
(h) Any Director who is a member of the Investment Committee may not be present during the Board’s deliberations in relation to setting the above entitlements under the PBS and must abstain from voting on such determination by the Board.
The Company believes the principles adopted by the PBS are consistent with or exceed industry best practice, in that:
A performance bonus on internally managed assets is paid only on realised (and not unrealised) gains, i.e. investments have to be sold (or otherwise crystallised) to contribute to a performance bonus. This eliminates the potential of a performance bonus being paid in a half year by reference to unrealised, internally managed investments that may have substantially outperformed over that half year, yet subsequently underperform.
The ‘clawback’ of underperformance means that the Investment Committee will be highly motivated to avoid periods of underperformance.
To achieve a performance bonus, the Investment Committee must not only outperform the Benchmark Index, but also achieve an absolute return at least $250,000 (performance threshold hurdle) greater than the result that would have been achieved matching the Benchmark Index for any half year. In other words, the first $250,000 of outperformance in any half year does not generate a performance bonus.
There were no entitlements arising under the PBS during the financial year (i.e. in respect of each of the half years ending 31 December 2012 and 30 June 2013).
(3) Details of Remuneration of Key Management Personnel Details of the nature and amount of each element of remuneration of each Key Management Personnel paid or payable by the Company during the financial year are as follows:
2013
Short-term Benefits
Post- Employment
Benefits
Other Long-term Benefits
Equity- Based
Key Management Personnel
Performance- related
Cash salary and
fees Non-cash
benefit Superannuation
Long service
leave Shares &
options Total % $ $ $ $ $ $
Executive Directors: Farooq Khan - 160,192 - 14,417 - - 174,609
Non-Executive Directors: Christopher Ryan(b) - 29,700 - - - - 29,700 William Johnson(a) - 63,750 - 5,738 - - 69,488
Company Secretary: Victor Ho - 85,000 - 7,650 - - 92,650
30 JUNE 2013 BENTLEY CAPITAL LIMITED A.B.N. 87 008 108 218
REMUNERATION REPORT
ANNUAL REPORT | 21
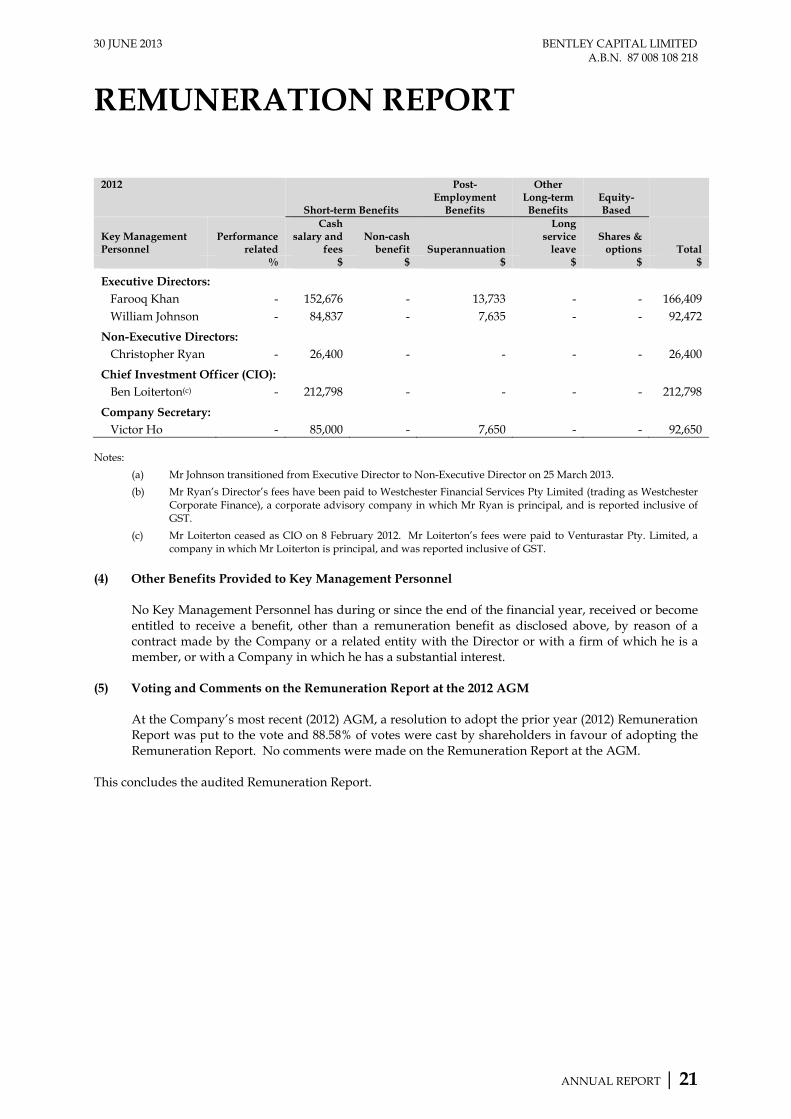
2012
Short-term Benefits
Post- Employment
Benefits
Other Long-term Benefits
Equity- Based
Key Management Personnel
Performance related
Cash salary and
fees Non-cash
benefit Superannuation
Long service
leave Shares &
options Total % $ $ $ $ $ $
Executive Directors: Farooq Khan - 152,676 - 13,733 - - 166,409 William Johnson - 84,837 - 7,635 - - 92,472
Non-Executive Directors: Christopher Ryan - 26,400 - - - - 26,400
Chief Investment Officer (CIO): Ben Loiterton(c) - 212,798 - - - - 212,798
Company Secretary: Victor Ho - 85,000 - 7,650 - - 92,650
Notes:
(a) Mr Johnson transitioned from Executive Director to Non-Executive Director on 25 March 2013.
(b) Mr Ryan’s Director’s fees have been paid to Westchester Financial Services Pty Limited (trading as Westchester Corporate Finance), a corporate advisory company in which Mr Ryan is principal, and is reported inclusive of GST.
(c) Mr Loiterton ceased as CIO on 8 February 2012. Mr Loiterton’s fees were paid to Venturastar Pty. Limited, a company in which Mr Loiterton is principal, and was reported inclusive of GST.
(4) Other Benefits Provided to Key Management Personnel
No Key Management Personnel has during or since the end of the financial year, received or become entitled to receive a benefit, other than a remuneration benefit as disclosed above, by reason of a contract made by the Company or a related entity with the Director or with a firm of which he is a member, or with a Company in which he has a substantial interest.
(5) Voting and Comments on the Remuneration Report at the 2012 AGM At the Company’s most recent (2012) AGM, a resolution to adopt the prior year (2012) Remuneration Report was put to the vote and 88.58% of votes were cast by shareholders in favour of adopting the Remuneration Report. No comments were made on the Remuneration Report at the AGM.
This concludes the audited Remuneration Report.
30 JUNE 2013 BENTLEY CAPITAL LIMITED A.B.N. 87 008 108 218
DIRECTORS’ REPORT
ANNUAL REPORT | 22
DIRECTORS’ AND OFFICERS’ INSURANCE The Company insures Directors and Officers against liability they may incur in respect of any wrongful acts or omissions made by them in such capacity (to the extent permitted by the Corporations Act 2001) (D&O Policy). Details of the amount of the premium paid in respect of the insurance policies are not disclosed as such disclosure is prohibited under the terms of the contract. DIRECTORS’ AND OFFICERS’ DEEDS In addition to the rights of indemnity provided under the Company’s Constitution (to the extent permitted by the Corporations Act 2001), the Company has also entered into a deed with each of the Directors and the Company Secretary (Officer) to regulate certain matters between the Company and each Officer, both during the time the Officer holds office and after the Officer ceases to be an officer of the Company, including the following matters:
(a) The Company’s obligation to indemnify an Officer for liabilities or legal costs incurred as an officer of the Company (to the extent permitted by the Corporations Act 2001); and
(b) Subject to the terms of the deed and the Corporations Act 2001, the Company may advance monies to the Officer to meet any costs or expenses of the Officer incurred in circumstances relating to the indemnities provided under the deed and prior to the outcome of any legal proceedings brought against the Officer.
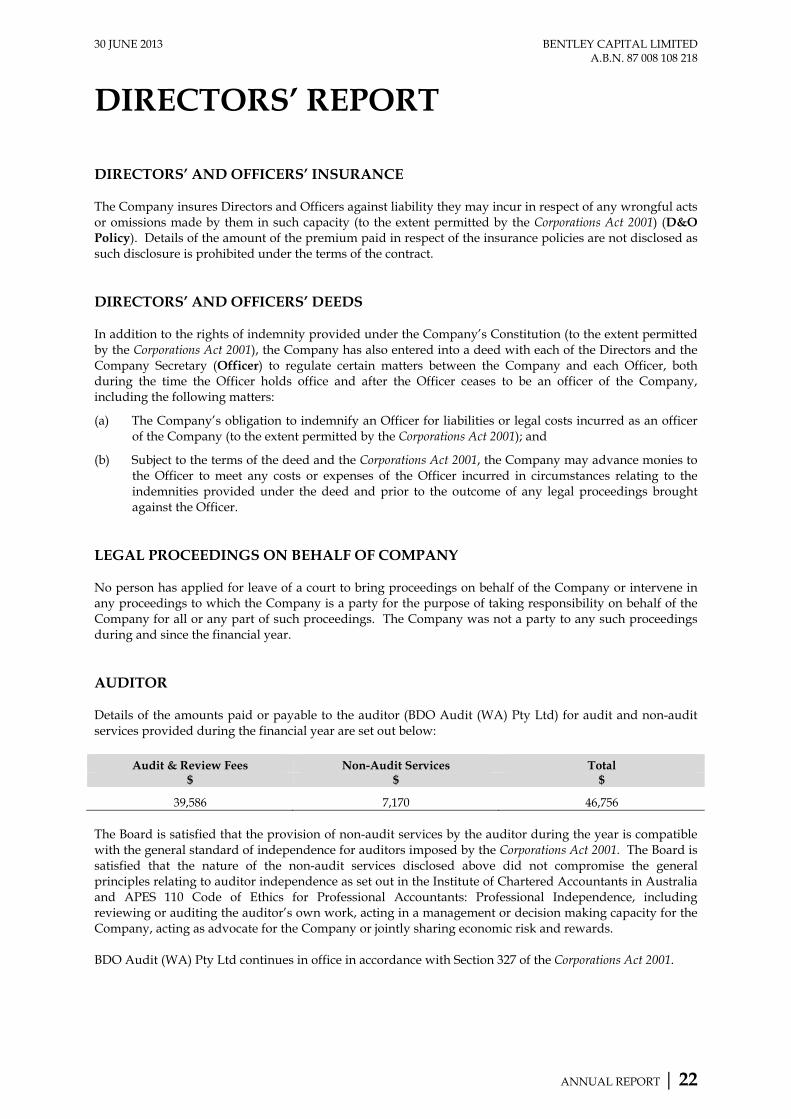
LEGAL PROCEEDINGS ON BEHALF OF COMPANY No person has applied for leave of a court to bring proceedings on behalf of the Company or intervene in any proceedings to which the Company is a party for the purpose of taking responsibility on behalf of the Company for all or any part of such proceedings. The Company was not a party to any such proceedings during and since the financial year. AUDITOR Details of the amounts paid or payable to the auditor (BDO Audit (WA) Pty Ltd) for audit and non-audit services provided during the financial year are set out below:
Audit & Review Fees Non-Audit Services Total $ $ $
39,586 7,170 46,756 The Board is satisfied that the provision of non-audit services by the auditor during the year is compatible with the general standard of independence for auditors imposed by the Corporations Act 2001. The Board is satisfied that the nature of the non-audit services disclosed above did not compromise the general principles relating to auditor independence as set out in the Institute of Chartered Accountants in Australia and APES 110 Code of Ethics for Professional Accountants: Professional Independence, including reviewing or auditing the auditor’s own work, acting in a management or decision making capacity for the Company, acting as advocate for the Company or jointly sharing economic risk and rewards. BDO Audit (WA) Pty Ltd continues in office in accordance with Section 327 of the Corporations Act 2001.
30 JUNE 2013 BENTLEY CAPITAL LIMITED A.B.N. 87 008 108 218
DIRECTORS’ REPORT
ANNUAL REPORT | 23
AUDITOR’S INDEPENDENCE DECLARATION A copy of the Auditor’s Independence Declaration as required under section 307C of the Corporations Act 2001 forms part of this Directors Report and is set out on page 24. This relates to the Audit Report, where the Auditors state that they have issued an independence declaration. EVENTS SUBSEQUENT TO BALANCE DATE The Directors are not aware of any matters or circumstances at the date of this Directors’ Report, other than those referred to in this Directors’ Report (in particular, in the Review of Operations) or the financial statements or notes thereto (in particular Note 24), that have significantly affected or may significantly affect the operations, the results of operations or the state of affairs of the Company in subsequent financial years. Signed for and on behalf of the Directors in accordance with a resolution of the Board,
Farooq Khan Christopher Ryan Chairman Director 30 August 2013

38 Station StreetSubiaco, WA 6008PO Box 700 West Perth WA 6872Australia
Tel: +8 6382 4600Fax: +8 6382 4601www.bdo.com.au
BDO Audit (WA) Pty Ltd ABN 79 112 284 787 is a member of a national association of independent entities which are all members of BDO (Australia) Ltd ABN 77 050110 275, an Australian company limited by guarantee. BDO Audit (WA) Pty Ltd and BDO (Australia) Ltd are members of BDO International Ltd, a UK company limitedby guarantee, and form part of the international BDO network of independent member firms. Liability limited by a scheme approved under Professional StandardsLegislation (other than for the acts or omissions of financial services licensees) in each State or Territory other than Tasmania.
30 August 2013
The Audit CommitteeBentley Capital LimitedSuite 1, 346 Barker RoadSUBIACO WA 6008
Dear Sirs,
DECLARATION OF INDEPENDENCE BY CHRIS BURTON TO THE DIRECTORS OFBENTLEY CAPITAL LIMITED
As lead auditor of Bentley Capital Limited for the year ended 30 June 2013, I declare that, to thebest of my knowledge and belief, there have been no contraventions of:
• the auditor independence requirements of the Corporations Act 2001 in relation to the audit;and
• any applicable code of professional conduct in relation to the audit.
This declaration is in respect of Bentley Capital Limited and the entities it controlled during theperiod.
Chris BurtonDirector
BDO Audit (WA) Pty LtdPerth, Western Australia


30 JUNE 2013 BENTLEY CAPITAL LIMITEDA.B.N. 87 008 108 218
Note 2013 2012
$ $
3(a)
288,487 8,662 255,560 323,791
227,420 - 170,747 240,917
942,214 573,370
3(b)
- (1,181,703) (176,940) (109,981) (120,662) (118,827)
(7,435) (4,643) (64,213) (64,106)
(909,676) (1,119,455)
(336,712) (2,025,345)
4 - -
(336,712) (2,025,345)
- -
(336,712) (2,025,345)
8 (0.46) (2.77)
Net Loss on Financial Assets at Fair Value through Profit or Loss
EXPENSES
Basic and Diluted Loss per Share (cents)
Other Comprehensive Income, Net of Tax
OTHER COMPREHENSIVE INCOME
LOSS FOR THE YEAR
TOTAL COMPREHENSIVE LOSS FOR THE YEAR
LOSS PER SHARE FOR LOSS ATTRIBUTABLE TO THE ORDINARYEQUITY HOLDERS OF THE COMPANY:
Corporate ExpensesFinance ExpensesOccupancy ExpensesInvestment Expenses
for the year ended 30 June 2013
OF PROFIT OR LOSS ANDCONSOLIDATED STATEMENT
TOTAL REVENUE
Other RevenueNet Gain on Financial Assets at Fair Value through Profit or Loss
OtherInterest RevenueDividend Revenue
Investment
REVENUE
OTHER COMPREHENSIVE INCOME
Income Tax Expense
LOSS BEFORE INCOME TAX
Administration Expenses
The accompanying notes form part of these financial statements
ANNUAL REPORT | 25
30 JUNE 2013 BENTLEY CAPITAL LIMITEDA.B.N. 87 008 108 218
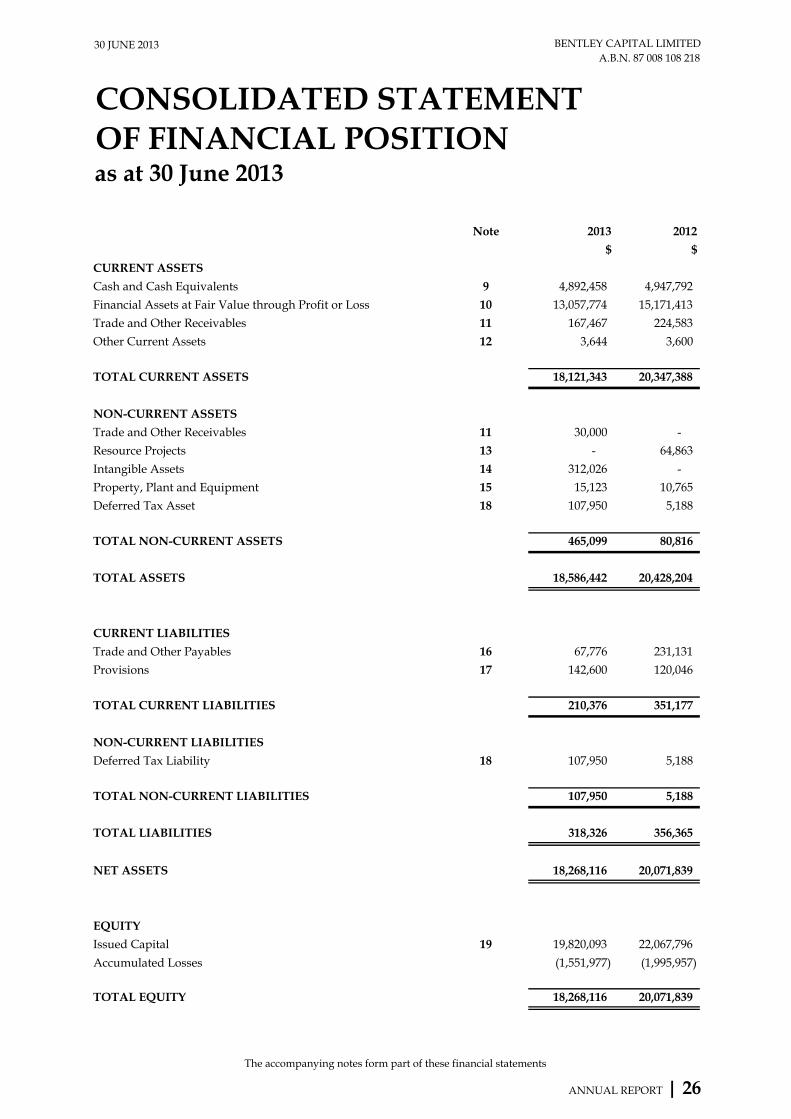
Note 2013 2012
$ $
9 4,892,458 4,947,792
10 13,057,774 15,171,413
11 167,467 224,583
12 3,644 3,600
18,121,343 20,347,388
11 30,000 -
13 - 64,863
14 312,026 -
15 15,123 10,765
18 107,950 5,188
465,099 80,816
18,586,442 20,428,204
16 67,776 231,131
17 142,600 120,046
210,376 351,177
18 107,950 5,188
107,950 5,188
318,326 356,365
18,268,116 20,071,839
19 19,820,093 22,067,796
(1,551,977) (1,995,957)
18,268,116 20,071,839
as at 30 June 2013OF FINANCIAL POSITIONCONSOLIDATED STATEMENT
CURRENT LIABILITIES
TOTAL ASSETS
Cash and Cash Equivalents
CURRENT ASSETS
TOTAL CURRENT ASSETS
Other Current Assets
Trade and Other Receivables
Financial Assets at Fair Value through Profit or Loss
Resource Projects
NON-CURRENT ASSETS
TOTAL CURRENT LIABILITIES
Provisions
Trade and Other Payables
TOTAL EQUITY
Accumulated Losses
Issued Capital
EQUITY
Intangible Assets
Trade and Other Receivables
NET ASSETS
TOTAL LIABILITIES
TOTAL NON-CURRENT LIABILITIES
Deferred Tax Liability
NON-CURRENT LIABILITIES
TOTAL NON-CURRENT ASSETS
Deferred Tax Asset
Property, Plant and Equipment
The accompanying notes form part of these financial statements
ANNUAL REPORT | 26

30 JUNE 2013 BENTLEY CAPITAL LIMITEDA.B.N. 87 008 108 218
Note
$ $ $
26,308,733 2,497,739 28,806,472
- (2,025,345) (2,025,345) - - - - (2,025,345) (2,025,345)
7 - (2,468,351) (2,468,351)
19 310,196 - 310,196
19 (4,406,350) - (4,406,350)
19 (144,783) - (144,783)
22,067,796 (1,995,957) 20,071,839
- - -
22,067,796 (1,995,957) 20,071,839
- (336,712) (336,712) - - - - (336,712) (336,712)
19 (780,692) 780,692 -
19 (1,467,011) - (1,467,011)
19,820,093 (1,551,977) 18,268,116
- -
represented by assets
Return of Capital
Reduction of Share Capital to the extent not
Total Comprehensive Loss for the Year
BALANCE AT 1 JULY 2012
for the year ended 30 June 2013OF CHANGES IN EQUITYCONSOLIDATED STATEMENT
BALANCE AT 30 JUNE 2012
Shares Issued under Dividend Reinvestment Plan
Dividends Paid
Total Comprehensive Loss for the YearOther Comprehensive IncomeLoss for the Year
BALANCE AT 1 JULY 2011
BALANCE AT 30 JUNE 2013
Return of Capital
Share Buy-Back
Other Comprehensive Income
Issued CapitalAccumulated
Losses Total
Transactions with Owners in their capacity as Owners:
Transactions with Owners in their capacity as Owners:
Loss for the Year
The accompanying notes form part of these financial statements
ANNUAL REPORT | 27
30 JUNE 2013 BENTLEY CAPITAL LIMITEDA.B.N. 87 008 108 218
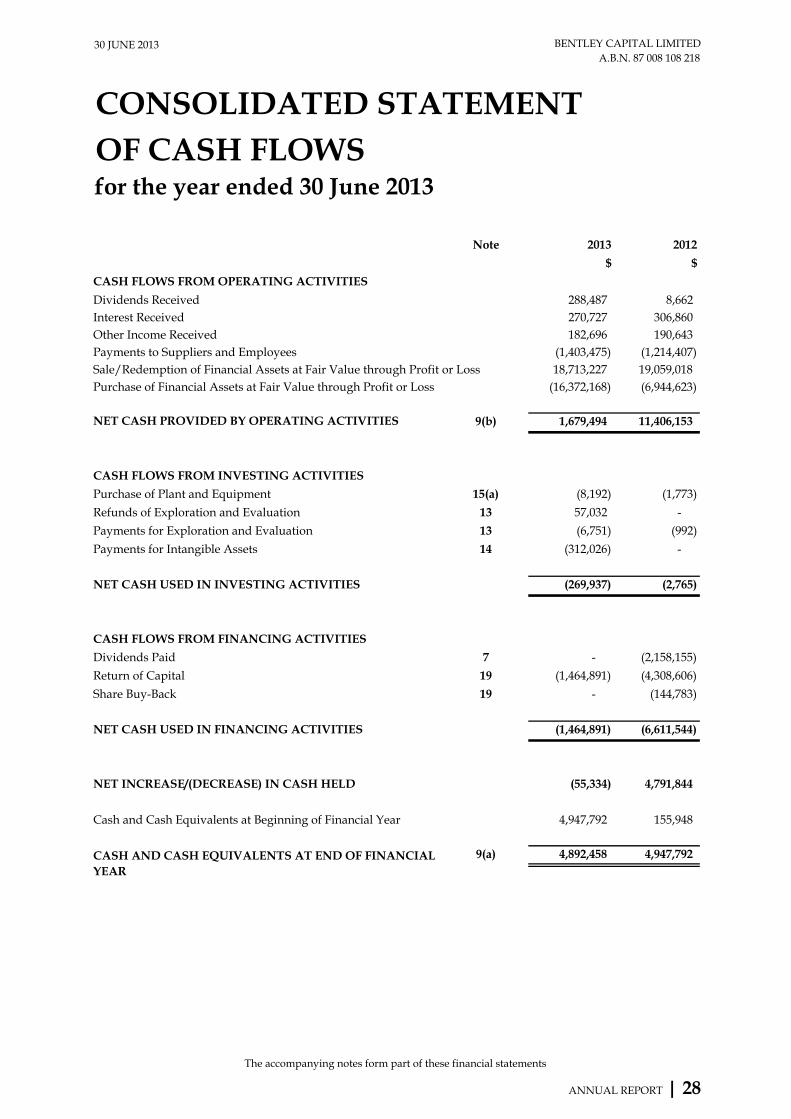
Note 2013 2012
$ $
288,487 8,662 270,727 306,860 182,696 190,643
(1,403,475) (1,214,407) 18,713,227 19,059,018
(16,372,168) (6,944,623)
9(b) 1,679,494 11,406,153
15(a) (8,192) (1,773)
13 57,032 -
13 (6,751) (992)
14 (312,026) -
(269,937) (2,765)
7 - (2,158,155)
19 (1,464,891) (4,308,606)
19 - (144,783)
(1,464,891) (6,611,544)
(55,334) 4,791,844
4,947,792 155,948
9(a) 4,892,458 4,947,792 CASH AND CASH EQUIVALENTS AT END OF FINANCIAL YEAR
Payments for Exploration and Evaluation
for the year ended 30 June 2013OF CASH FLOWSCONSOLIDATED STATEMENT
Interest ReceivedDividends Received
CASH FLOWS FROM OPERATING ACTIVITIES
NET CASH PROVIDED BY OPERATING ACTIVITIES
Payments to Suppliers and Employees
Cash and Cash Equivalents at Beginning of Financial Year
NET INCREASE/(DECREASE) IN CASH HELD
Sale/Redemption of Financial Assets at Fair Value through Profit or LossPurchase of Financial Assets at Fair Value through Profit or Loss
NET CASH USED IN INVESTING ACTIVITIES
Refunds of Exploration and Evaluation
Purchase of Plant and Equipment
CASH FLOWS FROM INVESTING ACTIVITIES
NET CASH USED IN FINANCING ACTIVITIES
Share Buy-Back
Dividends Paid
Return of Capital
CASH FLOWS FROM FINANCING ACTIVITIES
Payments for Intangible Assets
Other Income Received
The accompanying notes form part of these financial statements
ANNUAL REPORT | 28
30 JUNE 2013 BENTLEY CAPITAL LIMITED A.B.N. 87 008 108 218
NOTES TO THE CONSOLIDATED FINANCIAL STATEMENTS for the year ended 30 June 2013
ANNUAL REPORT | 29
1. SUMMARY OF ACCOUNTING POLICIES The principal accounting policies adopted in the preparation of these financial statements are set out below. These policies have been consistently applied to all the years presented, unless otherwise stated. The financial report includes the financial statements for the Consolidated Entity consisting of Bentley Capital Limited and its subsidiaries. Bentley Capital Limited (the Company) is a company limited by shares incorporated in Australia and whose shares are publicly traded on the Australian Securities Exchange (ASX). 1.1. Basis of Preparation
These general purpose financial statements have been prepared in accordance with Australian Accounting Standards, other authoritative pronouncements of the Australian Accounting Standards Board, Urgent Issues Group Interpretations and the Corporations Act 2001, appropriate for for-profit entities. Compliance with IFRS The consolidated financial statements of the Bentley Capital Limited Consolidated Entity also comply with International Financial Reporting Standards (IFRS) as issued by the International Accounting Standards Board (IASB). Reporting Basis and Conventions The financial report has been prepared on an accruals basis and is based on historical costs modified by the revaluation of financial assets and financial liabilities for which the fair value basis of accounting has been applied. 1.2. Principles of Consolidation
The consolidated financial statements incorporate the assets and liabilities of Bentley Capital Limited as at 30 June 2013 and the results of its subsidiaries for the year then ended. Bentley Capital Limited and its subsidiaries are referred to in this financial report as Bentley or the Consolidated Entity. Subsidiaries are all entities over which the Consolidated Entity has the power to govern the financial and operating policies, generally accompanying a shareholding of more than one-half of the voting rights. The existence and effect of potential voting rights that are currently exercisable or convertible are considered when assessing whether the Consolidated Entity controls another entity. Information on controlled entities is contained in Note 2(b) to the financial statements.
Subsidiaries are fully consolidated from the date on which control is transferred to the Consolidated Entity. They are de-consolidated from the date that control ceases. The acquisition method of accounting is used to account for business combinations by the Consolidated Entity. The controlled entities have a June financial year-end. All inter-company balances and transactions between entities in the Consolidated Entity, including any unrealised profits or losses, have been eliminated on consolidation.
1.3. Investments and Other Financial Assets Financial instruments are initially measured at cost on trade date, which includes transaction costs, when the related contractual rights or obligations exist. Subsequent to initial recognition, these instruments are measured as set out below. Financial Liabilities Non-derivative financial liabilities are recognised at amortised cost, comprising original debt less principal payments and amortisation. At each reporting date, the Consolidated Entity assesses whether there is objective evidence that a financial risk has been impaired. Impairment losses are recognised in the profit or loss. The Consolidated Entity’s investment portfolio (comprising listed and unlisted securities) is accounted for as “financial assets at fair value through profit and loss”. 1.4. Fair Value Estimation The fair value of financial assets and financial liabilities must be estimated for recognition and measurement or for disclosure purposes. The fair value of financial instruments traded in active markets (such as publicly traded derivatives, and trading and available-for-sale securities) is based on quoted market prices at the balance sheet date. The quoted market price used for financial assets held by the Consolidated Entity is the current bid price; the appropriate quoted market price for financial liabilities is the current ask price. The fair value of financial instruments that are not traded in an active market (for example over-the-counter derivatives) is determined using valuation techniques, including but not limited to recent arm’s length transactions, reference to similar instruments and option pricing models. The Consolidated Entity may use a variety of methods and makes assumptions

30 JUNE 2013 BENTLEY CAPITAL LIMITED A.B.N. 87 008 108 218
NOTES TO THE CONSOLIDATED FINANCIAL STATEMENTS for the year ended 30 June 2013
ANNUAL REPORT | 30
that are based on market conditions existing at each Balance Date. Other techniques, such as estimated discounted cash flows, are used to determine fair value for other financial instruments. The nominal value less estimated credit adjustments of trade receivables and payables are assumed to approximate their fair values. The fair value of financial liabilities for disclosure purposes is estimated by discounting the future contractual cash flows at the current market interest rate that is available to the Consolidated Entity for similar financial instruments. The Consolidated Entity’s investment portfolio (comprising listed and unlisted securities) is accounted for as a “financial assets at fair value through profit and loss” and is carried at fair value based on the quoted last bid prices at the reporting date (refer to Note 10). 1.5. Revenue Recognition Revenue is recognised to the extent that it is probable that the economic benefits will flow to the Consolidated Entity and the revenue can be reliably measured. All revenue is stated net of the amount of Goods and Services Tax (GST) except where the amount of GST incurred is not recoverable from the Australian Tax Office. The following specific recognition criteria must also be met before revenue is recognised: Sale of Goods and Disposal of Assets Revenue from the sale of goods and disposal of other assets is recognised when the Consolidated Entity has passed control of the goods or other assets to the buyer. Interest Revenue Interest revenue is recognised on a proportional basis taking into account the interest rates applicable to the financial assets. Dividend Revenue Dividend revenue is recognised when the right to receive a dividend has been established. The Consolidated Entity brings dividend revenue to account on the applicable ex-dividend entitlement date. Other Revenues Other revenues are recognised on a receipts basis. 1.6. Income Tax The income tax expense or revenue for the period is the tax payable on the current period’s taxable income based on the national income tax rate for each taxing jurisdiction adjusted by changes in deferred tax assets and liabilities attributable to temporary differences
between the tax bases of assets and liabilities and their carrying amounts in the financial statements, and to unused tax losses (if applicable). Deferred tax assets and liabilities are recognised for temporary differences at the tax rates expected to apply when the assets are recovered or liabilities are settled, based on those tax rates which are enacted or substantively enacted for each taxing jurisdiction. The relevant tax rates are applied to the cumulative amounts of deductible and taxable temporary differences to measure the deferred tax asset or liability. An exception is made for certain temporary differences arising from the initial recognition of an asset or a liability. No deferred tax asset or liability is recognised in relation to these temporary differences if they arose in a transaction, other than a business combination, that at the time of the transaction did not affect either accounting profit or taxable profit or loss. Deferred tax assets are recognised for deductible temporary differences and unused tax losses only if it is probable that future taxable amounts will be available to utilise those temporary differences and losses. The amount of deferred tax assets benefits brought to account or which may be realised in the future, is based on the assumption that no adverse change will occur in income taxation legislation and the anticipation that the Consolidated Entity will derive sufficient future assessable income to enable the benefit to be realised and comply with the conditions of deductibility imposed by the law. Deferred tax liabilities and assets are not recognised for temporary differences between the carrying amount and tax bases of investments in controlled entities where the Consolidated Entity is able to control the timing of the reversal of the temporary differences and it is probable that the differences will not reverse in the foreseeable future. Deferred tax assets and liabilities are offset when there is a legally enforceable right to offset current tax assets and liabilities and when the deferred tax balances relate to the same taxation authority. Current tax assets and tax liabilities are offset where the entity has a legally enforceable right to offset and intends either to settle on a net basis, or to realise the asset and settle the liability simultaneously. Current and deferred tax balances attributable to amounts recognised directly in equity are also recognised directly in equity. 1.7. Goods and Services Tax (GST) Revenues, expenses and assets are recognised net of the amount of GST, except where the amount of GST incurred is not recoverable from the Australian Tax Office. In these circumstances the GST is recognised as

30 JUNE 2013 BENTLEY CAPITAL LIMITED A.B.N. 87 008 108 218
NOTES TO THE CONSOLIDATED FINANCIAL STATEMENTS for the year ended 30 June 2013
ANNUAL REPORT | 31
part of the cost of acquisition of the asset or as part of an item of the expense. Receivables and payables in the balance sheet are shown inclusive of GST. Cash flows are presented in the Statement of Cash Flows on a gross basis, except for the GST component of investing and financing activities, which are disclosed as operating cash flows. 1.8. Receivables Trade receivables and other receivables are recorded at amounts due less any provision for doubtful debts. An estimate for doubtful debts is made when collection of the full amount is no longer probable. Bad debts are written off when considered non-recoverable. 1.9. Property, Plant and Equipment All items of property, plant and equipment are stated at historical cost less accumulated depreciation and impairment losses. Historical cost includes expenditure that is directly attributable to the acquisition of the items. The carrying amount of plant and equipment is reviewed annually by directors to ensure it is not in excess of the recoverable amount from these assets. The recoverable amount is assessed on the basis of the expected net cash flows that will be received from the asset’s employment and subsequent disposal. The expected net cash flows have been discounted to their present value in determining recoverable amount. Subsequent costs are included in the asset’s carrying amount or recognised as a separate asset, as appropriate, only when it is probable that future economic benefits associated with the item will flow to the Consolidated Entity and the cost of the item can be measured reliably. All other repairs and maintenance are charged to the Statement of Profit or Loss and Other Comprehensive Income during the financial period in which they are incurred. The depreciation rates used for each class of depreciable assets are: Class of Fixed Asset Rate MethodOffice Equipment 37.5% Diminishing ValueLeasehold Improvement s 7.5% Diminishing ValueOffice Furniture 10-15% Diminishing Value The assets’ residual values and useful lives are reviewed, and adjusted if appropriate, at each balance sheet date. An asset’s carrying amount is written down immediately to its recoverable amount if the asset’s carrying amount is greater than its estimated recoverable amount. Gains and losses on disposals are determined by comparing proceeds with carrying
amount. These are included in the Statement of Profit or Loss and Other Comprehensive Income. 1.10. Impairment of Assets At each reporting date, the Consolidated Entity reviews the carrying values of its tangible and intangible assets (where applicable) to determine whether there is any indication that those assets have been impaired. If such an indication exists, the recoverable amount of the asset, being the higher of the asset’s fair value less costs to sell and value in use, is compared to the asset’s carrying value. Any excess of the asset’s carrying value over its recoverable amount is expensed to the Statement of Profit or Loss and Other Comprehensive Income. Impairment testing is performed annually for goodwill and intangible assets (where applicable) with indefinite lives. Where it is not possible to estimate the recoverable amount of an individual asset, the Consolidated Entity estimates the recoverable amount of the cash-generating unit to which the asset belongs. 1.11. Payables These amounts represent liabilities for goods and services provided to the Consolidated Entity prior to the end of financial period which are unpaid. The amounts are unsecured and are usually paid within 30 days of recognition. 1.12. Issued Capital Ordinary shares are classified as equity. Incremental costs directly attributable to the issue of new securities are shown in equity as a deduction, net of tax, from the proceeds. Incremental costs directly attributable to the issue of new shares or options are shown in equity as a deduction, net of tax, from the proceeds. Incremental costs directly attributable to the issue of new shares or options for the acquisition of a business are not included in the cost of the acquisition as part of the purchase consideration 1.13. Earnings Per Share Basic Earnings per Share
Is determined by dividing the operating result after income tax by the weighted average number of ordinary shares on issue during the financial period.
30 JUNE 2013 BENTLEY CAPITAL LIMITED A.B.N. 87 008 108 218
NOTES TO THE CONSOLIDATED FINANCIAL STATEMENTS for the year ended 30 June 2013
ANNUAL REPORT | 32
Diluted Earnings per Share Adjusts the figures used in the determination of basic earnings per share by taking into account amounts unpaid on ordinary shares and any reduction in earnings per share that will probably arise from the exercise of options outstanding during the financial period. 1.14. Employee Benefits Short-term Obligations Provision is made for the Consolidated Entity’s liability for employee benefits arising from services rendered by employees to the Balance Date. Employee benefits that are expected to be settled within one year have been measured at the amounts expected to be paid when the liability is settled, plus related on-costs. Employee benefits payable later than one year from the Balance Date have been measured at the present value of the estimated future cash outflows to be made for those benefits. Employer superannuation contributions are made by the Consolidated Entity in accordance with statutory obligations and are charged as an expense when incurred. Other Long-term Employee Benefit Obligations The liability for long-service leave is recognised in the provision for employee benefits and measured as the present value of expected future payments to be made in respect of services provided by employees up to the Balance Date. Consideration is given to expected future wage and salary levels, experience of employee departures and periods of service. Performance Bonus The Consolidated Entity recognises a liability and an expense for cash bonuses payable to members of the Company’s Investment Committee pursuant to a Performance Bonus Scheme implemented on 1 May 2010. The performance of the Consolidated Entity is measured each financial half year (ending on 31 December and 30 June) by comparing the change over the half year in the net asset value of the Consolidated Entity with the change in the net assets of the Consolidated Entity that would have resulted if the investment return was equal to that recorded by the ASX All Ordinaries Index. 20% of any out-performance in excess of a performance threshold hurdle of $250,000 relative to the benchmark index is available for distribution to the Investment Committee each half year. In calculating over-performance, any under-performance against the ASX All Ordinaries Index in any half year is generally carried forward for the next two half years and set off against the Consolidated Entity’s performance.
1.15. Cash and Cash Equivalents Cash and cash equivalents includes cash on hand, deposits held at call with banks, other short-term highly liquid investments with original maturities of three months or less and bank overdrafts. Bank overdrafts (if any) are shown within short-term borrowings in current liabilities on the Statement of Financial Position. 1.16. Leases Leases in which a significant portion of the risks and rewards of ownership are not transferred to the Consolidated Entity as lessee are classified as operating leases. Payments made under operating leases (net of any incentives received from the lessor) are charged to the Statement of Profit or Loss and Other Comprehensive Income on a straight-line basis over the period of the lease. 1.17. Segment Reporting Operating segments are presented using the ‘management approach’, where the information presented is on the same basis as the internal reports provided to the Chief Operating Decision Makers (CODM). The CODM is responsible for the allocation of resources to operating segments and assessing their performance. 1.18. Dividends Policy
Provision is made for the amount of any dividend declared; being appropriately authorised and no longer at the discretion of the entity, on or before the end of the financial year but not distributed at the Balance Date. 1.19. Intangible Assets - Software Development
Expenditure during the research phase of a project is recognised as an expense when incurred. Development costs are capitalised only when:
(i) the technical feasibility and commercial viability of the project is demonstrated;
(ii) the Consolidated Entity has an intention and ability to complete the project and use or sell it; and
(iii) the costs can be measured reliably. Such costs include payments to external contractors to develop the software, any purchase of materials and equipment and personnel costs of employees directly involved in the project.
30 JUNE 2013 BENTLEY CAPITAL LIMITED A.B.N. 87 008 108 218
NOTES TO THE CONSOLIDATED FINANCIAL STATEMENTS for the year ended 30 June 2013
ANNUAL REPORT | 33
Capitalised software development expenditure is stated at cost less accumulated amortisation and impairment losses. Amortisation is based on a straight-line method over periods generally ranging from 1 to 4 years matched to the future economic benefits over the useful life of the project. The amortisation period and amortisation method of intangible assets other than goodwill are reviewed at least at each balance sheet date. No amortisation has taken place as the projects have not been completed as at the reporting date. 1.20. Mineral Exploration and Evaluation
Expenditure
Exploration, evaluation and development expenditure incurred is accumulated (i.e. capitalised) in respect of each identifiable area of interest. These costs are only carried forward to the extent that they are expected to be recouped through the successful development of the area or where activities in the area have not yet reached a stage that permits reasonable assessment of the existence or otherwise of economically recoverable reserves. Accumulated costs in relation to an abandoned area are written off in full against profit in the year in which the decision to abandon the area is made. Under AASB 6 “Exploration for and Evaluation of Mineral Resources”, if facts and circumstances suggest that the carrying amount of any recognised exploration and evaluation assets may be impaired, the Consolidated Entity must perform impairment tests on those assets and measure any impairment in accordance with AASB 136 “Impairment of Assets”. Any impairment loss is to be recognised as an expense. A regular review is undertaken of each area of interest to determine the appropriateness of continuing to carry forward costs in relation to that area of interest. 1.21. Comparative Figures Where required by Accounting Standards comparative figures have been adjusted to conform to changes in presentation for the current financial period. 1.22. Critical accounting judgements and estimates The preparation of the consolidated financial statements requires Directors to make judgements and estimates and form assumptions that affect how certain assets, liabilities, revenue, expenses and equity are reported. At each reporting period, the Directors evaluate their judgements and estimates based on historical experience and on other various factors they believe to be reasonable under the circumstances, the results of which form the basis of the carrying values of assets and liabilities (that are not readily apparent from
other sources, such as independent valuations). Actual results may differ from these estimates under different assumptions and conditions. Estimation of useful lives of assets The Consolidated Entity determines the estimated useful lives and related depreciation and amortisation charges for its property, plant and equipment. The useful lives could change significantly as a result of technical innovations, market, economic, legal environment or some other event. The depreciation and amortisation charge will increase where the useful lives are less than previously estimated lives, or technically obsolete or non-strategic assets that have been abandoned or sold will be written off or written down. Indefinite life of intangible assets The Consolidated Entity tests annually or more frequently, if events or changes in circumstances indicate impairment and whether the indefinite life of intangible assets has suffered any impairment, in accordance with note 1.10.
30 JUNE 2013 BENTLEY CAPITAL LIMITED A.B.N. 87 008 108 218
NOTES TO THE CONSOLIDATED FINANCIAL STATEMENTS for the year ended 30 June 2013
ANNUAL REPORT | 34
1.23. Summary of Accounting Standards Issued but not yet Effective (continued) The following new Accounting Standards and Interpretations (which have been released but not yet adopted) have no material impact on the Consolidated Entity’s financial statements or the associated notes therein.
AASB Reference
Title and Affected Standard(s) Nature of Change Application Date
AASB 9 (issued December 2009 and amended December 2010)
Financial Instruments Amends the requirements for classification and measurement of financial assets. The available-for-sale and held-to-maturity categories of financial assets in AASB 139 have been eliminated. Under AASB 9, there are three categories of financial assets:
Amortised cost
Fair value through profit or loss
Fair value through other comprehensive income.
The following requirements have generally been carried forward unchanged from AASB 139 Financial Instruments: Recognition and Measurement into AASB 9:
Classification and measurement of financial liabilities; and
Derecognition requirements for financial assets and liabilities.
However, AASB 9 requires that gains or losses on financial liabilities measured at fair value are recognised in profit or loss, except that the effects of changes in the liability’s credit risk are recognised in other comprehensive income.
Annual reporting periods beginning on or after 1 July 2015
IFRS (issued October 2012)
Investment Entities – Amendments to IFRS 10, IFRS 12 and IAS 27
The amendment defines an ‘investment entity’ and requires a parent that is an investment entity to measure its investments in particular subsidiaries at fair value through profit or loss in its consolidated and separate financial statements.
The amendment prescribes three criteria that must be met in order for an entity to be defined as an investment entity, as well as four ‘typical characteristics’ to consider in assessing the criteria.
The amendment also introduces disclosure requirements for investment entities into IFRS 12 Disclosure of Interests in Other Entities and amends IAS 27 Separate Financial Statements.
Annual reporting periods beginning on or after 1 July 2014

30 JUNE 2013 BENTLEY CAPITAL LIMITED A.B.N. 87 008 108 218
NOTES TO THE CONSOLIDATED FINANCIAL STATEMENTS for the year ended 30 June 2013
ANNUAL REPORT | 35
1.23. Summary of Accounting Standards Issued but not yet Effective (continued)
AASB Reference
Title and Affected Standard(s) Nature of Change Application Date
AASB 10 (issued August 2011)13
Consolidated Financial Statements
Introduces a single ‘control model’ for all entities, including special purpose entities (SPEs), whereby all of the following conditions must be present:
Power over investee (whether or not power used in practice)
Exposure, or rights, to variable returns from investee
Ability to use power over investee to affect the entity’s returns from investee.
Introduces the concept of ‘de facto’ control for entities with less than a 50% ownership interest in an entity, but which have a large shareholding compared to other shareholders. This could result in more instances of control and more entities being consolidated.
Potential voting rights are only considered when determining if there is control when they are substantive (holder has practical ability to exercise) and the rights are currently exercisable. This may result in possibly fewer instances of control.
Additional guidance included to determine when decision making authority over an entity has been delegated by a principal to an agent. Factors to consider include:
Scope of decision making authority
Rights held by other parties, e.g. kick-out rights
Remuneration and whether commensurate with services provided
Decision maker’s exposure to variability of returns from other interests held in the investee.
Annual reporting periods beginning on or after 1 July 2013
AASB 13 (issued September 2011)
Fair Value Measurement
Currently, fair value measurement requirements are included in several Accounting Standards. AASB 13 establishes a single framework for measuring fair value of financial and non-financial items recognised at fair value in the Statement of Financial Position or disclosed in the notes in the financial statements.
Additional disclosures required for items measured at fair value in the Statement of Financial Position, as well as items merely disclosed at fair value in the notes to the financial statements. Extensive additional disclosure requirements for items measured at fair value that are ‘level 3’ valuations in the fair value hierarchy that are not financial instruments, e.g. land and buildings, investment properties etc.
Annual reporting periods beginning on or after 1 July 2013
13 This standard only needs to be mentioned for general purpose financial statements and for special purpose financial statements which
currently state compliance with AASB 127
30 JUNE 2013 BENTLEY CAPITAL LIMITED A.B.N. 87 008 108 218
NOTES TO THE CONSOLIDATED FINANCIAL STATEMENTS for the year ended 30 June 2013
ANNUAL REPORT | 36
1.23. Summary of Accounting Standards Issued but not yet Effective (continued)
AASB Reference
Title and Affected Standard(s) Nature of Change Application Date
AASB 119 (reissued September 2011)
Employee Benefits Main changes include:
Elimination of the ‘corridor’ approach for deferring gains/losses for defined benefit plans
Actuarial gains/losses on remeasuring the defined benefit plan obligation/asset to be recognised in OCI rather than in profit or loss, and cannot be reclassified in subsequent periods
Subtle amendments to timing for recognition of liabilities for termination benefits
Employee benefits expected to be settled (as opposed to due to settle under current standard) wholly within 12 months after the end of the reporting period are short-term benefits, and therefore not discounted when calculating leave liabilities. Annual leave not expected to be used wholly within 12 months of end of reporting period will in future be discounted when calculating leave liability.
Annual reporting periods beginning on or after 1 July 2013
AASB 2012-5 (issued June 2012)
Amendments to Australian Accounting Standards arising from Annual Improvements 2009-2011 Cycle
Non-urgent but necessary changes to standards Annual reporting periods beginning on or after 1 July 2013
AASB 2012-9 (issued December 2012)
Amendment to AASB 1048 arising from the Withdrawal of Australian Interpretation 1039
Deletes Australian Interpretation 1039 Substantive Enactment of Major Tax Bills In Australia from the list of mandatory Australian Interpretations to be applied by entities preparing financial statements under the Corporations Act 2001 or other general purpose financial statements.
Annual reporting periods beginning on or after 1 July 2013
30 JUNE 2013 BENTLEY CAPITAL LIMITEDA.B.N. 87 008 108 218
2.
2013 2012
$ $
11,471,391 11,404,355 11,528,345 11,494,048 22,999,736 22,898,403
10,714,948 7,289,279 25,588 21,360
10,740,536 7,310,639
12,259,200 15,587,764
19,820,093 22,067,796 (7,560,893) (6,480,032) 12,259,200 15,587,764
(1,861,553) (546,848) - -
(1,861,553) (546,848)
(a)
2,796,716 1,606,526 1,100,000 5,000 3,896,716 1,611,526
4,219,050 9,459,181 150,000 150,000 137,504 111,963
4,506,554 9,721,144
(b)
11,486,243 11,485,843
Incorporated 2013 2012
Australia 100% 100%Australia 100% 100%Australia 100% - Australia 100% - Australia 100% - Australia 100% -
Units in unlisted FSP Equities Leaders FundUnlisted Investments at Fair ValueListed Investments at Fair Value
Financial Assets at Fair Value through Profit and Loss
Scarborough Resources Pty Ltd Scarborough Equities Pty Ltd
Investment in Controlled Entities
Details of percentage of Ordinary Shares held in Controlled Entities:
Shares in Controlled Entities - at cost
Investments in Wholly Owned Subsidiaries
Non Current Assets
Devisd Pty Limited (Incorporated 11 Jul 13)ShopBites Pty Limited (Incorporated 23 Jan 13)rdrct.it Pty Limited (Incorporated 27 Mar 13)
Bentley Portfolio No.1 Pty Ltd (Incorporated 26 Mar 13)
Ownership Interest
Term DepositsCash at Bank
Cash and Cash Equivalents
for the year ended 30 June 2013FINANCIAL STATEMENTSNOTES TO THE CONSOLIDATED
Loss for the Year
EQUITYAccumulated LossesIssued Capital
NET ASSETS
TOTAL COMPREHENSIVE LOSS FOR THE YEAROther Comprehensive Income
PARENT ENTITY INFORMATION
TOTAL LIABILITIESNon-Current LiabilitiesCurrent Liabilities
TOTAL ASSETSNon-Current AssetsCurrent Assets
The following information provided relates to the Company, Bentley Capital Limited, as at 30 June 2013. Theinformation presented below has been prepared using accounting policies outlined in Note 1.
Current Assets
ANNUAL REPORT | 37
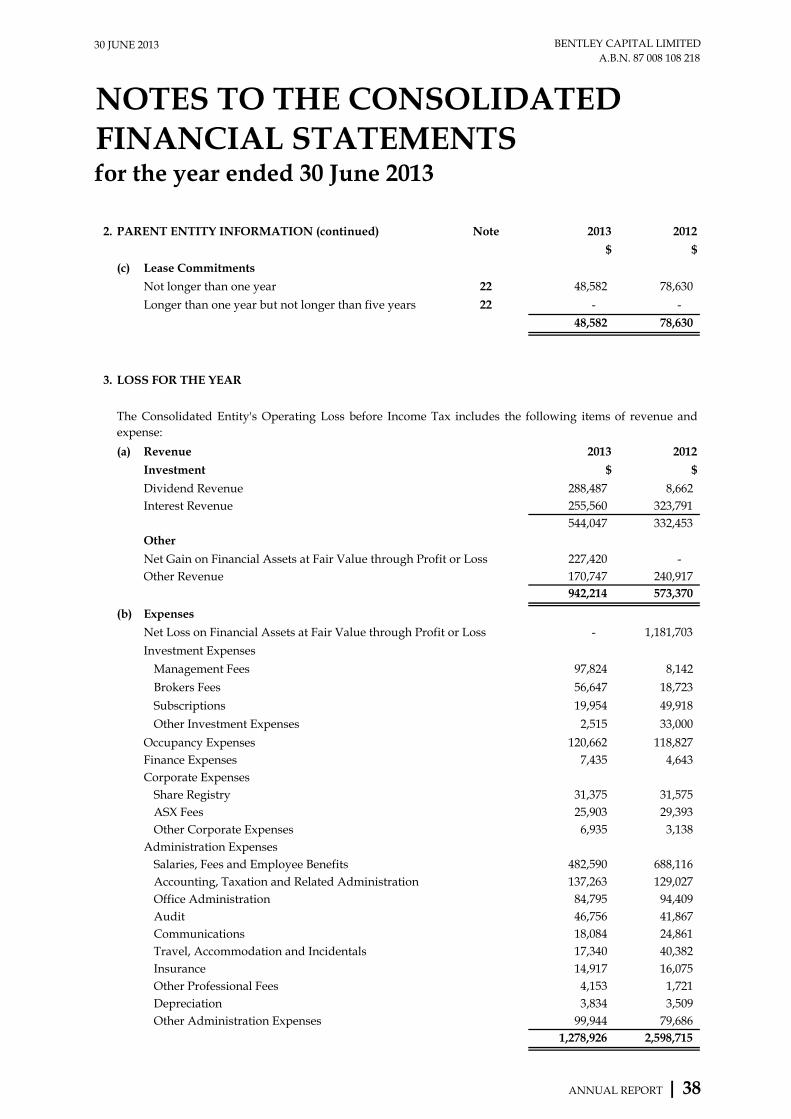
30 JUNE 2013 BENTLEY CAPITAL LIMITEDA.B.N. 87 008 108 218
for the year ended 30 June 2013FINANCIAL STATEMENTSNOTES TO THE CONSOLIDATED
2. Note 2013 2012
$ $
(c)
22 48,582 78,630
22 - -
48,582 78,630
3.
(a) 2013 2012
$ $
288,487 8,662 255,560 323,791 544,047 332,453
227,420 - 170,747 240,917 942,214 573,370
(b)
- 1,181,703
97,824 8,142
56,647 18,723
19,954 49,918
2,515 33,000
120,662 118,827 7,435 4,643
31,375 31,575 25,903 29,393
6,935 3,138
482,590 688,116 137,263 129,027
84,795 94,409 46,756 41,867 18,084 24,861 17,340 40,382 14,917 16,075
4,153 1,721 3,834 3,509
99,944 79,686 1,278,926 2,598,715
Management Fees
Salaries, Fees and Employee BenefitsAccounting, Taxation and Related AdministrationOffice Administration
Travel, Accommodation and Incidentals
Depreciation
InsuranceOther Professional Fees
Communications
Other Revenue
ASX Fees
Corporate Expenses
Subscriptions
Brokers Fees
Other Administration Expenses
LOSS FOR THE YEAR
Audit
PARENT ENTITY INFORMATION (continued)
Longer than one year but not longer than five years
Not longer than one year
Lease Commitments
The Consolidated Entity's Operating Loss before Income Tax includes the following items of revenue andexpense:
Dividend Revenue
Investment
Revenue
Interest Revenue
Other
Other Investment Expenses
Occupancy ExpensesFinance Expenses
Investment Expenses
Net Loss on Financial Assets at Fair Value through Profit or Loss
Expenses
Administration ExpensesOther Corporate Expenses
Share Registry
Net Gain on Financial Assets at Fair Value through Profit or Loss
ANNUAL REPORT | 38
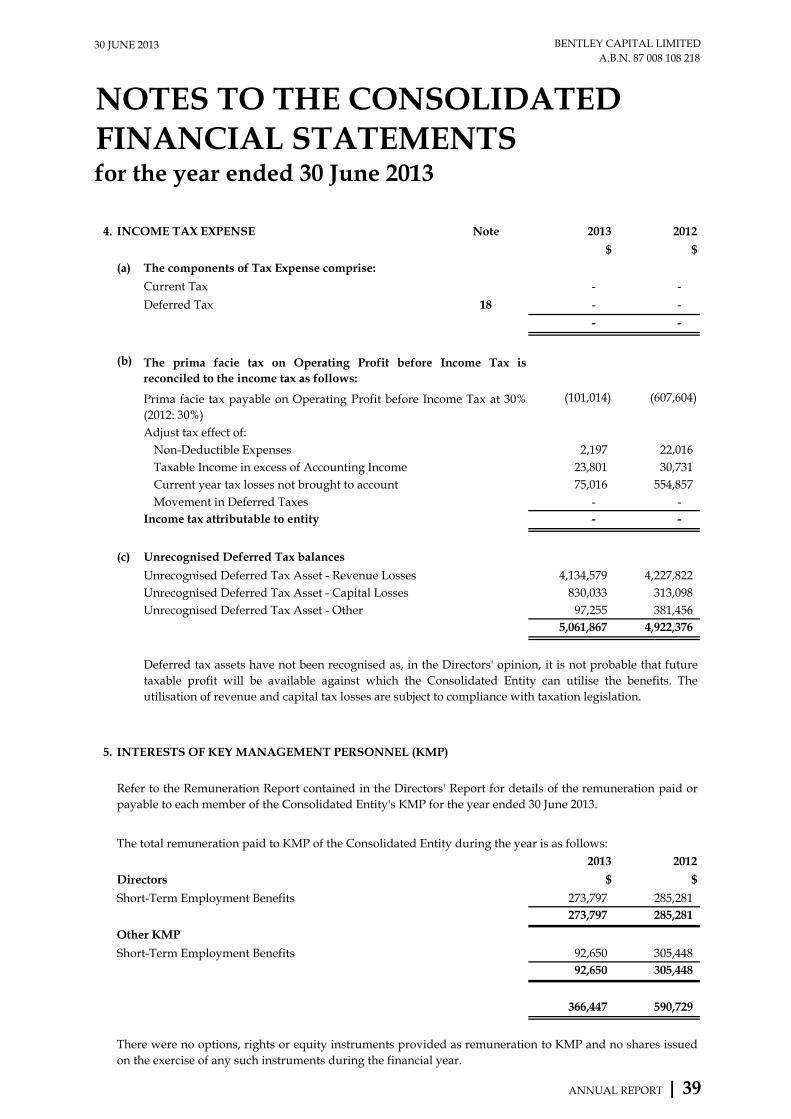
30 JUNE 2013 BENTLEY CAPITAL LIMITEDA.B.N. 87 008 108 218
for the year ended 30 June 2013FINANCIAL STATEMENTSNOTES TO THE CONSOLIDATED
4. Note 2013 2012
$ $
(a)
- -
18 - -
- -
(b)
(101,014) (607,604)
2,197 22,016 23,801 30,731 75,016 554,857
- - - -
(c)
4,134,579 4,227,822 830,033 313,098
97,255 381,456 5,061,867 4,922,376
5.
2013 2012
$ $
273,797 285,281 273,797 285,281
92,650 305,448 92,650 305,448
366,447 590,729
Short-Term Employment Benefits
Current Tax
Prima facie tax payable on Operating Profit before Income Tax at 30%(2012: 30%)
INCOME TAX EXPENSE
Unrecognised Deferred Tax Asset - OtherUnrecognised Deferred Tax Asset - Capital Losses
Income tax attributable to entity
Unrecognised Deferred Tax Asset - Revenue Losses
INTERESTS OF KEY MANAGEMENT PERSONNEL (KMP)
The total remuneration paid to KMP of the Consolidated Entity during the year is as follows:
Current year tax losses not brought to account
Deferred tax assets have not been recognised as, in the Directors' opinion, it is not probable that futuretaxable profit will be available against which the Consolidated Entity can utilise the benefits. Theutilisation of revenue and capital tax losses are subject to compliance with taxation legislation.
The prima facie tax on Operating Profit before Income Tax isreconciled to the income tax as follows:
Movement in Deferred Taxes
Taxable Income in excess of Accounting IncomeNon-Deductible Expenses
Adjust tax effect of:
Deferred Tax
The components of Tax Expense comprise:
Other KMP
Short-Term Employment Benefits
Unrecognised Deferred Tax balances
Refer to the Remuneration Report contained in the Directors' Report for details of the remuneration paid orpayable to each member of the Consolidated Entity's KMP for the year ended 30 June 2013.
There were no options, rights or equity instruments provided as remuneration to KMP and no shares issuedon the exercise of any such instruments during the financial year.
Directors
ANNUAL REPORT | 39

30 JUNE 2013 BENTLEY CAPITAL LIMITEDA.B.N. 87 008 108 218
for the year ended 30 June 2013FINANCIAL STATEMENTSNOTES TO THE CONSOLIDATED
5.
Balance at Start of Year
Balance at Appointment
/Cessation Net ChangeBalance at End
of Year
- - - - - - - - -
6,533 - 6,533
- - - - - - - - -
5,945 588 6,533 - -
2013 2012
$ $
- 7,425
Victor Ho (Company Secretary)
Other KMP
Ben Loiterton (CIO) (cease 7 Feb 2012)Victor Ho (Company Secretary)
Other KMP
Other KMP Transactions
INTERESTS OF KEY MANAGEMENT PERSONNEL (KMP) (continued)
30 June 2012
There were no transactions with KMP (or their personally related entities) during the financial year otherthan disclosed below.
The Company’s registered office in Sydney is located within the offices of Westchester Financial Services PtyLimited (trading as Westchester Corporate Finance) (Westchester), a corporate advisory company in whichNon-Executive Director, Christopher Ryan is the principal. This office was utilised in the 2012 financial yearby Sydney based members of the Investment Team and accordingly, Bentley agreed to contribute $825 permonth (inclusive of GST) towards Westchester’s lease and related office service costs.
Sydney office costs
Amounts recognised as expense
Christopher RyanWilliam JohnsonFarooq Khan
Directors
30 June 2013
KMP Shareholdings
The disclosures of equity holdings above are in accordance with the accounting standards which requiredisclosure of shares held directly, indirectly or beneficially by each key management person, a close memberof the family of that person, or an entity over which either of these persons have, directly or indirectly,control, joint control or significant influence (as defined under Accounting Standard AASB 124 Related PartyDisclosures).
Christopher RyanWilliam JohnsonFarooq Khan
Directors
ANNUAL REPORT | 40

30 JUNE 2013 BENTLEY CAPITAL LIMITEDA.B.N. 87 008 108 218
for the year ended 30 June 2013FINANCIAL STATEMENTSNOTES TO THE CONSOLIDATED
6.
2013 2012
$ $
39,586 37,962 7,170 3,905
46,756 41,867
7. 2013 2012
$ $
Paid On
23-Sep-11 - 2,468,351 - 2,468,351
- 2,158,155 - 310,196 - 2,468,351
1,845,290 1,796,278
(a)(b)
(c)
3.4 cents per share fully franked dividend
The franking credits attributable to the Consolidated Entity include franking credits that would be availableto the parent entity if distributable profits of subsidiaries were paid as dividends.
Dividends Paid
DIVIDENDS
AUDITORS' REMUNERATION
Taxation ServicesAudit and Review of Financial Statements
BDO Audit (WA) Pty Ltd
Paid in Cash
The above amounts represent the balance of the franking account as at the end of the reporting period,adjusted for:
Franking credits that will arise from the payment of the amount of the provision for income tax;Franking debits that will arise from the payment of dividends recognised as a liability at the reportingdate; and
Franking credits that will arise from the receipt of dividends recognised as receivables at the reportingdate.
Satisfied by Issue of Shares under DRP
Franking credits available for subsequent periods based on atax rate of 30% (2012: 30%)
During the year the following fees were paid for services provided by the auditor of the parent entity, itsrelated practices and non-related audit firms:
The Consolidated Entity may engage BDO on assignments additional to their statutory audit duties wheretheir expertise and experience with the Consolidated Entity are important. These assignments principallyrelate to taxation advice in relation to the tax notes to the financial statements.
Dividends paid in cash or satisfied by issue of shares underthe Dividend Reinvestment Plan (DRP) were as follows:
ANNUAL REPORT | 41
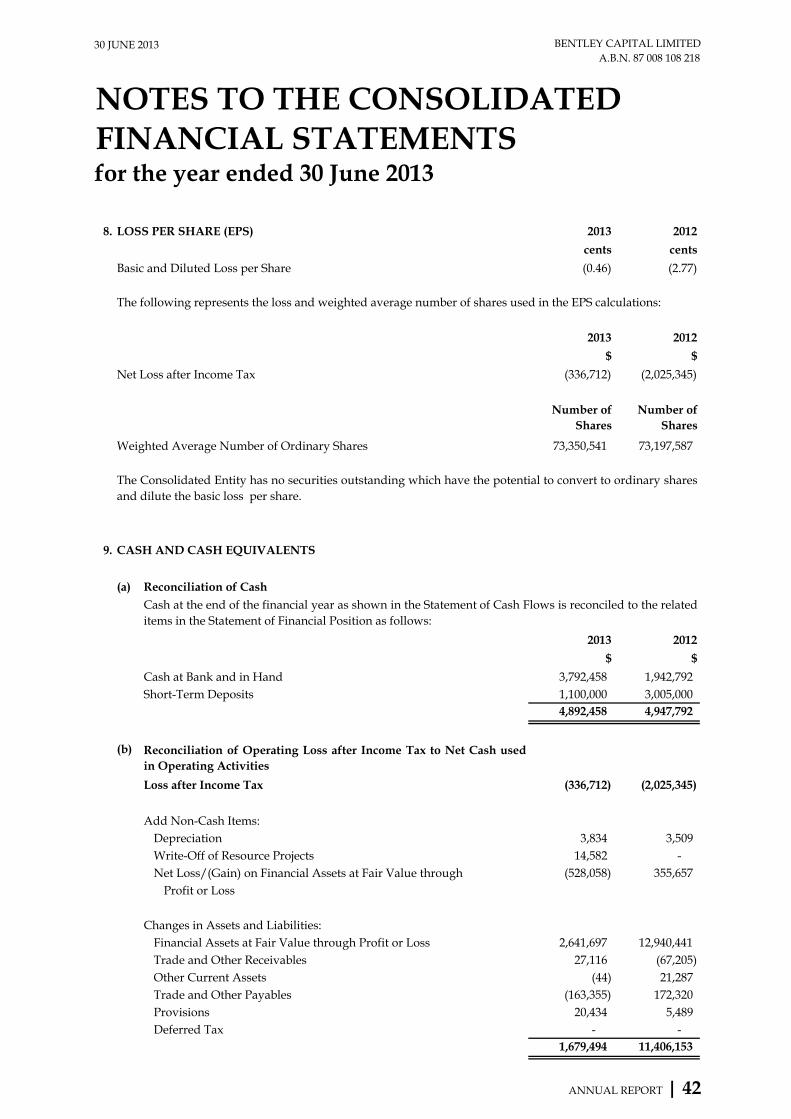
30 JUNE 2013 BENTLEY CAPITAL LIMITEDA.B.N. 87 008 108 218
for the year ended 30 June 2013FINANCIAL STATEMENTSNOTES TO THE CONSOLIDATED
8. 2013 2012
cents cents
(0.46) (2.77)
2013 2012
$ $
(336,712) (2,025,345)
Number of Shares
Number of Shares
73,350,541 73,197,587
9.
(a)
2013 2012
$ $
3,792,458 1,942,792 1,100,000 3,005,000 4,892,458 4,947,792
(b)
(336,712) (2,025,345)
3,834 3,509 14,582 -
(528,058) 355,657
2,641,697 12,940,441 27,116 (67,205)
(44) 21,287 (163,355) 172,320
20,434 5,489 - -
1,679,494 11,406,153
The following represents the loss and weighted average number of shares used in the EPS calculations:
LOSS PER SHARE (EPS)
Basic and Diluted Loss per Share
Write-Off of Resource ProjectsDepreciation
Trade and Other Payables
Net Loss/(Gain) on Financial Assets at Fair Value through
Short-Term Deposits
Reconciliation of Cash
Other Current Assets
Weighted Average Number of Ordinary Shares
Trade and Other Receivables
CASH AND CASH EQUIVALENTS
Deferred TaxProvisions
Cash at Bank and in Hand
Cash at the end of the financial year as shown in the Statement of Cash Flows is reconciled to the relateditems in the Statement of Financial Position as follows:
Changes in Assets and Liabilities:
Profit or Loss
Reconciliation of Operating Loss after Income Tax to Net Cash usedin Operating Activities
Add Non-Cash Items:
Loss after Income Tax
Financial Assets at Fair Value through Profit or Loss
Net Loss after Income Tax
The Consolidated Entity has no securities outstanding which have the potential to convert to ordinary sharesand dilute the basic loss per share.
ANNUAL REPORT | 42

30 JUNE 2013 BENTLEY CAPITAL LIMITEDA.B.N. 87 008 108 218
for the year ended 30 June 2013FINANCIAL STATEMENTSNOTES TO THE CONSOLIDATED
9.
(c)
10. 2013 2012
$ $
6,076,676 9,459,181 150,000 150,000
6,831,098 5,562,232 13,057,774 15,171,413
(a)
11.
485 485 1,764 16,931
160,256 208,515 4,962 (1,348)
167,467 224,583
30,000 - 30,000 -
(a)
(b)
12. OTHER CURRENT ASSETS 2013 2012
$ $
Prepayments 3,644 3,600
CASH AND CASH EQUIVALENTS (continued)
Risk Exposure
TRADE AND OTHER RECEIVABLES
Current
Income Distributions receivableInterest and Dividends receivableDeposits and Bonds
Non Current
Deposits and Bonds
The Consolidated Entity’s exposure to interest rate risk is discussed in Note 21. The maximum exposureto credit risk at the end of the reporting period is the carrying amount of each class of cash and cashequivalents mentioned above.
Risk Exposure
FINANCIAL ASSETS AT FAIR VALUE THROUGH PROFIT OR LOSS
Units in unlisted FSP Equities Leaders FundUnlisted Investments at Fair ValueListed Investments at Fair Value
Other receivables
None of the Consolidated Entity's receivables are impaired or past due.Impaired Trade Receivables
The Consolidated Entity’s exposure to credit and interest rate risks is discussed in Note 21. Risk Exposure
The Consolidated Entity’s exposure to price risk is discussed in Note 21.
Current
ANNUAL REPORT | 43

30 JUNE 2013 BENTLEY CAPITAL LIMITEDA.B.N. 87 008 108 218
for the year ended 30 June 2013FINANCIAL STATEMENTSNOTES TO THE CONSOLIDATED
13. RESOURCE PROJECTS 2013 2012
$ $
64,863 63,871 6,751 992
(57,032) - (14,582) -
- 64,863
14. 2013 2012
$ $
- - 312,026 - 312,026 -
15. 2013 2012
$ $
5,572 5,572 (3,645) (3,402) 1,927 2,170
764 764 (315) (279) 449 485
27,248 19,055 (14,501) (10,945) 12,747 8,110
15,123 10,765
Exploration and Evaluation Expenditure Written Off
INTANGIBLE ASSETS
Opening Balance
At CostAccumulated Depreciation
Office Equipment
Exploration and Evaluation Expenditure Refunded
Closing Balance
The software development costs relate to applications/software under development.
At Cost
Leasehold Improvements
Accumulated DepreciationAt Cost
Office Furniture
Opening Balance
Software Development Costs
PROPERTY, PLANT AND EQUIPMENT
Closing Balance
Exploration and Evaluation Expenditure Incurred
Accumulated Depreciation
The exploration and evaluation expenditure related to tenement application costs, a portion of which($57,032) was refunded in May 2013 after the applications were withdrawn.
ANNUAL REPORT | 44

30 JUNE 2013 BENTLEY CAPITAL LIMITEDA.B.N. 87 008 108 218
for the year ended 30 June 2013FINANCIAL STATEMENTSNOTES TO THE CONSOLIDATED
15.
(a)
$ $ $ $
2,442 525 9,534 12,501
- - 1,773 1,773 (272) (40) (3,197) (3,509)
2,170 485 8,110 10,765
2,170 485 8,110 10,765
- - 8,192 8,192 (243) (36) (3,555) (3,834)
1,927 449 12,747 15,123
16. 2013 2012
$ $
6,160 1,478 61,616 229,653 67,776 231,131
(a)
17. 2013 2012
$ $
19,851 1,052 22,885 21,250 99,864 97,744
142,600 120,046
PROPERTY, PLANT AND EQUIPMENT (continued)
TRADE AND OTHER PAYABLES
Return of Capital - refer (b)
Office Furniture
Additions
Employee Benefits - Annual Leave
Other Payables and Accrued Expenses
Employee Benefits - Long Service Leave
BALANCE AT 1 JULY 2012
Additions
BALANCE AT 1 JULY 2011
Office Equipment
PROVISIONS
BALANCE AT 30 JUNE 2012Depreciation expense
Movements in the carrying amounts for each class of property, plant and equipment between thebeginning and the end of the current financial year.
Movements in Carrying Amounts
The Consolidated Entity’s exposure to risks arising from current payables is set out in Note 21.Risk Exposure
BALANCE AT 30 JUNE 2013Depreciation expense
Leasehold Improvements
Current
Total
Trade Payables
Current
ANNUAL REPORT | 45

30 JUNE 2013 BENTLEY CAPITAL LIMITEDA.B.N. 87 008 108 218
for the year ended 30 June 2013FINANCIAL STATEMENTSNOTES TO THE CONSOLIDATED
17.
(a)
Return of Capital Total
$ $
97,744 97,744 1,467,011 1,467,011
(1,464,891) (1,464,891) 99,864 99,864
(b)
(c)
2013 2012
$ $
22,885 21,250
18. 2013 2012
$ $
12,821 5,188 95,129 -
107,950 5,188
107,312 - 638 5,188
107,950 5,188
DEFERRED TAX
The provision for annual leave and long service leave is presented as current since the ConsolidatedEntity does not have an unconditional right to defer settlement for any of these employee benefits. Longservice leave covers all unconditional entitlements where employees have completed the requiredperiod of service and also where employees are entitled to pro-rata payments in certain circumstances.
Deferred Tax Liabilities - Non-Current
Financial Assets
Amounts paid during the year
Movements in Provisions
Carrying Amount at Start of Year
Movements in each class of provision during the financial year, other than employee benefits, are setout below:
Charged/(Credited) to Equity
Deferred Tax Assets - Non-Current
Tax LossesEmployee Benefits
PROVISIONS (continued)
Return of Capital
Based on past experience, the employees have never taken the full amount of long service leave orrequire payment within the next 12 months. The following amounts reflect leave that is not expected tobe taken or paid within the next 12 months:
Leave obligations expected to be settled after 12 months
Amounts not expected to be settled within 12 months
The Company returned one cent per share to shareholders in November 2012 and April 2013 (at a totalcost of $733,505 and $733,506 respectively) pursuant to returns of capital approved by shareholders on16 November 2012 and 5 April 2013 respectively. The provision reflects the return of capital unclaimedby shareholders. The return of capital has no effect on the total number of shares on issue nor theholdings of each shareholder.
Other
Carrying Amount at End of Year
ANNUAL REPORT | 46
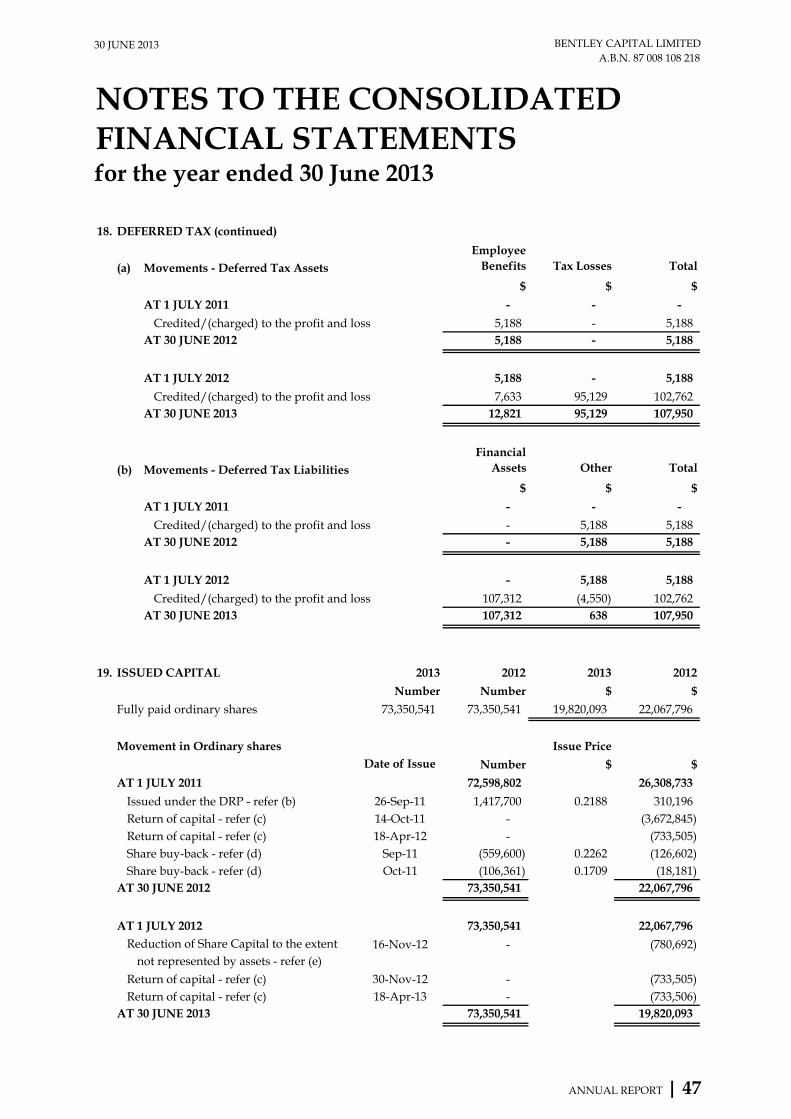
30 JUNE 2013 BENTLEY CAPITAL LIMITEDA.B.N. 87 008 108 218
for the year ended 30 June 2013FINANCIAL STATEMENTSNOTES TO THE CONSOLIDATED
18.
(a)Employee
Benefits Tax Losses Total
$ $ $
- - -
5,188 - 5,188 5,188 - 5,188
5,188 - 5,188
7,633 95,129 102,762 12,821 95,129 107,950
(b)Financial
Assets Other Total
$ $ $
- - -
- 5,188 5,188 - 5,188 5,188
- 5,188 5,188
107,312 (4,550) 102,762 107,312 638 107,950
19. 2013 2012 2013 2012
Number Number $ $
73,350,541 73,350,541 19,820,093 22,067,796
Issue Price
Number $ $
72,598,802 26,308,733
26-Sep-11 1,417,700 0.2188 310,196 14-Oct-11 - (3,672,845) 18-Apr-12 - (733,505)
Sep-11 (559,600) 0.2262 (126,602) Oct-11 (106,361) 0.1709 (18,181)
73,350,541 22,067,796
73,350,541 22,067,796
16-Nov-12 - (780,692)
30-Nov-12 - (733,505) 18-Apr-13 - (733,506)
73,350,541 19,820,093 AT 30 JUNE 2013
Share buy-back - refer (d)
Return of capital - refer (c)Return of capital - refer (c)
Reduction of Share Capital to the extentAT 1 JULY 2012
Movement in Ordinary shares
Fully paid ordinary shares
ISSUED CAPITAL
Date of Issue
AT 30 JUNE 2012
AT 1 JULY 2012
AT 30 JUNE 2013
AT 1 JULY 2012
not represented by assets - refer (e)
AT 30 JUNE 2012
AT 30 JUNE 2013
AT 30 JUNE 2012
AT 1 JULY 2011
Return of capital - refer (c)Share buy-back - refer (d)
Return of capital - refer (c)Issued under the DRP - refer (b)
AT 1 JULY 2011
Credited/(charged) to the profit and loss
Movements - Deferred Tax Liabilities
AT 1 JULY 2011
Movements - Deferred Tax Assets
Credited/(charged) to the profit and loss
Credited/(charged) to the profit and loss
DEFERRED TAX (continued)
Credited/(charged) to the profit and loss
ANNUAL REPORT | 47

30 JUNE 2013 BENTLEY CAPITAL LIMITEDA.B.N. 87 008 108 218
for the year ended 30 June 2013FINANCIAL STATEMENTSNOTES TO THE CONSOLIDATED
19.
(a)
(b)
(c)
(d)
(e) Reduction of Share Capital to the extent not represented by assets
(f)
During the 2012 financial year, the Company cancelled 665,961 shares bought back at a total cost of$144,783 (at an average cost (including brokerage) of $0.217). There were no share buy-back transactionsin the current financial year.
The Company's objectives when managing its capital are to safeguard its ability to continue as a goingconcern, so that they can continue to provide returns for shareholders and benefits for otherstakeholders and to maintain a capital structure balancing the interests of all shareholders.
Dividend Reinvestment Plan (DRP)
Return of Capital
Ordinary Shares
Share Buy-Back
The Consolidated Entity has no external borrowings. The Consolidated Entity's non-cash investmentscan be realised to meet accounts payable arising in the normal course of business.
The Board will consider capital management initiatives as is appropriate and in the best interests of theCompany and shareholders from time to time, including undertaking capital raisings, share buy-backs,capital reductions and the payment of dividends.
The Company has established a dividend reinvestment plan under which holders of ordinary sharesmay elect to have all or part of their dividend entitlements satisfied by the issue of new ordinary sharesrather than by being paid in cash. Shares issued under the plan during the previous financial year wereset at a 2.5% discount to the volume weighted average market price over five trading days up to andincluding the relevant dividend record date.
The Company returned one cent per share to shareholders twice, in November 2012 and April 2013, at atotal cost of $1.467 million as approved by shareholders on 16 November 2012 and 5 April 2013respectively (2012: five cents and one cent per share to shareholders in October 2011 and April 2012respectively (totalling $3.673 million and $0.733 million respectively) as approved by shareholders on 4October 2011 and 4 April 2012 respectively).
At the Annual General Meeting held on 16 November 2012, shareholders approved a reduction in valueof the Company's share capital against accumulated losses by $780,692, being an amount notrepresented by available assets, pursuant to section 258F of the Corporations Act. This was essentiallyan accounting entry that allowed the Company to remove from its books historical accumulatedaccounting losses that affects the ability of the Company to retain earnings from which future dividendsmay be paid. The reduction has no effect on the carried forward tax losses of the Company nor did itchange the number of shares on issue or the net asset position of the Company.
Fully paid ordinary shares carry one vote per share and the right to dividends.
The shares bought-back relates to an on-market share buy-back announced by the Company on 17August 2011. This buy-back expired on 31 August 2012 after 12 months.
Capital Risk Management
ISSUED CAPITAL (continued)
ANNUAL REPORT | 48

30 JUNE 2013 BENTLEY CAPITAL LIMITEDA.B.N. 87 008 108 218
for the year ended 30 June 2013FINANCIAL STATEMENTSNOTES TO THE CONSOLIDATED
20.
$ $ $ $ $
482,137 - - 61,909 544,046
392,789 - - 5,379 398,168 874,926 - - 67,288 942,214
176,940 - - - 176,940 - 2,637 - 4,798 7,435 - 188,503 15,429 701,910 905,842 - 675 - 3,159 3,834 - 33,580 230 151,065 184,875
697,986 (225,395) (15,659) (793,644) (336,712)
2,123,337 - - 2,769,121 4,892,458 13,057,774 - - - 13,057,774
- 312,026 - - 312,026 - 7,744 675 315,765 324,184
15,181,111 319,770 675 3,084,886 18,586,442
- (44,340) - (273,986) (318,326)
Depreciation ExpenseOther Expenses
Total Segment Profit/(Loss)
Intangible AssetsOther Assets
SEGMENT INFORMATION
The operating segments are reported in a manner consistent with the internal reporting provided to the"Chief Operating Decision Maker". The "Chief Operating Decision Maker", who is responsible for allocatingresources and assessing performance of the operating segments, has been identified as the Board ofDirectors.
Unallocated
2013Segment Revenues
Investment Expenses
Investment RevenueOther Revenue
The Board has considered the business and geographical perspectives of the operating results anddetermined that the Consolidated Entity operates only within Australia, with the main segments beingInvestments, Software Development and Resource Projects. Unallocated items are mainly comprised ofcorporate assets, office expenses and income tax assets and liabilities.
InvestmentsSoftware
DevelopmentResource
Projects Total
Adminstration Expenses
CashFinancial Assets
Segment Assets
Segment Liabilities
Total Segment Assets
Total Segment Revenues
Finance Expenses
ANNUAL REPORT | 49

30 JUNE 2013 BENTLEY CAPITAL LIMITEDA.B.N. 87 008 108 218
for the year ended 30 June 2013FINANCIAL STATEMENTSNOTES TO THE CONSOLIDATED
20.
$ $ $ $ $
192,996 - - - 192,996
239,872 - - 140,502 380,374 432,868 - - 140,502 573,370
1,291,684 - - - 1,291,684 - - - 4,643 4,643 - - - 1,115,946 1,115,946 - - - 3,509 3,509 - - 227 182,706 182,933
(858,816) - (227) (1,166,302) (2,025,345)
3,005,000 - - 1,942,792 4,947,792 15,171,413 - - - 15,171,413
- - 64,877 - 64,877 - - - 244,122 244,122
18,176,413 - 64,877 2,186,914 20,428,204
- - - (356,365) (356,365)
21.
The Consolidated Entity's financial instruments consist of deposits with banks, accounts receivable andpayable, investments in listed securities, investments in the unlisted FSP Equities Leaders Fund and otherunlisted securities. The principal activity of the Consolidated Entity is the management of its investments(Financial Assets at Fair Value through Profit and Loss) (refer to Note 10). The Consolidated Entity'sinvestments are subject to price (which includes interest rate and market risk), credit and liquidity risks.
The Board is responsible for the overall internal control framework (which includes risk management) but nocost-effective internal control system will preclude all errors and irregularities. The system is based, in part,on the appointment of suitably qualified management personnel. The effectiveness of the system iscontinually reviewed by management and at least annually by the Board.
The financial receivables and payables of the Consolidated Entity in the table below are due or payablewithin 30 days. The financial investments are held for trading and are realised at the discretion of theInvestment Committee.
Adminstration ExpensesDepreciation ExpenseOther Expenses
Total Segment Profit/(Loss)
Segment Assets
CashFinancial Assets
Unallocated
Intangible Assets
Total Segment Assets
Total
Investment ExpensesFinance Expenses
FINANCIAL RISK MANAGEMENT
Investment RevenueOther Revenue
Total Segment Revenues
Segment Liabilities
2012Segment Revenues
Other Assets
SEGMENT INFORMATION (continued)
InvestmentsSoftware
DevelopmentResource
Projects
ANNUAL REPORT | 50

30 JUNE 2013 BENTLEY CAPITAL LIMITEDA.B.N. 87 008 108 218
for the year ended 30 June 2013FINANCIAL STATEMENTSNOTES TO THE CONSOLIDATED
21.
2013 2012
Note $ $
9 4,892,458 4,947,792
10 13,057,774 15,171,413
11 167,467 224,583
18,117,699 20,343,788
16 (67,776) (231,131)
(67,776) (231,131)
18,049,923 20,112,657
(a)
(i)
Trade and Other Receivables
The Consolidated Entity is advised by investment manager, FSP Equities Management Limited,that the unlisted FSP Equities Leaders Fund comprises underlying investments in a diversifiedportfolio both in terms of number of securities held and exposure to a wide range of industrysectors.
Financial Assets at Fair Value through Profit or Loss
Financial Liabilities
Trade and Other Payables
Cash and Cash Equivalents
Financial Assets
The Consolidated Entity holds the following financial instruments:
Market Risk
Price RiskThe Consolidated Entity is exposed to equity securities price risk. This arises from investmentsheld by the Consolidated Entity and classified in the Statement of Financial Position at fair valuethrough profit or loss. The Consolidated Entity is exposed to commodity price risk in respect of itsinvestments indirectly via market risk and equity securities price risk.
The value of a financial instrument will fluctuate as a result of changes in market prices, whetherthose changes are caused by factors specific to the individual instrument, its issuer or factorsaffecting all instruments in the market. By its nature as an investment company, the ConsolidatedEntity will always be subject to market risk as it invests its capital in securities that are not risk free.This is reflected in the market price of these securities which can and will fluctuate. TheConsolidated Entity does not manage this risk through entering into derivative contracts, futures,options or swaps.
Equity price risk is minimised through ensuring that investment activities are undertaken inaccordance with Board established mandate limits and investment strategies.
The Consolidated Entity has performed a sensitivity analysis on its exposure to equity securitiesprice risk for listed and unlisted financial assets at fair value through profit or loss. The analysisdemonstrates the effect on the current year results and equity which could result from a change inthese risks. The All Ordinaries Accumulation Index was utilised as the benchmark for theinvestment portfolio.
FINANCIAL RISK MANAGEMENT (continued)
NET FINANCIAL ASSETS
ANNUAL REPORT | 51
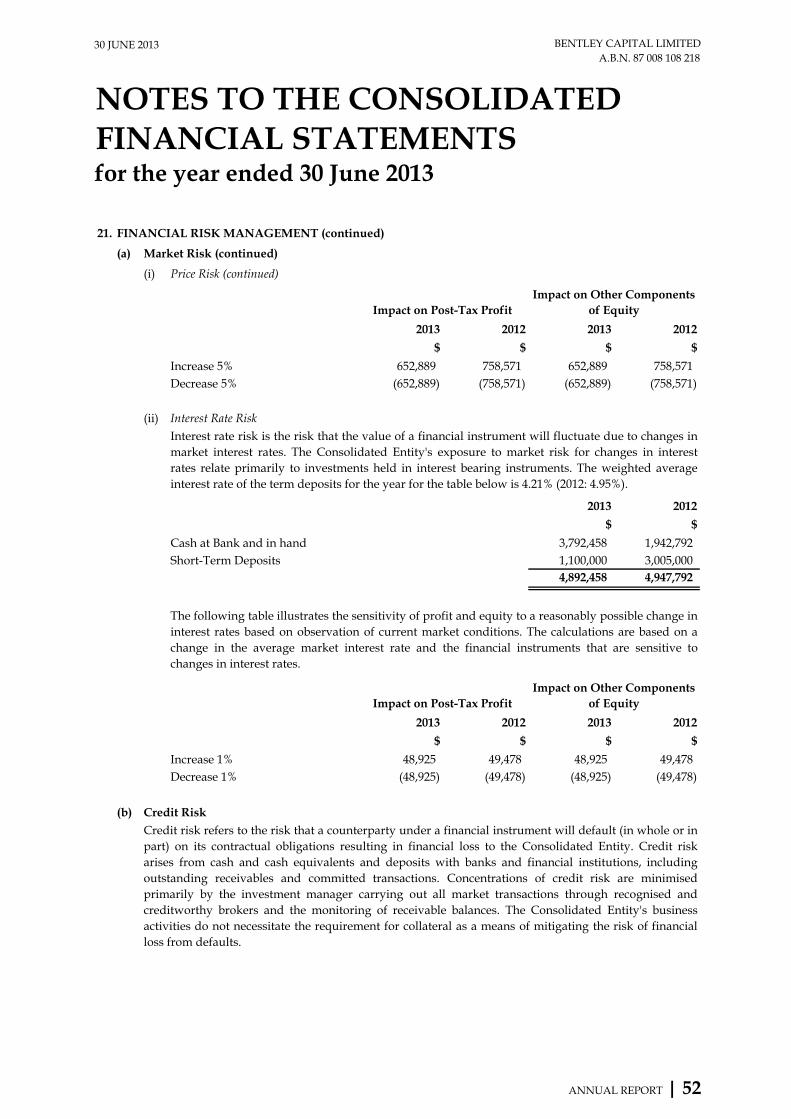
30 JUNE 2013 BENTLEY CAPITAL LIMITEDA.B.N. 87 008 108 218
for the year ended 30 June 2013FINANCIAL STATEMENTSNOTES TO THE CONSOLIDATED
21.
(a)
(i)
2013 2012 2013 2012
$ $ $ $
652,889 758,571 652,889 758,571 (652,889) (758,571) (652,889) (758,571)
(ii)
2013 2012
$ $
3,792,458 1,942,792 1,100,000 3,005,000 4,892,458 4,947,792
2013 2012 2013 2012
$ $ $ $
48,925 49,478 48,925 49,478 (48,925) (49,478) (48,925) (49,478)
(b)
Impact on Other Components of EquityImpact on Post-Tax Profit
The following table illustrates the sensitivity of profit and equity to a reasonably possible change ininterest rates based on observation of current market conditions. The calculations are based on achange in the average market interest rate and the financial instruments that are sensitive tochanges in interest rates.
Impact on Post-Tax Profit
Price Risk (continued)
Impact on Other Components of Equity
Credit risk refers to the risk that a counterparty under a financial instrument will default (in whole or inpart) on its contractual obligations resulting in financial loss to the Consolidated Entity. Credit riskarises from cash and cash equivalents and deposits with banks and financial institutions, includingoutstanding receivables and committed transactions. Concentrations of credit risk are minimisedprimarily by the investment manager carrying out all market transactions through recognised andcreditworthy brokers and the monitoring of receivable balances. The Consolidated Entity's businessactivities do not necessitate the requirement for collateral as a means of mitigating the risk of financialloss from defaults.
Credit Risk
Increase 1%
FINANCIAL RISK MANAGEMENT (continued)
Interest rate risk is the risk that the value of a financial instrument will fluctuate due to changes inmarket interest rates. The Consolidated Entity's exposure to market risk for changes in interestrates relate primarily to investments held in interest bearing instruments. The weighted averageinterest rate of the term deposits for the year for the table below is 4.21% (2012: 4.95%).
Cash at Bank and in handShort-Term Deposits
Decrease 1%
Decrease 5%
Market Risk (continued)
Interest Rate Risk
Increase 5%
ANNUAL REPORT | 52
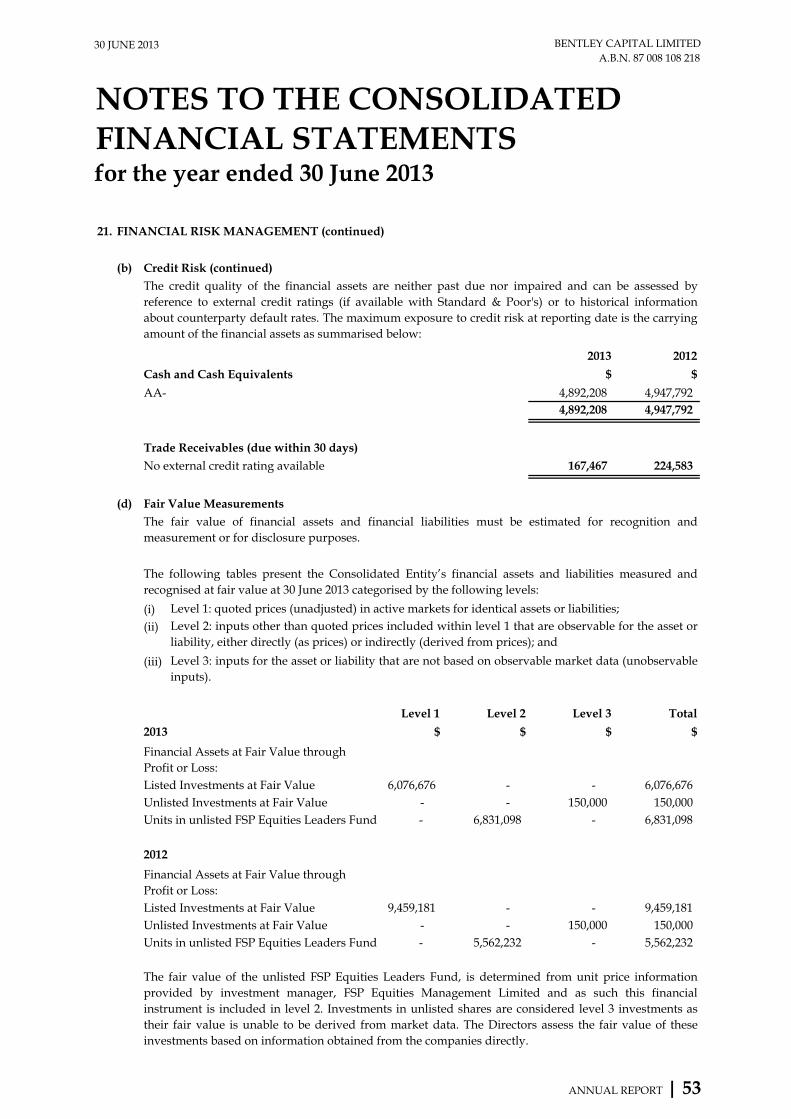
30 JUNE 2013 BENTLEY CAPITAL LIMITEDA.B.N. 87 008 108 218
for the year ended 30 June 2013FINANCIAL STATEMENTSNOTES TO THE CONSOLIDATED
21.
(b)
2013 2012
$ $
AA- 4,892,208 4,947,792 4,892,208 4,947,792
167,467 224,583
(d)
(i)(ii)
(iii)
Level 1 Level 2 Level 3 Total
$ $ $ $
6,076,676 - - 6,076,676 - - 150,000 150,000
6,831,098 - 6,831,098
9,459,181 - - 9,459,181 - - 150,000 150,000
5,562,232 - 5,562,232
Level 3: inputs for the asset or liability that are not based on observable market data (unobservableinputs).
FINANCIAL RISK MANAGEMENT (continued)
The fair value of the unlisted FSP Equities Leaders Fund, is determined from unit price informationprovided by investment manager, FSP Equities Management Limited and as such this financialinstrument is included in level 2. Investments in unlisted shares are considered level 3 investments astheir fair value is unable to be derived from market data. The Directors assess the fair value of theseinvestments based on information obtained from the companies directly.
The credit quality of the financial assets are neither past due nor impaired and can be assessed byreference to external credit ratings (if available with Standard & Poor's) or to historical informationabout counterparty default rates. The maximum exposure to credit risk at reporting date is the carryingamount of the financial assets as summarised below:
Cash and Cash Equivalents
Credit Risk (continued)
Trade Receivables (due within 30 days)
No external credit rating available
Level 2: inputs other than quoted prices included within level 1 that are observable for the asset orliability, either directly (as prices) or indirectly (derived from prices); and
Level 1: quoted prices (unadjusted) in active markets for identical assets or liabilities;
Listed Investments at Fair Value
2012
Financial Assets at Fair Value through Profit or Loss:
Units in unlisted FSP Equities Leaders Fund -
Units in unlisted FSP Equities Leaders Fund -
Fair Value MeasurementsThe fair value of financial assets and financial liabilities must be estimated for recognition andmeasurement or for disclosure purposes.
Unlisted Investments at Fair ValueListed Investments at Fair Value
2013
The following tables present the Consolidated Entity’s financial assets and liabilities measured andrecognised at fair value at 30 June 2013 categorised by the following levels:
Unlisted Investments at Fair Value
Financial Assets at Fair Value through Profit or Loss:
ANNUAL REPORT | 53

30 JUNE 2013 BENTLEY CAPITAL LIMITEDA.B.N. 87 008 108 218
for the year ended 30 June 2013FINANCIAL STATEMENTSNOTES TO THE CONSOLIDATED
21.
(d)
22. 2013 2012
$ $
48,582 157,261 - -
48,582 157,261
23.
24.
(a)(i)(ii)
(b)
The Consolidated Entity does not have any contingent assets or liabilities.
CONTINGENCIES
COMMITMENTS
FINANCIAL RISK MANAGEMENT (continued)
Not longer than one yearLonger than one year but not longer than five years
EVENTS OCCURRING AFTER THE REPORTING PERIOD
Liquidity risk is the risk that the Consolidated Entity will encounter difficulty in meeting obligationsassociated with financial liabilities. The Consolidated Entity has no borrowings. The ConsolidatedEntity's non-cash investments can be realised to meet trade and other payables arising in the normalcourse of business. The financial liabilities disclosed in the above table have a maturity obligation of notmore than 30 days.
Liquidity Risk
The non-cancellable operating lease commitment is the Consolidated Entity's share of the office premises atSuite 1, 346 Barker Road, Subiaco, Western Australia, and includes all outgoings (exclusive of GST). The leaseis for a one year term expiring 30 June 2014.
On 30 August 2013, the Company announced its intention to seek shareholder approval to undertake aone cent per share return of capital (Return of Capital). The Return of Capital is to be effected by theCompany seeking shareholder approval for a reduction in the share capital of the Company byreturning one cent per share to shareholders - this equates to an aggregate reduction of share capital byapproximately $0.733 million based upon the Company’s 73,350,541 shares currently on issue. Noshares will be cancelled as a result of the Return of Capital. Accordingly, the number of shares held byeach shareholder will not change as a consequence of the Return of Capital. The Return of Capital willhave no effect on the number of shares on issue. The Return of Capital is subject to shareholderapproval, which will be sought at the upcoming 2013 Annual General Meeting scheduled for lateNovember 2013. Meeting documentation advising details of the meeting together with relevantexplanatory materials will be despatched to shareholders and sent to the ASX in due course. Themeeting documentation will include details of the record date for determining eligibility to participatein the Return of Capital and the expected payment date, assuming the requisite resolution is passed byshareholders. If all conditions are met, including shareholder approval, the Directors aim to haveReturn of Capital paid in early December 2013.
Subsequent to balance date and to 23 August 2013, the Consolidated Entity
Invested a further $3.321 million in listed securities.Realised $3.132 million from the sale of listed securities; and
ANNUAL REPORT | 54

30 JUNE 2013 BENTLEY CAPITAL LIMITEDA.B.N. 87 008 108 218
for the year ended 30 June 2013FINANCIAL STATEMENTSNOTES TO THE CONSOLIDATED
24.
No other matter or circumstance has arisen since the end of the financial year that significantly affected, ormay significantly affect, the operations of the Consolidated Entity, the results of those operations, or the stateof affairs of the Consolidated Entity in future financial years.
EVENTS OCCURRING AFTER THE REPORTING PERIOD (continued)
ANNUAL REPORT | 55

30 JUNE 2013 BENTLEY CAPITAL LIMITED A.B.N. 87 008 108 218
DIRECTORS’ DECLARATION
ANNUAL REPORT | 56
The Directors of the Company declare that: 1. The financial statements, comprising the Statement of Profit or Loss and Other Comprehensive
Income, Statement of Financial Position, Statement of Cash Flows, Statement of Changes in Equity, and accompanying notes as set out on pages 25 to 55 are in accordance with the Corporations Act 2001 and:
(a) comply with Accounting Standards, the Corporations Regulations 2001 and other mandatory professional reporting; and
(b) give a true and fair view of the Company’s and Consolidated Entity’s financial position as at 30 June 2013 and of their performance for the year ended on that date;
2. In the Directors’ opinion there are reasonable grounds to believe that the Company will be able to
pay its debts as and when they become due and payable;
3. The Remuneration Report disclosures set out (within the Directors’ Report) on pages 18 to 21 (as the audited Remuneration Report) comply with section 300A of the Corporations Act 2001;
4. The Directors have been given the declarations required by section 295A of the Corporations Act 2001 by the Executive Chairman (the person who, in the opinion of the Directors, performs the Chief Executive Officer function) and Company Secretary (the person who, in the opinion of the Directors, performs the Chief Financial Officer function); and
5. The Company has included in the notes to the Financial Statements an explicit and unreserved statement of compliance with the International Financial Reporting Standards.
This declaration is made in accordance with a resolution of the Directors made pursuant to section 295(5) of the Corporations Act 2001.
Farooq Khan Christopher Ryan Chairman Director 30 August 2013
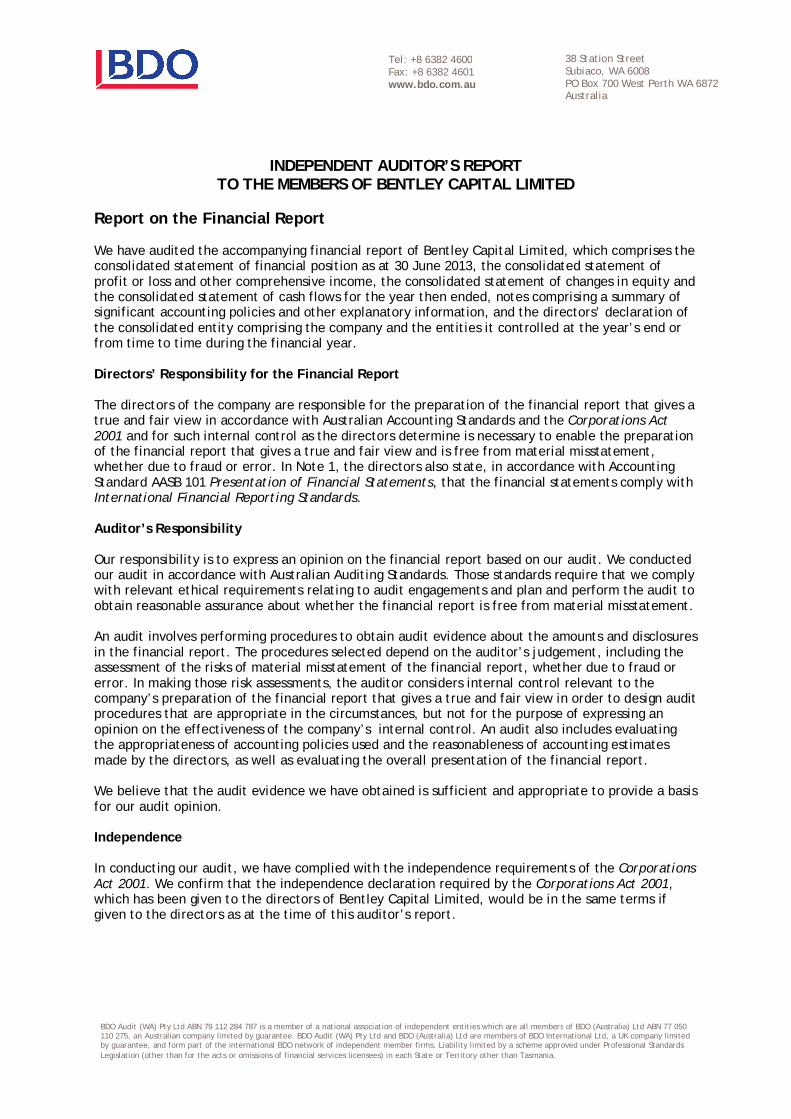
38 Station StreetSubiaco, WA 6008PO Box 700 West Perth WA 6872Australia
Tel: +8 6382 4600Fax: +8 6382 4601www.bdo.com.au
BDO Audit (WA) Pty Ltd ABN 79 112 284 787 is a member of a national association of independent entities which are all members of BDO (Australia) Ltd ABN 77 050110 275, an Australian company limited by guarantee. BDO Audit (WA) Pty Ltd and BDO (Australia) Ltd are members of BDO International Ltd, a UK company limitedby guarantee, and form part of the international BDO network of independent member firms. Liability limited by a scheme approved under Professional StandardsLegislation (other than for the acts or omissions of financial services licensees) in each State or Territory other than Tasmania.
INDEPENDENT AUDITOR’S REPORTTO THE MEMBERS OF BENTLEY CAPITAL LIMITED
Report on the Financial Report
We have audited the accompanying financial report of Bentley Capital Limited, which comprises theconsolidated statement of financial position as at 30 June 2013, the consolidated statement ofprofit or loss and other comprehensive income, the consolidated statement of changes in equity andthe consolidated statement of cash flows for the year then ended, notes comprising a summary ofsignificant accounting policies and other explanatory information, and the directors’ declaration ofthe consolidated entity comprising the company and the entities it controlled at the year’s end orfrom time to time during the financial year.
Directors’ Responsibility for the Financial Report
The directors of the company are responsible for the preparation of the financial report that gives atrue and fair view in accordance with Australian Accounting Standards and the Corporations Act2001 and for such internal control as the directors determine is necessary to enable the preparationof the financial report that gives a true and fair view and is free from material misstatement,whether due to fraud or error. In Note 1, the directors also state, in accordance with AccountingStandard AASB 101 Presentation of Financial Statements, that the financial statements comply withInternational Financial Reporting Standards.
Auditor’s Responsibility
Our responsibility is to express an opinion on the financial report based on our audit. We conductedour audit in accordance with Australian Auditing Standards. Those standards require that we complywith relevant ethical requirements relating to audit engagements and plan and perform the audit toobtain reasonable assurance about whether the financial report is free from material misstatement.
An audit involves performing procedures to obtain audit evidence about the amounts and disclosuresin the financial report. The procedures selected depend on the auditor’s judgement, including theassessment of the risks of material misstatement of the financial report, whether due to fraud orerror. In making those risk assessments, the auditor considers internal control relevant to thecompany’s preparation of the financial report that gives a true and fair view in order to design auditprocedures that are appropriate in the circumstances, but not for the purpose of expressing anopinion on the effectiveness of the company’s internal control. An audit also includes evaluatingthe appropriateness of accounting policies used and the reasonableness of accounting estimatesmade by the directors, as well as evaluating the overall presentation of the financial report.
We believe that the audit evidence we have obtained is sufficient and appropriate to provide a basisfor our audit opinion.
Independence
In conducting our audit, we have complied with the independence requirements of the CorporationsAct 2001. We confirm that the independence declaration required by the Corporations Act 2001,which has been given to the directors of Bentley Capital Limited, would be in the same terms ifgiven to the directors as at the time of this auditor’s report.
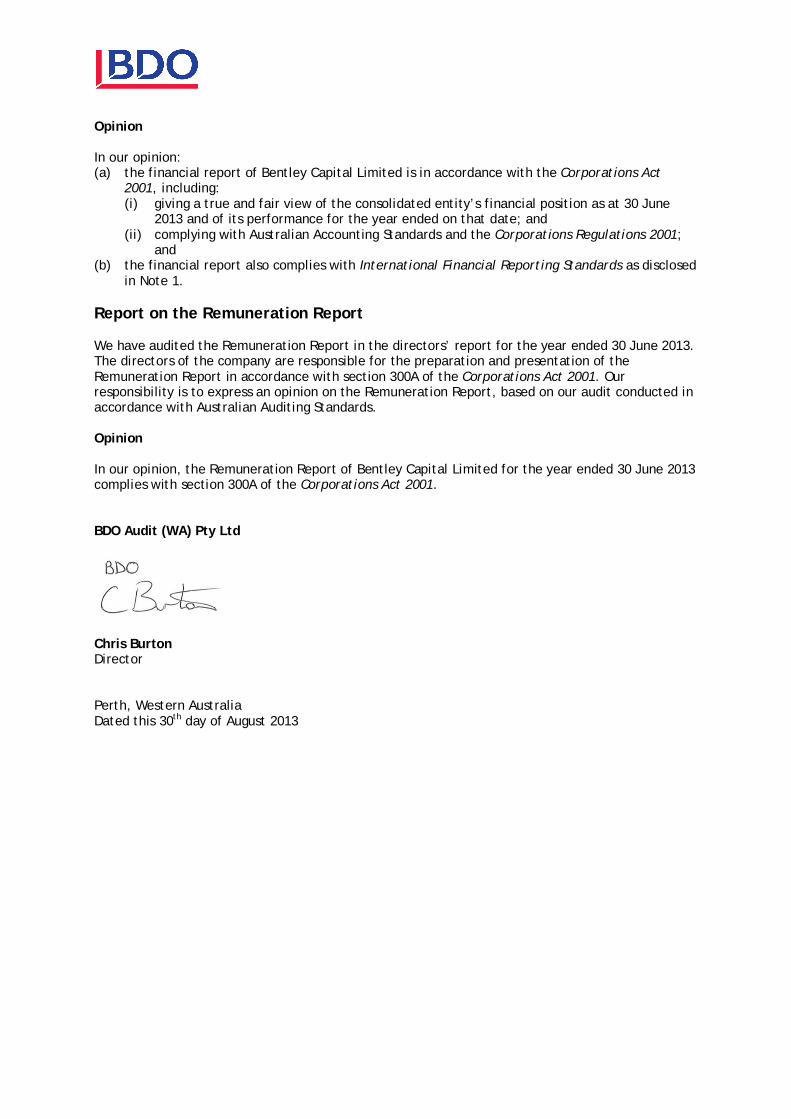
Opinion
In our opinion:(a) the financial report of Bentley Capital Limited is in accordance with the Corporations Act
2001, including:(i) giving a true and fair view of the consolidated entity’s financial position as at 30 June
2013 and of its performance for the year ended on that date; and(ii) complying with Australian Accounting Standards and the Corporations Regulations 2001;
and(b) the financial report also complies with International Financial Reporting Standards as disclosed
in Note 1.
Report on the Remuneration Report
We have audited the Remuneration Report in the directors’ report for the year ended 30 June 2013.The directors of the company are responsible for the preparation and presentation of theRemuneration Report in accordance with section 300A of the Corporations Act 2001. Ourresponsibility is to express an opinion on the Remuneration Report, based on our audit conducted inaccordance with Australian Auditing Standards.
Opinion
In our opinion, the Remuneration Report of Bentley Capital Limited for the year ended 30 June 2013complies with section 300A of the Corporations Act 2001.
BDO Audit (WA) Pty Ltd
Chris BurtonDirector
Perth, Western AustraliaDated this 30th day of August 2013

30 JUNE 2
CO
Comp The extent Recommen
Principle
Principle 1
Companies
1.1 Comsenio
1.2 Com
1.3 Com1.
The followreport:
an ex
whetperio
A statemendelegated athe compan
Principle 2
Companies
2.1 A ma
2.2 The c
2.3 The r
2.4 The b
2.5 Compcomm
2.6 Com2.
The followreport:
the sin off
the nthe c
the eboardrelati
a staindep
2013
RPOR
pliance t to which the Cndations (with 20
: Lay solid foun
s should establish
mpanies should eor executives and
mpanies should di
mpanies should p
wing material sh
xplanation of any
ther a performaod and whether i
nt of matters resauthority to seniony’s website in a
2: Structure the b
s should have a b
ajority of the boa
chair should be a
roles of chair and
board should est
panies should dmittees and indiv
mpanies should p
wing material sho
skills, experiencefice at the date o
names of the direcompany’s mater
existence of any d considers a dionships.
atement as to whpendent professi
RATE
with CoCompany has fo
010 Amendments
dations for man
h and disclose th
establish the fund disclose those f
isclose the proce
rovide the inform
hould be include
y departure from
nce evaluation fit was in accorda
served for the boor executives sho clearly marked c
board to add valu
board of an effect
ard should be ind
an independent d
d chief executive
ablish a nominat
disclose the procvidual directors.
rovide the inform
ould be included
e and expertise ref the annual repo
ectors consideredriality thresholds
of the relationsdirector to be i
hether there is aional advice at th
E GO
orporateollowed the ASXs) is as follows:
nagement and ov
he respective role
nctions reservedfunctions.
ss for evaluating
mation indicated
ed in the corpor
m Recommendati
for senior execuance with the pro
oard or the boarould be made pucorporate govern
ue
tive composition
dependent directo
director.
officer should no
tion committee.
cess for evaluat
mation indicated
d in the corpora
elevant to the poort.
d by the board ts.
ships listed in Bindependent, no
a procedure agrhe expense of the
OVER
e GoverSX Corporate Go
versight
es and responsibi
d to the board a
g the performanc
d in the Guide to
rate governance
ion 1.1, 1.2 or 1.3
utives has taken ocess disclosed.
rd charter or theublicly available,nance section.
n, size and comm
ors.
ot be exercised b
ting the perform
d in the Guide to
ate governance s
osition of directo
to constitute ind
Box 2.1 and an eotwithstanding
reed by the boare company.
RNAN
rnance Covernance Coun
ilities of board an
and those delega
ce of senior execu
Reporting on Pr
e section of the
.
place in the rep
e statement of a ideally by posti
mitment to adequa
by the same indiv
mance of the boa
Reporting on Pr
tatement in the
or held by each d
ependent directo
explanation of wthe existence of
rd for directors
BENT
NCE
AN
Council’ncil’s Corporate
Comp
nd management
ated to Yes
utives. Yes
rinciple
annual
porting
areas of ng it to
Yes
ately discharge it
No
No
vidual. Not
applic
Note:
Execu
have a
Manag
Yes
ard, its Yes
rinciple
annual
director
ors and
why the f these
to take
Yes
(as applic
TLEY CAPITALA.B.N. 87 0
NNUAL REPO
’s PrinciGovernance Pri
pliance CGS/ Com
2, 3.2
4.2
3.12
CGS
Annu
Web
ts responsibilitie
3.6
3.2, 3
cable
3.2, 4
the Company ha
utive Chairman b
a Chief Executive
aging Director
4.2
RemComChar
3.12
cable)
CGS
Annu
Web
L LIMITED 008 108 218
ORT | 59
iples inciples and
S References mments
2, 3.5, 4.1,
ual Reports
bsite
es and duties
3.6
4.1
as an
but does not
e Officer or
muneration mmittee
rter
ual Reports
bsite
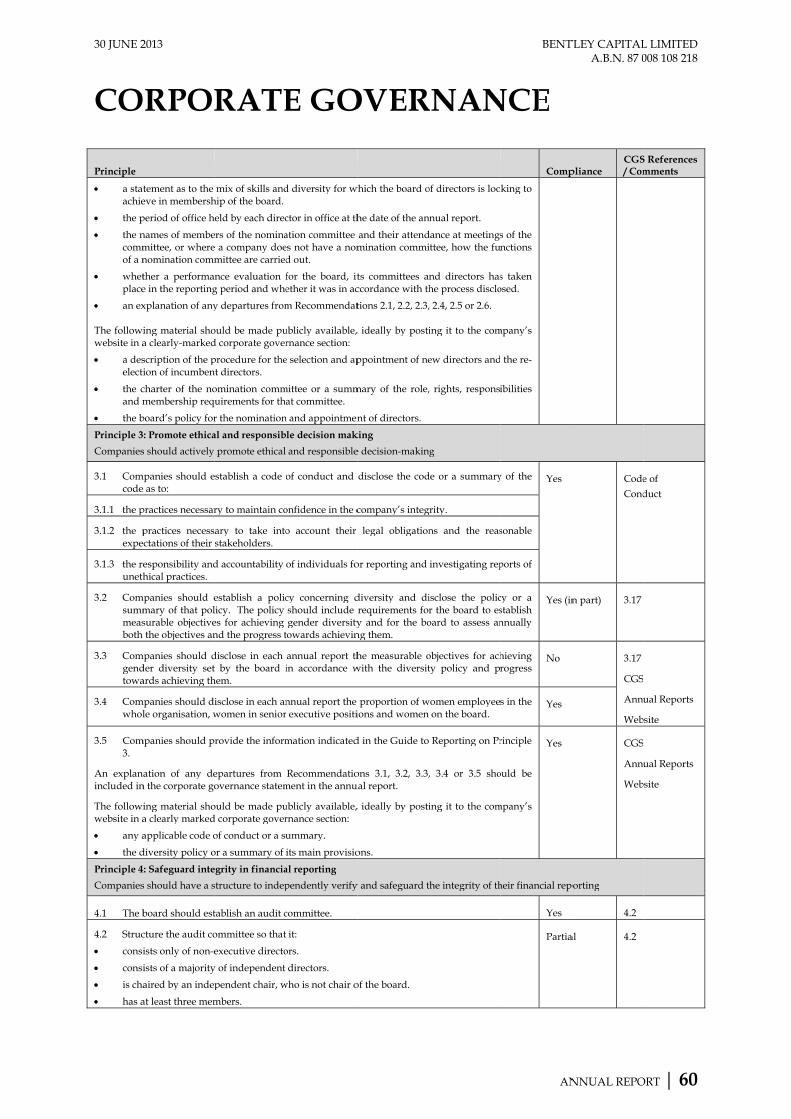
30 JUNE 2
CO
Principle
a statachie
the p
the ncommof a n
whetplace
an ex The followiwebsite in a
a deselecti
the cand m
the b
Principle 3
Companies
3.1 Comcode
3.1.1 the p
3.1.2 the pexpe
3.1.3 the reuneth
3.2 Comsummmeasboth
3.3 Comgendtowa
3.4 Comwhol
3.5 Com3.
An explanincluded in
The followiwebsite in a
any a
the d
Principle 4
Companies
4.1 The b
4.2 Struc
consi
consi
is cha
has a
2013
RPOR
tement as to the eve in membersh
period of office h
names of membemittee, or wherenomination comm
ther a performae in the reporting
xplanation of any
ing material shoa clearly-marked
scription of the pion of incumben
charter of the nomembership req
board’s policy for
3: Promote ethica
s should actively
mpanies should ee as to:
practices necessar
practices necessectations of their
esponsibility andhical practices.
mpanies should emary of that polsurable objective the objectives an
mpanies should dder diversity setards achieving th
mpanies should dle organisation, w
mpanies should p
nation of any den the corporate go
ing material shoa clearly marked
applicable code o
diversity policy o
4: Safeguard inte
s should have a s
board should est
cture the audit co
ists only of non-e
ists of a majority
aired by an indep
at least three mem
RATE
mix of skills andhip of the board.
eld by each direc
ers of the nominae a company doemittee are carried
nce evaluation fg period and whe
y departures from
ould be made pud corporate gover
procedure for thent directors.
omination commuirements for th
r the nomination
al and responsib
promote ethical
establish a code
ry to maintain co
ary to take intostakeholders.
d accountability
establish a policlicy. The policy es for achieving nd the progress t
disclose in each t by the board ihem.
isclose in each anwomen in senior
rovide the inform
epartures from overnance statem
ould be made pud corporate gover
of conduct or a su
or a summary of
egrity in financia
structure to indep
tablish an audit c
ommittee so that
executive directo
y of independent
pendent chair, w
mbers.
E GO
d diversity for wh
ctor in office at th
ation committee es not have a nomd out.
for the board, itether it was in ac
m Recommendat
ublicly available, rnance section:
e selection and ap
mittee or a summat committee.
n and appointmen
le decision mak
and responsible
of conduct and
onfidence in the c
o account their
of individuals fo
cy concerning d should include rgender diversity
towards achievin
annual report thin accordance w
nnual report the r executive positi
mation indicated
Recommendatioment in the annu
ublicly available, rnance section:
ummary.
its main provisio
al reporting
pendently verify
committee.
it:
ors.
directors.
who is not chair o
OVER
which the board o
he date of the an
and their attendmination commi
ts committees accordance with th
tions 2.1, 2.2, 2.3,
, ideally by posti
ppointment of ne
mary of the role,
nt of directors.
king
e decision-makin
disclose the cod
company’s integ
legal obligation
or reporting and
diversity and direquirements fory and for the bong them.
he measurable owith the diversit
proportion of wions and women
d in the Guide to
ons 3.1, 3.2, 3.3,ual report.
, ideally by posti
ons.
y and safeguard t
of the board.
RNAN
of directors is loo
nnual report.
dance at meetingsittee, how the fu
nd directors hashe process disclo
, 2.4, 2.5 or 2.6.
ing it to the com
ew directors and
, rights, respons
g
de or a summary
grity.
ns and the reas
investigating rep
isclose the policr the board to esoard to assess an
objectives for achty policy and p
women employee on the board.
Reporting on Pr
, 3.4 or 3.5 sho
ing it to the com
the integrity of th
BENT
NCE
AN
Comp
king to
s of the nctions
s taken osed.
mpany’s
the re-
ibilities
y of the Yes
sonable
ports of
cy or a stablish nnually
Yes (in
hieving rogress
No
s in the Yes
rinciple
ould be
mpany’s
Yes
heir financial rep
Yes
Partia
TLEY CAPITALA.B.N. 87 0
NNUAL REPO
pliance CGS/ Com
Code
Cond
n part) 3.17
3.17
CGS
Annu
Web
CGS
Annu
Web
porting
4.2
al 4.2
L LIMITED 008 108 218
ORT | 60
S References mments
e of
duct
ual Reports
bsite
ual Reports
bsite

30 JUNE 2
CO
4.3 The aud
4.4 Compa The followreport:
the naat methe fu
the nu
explan The followiwebsite in a
the au
informthe ro
Principle 5
Companies
5.1 ComListinfor th
5.2 Comp5.
An explanacorporate g The policiedisclosure company's
Principle 6
Companies
6.1 Compcommand d
6.2 Com
An explanacorporate g
The compaposting thesection.
Principle 7
Companies
7.1 Comrisks
7.2 The binterwhetmanamate
2013
RPOR
dit committee sh
anies should prov
wing material sho
ames and qualifieetings of the comunctions of an aud
umber of meeting
nation of any dep
ing material shoa clearly marked
udit committee ch
mation on procedotation of externa
5: Make timely an
s should promote
mpanies should ng Rule disclosuhat compliance a
panies should pr
ation of any depgovernance statem
es or a summarrequirements sh
web site in a clea
6: Respect the rig
s should respect t
panies should dmunication withdisclose their pol
mpanies should pr
ation of any depgovernance statem
any should descre information o
7: Recognise and
s should establish
mpanies should es and disclose a s
board should rernal control systether those risksagement has rep
erial business risk
RATE
hould have a form
vide the informa
ould be included
ications of those mmittee or, whedit committee ar
gs of the audit co
partures from Re
ould be made pud corporate gover
harter.
dures for the seleal audit engagem
nd balanced dis
e timely and bala
establish writteure requirementsand disclose thos
rovide the inform
partures from Rment in the annu
ry of those polichould be madearly marked corp
ghts of sharehold
the rights of shar
design and disclh shareholders anlicy or a summar
rovide the inform
partures from Rment in the annu
ribe how it will cn the company’
manage risk
h a sound system
establish policiesummary of those
quire managemeem to manage ths are being maported to it as toks.
E GO
mal charter.
tion indicated in
d in the corpora
appointed to theere a company de carried out.
ommittee and the
ecommendations
ublicly available, rnance section:
ection and appoiment partners.
closure
anced disclosure
n policies desig and to ensure ae policies or a su
mation indicated
Recommendationual report.
cies designed toe publicly availaporate governanc
ders
reholders and fac
lose a communind encouraging ry of that policy.
mation indicated
Recommendationual report.
communicate wi’s website in a
m of risk oversigh
s for oversight ae policies.
ent to design andhe company's maanaged effectiveo the effectivenes
OVER
n the Guide to Re
ate governance s
e audit committedoes not have an
e names of the at
s 4.1, 4.2, 4.3 or 4
, ideally by posti
intment of the ex
of all material m
gned to ensure accountability at ummary of those
d in the Guide to
ns 5.1 or 5.2 sho
o guide compliaable, ideally byce section.
cilitate the effect
ications policy f their participati
d in Guide to Rep
ns 6.1 or 6.2 sho
ith its shareholdclearly marked
ht and managem
and managemen
d implement theaterial business rely. The boardss of the compan
RNAN
eporting on Princ
tatement in the
ee and their atten audit committe
ttendees.
.4.
ing it to the com
xternal auditor, a
matters concernin
compliance wita senior executiv policies.
Reporting on Pr
uld be included
ance with Listiny posting them
ive exercise of th
for promoting efon at general m
porting on Princip
uld be included
ders publicly, ide corporate gove
ment and internal
nt of material b
e risk managemerisks and report d should disclosny's managemen
BENT
NCE
AN
Yes
ciple 4.
annual
ndance ee, how
mpany’s
and for
Yes
(as applic
ng the company
th ASX ve level
Yes
rinciple
d in the
ng Rule to the
Yes
hose rights
ffective meetings
Yes
ple 6.
d in the
eally by ernance
Yes
control
usiness Yes
ent and to it on se that nt of its
Yes
TLEY CAPITALA.B.N. 87 0
NNUAL REPO
Aud
Com
Char
Web
cable)
CGS
Annu
Web
8.2
CGS
Annu
Web
8.1
CGS
Annu
Web
7.1
7.1
L LIMITED 008 108 218
ORT | 61
it
mmittee
rter
bsite
ual Reports
bsite
ual Reports
bsite
ual Reports
bsite
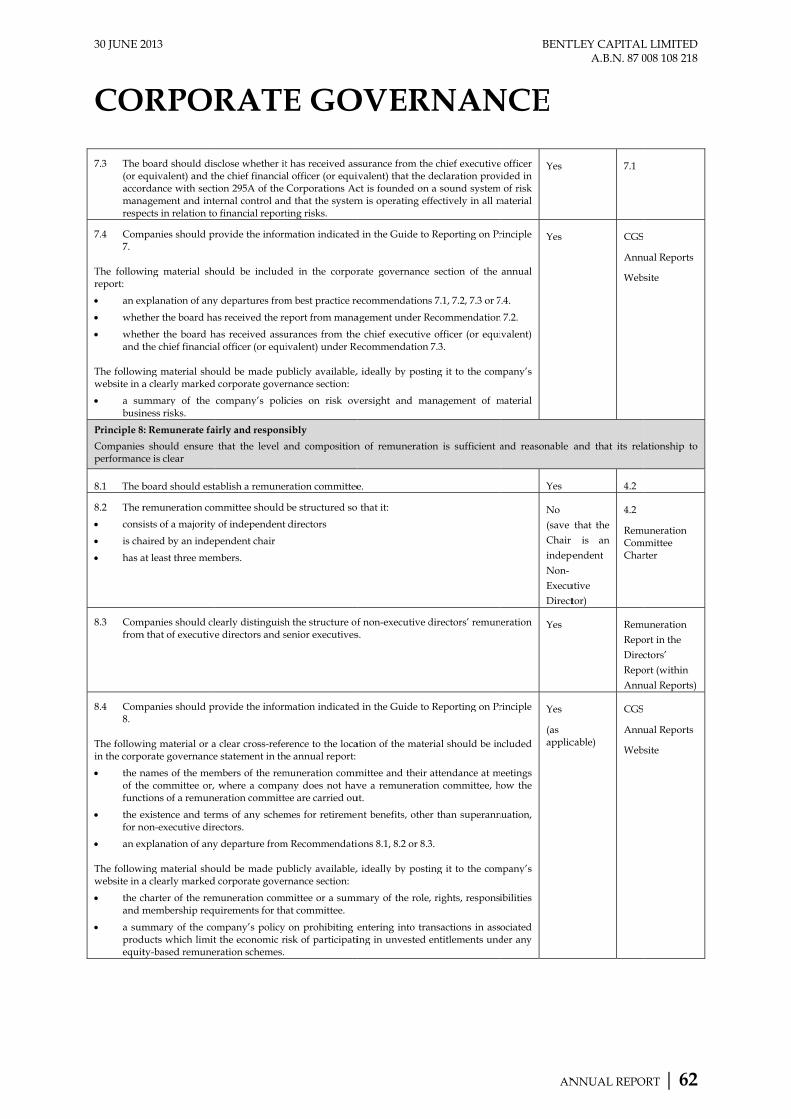
30 JUNE 2
CO
7.3 The b(or eaccormanarespe
7.4 Com7.
The followreport:
an ex
whet
whetand t
The followiwebsite in a
a subusin
Principle 8
Companiesperformanc
8.1 The b
8.2 The r
consi
is cha
has a
8.3 Comfrom
8.4 Com8.
The followiin the corpo
the nof thfunct
the efor n
an ex The followiwebsite in a
the cand m
a sumprodequit
2013
RPOR
board should disquivalent) and thrdance with sectagement and intects in relation to
mpanies should p
wing material sh
xplanation of any
ther the board ha
ther the board hthe chief financia
ing material shoa clearly marked
ummary of the ness risks.
8: Remunerate fa
s should ensure ce is clear
board should est
remuneration co
ists of a majority
aired by an indep
at least three mem
mpanies should clm that of executiv
mpanies should p
ing material or aorate governance
names of the memhe committee or,tions of a remun
existence and ternon-executive dir
xplanation of any
ing material shoa clearly marked
charter of the remmembership req
mmary of the coducts which limitty-based remune
RATE
sclose whether ithe chief financiation 295A of the ternal control ano financial report
rovide the inform
hould be include
y departures from
as received the re
has received assual officer (or equi
ould be made pud corporate gover
company’s poli
airly and respons
that the level a
tablish a remuner
mmittee should
y of independent
pendent chair
mbers.
learly distinguishe directors and s
rovide the inform
a clear cross-refere statement in th
mbers of the rem where a compaeration committe
rms of any schemrectors.
y departure from
ould be made pud corporate gover
muneration commuirements for th
ompany’s policy t the economic rieration schemes.
E GO
t has received asl officer (or equivCorporations Acd that the systemting risks.
mation indicated
ed in the corpor
m best practice re
eport from mana
urances from theivalent) under Re
ublicly available, rnance section:
icies on risk ov
sibly
and composition
ration committee
be structured so
directors
h the structure ofsenior executives
mation indicated
rence to the locae annual report:
muneration commany does not havee are carried ou
mes for retiremen
m Recommendati
ublicly available, rnance section:
mittee or a summat committee.
on prohibiting eisk of participati
OVER
ssurance from theivalent) that the dct is founded on m is operating ef
d in the Guide to
rate governance
ecommendations
agement under R
e chief executiveecommendation
, ideally by posti
versight and ma
n of remuneratio
e.
that it:
f non-executive ds.
d in the Guide to
ation of the mate
mittee and their ve a remuneratio
ut.
nt benefits, othe
ions 8.1, 8.2 or 8.3
, ideally by posti
mary of the role,
entering into traing in unvested
RNAN
e chief executivedeclaration prov a sound systemffectively in all m
Reporting on Pr
e section of the
s 7.1, 7.2, 7.3 or 7
Recommendation
e officer (or equi 7.3.
ing it to the com
anagement of m
on is sufficient a
directors’ remun
Reporting on Pr
rial should be in
attendance at mon committee, h
er than superann
3.
ing it to the com
, rights, responsi
ansactions in assentitlements und
BENT
NCE
AN
e officer ided in of risk
material
Yes
rinciple
annual
7.4.
n 7.2.
ivalent)
mpany’s
material
Yes
and reasonable
Yes
No
(save
Chair
indep
Non-
Execu
Direct
neration Yes
rinciple
ncluded
meetings how the
nuation,
mpany’s
ibilities
ociated der any
Yes
(as applic
TLEY CAPITALA.B.N. 87 0
NNUAL REPO
7.1
CGS
Annu
Web
and that its rel
4.2
that the
is an
pendent
utive
tor)
4.2
RemComChar
Rem
Repo
Direc
Repo
Annu
cable)
CGS
Annu
Web
L LIMITED 008 108 218
ORT | 62
ual Reports
bsite
ationship to
muneration mmittee
rter
muneration
ort in the
ctors’
ort (within
ual Reports)
ual Reports
bsite

30 JUNE 2
CO
COR 1. Fra
Go The Boardcorporate about havunderpin transparenstakeholde The BoarGovernanc(RecommeGovernancare largelyBoard connumber ofreasons setThe Boardexceptionsnegative imshareholde Details of website governanc 2. Bo In generaauthority tpractices, The Boardgovernancthe highesacting in tThe Boardall of its cregulatoryresponsibiCompany. Where theinformatioits membeand review Without inthe principinclude thespecified appropriat
(1) fordir
(2) theanpe
(3) theexeCo
2013
RPOR
PORAT
amework anovernance and
d is committed tgovernance.
ving a set of cthe Compa
ncy, fair dealingers.
rd of Directce Principleendations) devce Council (Couy consistent wnsiders that thf the Recomment out below in rd uses its bes to the Recompact on the Cers as a whole.
the Recommendat: http://w
ce-council.htm
oard of Director
l the Board isto determine, almanagement a
d is also respoce of the Compast standards of the best interes
d also ensures tcontractual, sta
y obligations. lity for the
e Board considon is required, wers, appropriatewed prior to a fi
ntending to limpal functions ae matters set ouelsewhere in tte:
rmulation andrection, objectiv
e prudential cond operations erformance of th
e resourcing, ecutive mana
ommittee;
RATE
TE GOV
d Approach Responsibility
to maintaining Good corpora
ore values andany’s activitieg and protection
tors supports es and Rveloped by theuncil). The Co
with the Recomhe implementandations are norelation to the mest endeavoursommendations
Company and th
dations can be www.asxgroup.c
rs - Role and Re
s responsible ll matters relati
and operations onsible for the any, and recogn behaviour andsts of the Comthat the Compaatutory and any
The Boardsuccessful op
ders that particwhich is not avae external advinal decision bei
mit the general and responsibiliut below, subjecthis Statement
d approval oves and goals of
ontrol of the Coand monitori
he Company;
review and agement and
E GO
VERNAN
to Corpor
high standardsate governance d behaviours thes and ensun of the interests
the CorporRecommendatioe ASX Corpormpany’s practi
mmendations - tation of a smot appropriate, matters concerns to ensure th
do not havehe best interests
found on the Acom.au/corpora
esponsibilities
for, and has ting to the policiof the Companoverall corpor
nises the need d accountability
mpany as a whoany complies wy other legal a
d has the finperations of t
cular expertise ailable from withice may be taking made.
role of the Boaities of the Boact to delegation or as otherw
of the strate the Company;
ompany’s finanng the financ
monitoring the Investme
OVER
NCE ST
rate
s of is hat ure s of
rate ons rate ices the
mall for
ned. hat
e a s of
ASX ate-
the ies, ny.
rate for
y in ole.
with and nal the
or hin ken
ard, ard
n as wise
egic
nces cial
of ent
(4
(5
(6
(7
ThRerede 3.
ThcodisizThqulatapeleap 3.1
DianCohaanfinanhaac ThDiCoBo 3.2
ThreactoChqulatMcuBoDideCh
RNAN
TATEME
) ensuring and procthese syst
) the identensuring
) the timecommuniand the m
) the establethical sta
he Board takes aemuneration Cspective Chart
ecision-making
Board of Process
he Board has bomposition, siischarge its respze and the scalehe names of thualifications andtest Annual Re
ppointed by theection) at the n
ppointment.
1. Skills, Kn
irectors are appnd governance ompany. The Bave a relevant bnd finance, lawnancial managend director-levaving regard toctivities.
he diverse skiirectors, discloompany’s latesoard considers a
2. Executive
he Executive sponsibility fo
ccurate, timely a perform theihairman of theualifications andtest Annual Re
Managing Directurrently has a moard as a whoirectors bring eliberations, unhairman.
BENT
NCE
AN
ENT (CG
that adequate cedures exist atems and proced
ification of sign that such risks
eliness, accuracications and r
market; and
lishment and mandards.
advice from theCommittee onters; however authority on tho
Directors – Co
been formed soze and comm
ponsibilities ande and nature of
he Directors curd experience areeport. A Dire Board and reti
next Annual Ge
nowledge and E
pointed based skills and exp
Board recogniselend of personaw, financial aement, public
vel business oo the scale and
lls and corporosed in the Dt financial yearappropriate.
e Chairman
Chairman leaor ensuring thand clear informr duties as a
e Company is d experience areeport. The Coor or Chief Exe
majority of Nonole is satisfied
an independnaffected by th
TLEY CAPITALA.B.N. 87 0
NNUAL REPO
GS)
e internal contrand that compldures is mainta
nificant busines are adequately
cy and effectreporting to sh
maintenance of a
e Audit Commitn matters wi
the Board rehose matters.
omposition, Str
o that it has thmmitment to
d duties, given f the Company’rrently in office
re stated in the ector is generaires (and may seneral Meeting
Experience
on the specificperience requir
es the need for Dal experience in and investmen
company admor corporate nature of the
rate backgrounDirectors’ Repor, reflect the m
ads the Boardthat the Boarmation to enabl
a Board. TheMr Farooq Kh
re stated in the ompany does necutive Officer.n-Executive Dird that the Nondent discretionhe executive sta
L LIMITED 008 108 218
ORT | 63
rol systems liance with
ained;
ss risks and managed;
tiveness of hareholders
appropriate
ttee and the ithin their etains final
ructure and
he effective adequately
the current ’s activities. e and their Company’s lly initially tand for re-
g after their
c corporate red by the Directors to accounting
nt markets, ministration experience, Company’s
nds of the ort for the
mix that the
d and has d receives le Directors
e Executive han, whose Company’s not have a The Board rectors. The n-Executive n to their atus of the
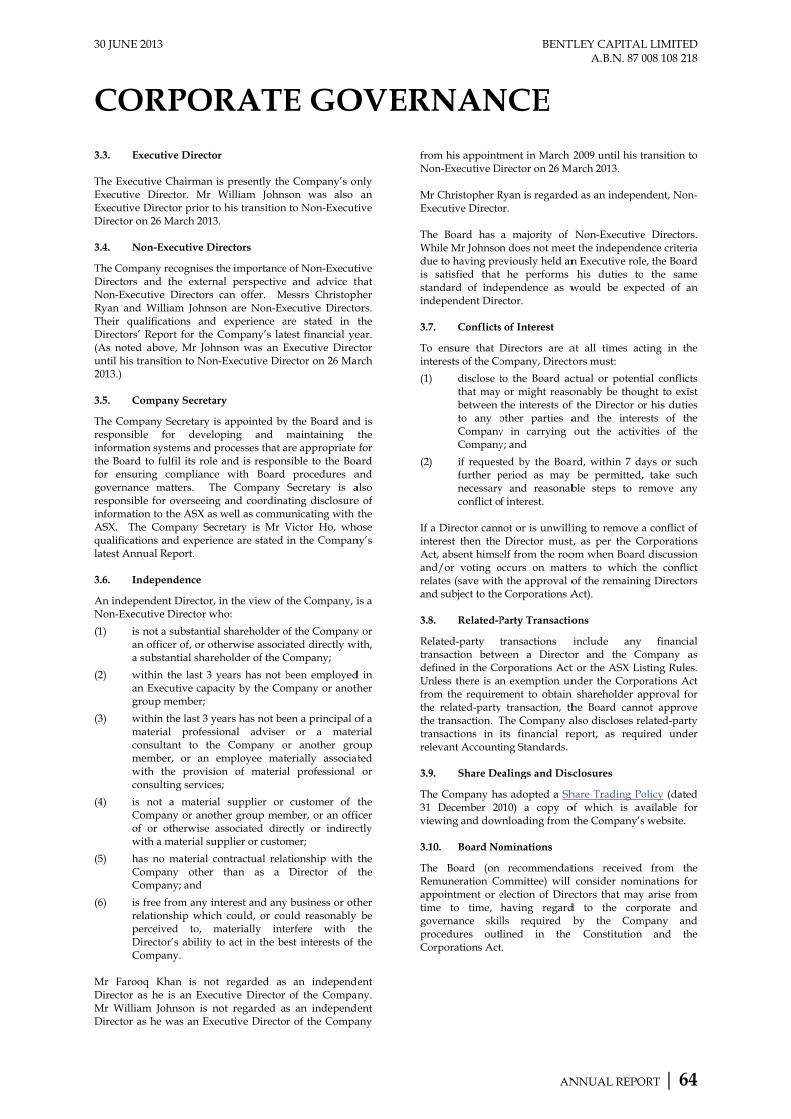
30 JUNE 2
CO 3.3. Ex The ExecuExecutive Executive Director on 3.4. No
The CompDirectors Non-ExecuRyan and Their quaDirectors’ (As noted until his tr2013.) 3.5. Co
The Compresponsiblinformatiothe Board for ensurigovernancresponsiblinformatioASX. Thequalificatiolatest Annu 3.6. In
An indepeNon-Execu
(1) is nana s
(2) wiangro
(3) wimaconmewicon
(4) is Coof wi
(5) haCoCo
(6) is frelpeDiCo
Mr FarooDirector aMr WilliamDirector as
2013
RPORxecutive Directo
utive Chairman Director. Mr
Director prior tn 26 March 2013
on-Executive D
pany recognises and the extern
utive Directors William Johnsalifications andReport for the above, Mr Johransition to Non
ompany Secreta
pany Secretary ie for devel
on systems and p to fulfil its roleing compliance
ce matters. Te for overseein
on to the ASX ase Company Secons and experieual Report.
dependence
endent Director,utive Director w
not a substantian officer of, or otsubstantial shar
ithin the last 3 n Executive capaoup member;
ithin the last 3 yaterial professnsultant to thember, or an ith the provisinsulting service
not a materiaompany or anot or otherwise ith a material su
as no material company other ompany; and
free from any inlationship whic
erceived to, mirector’s ability ompany.
q Khan is nos he is an Execm Johnson is ns he was an Ex
RATEor
is presently theWilliam Johns
to his transition3.
Directors
the importancenal perspective can offer. M
son are Non-Exd experience a Company’s lat
hnson was an En-Executive Dir
ary
is appointed byoping and processes that ae and is respone with Board
The Company ng and coordinas well as commucretary is Mr Vence are stated
, in the view of who:
al shareholder otherwise associaeholder of the C
years has not bacity by the Com
years has not besional adviser he Company o
employee mation of materiaes;
al supplier or ther group memassociated dire
upplier or custom
contractual rela than as a
nterest and anych could, or coumaterially inteto act in the be
ot regarded ascutive Director not regarded aecutive Directo
E GO
e Company’s onson was also
n to Non-Execut
e of Non-Execute and advice th
Messrs Christophxecutive Directoare stated in ttest financial yeExecutive Direcector on 26 Mar
y the Board andmaintaining t
are appropriate nsible to the Boa procedures aSecretary is a
ating disclosureunicating with tVictor Ho, whoin the Compan
the Company, i
of the Companyated directly wi
Company;
been employedmpany or anoth
een a principal o or a mater
or another groterially associatal professional
customer of tmber, or an offiectly or indirecmer;
ationship with tDirector of t
y business or othuld reasonably erfere with test interests of t
an independe of the Compans an independer of the Compa
OVER
nly an
tive
tive hat her ors. the ear. ctor rch
d is the for ard and also e of the ose
ny’s
is a
y or ith,
d in her
of a rial
oup ted or
the icer ctly
the the
her be the the
ent ny. ent
any
froN MEx ThWduis stain 3.7
Toin
(1
(2
If inAcanrean 3.8
RetradeUnfroththtrare 3.9
Th31vi 3.1
ThReaptimgoprCo
RNANom his appointmon-Executive D
Mr Christopher Rxecutive Directo
he Board has While Mr Johnson
ue to having pre satisfied that andard of inde
ndependent Dire
7. Conflicts
o ensure that Dnterests of the Co
) disclose tthat maybetween to any oCompanyCompany
) if requestfurther pnecessaryconflict o
a Director cannnterest then thect, absent himse
nd/or voting olates (save with
nd subject to the
8. Related-P
elated-party ansaction betwefined in the Conless there is anom the require
he related-partyhe transaction. Tansactions in ilevant Account
9. Share De
he Company ha1 December 20ewing and dow
10. Board No
he Board (on emuneration Coppointment or eme to time, overnance skilrocedures outlorporations Act
BENT
NCE
AN
ment in March irector on 26 M
Ryan is regardedor.
a majority of n does not meeteviously held an he performs ependence as wector.
s of Interest
Directors are aompany, Direct
to the Board ac or might reasothe interests of other parties ay in carrying y; and
ted by the Boarperiod as may y and reasonabf interest.
not or is unwilli Director mustelf from the roooccurs on matth the approval oe Corporations A
Party Transactio
transactions ween a Directoorporations Actn exemption unment to obtain
y transaction, thThe Company aits financial reing Standards.
ealings and Dis
as adopted a Sh010) a copy o
wnloading from
ominations
recommendatommittee) will election of Direhaving regardlls required lined in the t.
TLEY CAPITALA.B.N. 87 0
NNUAL REPO
2009 until his tMarch 2013.
d as an indepen
Non-Executivet the independen Executive role
his duties towould be expe
at all times actors must:
ctual or potentionably be thouf the Director oand the intereout the activi
ard, within 7 da be permitted,ble steps to re
ing to remove at, as per the Coom when Boardters to which tof the remaininAct).
ons
include any or and the Cot or the ASX Lisnder the Corpo
n shareholder aphe Board cannalso discloses reeport, as requ
sclosures
hare Trading Poof which is av the Company’s
tions received consider nomiectors that mayd to the corpby the Com Constitution
L LIMITED 008 108 218
ORT | 64
ransition to
ndent, Non-
e Directors. ence criteria e, the Board the same
ected of an
ting in the
ial conflicts ght to exist r his duties ests of the ties of the
ays or such take such emove any
a conflict of orporations
d discussion the conflict
ng Directors
financial ompany as sting Rules.
orations Act pproval for
not approve elated-party ired under
olicy (dated vailable for s website.
from the inations for
y arise from porate and
mpany and and the

30 JUNE 2
CO 3.11. Te
The curreappointed Company Director) calendar yMeeting fwithout suthird of thmust retireDirectors wMeeting arsince their The initialDirector ar
Director
Farooq
William Johnson ChristophRyan
3.12. Pe
It is the pand Execuknowledgeresponsibicollective Directors aprofessionCompany’employeesoperations The Remuthe perforChairman review and The Boardperformanthe perform The ExecuCompany executive. The Chairregarding 3.13. M
The Boardand holds to deal Directors’ appropriatBoard meeto spendintheir dutie
2013
RPORerms of Appoin
nt Directors o for fixed ter provides that amay not retayears or beyofollowing theirubmitting himsehe Directors (sae each year andwho retire by rre those with th appointment o
l appointment are listed below.
Appoi
Khan 2 D2003
13 Ma
her 5 F2004
erformance Rev
policy of the Boutives of the Ce and informatlities effectiveperformance isare encouraged
nal developmen’s expense. Ns to gain full s.
neration Commrmance and r and reporting d its recommend
d as a whole hasnce, the performmance of Board
utive Chairman Secretary, w
rman also sptheir role and p
eetings of the B
d holds regular m additional Boawith specific Circulatory Re
te - either in petings. Each meng sufficient times as a Director o
RATEntment as a Dire
f the Companrms. The co
a Director (otherin office for
ond the third election, whielf or herself foave for any Md are eligible forotation at eachhe longest lengtr last election.
and last re-elec
inted AGelec
December 19 N(staelecAG
arch 2009 16 N
February 11 N
view and Evalua
oard to ensure Company be eqtion they need ely and that s regularly andd to attend dirent courses, as ew Directors hbackground on
mittee is responsremuneration oto the Board ondations arising
s responsibility mance of individ
committees.
reviews the pewho is the on
eaks to Direcperformance as a
Board
meetings approard meetings wh matters reqsolutions are a
place of or in aember of the Bome to enable tof the Company
E GOector
ny have not benstitution of tr than a Managimore than thrAnnual Gene
chever is longr re-election. Oanaging Direct
or re-election. Th Annual Geneth of time in off
tion dates of ea
GM Last Rcted November 2010anding for re-ction at 2013
GM) November 2012
November 2011
ation
that the Directquipped with tto discharge th
individual ad fairly reviewector training a
required, at thave access to n the Compan
sible for reviewiof the Executn the results of therein.
to review its owdual Directors a
erformance of tnly other sen
ctors individuaa Director.
oximately monthhenever necessa
quiring attentiolso utilised wh
addition to formoard is committthem to carry oy.
OVER
een the ing
hree eral ger, One tor) The eral fice
ach
Re-
0
2
1
tors the
heir and
wed. and the all
ny’s
ing tive its
wn and
the nior
ally
hly ary on.
here mal ted out
It alsex 3.1
Suaplegexopan 3.1
AlCoacstaagconoau 3.1
ThthreofafofthReRe20 3.1
ThCocubl Thdi
(1
(2
ThanCh
ThCobeponadeobmthwBo
RNAN is recognised so concurrently
xecutive or non-
14. Independ
ubject to prior pplicable) each Dgal and other
xpense concernperations or unnd responsibiliti
15. Company
ll Directors haompany booksccordance with andards, Directgreed to keep coourse of the exeon-public infouthorised or lega
16. Directors
he Company hahe current Dire
gulate certain mfficer, both duriter the officer c
f any of its whohe terms of semuneration Report and in th009.
17. Diversity
he Board, seniompany curre
ulturally diverseend of qualifica
he Company riverse workplac
) creating aappointmmanagem
) identifyinwhich em
he Board has dnd ensuring whairman.
he small size ompany’s worke expected to ropulation. Givature and scale oetermined that bjectives for ach
monitor the extehe Company is
here required, oard will furthe
BENT
NCE
AN
and accepted ty serve on oth-executive capac
dent Profession
approval by Director has the
professional aning any asp
ndertakings in oies as a Director
y Information a
ave the right s and to Co legal requiremtors and employonfidential all inrcise of their durmation excepally mandated.
s’ and Officers’
as also entered ectors and thematters betweeing the time theases to be an oolly-owned subsuch deeds iseport in the Ce 2009 Notice o
y
ior managemenently comprisee, together with ations and skills
ecognises the e and is commi
a working enviment of well-qument and Board
ng ways to prombraces diversity
elegated the resworkplace div
of - and lowkforce are such reflect the full en those circumof the Companyit is not prac
hieving gender nt to which the appropriate oconsider meas
er consider the e
TLEY CAPITALA.B.N. 87 0
NNUAL REPO
that Board memther boards, eicity.
nal Advice
the Chairman/e right to seek inadvice at the pect of the order to fulfil tr.
and Confidenti
of access to aompany Execuments and agryees of the Comnformation receuties and will npt where dis
Deeds
d into a deed we Company Seen the Companhe officer holdsofficer of the Co
bsidiaries). A ss contained wCompany’s lateof AGM dated
nt and workfoes individuals possessing an a
s.
positive advanitted to:
ironment conduualified employ candidates; and
omote a corporty.
esponsibility of versity to the
w turnover wi that it cannot l diversity of tmstances, and y’s activities, thecticable to set diversity. Thee level of diver
on an ongoing sures to improvestablishment o
L LIMITED 008 108 218
ORT | 65
mbers may ither in an
/Board (as ndependent Company’s Company’s their duties
ality
all relevant utives. In
eed ethical mpany have eived in the not disclose sclosure is
with each of ecretary to y and each
s office and ompany (or ummary of within the est Annual 13 October
orce of the that are appropriate
ntages of a
ucive to the yees, senior d
rate culture
monitoring Executive
ithin - the realistically the general the current e Board has measurable Board will rsity within basis and, ve it. The
of objectives

30 JUNE 2
CO for achieviand its circ The Compsenior execnoted that36% of the 4. Ma 4.1. Ex
The CompDirector, Officer. The Boardthe approOfficer equis the appOfficer equcurrent finthe Corpor 4.2. Bo
InvestmenestablishedExecutive Secretary, Executive The InvesCompany’shareholdeinvestmen The Investon the catethe Investmcategories,Committee Audit Coman AuditindependeRyan (appExecutive was an ExqualificatioReport for The Auditrole and rmembershits operatioaudited anensuring reviewing reports frexternal au As a consCompany'Audit Comhave an in
2013
RPORing gender divcumstances chan
pany does not cutive roles or ot the Company Company’s cur
anagement
xecutives
pany does noChief Executiv
d has determineopriate person uivalent declarapropriate persouivalent declaranancial year, asrations Act and
oard and Manag
nt Committee:d an Investment
Chairman, MMr Victor Ho Director on 26
stment Commit’s Investmeners in Februa
nt strategies app
tment Committegories of invesment Mandate) , imposed by e reports regula
mmittee: In Octt Committee,
ent Non-Execupointed Chair Director, Mr W
xecutive Directons and experi the Company’s
t Committee hasresponsibilities,
hip requirementon, which inclunnual and reviewa risk manag and monitorinom managemeuditor.
sequence of ths Board (as oummittee only h
ndependent majo
RATEversity as the Cnge.
currently havon the Board. I only has two rrent employee
ot presently hve Officer or
d that the Execto make the
ation and the Con to make thation in respect s required unde recommended
gement Commi
: In March 2t Committee wh
Mr Farooq Khaand, until his t
6 March 2013, ttee’s role is t
nt Mandate, ary 2009 and proved by the Bo
tee’s authority istments it can m and financial l the Board.
arly to the Board
tober 2009 the which curr
utive Director, of the Comm
William Johnsotor until 26 Maence are stateds latest financial
s a formal chart composition, s of the Commides reviewing awed half-yearly
gement framewng compliance ent and matter
he size and coutlined in sectiohas two membority.
E GOompany develo
ve any women In this regard, isenior executivs are female.
ave a Managi Chief Financ
utive Chairman Chief Executompany Secretae Chief Financ of the Companer section 295A by the Council.
ittees
2009, the Boahich comprises tan, the Compatransition to NoWilliam Johnso
to implement tapproved
the Companoard.
is subject to limmake (imposed imits within tho The Investmed.
Board establishrently compri
Mr Christophmittee) and Non (noting that
arch 2013). Thd in the Directol year.
ter to prescribe structure and tttee and to goveand approving ty financial repor
work is in plaissues, reviewi
rs related to t
omposition of ton 3.6, above) ters and does n
OVERops
in it is ves.
ing cial
n is tive ary cial
ny’s A of
.
ard the any on-on. the by
ny’s
mits by ose ent
hed ises her on- he heir ors’
e its the ern the rts,
ace, ing the
the the not
Thdo ReescoChNhequRe Thprmad
(a
(b
AsCoReno Thdo 5. PlCocu 6. ThwCoofemCowcow Thanreco
RNANhe Audit Comownloaded from
emuneration Cstablished a Remomprises indephristopher Ryanon-Executive D
e was an Execuualifications andeport for the Co
he Remuneratiorescribe its pur
membership rdministrative m
) a remuneto make governinDirectorsand to asthe remuand advis
b) a nominamake recBoard mdesirablecompetenthese areof the Mdevelopmplans and
s a consequenompany's Boardemuneration Coot have an indep
he Remuneratioownloaded from
Remuner
lease refer to ompany’s lates
urrently have an
Code of C
he Company hahich may be ompany’s websf the standard omployees and coompany seeks till maintain an
orporate citizen orking for.
he Code sets ound personal behspecting the law
onflict of interes
BENT
NCE
AN
mmittee Chartem the Company’
Committee: In muneration Copendent Non-n (appointed Ch
Director, Mr Wiltive Director und experience ar
ompany’s latest
on Committee rpose, key resprequirements, atters. The Com
eration functionrecommendatiog the remunera, including eqsist the Executiv
uneration benefse on those dete
ation function (wommendations
matters includ qualificatio
ncies of Director reflected in thanaging Directo
ment and revied addressing Bo
ce of the size d (as outlined ommittee only hpendent majorit
on Committee Cm the Company’
ration Policy
the Remunerast Annual Repny equity-based
Conduct and Et
as developed a viewed and ite. The Code s
of conduct expeontractors in caro encourage annd enhance its and an employ
ut policies in relhaviour includiw, anti-corruptit and alcohol an
TLEY CAPITALA.B.N. 87 0
NNUAL REPO
er may be vi’s website.
October 2010 ommittee, whic-Executive Dirhair of the Comlliam Johnson (ntil 26 March 2re stated in the financial year.
has a formal ponsibilities, co
powers anmmittee has:
n (with key respons to the Boardation benefits oquity-based remive Chairman tofits of senior merminations); an
with key respon to the Board as
ding the neceons, experienrs and the exten
he Board, the aptor (where appliew of Board oard diversity).
and compositin section 3.6,
has two membety.
Charter may be v’s website.
ation Report port. Directo
d remuneration.
thical Standard
formal Code o downloaded sets and createsected of Directoarrying out theirnd develop a cus reputation asyer which perso
lation to variouing safety, discion, interpersonnd drugs.
L LIMITED 008 108 218
ORT | 66
iewed and
the Board h currently rector, Mr mittee) and (noting that 013). Their e Directors’
charter to omposition, nd other
ponsibilities d on policy
of Executive muneration, o determine
management nd
nsibilities to s to various essary and nce and nt to which ppointment licable), the
succession
tion of the above) the rs and does
viewed and
within the ors do not
ds
of Conduct, from the
s awareness ors, officers, r roles. The lture which s a valued onnel enjoy
us corporate crimination, nal conduct,
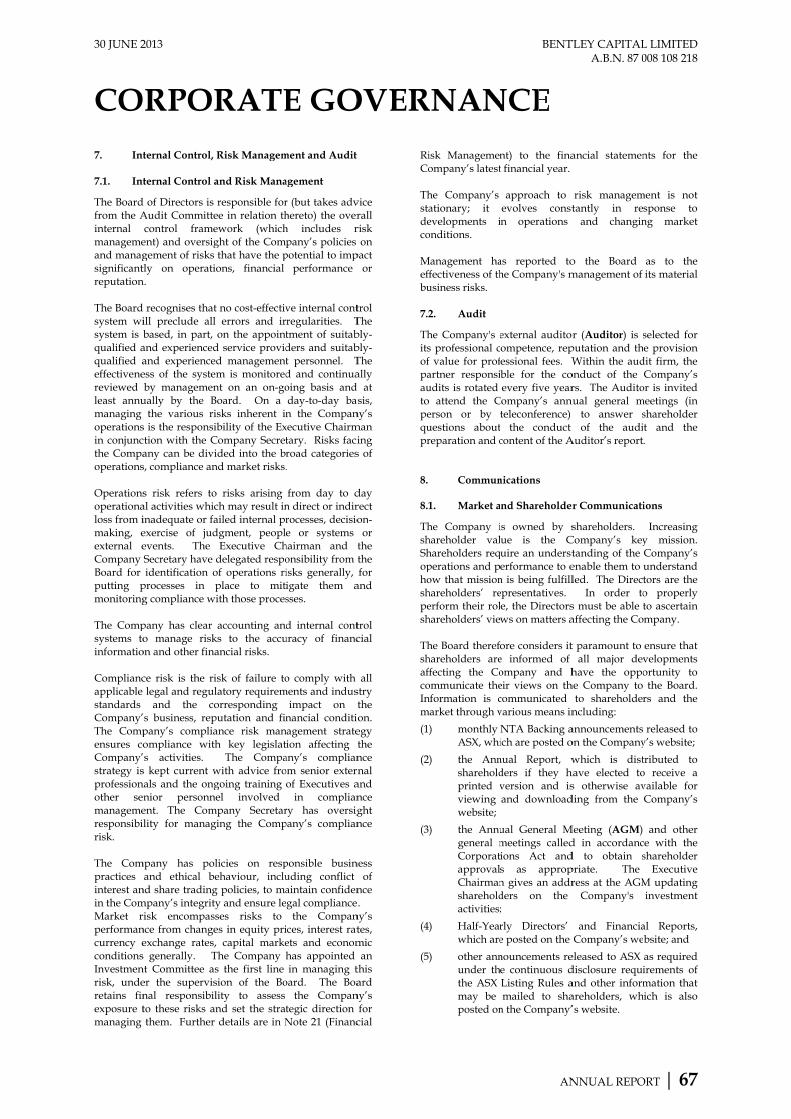
30 JUNE 2
CO 7. Int 7.1. Int
The Boardfrom the Ainternal managemeand managsignificantreputation The Boardsystem wisystem is qualified aqualified aeffectivenereviewed least annumanaging operationsin conjuncthe Compaoperations Operationsoperationaloss from imaking, eexternal eCompany Board for putting pmonitoring The Compsystems toinformatio Compliancapplicable standards Company’The Compensures coCompany’strategy isprofessionother semanagemeresponsibirisk. The Compractices interest anin the ComMarket rperformancurrency econditionsInvestmenrisk, underetains finexposure tmanaging
2013
RPORternal Control,
ternal Control a
d of Directors is Audit Committecontrol frame
ent) and oversiggement of risks tly on operatin.
d recognises thatill preclude allbased, in part,
and experiencedand experienceess of the systeby managemen
ually by the B the various ris is the responsiction with the Cany can be divis, compliance an
s risk refers toal activities whicinadequate or faexercise of judevents. The Secretary have identification o
processes in g compliance w
pany has clear o manage risk
on and other fina
ce risk is the ri legal and regul
and the co’s business, reppany’s compliaompliance wit’s activities. s kept current wnals and the ong
nior personnent. The Comlity for manag
mpany has poand ethical b
nd share tradingmpany’s integritrisk encompasnce from changeexchange rates,s generally. Tnt Committee aer the supervisnal responsibilto these risks a them. Further
RATE Risk Managem
and Risk Mana
responsible foree in relation thework (whichght of the Com that have the pions, financial
t no cost-effectivl errors and ir on the appointd service provided managementem is monitorednt on an on-goBoard. On a isks inherent inibility of the Ex
Company Secretided into the bnd market risks.
o risks arising ch may result inailed internal prdgment, peopl
Executive Ch delegated respoof operations riplace to mit
with those proces
accounting andks to the accuancial risks.
isk of failure tolatory requiremorresponding
putation and finance risk manth key legislat The Compawith advice frogoing training
nel involved mpany Secretarging the Comp
licies on respehaviour, inclu
g policies, to maty and ensure lesses risks to es in equity pri, capital marke
The Company s the first line sion of the Bolity to assess
and set the stratr details are in N
E GOment and Audit
agement
r (but takes advhereto) the overh includes rpany’s policies
potential to imp performance
ve internal contregularities. Ttment of suitabders and suitabt personnel. Td and continuaoing basis and day-to-day basn the Compan
xecutive Chairmtary. Risks faciroad categories.
from day to dn direct or indirrocesses, decisioe or systems
hairman and tonsibility from tisks generally, igate them asses.
d internal conturacy of financ
o comply with ments and indus
impact on tnancial conditio
nagement strateion affecting t
any’s complianom senior externof Executives a
in complianry has oversigpany’s complian
ponsible businuding conflict aintain confidengal compliance
the Companices, interest ratets and economhas appointed in managing t
oard. The Boa the Compantegic direction Note 21 (Financ
OVER
vice rall risk on
pact or
trol The bly- bly-The ally at sis,
ny’s man
ing s of
day rect on-
or the the for
and
trol cial
all stry the on. egy the nce nal
and nce ght nce
ness of
nce .
ny’s tes, mic an this ard
ny’s for
cial
RiCo Thstadeco Meffbu 7.2
Thitsofpaautopequpr 8. 8.1
ThshShophoshpesh ThshafcoInm
(1
(2
(3
(4
(5
RNANisk Managemenompany’s latest
he Company’s ationary; it evelopments ionditions.
Management hafectiveness of th
usiness risks.
2. Audit
he Company's es professional cf value for profartner responsiudits is rotated attend the C
erson or by uestions aboutreparation and c
Commun
1. Market a
he Company ihareholder valhareholders reqperations and pow that missionhareholders’ reerform their rolhareholders’ vie
he Board therefhareholders arefecting the Co
ommunicate thenformation is c
market through v
) monthly ASX, whi
) the Annshareholdprinted vviewing website;
) the Annugeneral mCorporatapprovalChairmanshareholdactivities;
) Half-Yearwhich are
) other annunder ththe ASX may be posted on
BENT
NCE
AN
nt) to the finat financial year.
approach to evolves constn operations
as reported tohe Company's m
external auditorompetence, repessional fees. Wble for the coevery five year
Company’s annuteleconference) the conduct content of the A
nications
nd Shareholder
is owned by sue is the Cuire an understerformance to e
n is being fulfillepresentatives. e, the Directorsws on matters a
ore considers ite informed of ompany and heir views on thcommunicated various means in
NTA Backing aich are posted o
nual Report, wders if they hversion and isand download
ual General Mmeetings calledions Act ands as appropn gives an addrders on the ;
rly Directors’ e posted on the
nouncements ree continuous dListing Rules amailed to sha
n the Company’
TLEY CAPITALA.B.N. 87 0
NNUAL REPO
ancial statemen
risk managemtantly in re
and changin
o the Board management of
or (Auditor) is sputation and thWithin the aud
onduct of the rs. The Audito
nual general m to answer s of the audi
Auditor’s report
er Communicati
shareholders. Company’s keytanding of the enable them to led. The Direct In order to
s must be able taffecting the Co
t paramount to all major devhave the oppo
he Company to to shareholder
ncluding:
announcements on the Company
which is disthave elected tos otherwise av
ding from the
Meeting (AGM) d in accordancd to obtain spriate. The ress at the AGM
Company's
and Financia Company’s we
eleased to ASX disclosure requiand other informareholders, wh’s website.
L LIMITED 008 108 218
ORT | 67
nts for the
ment is not sponse to ng market
as to the its material
selected for e provision
dit firm, the Company’s
or is invited meetings (in
shareholder t and the .
ions
Increasing y mission. Company’s understand tors are the o properly to ascertain mpany.
ensure that velopments ortunity to the Board. rs and the
released to y’s website;
tributed to o receive a vailable for Company’s
and other ce with the shareholder
Executive M updating investment
al Reports, bsite; and
as required irements of mation that
hich is also
30 JUNE 2
CO Shareholdemeans incl
(1) haDi
(2) theGean
(3) theavMe
(4) thesenqume
The Compshareholdeuse of the reports andownloadewebsite: wCompany of the Commanner. 8.2. Co
The Boardperson redisclosure communic In accordaRule 3.1, informatioperson woor value ofpermitted expect infovalue of would, orcommonlyacquire or All staff arany potentCompany managers Executive they reporof any potthe Comprumours uListing Ru The Execuspeak to Company’Secretary occasions ( The Compprevent trauninformedetermine 25 October
2013
RPORers communicatluding:
aving the oppirectors at all ge
e availability oeneral Meetings
ny issue relevant
e Company’s povailable to meet eetings; and
e Company mnior employees
uestions submitteans (where app
pany actively ers through a v Company’s wend ASX annoued from its web
www.asx.com.au also maintains mpany’s annou
ontinuous Discl
d has designateesponsible for of informa
cating with ASX
ance with the Cthe Company
on concerning tould expect to hf the Company’ by that rule. ormation to havthe Company’
r would be liky invest in sec dispose of the C
re required to intially price-sens as soon as theyare in turn requChairman or th
rt or, in their abtentially price-sany will not re
unless required ules.
utive Chairmanthe media, i
’s behalf. Othmay be given (where appropr
pany may requading in its secued. The Execut whether to seek
2013
RATEte with Director
portunity to aneral meetings;
f the external as to take sharehot to their capaci
olicy of expecti shareholders a
making Directos available to anted by telephonpropriate).
promotes comariety of measu
ebsite and emailuncements maybsite: www.bel.cu under ASX c an email list fo
uncements via
losure to ASX
d the Company overseeing a
ation to ASXX.
Corporations Acy immediately the Company
have a material ’s securities, subA reasonable p
ve a material eff’s securities ifkely to, influencurities in deciCompany’s secu
nform their repsitive informatiy become awaruired to informhe Company S
bsence, the otheensitive informespond to mark to do so by la
n has general investors and her Directors a brief to do riate).
uest a trading hurities if the mative Chairman k a trading halt
E GOrs through vario
ask questions
auditor at Annuolder questions ty as auditor;
ng Directors to at Annual Gene
ors and selectnswer shareholdne, email and oth
mmunication wures, including tl. The Company be viewed acom.au or the Acode “BEL”. Tor the distributiemail in a tim
y Secretary as tand coordinatiX as well
t and ASX Listinotifies ASX
that a reasonaeffect on the prbject to exceptioperson is takenfect on the pricef the informatince persons widing whether urities.
orting manageron concerning te of it. Reporti
m whichever of tecretary to who
er senior executmation. In gener
ket speculation aw or by the A
responsibility analysts on t
or the Compa so on particu
halt from ASX arket appears to is authorised .
OVERous
of
ual on
be eral
ted der her
with the
ny’s and
ASX The ion
mely
the ing
as
ing of
able rice ons
n to e or ion
who to
r of the ing the om tive ral,
n or ASX
to the
any ular
to o be to
RNAN
BENT
NCE
AN
TLEY CAPITALA.B.N. 87 0
NNUAL REPO
L LIMITED 008 108 218
ORT | 68
30 JUNE 2013 BENTLEY CAPITAL LIMITED A.B.N. 87 008 108 218
INVESTMENT MANDATE
ANNUAL REPORT | 69
The Investment Objectives of Bentley are to:
Achieve a high real rate of return over the medium term, ideally comprising both income and capital growth, whilst operating within acceptable risk parameters set by the Board; and
Deliver a regular income stream for shareholders in the form of franked dividends.
1. INVESTMENT STRATEGY
Bentley will implement an actively managed investment strategy undertaking investments typically into one of two broad investment categories:
Strategic Investments; and
Non-strategic Investments. Bentley will not allocate a fixed proportion of funds into each or any of the above investment categories, as it believes that complete flexibility to invest across these categories is key to maximising medium-term value growth for shareholders. For each strategic and non-strategic investment, Bentley will expect to receive a level of return that is commensurate with the level of risk associated with such investment. In each investment and for the investment portfolio in aggregate, Bentley will at least aim to achieve a return that is consistently in excess of an appropriate benchmark share index and or a return which could be earned from investments in cash, bills of exchange or negotiable instruments drawn or endorsed by a bank, non-bank financial institution or a government.
(a) Strategic Investments
Bentley will seek to undertake investments in which it can reasonably expect to exert a degree of influence, including board representation or through playing an active role alongside management in order to enhance or realise shareholder value. Investments will include those that have the potential for turnaround in profitability or capital appreciation through the introduction of new management, capital, improved business practices, industry rationalisation, and/or improved investor relations. Strategic investments by their nature will rely heavily on Bentley’s ability to identify, attract and exploit unique opportunities.
(b) Non-Strategic Investments
Bentley will seek to make non-strategic investments in entities where attractive investment opportunities develop due to market sentiment or mispricing or where Bentley sees other potential for generating positive returns. In contrast to strategic investments, with non-strategic investments Bentley does not envisage that it will take an active role in the management of the investment.
2. PORTFOLIO ALLOCATION
In executing its Investment Strategy, Bentley may, from time to time, hold a high proportion of net assets in cash, preferring to be patient and selective rather than filling its investment portfolio with mediocre or underperforming investments for the sake of becoming “fully-invested”. Bentley will not be limited to the principles of broad diversification; in other words, Bentley may invest a significant proportion of funds in any single investment that represents an exceptional opportunity.
3. INVESTMENTS
Investments may be made by Bentley in Australia and overseas and into any underlying industry, business or sector, in accordance with Bentley’s stated Investment Objectives and Strategies. In pursuit of the Investment Objectives and execution of the Investment Strategies outlined above, Bentley will have absolute discretion in applying its equity and any debt funds to a universe or range of potential investments in assets, businesses, securities, hybrid securities, cash, bills of exchange, other negotiable investments, debentures and other investments and structures.
4. MANAGEMENT OF INVESTMENTS
Bentley’s investment decisions are carried out by its Investment Committee, which currently comprises Executive Chairman, Farooq Khan and Company Secretary, Victor Ho (in conjunction with external consultants and advisers where appropriate). Executive Director, William Johnson was a member of the Investment Committee until he transitioned to Non-Executive Director on 25 March 2013. If it believed that it is in the best interests of Bentley, the Board may choose to delegate part or all of the responsibility for making investment decisions to an external investment manager, subject to the investment manager having appropriate capabilities, experience and the necessary Australian Financial Services Licence(s). * Ìnvestment Mandate was approved by shareholders at a
general meeting held on 25 February 2009

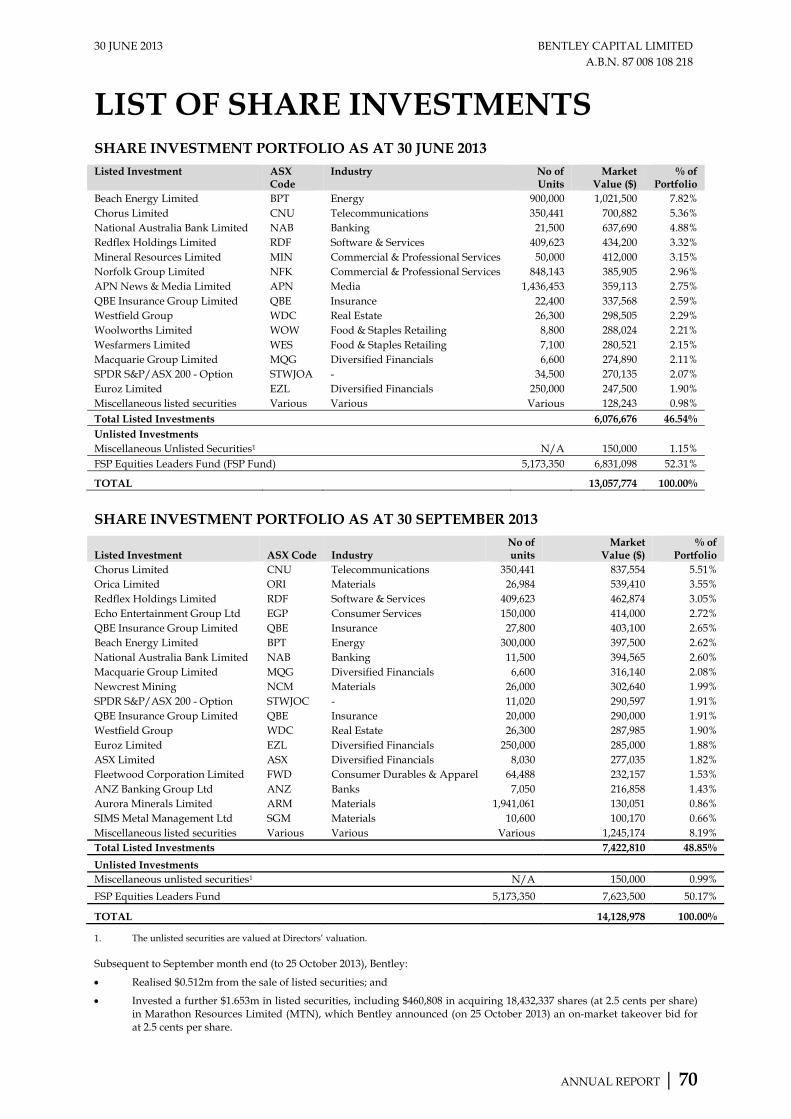
30 JUNE 2013 BENTLEY CAPITAL LIMITED A.B.N. 87 008 108 218
LIST OF SHARE INVESTMENTS
ANNUAL REPORT | 70
SHARE INVESTMENT PORTFOLIO AS AT 30 JUNE 2013 Listed Investment ASX
Code Industry No of
Units Market
Value ($) % of
Portfolio Beach Energy Limited BPT Energy 900,000 1,021,500 7.82% Chorus Limited CNU Telecommunications 350,441 700,882 5.36% National Australia Bank Limited NAB Banking 21,500 637,690 4.88% Redflex Holdings Limited RDF Software & Services 409,623 434,200 3.32% Mineral Resources Limited MIN Commercial & Professional Services 50,000 412,000 3.15% Norfolk Group Limited NFK Commercial & Professional Services 848,143 385,905 2.96% APN News & Media Limited APN Media 1,436,453 359,113 2.75% QBE Insurance Group Limited QBE Insurance 22,400 337,568 2.59% Westfield Group WDC Real Estate 26,300 298,505 2.29% Woolworths Limited WOW Food & Staples Retailing 8,800 288,024 2.21% Wesfarmers Limited WES Food & Staples Retailing 7,100 280,521 2.15% Macquarie Group Limited MQG Diversified Financials 6,600 274,890 2.11% SPDR S&P/ASX 200 - Option STWJOA - 34,500 270,135 2.07% Euroz Limited EZL Diversified Financials 250,000 247,500 1.90% Miscellaneous listed securities Various Various Various 128,243 0.98% Total Listed Investments 6,076,676 46.54% Unlisted Investments Miscellaneous Unlisted Securities1 N/A 150,000 1.15% FSP Equities Leaders Fund (FSP Fund) 5,173,350 6,831,098 52.31%
TOTAL 13,057,774 100.00%
SHARE INVESTMENT PORTFOLIO AS AT 30 SEPTEMBER 2013
Listed Investment ASX Code Industry No of units
Market Value ($)
% of Portfolio
Chorus Limited CNU Telecommunications 350,441 837,554 5.51% Orica Limited ORI Materials 26,984 539,410 3.55% Redflex Holdings Limited RDF Software & Services 409,623 462,874 3.05% Echo Entertainment Group Ltd EGP Consumer Services 150,000 414,000 2.72% QBE Insurance Group Limited QBE Insurance 27,800 403,100 2.65% Beach Energy Limited BPT Energy 300,000 397,500 2.62% National Australia Bank Limited NAB Banking 11,500 394,565 2.60% Macquarie Group Limited MQG Diversified Financials 6,600 316,140 2.08% Newcrest Mining NCM Materials 26,000 302,640 1.99% SPDR S&P/ASX 200 - Option STWJOC - 11,020 290,597 1.91% QBE Insurance Group Limited QBE Insurance 20,000 290,000 1.91% Westfield Group WDC Real Estate 26,300 287,985 1.90% Euroz Limited EZL Diversified Financials 250,000 285,000 1.88% ASX Limited ASX Diversified Financials 8,030 277,035 1.82% Fleetwood Corporation Limited FWD Consumer Durables & Apparel 64,488 232,157 1.53% ANZ Banking Group Ltd ANZ Banks 7,050 216,858 1.43% Aurora Minerals Limited ARM Materials 1,941,061 130,051 0.86% SIMS Metal Management Ltd SGM Materials 10,600 100,170 0.66% Miscellaneous listed securities Various Various Various 1,245,174 8.19% Total Listed Investments 7,422,810 48.85%
Unlisted Investments Miscellaneous unlisted securities1 N/A 150,000 0.99%
FSP Equities Leaders Fund 5,173,350 7,623,500 50.17%
TOTAL 14,128,978 100.00%
1. The unlisted securities are valued at Directors’ valuation. Subsequent to September month end (to 25 October 2013), Bentley:
Realised $0.512m from the sale of listed securities; and
Invested a further $1.653m in listed securities, including $460,808 in acquiring 18,432,337 shares (at 2.5 cents per share) in Marathon Resources Limited (MTN), which Bentley announced (on 25 October 2013) an on-market takeover bid for at 2.5 cents per share.
30 JUNE 2013 BENTLEY CAPITAL LIMITED A.B.N. 87 008 108 218
ADDITIONAL ASX INFORMATION
ANNUAL REPORT | 71
TRANSACTIONS AND BROKERAGE
During the financial year, the Company entered into 420 (2012: 151) transactions (including under the Leyland and Sentinel MDAs referred to below) for the purchase and sale of securities, incurring brokerage fees totalling $103,986 (2012: $42,990). The Company undertook no investments or redemptions into or from the FSP Fund (2012: 1 investment into and 2 redemptions). There are no entry or exit fees applicable to the FSP Fund. INVESTMENT MANAGEMENT AGREEMENTS
(a) An Investment Management Agreement dated 9 December 2004 (IMA) between Scarborough Equities Pty Ltd (Scarborough) (a wholly owned subsidiary of Bentley) and FSP Equities Management Limited ABN 120 098 327 809 AFSL 246790 (FSP) expired on 9 December 2006 and FSP’s mandate has continued on a month to month basis in accordance with the terms therein. Under the terms of the IMA: (a) FSP is to invest and manage Scarborough’s investment portfolio in the FSP Fund and (b) the management fees normally payable by participants in the FSP Fund is 1% per annum base management fee and a performance fee of 20% of the performance of the fund in excess of the S&P/ASX 200 Accumulation Index benchmark. A variable fee structure has been negotiated with a favourable rebate to the normal fees charged by the FSP Fund whilst still providing a material incentive to the Investment Manager for investment out performance to the benchmark. The payment of management fees to FSP occurs through the deduction by the manager of monies invested within the FSP Fund. The value of the investment in the FSP Fund is therefore net of fees payable to the manager from time to time. Bentley has also invested funds into the FSP Fund upon the same terms.
(b) Bentley has established an Individually Managed Account (on 22 May 2012) with Leyland Private Asset Management Pty Ltd ABN 75 081 890 799 AFSL 223419 (Leyland) which operates as a “managed discretionary account” (MDA) whereby Leyland has authority and discretion to undertake investments in listed securities which are held in the Company’s name. Leyland is entitled to receive a 1.5% per annum base management fee and a performance fee of 10% of the outperformance of the portfolio benchmarked against the ASX 200 Accumulation Index subject to a “high water mark” (which effectively requires a claw back of any previous underperformance and investment management fees, which are paid from the portfolio account). Base and performance fees of $35,449 were paid to Leyland for the financial year ended 30 June 2013.
(c) Bentley has established an MDA with Sentinel Financial Group Pty Ltd ABN 26 104 456 288 AFSL 230542 (Sentinel) whereby Sentinel has authority and discretion to undertake investments in listed securities which are held in the Company’s name. The portfolio, established initially in the name of Bentley Capital Limited on 22 May 2012, was migrated to a new subsidiary, Bentley Portfolio No.1 Pty Ltd, on 1 April 2013. Sentinel is entitled to receive a performance fee of 20% of the absolute performance of the portfolio, subject to a rolling 4-quarter “high water mark” (which effectively requires a claw back of any negative returns in the previous 4 quarters). A performance fee of $74,770 was paid to Sentinel for the financial year ended 30 June 2013.
ON-MARKET SHARE BUY-BACK
The Company’s on-market share buy-back initiative (Buy-Back)7 expired on 31 August 2012 after 12 months8. No shares were bought-back under the Buy-Back during the financial year (2012: 665,961 shares bought back at a cost of $0.144 million).
VOTING RIGHTS
At any meeting of the shareholders, each shareholder entitled to vote may vote in person or by proxy or by power of attorney or, in the case of a shareholder which is a corporation, by representative.
Every person who is present in the capacity of shareholder or the representative of a corporate shareholder shall, on a show of hands, have one vote.
Every shareholder who is present in person, by proxy, by power of attorney or by corporate representative shall, on a poll, have one vote in respect of every fully paid share held by him.
7 Refer 17 August 2011 ASX market announcement “Intention to Conduct On-Market Share Buy-Back” and Appendix 3C – Announcement
of Buy-Back dated 17 August 2011. 8 Refer Appendix 3F Final Share Buy-Back Notice released on ASX on 10 September 2012.

30 JUNE 2013 BENTLEY CAPITAL LIMITED A.B.N. 87 008 108 218
ADDITIONAL ASX INFORMATION as at 24 October 2013
ANNUAL REPORT | 72
DISTRIBUTION OF LISTED ORDINARY SHARES
Spread of Holdings Number of Holders Number of Shares % of Total Issued Capital
1 - 1,000 250 122,571 0.167%
1,001 - 5,000 742 2,283,564 3.113%
5,001 - 10,000 374 2,705,194 3.688%
10,001 - 100,000 520 13,902,929 18.954%
100,001 - and over 73 54,336,283 74.078%
Total 1959 73,350,541 100%
Unmarketable Parcel
Spread of Holdings Number of Holders Number of Shares % of Total Issued Capital
1 - 3,124 631 932,254 1.271% An unmarketable parcel is considered, for the purposes of the above table, to be a shareholding of 3,124 shares or less, being a value of $500 or less in total, based upon the Company’s closing share price on ASX on 24 October 2013 of $0.16 per share.
SUBSTANTIAL SHAREHOLDERS Substantial Shareholders Registered Shareholder Number of
Shares held Voting Power
Data Base Systems Limited (DBS) and Ambreen Chaudhri
DBS 11,717,586 15.98%(1)
Orion Equities Limited (OEQ) OEQ 20,513,783 27.97%
Queste Communications Ltd (QUE) QUE 1,740,625 30.34%(2)
OEQ 20,513,783
Mr Azhar Chaudhri, Renmuir Holdings Limited and Chi Tung Investments Ltd
QUE 1,740,625 30.34%(3)
OEQ 20,513,783
Notes:
(1) Based on the substantial shareholding notice filed by DBS and Ambreen Chaudhri dated 15 May 2012
(2) Based on the substantial shareholding notice filed by QUE dated 15 October 2009
(3) Based on the substantial shareholding notice filed by Azhar Chaudhri dated 2 May 2012

30 JUNE 2013 BENTLEY CAPITAL LIMITED A.B.N. 87 008 108 218
ADDITIONAL ASX INFORMATION as at 24 October 2013
ANNUAL REPORT | 73
TOP TWENTY ORDINARY FULLY PAID SHAREHOLDERS
Rank Shareholder Total Shares Held % Issued Capital
1 ORION EQUITIES LIMITED 20,513,783 27.967
2 DATA BASE SYSTEMS LTD 11,717,586 15.975
3 3RD PULITANO INCORPORATION PTY LTD 1,876,164 2.558
4 CHARLES W ROCKEFELLER PTY LTD 1,748,432 2.384
5 QUESTE COMMUNICATIONS LTD 1,740,625 2.373
6 MR JOHN ROBERT DILLON 1,489,019 2.030
7 MR COLIN JOHN VAUGHAN & MRS ROBIN VAUGHAN 1,150,445 1.568
8 BERGER EQUITIES PTY LTD 560,000 0.763
9 AVENUE ATHOL PTY LTD 536,046 0.731
10 MON NOMINEES PTY LTD 525,000 0.716
11 MR MICHAEL BRUCE SMITH & MRS KAY SMITH 481,044 0.656
12 LEIBLER SUPERANNUATION NOMINEES PTY LTD 457,743 0.624
13 MANAR NOMINEES PTY LTD 390,773 0.533
14 BOND STREET CUSTODIANS LIMITED 376,121 0.513
15 MR BENJAMIN KOPPEL & MRS SARAH KOPPEL 373,227 0.509
16 AVANTEOS INVESTMENTS LIMITED 354,687 0.484
17 KJ & ML GILROY PTY LTD 350,000 0.477
18 MRS KERRY ELIZABETH DRAFFIN 337,465 0.460
19 JOHN KERNICK S/F PTY LTD 300,000 0.409
20 KALAFMEL PTY LIMITED 278,721 0.380
TOTAL 45,556,881 62.110%
Bentley Capital limitedaBn 87 008 108 218
www.bel.com.au
aSX Code: Bel
corporate office:
Suite 1, 346 Barker RoadSubiaco, Western australia 6008
Share regiStry:advanced Share Registry ServicesSuite 2, 150 Stirling Highwaynedlands, Western australia 6009pO Box 1156, nedlands, Wa 6909
t | (08) 9389 8033F | (08) 9389 7871
level 6, 225 Clarence StreetSydney, new South Wales 2000pO Box Q1736, Queen Victoria Building, new South Wales 1230
t | (02) 8096 3502
e | [email protected] W | www.advancedshare.com.au
regiStered office:
Suite 202, angela House30-36 Bay Streetdouble Bay, new South Wales 2028
t | (02) 9363 5088F | (02) 9363 5488
t | (08) 9214 9757 F | (08) 9214 9701