ben’s bells-ua research and evaluation partnership€™s bells-ua research and evaluation...
TRANSCRIPT
Michele Walsh, PhDMadeleine deBlois, MSEd, ScD
Community Research, Evaluation, and Development Team(CRED)
Ben’s Bells-UA Research and Evaluation Partnership
Fourth Annual Kindness Coordinators ConferenceAugust 22nd, 2015
Presentation Overview
• (Re)Introduce our team• Progress in the last year
– Kindness Coordinator Survey– Pilot evaluation– What we’re learning about Kind Campus
• What’s next?
Ben’s Bells Evaluation Team• Michele Walsh, PhD• Madeleine deBlois, MSEd, ScD• Deanna Kaplan, MA• Violeta Dominguez, MA• Kara Tanoue, BA • John Daws, PhD• DeeDee Avery, MPH• Jose-Michael Gonzalez BA, BHT• Alyssa Begay, BA• Ayana Blackey, Maggie Van Dop, BA, André Pettman
Our long-range goal is to work together to develop Ben’s Bells programming into empirically-based, nationally recognized interventions, improving well-being in our schools and communities and providing opportunities for translational research.
CredibilityAccountability Sustainability
Why Evaluate?
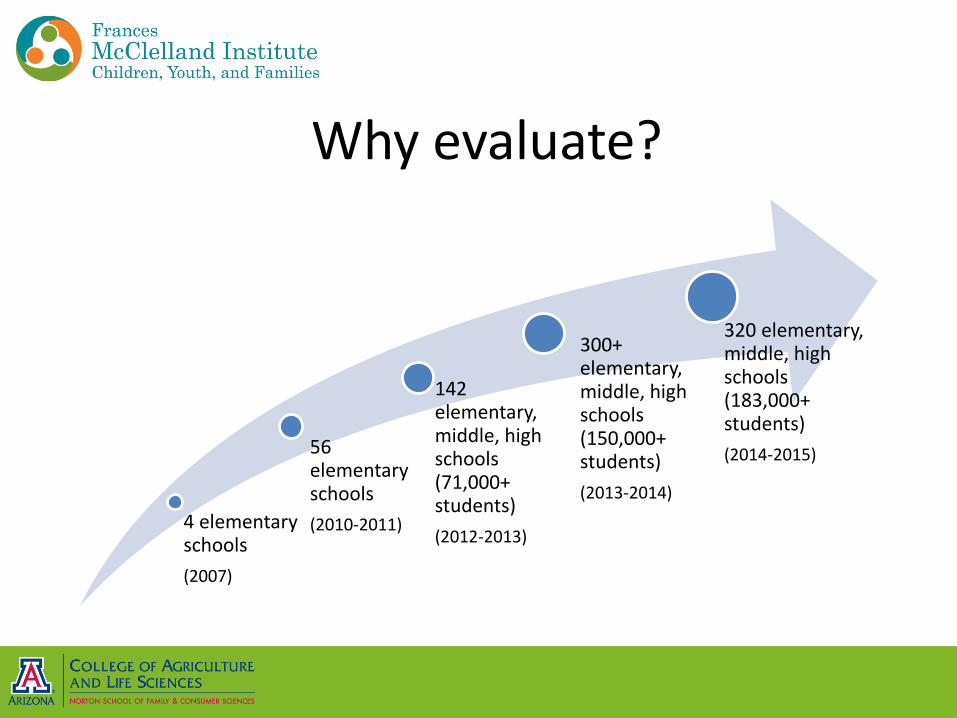
Why evaluate?
4 elementary schools(2007)
56 elementary schools(2010-2011)
142 elementary, middle, high schools (71,000+ students)(2012-2013)
300+ elementary, middle, high schools (150,000+ students) (2013-2014)
320 elementary, middle, high schools (183,000+ students)(2014-2015)

Programs Across North America, 2014-2015
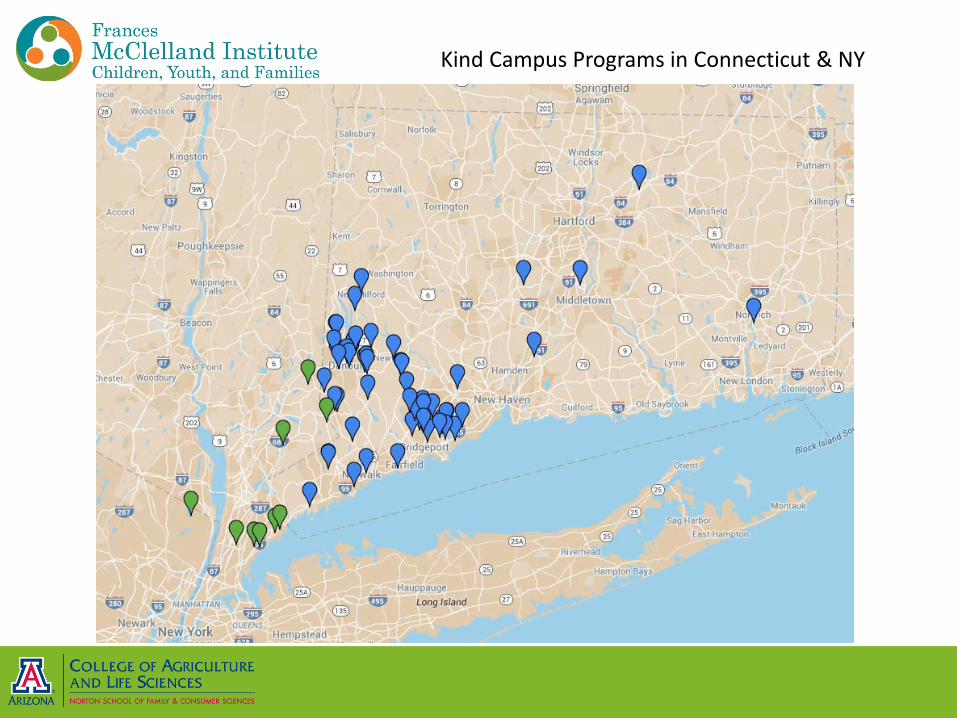
Kind Campus Programs in Connecticut & NY

Kind Campus in Metro Phoenix

Kind Campus in Southern Arizona
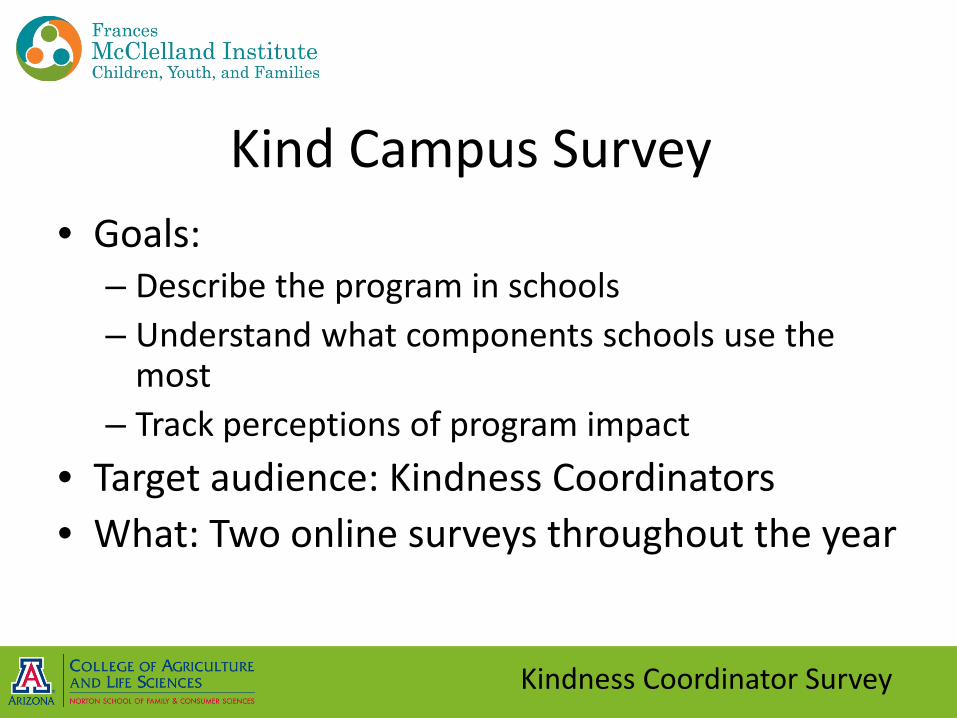
Kind Campus Survey• Goals:
– Describe the program in schools – Understand what components schools use the
most– Track perceptions of program impact
• Target audience: Kindness Coordinators• What: Two online surveys throughout the year
Kindness Coordinator Survey

Schools submitting surveys228
64
44
0
50
100
150
200
Beginning of school year End of school year Both beginning and end of year
Num
ber
Kindness Coordinator Survey

Number of years participating schools have been with the program
55%
22%
8%5% 6%
2% 1% 2%0%
10%
20%
30%
40%
50%
60%
70%
80%
90%
100%
<1 1 2 3 4 5 6 7
Perc
ent
of th
ose
resp
ondi
ng to
surv
ey 1
(%)
Years in Program
Schools
Kindness Coordinator Survey
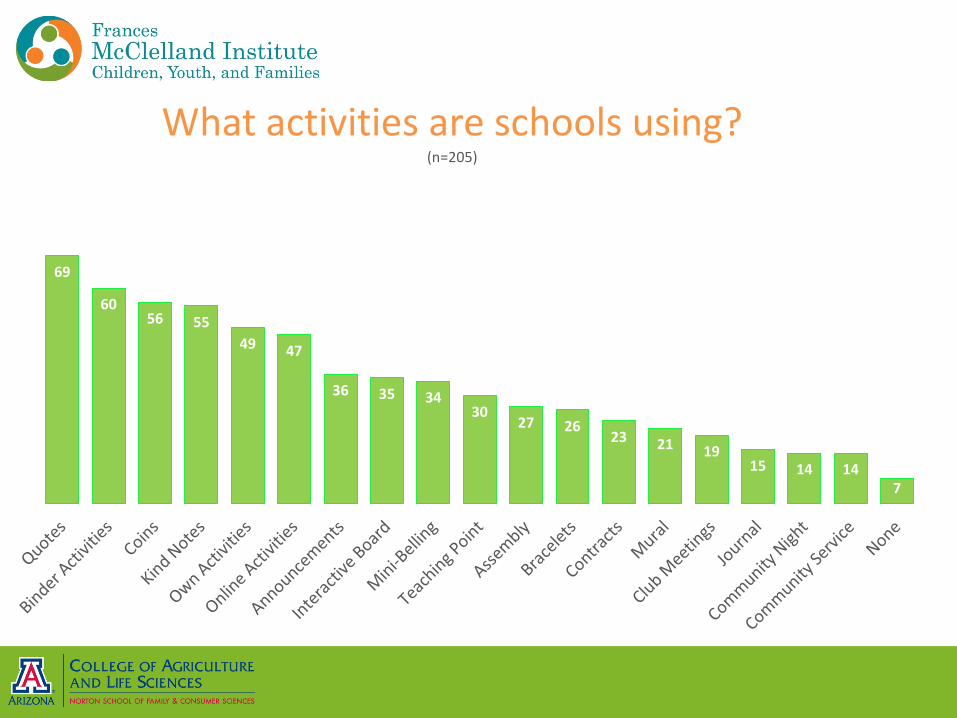
69
6056 55
49 47
36 35 3430
27 2623 21 19
15 14 147
What activities are schools using? (n=205)

Program Implementation• Minimal
– Never/rarely implemented Kind Kids/Kind Campus activities. – No visual reminders to 'be kind' on campus. – Students, staff/faculty and families are not aware of Kind Kids/Kind Campus
• Moderate – Implemented Kind Kids/Kind Campus activities at least once a month.– Some visual reminders to 'be kind' on campus.– Most students, staff/faculty and families are aware of Kind Kids/Kind Campus.
• Heavy– Implemented Kind Kids/Kind Campus as part of our regular school day routine.– Multiple visual reminders to 'be kind' on campus. – All students, staff/faculty and families are aware of the program on our
campus and participate.
Kindness Coordinator Survey
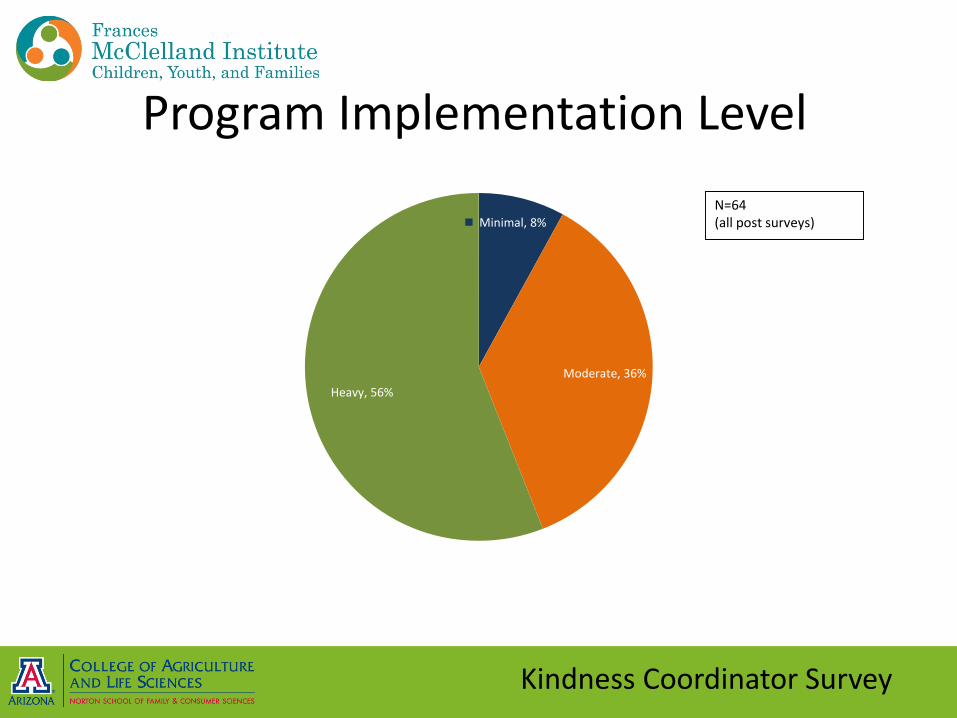
Program Implementation Level
Minimal, 8%
Moderate, 36%Heavy, 56%
N=64(all post surveys)
Kindness Coordinator Survey
Perceived Impact… with a caveat
• Goal: to assess Kindness Coordinators’ perception of change between the beginning and the end of the school year
• However, low survey participation at the end of the year continues to limit our ability to look at perception of change in detail
• BUT.. We are building up a longitudinal data set to better examine change over time
Kindness Coordinator Survey
Kindness Coordinator Survey
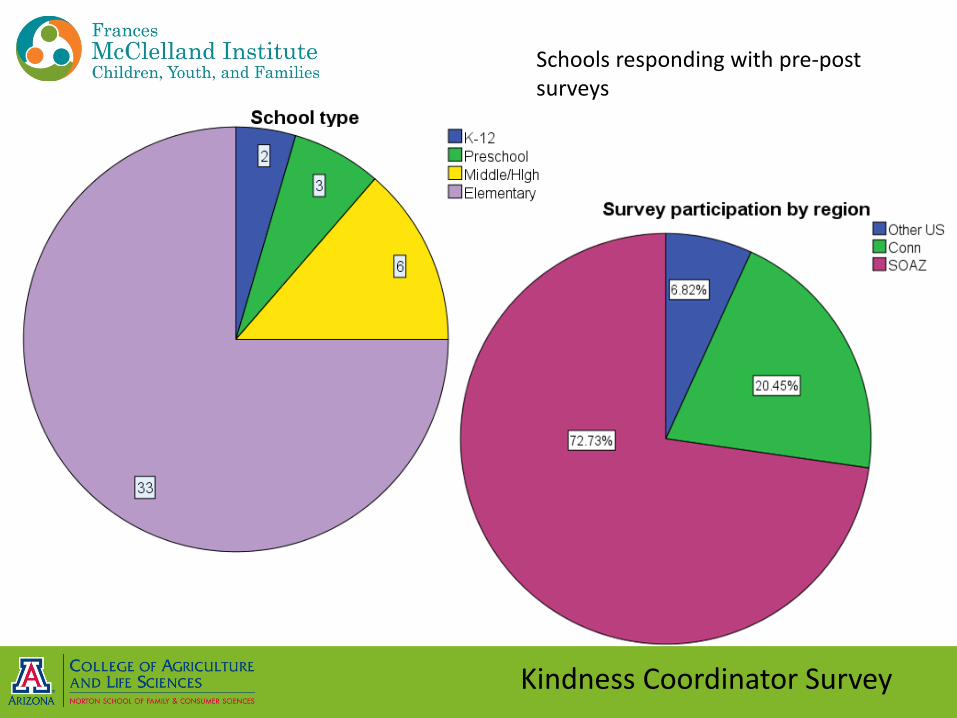
Schools responding with pre-post surveys

7.3
8.1
1 2 3 4 5 6 7 8 9 10
Impact on Teachers and Staff (N=43)
Impact on Students (N=42)
MeanNo positive impact Very strong positive impact
How much of a positive impact did the Ben’s Bells Kind Campus Program have on students/teachers and staff at your school this year?
Kindness Coordinator Survey
Kindness Coordinators report positive impacts on both students and teachers/staff

Kindness Outcomes
Kindness Coordinator Survey
• Students at my school treat one another/teachers/school staff with respect and kindness.
• Teachers and staff at my school treat one another/students with respect and kindness.

0.00
1.00
2.00
3.00
4.00
5.00
6.00
7.00
8.00
9.00
10.00
Student Kindness TowardStudents
Student Kindness TowardTeachers
Student Kindness TowardStaff
Teacher/Staff KindnessTowards FellowTeachers/Staff
Teacher/Staff KindnessTowards Students
Baseline
Year end
N = 42 schools* p <.05
***
*
Strongly agree
Strongly disagree
Kindness Coordinator Survey
Kindness coordinators report increases in student kindness over the course of the year.

0
1
2
3
4
5
6
7
8
9
10
Student KindnessToward Students
Student KindnessToward Teachers
Student KindnessToward Staff
Teacher/Staff KindnessTowards FellowTeachers/Staff
Teacher/Staff KindnessTowards Students
Baseline--Minimal
Year end--Minimal
Baseline-Minimal/ModerateYear end-Minimal/ModerateBaseline--Heavy
MinimalN=13 (2014)
Minimal/ModerateN=19
Heavy:N=24
*
** *
Strongly agree
Strongly disagree
Kindness Coordinator Survey
The reported increases are more substantial in schools that implement the program more heavily (though they tend to be higher on reported kindness at the outset, too)
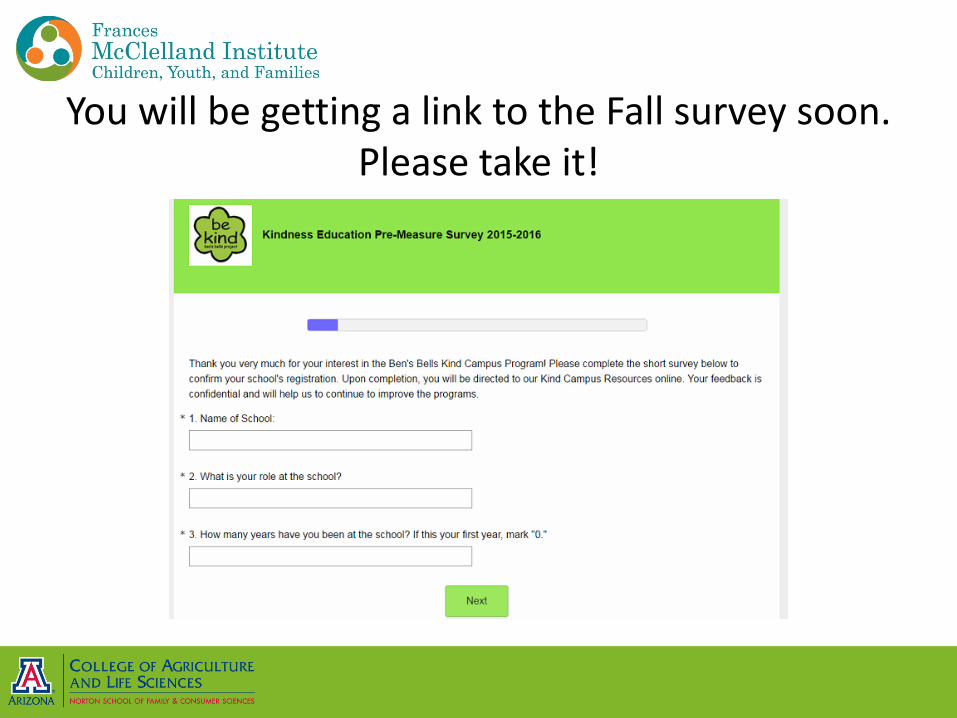
You will be getting a link to the Fall survey soon. Please take it!

Evaluation: The Big PictureKey Questions
• How does Kind Campus work?
• How do we measure kindness?
• What are the effects of increasing kindness?
Goals• Create an evaluation
toolkit for schools• Quality improvement
feedback• Evidence-based
programming
How does Kind Campus work?• What Kind Campus activities are
teachers/schools using most frequently?• How does Kind Campus operate in a school?• How do schools see Kind Campus fitting in the
(many!) other things that they do?
How do we measure kindness?
– What is kindness? How do you capture that?
– How do we measure this idea in children? In teachers and staff?

What are the effects of increasing kindness?– Does implementing Ben’s Bells Kind Campus
produce measurable differences in kindness in schools?
– Do those differences translate to differences in outcomes like disciplinary actions? Or student at staff satisfaction/happiness?
Participating in Kind Campus
activities
Kind behaviors increase in the
school community
Schools are measurably
happier, safer, places for people to learn and work

PILOT EVALUATION• Partnered with a local school district• 11 schools volunteered as Evaluation Pioneer Schools
– 8 Elementary Schools– 3 Middle Schools
• Student surveys (~3000)– Tech-savvy district all surveys online!
• Teacher surveys (~200)• Observational visits by undergraduate assistants• Principal interviews with evaluation staff

• Asked staff about– School’s involvement in KC– Use of KC materials in their classrooms– Support from staff and admin for KC
• Information through principal interviews
• Conducted walk-through observations of schools, looking for signs of Kind Campus participation and activities
• How does Kind Campus work?
• How do we measure kindness?
• What are the effects of increasing kindness?
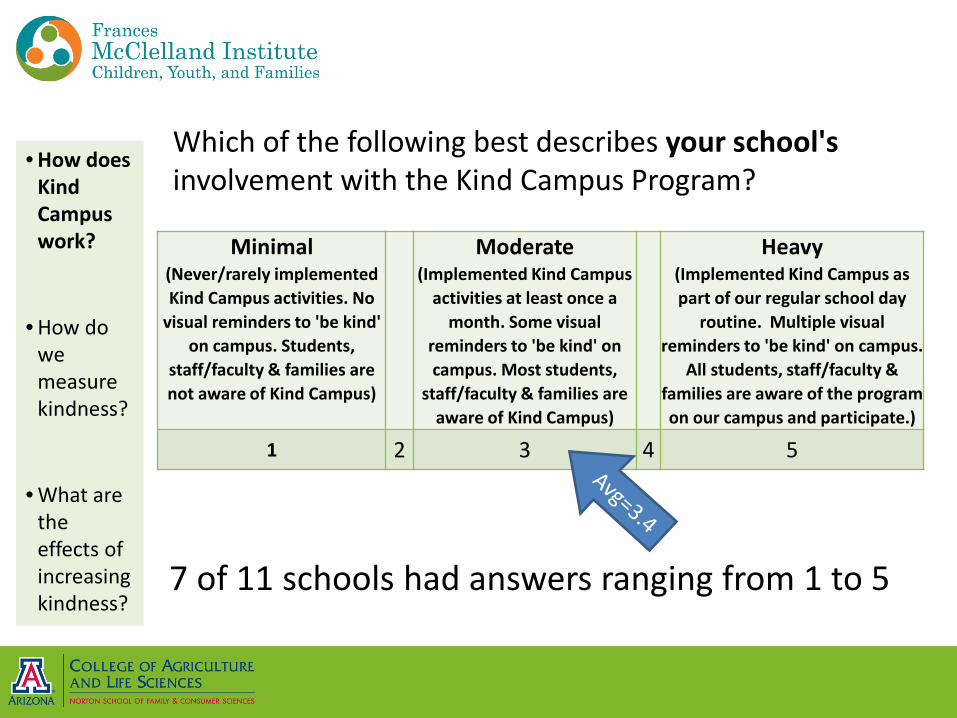
7 of 11 schools had answers ranging from 1 to 5
• How does Kind Campus work?
• How do we measure kindness?
• What are the effects of increasing kindness?
Minimal (Never/rarely implemented Kind Campus activities. No
visual reminders to 'be kind' on campus. Students,
staff/faculty & families are not aware of Kind Campus)
Moderate (Implemented Kind Campus
activities at least once a month. Some visual
reminders to 'be kind' on campus. Most students,
staff/faculty & families are aware of Kind Campus)
Heavy (Implemented Kind Campus as part of our regular school day
routine. Multiple visual reminders to 'be kind' on campus.
All students, staff/faculty & families are aware of the program on our campus and participate.)
1 2 3 4 5
Which of the following best describes your school'sinvolvement with the Kind Campus Program?
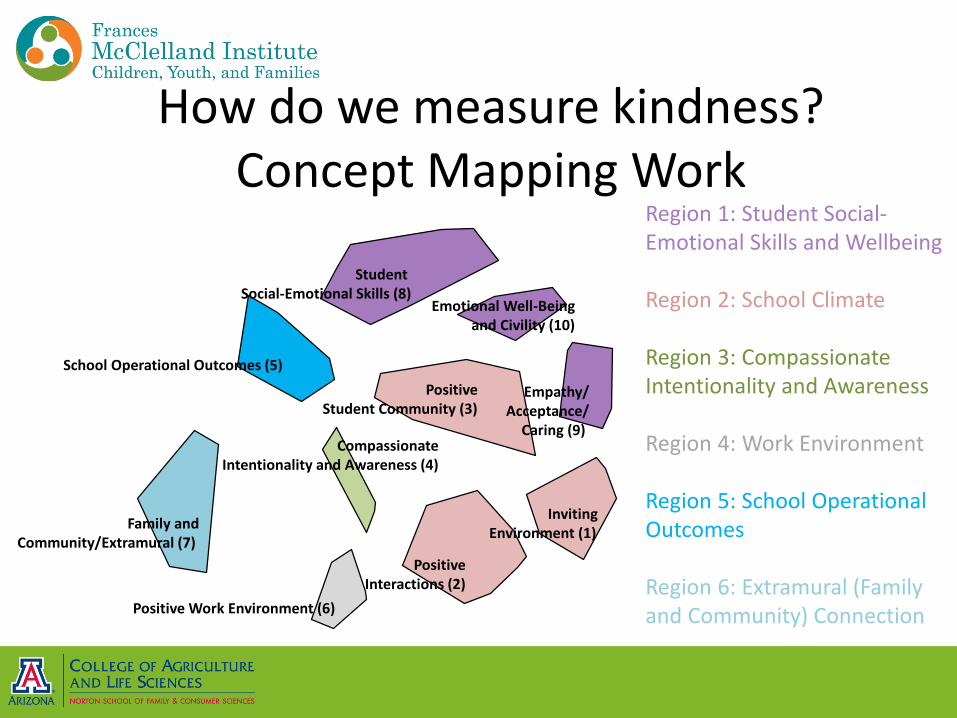
How do we measure kindness? Concept Mapping Work
InvitingEnvironment (1)
Positive Interactions (2)
Positive Student Community (3)
Compassionate Intentionality and Awareness (4)
School Operational Outcomes (5)
Positive Work Environment (6)
Family andCommunity/Extramural (7)
Student Social-Emotional Skills (8)
Empathy/Acceptance/
Caring (9)
Emotional Well-Being and Civility (10)
Region 1: Student Social-Emotional Skills and Wellbeing
Region 2: School Climate
Region 3: Compassionate Intentionality and Awareness
Region 4: Work Environment
Region 5: School Operational Outcomes
Region 6: Extramural (Family and Community) Connection

How do we measure kindness?• Draw on the concept mapping work
from last year• Pulled questions from existing scales
around topics like student socio-emotional skills, school climate, teacher burnout
• Tested surveys with student and teacher groups before the pilot
• How does Kind Campus work?
• How do we measure kindness?
• What are the effects of increasing kindness?
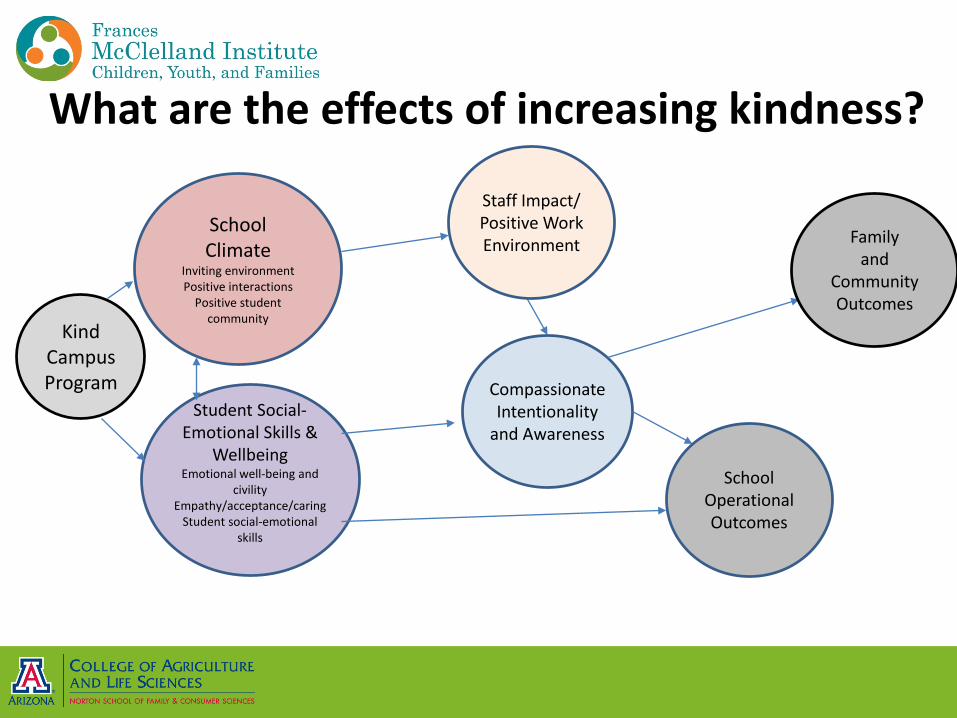
School Climate
Inviting environmentPositive interactions
Positive student community
Student Social-Emotional Skills &
WellbeingEmotional well-being and
civilityEmpathy/acceptance/caring
Student social-emotional skills
Compassionate Intentionality
and Awareness
Kind CampusProgram
Staff Impact/Positive Work Environment
SchoolOperationalOutcomes
Familyand
CommunityOutcomes
What are the effects of increasing kindness?
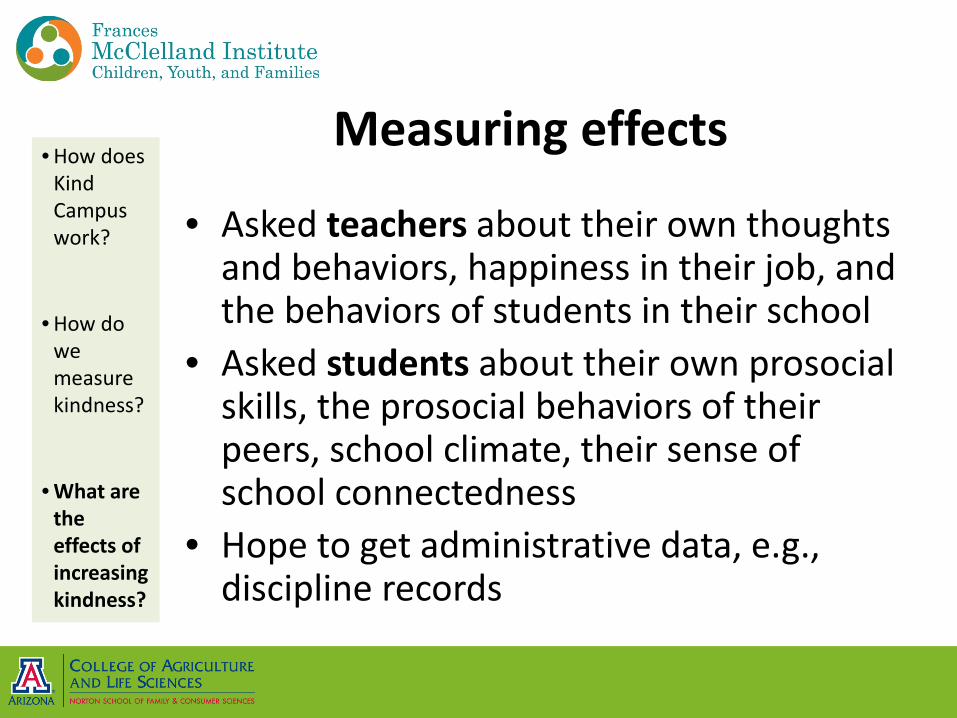
Measuring effects
• Asked teachers about their own thoughts and behaviors, happiness in their job, and the behaviors of students in their school
• Asked students about their own prosocial skills, the prosocial behaviors of their peers, school climate, their sense of school connectedness
• Hope to get administrative data, e.g., discipline records
• How does Kind Campus work?
• How do we measure kindness?
• What are the effects of increasing kindness?

Preliminary resultsIn schools where staff report that Kind Campus is a “big deal”, staff feel that
– Students get along better– Students are happy– Students are more respectful of teachers and staff– Students are able to calm themselves when they get angry– Students think it’s cool to be kind– The school offers a friendly learning environment– There’s good school spirit– The school has clear norms and expectations about
kindness– Fighting is less of an issue
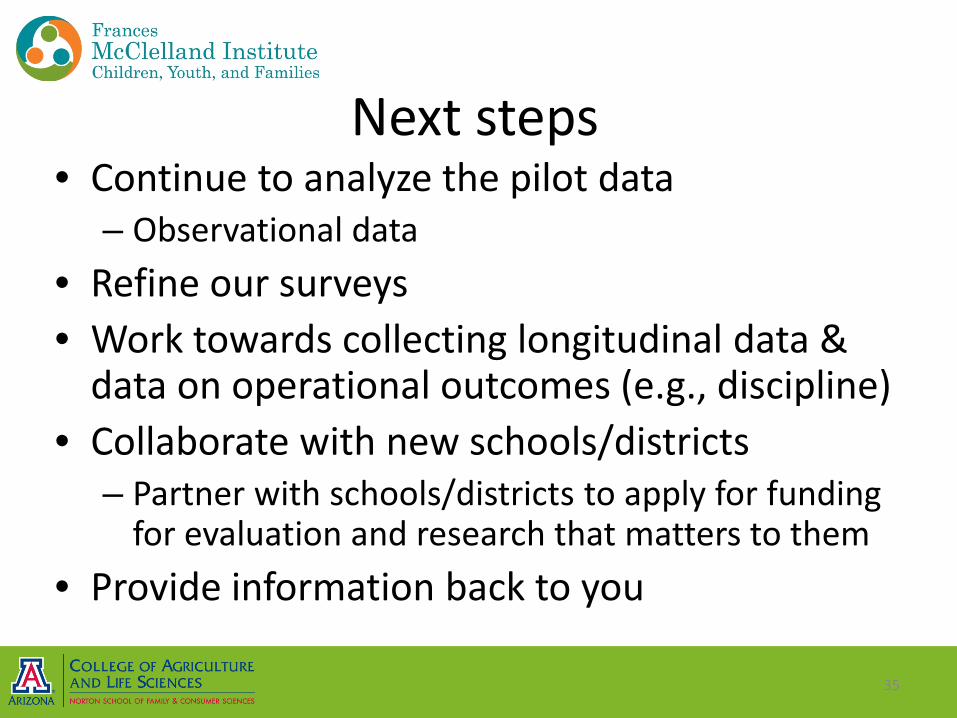
Next steps• Continue to analyze the pilot data
– Observational data• Refine our surveys • Work towards collecting longitudinal data &
data on operational outcomes (e.g., discipline)• Collaborate with new schools/districts
– Partner with schools/districts to apply for funding for evaluation and research that matters to them
• Provide information back to you
35